Embed Size (px)
Citation preview

GEORGE MASON UNIVERSITY
AUDITED FINANCIAL STATEMENTS
FOR THE YEAR ENDED
JUNE 30, 2008

-TABLE OF CONTENTS-
Pages MANAGEMENT’S DISCUSSION AND ANALYSIS 1-10 FINANCIAL STATEMENTS:
Statement of Net Assets 11 Statement of Revenues, Expenses, and Changes in Net Assets 12 Statement of Cash Flows 13-14 Notes to Financial Statements 15-40
INDEPENDENT AUDITOR’S REPORT:
Report on Financial Statements 41-42
UNIVERSITY OFFICIALS 43
George Mason University
Financial Statements for the Year Ended June 30, 2008
MANAGEMENT’S DISCUSSION AND ANALYSIS
Institutional Profile
Since it was founded in 1972, George Mason University has grown into a major educational force and earned a reputation as an innovative, entrepreneurial institution. Located in the heart of Northern Virginia’s technology corridor near Washington, D.C., George Mason has a growing and diverse student body and an exceptional faculty of enterprising scholars. The University was recently named the Number 1 national university to watch by U.S. News and World Report on its list of “Up-and-Coming Schools”. In addition, reflecting the University’s global outreach, Mason was recognized as being in the top 100 universities by the Academic Ranking of World Universities conducted annually by Shanghai Jiao Tong University’s Institute of Higher Education. At the center of the world’s political, information, and communications networks, George Mason is the university needed by a region and a world driven by new social, economic, and technological realities.
George Mason’s development has been shaped in response to the educational needs of its cosmopolitan constituency. The university has gained national distinction in a range of academic fields, including public policy, information technology, economics, the fine and performing arts, law, conflict resolution, and, most recently, the biosciences. Strong alliances with business, the community, and government benefit George Mason’s students and the larger society. Total enrollment is in excess of 30,000, with students studying in 168 degree programs at the undergraduate, master’s, doctoral, and professional levels. In the past three years, Mason has added 27 degree programs, including advanced degrees in climate dynamics, information security, and neuroscience, as well as undergraduate degrees in conflict analysis and resolution, global affairs, global and environmental change, and film and video studies.
George Mason is a distributed university with campuses in Fairfax, Arlington, and Prince William counties. Each campus has a distinctive academic focus that plays a critical role in the economy of its region. At each campus, students and faculty have access to all the university’s resources, while duplication of programs and support services is minimized through the use of technology. The university also offers programs on-site in Loudoun County, at the Center for Innovative Technology’s Herndon Training Center, at the Smithsonian Institute’s Conservation Research Center in Front Royal, VA, at its Ras Al Khaimah campus in the United Arab Emirates, and on the Internet.
The University is an agency of the Commonwealth of Virginia and therefore included as
a component unit in the Commonwealth of Virginia’s Comprehensive Annual Financial Report, a separate financial report that incorporates all agencies, boards, commissions and authorities over which the Commonwealth exercises, or has the ability to exercise, oversight authority. The 16 members of the George Mason University Board of Visitors govern University operations. Members of the Board are appointed by the Governor of Virginia.
1

Higher Education Restructuring The Restructured Higher Education Financial and Administrative Operations Act, as amended, provides the opportunity for all sixteen public colleges and universities in Virginia to become eligible for additional operational authority, provided state goals and management standards are met. George Mason University is in the process of seeking additional operating authority in the areas of information technology and procurement. Overview of the Financial Statements and Financial Analysis This unaudited Management’s Discussion and Analysis (MD&A) is required supplemental information under the Governmental Accounting Standards Board’s (GASB) reporting model. This discussion and analysis provides an overview of the financial condition and results of operations of George Mason University for the year ended June 30, 2008. Comparative numbers are included for the year ended June 30, 2007. MD&A includes highly summarized data and therefore should be read in conjunction with the financial statements and footnotes that follow this section. The University’s management is responsible for all of the financial information presented, including this discussion and analysis. The University’s financial statements have been prepared in accordance with GASB principles which establish standards for external financial reporting for public colleges and universities. These principles require that financial statements be presented on a consolidated basis to focus on the University as a whole, with resources classified for accounting and reporting purposes into four net asset categories. The three required financial statements are the Statement of Net Assets, the Statement of Revenues, Expenses, and Changes in Net Assets, and the Statement of Cash Flows. As stated above, these financial statements are summarized in MD&A. Financial Highlights During FY 2008, construction and renovation of facilities continued at a very high level of activity with over 25 active projects being managed. This activity is evident in the $107 million increase in Capital assets, net, and the $93 million increase in Noncurrent liabilities, reflecting the debt issued to finance the construction activity. Two prominent examples of this construction activity are discussed below. The University began, at its Fairfax campus, construction of a $60 million, 180,000 square foot research building that will house the Volgenau School of Information Technology and Engineering, and fulfill the need for cutting-edge academic research and future information technology and engineering leaders. By combining academic and research space with corporate lease space, the building will be unlike any other throughout the Virginia public university system, and builds on the University’s strength as an entrepreneurial university working with the business community. The new facility will open in the fall of 2009. At its Prince William campus, the University began construction of the George Mason University Biomedical Research Lab (BRL). The new BRL will be one of 13 Regional Biocontainment Laboratories to be built nationwide with funds from the National Institutes of Health (NIH). To construct the laboratory, Mason was awarded a $25 million NIH grant in 2005, which was subsequently increased to a total of $27.5 million. In addition, the University is providing an estimated $16.1 million in grant matching funds, plus another $4.7 million not
2

considered to be matching funds under the grant, both of which are to be financed by notes payable for VCBA pooled bonds. The BRL will contain laboratories where Mason researchers will develop and test the next generation of vaccines, treatments and diagnostics to protect citizens against biological terrorism and infectious diseases. The University’s Board of Visitors voted to raise annual tuition and fees for the 2008-09 academic year. This decision provided the funding necessary for the University to invest in academic excellence, scholarships for students, faculty and staff salary increases, expanded teaching spaces and research, and fund an increasing share of its operating budget as the percentage funded by the Commonwealth continues to decline. Despite the increase, Mason’s tuition and fees will remain lower than nearly half of Virginia’s other four-year colleges and universities. The decision reflects the University’s commitment to maintaining the highest level of standards and continuing to provide outstanding faculty and facilities. Statement of Net Assets The Statement of Net Assets presents the assets (current and noncurrent), liabilities (current and noncurrent), and net assets (assets minus liabilities) of the University as of the end of the fiscal year. This statement is a point of time financial statement. The purpose of the Statement of Net Assets is to present readers of the financial statements a fiscal snapshot of George Mason University at the end of the fiscal year. Assets and liabilities are generally measured using current values. One notable exception is capital assets, which are stated at historical cost less an allowance for depreciation. From the information presented, readers of the Statement of Net Assets are able to determine the assets available to continue the operations of the University. They are also able to determine how much the institution owes vendors and creditors. In addition, the Statement of Net Assets provides a picture of the net assets (assets minus liabilities) and their availability for expenditure by the institution. The difference between total assets and total liabilities, net assets, is one indicator of the current financial condition of the University, while the change in net assets is an indicator of whether the overall condition has improved or worsened during the year. Net assets are divided into three major categories. The first category, “invested in capital assets, net of related debt,” provides the University’s equity in the property, plant, and equipment that it owns. The next category is “restricted net assets,” which is divided into two subcategories, expendable and nonexpendable. Expendable restricted net assets are available for expenditure by the institution but must be spent as determined by donors and/or external entities that have placed time or purpose restrictions on the use of the assets. Nonexpendable restricted net assets consist of endowments and similar funds where donors or other outside sources have stipulated that, as a condition of the gift instrument, the principal is to be maintained inviolate and in perpetuity, and invested for the purpose of producing present and future income to be expended or placed in a reserve fund. The final category is “unrestricted net assets.” Unrestricted net assets are available to the University for any lawful purpose of the institution. A summary of the University’s assets, liabilities, and net assets at June 30, 2008, and June 30, 2007, follows.
3
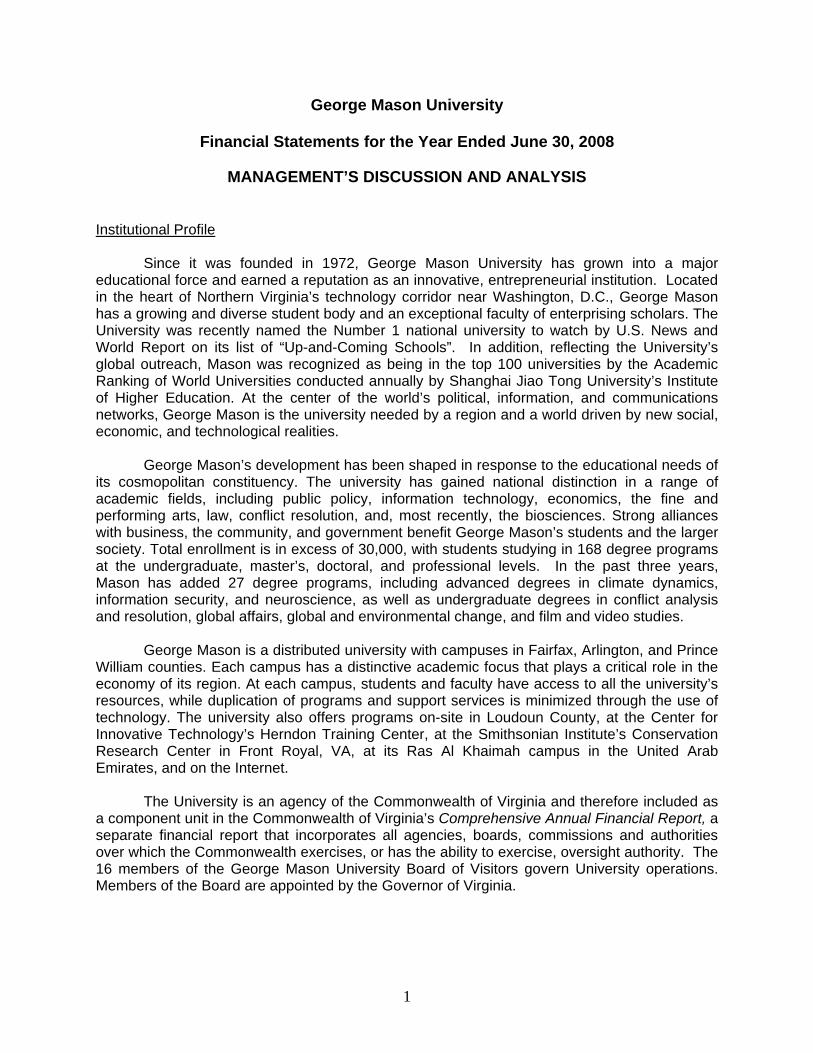
Statement of Net Assets*
June 30,
2008June 30, 2007**
Change (dollars)
Change (percentage)
Assets: Current assets $145,020 $135,402 $9,618 7% Capital assets, net 584,307 476,938 107,369 23% Other noncurrent assets 176,366 132,643 43,723 33% Total assets 905,693 744,983 160,710 22% Liabilities: Current liabilities 161,378 124,673 36,705 29% Noncurrent liabilities 346,591 253,937 92,654 36% Total liabilities 507,969 378,610 129,359 34% Net assets: Invested in capital assets, net of debt 336,255 290,452 45,803 16% Restricted: nonexpendable 3,221 2,500 721 29% Restricted: expendable 44,201 67,262 (23,061) (34%) Unrestricted 14,047 6,159 7,888 128% Total net assets $397,724 $366,373 $31,351 9%
* in thousands ** as restated for change in calculation of invested in capital assets net and reclass to noncurrent assets of appropriations available and unspent bond proceeds, to match FY 08 presentation
The University’s financial position remained strong at the end of FY 2008. Total assets were $906 million and net assets (total assets less liabilities of $508 million) amounted to $398 million. For FY 2008, current assets of $145.0 million are $16.4 million lower than current liabilities of $161.4 million. This is a change from FY 2007 when current assets exceeded current liabilities by $10.7 million. This decline in current assets relative to current liabilities is to be expected given the substantial and ongoing construction program, and the resulting large increase in capital assets. Nonetheless, current assets still cover 3.3 months of total operating expenses, including depreciation, which is unchanged from last year’s 3.3 months of coverage. Capital assets, net of accumulated depreciation of $273.7 million, totaled $584.3 million, which represents an increase of $107.4 million over FY 2007, and reflects the ongoing expansion of facilities at the University. During FY 2008, the University’s net asset position increased by $31.4 million. Most of this increase in total net assets is reflected in the increases in net assets invested in capital assets, net of related debt ($45.8 million) and unrestricted net assets ($7.9 million). Restricted
4

expendable net assets declined by $23.1 million as restricted capital appropriations received in FY 2007 were used for capital projects during FY 2008. Capital Asset and Debt Administration
Development and renewal of capital assets is one of the critical factors in sustaining the high quality of the University’s academic, research, and residential life functions. The University continues to maintain and upgrade current structures, and to add additional facilities.
Note 5 of the Notes to Financial Statements describes the University’s rapidly expanding investment in capital assets, with total depreciable capital asset additions of $105.9 million (excluding land, construction in progress, and works of art) and additions to construction in progress of $116.9 million. Depreciation expense increased by $2.5 million over the prior year to $27.4 million.
Capital asset additions in FY 2008 included increases of $85.7 million in buildings, $8.6 million in equipment, $5.7 million in infrastructure, $.297 million in improvements, and $5.5 million in library materials. The building increase included the completion and placing into service of the Krasnow Institute Addition ($7.1 million), the Child Development Center ($2.4 million), an improvement to Research I Building ($.441 million), the Fairfax Aquatic Center Addition ($8.0 million), Student Housing VII ($63.1 million), and the West Building Renovation ($3.1 million). Additions to infrastructure resulted primarily from improvements to the Fairfax campus infrastructure ($4.4 million) and the Prince William campus infrastructure ($1.3 million). The increase in improvements to land was attributable to the West parking lot project on the Fairfax campus ($.166 million) and improvements made to the leased property at the Conservation Research Center in Front Royal, VA ($.130 million).
Additions to construction in progress during FY 2008 included additional construction costs for ongoing projects such as the Prince William Biocontainment Lab ($1.1 million), Science and Tech I and II Renovation ($1.4 million), Student Union Building III ($13.8 million), PE Building Renovation and Addition ($9.5 million), Prince William Performing Arts Center ($4.4 million), Hotel and Conference Center ($1.8 million), Academic VI/Research II Building ($29.3 million), Parking Deck III ($22.4 million), Patriot Center Renovation ($6.8 million), Academic V Building ($9.4 million), Arlington II Building ($10.4 million) plus a number of other smaller projects totaling another $6.6 million.
Financial stewardship requires the effective management of resources, including the use of long-term debt to finance capital projects. Notes 7, 8 and 9 describe changes in the University’s long-term debt. New capital long-term debt in the amount of $107.7 million was issued during FY 2008. This increase is the result of $20.6 million in Virginia 9(c) Revenue Bonds issued to finance Housing VII-C and Entrance Road ($15.5 million), the Presidents Park Renovation ($3.1 million), and Student Housing VII RB#3 ($2.0 million) and $87.1 million in VCBA Notes, issued to finance the following projects: Prince William Performing Arts Center RB#2 ($8.6 million), Student Union I Building Renovation ($5.1 million), Student Union III Building RB#3 ($6.1 million), PE Building Addition/Renovation RB#3 ($8.6 million), PE Building Addition Phase II RB#2 ($3.8 million), Fairfax Surge Space Building RB#2 ($3.0 million), Academic VI/Research II Building ($4.9 million), Parking Deck III ($20.8 million), Softball Field Improvement ($1.5 million), Hotel and Conference Center ($18 million), Student Union II Building Renovation ($1.5 million), Series 2007B Refunding of Series 1997A ($3.6 million), and Series 2007B Refunding of Series 2005A ($1.7 million). Total long-term debt outstanding, including revenue bonds, notes payable, installment purchases, bond premiums and discounts,
5

and deferred gains and losses on refundings increased by $95.0 million from the end of FY 2007 to the end of FY 2008.
Contractual commitments for capital outlay projects under construction at year end increased from $27.0 million in FY 2007 to $255.1 million in FY 2008. These obligations are for future efforts and therefore have not been accrued as expenses or liabilities on the University’s financial statements. The large increase is caused primarily by the signing of construction contracts during FY 2008 for a list of projects including Arlington II, the Prince William Bio-containment Building, the Prince William Performing Arts Center, Parking Deck III, the Hotel and Conference Center, the Patriot Center Renovation, Academic VII/Research II Building, PE Building Renovation, Academic V Building, the Surge Space/Data Center Building, the Presidents Park Renovation, and Housing VII-C.
Statement of Revenues, Expenses, and Changes in Net Assets Changes in total net assets as presented in the Statement of Net Assets are based on the activity presented in the Statement of Revenues, Expenses, and Changes in Net Assets. The purpose of the statement is to present the University’s operating revenues, expenses incurred, and all other revenues, expenses, gains, and losses. Generally speaking, operating revenues are received for providing goods and services to the students and other constituencies of the institution. Operating expenses are those expenses incurred to acquire or produce the goods and services provided in return for the operating revenues, and to carry out the mission of the institution. Salaries and fringe benefits for faculty and staff are the largest type of operating expense. Nonoperating revenues are revenues received for which goods and services are not provided. For example, state appropriations are nonoperating revenues because they are provided by the legislature without the legislature directly receiving commensurate goods and services for those revenues. State appropriations and gifts, included in this category, provide substantial support for paying operating expenses of the University. Therefore, the University, like most public institutions, will expect to report an operating loss. A summary of the University’s Statement of Revenues, Expenses, and Changes in Net Assets follows.
Statement of Revenues, Expenses, and Changes in Net Assets*
June 30, 2008 June 30, 2007**Change (dollars)
Change (percentage)
Operating revenues: Student tuition and fees, net of allowances $166,106 $154,081 $12,025 8% Grants and contracts 95,204 84,797 10,407 12% Auxiliary enterprises and other 98,196 88,192 10,004 11% Total operating revenues 359,506 327,070 32,436 10%
Operating expenses: Education and general 403,761 374,482 29,279 8% Depreciation 27,436 24,986 2,450 10% Scholarships and fellowships 14,758 13,620 1,138 8% Auxiliary enterprises 78,094 68,607 9,487 14%
6

Total operating expenses 524,049 481,695 42,354 9%
Operating loss (164,543) (154,625) (9,918) 6%
Nonoperating revenues and expenses (net) 185,175 197,218 (12,043) (6%)
Income before other revenues, expenses, gains or losses 20,632 42,593 (21,961) (52%) Capital appropriations, gifts, contributions and other expenses 10,719 20,773 (10,054) (48%) Increase in net assets 31,351 63,366 (32,015) (51%) Net assets at beginning of year 366,373 303,007 63,366 21% Net assets at end of year $397,724 $366,373 $31,351 9%
* in thousands ** as restated for Pell grant receipts reporting change
The key number in the Statement of Revenues, Expenses, and Changes in Net Assets is “Income before other revenues, expenses, gains or losses” since this includes both operating results and the University’s educational and general operating appropriation from the Commonwealth. This amount declined by $22.0 million over the previous year ($20.6 million for fiscal year 2008 compared to $42.6 million for fiscal year 2007). This very large decrease in Income before other revenues, expenses, gains, or losses is primarily a result of a $22.5 million decrease in restricted state general fund appropriations offset by an $8.6 million increase in the state educational and general appropriation, a $12.0 million increase in tuition and fees revenue, a $9.0 million increase in auxiliary revenue, a $10.4 million increase in grants and contracts revenue, and an increase of $27.1 million in salaries, wages and benefits expense, and an increase of $11.6 million in goods and services expense.
Operating revenue, consisting mostly of tuition and fees, grants and contracts, and auxiliary enterprises, increased by $32.4 million, or 10%, over the prior year. Student tuition and fees, net of scholarship allowances, increased by $12.0 million, or 8%, over the prior year. Most of this growth is attributable to tuition rate increases at all levels and out-of-state and premium tuition revenue generated for law and graduate programs. Grants and contracts revenue increased by $10.4 million, or 12%, over the prior year. This change is a result of increased focus by academic units to grow sponsored funding including increasing the number of research faculty, bringing in faculty with existing research programs, and increasing the number of proposal submissions. Auxiliary revenue increased by $10.0 million, or 11%, primarily due to increased student enrollment and increased utilization of residential facilities and programs.
Total operating expenses increased by $42.4 million, or 9%, including an increase of $27.1 million in compensation expenses, consisting of the natural expense classification salaries, wages, and fringe benefits. Nonoperating revenues net of nonoperating expenses decreased by $12.0 million due primarily to the $22.5 million decline in restricted state general fund appropriations partially offset by the $8.6 million increase in state educational and general appropriations. Statement of Cash Flows The final statement is the Statement of Cash Flows. This statement presents information about the cash activity of the University during the year. Cash flows from operations will always be different from the operating loss on the Statement of Revenues, Expenses, and Changes in
7

Net Assets (SRECNA). This difference occurs because SRECNA is prepared on the accrual basis of accounting and includes non-cash items, such as depreciation expense, while the Statement of Cash Flows presents cash inflows and cash outflows without regard to accrual items. The Statement of Cash Flows provides information to assess the ability of the University to generate cash flows sufficient to meet its obligations. The statement is divided into five parts. The first deals with operating cash flows and shows the net cash used by the operating activities of the institution. The second section reflects cash flows from noncapital financing activities. This section reflects the cash received and spent for nonoperating, non-investing, and noncapital financing purposes such as the state appropriations for educational and general programs and financial aid. The third section reflects the cash flows from capital financing activities and shows the purchases, proceeds, and interest received from these activities. This section deals with the cash used for the acquisition and construction of capital and related items. The fourth section deals with cash flows from investing activities. The fifth section reconciles the net cash used by operating activities to the operational loss reflected on the Statement of Revenues, Expenses, and Changes in Net Assets. A summary of the University’s Statement of Cash Flows follows.
Statement of Cash Flows*
June 30,
2008June 30, 2007**
Change (dollars)
Change (percentage)
Cash provided from operations $361,290 $329,418 $31,872 10%Cash expended for operations 498,272 442,809 55,463 13% Net cash used for operations (136,982) (113,391) (23,591) 21% Net cash provided by noncapital financing activities 186,839 199,827 (12,988) (6%)Net cash provided by (used for) capital financing activities (1,605) (23,056) 21,451 93%Net cash provided by (used for) investing activities 2,469 6,340 (3,871) (61%) Net increase in cash 50,721 69,720 (18,999) (27%) Cash and cash equivalents, beginning of year 168,182 98,462 69,720 71% Cash and cash equivalents, end of year $218,903 $168,182 $50,721 30%
* in thousands ** as restated for change in reporting of Pell grant receipts and appropriations available The above summarized Statement of Cash Flows shows that the University generates 73 percent ($361 million of $498 million) of its operating cash requirements internally with the remainder ($137 million) being provided in the form of appropriations from the Commonwealth of Virginia, gifts, and investment earnings. Nonoperating cash was provided by capital appropriations and the sale of revenue bonds, which were used to acquire capital assets.
8

Cash provided from operating activities increased by $31.8 million in FY 2008. The major sources of the increase in operating cash are Student tuition and fees ($7.7 million increase), Grants and contracts ($9.2 million increase), Auxiliaries ($8.5 million increase), and Other receipts ($6.3 million increase). Uses of operating cash also increased from FY 2007 to FY 2008 by $55.4 million. Major uses of operating cash are payments for salaries, wages, and fringe benefits ($44.8 million increase) and payments for supplies and services ($10.3 million increase).
Cash provided by non-capital financing activities decreased $13.0 million in FY 2008, primarily due to net decrease of $13.8 million in state appropriations offset by an increase in Pell grant receipts of approximately $1 million. The University generated $21.5 million more cash from capital financing activities in FY 2008 than in FY 2007. Primary sources of the increase in cash from capital financing activities include proceeds from the issuance of capital related debt ($5.7 million increase from FY 2007), and proceeds from capital appropriations available ($37.2 million increase from FY 2007), offset by an increase in cash outflows for purchases of capital assets ($21.4 million increase from FY 2007). The primary source of cash from investing activities is interest on non-general fund and local cash balances and endowment investment earnings, and the primary use of cash from investing activities is the purchase of endowment investments. Economic Outlook The University faces numerous challenges including the weak economy, the ongoing decline in the percentage of the operating budget supported by state appropriations, the current state budget crisis, increased expectations of students and their parents, the challenge of recruiting and retaining high quality faculty and staff in the Washington, DC region, and managing the ongoing and growing capital construction program. Given this trend, securing additional private support is a key component to the University’s economic future. In recognition of this, the University has enhanced development efforts in a variety of ways including providing both targeted and unrestricted giving opportunities, expanding its use of recognition publications and recognition societies, reaching out to alumni through the alumni magazine and newsletter, and pursuing public-private development projects and other opportunities to work cooperatively with the business community. Despite the many challenges it faces, the University’s financial position is strong. Operating revenues will continue to expand due to ongoing enrollment increases and higher levels of tuition and fees, which nonetheless remain extremely competitive and attractive to new students. As evidence of this, the University has seen a continual rise in interest not only among students in Virginia, but also among out-of-state college prospects. Nevertheless, the University is sensitive to the issue of affordability and is committed to ensuring that higher education remains affordable, regardless of individual family income. Through use of a periodic assessment, the University determines the impact of tuition and fee levels net of financial aid on applications, enrollment, and student indebtedness incurred for the payment of tuition and fees. Well managed, efficient auxiliary enterprises demanded by today’s students will continue to provide a growing source of operating revenues while simultaneously contributing to the overall quality of the educational experience. In addition, management’s cost containment efforts, strategic investments, and a growing and diversified research portfolio will help the University effectively manage a change in state support.
9

The University’s economic future is supported and enhanced by its capital construction program. The capital construction program supports the University’s mission by advancing the research agenda, reducing space deficiencies, supporting new university programs, improving the quality of on-campus life through investment in on-campus residence halls, including university life and services functions in all capital projects, and investing in recreation facilities. Included in the more than 25 ongoing construction projects are new academic and research buildings, a new parking deck, new student housing, new dining facilities, new and renovated fitness facilities, a hotel and conference center, and a new performing arts center. The University’s economic future is also supported and enhanced by its growing and diversified research program, including the following representative examples:
• Biological Sciences - Researchers at Mason’s National Center for Biodefense are engaged in innovative biomedical research to develop unique approaches and techniques for the prevention and treatment of infectious diseases and biological threat agents.
• Scientists at the Center for Applied Proteomics and Molecular Medicine are continually
developing new diagnostic tools and groundbreaking techniques for treating patients diagnosed with cancer and other diseases.
• Researchers at the Center for Earth Observing and Space Research (CEOSR) are using
satellite microwave technology and buoy measurements to successfully predict whether tropical storms will develop hurricane strength.
• George Mason’s Critical Infrastructure Protection Project (CIPP), is an interdisciplinary,
multi-institutional research initiative focused on enhancing the security of cyber networks and economic processes that support the nation’s critical infrastructures.
Management believes that the University will maintain its solid financial foundation, permitting it to continue to build on its standard of excellence in teaching, research, and public service.
10
FINANCIAL STATEMENTS
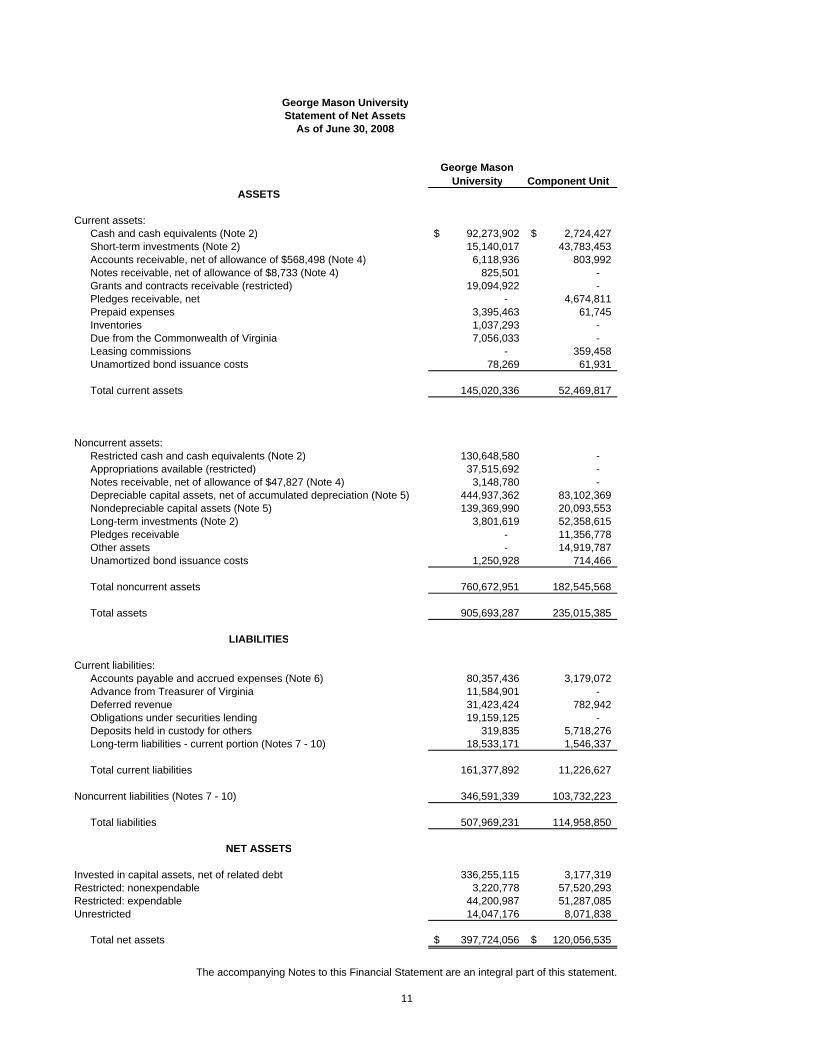
George Mason UniversityStatement of Net Assets
As of June 30, 2008
George Mason University Component Unit
ASSETS
Current assets:Cash and cash equivalents (Note 2) 92,273,902$ 2,724,427$ Short-term investments (Note 2) 15,140,017 43,783,453 Accounts receivable, net of allowance of $568,498 (Note 4) 6,118,936 803,992 Notes receivable, net of allowance of $8,733 (Note 4) 825,501 - Grants and contracts receivable (restricted) 19,094,922 - Pledges receivable, net - 4,674,811 Prepaid expenses 3,395,463 61,745 Inventories 1,037,293 - Due from the Commonwealth of Virginia 7,056,033 - Leasing commissions - 359,458 Unamortized bond issuance costs 78,269 61,931
Total current assets 145,020,336 52,469,817
Noncurrent assets:Restricted cash and cash equivalents (Note 2) 130,648,580 - Appropriations available (restricted) 37,515,692 - Notes receivable, net of allowance of $47,827 (Note 4) 3,148,780 - Depreciable capital assets, net of accumulated depreciation (Note 5) 444,937,362 83,102,369 Nondepreciable capital assets (Note 5) 139,369,990 20,093,553 Long-term investments (Note 2) 3,801,619 52,358,615Pledges receivable - 11,356,778 Other assets - 14,919,787 Unamortized bond issuance costs 1,250,928 714,466
Total noncurrent assets 760,672,951 182,545,568
Total assets 905,693,287 235,015,385
LIABILITIES
Current liabilities:Accounts payable and accrued expenses (Note 6) 80,357,436 3,179,072 Advance from Treasurer of Virginia 11,584,901 - Deferred revenue 31,423,424 782,942 Obligations under securities lending 19,159,125 - Deposits held in custody for others 319,835 5,718,276 Long-term liabilities - current portion (Notes 7 - 10) 18,533,171 1,546,337
Total current liabilities 161,377,892 11,226,627
Noncurrent liabilities (Notes 7 - 10) 346,591,339 103,732,223
Total liabilities 507,969,231 114,958,850
NET ASSETS
Invested in capital assets, net of related debt 336,255,115 3,177,319 Restricted: nonexpendable 3,220,778 57,520,293 Restricted: expendable 44,200,987 51,287,085Unrestricted 14,047,176 8,071,838
Total net assets 397,724,056$ 120,056,535$
The accompanying Notes to this Financial Statement are an integral part of this statement.
11

George Mason UniversityStatement of Revenues, Expenses, and Changes in Net Assets
For the Year Ended June 30, 2008
George Mason University Component Unit
Operating revenues:Student tuition and fees (net of scholarship allowances of $22,435,148) 166,106,018$ - Federal grants and contracts 63,161,880 - State, local, and nongovernmental grants and contracts 32,041,974 - Auxiliary enterprises (net of scholarship allowances of $6,359,195) 92,376,647 3,576,178Other operating revenue 5,819,764 19,333,984
Total operating revenue 359,506,283 22,910,162
Operating expenses: (Note 12)Instruction 206,294,926 2,863,017Research 52,351,777 8,269,877Public service 12,636,880 1,053,500Academic support 43,673,438 2,822,042Student services 19,382,769 28,614Institutional support 41,126,535 3,828,665Operation and maintenance of plant 28,293,511 3,039,000Depreciation and amortization 27,436,445 3,774,970Scholarships and fellowships 14,758,370 1,521,749Auxiliary enterprises 78,094,262 2,031,457
Total operating expenses 524,048,913 29,232,891
Operating income (loss) (164,542,630) (6,322,729)
Nonoperating revenues (expenses):State educational and general appropriation (Note 13) 135,567,184 - State general fund appropriations - restricted 38,567,709 - Pell grant receipts 9,780,135 - Investment earnings 746,313 (2,568,443)Interest income 5,524,054 - Interest expense (Note 14) (5,010,462) (5,941,067)Other - 8,139,666
Net nonoperating revenues 185,174,933 (369,844)
Income before other revenues, expenses, gains, or losses 20,632,303 (6,692,573)
Other revenues, expenses, gains, or losses:Capital gifts and contributions 7,229,489 - Capital appropriations 15,136,346 - Additions to permanent endowments 720,778 3,375,275Capital appropriation reversions (11,773,000) - Other capital appropriation reductions (311,088) - Other (283,892) (97,408)
Net other revenues, expenses, gains, or losses 10,718,633 3,277,867
Increase (decrease) in net assets 31,350,936 (3,414,706)
Net assets - beginning of year 366,373,120 123,471,241
Net assets - end of year 397,724,056$ 120,056,535$
The accompanying Notes to this Financial Statement are an integral part of this statement.
12

Cash flows from operating activities:Student tuition and fees 162,563,043$ Grants and contracts 96,248,112 Auxiliary enterprises 92,665,549 Perkins loan receipts 231,534 Other receipts 9,581,364 Payments to suppliers (132,986,952) Payments to employees (350,009,718) Payments for scholarships and fellowships (14,758,370) Perkins loan disbursements (517,025)
Net cash used by operating activities (136,982,463)
Cash flows from noncapital financing activities
State appropriations 174,134,893 Repayment of advance from Treasurer 1,084,901 Additions to endowments 720,778 Pell grant receipts 9,780,135 Agency transactions 1,118,800
Net cash provided by noncapital financing activities 186,839,507
Cash flows from capital and related financing activities
Proceeds from capital appropriations available 11,138,217 Capital gifts and contributions 7,958,924 Proceeds from issuance of capital related debt 104,255,432 Bond premium paid on capital related debt 3,109,870 Bond issuance costs on capital related debt (427,900) Principal paid on capital related debt (12,134,190) Interest paid on capital related debt (5,319,186) Purchases of capital assets (110,186,338)
Net cash provided by capital and related financing activities (1,605,171)
Cash flows from investing activities
Interest on investments 6,270,367 Purchase of investments (3,801,619)
Net cash provided by investing activities 2,468,748
Net increase in cash 50,720,621
Cash and cash equivalents - beginning of the year 216,675,025 Appropriations available restatement (Note 2) (45,767,049) Less: Securities Lending - Treasurer of Virginia (2,725,223) Cash and cash equivalents - beginning of the year (restated) 168,182,753
Cash and cash equivalents - end of the year 218,903,374$
George Mason UniversityStatement of Cash Flows
For the Year Ended June 30, 2008
The accompanying Notes to this Financial Statement are an integral part of this statement.13

RECONCILIATION OF STATEMENT OF CASH FLOWS, STATEMENT OF NET ASSETS:
Statement of Net Assets Cash and cash equivalents 222,922,482$ Less: Securities lending - Treasurer of Virginia (4,019,108)
Net cash and cash equivalents 218,903,374$
RECONCILIATION OF NET OPERATING LOSS TO NET CASH USED BY OPERATING ACTIVITIES
Operating loss (164,542,630)$
Adjustments to reconcile net loss to net cash used by operating activities:Depreciation expense 27,436,445 Changes in assets and liabilities: Accounts receivable (net) 446,191 Restricted assets receivable (net) (366,831) Perkins loan receivable (252,087) Perkins loan liability (33,404) Inventory (891,290) Prepaid expenses (504,665) Due from Commonwealth (1,281,241) Accounts payable and accrued liabilities 1,251,114 Deferred revenue 1,472,425 Compensated absences 283,510
Net cash used by operating activities (136,982,463)$
George Mason UniversityStatement of Cash Flows
For the Year Ended June 30, 2008
The accompanying Notes to this Financial Statement are an integral part of this statement.14

NOTES TO FINANCIAL STATEMENTS

George Mason University
Notes to Financial Statements
As of June 30, 2008 1. SUMMARY OF SIGNIFICANT ACCOUNTING POLICIES
A. Reporting Entity George Mason University is a comprehensive, doctoral institution that is
part of the Commonwealth of Virginia’s statewide system of higher education. The Board of Visitors, appointed by the Governor, is responsible for overseeing the governance of the University. A separate report is prepared for the Commonwealth of Virginia that includes all agencies, boards, commissions, and authorities over which the Commonwealth exercises or has the ability to exercise oversight authority. The University is a component unit of the Commonwealth of Virginia and is included in the general-purpose financial statements of the Commonwealth.
According to Governmental Accounting Standards Board (GASB)
Statement 39, Determining Whether Certain Organizations are Component Units, the George Mason University Foundation, Inc. (Foundation) meets criteria qualifying it as a component unit of the University. During the year ended June 30, 2008, the Foundation distributed $19,526,799 to or on behalf of the University for both restricted and unrestricted purposes. Separate financial information regarding the Foundation may be obtained by writing to the Foundation Business Office at 4400 University Drive, MSN 1A3, Fairfax, VA 22030.
B. Basis of Presentation
The University’s accounting policies conform with generally accepted accounting principles as prescribed by the GASB, including all applicable GASB pronouncements as well as applicable Financial Accounting Standards Board (FASB) statements and interpretations, Accounting Principles Board opinions, and Accounting Research Bulletins of the Committee on Accounting Procedure issued on or before November 30, 1989, unless those pronouncements conflict with or contradict GASB pronouncements. The financial statements have been prepared in accordance with GASB Statement Number 34, Basic Financial Statements—and Management’s Discussion and Analysis—for State and Local Governments, and GASB Statement Number 35, Basic Financial Statements—and Management’s Discussion and Analysis—for Public College and Universities an amendment of GASB Statement Number 34. The University follows Statement Number 34 requirements for “reporting by special-purpose governments engaged only in business-type activities.”
The Foundation is a private, nonprofit organization that reports under
Financial Accounting Standards Board (FASB) standards, including FASB Statement 117, Financial Reporting for Not-for-Profit Organizations. As such, certain revenue recognition criteria and presentation features are different from
15

GASB revenue recognition and presentation features. No modifications have been made to the Foundation’s financial information in the University’s financial reporting entity for these differences.
C. Basis of Accounting
The University’s financial statements have been prepared using the
economic resources measurement focus and the accrual basis of accounting. Under the accrual basis, revenues are recognized when earned and expenses are recorded when a liability is incurred, regardless of the timing of related cash flows. All significant intra-agency transactions have been eliminated. The University’s policy is to spend restricted resources before unrestricted resources when both are available for expenses that are properly chargeable to restricted resources.
D. Investments In accordance with GASB Statement Number 31, Accounting and
Financial Reporting for Certain Investments and for External Investment Pools, purchased investments, interest-bearing temporary investments classified with cash, and investments received as gifts are recorded at fair value. All investment income, including changes in the fair value of investments (unrealized gains and losses), is reported as nonoperating revenue in the Statement of Revenues, Expenses, and Changes in Net Assets.
E. Capital Assets
Capital assets include land, buildings, library materials, works of art and
historical treasures, equipment, improvements, and infrastructure assets such as sidewalks, and electrical and computer network cabling systems. Capital assets generally are defined by the University as assets with an initial cost of $2,000 or more and an estimated useful life in excess of one year. Library materials are valued using published average prices for library acquisitions. Other capital assets are recorded at actual cost or estimated historical cost if purchased or constructed. Donated capital assets are recorded at the estimated fair market value at the date of donation, with the exception of intra-entity capital asset donations which, in accordance with GASB Statement Number 48, Sales and Pledges of Receivables and Future Revenues and Intra-Entity Transfers of Assets and Future Revenues, are recorded at the carrying value of the asset on the transferor’s books as of the date of transfer. Expenses for major capital assets and improvements are capitalized as projects are constructed (construction in progress). Interest expense relating to construction is capitalized net of interest income earned on resources set aside for this purpose. The costs of normal maintenance and repairs that do not enhance the use of an asset, or materially extend its useful life, are not capitalized.
Depreciation is computed using the straight-line method over the
estimated useful life of the asset with no residual value. Depreciation is not allocated to the functional expense categories. Normal useful lives by asset categories are listed below:
16

Buildings 25-50 years* Improvements and infrastructure 10-30 years Equipment 5-20 years Library materials 10 years
* Research buildings are depreciated using the component method. The estimated useful lives of research building components range from 10-50 years.
Property and equipment held by the Foundation having a cost in excess
of $2,000 are capitalized at cost. Donated assets are capitalized at the estimated fair value at the date received. Buildings, furniture, and equipment are depreciated on a straight-line basis over their estimated useful lives. The estimated useful lives are as follows: buildings, 25 to 45 years; building improvements, 3 to 27 years; and furniture and equipment, 3 to 7 years.
F. Inventory Inventory is composed of two distinct categories of items. The first
category is composed of computers and related items for resale to students, faculty and staff. The second category is natural gas, which is used to power the University’s physical plant. Both categories of inventory are valued at cost using the first-in, first-out inventory methodology.
G. Noncurrent Cash and Investments
Cash and investments that are externally restricted for expenditure in the
acquisition or construction of noncurrent assets, to make debt service payments, or maintain sinking or reserve funds are classified as noncurrent assets in the Statement of Net Assets.
H. Deferred Revenue Deferred revenue represents monies collected but not earned as of June
30, 2008. This is primarily composed of student tuition collected for courses that will be offered after June 30, 2008.
I. Accrued Compensated Absences The amount of leave earned but not taken by salaried employees and
administrative faculty members is recorded as a liability. The amount reflects, as of June 30, 2008, all unused vacation, overtime, compensatory, recognition and sick leave payable upon termination under University policy. The applicable share of employer related taxes also is included.
17
J. Federal Financial Assistance Programs
The University participates in federally funded Pell Grants, Supplemental
Educational Opportunity Grants, Federal Work-Study, and Perkins Loan programs. Federal programs are audited in accordance with the Single Audit Act Amendments of 1996, the Office of Management and Budget Revised Circular A-133, Audit of States, Local Governments and Non-Profit Organizations, and the Compliance Supplement.
K. Net Assets
GASB Statement 34 requires that the Statement of Net Assets report the
difference between assets and liabilities as net assets, not fund balances. Net assets are classified as invested in capital assets, net of related debt; restricted; and unrestricted. “Invested in capital assets, net of related debt” consists of capital assets, net of accumulated depreciation and reduced by outstanding debt that is attributable to the acquisition, construction, or improvement of those assets. Net assets are reported as “restricted” when constraints on the net asset use are either externally imposed by creditors, grantors, or contributors; or imposed by law. Unrestricted net assets consist of net assets that do not meet the definitions above.
L. Revenue Classifications
Operating revenues include activities that have the characteristics of
exchange transactions, such as: (1) student tuition and fees, net of scholarship discounts and allowances; (2) sales and services of auxiliary enterprises, net of scholarship allowances; and (3) federal, state, local and nongovernmental grants and contracts.
Certain governmental financial aid grants, with the exception of Pell
grants which are treated as nonoperating revenue, and other federal, state or nongovernmental programs, are recorded as grants and contracts revenues in the University’s financial statements.
Nonoperating revenues include activities that have the characteristics of
nonexchange transactions, such as gifts, and other revenue sources that are defined as nonoperating revenues by GASB Statement 9, Reporting Cash Flows of Proprietary and Nonexpendable Trust Funds and Governmental Entities That Use Proprietary Fund Accounting, and GASB Statement 34, such as state appropriations and investment and interest income. Nonoperating expenses include interest on debt related to the purchase of capital assets.
M. Scholarship Discounts and Allowances
Student tuition and fees revenues, and certain other revenues from
students, are reported net of scholarship discounts and allowances in the Statement of Revenue, Expenses, and Changes in Net Assets. Scholarship discounts and allowances are the difference between the stated charge for goods
18

and services provided by the University, and the amount that is paid by students and/or third parties making payments on the student’s behalf.
N. Prepaid expenses
The University has recorded as a current asset facility rentals and
insurance premiums for fiscal year 2009 that were paid in advance as of June 30, 2008.
O. Discounts, Premiums, and Bond Issuance Costs Revenue bonds and notes payable on the Statement of Net Assets are
reported net of related discounts, premiums, and deferred gains and losses on debt refunding, which are expensed over the life of the bond. Similarly, bond issuance costs are reported as a noncurrent asset that is amortized over the life of the bond on a straight-line basis.
19

2. CASH, CASH EQUIVALENTS, AND INVESTMENTS
GASB Statement 40, Deposit and Investment Risk Disclosures, became effective
for the period beginning after June 15, 2004. It amends GASB Statement 3, Deposits with Financial Institutions. GASB Statement 40 eliminates the custodial credit risk disclosures for Category 1 and 2 deposits and investments. However, this statement does not change the disclosure requirements for Category 3 deposits and investments. The University has no Category 3 deposits for FY 2008, but does have Category 3 investments. The following risk disclosures are required by GASB:
Custodial Credit Risk - the custodial credit risk for investments is the risk that, in the event of the failure of the counterparty to a transaction, the University will not be able to recover the value of investment or collateral securities that are in possession of an outside party. The University has investments that are not registered in the University’s name, and which are held by the George Mason University Foundation (GMUF), a separate not-for-profit corporation under the laws of the Commonwealth of Virginia. GMUF was created to receive, hold, invest and administer property, and to make expenditures for the benefit of the University. GMUF holds common and preferred stocks on behalf of the University in the amount of $1,213,080. The other investments held for the University by GMUF are not investments whose existence is evidenced by securities that exist in physical or book entry form, and therefore are not subject to custodial credit risk. Credit Risk - the risk that an issuer or other counterparty to an investment will not fulfill its obligations. GASB Statement Number 40 requires the disclosure of the credit quality ratings of all investments in debt securities subject to credit risk. Credit quality ratings are not required for U.S. government securities or other obligations explicitly guaranteed by the U.S. government. Information with respect to the University deposit exposure to credit risk is discussed below. None of the investments held for the University by GMUF are debt securities, and therefore no credit risk disclosure is required. Concentration of Credit Risk - the risk of loss attributed to the magnitude of a government’s investment in a single issuer. GASB Statement Number 40 requires disclosure of investments with any one issuer that represents five percent or more of total investments. However, investments issued or explicitly guaranteed by the U.S. government, and investments in mutual funds, external investment pools, and other pooled investments are excluded from the requirement. The University’s investments are held by GMUF as a share of a larger investment pool managed by GMUF. No single issuer represents five percent or more of the overall investment pool managed by GMUF. Interest Rate Risk - the risk that changes in interest rates will adversely affect the fair value of an investment. GASB Statement Number 40 requires disclosure of maturities any investments subject to interest rate risk. The University does not have an interest rate risk policy. GMUF holds money market funds in the amount of $104,084 for the University. These money market funds have a maturity of less than one year. The other investments held for the University by GMUF are not investments of a type that are subject to interest rate risk.
20

Foreign Currency Risk - the risk that changes in exchange rates will adversely affect the fair value of an investment or deposit. The University had no foreign investments or deposits for FY 2008. A. Cash and Cash Equivalents
Pursuant to Section 2.2-1800, et seq., Code of Virginia, the Treasurer of Virginia, who is responsible for the collection, disbursement, custody, and investment of state funds, maintains all state funds of the University. Cash deposits held by the University are maintained in accounts that are collateralized in accordance with the Virginia Security for Public Deposits Act, Section 2.2-4400, et seq., Code of Virginia. In accordance with the GASB Statement 9, Definition of Cash and Cash Equivalents, cash represents cash with the Treasurer, cash on hand, and cash deposits including certificates of deposit and temporary investments with original maturities of three months or less.
B. Investments
The investment policy of the University is established by the Board of
Visitors and monitored by the Finance and Resource Development Committee of the Board. The University has cash and cash equivalents and investments as set forth in Section D.
C. Securities Lending Transactions
Investments and cash equivalents held by the Treasurer of Virginia represent the University’s allocated share of cash collateral received and reinvested and securities received for the State Treasury’s securities lending program. Information related to the credit risk of these investments and the State Treasury’s securities lending program is available on a statewide level in the Commonwealth of Virginia’s Comprehensive Annual Financial Report. The Commonwealth’s policy is to record unrealized gains and losses in the General Fund in the Commonwealth’s basic financial statements. When gains or losses are realized, the actual gains and losses are recorded by the affected agencies.
21

D. Summary of the University’s Cash, Cash Equivalents, and Investments
Market ValueCash and cash equivalents: Local funds $ 13,626,982 Treasurer of Virginia 74,627,812 Treasurer of Virginia (Securities Lending) 4,019,108 Subtotal 92,273,902 Restricted cash and cash equivalents: Treasurer of Virginia (State Nonarbitrage Program) 130,648,580
Total $222,922,482 Note- In FY 2007 the University reported appropriations available as cash and cash equivalents. For FY 2008 they are reported in Restricted Assets as a receivable called “Appropriations available”. On the Statement of Cash Flows, “Cash and cash equivalents- beginning of the year” has been restated down by $45,767,049 to account for the effect of this reporting change on the prior year amount. Investments:
Short-term: Treasurer of Virginia (Securities Lending) Long-term: Corporate stocks- held with GMUF Mutual Funds- held with GMUF Money Market Funds- held with GMUF Real Estate- held with GMUF
$15,140,017
1,213,080 586,490
104,084138,010
Alternative Investments- held with GMUF 1,759,955
Total $18,941,636
22

E. Summary of GMUF’s Investments
The fair market value of investments held by the Foundation at June 30, 2008 is summarized as follows:
Cash and Money market $7,815,819 Mutual funds: Equity funds 14,946,618 Bond funds 2,166 U.S. government and agency obligations 1,412,810 Corporate stocks 20,303,001 Corporate bonds 11,105,419 Alternative investments 38,459,863 Real estate and other 2,096,372
Total Investments
$ 96,142,068
The Foundation’s investment earnings are summarized as follows for the
year ended June 30, 2008:
Interest and dividends $2,561,399 Realized gains 549,604 External management fees (251,181) Unrealized loss (5,242,376) (2,382,554) Realized/unrealized gains (losses) included
with change in split interest agreements: Interest and dividends 99,853
Realized gains 37,611 External management fees (8,294)
Unrealized loss (315,104) (185,934) Net investment return $(2,568,488)
23
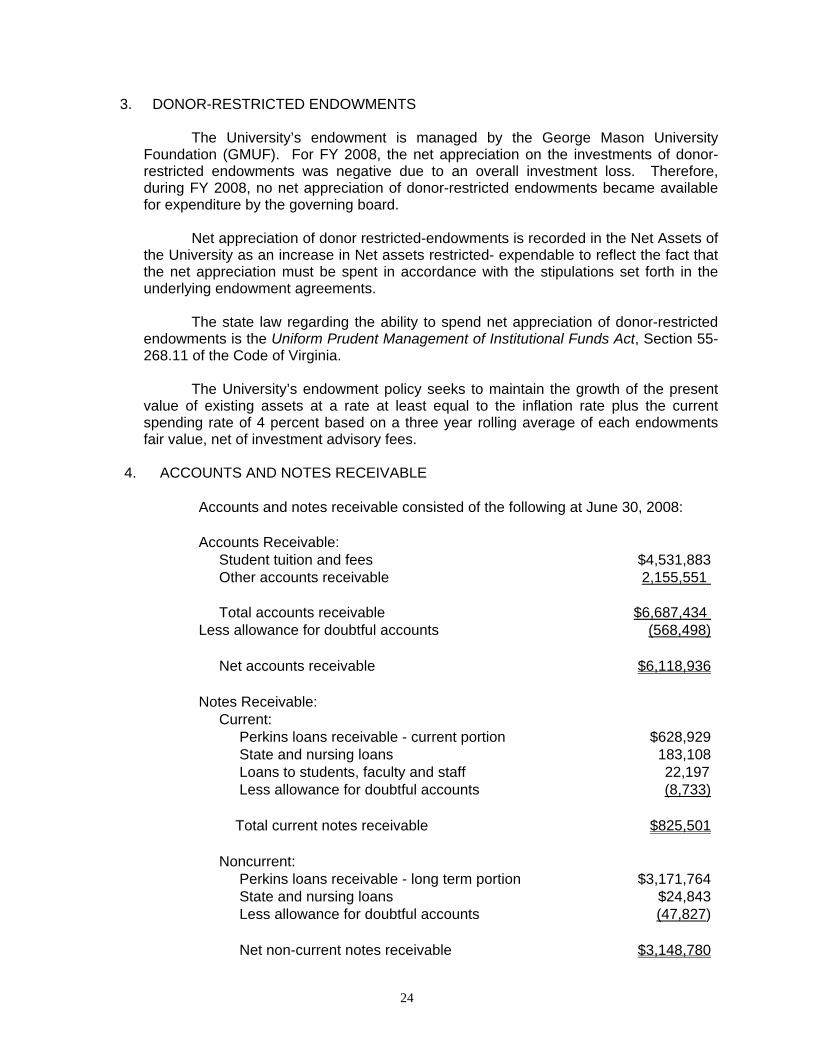
3. DONOR-RESTRICTED ENDOWMENTS
The University’s endowment is managed by the George Mason University Foundation (GMUF). For FY 2008, the net appreciation on the investments of donor-restricted endowments was negative due to an overall investment loss. Therefore, during FY 2008, no net appreciation of donor-restricted endowments became available for expenditure by the governing board.
Net appreciation of donor restricted-endowments is recorded in the Net Assets of the University as an increase in Net assets restricted- expendable to reflect the fact that the net appreciation must be spent in accordance with the stipulations set forth in the underlying endowment agreements.
The state law regarding the ability to spend net appreciation of donor-restricted endowments is the Uniform Prudent Management of Institutional Funds Act, Section 55-268.11 of the Code of Virginia.
The University’s endowment policy seeks to maintain the growth of the present value of existing assets at a rate at least equal to the inflation rate plus the current spending rate of 4 percent based on a three year rolling average of each endowments fair value, net of investment advisory fees.
4. ACCOUNTS AND NOTES RECEIVABLE
Accounts and notes receivable consisted of the following at June 30, 2008: Accounts Receivable: Student tuition and fees $4,531,883 Other accounts receivable 2,155,551 Total accounts receivable $6,687,434 Less allowance for doubtful accounts (568,498) Net accounts receivable $6,118,936 Notes Receivable: Current: Perkins loans receivable - current portion $628,929 State and nursing loans 183,108 Loans to students, faculty and staff 22,197 Less allowance for doubtful accounts (8,733) Total current notes receivable $825,501 Noncurrent: Perkins loans receivable - long term portion $3,171,764 State and nursing loans $24,843 Less allowance for doubtful accounts (47,827) Net non-current notes receivable $3,148,780
24

The Foundation's pledges receivable as of June 30, 2008 are as follows: Due in less than one year $4,674,811 Due in one to five years 5,930,059 Due in more than five years 7,955,127 Less discount present value (2,528,408) Total $16,031,589 Discount rates range from 1.63% to 5.12%.
As of June 30, 2008, the Foundation received $3,290,238 of conditional promises
to give, primarily matching funds for which the fundraising goals have not yet been achieved. These conditional promises to give are not recognized as assets in the consolidated statement of financial position.
5. CAPITAL ASSETS
A summary of changes in capital assets for the year ended June 30, 2008 is as follows:
Beginning Balance
Additions
Reductions
Ending Balance
Non-depreciable capital assets: Land $15,674,061 - - $15,674,061 Construction-in-progress 94,124,225 116,885,235 87,648,288 123,361,172 Works of art and historical treasures 295,457 39,300 - 334,757
Total non-depreciable capital assets 110,093,743 116,924,535 87,648,288 139,369,990 Depreciable Capital Assets:
Buildings 406,367,953 85,710,127 - 492,078,080 Improvements 23,252,306 296,533 - 23,548,839 Infrastructure assets 24,802,698 5,742,918 - 30,545,616 Equipment 93,983,001 8,566,957 3,911,373 98,638,585 Library materials 69,093,484 5,537,856 807,618 73,823,722
Total Depreciable Capital Assets 617,499,442 105,854,391 4,718,991 718,634,842 Less accumulated depreciation:
Buildings 128,435,823 11,896,132 - 140,331,955
Improvements 14,075,736
1,436,455 - 15,512,191
Infrastructure assets 11,433,376
855,782 - 12,289,158 Equipment 50,758,869 8,490,365 3,586,456 55,662,778 Library materials 45,951,305 4,757,711 807,618 49,901,398
25

Beginning Balance Additions Reductions
Ending Balance
Total accumulated depreciation
250,655,109
27,436,445
4,394,074
273,697,480
Depreciable capital assets, net 366,844,333 78,417,946 324,917 444,937,362
Total capital assets, net $476,938,076 $195,342,481 $87,973,205 $584,307,352 The following comprises property and equipment for the Foundation at June 30, 2008:
Land $19,520,986
Buildings 92,332,695
Building improvements 4,195,814
Furniture and equipment 1,024,041
Total 117,073,536
Accumulated depreciation and amortization (14,450,181)
Net property and equipment $102,623,355
6. ACCOUNTS PAYABLE AND ACCRUED EXPENSES
Accounts payable and accrued expenses consisted of the following at June 30, 2008:
Employee salaries, wages and fringe benefits payable 34,032,485 Vendors and suppliers accounts payable 9,885,909 Capital projects accounts and retainage payable 36,439,042 Total accounts payable and accrued expenses $ 80,357,436
26

7. NONCURRENT LIABILITIES
Noncurrent liabilities consist of long-term debt, installment purchases, accruals for compensated absences and retirement plans, and other noncurrent liabilities. A summary of changes in noncurrent liabilities for the year ended June 30, 2008 is as follows:
Beginning Balance Additions Reductions
Ending Balance
Current Portion
Non-current Portion
Long-term debt:
Revenue Bonds $120,141,130 $20,635,000 $7,250,030 $133,526,100 $8,591,431 $124,934,669
Notes Payable 119,080,000 81,890,000 3,625,000 197,345,000 4,305,000 193,040,000 Installment Purchases 12,412,200 1,805,432 1,282,954 12,934,678 1,344,245 11,590,433 Bond Discount (458,871) - (304,797) (154,074) (16,523) (137,551) Bond Premium 5,773,188 3,195,136 546,873 8,421,451 500,273 7,921,178 Deferred amount on refundings - (354,181) (23,794) (330,387) (35,690) (294,697)Total Long-term Debt 256,947,647 107,171,387 12,376,266 351,742,768 14,688,736 337,054,032 Accrued Compensated Absences 10,474,766 10,721,087 10,437,577 10,758,276 3,844,435 6,913,841 Loan Funds 2,656,870 - 33,404 2,623,466 - 2,623,466 Total Long-term Liabilities $270,079,283 $117,892,474 $22,847,247 $365,124,510 $18,533,171 $346,591,339
8. BONDS PAYABLE
A. Revenue Bonds George Mason University bonds are issued pursuant to Section 9, Article
X of the Constitution of Virginia. Section 9(c) bonds are backed by the full faith, credit, and taxing power of the Commonwealth, and are issued to finance capital projects which, when completed, are expected to generate revenue to repay the debt. Conversely, section 9(d) bonds are exclusively the limited obligations of the University to be repaid from pledged general revenues and other funds generated by the University. Net proceeds from the sale of revenue bonds are required to be invested in the Virginia State Non-Arbitrage program. GASB Statement Number 31 deems this participation to be involuntary.
The following schedule describes each of the revenue bonds outstanding:
27

Bond TitleYear
IssuedOriginal Amount Interest Rate
Bond Term
Final Payment
Due
Balance Outstanding at June 30, 2008
9(c) Revenue Bonds: Humanities III 1989 9,400,000 6.5 to 6.7% 20 Years 2009 867,621 Residence Halls III 1989 10,697,000 6.4 to 6.7% 20 Years 2009 987,390 Student Union II Addition 1998 1,572,296 3.5 to 5.5% 14 Years 2012 750,109 Residence Hall V 2001 21,780,000 4.0 to 5.0% 23 Years 2024 8,420,000 Housing Renovations 2001 3,435,000 4.0 to 5.0% 10 Years 2011 1,280,000 University Center 2002 14,695,852 3.75 to 5.25% 13 Years 2015 10,041,845 Residence Hall V 2002 8,635,000 2.25 to 5.0% 20 Years 2022 6,690,000 Residence Halls IV 2003 5,438,119 3.6 to 8.4% 7 Years 2010 1,710,279 Commonwealth and Dominion 2004 2,340,000 3.75 to 5.0% 10 Years 2014 1,530,000 9(c) 2004B Refunding 2004 9,939,875 2.0 to 5.0% 16 Years 2020 9,738,856 Student Housing VII 2005 25,800,000 3.75 to 5.0% 25 Years 2030 25,155,000 Student Housing VII RB#2 2006 39,080,000 4.0 to 5.0% 25 Years 2031 39,080,000 Renovate Housing -Dominion 2006 2,420,000 5.0% 10 Years 2016 2,200,000 Housing VIIC & Entrance Road 2007 15,495,000 4.0 to 5.0% 25 Years 2032 15,495,000 Presidents Park Renovation 2007 3,130,000 5.0% 10 Years 2017 3,130,000 Student Housing VII RB#3 2007 2,010,000 4.0 to 5.0% 25 Years 2032 2,010,000 Total 9(c) 175,868,142 129,086,100 9(d) Revenue Bonds: Refunded Krasnow Institute for Advanced Study * 2003 2,677,686 5.2 to 6.375% 13 Years 2016 2,446,281 Refunded Warehouse 2003 2,182,314 5.2 to 6.375% 13 Years 2016 1,993,719 Total 9(d) 4,860,000 4,400,000
Total Bonds Payable $180,728,142 $133,526,100
* The Krasnow Foundation has deposited funds with the George Mason University Foundation, which are used to reimburse the University for the debt service payments the latter is obligated to make.
Long-term debt as of June 30, 2008 matures as follows:
YEAR PRINCIPAL INTEREST TOTAL
2009 $8,591,431 $6,074,514 $14,665,945 2010 7,421,912 5,781,708 13,203,620 2011 6,843,505 5,437,039 12,280,544 2012 6,680,275 5,121,280 11,801,555 2013 6,786,257 4,797,658 11,583,915
2014-2018 30,019,244 19,118,546 49,137,790 2019-2023 27,343,476 12,700,351 40,043,827 2024-2028 24,340,000 6,562,769 30,902,769 2029-2033 15,500,000 1,410,888 16,910,888
Total $133,526,100 $67,004,753 $200,530,853
28

B. Commonwealth Bond Obligations
Commonwealth of Virginia Educational Institutions bonds, 9(b) general obligation bonds, were approved by voter referendum in the November 1992 general election. The bond liability is assumed by the Commonwealth of Virginia and is not reflected as a liability of the University.
In December 1996, Virginia College Building Authority issued
$53,160,000 in Educational Facilities Revenue bonds for the 21st Century College Program. The bond liability is assumed by the Commonwealth of Virginia and is not reflected as a liability of the University.
Chapter 924 of the 1997 Act of the General Assembly authorized the
Virginia Public Building Authority to provide $500,000 for capital costs related to the University’s construction of the Prince William Auditorium from the excess bond proceeds of the Authority. The bond liability is assumed by the Commonwealth of Virginia and is not reflected as a liability of the University.
C. Prior Year Bond Defeasance
The Commonwealth of Virginia, on behalf of the University, issued bonds
in previous fiscal years for which the proceeds were deposited into an irrevocable trust with an escrow agent to provide for all future debt service payments on other debt. The bonds representing that debt are therefore considered defeased. Accordingly, the trust account’s assets and liabilities for the defeased bonds are not included in the University’s financial statements. On June 30, 2008, $9,830,000 of general obligation bonds outstanding (Series 2001 9(c) bonds) was considered defeased.
9. NOTES PAYABLE
The University participates in the Public Higher Education Financing Program (Pooled Bond Program) created by the Virginia General Assembly in 1996. Through the Pooled Bond Program, the Virginia College Building Authority (VCBA) issues 9(d) bonds and uses the proceeds to purchase debt obligations (notes) of the University and various other institutions of higher education. The University’s general revenue secures these notes.
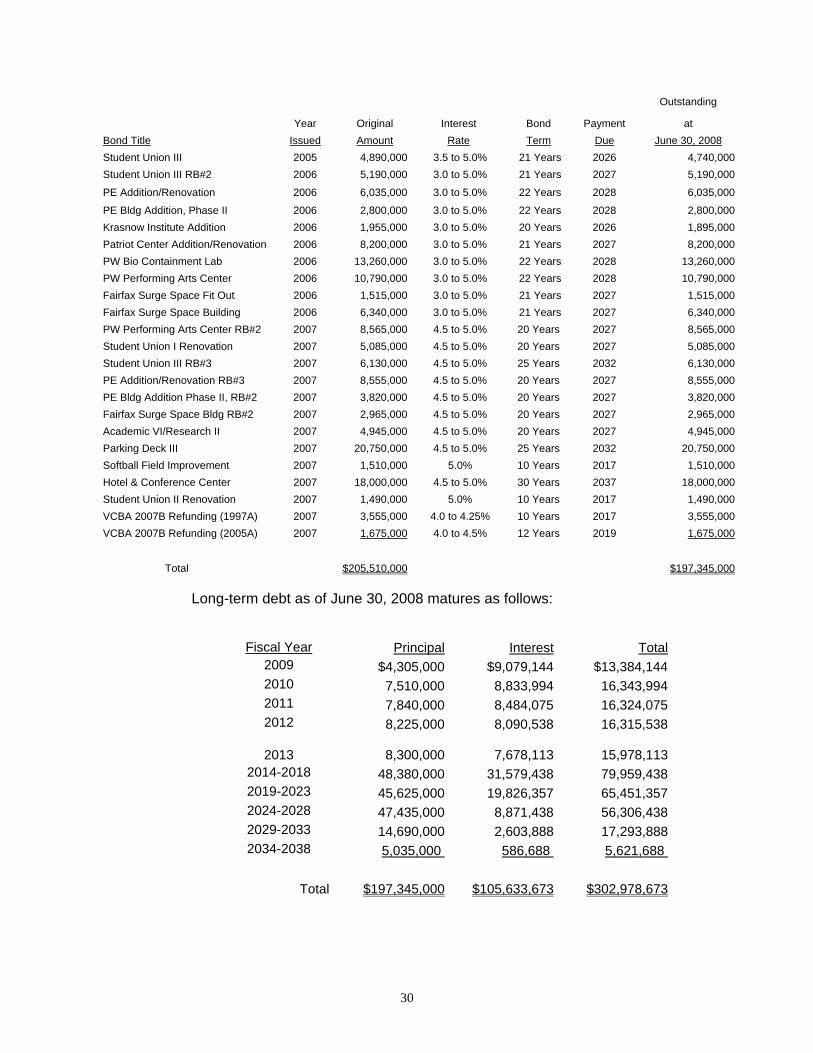
The following schedule describes each of the notes outstanding:
Final Balance
Outstanding Year Original Interest Bond Payment at
Bond Title Issued Amount Rate Term Due June 30, 2008Fairfax Parking Garage Expansion 1999 4,100,000 4.5 to 6.0% 10 Years 2009 370,000 Student Union I Renovation 2002 2,460,000 3.0 to 5.0% 9 Years 2011 1,195,000 Parking Deck II 2003 13,455,000 2.5 to 5.0% 21 Years 2024 12,115,000 Fairfax Research I 2004 10,005,000 3.0 to 5.0% 21 Years 2025 9,345,000 Aquatic Fitness Center 2004 6,785,000 3.0 to 5.0% 16 Years 2020 6,105,000 VCBA 2004B Refunding (1997A) 2004 13,470,000 3.0 to 5.0% 12 Years 2016 13,385,000 VCBA 2004B Refunding (1999A) 2004 2,720,000 3.0 to 5.0% 15 Years 2019 2,665,000 Krasnow Institute 2005 4,495,000 3.5 to 5.0% 21 Years 2026 4,355,000
Final Balance
29
Outstanding
Year Original Interest Bond Payment at Bond Title Issued Amount Rate Term Due June 30, 2008Student Union III 2005 4,890,000 3.5 to 5.0% 21 Years 2026 4,740,000 Student Union III RB#2 2006 5,190,000 3.0 to 5.0% 21 Years 2027 5,190,000
PE Addition/Renovation 2006 6,035,000 3.0 to 5.0% 22 Years 2028 6,035,000
PE Bldg Addition, Phase II 2006 2,800,000 3.0 to 5.0% 22 Years 2028 2,800,000 Krasnow Institute Addition 2006 1,955,000 3.0 to 5.0% 20 Years 2026 1,895,000 Patriot Center Addition/Renovation 2006 8,200,000 3.0 to 5.0% 21 Years 2027 8,200,000 PW Bio Containment Lab 2006 13,260,000 3.0 to 5.0% 22 Years 2028 13,260,000 PW Performing Arts Center 2006 10,790,000 3.0 to 5.0% 22 Years 2028 10,790,000 Fairfax Surge Space Fit Out 2006 1,515,000 3.0 to 5.0% 21 Years 2027 1,515,000 Fairfax Surge Space Building 2006 6,340,000 3.0 to 5.0% 21 Years 2027 6,340,000 PW Performing Arts Center RB#2 2007 8,565,000 4.5 to 5.0% 20 Years 2027 8,565,000 Student Union I Renovation 2007 5,085,000 4.5 to 5.0% 20 Years 2027 5,085,000 Student Union III RB#3 2007 6,130,000 4.5 to 5.0% 25 Years 2032 6,130,000 PE Addition/Renovation RB#3 2007 8,555,000 4.5 to 5.0% 20 Years 2027 8,555,000 PE Bldg Addition Phase II, RB#2 2007 3,820,000 4.5 to 5.0% 20 Years 2027 3,820,000 Fairfax Surge Space Bldg RB#2 2007 2,965,000 4.5 to 5.0% 20 Years 2027 2,965,000 Academic VI/Research II 2007 4,945,000 4.5 to 5.0% 20 Years 2027 4,945,000 Parking Deck III 2007 20,750,000 4.5 to 5.0% 25 Years 2032 20,750,000 Softball Field Improvement 2007 1,510,000 5.0% 10 Years 2017 1,510,000 Hotel & Conference Center 2007 18,000,000 4.5 to 5.0% 30 Years 2037 18,000,000 Student Union II Renovation 2007 1,490,000 5.0% 10 Years 2017 1,490,000 VCBA 2007B Refunding (1997A) 2007 3,555,000 4.0 to 4.25% 10 Years 2017 3,555,000 VCBA 2007B Refunding (2005A) 2007 1,675,000 4.0 to 4.5% 12 Years 2019 1,675,000
Total $205,510,000 $197,345,000
Long-term debt as of June 30, 2008 matures as follows:
Fiscal Year Principal Interest Total2009 $4,305,000 $9,079,144 $13,384,1442010 7,510,000 8,833,994 16,343,9942011 7,840,000 8,484,075 16,324,075 2012 8,225,000 8,090,538 16,315,538
2013 8,300,000 7,678,113 15,978,113 2014-2018 48,380,000 31,579,438 79,959,438 2019-2023 45,625,000 19,826,357 65,451,357 2024-2028 47,435,000 8,871,438 56,306,438 2029-2033 14,690,000 2,603,888 17,293,8882034-2038 5,035,000 586,688 5,621,688
Total $197,345,000 $105,633,673 $302,978,673
30

2008 Defeasance of Debt
In October 2007, the University issued $3,555,000 of VCBA Pooled Bonds, Series 2007B, with interest rates of 4.0 to 4.25 percent to refund $3,525,000 of outstanding notes payable with interest rates of 3.75 to 5.0 percent. The Series 2007B bonds issued to refund a portion of the Fairfax Swimming Pool and Prince William Aquatics, Series 1997A were advance refunded, where the net proceeds of $3,590,000 (after payment of $25,000 in issuance costs) were used to purchase state and local government securities. Those securities were deposited in an irrevocable trust with an escrow agent to provide for all future debt service payments on the 1997A notes. As a result, a portion of the 1997A Fairfax Swimming Pool and Prince William Aquatics notes were then considered to be defeased and the liability for those notes has been removed from the noncurrent liabilities line in the Statement of Net Assets. Any related assets in escrow have similarly been excluded. The Series 1997A notes were called in December 2007 and fully repaid, and are thus no longer defeased. Although the advance refunding resulted in the recognition of an accounting loss of $383,000 for the year ended June 30, 2008, the University in effect reduced its aggregate debt service payments by $161,500 over the next 10 years and obtained an economic gain (difference between the present values of the old and new debt service payments) of $134,000. In October 2007, the University also issued $1,675,000 of VCBA Pooled Bonds, Series 2007B, with interest rates of 4.0 to 4.5 percent to refund $1,630,000 of outstanding notes payable with interest rates of 3.5 to 5.0 percent. The Series 2007B bonds issued to refund the Child Development Center, Series 2005A were advance refunded, where the net proceeds of $1,689,000 (after payment of $12,000 in issuance costs) were used to purchase state and local government securities. Those securities were deposited in an irrevocable trust with an escrow agent to provide for all future debt service payments on the 2005A notes. As a result, the 2005A Child Development Center notes are considered to be defeased and the liability for those notes has been removed from the noncurrent liabilities line in the Statement of Net Assets. Any related assets in escrow have similarly been excluded. Although the advance refunding resulted in the recognition of an accounting gain of $28,500 for the year ended June 30, 2008, the University in effect increased its aggregate debt service payments by $277,000 over the next 12 years but obtained an economic gain (difference between the present values of the old and new debt service payments) of $22,000.
Prior Year Debt Defeasance
The Virginia College Building Authority (VCBA), in FY 2008 and prior years, issued 9(d) VCBA pooled bonds, the proceeds of which were deposited into an irrevocable trust with an escrow agent to provide for all future debt service payments on other debt. The notes representing that other debt are therefore considered defeased. Accordingly, the trust account’s assets and liabilities for the defeased notes are not included in the University’s financial statements. On June 30, 2008, $2,585,000 of notes from the Series 1999 9(d) VCBA pooled
31
bonds, and $1,630,000 of notes from the Series 2005 9(d) VCBA pooled bonds, were considered defeased.
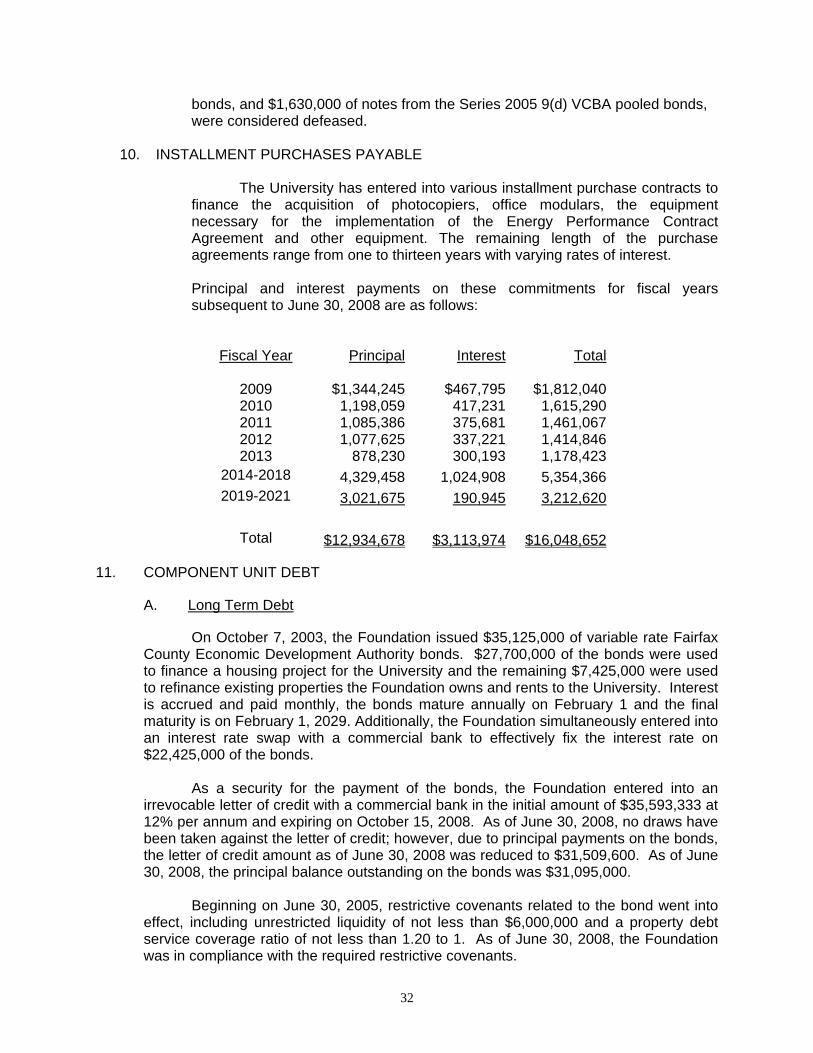
10. INSTALLMENT PURCHASES PAYABLE
The University has entered into various installment purchase contracts to finance the acquisition of photocopiers, office modulars, the equipment necessary for the implementation of the Energy Performance Contract Agreement and other equipment. The remaining length of the purchase agreements range from one to thirteen years with varying rates of interest.
Principal and interest payments on these commitments for fiscal years subsequent to June 30, 2008 are as follows:
Fiscal Year Principal Interest Total
2009 $1,344,245 $467,795 $1,812,040 2010 1,198,059 417,231 1,615,290 2011 1,085,386 375,681 1,461,067 2012 1,077,625 337,221 1,414,846 2013 878,230 300,193 1,178,423
2014-2018 4,329,458 1,024,908 5,354,366 2019-2021 3,021,675 190,945 3,212,620
Total $12,934,678 $3,113,974 $16,048,652
11. COMPONENT UNIT DEBT
A. Long Term Debt
On October 7, 2003, the Foundation issued $35,125,000 of variable rate Fairfax
County Economic Development Authority bonds. $27,700,000 of the bonds were used to finance a housing project for the University and the remaining $7,425,000 were used to refinance existing properties the Foundation owns and rents to the University. Interest is accrued and paid monthly, the bonds mature annually on February 1 and the final maturity is on February 1, 2029. Additionally, the Foundation simultaneously entered into an interest rate swap with a commercial bank to effectively fix the interest rate on $22,425,000 of the bonds.
As a security for the payment of the bonds, the Foundation entered into an
irrevocable letter of credit with a commercial bank in the initial amount of $35,593,333 at 12% per annum and expiring on October 15, 2008. As of June 30, 2008, no draws have been taken against the letter of credit; however, due to principal payments on the bonds, the letter of credit amount as of June 30, 2008 was reduced to $31,509,600. As of June 30, 2008, the principal balance outstanding on the bonds was $31,095,000.
Beginning on June 30, 2005, restrictive covenants related to the bond went into
effect, including unrestricted liquidity of not less than $6,000,000 and a property debt service coverage ratio of not less than 1.20 to 1. As of June 30, 2008, the Foundation was in compliance with the required restrictive covenants.
32

Interest incurred on the bonds as well as the related swap agreement during
fiscal year 2008 totaled $1,268,948.
On September 24, 2004, GMUF Arlington Campus, LLC secured a $61 million construction/mini-permanent loan with a consortium of banks and secured by a deed of trust on the property on 3434 North Washington Street and the improvements to be made on the property. The terms of the loan are seven years floating at LIBOR plus 2.25%. Concurrently, the GMUF Arlington Campus, LLC entered into a forward swap agreement with a financial institution to synthetically lock the interest rate at 6.96% for years three through seven. The loan requires monthly payments of interest only for 24 months and then will be amortized on a 25-year basis thereafter. This loan was paid off on August 18, 2006, resulting in zero balance outstanding at June 30, 2008.
In addition to the $61 million dollar loan, GMUF Arlington Campus, LLC entered
into a $6 million loan agreement for five years at a floating rate of LIBOR plus 2.25%. This second loan is secured by real property owned by the Foundation at a cost of approximately $10.4 million and by $823,000 of fixed income marketable securities. The proceeds from that loan have been deposited into an investment account with a financial institution guaranteed to earn income at the rate of LIBOR plus 1.25% locking in the negative arbitrage for the Foundation at 1%. This loan requires monthly payments of interest only with a principal payment of $1 million due at the end of both year three and year four with the balance due September 2009. This loan was paid off on August 18, 2006 resulting in zero balance outstanding at June 30, 2008.
On August 18, 2006, GMUF Arlington Campus, LLC secured a permanent 10-
year $68.5 million loan by executing a deed of trust on real property located at 3434 North Washington Street with a book value of $58,810,080 with a financial institution. There are two notes (“A note” and “B note”) under the deed of trust with the A note for $64,000,000 at a fixed interest rate of 6.24% per annum, two years interest only, with 30 year amortization thereafter, and the B note for $4,500,000 at a fixed interest rate of 10.50% per annum, two years interest only, with a 30 year amortization thereafter. The resulting blended rate for the two notes is 6.52%.
On February 16, 2007, GMUF Arlington Campus, LLC secured an additional
seven-year $1,300,000 collateral loan, secured by real property with a financial institution. The note has a fixed interest rate of 6.3%. As of June 30, 2008, the principal balance outstanding on the note was $1,200,000.
In fiscal year 2008, interest expense on all GMUF Arlington Campus, LLC loans
totaled $4,621,166.
The following are maturities of the long-term debt for the next five years ending June 30:
2009 $1,354,4802010 1,609,9222011 1,685,0042012 1,776,3602013 1,869,811Thereafter 92,499,423Total $100,795,000
33

B. Derivative Instruments
In October 2003, the Foundation entered into an interest rate swap agreement with a financial institution against the floating rate bonds in the notional amount of $22,425,000 at a fixed interest rate of 4.56%, including all costs, on a 20-year amortization schedule. Concurrently, the Foundation entered into a 20-year interest rate cap agreement with the same financial institution in the notional amount of $12,700,000, at a rate of 10%. At June 30, 2008, the notational amount on the swap was $19,475,000 and on the cap was $11,750,000. The interest rate swap was used as a cash flow hedge to synthetically fix the rate of the bonds and to eliminate changes in the market interest rates.
The fair value of the interest rate swap at June 30, 2008, totaled a derivative
liability of $809,341 and the interest rate cap at June 30, 2008, totaled a derivative asset of $21,824. The net change in value has been recorded as an unrealized loss on derivative in the consolidated statement of activities. Additionally, all assets or liabilities related to the interest rate swap and interest rate cap convert to zero at contract maturity in 2024.
On September 24, 2004, GMUF Arlington Campus, LLC entered into a forward
interest rate swap agreement with a financial institution to lock the interest rate at 6.96% for years three through seven related to their $61 million construction/mini-permanent loan. The interest rate swap was used as a cash flow hedge to synthetically fix the rate of the loan and to eliminate changes in the market interest rates. On August 18, 2006, the forward interest rate swap was unwound and settled for $1,058,000, resulting in a realized loss on derivative of $984,456 in the consolidated statement of activities as of June 30, 2007.
In October 2006, the Foundation entered into an interest rate swap agreement
with a financial institution against the floating rate bonds in the notional amount of $25,775,000 on a 23-year amortization schedule. At June 30, 2008, the notational amount on the swap was $25,775,000. The swap was used as a cash flow hedge to stabilize the interest rate for the last five years of the bond issue related to the student housing project and expects to create positive cash flows over the remaining bond life. At closing on October 19, 2006, the Foundation received $250,000 up front cash. Under the swap agreement, beginning in February 2007 the Foundation will received the difference between the Bond Market Association (BMA) index and 68.48% of the 5 year LIBOR index from the swap provider. If the BMA index is higher than 68.48% of the 5 year LIBOR index, the Foundation paid the difference to the swap provider. In fiscal year 2008, the swap provider paid $10,978 to the Foundation which is included in interest expense on the consolidated statement of activities.
The fair value of the interest rate swap at June 30, 2008, totaled a derivative
liability of $143,569. The net change in value has been recorded as an unrealized gain on derivative in the consolidated statement of activities. Additionally, all assets or liabilities related to the interest rate swap and interest rate cap convert to zero at contract maturity in 2029.
34

12. EXPENSES BY NATURAL CLASSIFICATION
The following table shows a classification of expenses both by function as listed in the Statement of Revenues, Expenses, and Changes in Net Assets and by natural classification, which is the basis for amounts shown in the Statement of Cash Flows.
Salaries
and WagesFringe
BenefitsGoods and Services
Scholarships and
Fellowships Depreciation Total Instruction $150,077,305 $35,188,533 $21,029,088 - - $206,294,926 Research 30,111,702 5,651,835 16,588,240 - - 52,351,777 Academic Support 26,237,960 8,866,813 8,568,665 - - 43,673,438 Student Services 12,675,133 3,345,334 3,362,302 - - 19,382,769 Public Services 5,822,775 1,351,237 5,462,868 - - 12,636,880 Operation and Maintenance of Plant 8,977,231 3,114,943 16,201,337 - - 28,293,511 Institutional Support 23,495,147 9,695,948 7,935,440 - - 41,126,535 Depreciation Expense - - - - 27,436,445 27,436,445 Scholarships and Fellowships - - - 14,758,370 - 14,758,370 Auxiliary Enterprises 21,904,602 5,640,678 50,548,982 - - 78,094,262 Totals $279,301,855 $72,855,321 $129,696,922 $14,758,370 $27,436,445 $524,048,913
13. STATE APPROPRIATIONS – CURRENT UNRESTRICTED FUNDS
George Mason University receives appropriations from the General Fund of the
Commonwealth. The Appropriation Act specifies that such unexpended appropriations shall revert, as specifically provided by the General Assembly, at the end of a biennium. For years ending at the middle of a biennium, unexpended appropriations that have not been approved for reappropriation in the next year by the Governor become part of the General Fund of the Commonwealth and are, therefore, no longer available to the University for disbursements. The following is a summary of General Fund appropriations received by the institution including all supplemental appropriations and reversions:
Original Appropriation $ 136,146,251
Central adjustment for budget reduction (6,912,313)
Central adjustment for tuition incentive 614,746 Central adjustment for FY 07 interest 1,412,801 Central adjustment for additional FY 07 interest 510,972 Central adjustment for FY 07 SPCC rebate 108,047
Central Adjustments for Salary and Benefits: Increased employee mileage reimbursement 16,327 Group life rate increase 172,253 Retirement rate adjustments 818,804 Retiree health credit rate adjustment 137,803 Health insurance premium increase 1,511,432 VSDP rate adjustment 301,441 Salary increase – state employees 2,570,469 Salary increase – pay practices 170,201
35

Funds for VIVA Program 26,338 Final Appropriation 137,605,572 Reversal of prior year accruals and cash reversion (2,038,388) Final Appropriation, net of prior year accruals and reversion $ 135,567,184
14. INTEREST EXPENSE
During 2008, the University incurred interest expense totaling $12,661,218. Of this amount, $7,650,756 was capitalized as part of the cost of construction and $5,010,462 was expensed.
15. COMMITMENTS
A. Operating Leases
The University is committed under various operating leases for rental of off-campus facilities. The leases are for one to ten year terms. Facility rental expenses for the fiscal year ended June 30, 2008 were $5,191,395. The University had, as of June 30, 2008, the following total future minimum rental payments due under the above leases:
Year Ended June 30,
2009 $ 4,850,3822010 4,340,7192011 4,141,2682012 1,825,8822013 1,741,342
Total $16,899,593
B. Construction
Outstanding commitments for capital outlay projects that were under construction at June 30, 2008 were $255,120,339.
16. RETIREMENT AND PENSION SYSTEMS
A. Virginia Retirement System (VRS)
Substantially all full-time classified salaried employees of George Mason University participate in the defined benefit retirement plan administered by VRS. The VRS is an agent multiple-employee public employee retirement system that acts as a common investment and administrative agency for the Commonwealth of Virginia and its political subdivisions.
36

The VRS does not measure assets and pension benefit obligations separately for individual state institutions. Information relating to this plan is available at the statewide level in the Commonwealth of Virginia’s Comprehensive Annual Financial Report (CAFR). Because the employees of the University are also employees of the Commonwealth, the Commonwealth of Virginia and not the University has the overall responsibility for contributions to this plan. The CAFR provides disclosure of the Commonwealth’s unfunded pension benefit obligation at June 30, 2008. The same report contains historical trend information showing VRS’s progress in accumulating sufficient assets to pay benefits when due.
The University’s expenses include the amount assessed by the Commonwealth
for contributions to VRS, which totaled approximately $9,640,439 for the year ended June 30, 2008. The retirement contribution rate was 11.1% for fiscal year 2008. Contributions to VRS were calculated using the base salary amount of approximately $86,740,681 for the year ended June 30, 2008.
The University’s law enforcement officers participate in the Virginia Law Officers’
Retirement System (VaLORS). The University’s expenses include the amount assessed by the Commonwealth for contributions to VaLORS, which totaled approximately $546,561 for the year ended June 30, 2008. The VaLORS retirement contribution rate was 18.2% for fiscal year 2008. Contributions to VaLORS were calculated using the base salary amount of approximately $2,998,104 for the year ended June 30, 2008.
The University’s expenses include the amount assessed by the Commonwealth
for contributions to the VRS Alternative Severance Option early retirement program, which totaled approximately $115,961 for the year ended June 30, 2008. Contributions were determined by formula based on years of service and annual salary.
The University’s total payroll was approximately $282,031,151 for fiscal year
2008.
B. Faculty Retirement Plans Most full-time faculty and certain administrative staff participate in one faculty
retirement plan with two investment providers rather than the VRS. These are defined contribution plans where the retirement benefits received are based upon the employer’s 10.3 percent contribution plus interest and dividends. The employee is not required to make contributions to the program. Individual contracts issued under the plan provide for full and immediate vesting of the University’s contributions. As with VRS, the employees' contributions are assumed by the employer. Total pension costs under these plans were approximately $13,748,176 for the year ended June 30, 2008. Contributions were calculated using the base salary of approximately $133,151,622 for fiscal year 2008. The University’s total payroll for fiscal year 2008 was approximately $282,031,151. The following schedule summarizes the cost and participation in the optional retirement plans.
37

Faculty Retirement Plans Retirement Pension CostPlan’s Covered
PayrollContributionPercentage
TIAA-CREF* $10,132,485 $98,149,705 10.3% Fidelity Investments 3,615,691 35,001,917 10.3%
Total $13,748,176 $133,151,622
*Teachers Insurance and Annuity Association/College Retirement Equities Fund
C. Deferred Compensation
Employees of the University are employees of the Commonwealth of Virginia.
State employees may participate in the Commonwealth's Deferred Compensation Plan. Participating employees can contribute to the plan each pay period with the Commonwealth matching up to $20 per pay period. The dollar amount match can change depending on the funding available in the Commonwealth's budget. The Deferred Compensation Plan is a qualified defined contribution plan under Section 401(a) of the Internal Revenue Code. Employer contributions under the Deferred Compensation Plan were approximately $879,907 for the fiscal year ended June 30, 2008.
17. POST-RETIREMENT BENEFITS
The Commonwealth participates in the VRS administered statewide group life insurance program which provides post employment life insurance benefits to eligible retired and terminated employees. The Commonwealth also provides health care credits against the monthly health insurance premiums of its retirees who have at least 15 years of service and participate in the State health plan. Information related to these plans is available at the statewide level in the Commonwealth's Comprehensive Annual Financial Report.
18. RISK MANAGEMENT AND EMPLOYEE HEALTH CARE PLANS
The University is exposed to various risks of loss related to torts; theft, or
damage to, and destruction of assets; errors and omissions; non-performance of duty; injuries to employees; and natural disasters. The University participates in insurance plans maintained by the Commonwealth of Virginia. The Department of Human Resource Management administers the Commonwealth employee health care and worker’s compensation plans, and the Department of Treasury, Division of Risk Management, administer the risk management insurance plans. Risk management insurance includes property, general liability, faithful performance of duty bond, automobile, and air and watercraft plans. The University pays premiums to each of these departments for its insurance coverage. Information relating to the Commonwealth’s insurance plans is available at the statewide level in the Commonwealth’s Comprehensive Annual Financial Report.
19. SUBSEQUENT EVENTS
In July 2008, the University executed a $41.5 million construction contract with Whiting-Turner Contracting Company for construction management services on the Prince William Biomedical Research Laboratory Project.
38
During September 2008, the renovation of Presidents Park I, Phase I, was completed. $2.9 million included in Construction in Progress at June 30, 2008, will be capitalized to buildings during FY 2009.
During September 2008, Student Union Building III, part of the Student Housing VII project, was completed. $9.9 million, included in Construction in Progress at June 30, 2008, will be capitalized to buildings during FY 2009.
During September 2008, the renovation of Commonwealth and Dominion Halls was completed. $728 thousand, included in Construction in Progress at June 30, 2008, will be capitalized to buildings during FY 2009. In November 2008, the Commonwealth Treasury Board completed the sale of the General Obligation Bonds, Series 2008B. The University’s share of the total principal amount of the bonds issued is $34.3 million. The University will use the proceeds of these bonds to finance several student housing construction and renovation projects. Payment on the bonds will be made semi-annually, with an interest rate ranging from 3 to 5 percent. The final payment will be due in 2033. In November 2008, the University signed a PPEA (Public-Private Education Facilities and Infrastructure Act) comprehensive agreement in the amount of $53.6 million with University Hotel Partners, LLC for the design and construction of a hotel/conference center ($50.3 million) and related infrastructure ($3.3 million). During December 2008 the George Mason Softball Field Improvement was completed. $194 thousand, included in Construction in Progress at June 30, 2008, will be capitalized to Improvements, along with additional expenditures made during FY 09, bringing total capitalization to approximately $2.1 million. In January 2009, the University entered into fourteen promissory notes with the Virginia College Building Authority (VCBA) to participate in the Educational Facilities Revenue Bonds, Series 2009A, issued by the VCBA under its Pooled Bond Program. The total principal amount of these notes is $136.7 million. The University will use the proceeds of these notes to finance several construction and renovation projects including six new buildings, five additions/renovations, a new parking deck, and other campus improvements. Payment on the notes will be made semi-annually, with an interest rate ranging from 2.1 percent to 5 percent. The final payment will be due in 2038. In February 2009, the University signed a contract in the amount of $17.5 million with Hess Construction for design-build services for an addition to, and renovation of, Student Union Building I. In February 2009, the University’s Board of Visitors voted to rescind the University’s participation in the campus at Ras al Khaimah (RAK) in the United Arab Emirates at the conclusion of the Spring 2009 semester due to procedural and budgetary changes made in the campus’ operations by the partner foundation in the RAK. No significant costs will be incurred to close out the University’s participation.
39

Subsequent to June 30, 2008, the global financial and credit markets experienced some of the greatest turbulence in their history, resulting in significant reductions in equity values and available credit. University management estimates the effect of these declines on its investment portfolio, including its endowment, to be a decrease of approximately 33 percent, or $1.3 million, as of February 28, 2009. The George Mason University Foundation’s investments, included in the Component Unit column of the Statement of Net Assets, have experienced similar declines during this period of market volatility. The market value of the Foundation’s investments decreased approximately 27%, or $26.0 million, as of February 28, 2009. In March 2009, the University announced that it will terminate its cooperative agreement with the Northern Virginia Regional Park Authority for operation of the Hemlock Overlook Center for Experiential Education. The decision to bring the agreement to a close followed an assessment of the facility’s cost viability and its fit with the University’s future plans. Mason will end its joint agreement with the Park Authority effective June 30, 2009. No significant costs will be incurred to close out the University’s participation.
40
April 23, 2009 The Honorable Timothy M. Kaine Governor of Virginia The Honorable M. Kirkland Cox Chairman, Joint Legislative Audit and Review Commission Board of Visitors George Mason University
INDEPENDENT AUDITOR’S REPORT ON FINANCIAL STATEMENTS
We have audited the accompanying financial statements of the business-type activities and discretely presented component unit of George Mason University, a component unit of the Commonwealth of Virginia, as of and for the year ended June 30, 2008, which collectively comprise the University’s basic financial statements as listed in the table of contents. These financial statements are the responsibility of the University’s management. Our responsibility is to express opinions on these financial statements based on our audit. We did not audit the financial statements of the component unit of the University, which is discussed in Note 1. Those financial statements were audited by other auditors whose report thereon has been furnished to us, and our opinion, insofar as it relates the amounts included for the component unit of the University is based on the report of the other auditors.
We conducted our audit in accordance with auditing standards generally accepted in the United States of America and the standards applicable to financial audits contained in Government Auditing Standards, issued by the Comptroller General of the United States. Those standards require that we plan and perform the audit to obtain reasonable assurance about whether the financial statements are free of material misstatement. The financial statements of the component unit of the University that was audited by other auditors upon whose report we are relying was audited in accordance with auditing standards generally accepted in the United States of America, but not in accordance with Government Auditing Standards. An audit includes examining, on a test basis, evidence supporting the amounts and disclosures in the financial statements. An audit also includes assessing the accounting principles used and significant estimates made by management, as well as evaluating the overall financial statement presentation. We believe that our audit and the report of other auditors provide a reasonable basis for our opinions.
In our opinion, based on our audit and the report of other auditors, the financial statements referred to above present fairly, in all material respects, the financial position of the business-type activities and discretely presented component unit of the University as of June 30, 2008, and the respective changes in
41

financial position and cash flows, where applicable, thereof for the year then ended, in conformity with accounting principles generally accepted in the United States of America.
The management’s discussion and analysis is not a required part of the basic financial statements, but is supplementary information required by accounting principles generally accepted in the United States of America. We have applied certain limited procedures, which consisted principally of inquiries of management regarding the methods of measurement and presentation of the required supplementary information. However, we did not audit the information and express no opinion on it.
In accordance with Government Auditing Standards, we have also issued our report dated April 23, 2009, on our consideration of George Mason University’s internal control over financial reporting and on our tests of its compliance with certain provisions of laws, regulations, contracts, and grant agreements and other matters. The purpose of that report is to describe the scope of our testing of internal control over financial reporting and compliance and the results of that testing, and not to provide an opinion on the effectiveness of internal control over financial reporting or on compliance. That report is an integral part of an audit performed in accordance with Government Auditing Standards and should be considered in assessing the results of our audit.
AUDITOR OF PUBLIC ACCOUNTS JHS/clj
42

GEORGE MASON UNIVERSITY
BOARD OF VISITORS As of June 30, 2008
Ernst Volgenau, Rector
J. Knox Singleton, Vice Rector
Carol Merchant Kirby, Secretary
Anne K. Altman Glenn C. Lewis Terri Cofer Beirne Byron F. Marchant Kathleen deLaski Charlie H. Mills, III C. Gibson Dunn Long Nguyen Dennis Garcia Sudhakar V. Shenoy Harry F. Hopper, III William Soza
D. Jean Wu
Suzanne Slayden, Faculty Representative Deidra Marie Bailey, Student Representative
Aline Sandouk, Student Representative
ADMINISTRATIVE OFFICERS
Alan G. Merten, President
Maurice W. Scherrens, Senior Vice President
Elizabeth A. Brock Associate Vice President and Controller