Embed Size (px)
Citation preview

®
The contents of this report reflect the views of the authors, who are responsible for the facts and the accuracy of the information presented herein. This document is disseminated under the sponsorship of the Department of Transportation
University Transportation Centers Program, in the interest of information exchange. The U.S. Government assumes no liability for the contents or use thereof.
Development of New Design Guidelines at Bridge
Report # MATC-UI: 141-1 Final Report
for Protection against Erosion Abutments - Phase I
George Constantinescu, Ph.D.ProfessorDepartment of Civil and Environmental EngineeringThe University of Iowa
2018
A Cooperative Research Project sponsored by U.S. Department of Transportation- Office of the AssistantSecretary for Research and Technology
WBS:25-1121-0005-141-1

Development of New Design Guidelines for Protection against Erosion at Bridge Abutments - Phase I
George Constantinescu, Ph.D., PI Professor Department of Civil and Environmental Engineering The University of Iowa
A Report on Research Sponsored by
Mid-America Transportation Center
University of Nebraska–Lincoln
December 2018

ii
Technical Report Documentation Page 1. Report No.
25-1121-0005-141-12. Government Accession No. 3. Recipient’s Catalog No.
4. Title and SubtitleDevelopment of New Design Guidelines for Protection against Erosion at Bridge Abutments - Phase I
5. Report DateDecember, 20186. Performing Organization Code
7. Author(s)George Constantinescu, Ph.D.; ORCID: 0000-0001-7060-8378
8. Performing Organization Report25-1121-0005-141-1
9. Performing Organization Name and AddressDepartment of Civil and Environmental Engineering,The University of Iowa, Iowa City, IA 52242
10. Work Unit No.
11. Contract or Grant No.69A3551747107
12. Sponsoring Agency Name and Address 13. Type of Report and PeriodCoveredFinal Report14. Sponsoring Agency Code91994-1
15. Supplementary NotesConducted in cooperation with the U.S. Department of Transportation, Federal Highway Administration.16. AbstractOver the last two decades, the United States Midwest has experienced increasingly catastrophic flood events. Severe erosion problems occurred even though the erosion protection design measures for bridge abutments and their embankments followed the existing guidelines (e.g., HEC 23, 2001 and following updates through 2009). The methodology proposed to estimate design variables in scour protection measure formulas (e.g., size of riprap stone) for these guidelines at such sites is oversimplified. The present research proposes a numerically-based approach for improving methodologies to design riprap protection measures at wing-wall and spill-through abutments. The mean flow fields and the bed shear stress distributions predicted using high-resolution, fully three-dimensional (3-D), non-hydrostatic RANS simulations were used to estimate the maximum bed shear stress over the riprap layer, the shear-failure entrainment threshold for the riprap stone and the other variables in the design formulas recommended in HEC 23 (Lagasse et al., 2001). The numerically-based approach was successfully validated for the case of wing-wall abutments placed in a straight channel. Simulations were also conducted for spill-through abutments with varying floodplain width, ratio of abutment length to floodplain width, and riprap stone size. The simulations demonstrated the critical Froude number corresponding to the entrainment threshold decreases monotonically with increasing La/Bf or La/yf (Bf=floodplain width, La=abutment length, yf=flow depth over floodplain). Modifications are proposed to the standard Lagasse et al. (2001) formula that ensure the (modified) design formula is applicable to a range of flow and geometrical parameters. There is a need for further research to determine the range of applicability of the standard design formulas such that they can be applied to more complex cases. 17. Key WordsBridges, Bridge scour, Bridge abutment, Local Scour,Rip-rap protection against scour
18. Distribution StatementNo restrictions. This document is availablethrough the National Technical InformationService, Springfield, VA 22161.
19. Security Classif. (of this report)Unclassified
20. Security Classif. (of thispage)Unclassified
21. No. ofPages
37
22. Price
ii
Table of Contents
Acknowledgments ......................................................................................................................... v Disclaimer ...................................................................................................................................... vi Abstract ......................................................................................................................................... vii Chapter 1 Introduction .................................................................................................................... 1
1.1 Motivation ..................................................................................................................... 1 1.2 Objectives ……………………………………………………………………………..3 1.3 Justification of Research Approach…………………………………………………...4
Chapter 2 Numerical Method ......................................................................................................... 6 Chapter 3 Wing-Wall Abutments ................................................................................................... 9
3.1 Description of Test Cases and RANS Solutions ........................................................... 9 3.2 Validation .................................................................................................................... 20 3.3 Comparison with Predictions of Design Formulas ..................................................... 21
Chapter 4 Spill-Through Abutments ............................................................................................. 23 4.1 Description of Test Cases and RANS Solutions ......................................................... 23 4.2 Comparison with Predictions of Design Formulas ..................................................... 30
Chapter 5 Conclusions, Recommendations and Proposed Future Work ...................................... 32 References ..................................................................................................................................... 36

iii
List of Figures Figure 1.1 Effect of flood on erosion at a small bridge with two (wing-wall) abutments situated in Squaw Creek, close to Ames (Iowa).. ......................................................................................... 2 Figure 3.1 Sketch showing general layout of the numerical simulations performed for a wing-wall abutment placed on the floodplain of a straight channel. Dimensions are in meters.. .......... 10 Figure 3.2 Computational domain used in the Case I, Case II and Case III simulations of flow past a wing-wall abutment. Shown are the main lengths (m) in the channel cross section. .... 11-13 Figure 3.3 Grid used to mesh the channel containing a wing-wall abutment for Case II simulations. ................................................................................................................................... 14 Figure 3.4 Visualization of the solution for Case IIc simulation with Fr=0.65. a) nondimensional streamwise velocity in relevant cross sections; b) nondimensional vertical vorticity at the free surface; c) nondimensional TKE; d) nondimensional bed friction velocity. ........................... 15-17 Figure 3.5 Nondimensional bed friction velocity distribution over the riprap layer predicted by the numerical simulations for some of the wing-wall abutment test cases. ............................. 18-19 Figure 3.6 Comparison of numerical results with Lagasse et al. (2001) and Pagan-Ortiz (1991) equations and the experimental data of Melville et al. (2007) for wing-wall abutments. Simulation data show predicted conditions for treshold of riprap entrainment by shear failure. Experimental data show if failure occurred (open symbols) or not (solid symbols) in the corresponding experiments. .......................................................................................................... 20 Figure 3.7 Comparison of numerical results with Lagasse et al. (2001) and Pagan-Ortiz (1991) equations and the experimental data of Melville et al. (2007) for wing-wall abutments. Plotted ia a modified version of Lagasse et al. (2001) formula (Ks=1.65) that results in conservative predictions of minimum riprap size for analyzed cases with wide floodplains. .......................... 22 Figure 4.1 Sketch showing general layout of the numerical simulations performed for a spill-through abutment placed on the floodplain of a straight channel. Dimensions are in meters. ..... 23 Figure 4.2 Computational domain used in the Case III simulations of flow past a spill-through abutment. Shown are the main lengths (m) in the channel cross section. .................................... 25 Figure 4.3 Computational grid used to mesh the channel containing a spill-through abutment for Case III simulations ...................................................................................................................... 26 Figure 4.4 Visualization of the solution for Case IIIc1 simulation with Fr=1.0. a) nondimensional streamwise velocity at the free surface; b) nondimensional vertical vorticity at the free surface; c) nondimensional TKE; d) nondimensional bed friction velocity. ............................................. 27-28 Figure 4.5 Nondimensional bed friction velocity distribution over the riprap layer predicted by the numerical simulation for the Case IIIc1 simulation with Fr= of spill-through abutment test cases. ............................................................................................................................................. 30 Figure 4.6 Comparison of numerical results with Lagasse et al. (2001) equation for spill-through abutments. Plotted ia a modified version of Lagasse et al. (2001) formula (Ks=1.1) that results in conservative predictions of minimum riprap size. ........................................................................ 31

iv
List of Tables Table 3.1 Matrix of test cases considered for the wing-wall abutment .......................................... 9 Table 4.1 Matrix of test cases considered for the spill-through abutment .................................... 24

v
Acknowledgments
We would like to thank Prof. Bruce Melville form University of Auckland, New Zeeland
for providing additional information on his experiments carried for wing-wall abutments.
vi
Disclaimer
The contents of this report reflect the views of the authors, who are responsible for the
facts and the accuracy of the information presented herein. This document is disseminated in the
interest of information exchange. The report is funded, partially or entirely, by a grant from the
U.S. Department of Transportation’s University Transportation Centers Program. However, the
U.S. Government assumes no liability for the contents or use thereof.

vii
Abstract
Over the last two decades, the United States Midwest has experienced increasingly
catastrophic flood events. Severe erosion problems occurred even though the erosion protection
design measures for bridge abutments and their embankments followed the existing guidelines
(e.g., Hydraulic Engineering Circular HEC 23, 2001 and following updates through 2009). The
methodology proposed to estimate design variables in scour protection measure formulas (e.g.,
size of riprap stone) for these guidelines at such sites is oversimplified. The calibration of these
formulas is based on a limited series of laboratory experiments conducted for a limited range of
relevant geometrical and flow parameters that cause erosion at such bridge sites. This project
aims to improve designs to increase erosion protection guideline applications.
The present research proposes a numerically-based approach for improving
methodologies to design riprap protection measures at wing-wall and spill-through abutments.
Such abutments are common at the floodplain on small bridges where no piers are present. The
mean flow fields and the bed shear stress distributions predicted using high-resolution, fully
three-dimensional (3-D), non-hydrostatic RANS simulations were used to estimate the maximum
bed shear stress over the riprap layer, the shear-failure entrainment threshold for the riprap stone
and the other variables in the design formulas recommended in HEC 23 (Lagasse et al., 2001).
The numerically-based approach was successfully validated for the case of wing-wall abutments
placed in a straight channel, for which detailed laboratory experiments are available. Simulations
were also conducted for spill-through abutments with varying floodplain width, ratio of abutment
length to floodplain width, and riprap stone size. The simulations demonstrated the critical
Froude number corresponding to the entrainment threshold decreases monotonically with
increasing La/Bf or La/yf (Bf=floodplain width, La=abutment length, yf=flow depth over

viii
floodplain). Modifications are proposed to the standard Lagasse et al. (2001) formula that ensure
the (modified) design formula is conservative enough when applied for the range of flow and
geometrical parameters considered in the present study. There is a need for further research to
determine the range of applicability of the Lagasse et al. (2001) formula and eventual
modifications of the standard formula such that it can be applied to more complex cases (e.g.,
abutments placed in a curved channel).

1
Chapter 1 Introduction 1.1 Motivation
Over the last several decades, the United States has experienced increasingly severe flood
events (e.g. during 1993 and 2008) both in terms of frequency and intensity (e.g. peak discharges
and stages, duration of the flood event). Consequently, significant erosion can occur if piers,
abutments and bridge embankments are not protected effectively. This is especially a concern in
the US Midwest where a large number of small bridges are present in rural areas. In extreme
cases including large floods when overtopping occurs, the embankments of such small bridges
can be washed away. The most common type of protection measure is to place riprap stone in
regions around the base of the structure where severe scour is expected to develop. The increased
size/weight of the riprap stones enables them to resist the increased velocities and turbulence
caused by the presence of the abutment in the flow, and thereby provide an armor layer
protection to the underlying sediments. Riprap placed in an apron at the base of an abutment may
be subjected to shear failure. Shear failure occurs where the individual riprap stones are not large
enough to resist entrainment by the flow. Two common types of abutments encountered at small
bridges are spill-through and wing-wall abutments.
An example is shown in figure 1.1, where the flood washed the back sides of the two
wing-wall abutments during the 1993 flood at a small Iowa bridge. After the flood, the
embankment was reconstructed by filling the washed road reaches in the vicinity of the bridge
and protecting the top surfaces with riprap stone.

2
Figure 1.1 Effect of flood on erosion at a small bridge with two (wing-wall) abutments situated
in Squaw Creek, close to Ames (Iowa).
The first two pictures show all the erodible material behind the toe of the abutment
washed by the flood. The last two pictures show the bridge after the abutments were
reconstructed and large-scale riprap stone was placed on the floodplain around the abutments for
protection against future floods. These infrastructural failures highlight the need for increased
attention on abutment design for small bridges where the abutments are placed on the floodplain
and no piers are present.
Existing design guidelines are mostly based on laboratory experiments (flume studies)
conducted for a few types of such abutments (e.g., in terms of shape, geometry, construction

3
materials) and for a limited range of flow conditions. For example, present design guidelines are
not accounting for pressure scour effects at high flow conditions when the bridge deck becomes
submerged. Severe erosion problems were reported at some bridge abutments where riprap
protection measures followed existing design guidelines. These guidelines need to be improved
by proposing modified formulas or methodologies that can provide effective protection against
erosion for a wider range of flow and geometrical conditions at these two types of abutments
(HEC 23, Lagasse et al., 2001, Melville and Coleman, 2000, Melville et al., 2006a, 2006b,
Hoffmans and Verheij, 1997, Ettema et al., 2011).
1.2 Objectives
As discussed in section 1.1, there is a clear need to conduct new research to better address
the fundamental aspects of the scour protection design guidelines for abutments in HEC 23. The
main research objectives of this project are to:
1. Validate a numerical approach based on 3-D RANS non-hydrostatic simulations to
estimate maximum bed shear stress and to evaluate the critical Froude number at which
entrainment of riprap stone with a certain diameter will occur
2. Test performance of main design formula recommended by HEC 23 (Lagasse et al.,
2001) to estimate minimum size of riprap stone used for protection against erosion for
wing-wall and spill-through abutments placed in straight channels with a floodplain
3. Propose modified versions of the design formula such that it can be applied for a wider
range of flow and geometrical parameters
In a more general context, the main impact of the present research will be to get a better
understanding of why existing riprap design formulas are not conservative enough in some cases

4
and on ways to improve the performance of these formulas (e.g., via inclusion of additional
factors of safety, different estimation of some of the variables in existing design formulas) in
order to reduce the risk of a serious bridge failure due to flood-induced scour.
1.3 Justification of Research Approach
Understanding and being able to quantitatively describe how the hydrodynamics of the
stream flow field (velocity magnitude and bed shear stress distributions around the bridge site)
changes with increasing stage and discharge as a result of a flood is critical to be able to propose
effective measures to protect bridge abutments and piers against erosion. The National
cooperative Highway Research Program Report 587 used in the development of HEC 23 states
the following:
Selection of countermeasures to protect bridges from scour requires estimates of velocity distributions in the bridge opening. Estimates of the peak velocity in what is typically a highly non-uniform flow distribution near the tip of the abutment is necessary to determine whether countermeasures are necessary and, if so, to determine the type, size, and extent of countermeasures to protect bridge abutments from scour. Laboratory physical models have been developed to determine the size, type, and location of protection for a relatively small range of flow conditions at bridges; however, the laboratory models represent very simplistic geometric conditions. Effective transfer of laboratory model results to the complex hydrodynamic conditions of real bridge sites requires that flow velocity be predicted in the vicinity of bridge abutments using numerical models. The report also comments on the limitations of the two-dimensional (2-D) depth-
averaged modeling approach which was used to provide more accurate estimations of the
variables in the design formulas used to protect against erosion. The main limitations of the 2-D
approach are due to the hydrostatic pressure assumption and simplified turbulence modeling.
Moreover, the region of maximum velocity amplification near the abutment toe is generally

5
located in a region of high flow curvature and, in many cases, it is situated over a sloped surface
where such 2-D numerical simulations give relatively large errors.
The present study uses fully three-dimensional (3-D) RANS simulations performed on
fine meshes to obtain the velocity flow field. This allows direct estimation of the boundary shear
stress over the whole bed region, including over the layer of riprap. For each set of geometrical
and flow conditions, the 3-D RANS simulation results are then used to predict the maximum
shear stress over the riprap region. This bed shear stress is then compared with the critical value
for riprap failure given a certain mean size of the riprap stone following the approach of Melville
and Coleman (2000) and Melville et al. (2007) to determine if riprap failure will occur or not. In
particular, this methodology can be used to test the performance of the leading design formulas
recommended by HEC 23 for erosion protection of bridge abutments using riprap stone.
The proposed approach is very general and can be applied for more complex planform
geometries (e.g., curved channels) and for bridge sites with geometrical complexities (e.g., spur
dikes present at the channel bank, etc.). Especially for such cases, laboratory experiments are
very expensive and the range of geometrical (e.g., channel aspect ratio, width of the floodplain)
and flow parameters in these experiments is even more limited compared to the simpler case of
an abutment placed in a straight channel. The numerical-based approach adopted in the present
study does not face these limitations. Moreover, this approach can also be applied for cases when
pressure scour effects are significant, something that is impossible to be achieved using 1-D and
2-D numerical models.

6
Chapter 2 Numerical Method
STAR-CCM+ is a state-of-the-art commercial code developed by CD-Adapco which
solves the fully 3-D non-hydrostatic Navier-Stokes equations using the finite volume method on
structured/unstructured meshes. The mean effect of turbulence on the momentum is accounted
for by including an additional viscosity term called eddy viscosity.
0=∂∂
i
i
xU (2.1)
( ) kgx
UxU
xxP
xUU
tU
i
k
k
it
kik
kii ˆ11)(−
∂∂
+∂∂
+∂∂
+∂∂
−=∂
∂+
∂∂
µµρρ
(2.2)
where iU = Reynolds Averaged velocity component along the i direction based on the original
velocity component
iu , ρ = density of the fluid
µ = molecular dynamic viscosity
tµ = eddy viscosity calculated from the RANS turbulence model
P = pressure
g = gravity
k̂ = unit normal vector along the vertical direction
The RANS equations are solved based on a finite volume representation. The advective
terms are discretised using a second-order accurate in a space upwinding scheme, while the
transient term was second-order accurate based on an implicit representation. The diffusive term
and the pressure gradient term are discretised using a second-order central difference scheme.

7
The pressure-coupling algorithm chosen was the SIMPLE algorithm. In the SIMPLE algorithm,
the RANS equations are solved and an intermediate velocity is obtained which does not satisfy
the continuity, or mass conservation equation. A pressure-correction algorithm is employed to
modify the pressure field, in turn modifying the mass fluxes and velocity fields in order to satisfy
mass conservation.
The realizable two-layer k-ε turbulence model and the k-ω SST models were chosen to
perform the RANS simulations. The SST model performed more accurately for channel flow
simulations with a large value of the relative bed roughness, leading to its use in the simulations
of flow-past abutments. STAR CCM+ with the SST turbulence model was widely used and
validated for predictions of flow in channels containing hydraulic structures (Cheng et al., 2018),
including for cases when an unsteady flood wave advanced in a channel with natural bathymetry
(Cheng et al., 2018 and Horna-Munoz and Constantinescu, 2016, 2017).
No-slip boundary conditions were specified at all wall boundaries, whereas the outlet was
specified as a pressure outlet boundary. The bed shear was calculated using the law of the wall
for rough or smooth surfaces. The surface roughness ks is different in the riprap region and over
the rest of the channel bed containing a layer of sand. The abutment walls were treated as smooth
surfaces. The free surface was treated as a slip boundary with zero vertical velocity. Preliminary
straight channel flow, steady RANS simulations with periodic boundary conditions in the
streamwise direction were performed to obtain a fully developed channel flow solution. The
cross section of the periodic channel was identical to the inlet section of the computational
domain containing the abutment (a floodplain was placed in the vicinity of the main channel).
This fully developed 2-D velocity field and the turbulence variables were specified at the inlet of
the domain containing the abutment.

8
STAR-CCM+ contains a very powerful meshing capability in which an initial geometry
can be imported, smoothed in such a way to improve computational efficiency, and to obtain
better results without loss of information. Once the geometry has been processed, a volume mesh
is created with the desired meshing model to obtain a high quality mesh. Some meshing models
include tetrahedral, hexahedral, and polyhedral models with mesh refinement near boundaries.
Additional refinement can be included near boundaries by producing high-aspect ratio, highly
skewed cells named prism layers. One of the main advantages of this software is that it allows
automatic grid refinement in critical regions (e.g., boundary layers) around hydraulic structures
(e.g., abutments). Thus, high quality meshes are easy to generate in very complex domains and
the amount of time needed to generate such meshes is relatively small.

9
Chapter 3 Wing-Wall Abutments
3.1 Description of Test Cases and RANS Solutions
Wing-wall abutments simulations were performed with different values of the riprap
mean stone diameter and for two different flow depths corresponding to normal flow and flood
conditions (flow over the floodplain) and four different values of the riprap diameter D50riprap (20
mm, 28 mm, 40 mm, and 60 mm). The main geometrical dimensions (Bf=floodplain width,
La=abutment length, ym=flow depth over main channel, yf=flow depth over floodplain, R2, R3
and R4) and mean sediment size diameter inside the channel and the riprap layer are summarized
in table 3.1 for the eight test cases.
Table 3.1. Matrix of test cases considered for the wing-wall abutment
Also indicated in Table 3.1 is the non-dimensional value of the critical bed shear stress
for shear failure for the riprap.
Ym (m)
Yf (m)
Bf (m)
R1 (m)
R2 (m)
R3 (m)
R4 (m)
D50-sand (mm)
D50-riprap (mm)
Ushear-failture *
Case I a 0.10 0.00 0.00 0.25 0.60 0.50 0.20 0.82 40 0.175CaseII a 0.17 0.07 0.40 0.25 0.60 0.50 0.20 0.82 20 0.120
b 0.17 0.07 0.40 0.25 0.60 0.50 0.20 0.82 28 0.145c 0.17 0.07 0.40 0.25 0.60 0.50 0.20 0.82 40 0.175d 0.17 0.07 0.40 0.25 0.60 0.50 0.20 0.82 61 0.210
Case III a 0.17 0.07 1.40 0.25 0.60 0.50 0.20 0.82 20 0.120b 0.17 0.07 1.40 0.25 0.60 0.50 0.20 0.82 40 0.175c 0.17 0.07 1.40 0.25 0.60 0.50 0.20 0.82 61 0.210
Ushear-failture =Utau_critical*0.35/Uref Uref=0.4
10
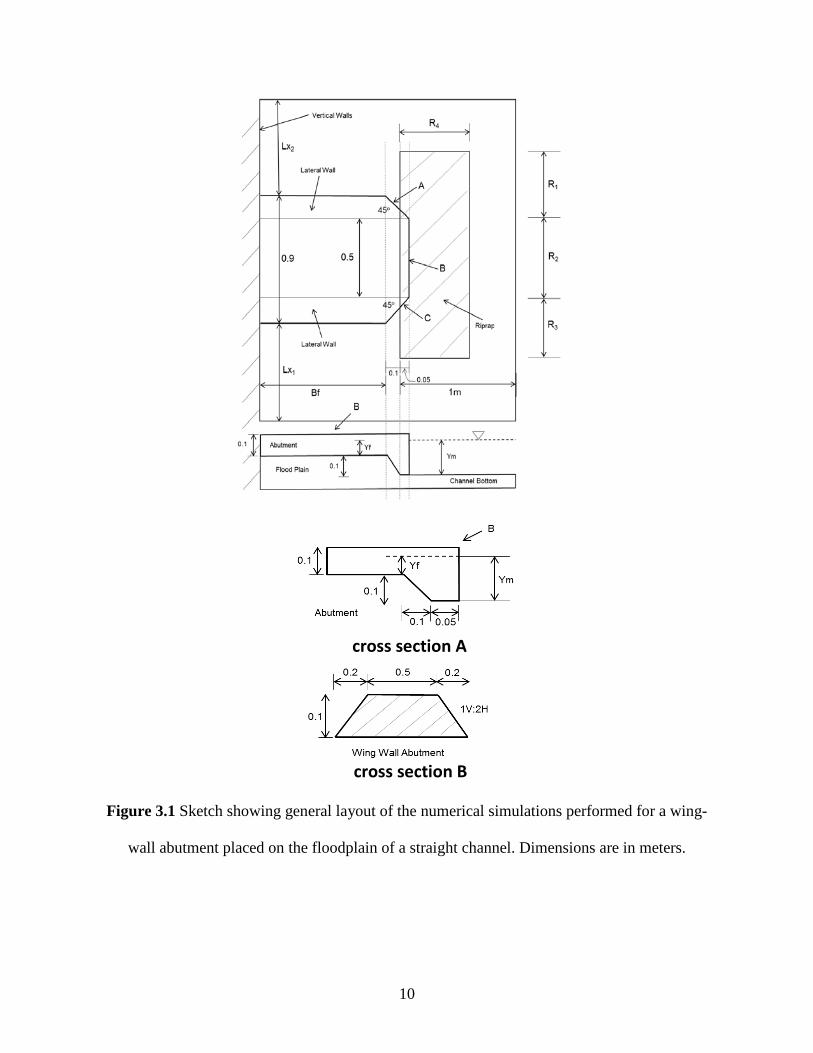
Figure 3.1 Sketch showing general layout of the numerical simulations performed for a wing-
wall abutment placed on the floodplain of a straight channel. Dimensions are in meters.
cross section A
cross section B

11
Figure 3.1 shows a sketch of the general layout of the computational domain, the main
geometrical variable, and the overall shape of the wing-wall abutment. The bottom frames show
two cross sections cutting through the abutment. The wing-wall abutment geometrical set up
corresponds to that used in the laboratory experiments of Melville et al. (2007).
Figure 3.2 provides more information on the computational domain used in the
simulations conducted with different values of the floodplain width, Bf=0.0 m (Case I), Bf=0.4 m
(Case II) and Bf=1.4 m (Case III). Outside of the riprap layer region, the flat channel bed was
covered with sand with a mean diameter D50=0.82 mm. The velocity scale was Uref=0.4 m/s,
while the length scale was Lref=0.1 m for all simulations.
CASE I

12
CASE II

13
CASE III
Figure 3.2 Computational domain used in Case I, Case II, and Case III simulations of
flow past a wing-wall abutment. Shown are the main lengths (m) in the channel cross
section.
These test cases correspond to the main test cases considered in the experimental
laboratory study of Melville et al. (2007). The numerical simulations were used to determine the
distribution of the depth-averaged velocity and of the bed shear stresses around the abutment and
the locations where the maximum bed shear stress, root-mean-square of the bed shear stress,
mean horizontal velocity, and turbulent kinetic energy (TKE) occur.

14
Figure 3.3 shows a view of the computational mesh.
Figure 3.3 Grid used to mesh the channel containing a wing-wall abutment for Case II
simulations.
For most simulations, the total number of computational cells was close to two
million. The mesh was refined close to all solid boundaries, including the abutment
surfaces, to insure all the boundary layers were sufficiently well resolved. This is
essential to accurately predict the mean flow and bed friction velocity distributions. The
mesh around the abutment was unstructured. It was connected to a structured mesh
upstream and downstream of the abutment and also in the main channel, away from the
toe of the abutment. To save computational resources, only half of the channel was
simulated. The experiments were also performed in a similar geometrical set up. For
each test case, simulations were conducted for flow conditions (mean velocity in the
incoming channel or, equivalently, the Froude number in the section cutting through the
15
center of the abutment) corresponding to no shear failure and to shear failure of the
riprap protection based on the experiments of Melville et al. (2007). For each test case
two simulations were run with Froude numbers corresponding to no entrainment and
entrainment of riprap, respectively.
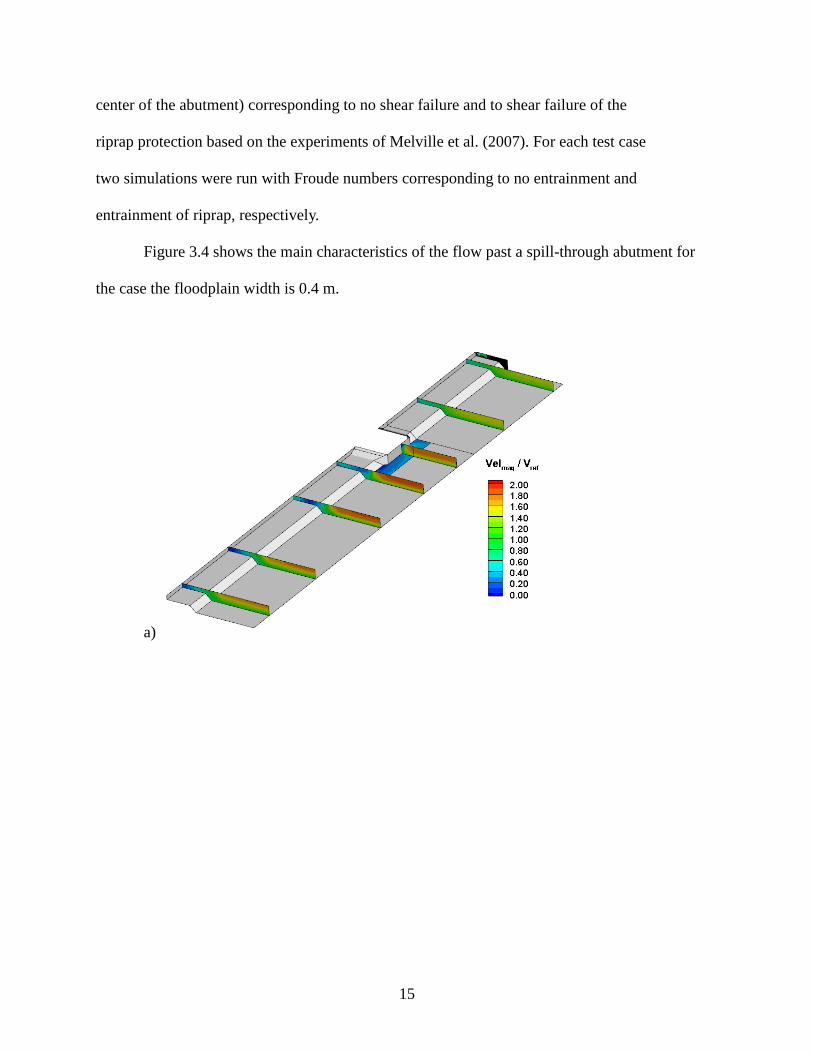
Figure 3.4 shows the main characteristics of the flow past a spill-through abutment for
the case the floodplain width is 0.4 m.
a)
16
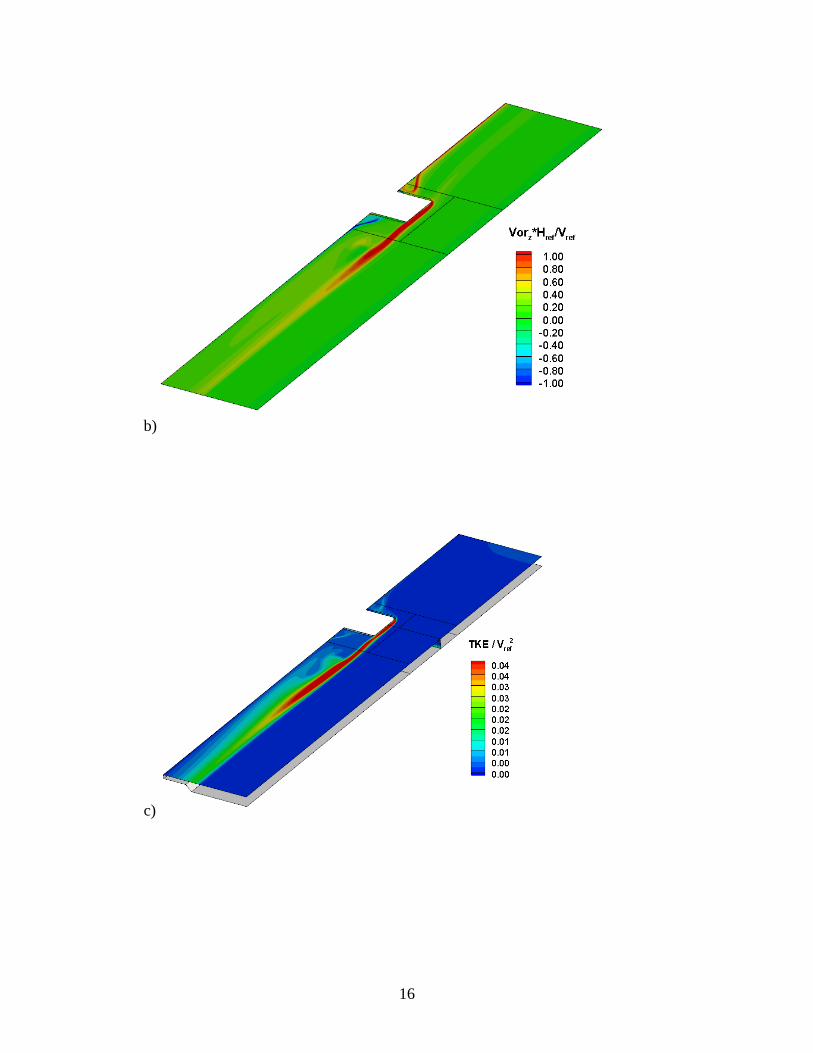
b)
c)

17
d)
Figure 3.4 Visualization of the solution for Case IIc simulation with Fr=0.65. a)
nondimensional streamwise velocity in relevant cross sections; b) nondimensional vertical
vorticity at the free surface; c) nondimensional TKE; d) nondimensional bed friction velocity.
As expected, the flow velocity is amplified in the cross sections cutting through the
abutment and a large recirculation region forms close to the free surface, downstream of the
abutment. The velocities over the floodplain are relatively small at all cross sections. As opposed
to abutments placed in channels with no floodplain, the main separated shear layer (SSL)
forming at the upstream edge of the toe of the abutment remains parallel and close to the toe of
the abutment and the interface between the main channel and the floodplain (fig. 3.4b). Other
regions of high vorticity correspond to the outer sides of the two recirculation regions forming
upstream and downstream of the abutment, as the incoming flow passes the abutment. The main
SSL is also a region of high turbulence production, as observed from the TKE distributions in
figure 3.4c. Relatively large TKE values are also predicted in the downstream recirculation

18
region forming over the floodplain. The largest bed friction velocities are observed over the
riprap layer. This is expected due to the much higher value of the bed roughness in this region
and the fact that the riprap layer is placed inside the main channel where the flow velocities are
larger. The bed friction velocity increases with the bed roughness. Relatively low values of the
bed roughness are predicted over the floodplain even outside the two recirculation regions,
mainly because the velocity magnitude is smaller in regions of reduced flow depth (fig. 3.4d).
Case Ia
Case IIb

19
Case IIIb
Figure 3.5 Nondimensional bed friction velocity distribution over the riprap layer predicted by
the numerical simulations for some of the wing-wall abutment test cases.
Figure 3.5 shows sample predicted distributions of the non-dimensional bed friction
velocity over the riprap layer for wing-wall abutments. The relative position of the maximum
value of the bed friction velocity is a function of the floodplain width. While in some cases the
maximum value is close to the upstream edge of the abutment toe, in cases with a large
floodplain width the maximum bed friction velocity value over the riprap region is predicted
close to the symmetry plane of the abutment.
The inlet discharge was varied until the maximum value of the bed friction velocity in this
region was slightly lower and slightly larger than 0.35 u*cr, where u*cr is obtained from the Shields
diagram for a given mean diameter of the riprap, D50riprap. Following, Melville and Coleman (2000),
this value was used to determine the riprap shear failure entrainment threshold. The Froude
number, Fr, was calculated using the mean velocity in the section containing the abutment and the
flow depth in the main channel for cases with La=Bf (e.g., wing-wall abutments).

20
3.2 Validation
Simulations were conducted with flow solely inside the main channel (ym=0.1 m) and
with flow over the floodplain (ym=0.17 m, yf=0.07 m) for Bf=0.4 m and 1.4 m and for 20
mm<D50riprap<61 mm. Five test cases for the wing-wall abutment corresponded to those in the
experiments of Melville et al. (2007).
Figure 3.6 Comparison of numerical results with Lagasse et al. (2001) and Pagan-Ortiz (1991)
equations and the experimental data of Melville et al. (2007) for wing-wall abutments.
Simulation data show predicted conditions for threshold of riprap entrainment by shear failure.
Experimental data show if failure occurred (open symbols) or not (solid symbols) in the
corresponding experiments.

21
Figure 3.6 shows that for each of the five series of experiments, the numerically predicted
shear failure entrainment threshold is situated in between the limiting experiments where no
shear failure and shear failure were observed. This result is of great importance as it directly
validates the proposed numerical approach to determine the entrainment threshold. Also shown
are the predictions given by the design formulas of Pagan-Ortiz (1991) and Lagasse et al. (2001)
that will be discussed more in depth in the next subchapter.
3.3 Comparison with Predictions of Design Formulas
Figure 3.7 shows additional numerical results for wide wing-wall abutments with Bf=1.4
m. Also represented are the design formula predictions of Pagan-Ortiz (1991)
D50/y=(1.064/(Ss-1))0.81 *Fr1.62 (3.1)
and the design formula predictions of Lagasse et al. (2001)
D50/y=(Ks/(Ss-1))*Frα w (3.2)
where Ks = shape factor
for Fr<0.8, Ks=1.02 and α=2
for Fr>0.8, Ks=0.69 and α=0.28
Ss = specific gravity of riprap = 2.65
y = ym for wing-wall abutments

22
Figure 3.7 Comparison of numerical results with Lagasse et al. (2001) and Pagan-Ortiz (1991)
equations and the experimental data of Melville et al. (2007) for wing-wall abutments. Plotted is
a modified version of Lagasse et al. (2001) formula (Ks=1.65) that results in conservative
predictions of minimum riprap size for analyzed cases with wide floodplains.
The Lagasse et al. (2001) formula does a great job for the high-flow cases with narrow
floodplains (Bf=0.4 m), while Pagan-Ortiz (1991) accurately predicts the entrainment threshold
for cases where the floodplain is not flooded. Neither formula is conservative enough for high-
flow cases with wide floodplains (Bf=1.4 m). For such cases, using Lagasse et al. (2001) formula
with a larger value of Ks=1.65 (Fr<0.8) results in agreement with the numerical experiments.
These results show that the original Lagasse et al. (2001) formula is conservative enough only
for high-flow cases with relatively narrow floodplains.

23
Chapter 4 Spill-Through Abutments
4.1 Description of Test Cases and RANS Solutions
Based on the experiments conducted by Melville et al. (2006) for spill-through
abutments, eight test cases with ym=0.17 m, yf=0.07 m, Bf=1.0 m and 1.4 m, and 0.3<La/Bf<1
were conducted with D50riprap=40 mm and D50=0.89 mm. Four simulations with Bf=1.4 m were
conducted with D50riprap=20 mm. For all cases, the width of the riprap layer was W=0.35 m (fig.
4.1).
Figure 4.1 Sketch showing general layout of the numerical simulations performed for a spill-
through abutment placed on the floodplain of a straight channel. Dimensions are in meters.

24
Table 4.1 summarizes the main geometrical parameters of these test cases.
Table 4.1. Matrix of test cases considered for the spill-through abutment
Figure 4.2 shows the whole computational domain for the case with Bf=1.4 m (Case III
simulations) together with a cross-section. Also included are additional test cases relevant for
understanding how the different flow and geometrical parameters affect the minimum required
size of the riprap stone needed to avoid shear failure at spill-through abutments.
Ym (m) Yf (m) Bf (m) La (m) R5(m) WD50-sand
(mm)D50-riprap
(mm)Ushear-failture *
Case I a1 0.17 0.07 0.50 0.50 0.35 0.35 0.82 20 0.120a2 0.17 0.07 0.50 0.50 0.35 0.35 0.82 40 0.175
CaseII a1 0.17 0.07 1.00 0.50 0.35 0.35 0.82 20 0.120a2 0.17 0.07 1.00 0.50 0.35 0.35 0.82 40 0.175b1 0.17 0.07 1.00 0.70 0.35 0.35 0.82 20 0.120b2 0.17 0.07 1.00 0.70 0.35 0.35 0.82 40 0.175c1 0.17 0.07 1.00 1.00 0.35 0.35 0.82 20 0.120c2 0.17 0.07 1.00 1.00 0.35 0.35 0.82 40 0.175
Case III a1 0.17 0.07 1.40 0.49 0.35 0.35 0.82 20 0.120a2 0.17 0.07 1.40 0.49 0.35 0.35 0.82 40 0.175
b1 0.17 0.07 1.40 0.70 0.35 0.35 0.82 20 0.120b2 0.17 0.07 1.40 0.70 0.35 0.35 0.82 40 0.175c1 0.17 0.07 1.40 0.98 0.35 0.35 0.82 20 0.120c2 0.17 0.07 1.40 0.98 0.35 0.35 0.82 40 0.175d1 0.17 0.07 1.40 1.40 0.35 0.35 0.82 20 0.120d2 0.17 0.07 1.40 1.40 0.35 0.35 0.82 40 0.175

25
Figure 4.2 Computational domain used in the Case III simulations of flow past a spill-
through abutment. Shown are the main lengths (m) in the channel cross section.
The average mesh contained 2-3 million grid points, with the larger number
corresponding to cases with a larger-width floodplain. Figure 4.3 visualizes the grid in relevant
planes around the spill-through abutment. The gridding procedure was similar to that used for
wing-wall abutments. The level of resolution of the boundary layers in the wall normal direction
was also similar to that used for the wing-wall abutment cases. The velocity and length scales
were also the same.
26
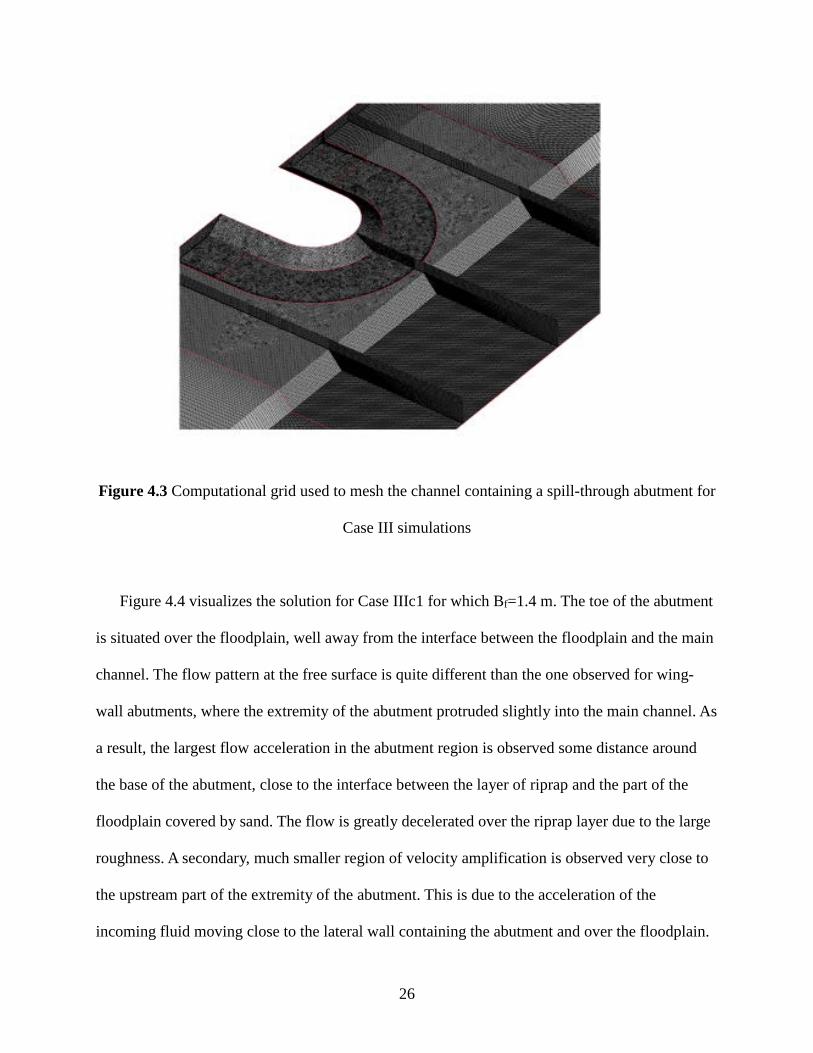
Figure 4.3 Computational grid used to mesh the channel containing a spill-through abutment for
Case III simulations
Figure 4.4 visualizes the solution for Case IIIc1 for which Bf=1.4 m. The toe of the abutment
is situated over the floodplain, well away from the interface between the floodplain and the main
channel. The flow pattern at the free surface is quite different than the one observed for wing-
wall abutments, where the extremity of the abutment protruded slightly into the main channel. As
a result, the largest flow acceleration in the abutment region is observed some distance around
the base of the abutment, close to the interface between the layer of riprap and the part of the
floodplain covered by sand. The flow is greatly decelerated over the riprap layer due to the large
roughness. A secondary, much smaller region of velocity amplification is observed very close to
the upstream part of the extremity of the abutment. This is due to the acceleration of the
incoming fluid moving close to the lateral wall containing the abutment and over the floodplain.
27
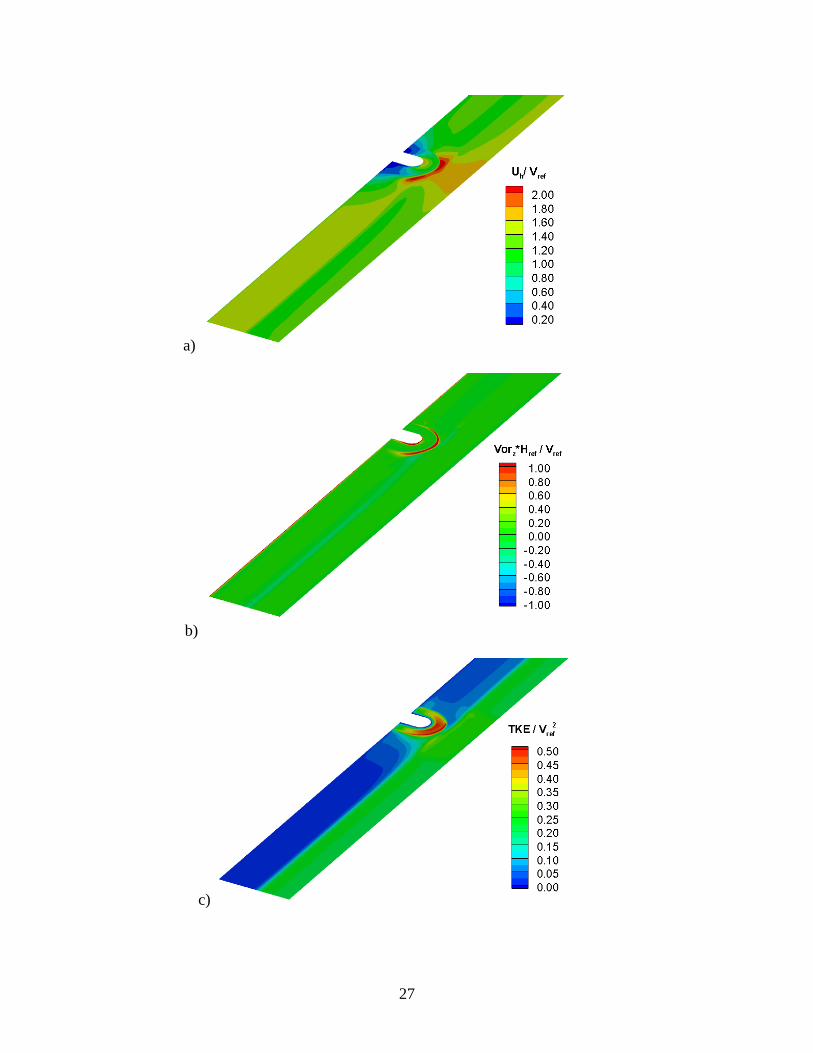
a)
b)
c)

28
d)
Figure 4.4 Visualization of the solution for Case IIIc1 simulation with Fr=1.0. a) non-
dimensional streamwise velocity at the free surface; b) non-dimensional vertical vorticity at the
free surface; c) non-dimensional TKE; d) non-dimensional bed friction velocity.
At streamwise locations close to the abutment position, the velocity amplification
occurring inside the main channel is important. The region of relatively high velocity
amplification in the main channel extends until the left boundary of the computational domain.
This means that lots of the fluid advected over the floodplain moves over the main channel as it
passes the abutment. The velocity amplification over the sloped abutment boundary is relatively
small.
The vertical vorticity contours at the free surface in figure 4.4b reveal the presence of two
vorticity sheets close to the free surface. One is related to the separated shear layer originating
close to the symmetry plane at the edge of the abutment, as the flow over the floodplain passes
the extremity of the abutment. This separated shear layer remains in the vicinity of the
downstream side of the abutment. However, the main vorticity sheet follows the outer edge of
the region containing the riprap. It forms due to the large velocity difference between the faster

29
fluid moving over the sand region and the slower fluid moving over the riprap region. Consistent
with this, the TKE distributions in figure 4.4c show that the largest amplification of the TKE
occurs over the riprap region, in between the edge of the abutment and the edge of the riprap
layer. The TKE values decay near the lateral wall containing the abutment. This is expected
because the velocity magnitude is very small inside the recirculation regions. It is well known
that the TKE levels are much larger in a turbulent boundary layer developing over a rough
boundary compared to a smooth boundary.
The bed friction velocity distributions in figures 4.4d and 4.5 show the level
amplification of the bed shear stress over the riprap region is comparable at locations situated
close to the rounded edge of the abutment. This pattern is different from that observed for a
wing-wall abutment. One should note that the bed friction velocity is much lower beneath the
region of high velocity amplification situated away from the edge of the riprap region, both over
the floodplain and over the main channel. This is mainly due to the much smaller values of the
sand roughness covering these surfaces.

30
Figure 4.5 Nondimensional bed friction velocity distribution over the riprap layer predicted by
the numerical simulation for the Case IIIc1 simulation with Fr= of spill-through abutment test
cases.
4.2 Comparison with Predictions of Design Formulas
For spill-through abutments, the Froude number, Fr, was calculated using the mean
velocity in the section containing the abutment, the flow depth in the main channel for cases with
La=Bf and the flow depth over the floodplain for abutments with La<Bf and (Bf-La)/ym>5 (HEC
23 recommendations).
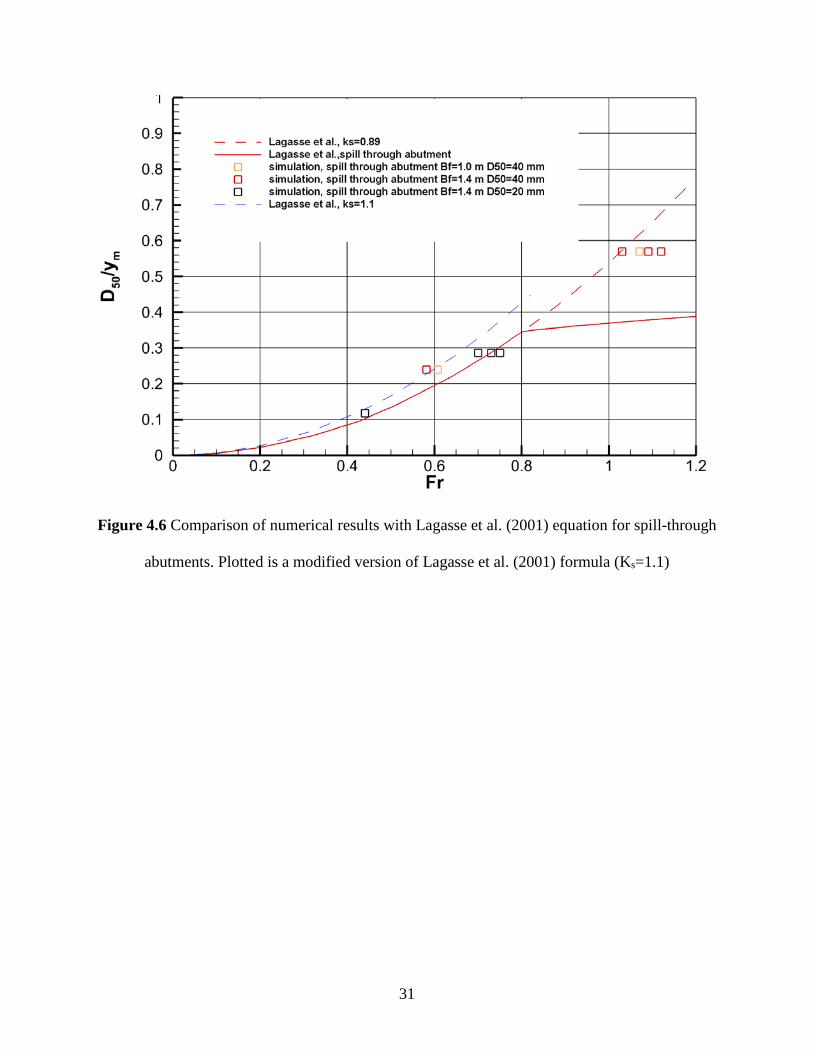
For the Fr<0.8 cases, Lagasse et al. (2001) standard formula (Ks=0.89, α=2.0) is fairly
close to the numerical predictions but still not conservative enough for four of the test cases.
Results in figure 4.6 show that using the equation recommended for Fr<0.8 until Fr~1 will result
in a conservative design formula. The modified version of Lagasse et al. (2001) plotted in the
previous figure results in conservative predictions of minimum riprap size. More data is needed
to propose a modified design formula that will provide accurate estimations for Fr>0.8.
31
Figure 4.6 Comparison of numerical results with Lagasse et al. (2001) equation for spill-through
abutments. Plotted is a modified version of Lagasse et al. (2001) formula (Ks=1.1)

32
Chapter 5 Conclusions, Recommendations, and Proposed Future Work
Reliable and safe transportation infrastructure design for flooding events is of great
economic importance for state and federal agencies in charge of maintaining roads operational.
Bridges are essential infrastructures that need to be protected against severe local scour around
their piers and abutments during floods. More reliable design formulas for protection of bridge
abutments against erosion will result in significant reduction of costs to operate roads during and
after flood events. It will also reduce the risk for hazards associated with bridge failure during
floods by avoiding structural failure.
As part of the present research, a general methodology based on 3-D RANS numerical
simulations was developed to determine the conditions for riprap failure for cases when a riprap
layer is placed close to an abutment or other hydraulic structure where local scour is a concern.
The relationship proposed by Melville and Coleman (2000) and Melville et al. (2007) for riprap
entrainment threshold (shear failure mode) was used to determine if riprap entrainment occurs.
Such an approach is much less expensive and constraining compared to the classical one based
on laboratory investigations conducted in a flume.
Fully 3-D RANS numerical simulations were conducted for a series of test cases. A
wing-wall or spill-through abutment was placed in a straight channel containing a floodplain to
obtain comprehensive information on how the conditions corresponding to the occurrence of
riprap shear failure develop at such abutments as a function of the relative riprap mean diameter,
main geometrical dimensions of the abutment and the channel, and the Froude number. Wing-
wall abutments simulations were performed with different values of the riprap mean diameter
and for two different flow depths corresponding to normal flow and flood conditions (flow over
the floodplain). These test cases cover the main ones considered in the experimental laboratory
33
study of Melville et al. (2007). The numerical simulations were used to determine the
distribution of the bed shear stress, vorticity, and TKE. Moreover, this database allowed
validating the numerical approach based on comparison with experiments conducted for wing-
wall abutments and further investigating the validity and predictive capabilities of the main
design formula (Lagasse et al., 2001) in HEC 23 for this type of abutments. The database
consisting of the 3-D RANS simulations was stored and is available for future use. These results
are also needed as a base case against which one can investigate more complex cases, not
covered by existing design recommendations (e.g., severe-flooding cases in which pressure scour
effects are present, cases in which other flow training devices used to protect against bank
erosion are present close to the abutment).
In the case of wing-wall abutments, the main recommendation is to modify the standard
Lagasse et al. (2001) formula and use Ks=1.65 or, even better, to specify Ks as a function of the
relative width of the floodplain (Bf/ym) in HEC 23. This will allow the modified formula to fit
most of the newly generated data. Based on the data set obtained for spill-through abutments, the
recommended modification of the Lagasse et al. (2001) formula is to use Ks=1.1. This will
ensure the design formula is conservative enough for all cases with Fr<0.8. Lagasse et al. (2001)
standard formula (Ks=0.61, α=0.28) fails for the test cases with Fr>0.8. Another main result for
spill-through abutments is the critical Froude number corresponding to the entrainment threshold
decreases monotonically with increasing La/Bf or La/yf (see series of test cases with constant
D50riprap/ym in fig. 4.6). This effect is ignored in present design formulas while being quite
significant. Additional simulations are needed to quantify this effect and propose modifications
in the design formula to account for it.

34
We also recommend performing a parametric study for D50riprap=20 mm for spill through
abutments, similar to that completed for D50riprap=40 mm (Bf=0.5 m, 1.0 m, ym=1.7 m, yf=0.7 m
with 0.3<La/Bf<1), for cases where the toe of the spill-through abutment is situated far from the
boundary of the main channel. These cases are listed in table 4.1. An additional series of
simulations with Bf=2.0 m, ym=1.7 m and 0.4 m<La<1.4 m can be used to check if the use of the
Set Back Ratio method (see NCRHRP 24-23 and 24-18) recommended by HEC 23 results in
accurate predictions of the riprap shear-failure entrainment threshold. The focus will be on cases
where the velocity in the design formula is estimated as the ratio between the discharge over the
floodplain and the floodplain part of the cross-sectional area in the abutment section.
Research would further improve from the investigation of the effect of bank curvature on
erosion potential at wing-wall and spill-through abutments. The aim is to quantitatively
understand how channel curvature amplifies the maximum bed shear stress over the riprap layer
and then to propose a procedure based on the design formula of Lagasse et al. (2001) that will
allow estimating the required size of the riprap stone needed to protect an abutment situated at
the outer bank of a curved channel. The main idea is to modify the definition of the velocity in
the contracted region and the shape factor in the original design formula of Lagasse et al. (2011)
to obtain a conservative formula for such cases which are not covered by any design formula
available in literature. These modifications would improve abutments placed in regions where
bank curvature effects are significant.
We will work with the Transportation Research Board (TRB) committees related to
bridges (e.g., TRB-AFB60) such that the main findings and the improved formulas will be
considered for adoption in future releases of HEC 23. Once adopted by state and federal agencies
in charge of maintaining operational bridges, the present research will increase the efficiency of
35
scour protection measures at two main types of abutments used especially for small bridges in
the United States.
The proposed procedure described in the present report to estimate shear failure of riprap
can be extended to other types of abutments and bridge piers of complex shape, or to cases when
erosion at the abutment is due to more than one factor. Such cases are not covered by existing
design formulas, which are mostly based on experiments conducted in straight channels. Given
detailed information on the flow fields, turbulence and their effects on the bed shear stress
distributions are available from these simulations, the present approach can lead to incorporating
more physics into existing design formulas and proposing new design formulas for protection
against local scour at hydraulic structures.

36
References Cardoso, A., Simarro, G. and Schleiss, A. 2010. “Sizing of riprap for spill-through abutments,”
Water Management, 163, issue WM10, 499-507, Paper 900024. Cheng, Z., Koken, M. and Constantinescu, G. 2018. “Approximate methodology to account for
effects of coherent structures on sediment entrainment in RANS simulations with a movable bed and applications to pier scour” Advances in Water Resources, in press
Ettema, R, Constantinescu, G and Melville, B. 2011. “NCHRP 24-27(01): Evaluation of bridge pier scour research: scour processes and estimation” Final report for NCHRP.
HEC-23 Bridge scour and Stream Instability Countermeasures [Lagasse, P, Zevenberger,L., Schall, J and Chopper, P (2001), ‘Bridge scour and stream instability countermeasures,’ Rep. No. FHWA-NH1-01-003, Hydraulic Engineering Circular No. 23, 2nd Ed. Office of Bridge Technology, Federal Highway Administration, Washington DC]
HEC-23 Bridge scour and Stream Instability Countermeasures: Experience. Selection and Design Guidance, 2009, 3rd Edition
Horna Munoz, D. and Constantinescu, G. 2016. “A numerical study of the efficiency of flood protection structures,” International conference on fluvial hydraulics, River Flow 2016, Saint Louis, USA.
Horna-Munoz, D. and Constantinescu, G. 2017. “Three dimensional numerical modeling of dam break flows,” 4th International Symposium of Shallow Flows, Eindhoven University of Technology, The Netherlands, June 2017
Hoffmans, G. J. C. M. and Verheij, H. J. 1997. “Scour manual.” A.A. Balkema, Rotterdam, Netherlands.
Melville, B. W. and Coleman, S. E. 2000. ”Bridge scour.” Water Resources Publications, Littleton, Colorado.
Melville, B., van Ballegooy, S., Coleman, S. and Barkdoll, B. 2006a. “Countermeasures to protection at spill-through abutments,” J. Hydr. Engrg., 132:235-245.
Melville, B., van Ballegooy, S., Coleman, S. and Barkdoll, B. 2006b. “Scour countermeasures for wing wall abutments,” J. Hydr. Engrg., 132:563-574.
Melville, B., van Ballegooy, S., Coleman, S. and Barkdoll, B. 2007. “Riprap selection at wing wall abutments,” J. Hydr. Engrg., 133:1265-1269.
NCHRP Project 24-18 (NCHRP Report 587), “Countermeasures to Protect Bridge Abutments from Scour”
NCHRP Project 24-19, “Selection Criteria and Design Guidelines, and techniques for the Size and Placement of Environmentally Sensitive Channel and Bank Protection Measures, and Quality Control”
NCHRP Project 24-20, “Prediction of Scour at Bridge Abutments” NCHRP Project 24-23, “Riprap Design Criteria, Specifications,” Pagaz-Ortiz, J. 1991. “Stability of rock riprap for protection at the toe of abutments located at the
flood plain,” Rep. No. FHWA-Rd-91-057, Federal Highway Administration, US Dept. of Transportation, Washington, DC.

37
Sumer, B. M. and Fredsoe J. 2002. “The mechanics of scour in the marine environment.” World Scientific.