Embed Size (px)
Citation preview

Cyclin E1 as a therapeutic target in high grade serous ovarian cancer
George Au-Yeung, MBBS (Hons), FRACP
Submitted in total fulfilment of the requirements of the degree of Doctor of Philosophy
February 2017
Peter MacCallum Cancer Centre and The Sir Peter MacCallum Department of Oncology
The University of Melbourne

Abstract
The central theme of this thesis is developing therapeutic strategies to selectively target CCNE1
amplified high grade serous ovarian cancer (HGSC). Patients with CCNE1 amplified HGSC represent
a key unmet clinical need given that they are associated with primary treatment resistance and poor
clinical outcome. Novel therapeutic strategies are urgently required in order to provide these patients
with additional treatment options.
Using short interfering RNA and short hairpin RNA, I demonstrated selective sensitivity of CCNE1
amplified HGSC to CDK2 gene suppression. However, I did not demonstrate similar amplicon
dependent sensitivity to dinaciclib, a potent small molecule inhibitor of multiple CDKs. In order to
identify drug combinations that would synergise with dinaciclib, I performed a high throughput
compound screen in CCNE1 amplified HGSC cell lines. I identified a combination of dinaciclib and
MK-2206, an AKT inhibitor, that was selectively synergistic in in vitro and in vivo models of CCNE1
amplified HGSC. CCNE1 and AKT2 were noted to be co-amplified in primary HGSC samples, and a
number of genes in the AKT pathway were found to be required in CCNE1 amplified HGSC cell
lines. Furthermore, over-expression of cyclin E1 and AKT isoforms resulted in uncontrolled growth
characteristics in TP53-mutant fallopian tube secretory cells, the proposed cell of origin for HGSC.
Taken together, these findings suggest that co-operative interaction between CCNE1 and the AKT
pathway in HGSC may be exploited therapeutically.
I also explored the potential mechanisms of resistance to CDK inhibitors by generating cell lines
resistant to dinaciclib. Dinaciclib in combination with multiple BH3-mimetic compounds was noted to
be synergistic in CDK-inhibitor resistant cell lines. Upregulation of multiple anti-apoptotic genes was
observed in resistant cell lines compared to parental sensitive cell lines, suggesting that this is a
potential mechanism of resistance to CDK inhibitors.
Targeting homologous recombination (HR) may also be a therapeutic option in CCNE1 amplified
HGSC. Proteasome inhibitors such as bortezomib have been shown to be indirect inhibitors of HR,
and I showed that CCNE1 amplified cell lines were highly sensitive to bortezomib and MLN9708, a
second generation proteasome inhibitor. Potential synergistic combinations with bortezomib were
identified in a high throughput compound screen, including a number of HDAC inhibitors, suggesting
a possible class effect.
i

Declaration
This is to certify that
(i) the thesis comprises only my original work towards the PhD except where
indicated in the Preface,
(ii) due acknowledgement has been made in the text to all other material used,
(iii) the thesis is less than 100,000 words in length, exclusive of tables, maps,
bibliographies and appendices.
George Au-Yeung
ii

Preface The work presented in this thesis resulted from a number of collaborations.
The fallopian tube secretory cell line FT282 was generated by Alison Drapkin and obtained from
Ronny Drapkin (University of Pennsylvania, US). Constructs for AKT isoforms were obtained from
Richard Pearson (Peter MacCallum Cancer Centre) and cloned into the FT282 cell line by Franziska
Lang (Cancer Genetics and Genomics Laboratory, Peter MacCallum Cancer Centre). Functional
experiments with the FT282 cell line were performed by Franziska Lang.
Immunohistochemical staining of pAKT, Ki67 and cleaved caspase-3 was performed by Judy Borg
(Centre for Histology and Microscopy, Peter MacCallum Cancer Centre).
Work in my thesis was funded in part by a Pfizer Cancer Research Grant (WI80176) and by a Peter
MacCallum Cancer Foundation New Investigator Grant (1319).
iii

Acknowledgements I would firstly like to thank my primary supervisor, David Bowtell, for his support, encouragement
and direction throughout my PhD. It has been an absolute privilege and pleasure to be able to start my
research career in his laboratory, and learn from an international leader in cancer research. I am very
grateful to have had the opportunity to contribute to research as part of his laboratory.
I would like to thank my co-supervisor Dariush Etemadmoghadam, for his patience, guidance and
especially for teaching me good research habits. Thanks also to my other co-supervisors Linda
Mileshkin and Danny Rischin for their clinical input and wonderful mentoring throughout my PhD. I
feel very fortunate to have had an excellent group of supervisors and am indebted to all of them for
their individual contributions.
To the rest of the Bowtell laboratory both past and present I feel very grateful to them for making the
lab such a great environment. In particular to Sarah Ftouni and Chris Mitchell who taught me about
pipetting, to Walid Azar for teaching me about cloning, to Franziska Lang for her assistance, to Prue
Cowin for throwing me in the deep end with animal experiments, and to Liz Christie, Anna Chen,
Jaclyn Sceneay and Colin House who all welcomed me into the lab despite my inexperience. To the
AOCS team Kathryn Alsop, Nadia Traficante, Joy Hendley, Leanne Bowes and Sian Fereday, I am
grateful to all of them for their support and help. Thanks also to Linda Stevens for her administrative
assistance and encouragement throughout.
To the other clinician-PhD students at Peter MacCallum Cancer Centre particularly Sharon Pattison,
David Liu, Aparna Rao and Annie Wong, I am very grateful for your friendship and debriefing; it has
made the process so much more enjoyable. I would also like to acknowledge Ben Solomon for his
contribution as a mentor.
To the staff in the core facilities at Peter MacCallum Cancer Centre, including the animal facility,
Victorian Centre for Functional Genomics, FACS and histology facilities, I am very grateful for their
assistance and technical expertise. I would also like to thank Carleen Cullinane and Rick Pearson for
their expert advice and input into various aspects of my PhD. To the collaborators from external
institutions, particularly Kate Jarman and Kurt Lackovic from the Walter and Eliza Hall Institute of
Medical Research, and Ronny Drapkin and Alison Karst from the University of Pennsylvania, I am
very grateful for their contributions.
Finally, I would not have been able to complete my PhD without the support of my family. I have to
thank my lovely wife Jenny Ng, who has supported me unconditionally all of these years, and our
wonderful new baby boy James who we are so grateful for. To my mum Paddy Au-Yeung and brother
iv

Patrick Au-Yeung, thank you so much for all the continued encouragement. To my wife’s family,
Peter and Lee Ng, Michael Ng and Grace Kong and their children Alex and Jason, and Amy Ng, your
support has been much appreciated. To my dad Peter Au-Yeung, who sadly passed away during my
PhD, but who instilled in me the importance of learning and education, I will always be grateful.
v

Publications The following are a list of publications arising as a result of work in this thesis:
George Au-Yeung, Franziska Lang, Walid J Azar, Chris Mitchell, Kate E. Jarman, Kurt Lackovic,
Diar Aziz, Carleen Cullinane, Richard B. Pearson, Linda Mileshkin, Danny Rischin, Alison M. Karst,
Ronny Drapkin, Dariush Etemadmoghadam, and David D.L. Bowtell (accepted, in press). “Selective
targeting of cyclin E1 amplified high grade serous ovarian cancer by cyclin-dependent kinase 2 and
AKT inhibition.” Clinical Cancer Research
Dariush Etemadmoghadam, George Au-Yeung, Meaghan Wall, Chris Mitchell, Maya Kansara,
Elizabeth Loehrer, Crisoula Batzios, Joshy George, Sarah Ftouni, Barbara A. Weir, Scott Carter, Irma
Gresshoff, Linda Mileshkin, Danny Rischin, William C. Hahn, Paul M. Waring, Gad Getz, Carleen
Cullinane, Lynda J. Campbell, and David D. Bowtell (2013). “Resistance to CDK2 inhibitors is
associated with selection of polyploidy cells in CCNE1-amplified ovarian cancer.” Clinical Cancer
Research; 19(21):5960-71. doi: 10.1158/1078-0432.CCR-13-1337.
Dariush Etemadmoghadam, Barbara A. Weir, George Au-Yeung, Kathryn Alsop, Gillian Mitchell,
Joshy George, Australian Ovarian Cancer Study Group, Sally Davis, Alan D. D’Andrea, Kaylene
Simpson, William C. Hahn, and David D.L. Bowtell (2013). “Synthetic lethality between CCNE1
amplification and loss of BRCA1.” Proceedings of the National Academy of Sciences USA;
110(48):19489-94. doi: 10.1073/pnas.1314302110
vi

Contents Abstract …………………………………………………………………………………..…i Declaration …………………………………………………………………………………ii Preface ……………………………………………………………………………………..iii Acknowledgements ………………………………………………………………………..iv Publications ………………………………………………………………………………..vi Abbreviations ……………………………………………………………………………...xi 1. Literature review ……………………………………………………………………... 1 1.1 Context of literature review………………………………………………………...... 1 1.2 Ovarian cancer background ……………………………………………………........ 2 1.2.1 Epidemiology and risk factors …………………………………………………...... 2
1.2.2 Screening …………………………………………………………………….......... 3 1.2.3 Histological classification of EOC………………………………………………..... 4 1.2.4 Classification of EOC – Type I and Type II tumours …………………………....... 4 1.2.5 Aetiology and cell of origin of EOC…………………………................................ 5
1.3 Clinical management of HGSC …………………………........……………………... 7 1.3.1 Clinical presentation….....…………………………....……………………………. 7 1.3.2 Staging………………………….....………………………….....…………………. 7 1.3.3 Management of HGSC following initial diagnosis………………………………… 8
1.3.3.1 Role of surgery in first-line treatment of HGSC…………………………........ 8 1.3.3.2 Role of chemotherapy in first-line treatment of advanced stage HGSC …….. 10 1.3.3.3 Role of chemotherapy in early stage HGSC…………………………………... 10 1.3.3.4 Intra-peritoneal chemotherapy………………………………………………… 11 1.3.3.5 Dose dense chemotherapy……………………………………………………... 11 1.3.3.6 Neoadjuvant chemotherapy……………………………………………………. 12
1.3.4 Management of recurrent HGSC…………………………………………………... 13 1.3.4.1 Defining recurrent HGSC……………………………………………………... 13 1.3.4.2 Role of secondary cytoreductive surgery ……………………………………... 14 1.3.4.3 Chemotherapy in the management of recurrent disease………………………. 14
1.3.5 Molecularly targeted therapy in HGSC……………………………………………. 16 1.3.5.1 Targeting angiogenesis……………………………………………………….. 16 1.3.5.2 Other novel targeted therapies………………………………………………… 17
1.4 Molecular characteristics of HGSC…………………………………………………. 18 1.4.1 Somatic driver mutations………………………………………………………….. 19 1.4.2 TP53 mutations in HGSC………………………………………………………….. 20
1.4.2.1 p53 dysfunction is ubiquitous in HGSC………………………………………. 20 1.4.2.2 Causes and consequences of p53 dysfunction………………………………… 20 1.4.2.3 TP53 mutation is an early event in the pathogenesis of HGSC………………. 21
1.4.3 The role of the homologous recombination pathway in HGSC……………………. 22 1.4.3.1 Role of HR in DNA repair…………………………………………………….. 22 1.4.3.2 Clinical implications of defects in HR pathway………………………………. 23
1.4.4 Structural variants and copy number alterations…………………………………… 27 1.4.5 Gene expression profiles…………………………………………………………… 29 1.4.6 Tumour heterogeneity……………………………………………………………… 29
1.5 CCNE1 amplification…………………………………………………………………. 30 1.5.1 Cyclin E1 function and role in cancer……………………………………………... 30 1.5.2 CCNE1 amplification in HGSC……………………………………………………. 32 1.5.3 Targeting CCNE1 amplification…………………………………………………… 34
vii

1.5.4 CDK inhibitors……………………………………………………………………... 35 1.6 Thesis Aims and Study Design ………………………………………………………. 37 2. Materials and Methods………………………………………………………………… 38 2.1 Materials………………………………………………………………………………. 38
2.1.1 Reagents and Chemicals……………………………………………………………. 38 2.1.2 Primer sequences for quantitative PCR…………………………………………….. 39 2.1.3 Antibodies………………………………………………………………………….. 40
2.2 Molecular and cell biology…………………………………………………………… 40 2.2.1 DNA Extraction…………………………………………………………………….. 40 2.2.2 RNA Extraction…………………………………………………………………….. 41 2.2.3 Primers for Quantitative PCR………………………………………………………. 42 2.2.4 Reverse transcription and quantitative PCR………………………………………... 42 2.2.5 Real-time Quantitative PCR………………………………………………………... 42 2.2.6 Immunohistochemistry……………………………………………………………... 43 2.2.7 Cell culture…………………………………………………………………………. 44
2.2.7.1 Mycoplasma testing……………………………………………………….. 44 2.2.7.2 Cell line authentication……………………………………………………. 45
2.2.8 Drug sensitivity assays…………………………………………………………….. 45 2.2.8.1 CellTitre 96 Aqueous Non-Radioactive Proliferation (MTS) Assay……… 45 2.2.8.2 Clonogenic survival assay…………………………………………………. 46 2.2.9 Gene suppression studies using short-interfering RNA……………………………. 46 2.2.10 Short hairpin mediated CDK2 knockdown……………………………………….. 47 2.2.11 Cyclin E1 and AKT over-expression in Fallopian tube secretory epithelial cells....51 2.2.12 Western blot……………………………………………………………………….. 51 2.2.13 Anchorage independent growth assay.................................................................... 53 2.2.14 Proliferation assay………………………………………………………………… 53 2.2.15 Generating drug resistant cell lines……………………………………………….. 53 2.2.16 Flow Cytometry…………………………………………………………………… 53
2.2.16.1 Cell cycle analysis…………………………………………………………53 2.2.16.2 Annexin V-Propidium iodide apoptosis assay……………………………. 53
2.3 High throughput compound screen methods and analysis………………………… 54 2.3.1 Optimisation of screening conditions………………………………………………. 54 2.3.2 Primary screen strategy…………………………………………………………….. 57 2.3.3 Secondary screen…………………………………………………………………… 57 2.3.4 Matrix screen……………………………………………………………………….. 58 2.4 Xenograft studies……………………………………………………………………... 58 2.4.1 Engraftment of cell lines…………………………………………………………… 58 2.4.2 Implantation of oestrogen pellets…………………………………………………... 59 2.4.3 Drug efficacy studies……………………………………………………………….. 60 3. Targeting CCNE1 amplified high-grade serous ovarian cancer via CDK2 inhibition 3.1 Introduction…………………………………………………………………………… 61 3.2 Selective targeting of cyclin E1 amplified high grade serous ovarian cancer by cyclin-dependent kinase 2 and AKT inhibition…………………………………………. 61 3.3 Closing remarks………………………………………………………………………. 112 3.4 Appendix – Etemadmoghadam D, et al. Resistance to CDK2 inhibitors is associated with selection of polyploidy cells in CCNE1-amplified ovarian cancer. Clinical Cancer Research 2013;19:5960-5971....…………………………………………………………... 113
viii
4. Targeting CCNE1 amplified high-grade serous ovarian cancer via proteasome inhibition 4.1 Introduction…………………………………………………………………………… 125 4.2 Screening of HGSC cell lines against proteasome inhibitors in vitro..................... 125 4.3 Testing of proteasome inhibitors in vivo…………………………………………….. 128
4.3.1 Generating xenograft models of CCNE1 amplified HGSC……………………... 128 4.3.2 Efficacy of proteasome inhibitors in vivo……………………………………….. 130
4.4 Results from a high throughput screen ……………………………………………... 132 4.5 Discussion……………………………………………………………………………... 136
4.5.1 Mechanism of action of proteasome inhibitors…………………………………..137 4.5.2 Polo-like kinase 1 (Plk1) inhibitors as a potential therapeutic strategy…………. 137 4.5.3 Histone deacetylase inhibitors (HDACi)………………………………………... 137 4.5.4 Concluding remarks…………………………………………………………….. 139
4.6 Appendix – Etemadmoghadam D, et al. Synthetic lethality between CCNE1 amplification and BRCA1 loss. Proceedings of the National Academy of Sciences USA 2013;110:19489-94................................................................................................... ……... 140
5. Future directions……………………………………………………………………….. 153 5.1 Summary of key findings…………………………………………………………….. 153 5.2 Unravelling the differences between CDK2 gene suppression and CDK drug inhibition………………………………………………………………………………….. 154
5.2.1 Kinase independent functions of cyclin E1-CDK2 complex…………………….. 154 5.2.2 Challenges of designing specific CDK2 inhibitors………………………………. 155 5.2.3 Potential for developing RNA interfering therapy………………………………..156
5.3 HR and CCNE1 amplification……………………………………………………….. 156 5.3.1 Mechanism of action of proteasome inhibitors in CCNE1 amplified HGSC……. 157 5.3.2 Direct targeting of HR…………………………………………………………… 157
5.4 Understanding the biology of CCNE1 amplified HGSC…………………………… 158 5.4.1 Role of cyclin E1 in malignant transformation of FTSEC………………………. 158 5.4.2 Generating clinically relevant models of CCNE1 amplified HGSC…………….. 158
5.5 CCNE1 amplification as a therapeutic target – is this precision medicine?........... 159 5.6 Closing remarks………………………………………………………………………. 161 Index of Tables Table 1.1 FIGO Staging of ovarian cancer…………………………………………………………. 8 Table 1.2 IC50 values against CDKs for selected CDK inhibitors…………………………………. 36 Table 2.1 Reagents and Chemicals…………………………………………………………………. 38 Table 2.2 Primer sequences for quantitative PCR ………………………………………………….. 39 Table 2.3 Antibodies………………………………………………………………………………... 40 Table 2.4 Antibody dilutions for IHC………………………………………………………………. 44 Table 2.5 Ovarian cancer cell lines…………………………………………………………………. 44 Table 2.6 Seeding density for cell lines…………………………………………………………….. 46 Table 2.7 Workflow for viral transfection/transduction……………………………………………. 50 Table 2.8 Buffers for Western blotting……………………………………………………………... 52 Table 4.1 Combination indexes and interaction between compounds tested in matrix screen……. 135 Index of Figures Figure 1.1 Molecular classification of HGSC………………………………………………………. 19
ix

Figure 1.2 Cyclin E1-CDK2 functions…………………………………………………………….. 32 Figure 1.3 Frequency of CCNE1 amplification in primary tumours………………………………. 33 Figure 2.1 Plate templates for primary screen……………………………………………………… 56 Figure 2.2 Example of plate setup for matrix screen………………………………………………. 58 Figure 4.1 CCNE1 copy number and expression of HGSC cell lines……………………………… 126 Figure 4.2 In vitro sensitivity to bortezomib………………………………………………………. 127 Figure 4.3 In vitro sensitivity to MLN9708………………………………………………………… 127 Figure 4.4 Xenograft growth of CCNE1 amplified HGSC cell lines………………………………. 128 Figure 4.5 Xenograft growth of adapted CCNE1 amplified HGSC cell lines……………………… 129 Figure 4.6 Genomic profile of adapted OVCAR3 cell lines……………………………………….. 129 Figure 4.7 Characterisation of adapted OVCAR3 cell lines………………………………………... 130 Figure 4.8 Activity of proteasome inhibitors in vivo……………………………………………….. 131 Figure 4.9 Results from primary screen…………………………………………………………….. 133 Figure 4.10 Dose response curves from secondary screen …………………………………………. 134 Figure 4.11 Dose response curves from secondary screen …………………………………………. 135 References…………………………………………………………………………………. 162 Appendices………………………………………………………………………………… 185 Appendix A EC50 values for primary screen OVCAR3 vs SKOV3…………………………….. 185 Appendix B EC50 values for primary screen OVCAR3-R1 vs OVCAR3……………………… 194 Appendix C Compound list for secondary screen OVCAR3 vs SKOV3………………………. 203 Appendix D. Compound list for secondary screen OVCAR3-R1 vs OVCAR3………………… 205
x

Abbreviations AOCS Australian Ovarian Cancer Study BSO Bilateral salpingo-oopherectomy CDK Cyclin-dependent kinase EOC Epithelial Ovarian Cancer FACS Flow Cytometry and Cell Sorting FTSEC Fallopian tube secretory epithelial cells GOG Gynecologic Oncology Group HGSC High grade serous ovarian cancer HR Homologous recombination IHC Immunohistochemistry NACT Neoadjuvant chemotherapy RT-PCR Reverse-transcriptase Polymerase Chain Reaction shRNA Short-hairpin RNA siRNA Short-interfering RNA STIC Serous Tubal Intra-epithelial Carcinoma TCGA The Cancer Genome Atlas
xi

1. Literature review 1.1 Context of literature review This chapter provides an overview of the clinical aspects of ovarian cancer, as well as key molecular
characteristics. Treatment of advanced ovarian cancer and the landmark clinical trials that have
established current standards of care will be described. A focus on emerging targeted therapies that
are utilised in ovarian cancer will highlight the inadequacies of the current options, particularly in
comparison to other cancers. This review of the literature aims to set the scene for a description of the
role of cyclin E1 deregulation in ovarian cancer, and the potential for translating findings made during
this study to clinical trials in patients whose tumours harbour cyclin E1 (CCNE1) amplification.
During this thesis findings were made that improved understanding of the activity of CCNE1/cyclin
E1, the subject of my work. For the sake of clarity, this Review only includes information about
CCNE1 as a driver oncogene that was apparent at the commencement of my studies.
1

1.2 Ovarian cancer background
1.2.1 Epidemiology and risk factors In Australia, ovarian cancer is the 8th most common cancer in women, and the 6th most common cause
of cancer death (1). In 2011, 1330 new cases of ovarian cancer were diagnosed in Australia, with the
mean age of 63.8 years at first diagnosis. Between 1982 and 2010, age-standardised incidence of
ovarian cancer fell from 12.5 to 10.6 per 100,000. The reason for the decline in age-standardised
incidence is unclear but may include changes in exposure to risk factors (eg. use of oral contraceptive
pill, a potential protective factor), changes to classification systems, and removal of pre-cancerous
lesions that may have prevented ovarian cancer from developing in certain high risk populations. For
example, studies have shown that surgical excision of endometriosis reduces the risk of invasive
ovarian cancer (2, 3). Prophylactic surgery in high risk patients has also influenced the incidence of
invasive ovarian cancer (4, 5), discussed in detail in Section 1.4.3.2.
Worldwide, ovarian cancer is the 5th most common cancer in women in Europe, and the 11th most
common cancer in women in the US (6). Ovarian cancer incidence rates are highest in Central and
Eastern Europe, and lowest in West Africa, although this partly reflects varying data quality
worldwide (7). Other possible reasons for regional variation include differences in ethnicity,
environmental risk factors and diagnostic accuracy (8). Differences in use of oral contraceptive pill
and reproductive factors are likely to also affect incidence, particularly in Africa (Moorman Annals
Epi 2016).
Established risk factors for ovarian cancer include age and family history (8). Hereditary breast and
ovarian cancer syndrome in particular is associated with significant increased risk of invasive ovarian
cancer (discussed in detail in Section 1.4.3.2). Hormonal factors have also been associated with risk of
ovarian cancer (8), discussed in more detail in Section 1.2.5. Oral contraceptive use, pregnancy and
lactation have been associated with reduced risk of ovarian cancer, however unopposed oestrogen use
in postmenopausal women has been linked to an increased risk of ovarian cancer (9-13). Other
suspected risk factors for ovarian cancer include obesity, alcohol consumption, smoking, and talc use
(14-20).
Ovarian cancer is the most common cause of death from a gynaecological malignancy. Overall,
ovarian cancer is ranked seventh in terms of cancer-related deaths in females. The mortality rate for
ovarian cancer has gradually improved over the last 30 years. In Australia, five year overall survival
(OS) rate has improved from 32% in the time period between 1982-1987 to 43% in the time period
between 2006-2010 (1). Potential reasons for improvement in OS in ovarian cancer include improved
2

investigations and treatments, as well as increased access to specialised gynae-oncology multi-
disciplinary care (21-23).
1.2.2 Screening Screening tests for cancer are aimed at detecting cancer before the development of symptoms, when
the cancer may be more readily cured. Key features of a screening test include safety, tolerability and
cost-effectiveness (24). High levels of sensitivity and specificity are also crucial elements of a
screening test, to reduce both the false negative and false positive rates (25). A low false positive rate
is particularly important in ovarian cancer given its low incidence, where even a small false positive
rate can significantly impact on the positive predictive value of a test (25). Examples of successful
population-based cancer screening programs include mammography for breast cancer, faecal occult
blood testing for colorectal cancer and Pap smears for cervical cancer (26). These programs have
established evidence demonstrating cost-effectiveness and capacity to detect cancers at earlier stages,
resulting in improvements in survival.
To date, despite strenuous effort, effective population-based screening for ovarian cancer remains an
elusive goal. Tests such as pelvic examination, transvaginal ultrasound (TVUS) and serum cancer
antigen 125 (CA-125) levels have been examined in a number of trials. Two large prospective
randomised trials have been published recently. The Prostate, Lung, Colorectal and Ovarian (PLCO)
Cancer Screening Trial evaluated the efficacy of annual serum CA-125 levels and TVUS as screening
tools to reduce ovarian cancer mortality (27). Almost 80,000 women in the general US population
were recruited to the study. Compared to usual standard of care, the study found that screening with
CA-125 and TVUS did not reduce ovarian cancer mortality, and resulted in increased invasive
medical procedures and associated complications. Updated analysis of the PLCO trial with extended
follow up was published recently, confirming the lack of mortality benefit with CA-125 and TVUS
screening (28). The UK Collaborative Trial of Ovarian Cancer Screening study (UKCTOCS) has also
recently published their results (29). This prospective randomised study also evaluated CA-125 levels
and TVUS as screening tests, however the investigators used a risk algorithm based on the velocity of
CA-125 level change when collected serially to assess likelihood of having ovarian cancer (30). Over
200,000 post-menopausal women were randomised, with no significant difference in mortality in the
primary analysis. However multimodality screening was able to detect more ovarian cancers, with
significant reduction in mortality in the 7-14 year time period. The longer-term mortality data are not
yet mature and therefore the authors concluded that further follow up is required to determine the
cost-effectiveness and utility of a population based screening program (29).
Screening in high risk individuals was proposed as a potential strategy to detect ovarian cancer at an
early stage (31, 32). However, multiple studies have failed to demonstrate any benefit to screening
3

with annual CA-125 levels and TVUS in patients with germline BRCA1/2 mutations (33, 34).
Therefore there are currently no screening tests in routine use for ovarian cancer detection, either in
high risk patients or the general population.
1.2.3 Histological classification of EOC Conventional classification of ovarian cancer has typically divided it into three categories – epithelial,
sex-cord stromal and germ cell (35). Epithelial ovarian cancer (EOC) accounts for approximately 90%
of all ovarian cancers, and are responsible for most deaths due to gynaecological cancers (36). Sex
cord stromal and germ cell tumours of the ovary have distinct characteristics in terms of pathogenesis,
molecular characteristics and clinical behaviour compared to epithelial cancers (37), and are not
addressed further here.
Histological classification of EOC is based on the similarity to cell types of the Mullerian tract (38).
Mucinous ovarian cancer cells resemble endocervix or gastro-intestinal tract mucinous cells, and
contain intracellular mucin in the majority of cells (39). Ovarian clear cell carcinomas are described as
glycogen containing clear cells, growing in a solid, tubular or papillary pattern with hobnail cells
lining tubules or cysts (40). Low grade endometrioid ovarian cancer cells resemble endometrial
mucosa, and occasionally co-exist with endometrial carcinoma (41). High grade endometrioid ovarian
cancer is less common, and improved immunohistochemical (IHC) markers and genomic studies
indicate that many previously classified high grade endometrioid ovarian carcinomas should be re-
classified as high grade serous ovarian cancer (HGSC). Serous carcinomas morphologically resemble
fallopian tube epithelium (35). In the past, serous ovarian cancers were graded histologically using the
International Federation of Gynecology and Obstetrics (FIGO), the World Health Organisation
(WHO) or the Silverberg classification (42-44). Each of these histological grading systems assessed
the architectural features, degree of nuclear atypia and mitotic index and categorised serous tumours
into grade 1, 2 or 3. In 2004, Malpica et al described a two-tier system for grading serous ovarian
cancers into either low grade (former grade 1) or high grade (former grades 2 and 3) based primarily
on nuclear atypia (45). This two-tier grading system was subsequently validated in additional samples
and has been adopted internationally (46, 47). Low-grade serous carcinomas typically have a well-
differentiated architecture with papillary growth, uniform nuclei and infrequent mitoses (48). By
contrast, HGSC exhibit significant heterogeneity in terms of architectural structure, cellular size and
shape, and nuclear features (49).
1.2.4 Classification of EOC – Type I and Type II tumours Although histological subtypes of EOC have long been recognised (35), it has been largely managed
clinically as a single entity. Over the last two decades, however, advances in histo-pathological,
clinical and genomic studies have highlighted important biological differences between subtypes,
4

their distinct aetiologies and clinical behaviour (50). One broadly used system involves classification
of EOC into two subtypes – Type I and Type II - based on histological, clinical and molecular
characteristics (51). Type I tumours comprise of low-grade serous, low-grade endometrioid, clear cell
and mucinous carcinomas. HGSC, high grade endometrioid carcinomas and malignant mixed
Mullerian tumours (now more commonly known as carcinosarcomas) make up type II tumours. Type
I tumours are typically slow growing, insensitive to chemotherapy, genetically stable, and each
subtype is characterised by specific mutations in genes including KRAS, BRAF, ERBB2, CTNNB1,
PTEN and PIK3CA. By contrast, Type II tumours are aggressive and highly genetically unstable.
Type II tumours rarely or never harbour mutations seen in Type I tumours but have near ubiquitous
TP53 mutations (52). This model suggests that the two different types of EOC develop along different
molecular pathways and may arise from different precursors (discussed in Section 1.2.5).
1.2.5 Aetiology and cell of origin of EOC Historically, EOC was thought to derive from malignant transformation of the surface epithelium of
the ovary (53). In part, this was supported by observations that factors which interrupted ovulation
such as oral contraceptive use, pregnancy and lactation reduced the risk of ovarian cancer (54). By
contrast, nulliparity is associated with an increased risk of ovarian cancer (55, 56). Collectively, these
findings suggested that uninterrupted ovulation and postovulatory repair result in the accumulation of
genomic abnormalities, predisposing the ovarian surface epithelium to malignant transformation (54,
57). There is also a noted association between chronic inflammatory states such as pelvic
inflammatory disease and endometriosis and the risk of ovarian cancer (58). It was proposed that the
various different histological subtypes of EOC all derived from the ovarian surface epithelium, and
the accumulated genomic changes led to metaplastic changes resulting in the different histological
subtypes (59).
More recently, detailed histologic and molecular studies have indicated that the ovarian surface
epithelium may not be the cell of origin for a majority of EOC (52). No mucinous cell type exists in
the ovary, and primary ovarian mucinous carcinomas share many similarities with mucinous
colorectal cancers (39), suggesting that mucinous ovarian tumours may be metastatic deposits from
gastrointestinal tumours (60). Ovarian clear cell carcinomas have been strongly associated with
endometriosis (61-63), and gene expression profiling studies have demonstrated remarkable
similarities to renal clear cell cancers (64, 65). Low-grade endometrioid ovarian cancers have also
been linked to endometriosis, suggesting that the endometrium is the potential source of these ovarian
cancers (66). Low-grade serous ovarian cancers have been associated with non-invasive tumours, such
as serous adenofibroma or serous tumours of low malignant potential (67). Clinical and genomic
studies have indicated that low grade serous ovarian cancers may develop from non-invasive
5

components of benign tumours of the ovary such as serous adenofibroma or serous tumours of low
malignant potential, suggesting a step-wise progression of tumorigenesis (48, 68).
HGSC is the most common form of EOC, and is the focus of this thesis. HGSC were originally
thought to arise from ovarian surface epithelium that had invaginated into the underlying stroma,
resulting in inclusion cysts that eventually undergo malignant transformation (69). Following the
identification of germline BRCA1 and BRCA2 mutations causing hereditary breast and ovarian cancer
syndromes (70)(discussed in more detail in Section 1.4.3), risk-reducing bilateral salpingo-
oopherectomy has become commonly offered to BRCA1/2 mutation carriers (32). Detailed histological
examination of ovaries and fallopian tubes of BRCA1/2 mutation carriers who had not developed
invasive cancer led to the identification of dysplastic changes, abnormal p53 immunostaining and
serous tubal intraepithelial carcinoma (STIC) lesions within the distal fimbral end of the fallopian
tube (71-74). A protocol for close examination of the fallopian tubes to identify any potential HGSC
precursors was subsequently developed (73). Evaluation of the fallopian tubes in women with sporadic
HGSC identified STIC lesions in approximately 50-60% of cases (75-77).
Multiple lines of evidence support the view that fallopian tube STIC represents the precursor lesion of
a majority of HGSC. STIC lesions are characterised by a disorganised epithelium, composed of
malignant secretory cells with evidence of DNA damage, high proliferative index and abnormal p53
staining (72, 73). Sequencing of TP53 in STIC lesions and HGSC from the same patient demonstrated
identical TP53 mutations, supporting the hypothesis of clonality and progression from STIC to HGSC
(75). However, the process of transformation from STIC to HGSC has yet to be clearly delineated, and
is the focus of ongoing investigation (78). The recent development of fallopian tube model systems,
including genetically engineered mouse models, can potentially facilitate this area of study (79-85).
Results from these studies have significant clinical applicability, particularly in the area of ovarian
cancer prevention in high risk patients (discussed in Section 1.4.3.2).
The clinical outcome for patients with the finding of an isolated STIC lesion has not been
prospectively established. A number of small studies have shown excellent outcomes for isolated
STIC lesions, although some patients did develop recurrent invasive disease during follow up (86-88).
Additional studies and long term follow up is required to determine the natural history of STIC
lesions, and whether any additional treatment such as further surgery or chemotherapy is necessary. It
is important to note that STIC lesions have not been found in all patients with HGSC. Possible
explanations include inter-observer variability and sampling errors and the presence of advanced stage
disease that may mask the identification of a STIC lesion (78). Additionally, fallopian tubes cells are
known to dislodge and implant on or in the ovary (a process known as endosalpingiosis), possibly
during ovulation, and these may provide a source of fallopian-tube derived cells that give rise to what
appears to be an ovarian primary tumour (52, 76, 78, 89).
6

1.3 Clinical management of HGSC
1.3.1 Clinical presentation HGSC is an insidious disease, in which the early stages are usually asymptomatic (90). When
symptoms develop, they are often non-specific and indicative of disease in the upper abdomen (91).
Common symptoms in patients with HGSC include fatigue, nausea, bloating, indigestion, early satiety
and changes in bowel function. These complaints are often associated with other, non-malignant,
conditions and studies have shown that the majority of women with these symptoms do not have
ovarian cancer (92). Patients are more likely to have EOC if they have a combination of symptoms
(>3) or a higher frequency and severity of symptoms. Retrospective studies have shown that more
than 90% of patients with EOC complain of some type of symptom in the preceding 12 months prior
to diagnosis (92, 93). However, once symptoms have developed, altering the time to diagnosis may not
alter the clinical outcome and therefore raising symptom-awareness in women may not improve
survival (94).
Findings made upon clinical examination are largely dependent on the stage of disease (90). Patients
with advanced disease are likely to have ascites and significant abdominal distension, and may have
palpable peritoneal disease, as well as pleural effusions. Standard initial investigations include serum
CA-125 levels, pelvic ultrasound, CT or MRI scanning (95). These investigations often serve as both
diagnostic and staging investigations, and assist in determining the treatment modality. A presumptive
diagnosis of EOC is typically made on the basis of clinical presentation and investigations, and
subsequently confirmed via ascites fluid aspiration or biopsy of omental disease.
1.3.2 Staging Staging of EOC is based on the FIGO staging system, which was revised recently (96). EOC is staged
surgically and pathologically, and provides important prognostic information that guides treatment
decisions. The current staging system considers pathological aspects such as extent of local and
distant spread, peritoneal fluid cytology and lymph node involvement. Stage I disease is limited to the
ovaries only, Stage II involves disease extending to the other pelvic structures, Stage III involves
dissemination into the abdominal cavity or regional lymph nodes, and Stage IV disease is defined by
distant metastases (96). HGSC patients typically present with Stage IIIC disease, which involves
spread to the abdominal cavity with bulky tumour deposits greater than 2cm.
7
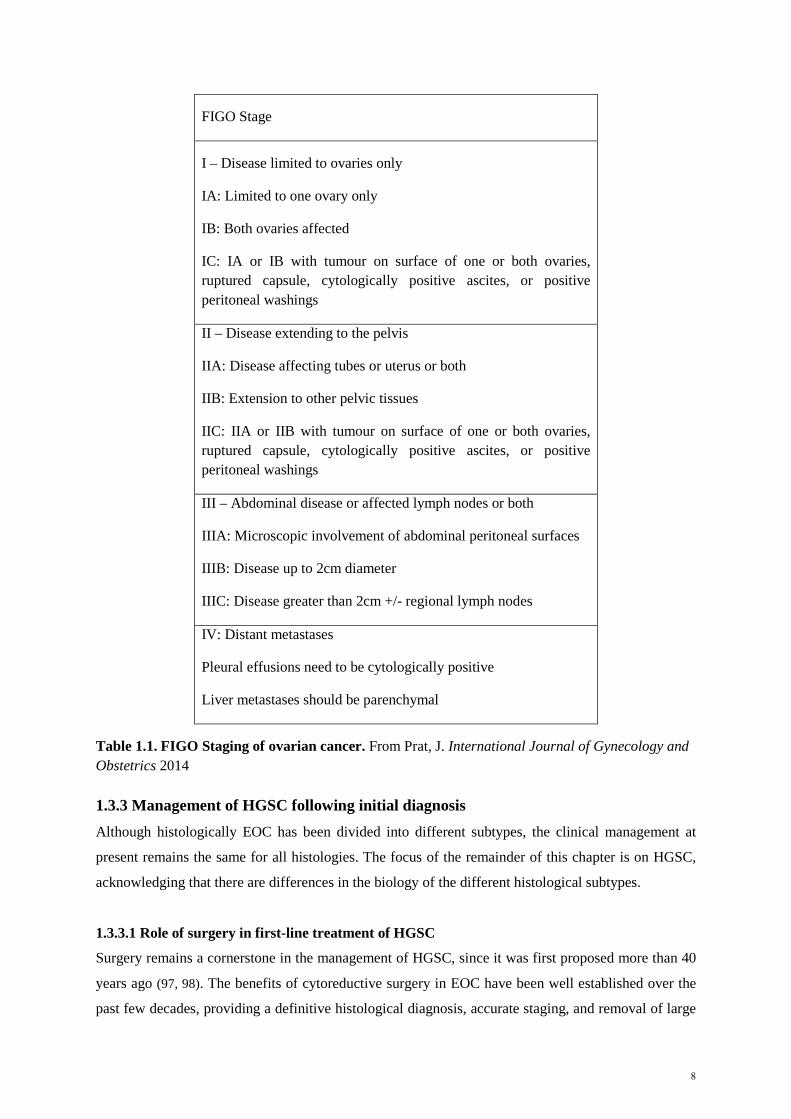
FIGO Stage
I – Disease limited to ovaries only
IA: Limited to one ovary only
IB: Both ovaries affected
IC: IA or IB with tumour on surface of one or both ovaries, ruptured capsule, cytologically positive ascites, or positive peritoneal washings
II – Disease extending to the pelvis
IIA: Disease affecting tubes or uterus or both
IIB: Extension to other pelvic tissues
IIC: IIA or IIB with tumour on surface of one or both ovaries, ruptured capsule, cytologically positive ascites, or positive peritoneal washings
III – Abdominal disease or affected lymph nodes or both
IIIA: Microscopic involvement of abdominal peritoneal surfaces
IIIB: Disease up to 2cm diameter
IIIC: Disease greater than 2cm +/- regional lymph nodes
IV: Distant metastases
Pleural effusions need to be cytologically positive
Liver metastases should be parenchymal
Table 1.1. FIGO Staging of ovarian cancer. From Prat, J. International Journal of Gynecology and Obstetrics 2014 1.3.3 Management of HGSC following initial diagnosis Although histologically EOC has been divided into different subtypes, the clinical management at
present remains the same for all histologies. The focus of the remainder of this chapter is on HGSC,
acknowledging that there are differences in the biology of the different histological subtypes.
1.3.3.1 Role of surgery in first-line treatment of HGSC
Surgery remains a cornerstone in the management of HGSC, since it was first proposed more than 40
years ago (97, 98). The benefits of cytoreductive surgery in EOC have been well established over the
past few decades, providing a definitive histological diagnosis, accurate staging, and removal of large
8
tumour masses (99). The theoretical benefits of this procedure include improved chemo-sensitivity,
potentially by leaving a high proportion of cells in an active growth phase, removing parts of the
tumour with a poor blood supply that may not receive adequate doses of chemotherapy, and reducing
the number of clonogenic cells that may regrow and/or become resistant after chemotherapy (98). The
standard surgical approach is a vertical midline incision to allow adequate exposure of the upper
abdomen and pelvis. Surgery should be performed by a specialist gynae-oncology surgeon, and
include a total hysterectomy, bilateral salpingo-oopherectomy (BSO), tumour debulking and
omentectomy (100-102). Careful examination of all peritoneal surfaces, upper abdomen and
diaphragm are required for accurate staging. Histologic examination of all specimens obtained
surgically will provide final definitive diagnosis and staging.
The presence of residual disease following primary cytoreductive surgery has been shown in multiple
studies to be a significant prognostic factor in EOC (103-105). Therefore, the goal of gynaecologic
oncologists is to achieve optimal debulking surgery – historically defined as largest single residual
mass ≤ 2cm in maximal diameter. Operations resulting in any residual tumour ≥ 2cm have been
defined as sub-optimal debulking (106). This arbitrary cut-off continues to be heavily debated. A large
meta-analysis reported that each 10% increase in the amount of cytoreduction was associated with a
5.5% increase in median survival time (105). In addition, a recent meta-analysis evaluating the
surgical outcome of three clinical trials demonstrated that residual tumour is a stronger prognostic
determinant than FIGO stage (107). For example, patients with suboptimally debulked stage IIB-IIIB
tumours had a worse outcome than those with optimally debulked stage IIIC tumours. The results
from these studies and others have persuaded some groups to alter the definition of optimal debulking,
and advocate for maximal surgical effort in order to achieve cytoreduction of all macroscopically
visible disease - a so called “R0” resection (108-111). However, other studies have suggested that
patients with extensive disease before cytoreductive surgery will have a worse prognosis, despite
optimal debulking (112-114). It remains unclear whether the ability to achieve optimal cytoreduction
in some EOC patients simply reflects a more biologically favourable patient subgroup, or whether
differences in surgical effort and skill are directly responsible for the superior outcomes seen in R0
patients (98). A recent retrospective study of 2,655 patients with EOC treated in the Gynecologic
Oncology Group (GOG) 182 study attempted to address this question (115). In patients that achieved
optimal debulking, those patients who had a high disease distribution prior to surgery had a lower OS
and progression free survival (PFS) compared to those who had a lower disease distribution before
surgery. The authors indicated that aggressive surgery is therefore unlikely to overcome the poor
prognosis associated with patients who present with widespread disease. The authors also suggested
that in patients with widespread EOC in whom optimal debulking surgery is unlikely at initial
presentation should be considered for neoadjuvant chemotherapy (NACT) with interval debulking
surgery (discussed in Section 1.3.3.6).
9

1.3.3.2 Role of chemotherapy in first-line treatment of advanced stage HGSC
The current standard of care for treatment of advanced stage HGSC (FIGO Stage III/IV) has typically
consisted of 6 cycles of intravenous (IV) carboplatin and paclitaxel chemotherapy following
debulking surgery, given on a 3-weekly cycle (116). This regimen was been established over the last
four decades, after cisplatin was introduced in the 1970s and 1980s (Williams JCO 1985) and
paclitaxel in the 1990s (117, 118). Subsequently the GOG158 study demonstrated equivalence of
cisplatin and carboplatin, but with lower toxicity associated with the latter and carboplatin has
therefore become the preferred platinum backbone (119). Over nearly two decades more than 12,000
women have been enrolled in clinical trials in an effort to improve on the combination of IV platinum
and taxane chemotherapy (116). Addition of a third cytotoxic, sequential doublets, alternative taxane
or anthracycline doublets, and maintenance chemotherapy are all strategies that have been tested in
randomised clinical trials that have failed to demonstrate significant improvements in the survival of
patients with advanced stage HGSC (116, 120). Therefore, the combination of IV carboplatin and
paclitaxel remains the standard of care for advanced stage HGSC. Dosing of paclitaxel is based on
body surface area (paclitaxel dose = 175mg/m2), and carboplatin dose is based on estimated drug
clearance rate based on age, serum creatinine, and body weight (carboplatin dose = glomerular
filtration rate + 25 x target AUC). This regimen results in response rates of over 70%, making HGSC
one of the most chemo-sensitive solid malignancies (120). In up to 50% of cases, patients will be
rendered free of disease, with no detectable disease on imaging or serum markers following treatment
(121). Despite this, the emergence of resistant recurrent disease occurs in up to 70% of patients who
initially present with advanced disease (122). Studies more recently have focused on changes in
scheduling, dosing and route of administration of cytotoxic chemotherapy (discussed in Sections
1.3.3.4 and 1.3.3.5) in the first line setting in order to improve outcomes. Addition of molecularly
targeted agents to chemotherapy, particularly anti-angiogenic agents, has also been tested in multiple
clinical trials, with modest incremental benefits reported (discussed in Section 1.3.5).
1.3.3.3 Role of chemotherapy in early stage HGSC
Although the majority of patients with HGSC present with advanced disease, approximately 30% of
patients present with FIGO Stage I and II disease (123). The survival of patients with early stage
disease is significantly better than those with advanced stage disease, and therefore studies have
attempted to reduce the amount of chemotherapy delivered (123-125). For example, the GOG157
study was a randomised phase III trial that compared 3 cycles of carboplatin and paclitaxel to 6 cycles
for adjuvant treatment of high risk early stage EOC (123). The authors concluded that 6 cycles of
chemotherapy did not significantly alter the rate of recurrence but was associated with more toxicity.
However a post-hoc retrospective analysis of the different histological subgroups treated in GOG157
demonstrated that there was a significant benefit associated with more chemotherapy in HGSC, with a
5-year recurrence-free survival rate of 83% and 60% in those who received 6 cycles versus 3 cycles,
10

respectively (126). For non-serous EOC, there appeared to be no difference in recurrence-free survival
with 3 or 6 cycles of chemotherapy. In addition, those patients who developed recurrent disease after
an initial diagnosis of early stage HGSC still had a poor survival and comparable outcomes to those
with advanced stage disease (127). Therefore selection of appropriate patients with early stage HGSC
for adequate adjuvant chemotherapy is crucial to preventing disease recurrence.
1.3.3.4 Intra-peritoneal chemotherapy
The peritoneum serves as the primary site of disease spread and recurrence in EOC and in many
patients tumours remain confined to the abdomen until quite late in disease progression (128).
Therefore, theoretically EOC is a disease that may be amenable to treatment delivered into the
peritoneum. The potential advantage of intra-peritoneal (IP) over IV chemotherapy is that IP
chemotherapy exposes tumour cells inside the peritoneal cavity to higher concentrations of cytotoxic
drugs than would be possible through the IV route (129). Three pivotal randomised clinical trials
demonstrated significant improvements in PFS and OS with IP chemotherapy over standard IV
chemotherapy (106, 130-132). Despite the results of these trials, a meta-analysis and a subsequent
National Cancer Institute alert, IP chemotherapy has not been adopted as a standard of care
internationally (133). Clinicians are reluctant to prescribe IP chemotherapy due to higher toxicity,
catheter related complications, inconvenience and uncertain long-term benefits (134, 135). Others
argue that the underlying rationale of increased exposure of chemotherapy to peritoneal tumour
deposits is mitigated by the observation that cisplatin and many other drugs are rapidly absorbed from
the peritoneal space, and therefore the improvements seen with IP chemotherapy may be attributed to
differences in dose density (136). In addition, there are no studies that have identified clinical or
pathological factors that may predict benefit or tolerability of IP chemotherapy, although one
retrospective study did demonstrate an association between decreased BRCA1 expression and
improvement in OS with IP chemotherapy (137). More recently, trials have been designed to improve
tolerability of IP chemotherapy by adjusting the doses or drugs given, as well as direct comparisons to
dose-dense IV chemotherapy regimens (132). Results of these trials are awaited.
1.3.3.5 Dose dense chemotherapy
In breast cancer, clinical trials have demonstrated improved efficacy with the use of paclitaxel given
weekly (dose-dense) compared with conventional three-weekly dosing (138, 139). These findings are
supported by pre-clinical studies that found that weekly administration of paclitaxel can induce
apoptosis and inhibit angiogenesis (140).
A pivotal study published in 2009 by the Japanese Gynae-Oncology Group (JGOG) demonstrated
impressive improvements in PFS and OS with dose dense paclitaxel compared to three-weekly dosing
(141, 142). However, two subsequent studies (MITO 7, GOG262) comparing dose dense to three-
11

weekly dosing conducted in Europe and the US did not demonstrate similar effects (143, 144).
Potential reasons for the different results observed in these three studies include pharmacogenomic
variations between Asian and Caucasian patients (145), the addition of bevacizumab in the GOG262
study (144), and modification of the timing and dose level of carboplatin in the European Study (143).
There is an ongoing international study (ICON-8) attempting to resolve these issues that is yet to be
published. Results are awaited before the use of dose-dense paclitaxel is recommended as the standard
of care in the first-line setting, however, it is commonly used in disease recurrence.
1.3.3.6 Neoadjuvant chemotherapy (NACT)
The concept of NACT, delivering chemotherapy prior to debulking surgery, was first attempted in
order to improve optimal cytoreduction rates in patients with advanced EOC (146, 147). The approach
remains controversial despite a number of randomised clinical trials, two meta-analyses and a
Cochrane Systematic Review (148-153). A recent European study showing non-inferiority of NACT
over primary debulking surgery and adjuvant chemotherapy, but lower morbidity with NACT, has
been particularly influential in changing practise (149). However, that study was criticized for the low
rate of optimal surgical debulking achieved (154), and questions regarding patient selection, preferred
chemotherapy regimen, timing of surgery and concerns over differences in outcome between NACT
and primary cytoreduction remain. Recently, ASCO published guidelines attempting to offer
clinicians information regarding the use of NACT (155), indicating that patients with advanced EOC
who have a high risk of perioperative morbidity may be offered NACT after detailed assessment by a
gynaecologic oncologist. In addition, for patients who are deemed fit for primary surgery but are
thought unlikely to achieve optimal cytoreduction, NACT is recommended.
Ongoing studies to validate tools that can accurately predict for optimal cytoreduction and choice of
NACT versus PDS are underway. For example, investigators at the MD Anderson Cancer Centre have
reported on a decision-making algorithm featuring a two-surgeon laparoscopic evaluation to
determine the likelihood of achieving a R0 resection (111, 156). Patients deemed unlikely to achieve a
R0 resection are offered NACT followed by interval debulking surgery. Following the
implementation of this algorithm, the authors reported that 50% of patients with advanced HGSC
were treated with NACT rather than primary cytoreductive surgery. Rates of R0 resection at primary
surgery significantly increased, and a trend to improved R0 resection for patients undergoing NACT
was also noted. No differences in surgical morbidity or laparoscopic port site metastases were
reported. The authors concluded that the implementation of their decision algorithm improved patient
selection for primary surgery or NACT, in the hope that this will lead to increased rates of R0
resections and subsequent improvements in survival. One potential limitation to this proposed
algorithm is the potential increase in resources required, particularly in terms of access to operating
12
theatres and specialised gynae-oncologists. Therefore it is unlikely to be feasible outside of tertiary
level centres.
1.3.4 Management of recurrent HGSC Despite initial good response rates to surgery and chemotherapy, HGSC recurs in up 70% of patients
who present with Stage III/IV disease (122). The management of patients with recurrent HGSC is
largely palliative, although occasionally patients can undergo optimal secondary cytoreductive
surgery with reasonable long term outcomes (157). Second-line chemotherapy options can also result
in meaningful response rates and disease control, however resistance to chemotherapy develops in
almost all recurrent patients, resulting in progressive disease and death.
1.3.4.1 Defining recurrent HGSC
Follow up of patients after completion of primary therapy previously centred on clinical assessment
and 1- to 3-monthly monitoring of CA-125, based on the assumption that earlier detection of recurrent
cancer can improve survival (158, 159). However, close monitoring of CA-125 levels in the post-first
line treatment setting, with early initiation of second-line therapy upon biochemical evidence of
relapse, has not been shown to be curative or improve outcomes compared to commencing treatment
when the patient became symptomatic (160, 161). In a randomised phase III study, the use of
chemotherapy immediately on a CA-125 rise was compared to observation until the development of
symptomatic disease recurrence (160). Although chemotherapy was started at a median of 5 months
earlier in the immediate arm it did not result in an improvement in OS. Quality of life was also
measured in this study and found to be adversely impacted by use of early chemotherapy. As a result
of this pivotal study, serial CA-125 monitoring is not routinely recommended, although remains a
common practice (162-164). This is in contrast to colorectal cancer, where serial CEA monitoring has
been shown to improve survival by potentially identifying isolated hepatic metastases that may be
amenable to surgical resection (165). In part, this reflects the biology of HGSC, where recurrent
disease typically occurs as multi-focal peritoneal nodules rather than solitary metastatic deposits (128).
Furthermore, it is important to note that the Rustin data were collected from patients treated a decade
or more ago, and there may be value in reassessing the timing of treatment re-initiation as more
contemporary and effective treatments emerge.
Recurrent disease in HGSC is typically categorised based on the time from last prior platinum-based
chemotherapy. This so-called platinum free interval (PFI) has been used in clinical trials to define
patient populations, and is commonly used in clinical practice to guide treatment choices (166). It is
worth noting that these definitions were initially based on three relatively small retrospective studies
that observed that responses to second-line platinum based chemotherapy were common, and the
13

response rate increased with increasing PFI (167-169). Currently, recurrent HGSC is classified broadly
as (170):
1. Platinum refractory – fail to respond to first-line chemotherapy or progression within 4 weeks of
last platinum dose
2. Platinum resistant – disease that recurs within 6 months of platinum-based chemotherapy
3. Platinum sensitive – disease that recurs greater than 6 months after platinum-based chemotherapy
Some investigators split the third category into partially platinum sensitive (PFI 6-12 months) and
platinum sensitive (≥12 months)(170). Recurrences diagnosed in the studies that helped define these
cut offs were made largely by clinical or radiological assessments, not CA-125 monitoring. The 6
month and other time points are essentially arbitrary, and do not fully reflect the underlying biology
and heterogeneity of recurrent HGSC (discussed below). Furthermore, differences in how closely
individual patients are monitored, such as the timing and frequency of CA125 readings, can impact on
how their response is assigned.
1.3.4.2 Role of secondary cytoreductive surgery
The reported benefits of optimal primary cytoreductive surgery prompted studies into the role of
secondary cytoreductive surgery (171, 172). Data from largely retrospective studies supports the use of
secondary cytoreductive surgery in platinum-sensitive recurrent EOC, particularly when complete
cytoreduction is possible. Similar to the first-line setting, the ability to achieve complete cytoreduction
with no visible residual disease is associated with improved OS (157). This has led to the development
of DESKTOP III and GOG 213, prospective clinical trials that investigate tools to select patients with
recurrent EOC for secondary cytoreductive surgery. These studies are due to report in the near future.
1.3.4.3 Chemotherapy in the clinical management of recurrent disease
The current standard of care for recurrent HGSC remains chemotherapy. Chemotherapy in this setting
is palliative rather than curative, aiming to ameliorate cancer related symptoms such as pain and
abdominal bloating, improve patients’ quality of life, and extend OS (122). The choice of regimen is
influenced by multiple factors, including performance status, cancer-related symptoms, adverse
effects, quality of life and patient preferences. Most importantly, the PFI is the strongest clinical
predictor of likelihood of response to platinum-based and other lines of chemotherapy (173).
Platinum refractory HGSC
Patients with primary platinum refractory HGSC have a very poor prognosis, with OS less than 12
months (169). These patients essentially fail to respond to first line treatment, and demonstrate
ongoing tumour growth during or very soon after initial therapy. Truly refractory HGSC (i.e. no
14

measurable response to primary treatment) is relatively uncommon, occurring in 14% of cases (174).
The comparative rarity of refractory patients means that relatively little is known of the biology of
their disease. Response rates to single agent chemotherapy agents such as weekly paclitaxel,
gemcitabine, and liposomal doxorubicin are generally 10-15% (175). This population remains a key
area of unmet need.
Platinum resistant recurrent HGSC
Platinum resistance can become apparent following first line treatment (primary resistance) or emerge
following subsequent lines of treatment (secondary resistance). Biological features underlying
primary and acquired resistance are discussed below (Sections 1.4.4 and 1.5). Similar to platinum
refractory disease, current standard of care for patients with platinum resistant disease is non-platinum
single agent chemotherapy. Most common options include liposomal doxorubicin, gemcitabine,
weekly paclitaxel and topotecan. Response rates are between 20-30% at best, with OS generally
around 12 months (121). More recently, the addition of bevacizumab to chemotherapy in platinum
resistant recurrent HGSC has been tested in a randomised clinical trial, resulting in modest
improvements of PFS, control of disease related symptoms, but no increase in OS (176). Given this
outcome, many current clinical trials include patient reported outcomes (PRO) as a key endpoint (170,
177).
Platinum sensitive recurrent HGSC
Patients with platinum sensitive recurrent HGSC have a better prognosis than those with platinum
resistant or refractory disease (169). However, platinum-sensitive recurrent HGSC is a broad category
that can be quite heterogeneous. For example, a patient that recurs just after 7 months following
completion of first line therapy is unlikely to respond to treatment in the same manner as a patient that
has had a PFI of 2 years, or another patient who has responded to multiple lines of platinum-based
chemotherapy (121). Each patient’s tumour, although classified as platinum sensitive, is likely to have
different underlying biology.
Multiple clinical trials, together with a meta-analysis of individual patient data, have demonstrated the
efficacy of platinum-based chemotherapy regimens for recurrent platinum sensitive HGSC (178).
Combining platinum with agents such as paclitaxel, gemcitabine or liposomal doxorubicin have
consistently shown improved response rates and PFS, compared to single agent platinum-based
chemotherapy (179-182). Because OS is similar with all of platinum doublets, the choice between
treatment options is generally based on patient preference and toxicity profile (178). More recently,
additional novel molecularly targeted agents such as bevacizumab have also been shown to improve
response rates and PFS in combination with chemotherapy in the recurrent setting (discussed in
Section 1.3.5).
15

1.3.5 Molecularly targeted therapy in HGSC Multiple clinical trials testing novel molecularly targeted agents such as tyrosine kinase inhibitors and
monoclonal antibodies have been carried out in EOC. Despite these efforts, only two such class of
drugs have progressed into routine clinical practice – agents targeting angiogenesis and poly ADP
ribose polymerase (PARP) inhibitors. The clinical development of PARP inhibitors are described later
in this Review (Section 1.4.3.2) following a discussion of the molecular features of HGSC defective
in homologous recombination repair.
1.3.5.1 Targeting angiogenesis
The concept that tumour growth is dependent on the growth of new vessels, termed angiogenesis, and
that inhibition of angiogenesis could be of therapeutic value, was first introduced more than 40 years
ago (183). Cells require oxygen and nutrients supplied by the surrounding vasculature for cell function
and survival. During normal organogenesis, a tightly regulated process of counterbalancing
stimulatory and inhibitory signals ensures the coordinated growth of parenchyma and blood vessels
(184). Once a tissue is formed, angiogenesis is also carefully regulated. However, in the neoplastic
setting, malignant cells acquire angiogenic ability as the tumour develops, facilitating uncontrolled
growth, tumour expansion and metastatic potential (185, 186). Pro-angiogenic growth factors and
receptors have now become key targets in the treatment of cancer, including ovarian cancer. The most
widely studied pathway comprises vascular endothelial growth factor (VEGF) and the two receptor
tyrosine kinases, VEGF-R1 and VEGF-R2 (187, 188). Other factors that share similar downstream
targets to VEGF include fibroblast growth factor (FGF) and platelet-derived growth factor (PDGF)
(189, 190). The angiopoietin (Ang) pathway is a parallel, VEGF-independent pathway with direct
effects on the tumour microenvironment and vascular remodelling (191). Drugs targeting all of these
pathways are available and have been tested in clinical trials in EOC (192).
Angiogenesis plays a fundamental role in the pathogenesis of EOC, promoting tumour growth and
metastatic spread (193). VEGF and VEGF-R2 expression is associated with higher grade and disease
stage, and has been identified as an independent poor prognostic factor in EOC (194). In addition, high
levels of VEGF results in increased capillary permeability, leading to ascites formation (195, 196).
Therefore angiogenesis represents an attractive therapeutic target in HGSC.
Since 2011, there have been eight positive randomised phase 3 clinical trials in EOC reported,
involving five unique anti-angiogenic agents – bevacizumab, pazopanib, cedirinib, trebananib and
nintenanib (192). Nearly 8,000 patients with either newly diagnosed or recurrent EOC have been
recruited to these trials, with consistent improvements in response rates and PFS demonstrated in the
absence of OS benefit in the broad study population. In Australia, the only agent that has been
16

approved by the regulatory bodies for use in EOC is bevacizumab, based on two pivotal trials
demonstrating improvement in PFS in the front-line setting (197, 198). Subgroup analysis of the
ICON7 trial demonstrated improvements in OS in patients deemed to have “high-risk” disease, as
defined by suboptimally debulked Stage III or Stage IV disease (199). However, a post-hoc
retrospective analysis of a similar cohort of patients from GOG218 study did not demonstrate a
statistically significant improvement in OS (200).
Trials in platinum sensitive and platinum resistant recurrent EOC have also demonstrated
improvements in PFS with the addition of bevacizumab compared to chemotherapy alone (176, 201).
Importantly, improvements in patient reported symptoms were also noted, particularly with significant
reduction in the recurrence of tumour related ascites (202). Despite the results of these trials,
additional questions regarding the optimal use of anti-angiogenic agents remain. The optimal timing
(following initial diagnosis or recurrent disease), duration, dose, combinations with intra-peritoneal or
dose-dense chemotherapy, choice of agent and cost effectiveness are all questions that are under
active research (192). One key issue that may address these questions is the development of a
biomarker that can predict benefit (or lack of benefit) from anti-angiogenic agents (203-205).
1.3.5.2 Other novel targeted therapies
Other agents tested in unselected patients with recurrent EOC include multi-kinase inhibitors, such as
sunitinib, sorafenib and imatinib (206-209). Response rates to these agents were less than 10%, and
significant toxicities were quite common. Erlotinib, a tyrosine kinase inhibitor targeting the epidermal
growth factor receptor (EGFR), was also investigated in a large randomised phase III trial (210). The
study randomised EOC patients to erlotinib or placebo as maintenance therapy following completion
of primary chemotherapy. There was no difference in PFS or OS between the two arms. Biomarker
studies did not demonstrate any correlation between EGFR mutations, increased copy number or
over-expression and response to erlotinib. Other trials testing other small molecule or monoclonal
antibodies targeting EGFR have reported similarly disappointing results (208).
Agents targeting the folate receptor have also been tested in EOC. The α-folate receptor is
overexpressed in greater than 80% of EOC (211), and studies have shown a correlation between
overexpression and tumour grade and prognosis (212, 213). Two approaches to targeting the folate
receptor have been tested in randomised clinical trials. Farletuzumab, a monoclonal antibody that
binds to the α-folate receptor, demonstrated promising response rates in a phase II study of recurrent
EOC (214). However a randomised phase III trial failed to show a benefit to the addition of
farletuzumab to chemotherapy in recurrent EOC (215). Vintafolide is a conjugate consisting of folate
linked to a potent vinca alkaloid chemotherapy agent, thereby aiming to directly target folate receptor
expressing cells (216). A randomised phase II study of vintafolide combined with liposomal
17

doxorubicin in patients with platinum resistant recurrent EOC demonstrated an improvement in PFS
in the combination arm compared with liposomal doxorubicin alone (213). The use of a folate receptor
imaging agent, 99mTc-etarfolatide, was also tested in this study as a means of identifying patients that
have high expression of folate receptor. Response rates and PFS were significantly higher in patients
with ≥ 1 folate receptor positive lesion (213). A randomised phase III trial of vintafolide plus
liposomal doxorubicin in folate receptor positive patients was subsequently initiated (PROCEED,
NIH Clinical Trial NCT01170650). However, interim analysis by the Data Safety Monitoring Board
recommended that the trial be prematurely stopped because it did not meet the pre-specified criteria
for an improvement in PFS (217). It remains unclear why the promising phase II data for agents
targeting the folate receptor did not translate into positive findings in the phase III setting.
Of note, many of the clinical trials of targeted agents in ovarian cancer did not specify histological
subtype. Generally, patient populations in trials reflect the general EOC spectrum, with HGSC being
the most common histology (121). Efforts to develop histology-specific trials are ongoing, and
hopefully will lead to improved clinical outcomes (121). For example, although sunitinib had minimal
activity in unselected EOC patients, it may be more effective in ovarian clear cell cancers, which
more closely resemble renal clear cell cancers in terms of gene expression profile (65). A clinical trial
of sunitinib in recurrent ovarian clear cell cancers is ongoing (NIH Clinical Trial NCT00979992).
However, such trials are likely to require large scale international collaborative efforts in order to
accrue sufficient patients, given the relative rarity of the non-HGSC subtypes of EOC.
1.4 Molecular characteristics of HGSC Given the relatively modest improvements in survival in HGSC patients over the last few decades, it
seems advisable to investigate the biology of these tumors to better understand tumor dependencies,
improve patient stratification on trial, and develop new therapeutic approaches. Knowledge of the
biology of HGSC has improved substantially over the last ten years, driven particularly by an
appreciation of the need to study the EOC histotypes separately, the development of microarrays to
monitor global changes in gene expression, DNA copy number and methylation patterns, and more
recently, next generation DNA sequencing (218-220).
Key molecular characteristics of HGSC that have been established are:
1. Near ubiquitous TP53 mutation
2. Frequent mutation in genes associated with the homologous recombination repair pathway,
including germline BRCA1/2 mutations
3. Significant genomic instability, structural variation and copy number alterations
4. Very infrequent point mutational activation of oncogenic drivers.
5. Molecular subtypes defined by gene expression profiles that correlate with survival
18

6. CCNE1 amplification as a marker of primary treatment resistance and poor outcome
Figure 1.1. Molecular classification of HGSC. Adapted from The Cancer Genome Atlas, Nature 2011 Each of these will be discussed in detail. 1.4.1 Somatic driver mutations One key aspect of the genomic characterisation of cancers has been the cataloguing of the somatic
mutations present in cancer cells (221, 222). Somatic mutations occur in the genome of all dividing
cells, occurring as a result of faults during DNA replication, or through exposure to exogenous or
endogenous mutagens (223). For example, a mutational signature related to the age of the patient can
be found in many cancers, reflecting the accumulation of errors during life (224, 225). Most mutations
are repaired by cells, however some are not and become fixed in clonal descendants.
Somatic mutations detected in cancer cells are broadly classified as driver or passenger mutations,
according to the consequences for cancer development (221, 223). Driver mutations confer a growth
advantage, and are likely to have been positively selected during cancer evolution. These mutations
have increasing clinical relevance due to the development of drugs that are able to specifically target
aberrant proteins that are expressed as a consequence of the gene mutation. Many examples of this are
now in clinical practice, most effectively illustrated by somatic mutations in BRAF and EGFR in
melanoma and non-small cell lung cancer, respectively (226). BRAF inhibitors such as vemurafenib
and EGFR inhibitors such as gefinitib are now in routine clinical practice for melanoma and non-
small cell lung cancers that harbour mutations in the respective genes (227, 228). By contrast,
19

passenger mutations do not confer a growth advantage. An ongoing challenge is to distinguish driver
mutations from passengers, particularly within the context of different cancer types and background
mutation rates (229).
In HGSC, the frequency of recurrent somatic point mutations in driver genes is low relative to other
cancer types such as lung (230, 231), with the exception of TP53 mutations which are apparent in
almost all HGSC (described below). Somatic mutations in BRCA1/2 were observed in 7% of tumours,
adding to the 17% rate of germline mutation (see below). Seven other significantly mutated genes
were identified in the The Cancer Genome Atlas (TCGA) study, but only in 2-6% of HGSC samples
(230). The low frequency of recurrent somatic driver mutations has implications for precision
medicine in HGSC, and is likely to be a contributory factor to the lack of efficacy of molecularly
directed therapies targeting single point mutations in HGSC (232).
1.4.2 TP53 mutations in HGSC 1.4.2.1 p53 dysfunction is ubiquitous in HGSC
TP53, encoding the tumour suppressor protein p53, is the most common somatically mutated gene in
human cancer (233, 234). The loss of function of p53 has a variety of effects including disrupted cell
cycle regulation, DNA replication and apoptosis (184). In EOC, studies into the frequency and clinical
relevance of p53 dysfunction were initially hampered by inconsistent study design, heterogeneity,
technical limitations and reliance on p53 immunostaining as a surrogate marker for TP53 mutation
(235). More recently, a study of 123 HGSC patient samples demonstrated a TP53 mutation rate of
96.7% (236). In the four mutation-negative HGSC samples, three showed evidence of p53
deregulation, indicating that p53 dysfunction is almost ubiquitous in HGSC. However, in contrast to
previous studies, TP53 mutation did not appear to be prognostic or predictive in HGSC. These
findings were subsequently validated by the TCGA, which reported that 96% of HGSC harboured
TP53 mutations (230). Subsequent detailed histological evaluation of the 14 cases in the TCGA cohort
without TP53 mutations concluded that 13 of the cases demonstrated characteristics that were not
consistent with HGSC (237). Taken together, the absence of molecular alterations of TP53 is
essentially inconsistent with the diagnosis of HGSC.
1.4.2.2 Causes and consequences of p53 dysfunction
p53 is a stress response protein that functions primarily as a tetrameric transcription factor, which
regulates a large number of key processes in response to cellular insults such as DNA damage, UV
light, and oncogene activation (233). These signals impinge on p53 and its negative regulator, MDM2,
ultimately leading to increased levels of activated p53. Depending upon the cellular context, one of
several responses is triggered, including cell cycle arrest, senescence, differentiation or induction of
20

an apoptotic cascade, via binding of activated p53 to binding sites in regulatory regions of target
genes. Therefore dysfunction of p53 can lead to dysregulation of many key cellular processes (238).
In cancer, multiple mechanisms have been implicated in causing p53 dysfunction (233). The most
common is via amino-acid changing mutations that affect the DNA binding domain of p53. Other
causes include viral infection and expression of inhibitory proteins, mis-localisation of p53, and
alterations of p53 regulators such as MDM2/4 and p14ARF. In HGSC, the majority of p53 dysfunction
is as a result of somatic mutations (230, 236). TP53 is frequently inactivated by missense mutations
that occur in hotspots between exons 4 and 8. Other types of mutations that have been detected by
large scale sequencing studies include frameshift deletions or insertions, nonsense and splice
mutations (236, 239).
The consequences of TP53 mutation can broadly be classified into three groups:
1. Dominant-negative effect – most missense mutations produce a full length mutant p53
capable of inhibiting the function of the wild-type protein encoded by the second normal
allele. This effect is achieved by oligomerization of the mutant and wild-type proteins,
forming a heterotetramer that is defective in sequence-specific binding to p53 target genes
(240, 241).
2. Loss of function – partial or complete loss of function that prevents the binding of p53 to
target genes. Most commonly seen with truncating, splicing and nonsense mutations, but can
also be seen with some missense mutations (242).
3. Gain of function effect – several mutations have been shown to confer mutant p53 with new
functions that are independent of wild-type p53, supported by numerous experimental models
(238, 243, 244). Most gain-of-function properties are believed to stem from binding of mutant
p53 to proteins such as transcription factors that alter cellular activity. This may have
significant clinical implications in tumour initiation and progression (238).
Approximately two thirds of TP53 mutations in HGSC are missense and the remainder nonsense (230,
236). Missense mutations are usually manifest as dense nuclear immunohistochemical staining of
sections, whereas nonsense mutations are associated with complete loss of staining arising from non-
sense mediated decay of mutant mRNA and degradation of unstable, truncated protein (245, 246).
Approximately 3% of TP53 mutations give rise to diffuse cytoplasmic staining of mis-localised
protein (247).
1.4.2.3 TP53 mutation is an early event in the pathogenesis of HGSC
The prevalence of TP53 mutation in HGSC has led to the hypothesis that it is a key driver in the
pathogenesis of HGSC (74, 236). Additional lines of evidence are emerging to support this hypothesis.
21

As mentioned above, TP53 mutations have been identified in STIC lesions, the proposed precursor to
HGSC (75). Even earlier than the development of STIC, small foci of intense p53 immunostaining
have been identified in histologically normal fallopian tube epithelium from women with germline
BRCA1/2 mutations (74). These foci, termed “p53 signatures,” have been molecularly analysed and
TP53 mutations were detected in 8 of 14 samples.
Experimental evidence for the role of TP53 mutation in HGSC pathogenesis is also emerging.
Genetically engineered mouse models of HGSC incorporating Tp53, Brca1/2 mutations and Pten
deletions have been developed, effectively re-capitulating common molecular alterations identified in
human HGSC (84). Interestingly, Tp53-/-;Pten-/- mice developed STIC lesions, but none progressed
to invasive tumours, suggesting that additional events are required for fallopian tube cells to transform
into HGSC .
In summary, these findings indicate that TP53 mutation is a key molecular feature of HGSC, and
suggest that TP53 mutation is an important early event in HGSC pathogenesis. Studies are ongoing to
elucidate the additional molecular changes required for malignant transformation, as well as potential
novel therapies that may restore p53 function as a therapeutic target in HGSC (248, 249).
1.4.3 The role of the homologous recombination (HR) pathway in HGSC Two genes associated with early onset, familial breast and ovarian cancer, Breast Cancer 1, early
onset (BRCA1) and Breast Cancer 2, early onset (BRCA2) were discovered more than 20 years ago
(250, 251). BRCA1 and BRCA2 play key roles in the process of homologous recombination (HR), a
form of DNA repair that recognises and repairs DNA double stranded breaks (DSB) (252). The
association between heterozygous germline mutations in BRCA1/2 and risk of breast and ovarian
cancer is now well established (70). The following sections will cover the role of HR in DNA repair,
the clinical implications associated with defects in HR, and recent progress and challenges associated
with targeting HR in HGSC.
1.4.3.1 Role of HR in DNA repair
As described in Section 1.4.1, DNA damage occurs regularly in cells as a result of exposure to
endogenous and exogenous mutagens such as tobacco smoke, radiation and reactive oxygen species
(253). In response to DNA damage, complex and highly co-ordinated processes are triggered to
recognise and repair DNA, as well as activate cell cycle checkpoints to allow time for cells to repair
DNA before cell division occurs (253). These processes ensure genomic integrity, and when they fail
this can lead to accumulation of mutations in genes that can promote cancer development (184).
22

Approximately half of all HGSC have evidence of mutational disruption in genes involved in the HR
pathway (230). HR is a key aspect of DNA repair, and is involved in the repair of DSB, a severe form
of DNA damage that if left unrepaired results in cell death (252). The HR process is initiated
following recognition of a DSB by ATM and ATR, kinases that phosphorylate downstream targets
including CHEK2, p53, BRCA1 and H2AX. BRCA1, together with BARD1 and BRIP1, act as a
scaffold that organises the remaining proteins to the site of repair. BRCA1 also recruits the MRN
complex, consisting of MRE11, RAD50 and NBS1. Together with CtBP-interacting protein (CtIP)
and exonuclease 1 (EXO1), the MRN complex resects the DNA ends to form single strand 3’
overhangs. The single-stranded DNA overhang is rapidly coated with replication protein A (RPA),
which prevents it from being degraded. This recruits the ataxia-telangiectasia and Rad3-related
(ATR)–interacting protein (ATRIP) complex, which signals via phosphorylation of CHK1 to induce S
and G2 arrest. RPA also recruits BRCA2, which together with PALB2, loads RAD51 onto RPA-
coated DNA with the assistance of RAD51B, RAD51C and RAD51D. The RAD51 nucleoprotein
filament then invades an unbroken homologous DNA strand, typically the sister chromatid, in a
process called strand invasion. The invading strand is extended by DNA polymerase, using the sister
chromatid as a template for error-free repair (252-256). To complete HR, the newly synthesized strand
can dissociate to anneal to the other end, resulting in a non-crossover outcome with no change to the
template DNA. Alternatively, two independent strand invasions from both DSB ends, followed by
simultaneous DNA synthesis and annealing can result in a double Holliday junction (HJ). These HJs
can be cleaved by one of several HJ resolvases, yielding in either a non-crossover or a crossover
outcome (253). HR is therefore a highly accurate form of DNA repair, and although it only repairs a
small proportion of DSBs, HR is crucial as it is also involved with the processing of interstrand
crosslinks (ICLs) that are created by agents such as platinum chemotherapy (257).
1.4.3.2 The clinical implications of defects in the HR pathway
Defects in the HR pathway have several important clinical implications for familial risk, likelihood of
response to therapy, emergence of resistance and use of novel targeted agents.
Hereditary breast and ovarian cancer
The frequency of heterozygous germline mutations in BRCA1/2 in EOC has now been clearly defined.
A large population based study in Australia found that 14% of EOC patients harboured a germline
mutation in BRCA1 or BRCA2 (258). In HGSC patients, the germline mutation rate was 17%. Other
studies have obtained similar results (230, 259-262). Importantly, approximately half of the patients in
the Alsop study did not have a family history that was suggestive of a hereditary cancer syndrome.
These results indicate that family history is not a reliable screening tool for referral to a familial
cancer clinic for testing of germline BRCA1/2 mutations. Many countries including the US, UK and
Australia have now altered their guidelines to recommend all women aged less than 70 diagnosed
23

with non-mucinous epithelial ovarian cancer be referred to a familial cancer clinic for genetic
counselling and possible testing for germline BRCA1/2 mutations (263-265).
The majority of BRCA1/2 mutations are frameshift insertions or deletions; mutations have been
identified in all functional domains of BRCA1/2 genes, and can be associated with varying risks of
breast or ovarian cancer (266). The estimated ovarian cancer risks ranges from 36-63% for BRCA1 and
10-27% for BRCA2 mutation carriers (267, 268). Due to the lack of effective screening for ovarian
cancer, prophylactic BSO is strongly recommended once childbearing is complete or by age 40 (269,
270). Risk-reducing BSO is associated with a significantly lower risk of ovarian cancer, breast cancer
and all-cause mortality (5, 270). The timing of prophylactic BSO is often affected by age, fertility and
concerns regarding premature menopause (271), however the risk of detecting occult malignancy at
the time of prophylactic surgery increases with age, particularly for BRCA1 mutation carriers (270).
More recently, due to concerns regarding surgically induced menopause as well as evidence
supporting FTSEC as the precursor for HGSC, there is support for a staged approach to risk reducing
surgery involving bilateral salpingectomy after childbearing followed by bilateral oophorectomy
closer to the age of natural menopause (272). This strategy for risk reduction remains an active area of
debate given the lack of prospective evidence (273, 274), and studies are underway to investigate the
appropriateness of this approach (275).
While BRCA1 and BRCA2 mutations account for the majority of hereditary ovarian cancer, more
recent studies have identified other germline mutations affecting genes in the HR pathway that confer
risk of breast and/or ovarian cancer (276-282). Work is ongoing to clearly define the risk of breast and
ovarian cancer due to germline mutations in genes such as BARD1, BRIP1 and PALB2 (283). Routine
testing of these additional genes in the HR pathway has not yet been established, and there are no
current management guidelines to support decision making for affected individuals (284).
Somatic and epigenetic alterations in the HR pathway
Somatic mutations and epigenetic alterations affecting genes in the HR pathway occur in 10-15% of
HGSC cases (230, 280). Mutations in Fanconi anaemia genes, DNA damage response genes such as
ATM, ATR, CHEK1, CHEK2, and other core HR genes such as RAD50, RAD51 and RAD51C have all
been observed (230, 231). These somatic alterations generally result in a similar drug response patterns
to that seen with germline mutations (280, 285), although there are notable exceptions. For example,
BRCA1 promoter hypermethylation, which downregulates BRCA1 expression, has been proposed as a
mechanism of HR deficiency (286, 287). However, in contrast to BRCA1 mutation, BRCA1
hypermethylation has not been associated with improved OS or platinum sensitivity (230, 288).
Therefore, epigenetic downregulation of BRCA1 expression may have a less profound effect on HR
than inactivating mutations in BRCA1. Alternatively, the consequences of BRCA1 methylation may be
24

more readily circumvented in tumour cells in response to therapy than mutational loss of function
(230, 231). The almost complete mutual exclusivity of BRCA1/2 mutation and BRCA1 methylation
extends only partially to other members of the HR pathway. Where mutation in individual HR genes
occur at low frequency it is difficult to assess whether a lack of mutual exclusivity with other pathway
members is significant (289). For others such as PTEN loss or EMSY amplification, which are
relatively common, a lack of mutual exclusivity with BRCA1/2 mutation or methylation suggests that
these genes are not functionally equivalent to BRCA1/2 loss (230, 290). In addition, EMSY
amplification has been associated with worse clinical outcome, suggesting that it may not result in a
HR deficient phenotype in HGSC (291).
Clinical phenotype of HR-defective HGSC – improved OS, improved responsiveness to platinum
chemotherapy
Patients with HR deficient tumours appear to have a distinct clinical phenotype of high grade serous
histology, repeated platinum sensitivity, and improved PFS and OS (230, 258, 262, 292, 293). HGSC
patients with germline BRCA1/2 mutations also respond more consistently than non-carriers to other
non-platinum chemotherapy agents (294, 295). However, recent long term follow up data of over 2,000
EOC patients indicates that the improvement in OS associated with germline mutation may not persist
after 5 years in BRCA1 carriers (296).
Whilst the prognostic significance of HR deficiency in HGSC is in part due improved
chemosensitivity, other independent factors are also likely to contribute. For example, BRCA1
mutated tumours have been shown to harbour more tumour-infiltrating lymphocytes, and therefore
may be more immunogenic compared with HR-proficient HGSC (297-299). Consistent with these
observations, the C2-immunoreactive subtype of HGSC (discussed below in Section 1.4.5) is also
enriched for tumours with BRCA1 mutations (298). Multiple studies have demonstrated an association
between lymphocyte-rich tumours and longer PFS and OS, suggesting that the immune system may
influence the improved outcomes seen in BRCA1/2 mutated HGSC (300-303). The intra-tumoural
response seen in tumours with BRCA1 mutations may be associated with the higher number of
somatic mutations observed in germline BRCA1 mutated HGSC when compared with HR intact
tumours (231, 299).
Targeting HR deficient HGSC
BRCA1/2 mutation and other alterations in the HR pathway result in impaired DNA repair, and this
has been exploited though synthetic lethality associated with PARP-1 inhibition (304, 305). Loss of
PARP-1 function in BRCA-deficient results in the generation of replication-associated DNA lesions
due to error-prone DNA repair, leading to cell cycle arrest or cell death. No selective effect was seen
in cells with heterozygous BRCA1/2 mutations, indicating that PARP inhibitors are unlikely to have
25

an effect on normal cells (304). Recently, multiple clinical trials have demonstrated sensitivity of HR-
deficient HGSC to PARP inhibitors (306-309). However, the development of PARP inhibitors was
hampered by the publication of a large negative phase III clinical trial of iniparib combined with
carboplatin and gemcitabine in triple negative breast cancer (310). Iniparib was subsequently shown to
not have PARP inhibitory activity at physiological doses (311). More recently, results from a pivotal
clinical trial has led to the approval of olaparib in Australia and Europe for germline BRCA1/2
mutation carriers with recurrent ovarian cancer. The Study 19 demonstrated a non-statistically
significant trend to improved OS in olaparib compared to placebo treated germline BRCA1/2 patients
when given in the maintenance setting in recurrent EOC (309, 312, 313). Of note, significant cross over
occurred in the control and treatment arms post-trial and the study was not powered to detect an OS
benefit (314). Additional studies are underway to better understand the survival benefit associated with
PARP inhibition (SOLO-1 NIH Clinical Trial NCT01844986, SOLO-2 NIH Clinical Trial
NCT01874353).
The molecular mechanisms behind the clinical interaction of PARP inhibition and HR deficiency are
incompletely understood. Multiple aspects of PARP and HR biology have been proposed, including
inhibition of base excision repair, PARP1 trapping on DNA, impaired recruitment of BARD1-BRCA1
complex, and inhibition of PARP1-PolE mediated alternative end joining (315). BRCA1/2 status has
thus far been the most extensively studied predictive biomarker for PARP inhibitors in HGSC.
Platinum sensitivity has also been used as a surrogate for PARP inhibitor sensitivity (309, 316). Other,
more recent approaches to predicting patients who are likely to respond to PARP inhibitors include
gene expression profiling, IHC, assessment of mutational spectrum and targeted mutational profiling
of HR genes, which have all been evaluated in this context (279, 280, 317-319).
Large genomic deletions and loss of heterozygosity are typical of a HR deficient phenotype, as a
result of reliance on error-prone DNA repair pathways such as non-homologous end joining (320,
321). This pattern of DNA damage can be identified using genomic profiling, and has been
extensively investigated as a potential biomarker for a HR defective phenotype. Using SNP array
data, three quantitative measurements of these structural chromosomal aberrations have been
developed, including whole genome tumour loss of heterozygosity (LOH) (322), telomeric allelic
imbalance (TAI) (323), and large-scale state transitions (LST) (324). Genomic LOH has been shown to
correlate well with response to the PARP inhibitor rucaparib. In a phase II clinical trial of patients
with EOC, in women without BRCA1/2 mutations, tumours with genomic LOH had an overall
response rate of 32-40%, whereas those without LOH had an overall response rate of 8% (325). More
recently, studies have attempted to combine LOH, TAI and LST into a composite HR deficiency
(HRD) score in order to accurately identify patients that may respond to DNA damaging agents (326,
327). The clinical utility of the HRD score is being tested prospectively in multiple clinical trials
26

involving PARP inhibitors (328). A recent study of the PARP inhibitor niraparib as maintenance
therapy in recurrent ovarian cancer utilised this composite HRD score to predict for response (329).
Consistent with previous studies, a significant PFS benefit was noted in patients with BRCA1/2
mutations as well as patients deemed to be HRD according to the HRD assay. Unexpectedly, the
subgroup of patients that were not HR deficient as assessed by the HRD assay still appeared to have a
significant benefit in PFS – 6.9 versus 3.8 months. These findings suggest that using BRCA1/2
mutations and HRD scores may miss some patients who may benefit from PARP inhibitor therapy,
and ongoing research is required to identify the ideal predictive biomarker (330).
A limitation of current biomarkers of HR deficiency is that they are a static measure of HR function.
As discussed above, resistance to therapy is a key problem in HGSC. A well-studied mechanism of
resistance to platinum and PARP inhibitors involves intragenic (reversion) mutations in either
BRCA1/2 that restore BRCA1/2 protein and HR function (231, 331-335). However, the cumulative
defects that occurred in the cancer genome as a result of the original HR deficiency do not reverse and
therefore these tumours are likely to be assessed as HR deficient based on the biomarkers such as the
HRD score (322). More recently, use of markers such as RAD51 and geminin assessed by IHC or
immunofluorescence has been proposed, but further functional and clinical validation is required (336,
337). Furthermore, functional biomarkers of HR function are often complex to implement, may
require ex vivo DNA damage of isolated tumour tissue, and are not well suited to many clinical
settings. Understanding how resistance to PARP inhibitors develops, including cross-resistance
between chemotherapy agents, will help to integrate the use of PARP inhibitors into clinical practice.
Rational combinations with chemotherapy or other targeted agents may increase efficacy or overcome
resistance to PARP inhibitors (338), although concerns regarding potential overlapping toxicities need
to be considered (339).
1.4.4 Structural variants and copy number alterations In addition to somatic point mutations and small insertions and deletions (indels), cancers are also
characterised by large-scale structural variants that include somatic copy number abberations (SCNA)
and gene rearrangements (340). Similar to somatic mutations, SCNA may be driver events that
contribute to oncogenesis, or may be random alterations that accumulate during the oncogenic process
(226). Integrated genomic methods have enabled the analysis of SCNA across multiple types of
cancers. Specific patterns have emerged, identifying similarities and differences within and between
tumour types (341). These results suggest that there is likely to be significant intra-cancer
heterogeneity, as well as shared molecular events between cancer types (341).
Chromosomal rearrangements can lead to cancer development through dysregulation of normal genes
or generation of novel gene fusions that direct or maintain oncogenesis (226). One of the first
27

examples of chromosomal rearrangement to be described was identified in chronic myeloid
leukaemia, where a translocation between chromosomes 9 and 22 resulted in the fusion of two genes –
BCR and ABL1 (342). The resultant fusion protein leads to a constitutively active Bcr-Abl tyrosine
kinase that results in uncontrolled growth and malignant transformation of haematopoietic cells (343).
This discovery was also notable for the fact that it led to the development of imatinib, the first Bcr-
Abl tyrosine kinase inhibitor used in the treatment of CML (344). Imatinib was one of the first types
of molecularly targeted therapy, a paradigm that has since revolutionised cancer research and care
(345).
HGSC is characterised by extensive genomic instability, featuring widespread SCNA and
chromosomal rearrangements (230, 231, 341, 346). The underlying mechanism for the development of
genomic instability has yet to be clearly defined, although it is likely that TP53 mutations are a
contributory factor, given that cancers which have high levels of SCNA are enriched for TP53
mutations (341). For example, basal-like breast cancers and uterine serous cancers both resemble
HGSC molecularly in that they also have a high prevalence of somatic TP53 mutations and SCNA
(324, 347, 348). These types of tumours have therefore been classified as “C” class, defined by
multiple recurrent chromosomal gains and losses and TP53 mutations (341). It is possible that
aberrations in the HR pathway also contribute to the high levels of SCNA, given that pre-clinical
models of BRCA1 or BRCA2 loss result in chromosomal instability, SCNA and aneuploidy (84, 349-
351). Structural variants are also more common in HGSC with BRCA1 inactivation (231). Similar
observations have been made in basal-like breast cancer, where HR pathway alterations are also
common (324, 347). By contrast, BRCA1/2 mutations are less common in uterine serous cancer (348),
although recent studies of small numbers of patients have suggested an association between uterine
serous cancers and germline mutations in DNA repair genes (352-354).
Recurrent copy number variants are common in HGSC and contribute to the underlying biology of
HGSC (230, 231, 346, 355). Focal amplification of known oncogenes including MYC, MECOM and
CCNE1 (discussed in further detail in Section 1.5) have been described, as well as focal deletions in
tumour suppressor genes such as PTEN, RB1 and NF1 (230, 231). Structural variants such as gene
rearrangements are likely to also play a role in driving disease recurrence and resistance to
chemotherapy (231, 356). For example, upregulation of the ABCB1 gene, encoding the multi-drug
resistant protein 1 (MDR1), has been observed in HGSC recurrence samples (231). Whole genome
sequencing studies of recurrent HGSC samples have identified a novel fusion of ABCB1 with
SLC25A40, resulting in high expression of MDR1, an efflux pump for several chemotherapies
including paclitaxel. Clinical data from HGSC patients with this fusion event demonstrated a lack of
response to MDR1 substrates, supporting this structural variant as a potential resistance mechanism
(231).
28

1.4.5 Gene expression profiles Genome-wide gene expression profiling became an important part of characterisation of human
cancers following the development of microarray technology (226). Initial studies in breast and lung
cancer identified distinct subsets based on hierarchical clustering of gene expression (357-359).
Subsequent analyses were able to associate the different gene expression subsets with clinical
outcomes and behaviour.
In HGSC, four molecular subtypes based on gene expression profiling studies have now been
established and validated across different cohort studies (230, 360-363). These subtypes labelled
C1/mesenchymal, C2/immune, C4/differentiated and C5/proliferative, each have distinct molecular
features and clinical outcomes that are consistent across different cohorts (361, 364). The
C1/mesenchymal subtype is characterised by high expression of genes associated with reactive
fibroblasts and matricellular deposition, and morphologically by extensive stromal infiltration
(desmoplasia) in the surrounding tumour microenvironment (230, 360). The C2/immune subtype is
notable for a T cell infiltrate in the epithelial fraction of the tumour, with high expression of T-cell
chemokine ligands CXCL11 and CXCL10 and the receptor CXCR3 (230, 298). The C2 subtype is also
generally associated with a favourable response, and enriched for BRCA1 altered tumours due to
germline and somatic mutations, as well as methylation (298). The C4/differentiated subtype show
increased expression of ovarian tumour markers MUC1 and MUC16, as well as expression of the
secretory fallopian tube marker SLPI. C5/proliferative subtype is characterised by overexpression of
transcription factors involved in stem cell expansion, including MYCN, HMGA2, SOX11 and low
expression of ovarian tumour markers such as MUC1 and MUC16. The C5 subtype is typically
associated with a poor clinical outcome compared to C2 and C4 (360, 361).
Despite clear associations with differing biology and clinical outcome, molecular subtyping of HGSC
based on gene expression has yet to make a significant impact in the management of HGSC. Recent
work has focused on adapting a subtype classifier using either a restricted gene set or via IHC that can
be translated into the diagnostic setting (365). Attempts at targeting specific molecular subtypes have
also been made in preclinical studies, and subtype specific clinical trials are in development (362, 366).
1.4.6 Tumour heterogeneity The development of improved genomic capabilities has led to the characterisation of molecular
heterogeneity that exists between patients and within patients in a number of different cancers such as
breast, colorectal, renal and pancreatic (367-369). In HGSC, studies in small numbers of patients have
utilised genomic techniques to analyse the degree of heterogeneity between primary and metastatic
29

deposits (231, 370-372). Consistently across these studies, a significant degree of genetic heterogeneity
was observed, particularly in SCNA. More recently, a study of 135 metastatic deposits from 17
different patients correlated the degree of heterogeneity with clinical outcome (373). Cases with high
heterogeneity had poorer PFS and OS compared with those that had low heterogeneity, suggesting
that this may influence treatment response and acquisition of drug resistance. How temporal and
spatial heterogeneity impacts the clinical management of HGSC as well as other cancers is not yet
clear, although it is likely that heterogeneity influences the efficacy of molecularly targeted therapy
(374). Understanding what drives tumour heterogeneity is an ongoing challenge, as is identifying
mutations that may be more susceptible to inhibition with targeted therapies (375, 376).
1.5 CCNE1 amplification To not confuse earlier knowledge of CCNE1 in HGSC with observations I made during my thesis, I
have confined commentary in this section of the review to that information apparent when I
commenced my studies.
As discussed above, SCNA are a feature of many cancers including HGSC. The 19q12 locus,
incorporating CCNE1, has been reported to be recurrently amplified in multiple cancer types
including breast, gastric, bladder and ovarian (355, 377-380). In HGSC, studies have demonstrated that
gain of 19q12 was associated with poor clinical outcome (355, 381-383).
Functional analysis of the 19q12 locus has identified multiple potential drivers of this amplicon
including URI (384, 385), POP4, PLEKHF1, and TSZH3 (386). CCNE1 has been identified as a
potential driver of this amplicon in HGSC, and this will be described in detail below in Section 1.5.2
(Etemad 2010, Nakayama 2011; Section 1.5.2) (387, 388). Other studies have identified URI, located
adjacent to CCNE1, as an additional driver of the 19q12 amplicon in HGSC (384, 385). A recent study
using in situ hybridisation (ISH) techniques reported that the majority of HGSC cases with CCNE1
amplification also have URI amplification (389), and it appears likely that both CCNE1 and URI
amplification contribute to the molecular impact of the 19q12 amplicon. It has been suggested that the
proximity of CCNE1 and URI at 19q12 may provide a unique selective advantage in that CCNE1
amplification promotes dysregulated cell cycle progression, while URI promotes cell survival and
resistance (384).
1.5.1 Cyclin E1 function and role in cancer Cyclin E1 functions as a key regulator of the G1/S cell cycle transition. In response to mitotic signals,
D-type cyclins complex with cyclin dependent kinases (CDK) 4 and 6, resulting in phosphorylation of
Rb. Phosphorylation of Rb results in release of the E2F complex, leading to the activation of the
30
cyclin E1-CDK2 complex that in turn also phosphorylates Rb in a positive feedback loop to facilitate
G1 to S phase transition (390). In normal cells, cyclin E1 accumulates at the G1/S phase boundary and
is degraded as the cell passes through S phase. This periodicity is regulated by cell-cycle dependent
transcription and post-translational control by ubiquitin-dependent proteolysis (391).
Although CDK2 is the main kinase partner for cyclin E1, studies have shown that other CDKs can
also bind to cyclin E1 (392). For example, Cdk2-/- mice are viable, with evidence of Cdk1 binding to
cyclin E1 to promote G1 to S phase transition (393). There may also be tissue specific roles such as
the regulatory role of cyclin E1 in neurons by binding and inactivating Cdk5 (394). Cyclin E1 also has
kinase independent functions such as centriole duplication, centrosome separation and endoreplication
(390, 391, 395). Double cyclin E1/E2 knockout mice die in utero due to impairments in endoreplication
of trophoblast cells which are critical in placental attachment and provision of nutrients to developing
embryos. However, endoreplication is unaffected in Cdk2 knockout mice, suggesting that this role of
cyclin E1 may be kinase independent (395).
The role of cyclin E1 in oncogenesis has been directly studied in cancers such as lung and breast
cancer (396, 397). Over-expression of cyclin E1 in the mammary glands of pregnant and lactating mice
resulted in hyperplasia and carcinomas in greater than 10% of mice (396). Quantification of cyclin E1-
cdk2 kinase activity in mammary carcinomas demonstrated a 13- to 22-fold increase in kinase activity
in the transgenic tumours relative to the normal mammary gland. This suggests that cyclin E1-cdk2
activity is a contributing factor to mammary tumourigenesis. By contrast, cyclin E1 mutants that were
defective in forming an active kinase complex with Cdk2 were still able to induce malignant
transformation in rat embryo fibroblasts in co-operation with Ha-Ras (398). This suggests that kinase
independent functions of cyclin E1 may contribute to its oncogenic activity.
31

Figure 1.2. Cyclin E1-CDK2 functions. Adapted from Caldon and Musgrove, Cell Division 2010 Proteolytic cleavage of cyclin E1 to a low molecular weight (LMW) isoform has also been implicated
in breast cancer as a key prognostic marker (399, 400). LMW cyclin E1 isoforms are generated by
NH2-terminal elastase cleavage of the 50kDa full length cyclin E1 protein, resulting in 34-49kDa
isoforms (401). LMW cyclin E1 isoforms are tumour specific, and are resistant to endogenous CDK
inhibitors p27 and p21 (402). LMW cyclin E1 has also been shown to bind more efficiently to CDK2
in breast cancer models, and through increased CDK2 activity, drive cells through the G1/S
checkpoint resulting in genomic instability and tumourigenesis (403, 404). Expression of LMW
isoforms of cyclin E1 have also been observed in ovarian cancer (405), melanoma (406), and colorectal
cancer (407), although the relationship with clinical outcomes is less well established. Ongoing studies
are attempting to investigate ways of targeting LMW isoforms of cyclin E1 in breast cancer (408, 409).
1.5.2 CCNE1 amplification in HGSC CCNE1 amplification is observed in many different cancers (Figure 1.3), particularly in HGSC where
the frequency has been reported to be 20% in the TCGA dataset (230, 410, 411). CCNE1 amplification
has also been shown to affect clinical outcome in HGSC (355, 387, 388). An integrated genome-wide
DNA copy number and expression analysis of primary HGSC samples collected as part of the
Australian Ovarian Cancer Study (AOCS), has demonstrated that amplification of 19q12,
incorporating CCNE1, was strongly associated with platinum resistance and reduced OS and PFS in
HGSC (355). HGSC with high level amplification (defined as ≥ 8 copies as assessed by quantitative
PCR) was associated with poor clinical outcome, with a mean PFS of 10.7 months compared to 18.9
32

months in those cases without CCNE1 amplification (387). Systematic knockdown of the individual
genes within the 19q12 locus demonstrated that only knockdown of CCNE1 resulted in amplicon-
dependent reduction in cellular proliferation, increased apoptosis and induced G1 cell arrest in cell
lines with high level amplification of 19q12 (387).
Figure 1.3. Frequency of CCNE1 amplification in primary tumours. Data from cBioportal (http://www.cbioportal.org), accessed in November 2016 Focal high level amplification of CCNE1 correlates well with overexpression of cyclin E1 mRNA and
protein (230, 387), although one study observed that 10 out of 22 (45%) HGSC with CCNE1
amplification did not have high protein expression, as assessed by IHC (412). The authors proposed
various reasons for CCNE1 gene amplification without corresponding protein expression including
post-translational repression or increased protein degradation by ubiquitination. By contrast, another
study using a different ISH probe and the H-score IHC scoring system only identified 3 out of 30
(10%) CCNE1 amplified cases without high protein expression (389).
A proportion of HGSC are noted to have cyclin E1 protein over-expression in the absence of copy
number gain (389, 412). In addition to gene amplification, other possible mechanisms contributing to
cyclin E1 over-expression include disruption of the regulated turnover of cyclin E1. For example,
mutations in FBXW7, a subunit of the E3 ubiquitin ligase that targets cyclin E1 for degradation occur
in a number of cancer types (390, 413, 414). Mutations of FBXW7 are rare in HGSC, although they are
found in uterine serous cancer where 57% of tumours are noted to have cyclin E1 over-expression due
33
to either CCNE1 amplification (6 of 23 tumours, 27%) or FBXW7 mutation (7 of 23 tumours, 30%)
(230, 348, 415).
A recent study utilised fluorescent in situ hybridization (FISH) to characterise the CCNE1 copy
number in a small cohort of STIC and HGSC (416). Of the 19 cases where there were co-existing
STIC and HGSC, 22% of cases demonstrated CCNE1 gain or amplification, with 100% concordance
between the two types of lesions (P < 0.001). Other studies also demonstrated similar rates of cyclin
E1 over-expression in STIC lesions (417). The same group of investigators also characterised CCNE1
amplification in uterine serous cancer and endometrial intraepithelial carcinoma, and observed high
concordance rates analogous to HGSC (418). These findings support the hypothesis that CCNE1
amplification is an early event contributing to development of HGSC and uterine serous cancer. This
has relevance for targeting CCNE1, given that early events are preferable therapeutic targets (419).
Such actionable “truncal” aberrations are more likely to be ubiquitous, clonally dominant driver
events that are present in all tumour cells and therefore less susceptible to sampling bias, and more
likely to significantly influence clinical outcome if successfully targeted (375).
Although CCNE1 amplification has been observed in STIC lesions, additional events are likely to be
required for malignant transformation, as demonstrated by a recent study which over-expressed cyclin
E1 in immortalised FTSEC with mutant TP53 (412). Although these cells acquired increased
proliferation and anchorage independent growth, they did not undergo malignant transformation.
Additional molecular events are likely to co-operate with cyclin E1amplification/over-expression and
mutant TP53 to result in malignant transformation, and this forms part of the studies described in
Chapter 3 of my thesis.
1.5.3 Targeting CCNE1 amplification Targeting of cyclin E1 has been studied in other cancer settings such as breast and lung cancer (408,
420, 421). Inhibition of cyclin E1, CDK1 and CDK2 with gene suppression and small molecule CDK
inhibitors resulted in marked apoptosis and tumour growth inhibition an in vivo model of lung cancer
(420). Similarly, breast cancer cell lines with CCNE1 amplification were also sensitive to CDK2
inhibition in vitro and in vivo (421). Despite these promising pre-clinical results, and the clear role for
cyclin E1 in many human cancers, there have been no clinical trials selecting patients on the basis of
CCNE1 amplification.
CCNE1 amplification has been reported to be mutually exclusive with defects in the HR pathway
(230, 422). An intact HR pathway in most CCNE1 amplified cancers may explain the apparent
resistance or lack of sensitivity to platinum chemotherapy (230), since the high-fidelity HR pathway
can repair the double stranded DNA breaks that are sustained following platinum exposure. Similarly,
34

the newly developed PARP inhibitors are also unlikely to be of any benefit to patients with CCNE1
amplified HGSC. It is possible that the dysregulated cell cycling, genomic instability and high levels
of DNA damage as a consequence of CCNE1 amplification can only be tolerated in cells with an
intact HR pathway (423). This concept of synthetic lethality where alteration of either gene alone is
compatible with cell viability but alteration of both genes leads to cell death is a potential strategy to
specifically inhibit cancer cells with an improved therapeutic window (424). CCNE1 amplified HGSC
may therefore be vulnerable to direct or indirect targeting of the HR pathway. For example,
proteasome inhibitors have been identified as potential indirect inhibitors of HR (425), and therefore
may be a novel strategy to targeting CCNE1 amplified HGSC. Proteasome inhibitors such as
bortezomib are a key focus of the studies described in Chapter 4 of this thesis.
An ongoing challenge to targeting CCNE1 amplification is defining the cut-off for amplification that
may predict for response to targeted therapies. This is analogous to the scenario observed with HER2
in gastric cancer, where studies have shown that tumours with both HER2 amplification and high
expression responded best to trastuzumab, a monoclonal antibody targeting HER2 (426). By contrast,
tumours with HER2 over-expression in the absence of increased copy number as assessed by a FISH
assay did not demonstrate improved clinical outcomes (427). It is unclear whether similar results will
be seen in relation to CCNE1 amplification in HGSC.
The relationship between CCNE1 amplification and cyclin E1 protein over-expression has important
implications for patient selection in the clinical setting. Previous work has shown that CCNE1
amplification is more strongly associated with poor OS and PFS than over-expression suggesting that
copy number may be the preferred selection tool (387). Furthermore, with the increasing use of
molecular profiling in the clinical setting, strategies to accurately assess copy number from next
generation sequencing data have now been developed and validated (428-430). Use of a sequencing
platform to screen patients in the clinical setting has the potential advantage of identifying other
genetic aberrations that can direct patients towards other molecularly targeted therapies. However,
studies investigating the clinical utility of molecular profiling using targeted sequencing panels in
gynaecological cancers such as HGSC have not resulted in dramatic improvements in outcome, with
significant limitations in terms of costs and access to targeted therapies (431, 432).
1.5.4 CDK inhibitors The most direct method of targeting cyclin E1 should be through inhibition of CDK2 activity (387).
Small molecule CDK inhibitors have been in development for more than twenty years (433), Table 1.2
lists examples of different CDK inhibitors and their inhibitory concentrations against various CDKs.
First generation CDK inhibitors, such as flavopiridol and roscovitine, were non-specific kinase
inhibitors, targeting multiple CDKs as well as other kinases (433-436). Minimal clinical activity across
35

a broad range of solid and haematological malignancies was observed with first generation CDK
inhibitors, and none remain in clinical trial (437).
IC50 values against CDKs
Drug CDK1 CDK2 CDK4 CDK5 CDK7 CDK9 Other
Flavopiridol 30nM 170nM 100nM 170nM ND 20nM
Roscovitine 330nM 220nM >10uM 270nM 800nM 230nM
Dinaciclib 3nM 1nM ND 1nM ND 4nM CDK12:60-100nM
SNS-032 480nM 48nM >900nM 340nM 62nM 4nM
Palbociclib >10uM >10uM 9-11nM >10uM ND ND CDK6: 15nM
Abemaciclib >1uM >500nM 2nM ND 300nM 57nM CDK6: 5nM
Ribociclib >100uM >50uM 10nM ND ND ND CDK6: 39nM
Table 1.2. IC50 values against CDKs for selected CDK inhibitors. Adapted from Asghar et al, Nature Reviews Drug Discovery 2015.
Second generation CDK inhibitors were designed to increase selectivity for certain CDKs and/or
increase overall potency (436, 438). Although pre-clinical activity across a range of cancers has been
observed, most have not progressed beyond phase I clinical trials because clinical activity in solid
cancers has been quite limited (437). For example, a randomised phase II trial in advanced breast
cancer of dinaciclib, a potent CDK1, 2, 5 and 9 inhibitor, was ceased at interim analysis due to
inferior responses compared to the control arm, capecitabine (439).
More recently, responses have been observed with selective CDK4/6 inhibitors in breast cancer.
Palbociclib has been approved for use in combination with hormone therapy for oestrogen receptor
positive breast cancer, with significant improvement in PFS observed in randomised clinical trials
(440, 441). Similar results have been seen with another CDK4/6 inhibitor, ribociclib (442). Although a
clearly defined predictive biomarker (aside from oestrogen receptor status) has yet to be defined for
CDK4/6 inhibitors (443), the results from these clinical trials provide some insights that can be
incorporated into the development of other CDK inhibitors.
Designing selective CDK inhibitors, understanding the pharmacokinetics, developing predictive
biomarkers and investigating potential synergistic drug combinations are all challenges that require
ongoing studies (437). This sets the scene for studies described in Chapter 3 of my thesis, focused on
CDK2 inhibition of CCNE1 amplified HGSC.
36
1.6 Thesis Aims and Study Design This review has focused on the clinical features and management of HGSC, as well as the current
understanding of the molecular characteristics of HGSC. Despite the advances in knowledge and
numerous clinical trials, the outcome for patients with HGSC remains poor, and has stagnated
somewhat over the last three decades. There remains a need to develop novel biomarker driven
therapies that could improve the survival for patients with HGSC. Cyclin E1 amplification represents
a potential novel biomarker in HGSC, and the focus of my thesis is to develop pre-clinical evidence
for strategies that may be clinically applicable to patients with CCNE1 amplified HGSC.
The first aim of the study was to investigate the role of CDK2 inhibition in CCNE1 amplified HGSC
(Chapter 3). A gene suppression approach utilising short-interfering and short-hairpin RNA
interference as well as CDK2 small molecule inhibitors were used to assess the dependency of
CCNE1 amplified HGSC to CDK2 inhibition in vitro and in vivo. A high throughput compound
screen was undertaken in an unbiased fashion to identify potential drug combinations that could
selectively target CCNE1 amplified HGSC. In addition, cell lines resistant to CDK inhibitors were
generated in order to explore potential mechanisms of resistance.
The second aim was to explore the effect targeting HR in CCNE1 amplified HGSC using proteasome
inhibitors (Chapter 4). I also describe the challenges in generating xenografts from CCNE1 amplified
HGSC cell lines, and the steps taken to overcome these challenges.
In the final chapter, a summary of the major findings from the study as well as future directions will
be discussed.
37

2. Materials and Methods 2.1 Materials 2.1.1 Reagents and Chemicals
Product Manufacturer 2-mercaptoethanol Merck 40% Acrylamide Amresco 5x siRNA buffer Dharmacon ABT-199 Selleck Chemicals ABT-263 Selleck Chemicals ABT-737 AbbVie Agarose Amresco AlamarBlue WEHI Ammonium peroxodisulfate (APS) Merck Millipore β-Oestradiol Sigma-Aldrich Bortezomib Takeda-Millennium Bovine Serum Albumin (BSA) Sigma-Aldrich Bromophenol Blue Sigma-Aldrich Captisol Ligand Technology CellTitre 96 Aqueous Non-Radioactive Proliferation Assay Promega CellTitre Glo Luminescent Assay Promega Cisplatin Hospira Collagenase Sigma-Aldrich Crystal Violet Sigma-Aldrich DAB+ Chromogen Dako Dako Target Retrieval Solution Dako DC (Detergent Compatible) Protein Assay Biorad Deoxynucleotide triphosphates (dNTPs) Promega DharmaFect Transfection Reagent Thermo Fischer Scientific Dimethyl sulphoxide (DMSO) Calbiochem Dinaciclib Merck DMEM cell culture media Thermo Fisher Scientific DNAse Sigma-Aldrich Dneasy DNA Tissue Kit Qiagen Doxycycline Sigma-Aldrich ECL Prime Western blotting Detection Reagents GE Healthcare Life Sciences ECL Western blotting Detection Reagents GE Healthcare Life Sciences Ethanol (Absolute) Analytical Grade Merck Ethidium bromide Sigma-Aldrich Foetal Calf Serum Sigma-Aldrich Gel + PCR Clean-up System Promega Glycerol Amresco GSK2110183 Selleck Chemicals Haematoxylin Dako Histolene Fronine HotStarTaq DNA Polymerase Qiagen Hyaluronidase Sigma-Aldrich Hydroxypropyl-beta-cyclodextrin Cyclodextrin Technologies Development Inc Insulin Novo Nordisk Isoflurane Baxter Ketamine Zoetis LentiX packaging system Clontech Laboratories Low fat milk powder Klim Matrigel BD Biosciences
38

Product Manufacturer MED-4011 Silicone A and Silicone B NuSil Silocone Technology Methanol Merck mirVana miRNA Isolation kit Thermo Fischer Scientific MK-2206 Selleck Chemicals MLN9708 Takeda-Millennium MMLV Reverse Transcriptase Promega MMLV RT 5x Buffer Promega Paraformaldehyde Sigma-Aldrich Penicillin-Streptomicin Thermo Fischer Scientific PHA-533533 Pfizer Plasmid Maxi Kit Qiagen Polybrene (Hexadimethrine bromide) Sigma-Aldrich Polyethylenimine Sigma-Aldrich Propidium iodide Sigma-Aldrich Pure Yield Plasmid Miniprep System Promega Random primers Promega RNAse Qiagen RPMI 1640 cell culture media Thermo Fischer Scientific Sodium dodecyl sulfate (SDS) Amresco Sodium Chloride Pfizer Sucrose Merck SuperSignal West Femto Maximum Sensitivity Substrate Thermo Fischer Scientific SYBR Green PCR Master Mix Applied Biosystems TEMED Biorad Tris(hydroxymethyl)methylamine (Tris) Amresco Trypsin Thermo Fischer Scientific Tween-20 Sigma-Aldrich Ultroser G Pall Life Sciences Water for Injection Pfizer Xylazine Troy Laboratories Xylene BDH Table 2.1
2.1.2 Primer sequences for quantitative PCR
Locus Left Sequence (Forward) Tm Right Sequence (Reverse) Tm Product size (bp) ACTB* gcacagagcctcgcctt 60.25 gttgtcgacgacgagcg 60.1 93 AKT1 atgagcgacgtggctattg 59.8 gtagccaatgaaggtgccat 60.0 114 AKT2 tccgaggtcgacacaaggta 60.2 ctggtccagctccagtaagc 60.1 105 AKT3 tttgatgaagaatttacagctcaga 59.4 tctcattgtccatgcagtcc 59.6 88 BCL-2** ccgcatcaggaaggctagag 62.3 ctgggacacaggcaggttct 62.6 95 BCL-W** gacaagtgcaggagtggatg 58.5 aaggcccctacagttaccag 58.7 208 BCL-XL** tggagtcagtttagtgatgtgga 59.6 ccaggatgggttgccattg 64.6 102 CCNE1 (Set A)*** agcggtaagaagcagagcag 59.95 cgctgcaacagacagaagag 60 107 CCNE1 (Set B)*** ccttgggacaataatgcagtc 59.4 gaggcttgcacgttgagttt 60.4 103 CCNE1* gaaatggccaaaatcgacag 60.45 tctttgtcaggtgtgggga 60.1 110 CDK1 tggatctgaagaaatacttggattcta 60.7 caatcccctgtaggatttgg 59.2 96 CDK2**** ggccatcaagctagcagact 59.6 gaatctccagggaatagggc 59.9 102 CDK5 atggtgacctcgatcctgag 60.1 ggcttcaggtccctgtgtag 59.7 103
39

Locus Left Sequence (Forward) Tm Right Sequence (Reverse) Tm Product size (bp) CDK9 aaggtgctgatggaaaacga 60.6 caagttgaccacattctcgtg 59.2 99 HPRT1 gttatggcgacccgcag 61.2 accctttccaaatcctcagc 60.4 107 Line1***** aaagccgctcaactacatgg 60.3 tgctttgaatgcgtcccagag 65.8 149 MCL-1** gtaaggagtcggggtcttcc 59.9 ccccacagtagaggttgagt 56.6 108 *From Etemadmoghadam PLoS One 2010 (387)
**From Liu et al, Gut 2015 (444) ***From Etemadmoghadam Clin Cancer Res 2009 (355)
****From Etemadmoghadam Clin Cancer Res 2013 (445) *****From Shih et al, Proc Natl Acacd Sci USA 2005 (446) Table 2.2
2.1.3 Antibodies Antibody Manufacturer Application AKT1 Cell Signaling Western blot AKT2 Cell Signaling Western blot AKT3 Merck Millipore Western blot Annexin V (APC) BD Pharmingen Flow cytometry Bcl-XL Santa Cruz Biotechnology Western blot CDK2 Santa Cruz Biotechnology Western blot Cleaved caspase 3 Cell Signaling Immunohistochemistry Cyclin E1 Santa Cruz Biotechnology Western blot DAPI Thermo Fischer Scientific Nuclear staining, proliferation assay FluoroGold Santa Cruz Biotechnology Flow cytometry Ki67 Abcam Immunohistochemistry Mcl-1 Rockland Western blot PARP cleavage product Cell Signaling Western blot Phospho-AKT (Ser473) Cell Signaling Western blot; Immunohistochemistry Phospho-PRAS40 (Thr246) Cell Signaling Western blot Phospho-Rb (Ser807/811) Cell Signaling Western blot; Immunohistochemistry Total AKT Cell Signaling Western blot α-tubulin Sigma Aldrich Western blot β-actin Sigma Aldrich Western blot Table 2.3
2.2 Molecular and cell biology
2.2.1 DNA Extraction DNA was extracted from cultured cells or tumour xenografts using a Qiagen DNeasy Blood and
Tissue Kit (Qiagen). According to the manufacturer’s protocol, cell pellets were spun down and
resuspended in 200µL PBS and 20µL of proteinase K. 200 µL of Buffer AL was added, mixed briefly
by vortexing and incubated in a heat block at 56°C for 10 minutes. Following incubation, 200 µL
100% ethanol was added to the sample and mixed thoroughly by vortexing. The sample was then
pipetted into DNeasy Mini spin column and centrifuged at 6,000 g (8,000 rpm) for 1 minute. The flow
40
through was discarded, and DNA bound to the column was washed with two wash and centrifuge
cycles. For the first cycle, 500µL Buffer AW1 was added and centrifuged for 1 minute at 6,000g. The
flow through was discarded, and 500µL Buffer AW2 was added and centrifuged for 3 minutes at
20,000 g (14,000rpm). Flow through was discarded, and the column centrifuged again for 1 minute
until dry. At this point, the manufacturer’s standard protocol was altered to increase the concentration
of purified DNA. 50µL of elution buffer (AE) was added to the column and incubated at room
temperature for 5 minutes. DNA was eluted by centrifugation for 1 minute at 6,000 g. A second
elution for all samples was collected by adding an additional 50 µL AE buffer to the dry column and
incubated at room temperature and eluted as above.
DNA quality and concentration was assessed by spectrophotometry on a Nanodrop ND-1000
Spectrophotometer (Nanodrop Technologies). Samples were considered free from protein and other
contaminants if the 260/280nm absorbance ratio was ≥1.8 and 260/230nm ratio was between 1.8 and
2.2. DNA dilutions for experiments (quantitative PCR, short-tandem repeat genotyping) were
prepared using purified water (Pfizer).
2.2.2 RNA Extraction RNA was extracted from cultured cells or tumour xenografts using the mirVana miRNA isolation kit
(Thermo Fisher). According to the manufacturer’s protocol, 300µL of Lysis/Binding buffer was added
to cell pellets, or 600µL to tumour sections in a microcentrifuge (Eppendorf) tube. Samples were
mixed thoroughly by vortexing until slurry consistency, and 1/10 volume miRNA Homogenate
additive (30µL or 60µL) added and then incubated on ice for 10 minutes. Following incubation, a
volume of acid-phenol:choloroform equal to the lysate was added (300µL or 600µL) and vortexed for
30-60 seconds. The mixture was centrifuged for 5 minutes at 10,000 g, and the aqueous phase
containing total RNA was transferred into a new microcentrifuge tube without disturbing the lower
phase, noting the volume transferred. 1.25 times the volume of the aqueous phase of 100% ethanol
was added to the lysate – for example, if 300µL recovered, 375µL of ethanol was added. The
lysate/ethanol mixture was added to a filter cartridge and centrifuged for ~15 seconds at 10,000 g. The
flow through was discarded, and the filter cartridge washed and centrifuged for three wash cycles –
one cycle with 700µL Wash Solution 1, and two cycles with 500µL Wash Solution 2 and 3, each for
10-15 seconds at 10,000 g. After discarding the flow through from the last wash, the filter cartridge
was centrifuged for 1 minute at 10,000 g until dry. The filter cartridge was transferred into a new
collection tube, and at this point the manufacturer’s protocol was altered to increase the concentration
of purified RNA. 30µL of pre-warmed elution buffer at 95°C was added to the filter cartridge and
RNA eluted by centrifugation for 20-30 seconds at 10,000 g.
41

RNA quality and concentration was assessed by spectrophotometry on a Nanodrop ND-1000
Spectrophotometer (Nanodrop Technologies). Samples quality was considered satisfactory if the
260/280nm absorbance ratio between 1.8 and 2.1.
2.2.3 Primers for quantitative PCR Primers for qPCR were designed to genomic DNA sequences using qPrimer Depot
https://primerdepot.nci.nih.gov/. Products were specified to be between 100-150bp in size with primer
melting temperature (Tm) between 58.5-61.5°C (optimal 60°C). Primer sequences were selected to
avoid known SNPs (according to UCSC Genome Browser https://genome.ucsc.edu/cgi-
bin/hgGateway) and not to amplify products with homology to other sequences assessed using NCBI
BLAST (https://blast.ncbi.nlm.nih.gov/Blast.cgi) search of product sequence.
2.2.4 Reverse Transcription and quantitative PCR 1µg total RNA was denatured with an equal amount of random hexamer primers (Promega) at 70°C
for 5 minutes then cooled on ice to anneal. Synthesis of cDNA was performed using 200U M-MLV
reverse transcriptase and 12.5nmol of each dNTP in M-MLV reaction buffer (all reagents Promega) at
42°C for 90 minutes followed by a 95°C enzyme deactivation step for 5 minutes.
Gene expression was measured by quantitative PCR (qPCR) using SYBR Green qPCR assay on the
7900HT Fast Real-Time PCR system (Applied Biosystems). PCR was performed in triplicate 10µL
reactions containing approximately 2ng cDNA, 1µmol of each primer and 5µL SYBR Green master
mix (Applied Biosystems). Conditions for amplification were 50°C for 2 minutes, 95°C for 10
minutes followed by 40 cycles of 95°C for 15 seconds and 60°C for 1 minute. Threshold cycle
numbers (CT) were obtained using Sequence Detection Software 2.3 (Applied Biosystems) using
default settings. Gene expression was calculated using the comparative threshold cycle method
(ΔΔCT) against the average CT value obtained for two endogenous control genes (ACTB and HPRT1).
2.2.5 Real-time quantitative PCR (RT-qPCR) Real-time qPCR was performed using SYBR Green qPCR assay on the 7900HT Fast Real-Time PCR
system (Applied Biosystems). PCR reactions were performed in triplicate 10µL reactions contacting
2ng genomic DNA (final concentration 0.2ng.µL-1) and 1µmol of each primer (final concentration
0.1µM) in purified water (Pfizer), plus 5µL SYBR Green master mix (Applied Biosystems).
Conditions for amplification were 50°C for 2 minutes, 95°C for 10 minutes followed by 40 cycles of
95°C for 15 seconds and 60°C for 1 minute. Threshold cycle numbers were obtained using Sequence
Detection Software 2.3 (Applied Biosystems) using default settings.
42

Target gene (CCNE1) quantity (log2 ratio) was calculated in the cell line or xenograft sample by
normalising the data to a repetitive element, Line-1, for which copy number per haploid genome
(copy number ratio to normal) are similar among normal and neoplastic genomes (447). CCNE1 copy
number was calculated using the CT method, which uses the difference in threshold cycle number
between test and reference sample, according to the formula:
log2 ratio = (Ntest-Nref) – (Ttest – Tref)
where Ntest is the median threshold cycle number (CT) observed for the CCNE1 primer in the normal
DNA sample, Nref is the median CT for the Line-1 primer in the normal DNA sample, Ttest is the
median CT for CCNE1 primer in the cell line or tumour sample, and Tref is the median CT for the Line-
1 primer in the cell line or tumour sample. Copy number ratio was given as the mean value from
paired primer sets (Table 2.2).
Dissociation curve (melting peak) analysis was performed to determine melting temperature of PCR
products and ensure amplification product specificity. Each fluorescence reading taken during the
temperature ramp (between 60-110°C) was used to calculate derivative (Rn), which reflects the rate of
fluorescence of dye as a function of temperature. The melting temperature (Tm) of the PCR product
was derived from the peak (Rn maximum rate of change) of the dissociation curve.
2.2.6 Immunohistochemistry (IHC) Immunhistochemical staining of formalin fixed paraffin embedded tissue (FFPE) was performed
according to standard protocols. Sections from FFPE blocks were cut to a thickness of 4µm on to
Superfrost Plus slides (Thermo Fisher Scientific) and de-waxed. Antigen retrieval was performed by
boiling samples in a pressure cooker at 125°C with Dako Target Retrieval Solution (pH 9.0) for 2
minutes. Slides were then washed in distilled water for 5 minutes and rinsed in 50mM Tris/HCl buffer
for 5 minutes.
A Dako Autostainer was used for staining, with all incubation steps performed at room temperature.
Endogenous peroxidases were blocked using 3% hydrogen peroxide for 10 minutes, and then primary
antibody (Table 2.3) was applied for 60 minutes according to dilutions specified below (Table 2.4).
Slides were then rinsed in 50mM Tris/HCl buffer for 5 minutes and incubated with Envision+ rabbit
(Dako) peroxidase labelled polymer for 60 minutes. Slides were then rinsed in Tris/HCl buffer for 5
minutes, and then DAB+ (Dako) substrate chromogen was applied for 10 minutes. Slides were then
removed from the Autostainer and counterstained with haematoxylin before drying, clearing,
mounting and cover-slip applied.
43

Antibody Dilution Cleaved caspase-3 1/100 Phospho-AKT 1/50 Phospho-Rb 1/500 Ki67 1/100
Table 2.4 Antibody dilutions for IHC
Images from IHC stained slides were captured using an Olympus BX61 microscope for quantitative
analysis using Metamorph Microscopy Automation and Image Analysis software (Molecular
Devices).
2.2.7 Cell Culture Ovarian cancer cell lines (Table 2.5) were obtained from the National Cancer Institute (NCI)
Repository, and actively passaged for less than 6 months for experiments. Cells were maintained in
37°C and 5% CO2 (v/v) and cultured in specified media (Table 2.5) containing 10% (v/v) foetal calf
serum (Sigma-Aldrich) and 1% penicillin-streptomycin (Thermo Fisher Scientific).
Cell Line Media Additives
59M DMEM 20IU Insulin 2mM Glutamine 1mM Sodium pyruvate
A2780 RPMI 1640 CAOV3 DMEM 2mM Glutamine
COV318 DMEM 2mM Glutamine FUOV1 DMEM/F12
IGROV1 RPMI 1640 JHOS2 DMEM/F12 0.1mM Non-essential amino acids (NEAA)
JHOS4 DMEM/F12 0.1mM Non-essential amino acids (NEAA) Kuramochi RPMI 1640
OAW28 DMEM
20IU Insulin 2mM Glutamine 1mM Sodium pyruvate
OVCAR3 RPMI 1640 OVCAR4 RPMI 1640 OVCAR5 RPMI 1640 OVCAR8 RPMI 1640 OVKATE RPMI 1640 SKOV3 RPMI 1640
Table 2.5 Ovarian cancer cell lines
2.2.7.1 Mycoplasma testing Cell lines were regularly tested for Mycoplasma every 6 months, and prior to use in vivo or high
throughput screening. A small amount of cells were scraped from cell culture flasks and added to 5mL
44

of supernatant and frozen at -20°C. Samples were then sent to the Victorian Infectious Diseases
Reference Laboratory for testing using a real-time TaqMan PCR assay.
2.2.7.2 Cell line authentication Ovarian cancer cell lines were authenticated following receipt from NCI, and tested yearly with DNA
finger-printing using short tandem repeat (STR) markers to confirm their identity against the Cancer
Genome Project database (Wellcome Trust Sanger Institute, Cambridgeshire, United Kingdom). A
cell line was considered authentic when the STR profile shows a ≥80% match between the cell line
and the reference database (448).
Genomic DNA was extracted from the cell lines as described above. DNA was diluted to a
concentration of 5ng/ µL, and 10ng (2µL) was added to a PCR reaction of 20µL containing primers at
3µM concentration (CSF1PO, TPOX, THO1, vWA, D16S539, D7S820, D5S818). Conditions for
amplification were 95°C for 15 minutes, followed by 35 cycles of 94°C for 30 seconds, 58°C for 1
minute, 72°C for 2 minutes, then 72°C for 10 minutes and 25°C for 1 second.
PCR Reaction Component µL (per reaction) 10x Buffer 2 Primer (3µM) 1 dNTPs (25 µM) 2 Hot Star Taq DNA Polymerase (5µg/µL) 0.1 DNA 2 Purified water to 20µL
To complete STR analysis, 10µL of the PCR product was sent to the Australian Genome Research
Facility (AGRF) for genotyping using the Promega GenePrint 10 system. The size of each PCR
marker obtained was compared against the expected size as listed in the Cancer Genome Project
database. A difference of less than 4 base pairs between expected and actual size was considered
acceptable. Additionally, 10uL of the PCR products were run on a 2% agarose gel at 100V for 1 hour
to validate appropriate sized fragments were amplified.
2.2.8 Drug sensitivity assays
2.2.8.1 CellTitre 96 Aqueous Non-Radioactive Proliferation (MTS) Assay To determine drug sensitivity, cells were seeded into 96 well plates at specific seeding densities (see
Table 2.6). Seeding densities were optimised for each cell line to reach confluence at assay end-point
(96 hours) for untreated cells (media only controls). Cells were seeded in antibiotic free media, and
allowed to attach overnight before the addition of drug at up to 11 different concentrations. After 72
hours of incubation, 20 µL of MTS reagent was added to each well, and the amount of MTS
tetrazolium salt bioreduced to formazan was measured by absorbance at 490nm with a VersaMax
Plate Reader (Molecular Devices). Absorbance was normalised to media alone, and the IC50 dose
45

was approximated by fitting a four-parameter dose-response curve (Hill equation) using Prism 6
(GraphPad Software).
Cell line 96-well MTS
6-well clono
12-well siRNA Transfection
6-well clono siRNA
96-well siRNA MTS
Count type Countess Coulter Countess Coulter Countess 59M 7,500 5,000 60,000 10,000 10,000 A2780 5,000 2,000 48,000 2,000 7,500 CAOV3 5,000 5,000 45,000 10,000 7,500 COV318 5,000 5,000 45,000 10,000 7,500 FUOV1 7,500 7,500 60,000 10,000 10,000 IGROV1 5,000 2,000 45,000 5,000 7,500 JHOS2 7,500 7,500 90,000 10,000 10,000 JHOS4 7,500 7,500 90,000 10,000 10,000 Kuramochi 7,500 5,000 48,000 10,000 10,000 OAW28 7,500 5,000 90,000 10,000 10,000 OVCAR3 5,000 2,000 48,000 5,000 10,000 OVCAR4 5,000 2,000 48,000 5,000 7,500 OVCAR5 5,000 2,000 48,000 5,000 7,500 OVCAR8 5,000 1,000 48,000 1,000 5,000 OVKATE 7,500 7,500 90,000 10,000 10,000 SKOV3 5,000 500 24,000 1,000 5,000 Table 2.6 Seeding density for cell lines
2.2.8.2 Clonogenic survival assay Cells were trypsinized to form a single cell suspension, counted using a Coulter Counter (Beckman
Coulter), and seeded at low density in a 6 well plate in triplicate (see Table 2.6 for seeding density).
After attachment overnight, drug was added at up to 11 different concentrations and incubated for 7-
10 days. Cell colonies were washed, fixed and stained with 20% (v/v) methanol and 0.1% (w/v)
crystal violet for 30 minutes on a rocking platform at room temperature. Cells were rinsed in water,
air-dried, digitally scanned and discrete colonies (defined as >50 cells per colony) counted using
MetaMorph. IC50 dose was approximated by fitting a four-parameter dose-response curve (Hill
equation) using Prism 6.
2.2.9 Gene suppression studies using short-interfering RNA (siRNA) Optimisation for siRNA transfection included selecting seeding densities that resulted in sub-
confluent monolayer growth prior to transfection (see Table 2.6). Optimal transfection conditions
were determined based on maximal gene knockdown and minimal cytotoxicity as assessed by qPCR
and MTS cell viability assay (described above). Nuclear localisation of siGLO Green Transfection
46

Indicator (Dharmacon) was used to monitor transfection efficiency by fluorescence microscopy 24 to
48 hours after transfection.
For gene suppression studies, cells were seeded in 12 well plates in antibiotic free media, and allowed
to adhere overnight for up to 20 hours prior to transfection. ON-Target plus siRNA pools and
transfection reagents (Dharmacon) were pre-incubated at room temperature for 15 minutes in serum-
free media (20% of final transfection volume) to facilitate formation of lipid-siRNA complexes. Cells
were then incubated in the final transfection mix containing 0.4% (v/v) DharmaFECT transfection
reagent and 50nM siRNA in antibiotic free media with serum. After 24 hours of transfection, cells
were washed and trypsinised and resuspended into a single cell suspension for clonogenic survival
assay as described above. Cells were counted with the Coulter Counter and the cell number equalised
for each experimental condition. Cells were seeded at low density in wells of a 6 well plate in
triplicate, and left to form colonies for up to ten days. Parallel transfection was carried out to validate
knockdown of gene target by qPCR and/or Western blot.
2.2.10 Short hairpin (shRNA) mediated CDK2 knockdown Short hairpin-mediated knockdown of CDK2 was performed by cloning CDK2-specific shRNA into a
lentiviral tetracycline-inducible expression vector containing the optimized miR-E backbone (449).
The modified lentiviral vector pRRL-T3G-TurboGFP-miRE-PGK-mCherry-IRES-rTA3 (also referred
to as LT3GECIR) system includes a red (mCherry) fluorescent marker for transduction and a green
(turboGFP) fluorescent marker for induction.
The method for designing and cloning specific shRNA constructs has been published (450). To design
specific miR-E based shRNA constructs, the region of the CDK2 mRNA sequence to be targeted was
identified from the National Centre for Biotechnology Information (NCBI) database
(http://www.ncbi.nlm.nih.gov/gene). Taking the FASTA sequence, ten shRNA sequences were
designed using the Designer of Small Interfering RNA algorithm (DSIR,
http://biodev.cea.fr/DSIR/DSIR.php) (451). The top 10 ranked 21 nucleotide target binding site
sequence was used as the basis for designing the 97mer oligonucleotide sequence at RNAi Central
hosted by Cold Spring Harbor Laboratory
(http://cancan.cshl.edu/RNAi_central/RNAi.cgi?type=shRNA). Oligonucleotides were ordered from
Sigma in 96 well plates, and resuspended in purified water.
Each 97mer oligonucleotide was used as a template for a PCR reaction to yield a product that could
be cut with restriction enzymes Xho1 and EcoR1 (Promega) to produce unique 110bp hairpin
products.
47
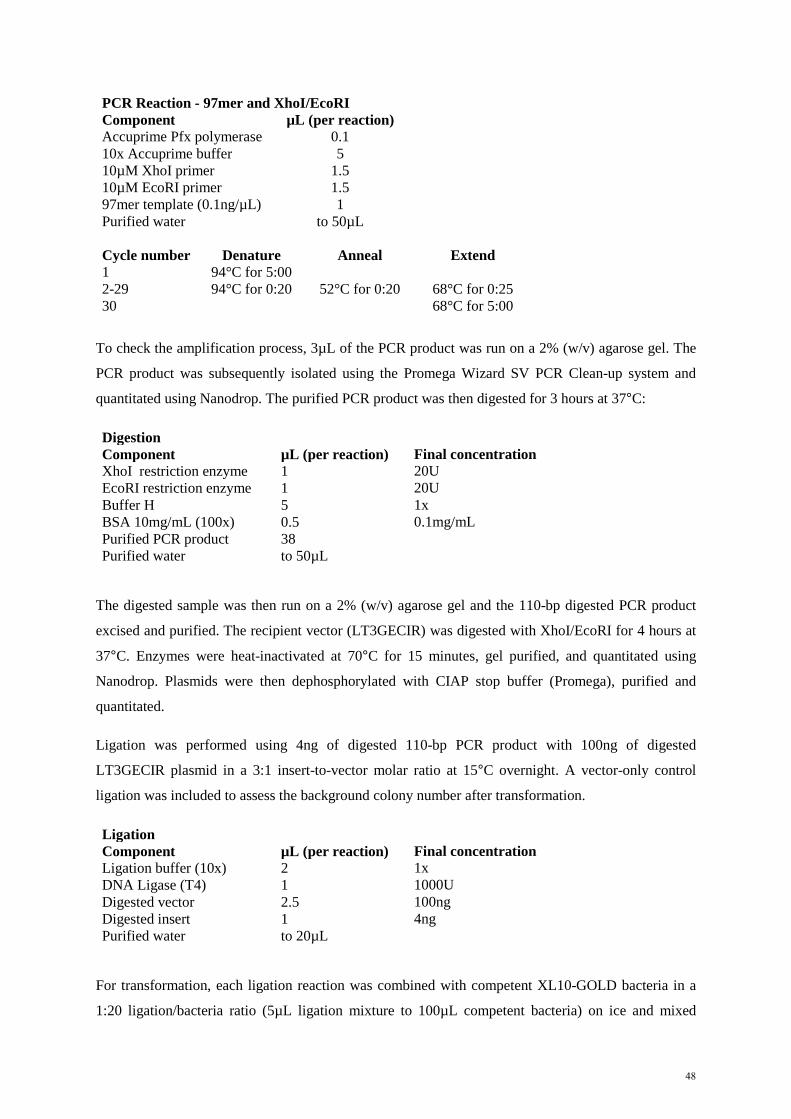
PCR Reaction - 97mer and XhoI/EcoRI Component µL (per reaction) Accuprime Pfx polymerase 0.1 10x Accuprime buffer 5 10µM XhoI primer 1.5 10µM EcoRI primer 1.5 97mer template (0.1ng/µL) 1 Purified water to 50µL Cycle number Denature Anneal Extend 1 94°C for 5:00
2-29 94°C for 0:20 52°C for 0:20 68°C for 0:25 30
68°C for 5:00
To check the amplification process, 3µL of the PCR product was run on a 2% (w/v) agarose gel. The
PCR product was subsequently isolated using the Promega Wizard SV PCR Clean-up system and
quantitated using Nanodrop. The purified PCR product was then digested for 3 hours at 37°C:
Digestion Component µL (per reaction) Final concentration XhoI restriction enzyme 1 20U EcoRI restriction enzyme 1 20U Buffer H 5 1x BSA 10mg/mL (100x) 0.5 0.1mg/mL Purified PCR product 38 Purified water to 50µL
The digested sample was then run on a 2% (w/v) agarose gel and the 110-bp digested PCR product
excised and purified. The recipient vector (LT3GECIR) was digested with XhoI/EcoRI for 4 hours at
37°C. Enzymes were heat-inactivated at 70°C for 15 minutes, gel purified, and quantitated using
Nanodrop. Plasmids were then dephosphorylated with CIAP stop buffer (Promega), purified and
quantitated.
Ligation was performed using 4ng of digested 110-bp PCR product with 100ng of digested
LT3GECIR plasmid in a 3:1 insert-to-vector molar ratio at 15°C overnight. A vector-only control
ligation was included to assess the background colony number after transformation.
Ligation Component µL (per reaction) Final concentration Ligation buffer (10x) 2 1x DNA Ligase (T4) 1 1000U Digested vector 2.5 100ng Digested insert 1 4ng Purified water to 20µL
For transformation, each ligation reaction was combined with competent XL10-GOLD bacteria in a
1:20 ligation/bacteria ratio (5µL ligation mixture to 100µL competent bacteria) on ice and mixed
48

gently. Tubes were left on ice for 15-30minutes and then heat shocked for 45 seconds at 42°C. To
plate on LB agar and ampicillin plates, 900µL of LB broth was added to the ligation/bacteria mixture
and incubated for 1 hour at 37°C in a shaker. Following incubation, 100µL was then pipetted onto the
LB plate and streaked using a glass pipette. Plates were then placed into a 37°C incubator to allow
colonies to grow overnight.
Colonies were considered positive if the number of colonies on each ligation plate was at least four- to
fivefold greater than that on the control plate (vector alone without insert). Three or four colonies per
shRNA were picked and transferred into 4mL of LB broth with ampicillin. Tubes were cultured
overnight at 37°C with shaking.
Plasmid DNA was extracted using the PureYield Miniprep Kit (Promega) and clones were sequenced
at the Centre for Translational Pathology (University of Melbourne). In addition, 500µL of the
bacterial culture was mixed with 500µL of glycerol stock and stored at -80°C for future use.
Lentiviral production was performed using HEK293T cells transfected with plasmid DNA combined
with the Lenti-X packaging system (see Table 2.7 for workflow). HEK293T cells were seeded into
100mm dishes in 5mL DMEM media. A transfection master mix of plasmid DNA, Lenti-X and media
was prepared to a total volume of 500µL per 100mm dish.
Plasmid DNA (500ng/µL) 20µL (10µg) Lenti-X (500ng/µL) 20µL (10µg) DMEM (no supplements) 370µL The transfection mix was then mixed vortexing for 10 seconds at medium speed prior to adding 90µL
of polyethylenimine 1mg/mL (PEI). The transfection mix was then vortexed again at medium speed
for 10 seconds and incubated at room temperature for 10 minutes to allow DNA precipitates to form.
Following incubation, the transfection mix was vortexed for 10 seconds at medium speed prior to
adding to HEK293T cells. The entire 500 µL transfection mix was added dropwise into the dish,
whilst gently swirling to distribute evenly. Dishes were placed back into the incubator at 37°C with
5% CO2 and left overnight.
Twenty-four hours following transfection, HEK293T cells were checked for transfection efficiency
using fluorescence microscopy to look for presence of mCherry (red) fluorescent reporter. The
supernatant was then aspirated, and replaced with fresh 7.5mL warmed media, matched to the target
cells. Dishes were placed back into the incubator for 48 hours at 37°C.
Following 48 hours incubation, medium containing lentiviral particles was collected for transduction
of target cells. Fresh 7.5mL warmed media was added back to the HEK293T cells and placed back
into the incubator for 24 hours for a second collection of lentiviral particles.
49

Medium containing lentiviral particles was filtered through a 0.45µm filter using the Amicon 15mL
Centrifugal filter columns (Merck Millipore). Virus was then concentrated by centrifuging columns at
3000 g for 8-10 minutes at 37°C to final volume of 1mL. Polybrene (Hexadimethrine bromide,
Sigma) was added to the concentrated lentiviral particles to improve transduction efficiency. 2µL of
4mg/mL Polybrene was added to 1mL lentiviral particles to achieve the final concentration of
8µg/mL. The target cells were washed with PBS, and the concentrated lentiviral particles and
polybrene mix was added and incubated for 24 hours.
Following 24 hours of incubation with lentiviral particles, the supernatant was aspirated from the
target cells and 3mL of fresh media added. Tranduction efficiency can be monitored by fluorescence
microscopy. Target cells were then expanded in culture, and transferred from 100mm dishes to flasks
until > 1x10⁶ cells were available for sorting by flow cytometry (FACS).
DAY STEP 0 Prepare HEK293T cells for Transfection 1 Transfection of HEK293T cells 2 Change media of transfected HEK293T cells
Prepare target cells
4 Collect lentiviral supernatant and change media
Transduction of target cells
5 Change media of transduced target cells
Second collection of lentiviral supernatant
7 Expand transduced target cells for FACS sorting Table 2.7 Work flow for viral transfection/transduction
Sorting for transduced cells was performed by Viki Milovac (Peter MacCallum Cancer Centre) using
the FACS Fusion 5 cell sorter (BD Biosciences). Cells were harvested with trypsin, then PBS washed
twice and filtered through a cell strainer to ensure single cell suspension using a 5mL round bottom
Falcon tube (Invitro Technologies). Cells were suspended in 150-200µL PBS with 0.25mM EDTA to
prevent cell clumping. FluoroGold antibody was added at 1:25 ratio as a viability marker.
Cells were sorted for expression of both FluoroGold and mCherry as a marker for transduction. Only
the top 20% mCherry expressing cells were collected to ensure a pure population of cells. Sorted cells
were expanded and doxycycline was used to induce shRNA expression. Optimisation of induction
efficiency was carried out with three doses of doxycycline (1mg/mL, 2mg/mL and 4mg/mL) and three
different time points (24, 48 and 72 hours). Induction of shRNA was monitored by FACS using the
LSRFortessa X-20 cell analyser (BD Biosciences), and knockdown of individual hairpins assessed by
qPCR and Western blot. The most efficient shRNA construct was taken forward for in vitro and in
vivo experiments.
50

2.2.11 Cyclin E1 and AKT over-expression in Fallopian tube secretory epithelial cells The immortalised fallopian tube secretory epithelial cell (FTSEC) line FT282 was obtained from
Ronny Drapkin (University of Pennsylvania) (412) The FT282 cell line was established from fresh
normal human fallopian tube tissue, and vectors expressing human telomerase reverse transcriptase
(TERT; pBABE-hygro-TERT) and mutant p53R175H (pLenti6/V5-TP53R175) were cloned in by Karst et
al (412). Derivative cell lines were then generated by Franziska Lang (Peter MacCallum Cancer
Centre) using pMSCV-mCherry-(empty) and pMSCV-mCherry-CCNE1, encoding full length
CCNE1. Additional cell lines were generated with pMSCV-GFP-myr-AKT1, pMSCV-GFP-myr-
AKT2 and pMSCV-GFP-myr-AKT3. Plasmids were obtained from Richard Pearson (Peter
MacCallum Cancer Centre) and insert sequenced by Sanger sequencing at the Centre for Translational
Pathology (University of Melbourne). The methods for generating these additional lines were as
above, using PEI-based transfection and transduction, although there were differences as pMSCV is a
retroviral vector as opposed to the lentiviral vector described above. Phoenix A cells were transfected
to generate retroviral particles, and Lenti-X mix was not required. Otherwise, a similar protocol of
transfection, transduction, expansion and sorting was used to select cells expressing GFP or mCherry
fluorescent markers. Expression of Cyclin E1, AKT1, AKT2 and AKT3 was validated by qPCR and
Western blot.
2.2.12 Western blot Cells were washed with PBS, and lysed by adding protein lysis buffer (see Table 2.9 for buffers) and
incubating at room temperature for 5 minutes. Protein lysates were then boiled for 5 minutes, and
quantitated against bovine serum albumin (BSA) standards using the Detergent Compatible (DC)
Protein Assay (Bio-Rad). 10µL of protein lysate was added to 25µL of Reagent A and 100µL of
Reagent B in a 96 well plate. Absorbance was then measured using the VersaMax plate reader at 650-
750nm and protein concentration calculated against the standards. Samples were then equalised across
the experiment to ensure the same concentration of protein lysate was loaded.
Protein lysates were prepared with sample buffer in a 2:1 dilution, and previously calculated
quantities of each sample loaded. 10µL of SeeBlue Plus2 Protein Standard (Thermo Fisher Scientific)
was used as an indicator of molecular weights of proteins. Samples were resolved by SDS-PAGE
using 12-15% (w/v) acrylamide gels, and then transferred to polyvinylidene difluoride (PVDF)
membranes at 100mA per blot for 1 hour using a semi-dry transfer apparatus (Bio-Rad). PVDF
membranes were first prepared by soaking briefly in methanol and then transfer buffer, and
sandwiched between blotting paper soaked in transfer buffer. Following transfer, membranes were
blocked in 5% (w/v) non-fat milk power in PBS-T and probed overnight at 4°C in primary antibody
on a rocking platform. Membranes were then washed in PBS-T and incubated with peroxidase-
conjugate secondary antibody for 1 hour at room temperature, washed again with PBS-T. Membranes
51

were then developed by enhanced chemiluminesecence before being exposed to radiographic film
(Fuji), using ECL, ECL Prime (both GE Healthcare Life Sciences) or SuperSignal West Femto
(Thermo Fisher Scientific). Blots were re-probed with α-tubulin or β-actin antibodies to assess protein
loading.
Lower Gel Buffer (pH 8.8)
Upper Gel Buffer (pH 6.8) Component Quantity
Component Quantity
Tris 91g
Tris 15g SDS 2g
SDS 1g
Ultrapure Water (Milli-Q, Merck) 500mL
Ultrapure Water 250mL
3X SDS Sample Buffer
Protein lysis buffer Component Quantity
Component Volume
Tris 1.9g
1.0M Tris pH 6.85 3mL Glycerol 31.42g
10% SDS 12mL
SDS 5.75g
Ultrapure Water 48mL Ultrapure Water 83.3mL
Bromophenol blue added until solution becomes dark blue and opaque 40µL of beta-mercaptoethanol per mL of 3x SDS Sample buffer
Resolving buffer
12% Resolving gel Component Volume (mL)
Component Volume
40% Acrylamide 15
Resolving buffer 8mL Lower Gel Buffer 13.3
25% APS 18µL
Ultrapure Water (Milli-Q, Merck) 22
TEMED 6µL
Stacking buffer
4% Stacking gel Component Volume (mL)
Component Volume
40% Acrylamide 6.7
Stacking buffer 4mL Upper Gel Buffer 12.4
25% APS 18µL
Ultrapure Water 30.9
TEMED 6µL
10X Gel Electrophoresis Running Buffer
Transfer Buffer Component Quantity
Component Quantity
Tris 60.6g
Tris 5.81g Glycine 288g
Glycine 9.93g
SDS 20g
SDS 0.375g Ultrapure Water 2L
Methanol 200mL
Ultrapure Water Up to 1L
Table 2.8 Buffers for Western blotting
52
2.2.13 Anchorage independent growth assay Cells were suspended in 50μL of 0.375% Agarose II (Amresco, Ohio, USA) and seeded over a 0.75%
agar base in 96 well plates (300 cells per well, 6 replicates). Plates were incubated at 37°C and 5%
CO2 for three weeks, and then fixed with 2% Paraformaldehyde. 46 stages of one microscopic field
(4x magnification) per well were photographed using an Olympus IX81 live cell imager and the
number of colonies > 100μm were counted manually.
2.2.14 Proliferation assay Cells were seeded in 96-well plates (500 cells per well, 6 replicates) and fixed and stained at 24, 48
and 72 hours with 2% Paraformaldehyde and DAPI. Cell density was quantified using CellInsight cell
imager (ThermoScientific).
2.2.15 Generating drug resistant cell lines Cell lines resistant to dinaciclib were generated using methods described in Etemadmoghadam et al
(445). OVCAR3 cells were plated in 6-well plates and treated with dinaciclib at the IC50 dose (10nM,
based on 72 hour cytotoxicity assay) for two 72-hour periods (media removed and freshly prepared
drug added). Surviving cells were allowed to repopulate for 96 hours and the process repeated once.
Remaining cells were cultured in media or in the presence of drug, and regularly monitored for
sensitivity to dinaciclib. Six independent cell lines were generated in this fashion, and designated
OVCAR3-RD1 to –RD6. Resistant cell lines were confirmed to represent derivatives of parental
OVCAR3 cell lines by STR genotyping as above.
2.2.16 Flow Cytometry and Cell Sorting (FACS)
2.2.16.1 Cell cycle analysis Cell cycle analysis was performed following CDK2 knockdown mediated by shRNA as described
above. Cells were plated in 6 well plates and shRNA was induced using doxycycline. Following 72
hours of induction, cells were rinsed in PBS, trypsinized and fixed in 70% ice-cold ethanol. Cells
were pelleted and resuspended in a solution containing 50µg.mL-1 propidium iodide (PI) and
100U.mL-1 RNAase (Qiagen) for 30 minutes at room temperature. Up to 10,000 cells were then
counted by FACSCanto II (BD Biosciences). Viable cell-cycle profiles and percentage of cells in each
cell-cycle phase was determined using FlowLogic (Inivai Technologies Australia).
2.2.16.2 Annexin V-Propidium iodide (PI) apoptosis assay The Annexin V-Propidium iodide assay was used to assess apoptosis following drug treatment or
CDK2 knockdown mediated by shRNA as described above. Cells were plated in 12 well plates and
either drug treated or CDK2-shRNA induced using doxycycline. Following 24 hours (of drug
treatment) or 72 hours (of shRNA induction), cells were collected and stained with Annexin V
53

antibody (BD Pharmingen) and 50µg.mL-1 PI. Cells were incubated at room temperature for 15
minutes and then analysed by FACSCantoII. Percentage of Annexin V and PI positive cells was
determined using FlowLogic.
2.3 High throughput compound screen methods and analysis The aim of the high throughput screen (HTS) was to identify compounds that would synergistically
combine with either dinaciclib or bortezomib in four different conditions:
1. Synergistic with dinaciclib in CCNE1 amplified compared to non-amplified
2. Synergistic with bortezomib in CCNE1 amplified compared to non-amplified
3. Synergistic with dinaciclib in CDK inhibitor-resistant cell line compared to parental
4. Synergistic with bortezomib in CDK inhibitor-resistant cell line compared to parental
Three cell lines were chosen for the HTS – OVCAR3 (CCNE1 amplified), SKOV3 (CCNE1
unamplified) and OVCAR3-R1-533533 (CDK inhibitor-resistant). All cell lines were STR profiled
and tested for Mycoplasma prior to performing the HTS. Only early passage (less than passage 20)
cell lines were used. HTS was carried out at the Walter and Eliza Hall Institute (WEHI) High
Throughput Screening facility at Bundoora, Victoria; with the assistance of Kurt Lackovic and Kate
Jarman (WEHI).
2.3.1 Optimisation of screening conditions The following conditions of the high throughput screen (HTS) required optimisation prior to
commencement of screening:
- Seeding density for each cell line
- Seeding volumes
- Incubation period
- Dose of single agent to achieve EC30
- DMSO (vehicle) control concentration
- Reagent type and volume
Early passage cells were seeded into 384-well microtiter plates (Corning) using a multidrop dispenser
(Thermo Scientific). Cells were allowed to adhere overnight, and 0.1µL media added using a 384,
hydrophobic slotted pintool (VP Scientific) calibrated to dispense 0.1µL of DMSO compound
solution. This was performed to mimic the planned HTS workflow. Initial optimisation steps were
performed to ensure use of each automated step would result in consistent seeding density across the
384-well plate.
54

Cells were incubated at 37°C and 5% CO2 for either 48 hours or 72 hours, and two reagents were
tested during the optimisation process – AlamarBlue (WEHI) and CellTiter Glo (Promega).
AlamarBlue was added in a 1:2 dilution to cells using the multidrop dispenser, and allowed to
incubate at 37°C for up to 4 hours. Cell viability was assessed by measuring absorbance at 570nm
using the EnVision Multilabel plate reader (PerkinElmer). Plates were read at 1, 2, and 4 hours
following addition of AlamarBlue to assess the consistency of the assay.
CellTiter Glo (CTG) was added in a 1:2 dilution to cells using the multidrop dispenser, stirred gently
using a platform rocker for 2 minutes, and kept in the dark for 10 minutes. Cell viability was assessed
by measuring the luminescence using the EnVision Multilabel plate reader. Results were significantly
more consistent with CTG compared to AlamarBlue, and therefore CTG was chosen as the reagent for
the HTS.
55

Figure 2.1 Plate templates for primary screen
56

2.3.2 Primary screen The plate layout for the primary screen is illustrated in Figure 2.1. The compound library used in the
primary screen consisted of 73 targeted agents, 71 epigenetic agents, 208 kinase inhibitors and 3.707
known drugs (452). For targeted agents, epigenetic agents and kinase inhibitors, the primary screen
was conducted using 11 concentrations; for the known drug library, 3 concentrations were used. Stock
plates for a fixed dose of dinaciclib and bortezomib as determined in the optimisation phase were
freshly prepared using a multichannel pipette. Library compounds were added to cells using pintool
transfer as described above, followed by dinaciclib or bortezomib.
At assay end-point, cell viability was measured using the CellTitre-Glo luminescent assay as
described above and average viability was normalised to DMSO control treated wells. Dose-response
curves and the half maximal effective concentration (EC50) for each individual library compound for
each cell line was approximated by fitting a four-parameter dose-response curve using XLfit (IDBS).
Dose-response curves were manually curated, and library compounds where a curve could not be
fitted were excluded from the analysis. Each EC50 value from the primary screen was used to make
four pair-wise comparisons:
1. Dinaciclib plus library compound comparing CCNE1-amplified (OVCAR3) to CCNE1-
unamplified (SKOV3)
2. Dinaciclib plus library compound comparing parental (OVCAR3) to CDK inhibitor-resistant
(OVCAR3-R1)
3. Bortezomib plus library compound comparing CCNE1-amplified (OVCAR3) to CCNE1-
unamplified (SKOV3)
4. Bortezomib plus library compound comparing parental (OVCAR3) to CDK inhibitor-resistant
(OVCAR3-R1)
Library compounds where the ratio of EC50 was less than 0.5 were selected as hits for that particular
comparison. A list of 64 compounds was selected for a secondary screen, incorporating hits as well as
other compounds of biological interest.
2.3.2 Secondary screen To identify library compounds with at least an additive effect in combination with either dinaciclib or
bortezomib, a secondary screen was performed with the library compounds in the presence or absence
of dinaciclib or bortezomib. All secondary screen compounds were tested using 11 concentrations and
carried out in duplicate.
57

Cell viability was measured at assay end-point using the CellTitre-Glo luminescence assay as above,
and average viability normalised to DMSO control treated wells. Dose-response curves and EC50
doses for each individual library compound for each cell line was approximated as above. The EC50
dose for each library compound in combination with dinaciclib or bortezomib was then compared to
the EC50 for the library compound without dinaciclib or bortezomib. For compounds where the EC50
for the combination was half or less than the EC50 for the library compound alone, this was deemed to
be a hit and taken forward for further testing.
2.3.3 Matrix screen To assess the formal interaction between the library compound and dinaciclib or bortezomib, a matrix
screen was performed. This involved a 5-point titration of each compound (library compound and
dinaciclib or bortezomib) using the Chou-Talalay methodology (453) of constant-ratio drug
combinations (see Figure 2.2). The fraction of cells affected by each drug and the combination was
assessed using the CellTitre-Glo assay, and average viability normalised to DMSO control treated
wells. The matrix screen was carried out in duplicate.
A series of combination indexes quantifying the interaction between each library compound and
dinaciclib or bortezomib was generated using CalcuSyn 2.0 software.
Figure 2.2 Example of plate setup for matrix screen 2.4 Xenograft studies
2.4.1 Engraftment of cell lines All animal studies performed as part of this thesis was approved by the Peter MacCallum Cancer
Centre Animal Experimentation Ethics Committee and conducted in accordance with the National
Health and Medical Research Council Australian Code of Practice for the Care and Use of Animals
for Scientific purposes.
Firstly, a number of cell lines (OVCAR3, OVCAR4, SKOV3, CAOV3, OAW28, COV318 and
FUOV1) were injected into immunocompromised mice (NOD/SCID or NOD/SCID/IL2Rγnull) to
0 0.25x(EC50) 0.5x(EC50) 1x(EC50) 2x(EC50) 4x(EC50)
0
0.25x(EC50)
0.5x(EC50)
1x(EC50)
2x(EC50)
4x(EC50)
Drug A
Drug
B
58

determine if they would establish xenografts. Cell lines were grown in vitro, washed twice with PBS
and resuspended in 50% Matrigel (v/v) in PBS. Mice were anaesthetised using inhaled isoflurane, ear
clipped, and the right flank shaved with clippers and cleaned with 70% (v/v) ethanol. Using a 29G
gauge insulin pen needle (BD), mice were injected subcutaneously with 5 x 10⁶ cells in 100µL. Mice
were monitored twice weekly, and tumours measured using electronic callipers. Tumour volume was
calculated using the equation: Volume = (width)2 x length/2.
For cell lines where the tumour growth was slow or inconsistent, xenografts were passaged repeatedly
through immunocompromised mice in order to adapt the cell line in the mouse microenvironment.
Xenografts were harvested and minced into a slurry consistency. The tumour slurry was then added to
2mL digestion mix of collagenase I (2mg/mL), hyaluronidase (125U/mL) and supplemented DMEM
media. The mixture was then incubated at 37°C in a shaker, and mixed regularly at 5 minute intervals
using a vortex until digested. The digested mixture was then added to 10mL solution of 1% (w/v)
bovine serum albumin (BSA) in PBS. The mixture was then centrifuged at 1,500 rpm for 5 minutes.
The supernatant was aspirated and set aside and centrifuged again to capture any epithelial cells. The
pellet was resuspended in the 1%BSA/PBS solution and filtered through a 100µm cell strainer and
then a 40µm cell strainer to remove fibroblasts. The cell strainer was then inverted and rinsed with
1%BSA/PBS solution to collect the captured epithelial cells. The solution containing the epithelial
cells was centrifuged at 1,500 rpm for 5 minutes, and the supernatant aspirated and discarded. The cell
pellet was then incubated for 1 minute with 1mL of trypsin, and then washed again with 1%BSA/PBS
and centrifuged at 1,500 rpm for 5 minutes. The supernatant was aspirated, discarded and the
remaining epithelial cell pellet resuspended in media and plated into 6-well plates or a T25 cell
culture flask depending on the size of the pellet. The cells were then expanded in vitro, and
characterised using STR genotyping to ensure that they resembled the parental cell line. The adapted
cell line was then expanded in vitro, and re-injected subcutaneously into immunocompromised mice.
This cycle was repeated until the tumours grew reliably in mice as a xenograft.
2.4.2 Implantation of oestrogen pellets For some cell lines, despite adaptation using the method described above, the growth rate as
subcutaneous xenografts was still poor. Many HGSC cell lines including OVCAR3 are known to
express oestrogen receptors (454), and implantation of oestrogen pellets have been shown to enhance
the take rate of ovarian cancer xenografts in immunocompromised mice (455). Therefore I made
oestrogen pellets to see if the growth rates of HGSC cell lines such as OVCAR3 would improve.
Oestrogen pellets were made under sterile conditions using β-oestradiol powder (Sigma) and MED-
4011 Silicone (NuSil Silicone Technology). A dose of 0.72mg oestrogen per pellet was made using
160mg β-oestradiol powder, 400mg Silicone B and 4g Silicone A. The silicone- β-oestradiol powder
59

mixture was stirred thoroughly using a spatula, and then spread evenly across a glass slide to 4mm
thickness. Slides were then transferred to a sterile petri dish, covered with Parafilm and placed into a
37°C incubator overnight. Once set, the slide was placed a 4mm x 4mm grid as a guide to cut the β-
oestradiol into evenly sized pellets. These were then stored at room temperature.
To help establish xenografts, oestrogen pellets were implanted subcutaneously into the back of
immunocompromised mice at least 3 days prior to injection of cells. Mice were firstly anaesthetised
using a mixture of ketamine and xylazine with normal saline for injection. A solution of ketamine
86mg/kg and xylazine 17mg/kg was made and 0.1mL per 10g mouse weight injected by intra-
peritoneal injection using a 1mL syringe and a 26G needle. Once the mouse was completely
anaesthetised, the incision site was shaved with clippers and cleaned with 70% ethanol. A small 5-
7mm incision was made using scissors just below the neck. Using forceps, the skin was picked up at
the incision site, and scissors placed under the skin and gently opened to create a small pocket for the
pellet. Without dropping the skin, an oestrogen pellet was picked up with forceps and placed as deep
into the pocket as possible. The pellet was released, the forceps removed and the incision site abutted
together. The incision site was closed using 3-0 antibacterial coated Vicryl absorbable sutures
(Ethicon). Mice were then allowed to recover slowly on heat pads for at least 4 hours with food and
water easily available. Mice were weighed and checked daily after implantation.
2.4.3 Drug efficacy studies Once tumour volume reached 100-150mm3, mice were randomised into groups of five for treatment
with vehicle alone or drug.
Dinaciclib was prepared fresh prior to injection in 20% (w/v) hydroxypropyl-beta-cyclodextrin
(Cyclodextrin Technologies Development, Inc) and mice dosed twice weekly as a single agent via
intraperitoneal injection. MK-2206 was reconstituted in 30% (w/v) Captisol (Ligand Technology) and
dosed at 60 mg/kg three times per week as a single agent via oral gavage. For combination studies,
maximum tolerated doses of dinaciclib 20mg/kg and MK-2206 60mg/kg were dosed three times per
week. All mice were monitored daily following drug dosing. Tumours were harvested at specific
time-points for biomarker analysis or at study endpoint, with half snap frozen in liquid nitrogen and
half fixed in formalin and paraffin embedded for IHC. Percentage tumour growth inhibition (TGI)
was calculated as 100 × (1-ΔT/ΔC) where ΔC and ΔT were determined by subtracting the mean
tumour volume (in the vehicle control and treated groups respectively) on day 1 of treatment, from the
mean tumour volume on each day of assessment. Statistical analyses were performed using GraphPad
Prism Version 6.0 (GraphPad, La Jolla, CA, USA) with analysis of variance (ANOVA) followed by
Dunnett’s post hoc test to compare the tumour growth between treatment groups.
60

3. Targeting CCNE1 amplified high-grade serous ovarian cancer via CDK2 inhibition
3.1 Introduction Although understanding of the biology and molecular characteristics of HGSC has improved
significantly over the last 10 years, only two classes of “targeted therapies” have entered routine
clinical care – anti-angiogenic agents, such as bevacizumab, and PARP inhibitors, such as olaparib.
CCNE1 amplification is a validated prognostic biomarker in HGSC, occurring in 20% of all HGSC
tumours and is associated with primary treatment resistance and reduced overall survival (Section
1.5.2). Cyclin E1 and its protein partner CDK2 are therefore of considerable interest as additional
therapeutic targets in a subset of HGSC patients.
The focus of this chapter is to study the effect of targeting CCNE1 amplified tumours via CDK2
inhibition. Using gene suppression and a small molecule CDK inhibitor, dinaciclib, I investigated the
effect of CDK2 inhibition on a panel of HGSC cell lines in vitro and in vivo. In order to enhance the
effect of dinaciclib, I performed a high throughput compound screen to identify compounds that
would be synergistic in combination with it. Results from the screen pointed to an interaction between
CCNE1 amplification and the AKT pathway, which I further explored using correlative genomic data
from TCGA, as well as functional studies in a FTSEC model. I also generated dinaciclib-resistant cell
lines in order to identify potential mechanisms of drug resistance, and combinations that may
overcome resistance.
The work from this chapter formed a key publication: Au-Yeung et. al Selective targeting of cyclin E1
amplified high grade serous ovarian cancer by CKD2 and AKT inhibition. Clinical Cancer Research,
2016. In addition, part of my work in this chapter also contributed to Etemadmoghadam et al.
Resistance to CDK2 inhibitors is associated with selection of polyploidy cells in CCNE1-amplified
ovarian cancer. Clinical Cancer Research, 2013.
3.2 Selective targeting of cyclin E1 amplified high grade serous ovarian cancer by
cyclin-dependent kinase 2 and AKT inhibition
61

Biology of Human Tumors
Selective Targeting of Cyclin E1-AmplifiedHigh-Grade Serous Ovarian Cancer by Cyclin-Dependent Kinase 2 and AKT InhibitionGeorge Au-Yeung1,2, Franziska Lang1,Walid J. Azar1, Chris Mitchell1, Kate E. Jarman3,Kurt Lackovic3,4, Diar Aziz5,CarleenCullinane1,6, RichardB. Pearson1,2,7, LindaMileshkin2,8,Danny Rischin2,8, Alison M. Karst9, Ronny Drapkin10, Dariush Etemadmoghadam1,2,5, andDavid D.L. Bowtell1,2,7,11
Abstract
Purpose: Cyclin E1 (CCNE1) amplification is associated withprimary treatment resistance and poor outcome in high-gradeserous ovarian cancer (HGSC). Here, we explore approaches totarget CCNE1-amplified cancers and potential strategies to over-come resistance to targeted agents.
Experimental Design: To examine dependency on CDK2 inCCNE1-amplified HGSC, we utilized siRNA and conditionalshRNA gene suppression, and chemical inhibition using dina-ciclib, a small-molecule CDK2 inhibitor. High-throughputcompound screening was used to identify selective synergisticdrug combinations, as well as combinations that may over-come drug resistance. An observed relationship betweenCCNE1 and the AKT pathway was further explored in genomicdata from primary tumors, and functional studies in fallopiantube secretory cells.
Results: We validate CDK2 as a therapeutic target by demon-strating selective sensitivity to gene suppression.However, we foundthat dinaciclib did not trigger amplicon-dependent sensitivity in apanel of HGSC cell lines. A high-throughput compound screenidentified synergistic combinations in CCNE1-amplified HGSC,including dinaciclib and AKT inhibitors. Analysis of genomic datafrom TCGA demonstrated coamplification of CCNE1 and AKT2.Overexpression of Cyclin E1 and AKT isoforms, in addition tomutant TP53, imparted malignant characteristics in untransformedfallopian tube secretory cells, the dominant site of origin of HGSC.
Conclusions: These findings suggest a specific dependency ofCCNE1-amplified tumors for AKT activity, and point to a novelcombination of dinaciclib andAKT inhibitors thatmay selectivelytarget patients with CCNE1-amplified HGSC. Clin Cancer Res; 1–13.�2016 AACR.
IntroductionTargeted therapies have changed the management of many
cancers types, resulting in significant improvements in clinicalresponse rates and survival (1). However, while the antiangio-genic mAb bevacizumab (2, 3) and the PARP inhibitor olaparib(4, 5) have entered care in high-grade serous ovarian cancer(HGSC) recently, the development of targeted therapy to thisdisease has been relatively slow.
HGSCs are characterized by ubiquitous TP53mutations, geno-mic instability, and widespread copy number alterations, withrelatively infrequent somatic point mutations of driver genes(6, 7). Structural aberration also contributes to loss of tumorsuppressors such as RB1 andNF1 by gene breakage (8). Defects inthe homologous recombination repair (HR) pathway are presentin approximately 50%of HGSCs, primarily associated with germ-line and somatic mutations in BRCA1, BRCA2, and associatedproteins (7). HRdeficiency imparts platinum sensitivity inHGSC,and provides the basis for the use of PARP inhibitors that targetcompensatory DNA repair pathways (4, 9). Of HGSC with intactHR, amplification of CCNE1, which encodes the cell-cycle regu-lator cyclin E1, is the best characterized driver. CCNE1 amplifi-cation or gain occurs in 20%of all HGSC tumors and is associatedwith primary treatment resistance and reduced overall survivalin HGSC (10, 11). Patients whose tumors have CCNE1
1Division of Cancer Research, Peter MacCallum Cancer Centre, Melbourne,Victoria, Australia. 2Sir Peter MacCallum Department of Medical Oncology,University of Melbourne, Parkville, Victoria, Australia. 3Walter and Eliza HallInstitute of Medical Research, Parkville, Victoria, Australia. 4Department ofMedical Biology, University of Melbourne, Parkville, Victoria, Australia. 5Depart-ment of Pathology, University of Melbourne, Parkville, Victoria, Australia.6Translational Research Program, Peter MacCallum Cancer Centre, East Mel-bourne, Victoria, Australia. 7Department of Biochemistry andMolecular Biology,University of Melbourne, Parkville, Victoria, Australia. 8Department of MedicalOncology, Peter MacCallum Cancer Centre, East Melbourne, Victoria, Australia.9Department of Medical Oncology, Dana Farber Cancer Institute, Boston,Massachusetts. 10Division of Gynecologic Oncology, Department of Obstetricsand Gynecology, Penn Ovarian Cancer Research Center, University of Pennsyl-vania Perelman School of Medicine, Philadelphia, Pennsylvania. 11KinghornCancer Centre, Garvan Institute for Medical Research, Darlinghurst, New SouthWales, Australia.
Note: Supplementary data for this article are available at Clinical CancerResearch Online (http://clincancerres.aacrjournals.org/).
D. Etemadmoghadam and D.D.L. Bowtell contributed equally to this article.
Corresponding Author: David D.L. Bowtell, Peter MacCallum Cancer Centre,Locked Bag I, A'Beckett Street, Melbourne, Victoria 8006, Australia. Phone:613-8559-7108; E-mail: [email protected]
doi: 10.1158/1078-0432.CCR-16-0620
�2016 American Association for Cancer Research.
ClinicalCancerResearch
www.aacrjournals.org OF162

amplification represent a group with unmet clinical need, as theyare unlikely to benefit from PARP inhibitors by virtue of themutual exclusivity of CCNE1 amplification and BRCA1/2 muta-tion (7, 12), and are less likely to respond to platinum agents.
In recent preclinical studies, we have shown a dependency onCDK2 (13) and HR activity (12) in CCNE1-amplified cell lines.Although targeted agents have been effective in the clinical settingacross many cancers, the emergence of acquired resistance iscommon (14). Indeed, we reported in vitro resistance to CDK2inhibitors through selection of a polyploid population in theCCNE1-amplified cell line OVCAR3 (13). Rational drug combi-nations are a potential strategy to prevent resistance (15), andmayalso facilitate improvements in the therapeutic window by reduc-ing the doses of drugs required to achieve efficacy, resulting infewer side effects (16). We therefore used a high-throughput drugscreen to identify drug combinations that synergize with theCDK2 inhibitor dinaciclib (17) to selectively target CCNE1-amplified HGSC, and to overcome resistance in a cell line thathas acquired resistance to CDK inhibitors in vitro (13). Weidentified several synergistic combinations, including dinacicliband AKT inhibitors, and found that that this synergy extendedmore generally to CCNE1-amplified HGSC cell lines. Our resultssuggest targeting CDK2 and the AKT pathway may be an impor-tant approach to the clinical management of CCNE1-amplifiedHGSC.
Materials and MethodsEthics statement
All animal experiments were approved by the PeterMacCallumCancer Centre Animal Experimentation Ethics Committee andconducted in accordance with the National Health and MedicalResearch Council Australian Code of Practice for the Care andUseof Animals for Scientific Purposes.
Cell linesOvarian cancer cell lines were obtained from the National
Cancer Institute Repository, actively passaged for less than 6months, and authenticated using short-tandem repeat markers
to confirm their identity against the Cancer Genome Projectdatabase (Wellcome Trust Sanger Institute, Cambridgeshire, Unit-ed Kingdom) before use in experiments. Cells were maintained at37�C and 5% CO2 (v/v), and cultured in RPMI1640 mediacontaining 10%(v/v) FCS and 1%penicillin/streptomycin. Trans-fection and drug sensitivity assays were performed in the absenceof antibiotics. Cell lines resistant to dinaciclib were generatedutilizing methods as described previously (13). Briefly, OVCAR3cells were plated in 6-well plates and treated with dinaciclib at theIC50 dose for two72-hour periods (media removed and fresh drugadded). Surviving cells were allowed to repopulate for 96 hoursand the process repeated once. Remaining cells were cultured inmedia or in the presence of drug, and regularly monitored forsensitivity to dinaciclib. Six independent cell lines were generatedin this fashion, and designated OVCAR3-RD1 to -RD6.
Short hairpin–mediated CDK2 knockdownShort hairpin–mediated knockdown of CDK2 was performed
by cloning CDK2-specific shRNA into a lentiviral tetracycline-inducible expression vector containing the optimized miR-Ebackbone (18). The modified lentiviral vector pRRL-T3G-Tur-boGFP-miRE-PGK-mCherry-IRES-rTA3 (also referred to asLT3GECIR) system includes a red (mCherry) fluorescent markerfor transduction and a green (turboGFP) fluorescent marker forinduction. Five CDK2-specific shRNA constructs were cloned intothis system (see Supplementary Table S1 for sequences). Forlentiviral production, HEK293T cells were transfected with plas-midDNA combinedwith the Lenti-X packaging system (ClontechLaboratories). Transfection, production of lentiviral particles, andtransduction of target cells was performed as described by themanufacturer's protocol. Doxycycline was used to induce shRNAexpression, and transfection efficiency was validated by flowcytometry (FACS), and knockdown of individual hairpins byRT-PCR and Western blot analysis. The most efficient shRNAconstruct was taken forward for in vitro and in vivo experiments.
For in vivo experiments, xenograft tumors from transduced cellswere generated as described below. Once tumors reached 100mm3, mice were randomized into two groups to receive eithernormal food and water or doxycycline food and water (2 mg/mLin 2% sucrose) as a means of reliable induction of shRNAexpression. Tumors were subsequently monitored as describedbelow.
Cyclin E1 and AKT overexpression in Fallopian tube secretoryepithelial cells
The immortalized fallopian tube secretory epithelial cell(FTSEC) line FT282 was obtained from Ronny Drapkin (Univer-sity of Pennsylvania, Philadelphia, PA; ref. 19). Derivative celllines were generated using pMSCV-mCherry-(empty) andpMSCV-mCherry-CCNE1, encoding full-length CCNE1. Addi-tional cell lines were generated with pMSCV-GFP-myr-AKT1,pMSCV-GFP-myr-AKT2, and pMSCV-GFP-myr-AKT3, encodingthe three different isoforms of myr-AKT (20). Plasmids werevalidated by sequencing, and expression of CCNE1, AKT1, AKT2,and AKT3 was validated by quantitative real-time PCR andWestern blotting. Primer sequences are listed in SupplementaryTable S2.
High-throughput compound screenThe compound library consisted of 73 targeted agents, 71
epigenetic agents, 208 kinase inhibitors, and 3,707 known drugs
Translational Relevance
High-grade serous ovarian cancer (HGSC) patients withCyclin E1 (CCNE1) amplification represent a group with highunmet clinical need. Novel therapies are needed to improveoutcomes in these patients, given that CCNE1-amplifiedtumors are unlikely to respond to chemotherapy or PARPinhibitors, and are associated with poor overall survival. Here,we validateCDK2 as a selective target forCCNE1-amplified celllines. We performed a high-throughput compound screen andidentified a number of potential therapeutic combinations.We focused on dinaciclib and AKT inhibitors, and demon-strate selective and potent activity inCCNE1-amplifiedHGSC.We further show cooperation between CCNE1 and AKT, bothin genomic data fromTCGA and functionally in fallopian tubesecretory cells. This study demonstrates approaches to targetan important subset of solid cancers, and for the first timeprovides evidence to support the design of a rational clinicaltrial that targets CCNE1-amplified HGSC.
Au-Yeung et al.
Clin Cancer Res; 2017 Clinical Cancer ResearchOF263

(21). All agents were dissolved in DMSO, and diluted to con-centrations from 0.01 to 10 mmol/L. For targeted agents, epige-netic agents and kinase inhibitors, the primary screen was con-ducted using 11 concentrations; for the known drug library threeconcentrations were used. Compounds were dispensed into 384-well drug stock plates and stored at �20�C. Stock plates fordinaciclib at a fixed dose concentration (EC30) were preparedusing a multichannel pipette before each assay.
Early passage cells were deposited into 384-well microtiterplates at 750–1,500 cells per well using a multidrop dispenser(Thermo Scientific) in 40 mL of media. Cells were allowed toadhere overnight. A MiniTrak IX (PerkinElmer Life Sciences)automated robotic platform was used to dispense compoundsinto assay plates. Compounds were added directly to assay platesusing a 384, hydrophobic slotted pintool (VP Scientific) calibrat-ed to dispense 0.1 mL of DMSO compound solution. DMSO(0.1%) was used as negative control. Cells were exposed to drugfor 48 hours, and cell viability measured using the CellTiter-GloLuminescent Assay (Promega) and the EnVision Multilabel PlateReader (PerkinElmer). Average viability was normalized toDMSO control wells, and EC50 dose was approximated by fittinga four-parameter dose–response curve using XLfit (IDBS).
Xenograft studiesEstrogen pellets were implanted subcutaneously into 4- to 6-
week-old female NOD/SCID mice to facilitate the growth ofxenografted cells. The pellet was implanted 3 days beforeinjection of cells. Cell lines were grown in vitro, washed twicewith PBS, and resuspended in 50%Matrigel (BD Biosciences) inPBS. Mice were injected subcutaneously with 5 � 106 cells in100 mL, and monitored at least twice weekly. Tumor volumewas calculated using the equation: volume ¼ (width)2 �length/2. When tumors reached 100 to 150 mm3, mice wererandomized into groups of five for treatment with vehicle aloneor drug. Dinaciclib was prepared fresh before injection in 20%(w/v) hydroxypropyl-beta-cyclodextrin (Cyclodextrin Technol-ogies Development, Inc.) and mice dosed twice weekly as asingle agent via intraperitoneal injection. MK-2206 was recon-stituted in 30% (w/v) Captisol (Ligand Technology) and dosedat 60 mg/kg three times per week as a single agent via oralgavage. For combination studies, MTDs of dinaciclib 20 mg/kgand MK-2206 60 mg/kg were dosed three times per week. Allmice were monitored daily following drug dosing. Tumors wereharvested at specific time points for biomarker analysis or atstudy endpoint, with half snap frozen in liquid nitrogen andhalf fixed in formalin and paraffin embedded for IHC. Percent-age tumor growth inhibition (TGI) was calculated as 100 �(1�DT/DC) where DC and DT were determined by subtractingthe mean tumor volume (in the vehicle control and treatedgroups, respectively) on day 1 of treatment, from the meantumor volume on each day of assessment. Statistical analyseswere performed using GraphPad Prism Version 6.0 (GraphPad)with ANOVA followed by Dunnett post hoc test to compare thetumor growth between treatment groups.
CCNE1 and AKT status in primary ovarian tumor samplesGenomic alterations identified inCCNE1 andgenes involved in
the PI3K–AKT–mTOR pathway were obtained from The CancerGenomeAtlas (TCGA) cBioPortal (22, 23). All available data as ofMarch 2015 were analyzed, comprising 316 primary ovarianserous cystadenocarcinoma samples (7).
shRNA screen dataData from the Project Achilles was obtained to evaluate the
interaction between CCNE1-amplified ovarian cancer cell linesand genes in the AKT pathway (24). Cell line copy number datawere obtained from the Cancer Cell Line Encyclopedia (25). Onlycell lines known to resemble HGSC according to their genomiccharacteristics (26) were used in the analysis (N ¼ 14, seeSupplementary Table S3). Cell lines with a log2 copy numberratio > 0.3 over the CCNE1 locus were designated as amplified (n¼ 9) and cell lines with a log2 copy number ratio < 0 weredesignated as unamplified (n ¼ 5). Cell lines with CCNE1 geneexpression greater than themedianþ1 SD (n¼ 9) were defined asCCNE1-high expression, whereas cell lines with CCNE1 geneexpression less than median (n ¼ 5) were defined as CCNE1-lowexpression.
Additional methods for gene suppression studies, Western blotanalysis, IHC, flow cytometry and drug sensitivity, clonogenic,proliferation, and anchorage-independent growth assays can befound in Supplementary Methods.
ResultsCCNE1-amplified HGSC cells are selectively sensitive to CDK2knockdown
We previously demonstrated in a limited number of cell linesthat CCNE1-amplified HGSC cell lines are selectively sensitive toCCNE1 and CDK2 knockdown mediated by siRNA (13). Follow-ing a recent analysis of ovarian cancer cell lines (26), we extendedour analysis to a wider number of HGSC cell lines and confirmedconsistent amplicon-dependent sensitivity to siRNA-mediatedCCNE1 and CDK2 knockdown (Fig. 1A and Supplementary Fig.S1A and S1B). The OVCAR8 cell line has a low-level gain ofCCNE1 and was not sensitive to CCNE1 or CDK2 knockdown(Fig. 1A).However, OVCAR8does not overexpress cyclin E1 at themRNA or protein level (Supplementary Fig. S1B and S1C) com-pared with other cell lines such as OVCAR4 that have similarCCNE1 copy number. These findings suggest a threshold ofCCNE1/CDK2 dependency that may be relevant to patient selec-tion in clinical trials targeting this oncogene in HGSC.
To validate the effect of CDK2 knockdown, we utilized atetracycline-inducible shRNA targeting CDK2 (Fig. 1B). Consis-tentwith the siRNAdata, inhibitionofCDK2by shRNA resulted inreduced clonogenic survival, more evident in the CCNE1-ampli-fied cell line, OVCAR3 compared with the CCNE1-unamplifiedcell line CAOV3 (Fig. 1C). Knockdown of CDK2 was validated atthe protein level (Supplementary Fig. S2A). Cell-cycle analysisdemonstrated arrest in G1, seen only in the OVCAR3 cell line (Fig.1D). We did not observe significant levels of apoptosis followingCDK2 knockdown, as assessed by percentage of Annexin V–positive cells measured by FACS (Supplementary Fig. S2B).
Cells transduced with CDK2-shRNA were grown as xenograftsinNOD/SCIDmice to examine the effects ofCDK2 knockdown invivo. Consistent with the in vitro data, attenuation of CDK2expression in theOVCAR3 xenograft model resulted in significanttumor growth arrest in the group receiving doxycycline in foodand water compared with controls (Fig. 1E–F). Induction ofshRNA by doxycycline was monitored by CDK2 gene expressionmeasured by RT-PCR (Supplementary Fig. S2C). Reduced Rb1phosphorylation was observed following CDK2 knockdown inOVCAR3 tumors harvested at 7 days following induction (Fig.1G), providing a biomarker of targeting cyclinE1/CDK2.
Targeting CCNE1-Amplified Cancer by CDK2 and AKT Inhibition
www.aacrjournals.org Clin Cancer Res; 2017 OF364

Au-Yeung et al.
Clin Cancer Res; 2017 Clinical Cancer ResearchOF465

Taken together, CCNE1-amplified HGSC appear selectivelysensitive to siRNA- and shRNA-mediated knockdown of CDK2both in vitro and in vivo. These findings support our previousstudies and point to CDK2 as a potential therapeutic target inCCNE1-amplified HGSC.
CDK2 inhibitor dinaciclib delayed tumor growth in CCNE1-amplified HGSC xenografts
Consistent with siRNA data, we previously showed in a limitednumber of cell lines selective sensitivity of CCNE1-amplified celllines to dinaciclib, a potent CDK2 inhibitor in advanced clinicaldevelopment (13). However, in this study, when tested across abroader panel ofHGSC cell lines, there did not appear to be a clearamplicon-dependent sensitivity (Fig. 2A), in contrast with thesiRNA and shRNA data. Furthermore, activity in vivowas also seenin a xenograft model developed from a CCNE1-unamplified cellline, CAOV3 (Fig. 2B–D). The difference in amplicon-dependentsensitivity between gene suppression and pharmacologic inhibi-tion may be due to the broad activity of dinaciclib, which, inaddition to inhibiting CDK2, is also active against CDK1, 5, 9, and12 (17, 27).
In addition to CDK2 inhibitors, we previously identified use ofbortezomib, a proteasome inhibitor, as a potential therapeuticstrategy for CCNE1-amplified HGSC (12). Although we did notobserve amplicon-dependent sensitivity to dinaciclib, we inves-tigated the interaction between dinaciclib and bortezomib to seewhether the two drugs would be synergistic in combination.Using the Chou–Talalay methodology for drug combinationstudies (28), we did not observe a synergistic interaction withdinaciclib and bortezomib (Fig. 2E and F) in a panel of CCNE1-amplified and CCNE1-unamplified HGSC cell lines. Given thislack of synergism, we sought to identify selective synergistic drugcombinations by adopting an unbiased high-throughput screen-ing approach.
Ahigh-throughput compound screen identifies synergistic drugcombinations
We performed a high-throughput compound screen to identifycombinations thatwouldbe synergistic inCCNE1-amplified cells,as well as combinations that would be selective in a CDK inhib-itor–resistant cell line OVCAR3-R1-533533 (13). In the primaryscreen, 4,059 compounds (including duplicates) were combinedwith a fixed dose of dinaciclib as described in Materials andMethods. Dose–response curves were generated and manually
curated, and compounds where a curve could not be fitted wereexcluded from the analysis. A full list of EC50 values for each cellline and compound is given in Supplementary Tables S4 and S5.
EC50 values from the primary screen were used to make twopair-wise comparisons (Fig. 2G and H): (i) dinaciclib plus librarycompound comparing OVCAR3 (CCNE1-amplified) versusSKOV3 (CCNE1-unamplified) and (ii) dinaciclib plus librarycompound comparing OVCAR3 (parental) and OVCAR3-R1(CDK inhibitor resistant). At the time of undertaking the screen,SKOV3 was a commonly used ovarian cancer cell line; however,recent studies have demonstrated that SKOV3 is unlikely toresemble HGSC (26). Therefore, any potential hits identified inthe screen were subsequently validated using only HGSC celllines.
Library compounds where the ratio of EC50 was less than 0.5were selected as hits for a secondary screen involving a total of 64compounds (Supplementary Table S6 and S7). Compounds thatappeared tohave an additive effectwith dinaciclibwere selected ashits from the secondary screen and carried forward for furthertesting.
The final part of the screen involved assessing the level ofsynergy between the library compound hits and dinaciclib involv-ing an 11-point titration of each compound. Using the Chou–Talalay methodology of constant-ratio drug combinations, aseries of combination indexes were generated to identify syner-gistic interactions.
In the OVCAR3 parental cell line, there were no synergisticcombinations identified between dinaciclib and the library com-pounds (Supplementary Table S8). In the OVCAR3-R1 cell line,there were a number of synergistic interactions identified (Sup-plementary Table S8).Nonselective BH3-mimetic agents ABT-263and ABT-737 were synergistic in combination with dinaciclib,suggestive of a class effect. This was validated further in anindependently derived dinaciclib-resistant cell line, OVCAR3-RD6 (Fig. 3A–B and Supplementary Fig. S4A–S4C). There wasno synergistic interaction noted in the combination betweendinaciclib and ABT-199 (Fig. 3C), a selective Bcl-2 antagonist.The combination of dinaciclib and ABT-737 resulted in a dose-dependent increase in apoptosis, observed only in CDK inhibi-tor–resistant cell lines as demonstrated by increase in PARPcleavage products on Western blot analysis (Fig. 3D). Mcl-1protein expression was not observed in the OVCAR3-RD6 cellline resistant to dinaciclib (Fig. 3D). Real-time PCR demonstratedupregulation of antiapoptotic genes in the dinaciclib and
Figure 1.CDK2 knockdown via siRNA and shRNA in vitro and in vivo results in selective reduction in clonogenic survival and tumor growth arrest in CCNE1-amplified HGSC. A,Clonogenic survival after transfection with CCNE1 and CDK2 siRNAs in panel of HGSC cell lines. Average percentage of discrete colonies formed after 7 to 10 daysrelative to no siRNA controls shown (n¼ 3). Error bars, SEM. Statistical significance (t test) calculated by comparison with nonsilencing (NS) siRNA in the same cellline. ��, P < 0.01, ��� , P < 0.001, ����, P < 0.0001. B, Schematic of conditional LT3GECIR lentiviral vector showing inducible transcripts produced by vector. C,Clonogenic survival after induction of a nonspecific or CDK2-targeting shRNA in OVCAR3 (CCNE1-amplified) and CAOV3 (CCNE1-unamplified). The averagepercentage of discrete colonies formed after 7 to 10 days relative to no induction shown (n ¼ 3). Statistical significance (t test) calculated by comparisonwith noninduced (�Dox) in the same cell line; �� , P <0.01, ��� , P <0.001.D,Cell-cycle analysis following CDK2 knockdownwith inducible shRNA. Proportion of cells inG1, S, or G2 phase for propidium iodide (PI)-stained cells analyzed by flow cytometry 72 hours after induction with doxycycline. Mean of three independentlyperformed experiments shown. Statistical significance (t test) calculated by comparison with noninduced (�Dox) in the same cell line. ���, P < 0.001. E, Meanpercentage change in tumor volume � SEM following induction of a nonspecific (NS) or CDK2 (sh6) shRNA in subcutaneous xenograft tumors grown inimmunocompromised mice, generated from OVCAR3 and CAOV3. Induced and noninduced groups as marked, n ¼ 5 per group. �� , P < 0.001, unpaired t testcomparison of mean percentage tumor volume change. F, Percentage tumor growth inhibition following induction of nonspecific (NS) or CDK2 (sh6) shRNAwith doxycycline. Bars, mean � SEM, n ¼ 5 mice per group. Statistical analysis performed with ANOVA followed by Dunnett post hoc test to compare thepercentage tumor growth inhibition between the treatment groups. ���� , P < 0.0001. G, IHC assessment of phospho-Rb with or without doxycyclinetreatment in OVCAR3 xenograft tumor.
Targeting CCNE1-Amplified Cancer by CDK2 and AKT Inhibition
www.aacrjournals.org Clin Cancer Res; 2017 OF566

Figure 2.
CDK inhibitor dinaciclib results in modest tumor growth inhibition in vivo but is not synergistic in combination with bortezomib in vitro. A, Mean IC50
values for a panel of HGSC cell lines treated with dinaciclib generated from dose–response curves following standard MTS cell proliferation assays. Errorbars, SEM, n ¼ 3 experiments. B, In vivo effects of dinaciclib. Immunocompromised mice bearing OVCAR3 (CCNE1-amplified) or CAOV3 (CCNE1-unamplified) tumor xenografts were treated with vehicle or drug as described in Materials and Methods. Plots represent mean tumor volume changefrom baseline � SEM, n ¼ 5 mice per group. C, The percentage tumor growth inhibition following 21 days of treatment with vehicle or dinaciclib. Barsrepresent mean� SEM, n ¼ 5 mice per group. Statistical analysis performed with ANOVA followed by Dunnett post hoc test to compare the percentage tumorgrowth inhibition between the treatment groups. �� , P < 0.01. D, Immunohistochemical analysis of Ki67 expression in OVCAR3 and CAOV3 tumorxenograft harvested 24 hours after dose of vehicle or dinaciclib. E, Formal assessment of synergy between dinaciclib and bortezomib using Chou–Talalay Isobologram analysis. Figures are generated with CalcuSyn 2.0. Data are normalized, with connecting line at X and Y corresponding tocombination index ¼ 1, representing line of additivity. Data points above the line are antagonistic, along or near the line are additive and pointsbelow the line are synergistic. F, Combination indexes for a panel of HGSC cell lines tested against dinaciclib in combination with bortezomib. Valuesrepresent mean � SEM, n ¼ 3. G–H, Scatter plots showing EC50 values for library compounds in combination with dinaciclib from primary screenfor the comparison between CCNE1-amplified and unamplified (G) and resistant versus parental (H). Data points in red represent compounds takenforward for secondary screen.
Au-Yeung et al.
Clin Cancer Res; 2017 Clinical Cancer ResearchOF667

Figure 3.
Dinaciclib in combination with nonselective BH3 mimetics are synergistic in CDK inhibitor–resistant cell lines. Combination indexes for parental and CDKinhibitor–resistant cell lines tested against dinaciclib in combination with ABT-737 (A), ABT-263 (B), ABT-199 (C). Values represent mean� SEM, n¼ 3. D,Westernblot analysis demonstrating protein expression of Bcl-XL, Mcl-1, and PARP cleavage products in OVCAR3 parental and CDK inhibitor–resistant cell lines aftertreatment with dinaciclib and ABT-737. E, Expression of antiapoptotic proteins as assessed by quantitative real-time PCR. R-lines signify cell lines resistant toPHA533533. RD lines signify cell lines resistant to dinaciclib. Bars represent mean � SEM, n ¼ 3.
Targeting CCNE1-Amplified Cancer by CDK2 and AKT Inhibition
www.aacrjournals.org Clin Cancer Res; 2017 OF768

Figure 4.
Dinaciclib in combination with two AKT inhibitors are synergistic in vitro and in vivo models of CCNE1-amplified HGSC. Combination indexes for a panel of HGSCcell lines tested against dinaciclib in combination with MK-2206 (A) and GSK2110183 (B). Values represent mean � SEM, (Continued on the following page.)
Au-Yeung et al.
Clin Cancer Res; 2017 Clinical Cancer ResearchOF869

PHA533533-resistant cell lines (Fig. 3E), but downregulation ofMCL1 in the dinaciclib-resistant OVCAR3-RD cell lines. Dinaci-clib is reported to have a greater effect on CDK9 compared withPHA533533 (13). Given thatMCL1 is regulated by CDK9 activity(29), this may explain the reduction of MCL1 levels in thepresence of dinaciclib. However, it is unclear why reduced MCL1expression is also apparent in OVCAR3-RD cell lines even whengrown in the absence of dinaciclib.
MK-2206, a pan-AKT inhibitor, was identified as a synergisticdrug combination in the CDK inhibitor–resistant cell line,OVCAR3-R1. In validating this interaction between dinacicliband MK-2206, we observed that this combination was alsosynergistic in CCNE1-amplified cell lines FUOV1 and parentalOVCAR3 (Fig. 4A). This effectwas similarly observedwith anotherAKT inhibitor, GSK-2110183 (Fig. 4B), that was not included inthe original high-throughput screen library. Exposure to dinaci-clib and MK2206 resulted in significantly higher number ofapoptotic cells in CCNE1-amplified cell lines, indicated by per-centage of Annexin V–positive cells measured by FACS (Fig. 4C).This result was similarly observed on Western blot analysis, withappearance of PARP cleavage products following treatment ofOVCAR3 cells with the combination of dinaciclib and MK-2206(Supplementary Fig. S4D). As dinaciclib targets several CDKs inaddition to CDK2 (17), we used siRNA knockdown of CDK2,CDK1, or CDK9 to determine the specificity of the synergisticeffect of dinaciclib and MK-2206. We found that the synergyobserved was predominantly mediated through CDK2 (Supple-mentary Fig. S4E).
Dinaciclib and MK-2206 are selectively synergistic in CCNE1-amplified cell lines in vivo
The in vivo effect of dinaciclib andMK-2206 was assessed usingxenograft models from CCNE1-amplified and unamplified celllines, OVCAR3 and CAOV3, respectively. The combination wassignificantly more effective than each single agent alone in theCCNE1-amplified model (Fig. 4D and E), whereas there was nostatistically significant effect of the combination compared tosingle-agent treatment in the CCNE1-unamplified model. After atreatment period of three weeks with dinaciclib and MK-2206,xenograft tumors began regrowing within 10 days of treatmentcessation. Rechallenge with the same drug combination resultedin significant tumor regression (Supplementary Fig. S4F), indi-cating continued sensitivity to the combination. Consistent withthis effect on tumor growth, treatment with dinaciclib and MK-2206 resulted in inhibition of cell proliferation and induction ofapoptosis, as assessed by Ki67 and cleaved caspase-3 IHC ontumors harvested at 24 hours (Fig. 4F and G). Taken together, thehigh-throughput screen identified a novel combination of dina-
ciclib and MK-2206 that appeared to be selectively synergistic inCCNE1-amplified HGSC cell lines both in vitro and in vivo.
CCNE1 and AKT2 are frequently coamplified in primary HGSCsamples
We sought to investigate whether there was evidence for aninteraction between CCNE1 amplification and the AKT pathwayin primary tumor samples. Analysis of TCGA dataset indicatedthat CCNE1 and AKT2 amplification events cooccur (P < 0.001;Supplementary Fig. S5). This observation was not seen with otherisoforms of AKT or genes in the AKT pathway. To examine therelationship between CCNE1 amplification and the AKT pathwayfurther, wemade use of data fromProject Achilles, a genome-wideshRNA screen of synthetic lethality in 216 cancer cell lines (24).The abundance of shRNA sequence relative to a reference poolwasmeasured by microarray to identify genes essential for survival.We analyzed the effect of shRNA-targeting genes within the AKTpathway, restricting the analysis to HGSC cell lines, classifiedaccording to CCNE1 copy number or expression. A statisticallysignificant dependence on genes in the AKT pathway, includingAKT2, was observed, indicated by a depletion of shRNAs targetingthese genes in cell lines with CCNE1 amplification or overexpres-sion (Fig. 5). CDK2 was included in the analysis as a control, andconsistentwith our previous analysis, was shown to be required inCCNE1-amplified cells (13).
Cyclin E1 and AKT overexpression cooperates to promoteuncontrolled growth in FTSECs
Previously, Karst and colleagues demonstrated that cyclin E1overexpression combinedwith TP53mutation in FTSECs resultedin increased proliferation, colony-forming ability, and colonyformation in soft agar (19). However, cyclin E1 overexpressionalone did not result in complete transformation, suggesting thatadditional events are required.
We examined the interaction between cyclin E1 and AKT over-expression in FTSECs by overexpressing the myristoylated, activeforms of AKT1, AKT2, and AKT3 (20). Expression of each AKTisoform and cyclin E1 was validated with Western blot analysis(Fig. 6A) and RT-PCR (Supplementary Fig. S6A). Overexpressionof AKT isoforms led to increased expression of AKT downstreamtargets (Supplementary Fig. S6B). AKT2 and cyclin E1 overexpres-sion alone or in combination showed a trend toward increasedproliferation compared with empty vector alone (Fig. 6B), andAKT2 or AKT3 overexpression in combination with cyclin E1showed a trend toward enhanced clonogenic colony formationin comparison with overexpression of cyclin E1 alone (Fig. 6C).There was a significant increase in soft agar colony formationwith the overexpression of AKT2 or AKT3 in combination with
(Continued.) n ¼ 3. C, HGSC cell lines were cultured in vitro with dinaciclib, MK-2206, or the combination for 24 hours and then analyzed using flowcytometry for Annexin V/propidium iodide positivity. Bars, mean � SEM, n ¼ 3. �, P < 0.05; �� , P < 0.01; ��� , P < 0.001; unpaired t test. D, In vivo effects of vehicle,dinaciclib, MK-2206, or combination. Immunocompromised mice bearing OVCAR3 (CCNE1-amplified) or CAOV3 (CCNE1-unamplified) tumor xenografts weretreated with vehicle or drug as described in Materials and Methods. Plots represent mean tumor volume change from baseline � SEM, n ¼ 5 mice pergroup. E, Percentage tumor growth inhibition following 21 days of treatment with vehicle, dinaciclib, MK-2206, or the combination. Bars, mean � SEM, n ¼ 5mice per group. Statistical analysis performed with ANOVA followed by Dunnett post hoc test to compare the percentage tumor growth inhibition between thetreatment groups. � , P < 0.05; �� , P < 0.01; ���� , P < 0.0001. F, Quantitation of immunohistochemical staining for Ki67 and cleaved caspase-3. Bars, meanpercentage of Ki67 or cleaved caspase-3–positive cells relative to background number of cells measured � SEM, n ¼ 3 in each group. Statistical analysisperformed by ANOVA with Tukey multiple comparison test to compare between treatment groups. G, Subcutaneous tumors were obtained after 24 hoursof treatment and were examined by IHC for biomarker analysis. Rb phosphorylation was inhibited by dinaciclib, but not MK-2206 treatment. AKTphosphorylation was inhibited by MK-2206, but not dinaciclib treatment. Proliferation (Ki67) was inhibited and apoptosis (cleaved caspase-3) was induced by thecombination of dinaciclib and MK-2206 in CCNE1-amplified xenograft model (OVCAR3).
Targeting CCNE1-Amplified Cancer by CDK2 and AKT Inhibition
www.aacrjournals.org Clin Cancer Res; 2017 OF970

cyclin E1 compared with overexpression of cyclin E1 alone(Fig. 6D). These findings support an interaction between cyclinE1 and AKT pathway to promote uncontrolled growth in FTSECs,andmay explain synergism observed between dinaciclib andMK-2206 in CCNE1-amplified HGSC.
DiscussionHGSC patients with CCNE1 amplification have a clear unmet
need in terms of effective therapies. In this study, we validateCDK2 as a selective target in CCNE1-amplified HGSC usingshRNA-mediated gene suppression in vitro and in vivo. However,we did not observe similar amplicon-dependent specificity todinaciclib, a small-molecule inhibitor targeting CDKs. This maybe due to the nonspecificity of inhibitors such as dinaciclib or arole for kinase-independent activities of CCNE1 in amplifiedHGSC (30). Our findings highlight the potential differencesbetween inhibition of kinase activity and complete suppressionof CCNE1 or CDK2 gene expression.
In addition to CDK2, dinaciclib targets CDK1, 5, 9, and 12(17, 27). CDK9 phosphorylates the carboxyl-terminal repeatdomains of RNA polymerase II, and inhibition of CDK9 bydinaciclib results in rapid downregulation of mRNA transcriptsand proteins with short half-lives such as the antiapoptotic BCL2family member, Mcl1 (17). Preclinical studies have indicateddinaciclib-mediated targeting of Mcl-1 may be an effective ther-apeutic approach in anumber of different cancers (17). Inhibition
of CDK2 kinase activity may also differ significantly from com-plete suppression of gene expression, resulting in varying down-stream and compensatory effects (31, 32). Studies with knockoutexperiments indicate that CDK2 functions appear redundant withCDK1, although in our studies, we did not observe upregulationof CDK1 expression following CDK2 knockdown in vitro or in vivo(data not shown).
Although we observed a difference in the amplicon-dependentsensitivity of CDK2 gene suppression compared with pharmaco-logic inhibition, dinaciclib remains a potent CDK2 inhibitor withsingle-agent activity in CCNE1-amplified HGSC cell lines and isone of the most clinically advanced CDK2 inhibitors (33). There-fore, to more effectively target CCNE1-amplified HGSCs, weperformed a combinatorial drug screen to identify compoundsthat would synergize with dinaciclib. We also sought to identifycompounds that may potentially overcome resistance to dinaci-clib, a common occurrence in the clinical use of targeted small-molecule inhibitors, by testing a cell line thatwas resistant toCDKinhibitors. Dinaciclib in combination with MK-2206, an AKTinhibitor, was identified as a synergistic combination in targetingCDK inhibitor–resistant cell lines. This supported our previouswork that identified increased AKT1 copy number and upregula-tion of genes in the AKT pathway as a potential mechanismof resistance to CDK2 inhibitors (13). In validating this finding,we observed selective, potent synergism between dinaciclib andMK-2206 in vitro and in vivomodels of CCNE1-amplified HGSCs,including parental OVCAR3 cells. This interaction was not
Figure 5.
CCNE1 and AKT2 are coamplified inprimary HGSC samples. Dot plots ofmedian shRNA abundance for eachgene targeted by shRNA in HGSC celllines, stratified by CCNE1 copy numberor expression. Depletion of shRNAabundance within a group suggestsrequirement for maintainedexpression of its target gene. Onlygenes with a statistically significantdifference are shown; seeSupplementary Table S3 for the list ofgenes and cell lines analyzed.Statistical significance (t test)calculated by comparison betweenCCNE1-amplified and unamplified orCCNE1 overexpressing and lowexpressing cell lines; � , P < 0.05; �� , P <0.01.
Au-Yeung et al.
Clin Cancer Res; 2017 Clinical Cancer ResearchOF1071

Figure 6.
Cyclin E1 and AKT overexpression cooperates to promote uncontrolled growth in FTSECs. A, Western blot analysis of fallopian tube secretory cellstransduced with cyclin E1, empty vector, and AKT1, AKT2, and AKT3 overexpression constructs. Blots are representative of three independently performedexperiments.B, Proliferation assayof fallopian tube secretory cells (FT282) transducedwith empty vector (EV), cyclin E1 (CCNE1), AKT2, and both cyclin E1 andAKT2(CCNE1þAKT2). Plots represent mean of three independently performed experiments, error bars represent SEM. C, Clonogenic survival assay of FT282 cellstransduced as labeled. Images (left) show cells fixed and stained with crystal violet. Bar chart represents mean of three independently performed experiments,error bars represent SEM. Statistical significance (t test) calculated by comparison with FT282 cells transduced with cyclin E1 (FT282-CCNE1). D, Anchorage-independent assay of FT282 cells transduced as labeled. Images (left) represent cells fixed with 2% paraformaldehyde and captured using an Olympus IX81live cell imager. Bar chart represents mean of three independently performed experiments, error bars represent SEM. Statistical significance (t test) calculatedby comparison with FT282 cells transduced with cyclin E1 (FT282-CCNE1); � , P < 0.05, �� , P < 0.01.
Targeting CCNE1-Amplified Cancer by CDK2 and AKT Inhibition
www.aacrjournals.org Clin Cancer Res; 2017 OF1172

initially observed in the primary high-throughput screen. How-ever, the use of SKOV3 cell line as a comparator in the screenmaybe a potential confounder, as the selection of compounds as hitsfrom the primary screen was based on a difference in the EC50
values between the two cell lines tested, OVCAR3 and SKOV3.Recently, multiple studies characterizing the genomic profile ofcommercially available ovarian cancer cell lines have shown thatmany of these cell lines, including SKOV3, may not accuratelyresemble HGSC (26, 34–36).
Synergism between dinaciclib andMK-2206, as well as anotherAKT-specific inhibitor GSK2110183, but an absence of a syner-gistic combination with other inhibitors of the PI3K–AKT–mTORpathway suggests that the interactionwithCCNE1may be specificto AKT. Analysis of genomic data from patients demonstrated asignificant cooccurrence of CCNE1 and AKT2 amplification,whichmay inpart be explainedby colocalizationon chromosome19q. However, FUOV1, which has CCNE1-amplification withoutAKT2-amplification (25), was equally sensitive to the combina-tion of dinaciclib and AKT inhibitors. Coexpression of AKT2 orAKT3 with cyclin E1 in a TP53-mutant FTSEC cell line resulted inincreased proliferation and anchorage-independent growth.Analysis of data from Project Achilles indicates that HGSC celllines that haveCCNE1 amplification or overexpression are depen-dent on multiple genes within the AKT pathway. We previouslyperformed a pathway analysis of genes coexpressed with CCNE1amplification and observed an enrichment of genes involved inAKT signaling (12). Collectively, these data suggest a specificdependency of CCNE1-amplified tumors for AKT activity.
Dinaciclib and MK-2206 have previously been shown to beactive against pancreatic adenocarcinoma (37). In KRAS-mutantpancreatic cancer patient–derived xenografts, Hu and colleagues(37) demonstrated efficacy of dinaciclib combined with MK-2206. They proposed that sensitivity was due to the effect ofdinaciclib on CDK5, and in turn, inhibition of RAL pathway. Onthe basis of these results, a phase I clinical trial (NIH TrialNCT01783171) of dinaciclib and MK-2206 has been initiated inpatients with advanced pancreatic cancer. While this trial willprovide safety and recommended dosing of the combination,patients are not preselected on the basis of tumoral CCNE1amplification, and the mechanism of interaction and biomarkersthat predict response are likely to be different in pancreatic cancercompared with HGSC.
Othercombinationswerealsoidentifiedfromthehigh-through-put screen. In particular, nonselective BH3-mimetic compoundsABT-737 and ABT-263were synergistic in combination with dina-ciclib inCDKinhibitor–resistantcell lines.Therewasnosynergisticinteraction between dinaciclib and the Bcl-2–specific antagonist,ABT-199, indicating that the targeting of multiple antiapoptoticproteins is potentially required to overcome resistance to CDK2inhibitors. This observation is supported by upregulation of mul-tiplegenes in thispathway includingBCL-2,BCL-XL,andBCL-Winresistant cell lines. However, the use of ABT-737 or ABT-263 incombination with dinaciclib in vivo is hindered by significanttoxicities, particularly hematologic (Joel Leverson, personal com-munication), and are therefore unlikely to have clinical utility.
Biomarker-driven trials inHGSC are needed to improve clinicaloutcomes. HGSC patients with CCNE1 amplification are a subsetthat requires different treatment approaches, given that they haveHR-proficient tumors, and as such, are likely to have poorresponses to platinum-based chemotherapy and PARP inhibitors.However, targeted therapieswhenusedalonemaynotbe sufficient
to induce selective, cytotoxic effects, and often result in thedevelopment of resistance. Combination therapies may poten-tiallybea strategy toovercomethese limitations.High-throughputdrug screening is an unbiased approach to identify novel thera-peutic strategies, and we have identified dinaciclib and MK-2206as a combination thatmay prove to selectively target patients withCCNE1-amplified HGSC. Further work incorporating additionalclinically relevantmodels andnovel combinationswill inform thedesignof rational clinical trials targetingCCNE1-amplifiedHGSC.
Disclosure of Potential Conflicts of InterestNo potential conflicts of interest were disclosed.
Authors' ContributionsConception and design: G. Au-Yeung, W.J. Azar, C. Cullinane, D. Rischin,R. Drapkin, D. Etemadmoghadam, D.D.L. BowtellDevelopment of methodology: G. Au-Yeung, F. Lang, W.J. Azar, K. Lackovic,R.B. Pearson, R. DrapkinAcquisition of data (provided animals, acquired and managed patients,provided facilities, etc.): G. Au-Yeung, F. Lang, W.J. Azar, K.E. Jarman,K. Lackovic, D. AzizAnalysis and interpretation of data (e.g., statistical analysis, biostatistics,computational analysis): G. Au-Yeung, F. Lang, W.J. Azar, K. Lackovic,C. Cullinane, D.D.L. BowtellWriting, review, and/or revision of the manuscript: G. Au-Yeung, F. Lang,C. Mitchell, K. Lackovic, C. Cullinane, R.B. Pearson, L. Mileshkin, D. Rischin,D. Etemadmoghadam, D.D.L. BowtellAdministrative, technical, or material support (i.e., reporting or organizingdata, constructing databases): W.J. Azar, C. Mitchell, K.E. Jarman, R. DrapkinStudy supervision: L. Mileshkin, D. Rischin, D. Etemadmoghadam, D.D.L.BowtellOther [createdmaterial integral to the study (engineered primary human celllines)]: A.M. Karst
AcknowledgmentsThe authors wish to acknowledge staff from the Peter MacCallum Cancer
Centre Animal facility, FACS facility, and Histology core facility for theirassistance.
Grant SupportThisworkwas supported by aNationalHealth andMedical ResearchCouncil
(NHMRC) program grant (APP1092856; to D.D.L. Bowtell), NHMRC projectgrant (APP1042358; to D. Etemadmoghadam), a Pfizer Cancer Research Grant(WI80176; to G. Au-Yeung), University of Melbourne Australian PostgraduateAward (to G. Au-Yeung), the U.S. Army Medical Research and Materiel Com-mand (OC140511; to D.D.L. Bowtell and R. Drapkin), the National CancerInstitute at the NIH (P50-CA083636 and R21 CA156021; to R. Drapkin); theHonorable Tina Brozman `Tina's Wish' Foundation (to R. Drapkin), the Dr.Miriam and Sheldon G. AdelsonMedical Research Foundation (to R. Drapkin),a Canadian Institutes of Health Research Fellowship (to A.M. Karst), a Kalei-doscope ofHope Foundation Young Investigator Research grant (to A.M. Karst),the Basser Center for BRCA, and Department of Obstetrics and Gynecology atthe University of Pennsylvania Perelman School of Medicine (to R. Drapkin).The Australian Ovarian Cancer Study is supported by the Peter MacCallumCancer Centre Foundation, U.S. Army Medical Research and Materiel Com-mand under DAMD17-01-1-0729, The Cancer Council Victoria, QueenslandCancer Fund, The Cancer Council New SouthWales, The Cancer Council SouthAustralia, The Cancer Foundation of Western Australia, The Cancer CouncilTasmania, and the National Health and Medical Research Council of Australia(NHMRC; ID#628779), Stephanie Boldeman, the Agar family, and OvarianCancer Australia.
The costs of publication of this articlewere defrayed inpart by the payment ofpage charges. This article must therefore be hereby marked advertisement inaccordance with 18 U.S.C. Section 1734 solely to indicate this fact.
ReceivedMarch 10, 2016; revised September 6, 2016; accepted September 12,2016; published OnlineFirst September 23, 2016.
Au-Yeung et al.
Clin Cancer Res; 2017 Clinical Cancer ResearchOF1273

References1. Martini M, Vecchione L, Siena S, Tejpar S, Bardelli A. Targeted therapies:
how personal should we go? Nat Rev Clin Oncol 2012;9:87–97.2. Burger RA, BradyMF, BookmanMA, Fleming GF, Monk BJ, Huang H, et al.
Incorporation of bevacizumab in the primary treatment of ovarian cancer.N Engl J Med 2011;365:2473–83.
3. Perren TJ, Swart AM, Pfisterer J, Ledermann JA, Pujade-Lauraine E, Kris-tensen G, et al. A phase 3 trial of bevacizumab in ovarian cancer. N Engl JMed 2011;365:2484–96.
4. Fong PC, Boss DS, Yap TA, Tutt A, Wu P, Mergui-Roelvink M, et al.Inhibition of poly(ADP-ribose) polymerase in tumors from BRCA muta-tion carriers. N Engl J Med 2009;361:123–34.
5. Ledermann J, Harter P, Gourley C, Friedlander M, Vergote I, Rustin G, et al.Olaparib maintenance therapy in platinum-sensitive relapsed ovariancancer. N Engl J Med 2012;366:1382–92.
6. Ahmed AA, Etemadmoghadam D, Temple J, Lynch AG, Riad M, Sharma R,et al. Driver mutations in TP53 are ubiquitous in high grade serouscarcinoma of the ovary. J Pathol 2010;221:49–56.
7. Cancer Genome Atlas Research Network. Integrated genomic analyses ofovarian carcinoma. Nature 2011;474:609–15.
8. PatchAM,Christie EL, EtemadmoghadamD,GarsedDW,George J, FeredayS, et al. Whole-genome characterization of chemoresistant ovarian cancer.Nature 2015;521:489–94.
9. Scott CL, Swisher EM, Kaufmann SH. Poly (ADP-ribose) polymeraseinhibitors: recent advances and future development. J ClinOncol 2015;33:1397–406.
10. Etemadmoghadam D, deFazio A, Beroukhim R, Mermel C, George J, GetzG, et al. Integrated genome-wide DNA copy number and expressionanalysis identifies distinct mechanisms of primary chemoresistance inovarian carcinomas. Clin Cancer Res 2009;15:1417–27.
11. Nakayama N, Nakayama K, Shamima Y, Ishikawa M, Katagiri A, Iida K,et al. Gene amplification CCNE1 is related to poor survival and potentialtherapeutic target in ovarian cancer. Cancer 2010;116:2621–34.
12. EtemadmoghadamD,Weir BA, Au-YeungG, Alsop K,Mitchell G, George J,et al. Synthetic lethality between CCNE1 amplification and loss of BRCA1.Proc Natl Acad Sci U S A 2013;110:19489–94.
13. EtemadmoghadamD,Au-YeungG,WallM,Mitchell C, KansaraM, LoehrerE, et al. Resistance to CDK2 inhibitors is associated with selection ofpolyploid cells in CCNE1-amplified ovarian cancer. Clin Cancer Res2013;19:5960–71.
14. Ellis LM, Hicklin DJ. Resistance to targeted therapies: refining anticancertherapy in the eraofmolecular oncology. ClinCancerRes 2009;15:7471–8.
15. Yap TA, Omlin A, de Bono JS. Development of therapeutic combinationstargeting major cancer signaling pathways. J Clin Oncol 2013;31:1592–605.
16. Fitzgerald JB, Schoeberl B, Nielsen UB, Sorger PK. Systems biology andcombination therapy in the quest for clinical efficacy. Nat Chem Biol2006;2:458–66.
17. Parry D, Guzi T, Shanahan F, Davis N, Prabhavalkar D, Wiswell D, et al.Dinaciclib (SCH 727965), a novel and potent cyclin-dependent kinaseinhibitor. Mol Cancer Ther 2010;9:2344–53.
18. Fellmann C, Hoffmann T, Sridhar V, Hopfgartner B, Muhar M, Roth M,et al. An optimized microRNA backbone for effective single-copy RNAi.Cell Rep 2013;5:1704–13.
19. Karst AM, Jones PM, Vena N, Ligon AH, Liu JF, Hirsch MS, et al. Cyclin E1deregulation occurs early in secretory cell transformation to promoteformation of fallopian tube-derived high-grade serous ovarian cancers.Cancer Res 2014;74:1141–52.
20. AstleMV,HannanKM,NgPY, Lee RS,George AJ, HsuAK, et al. AKT inducessenescence in human cells via mTORC1 and p53 in the absence of DNA
damage: implications for targeting mTOR during malignancy. Oncogene2012;31:1949–62.
21. Lackovic K, Lessene G, Falk H, Leuchowius KJ, Baell J, Street I. A perspectiveon 10-years HTS experience at the walter and eliza hall institute of medicalresearch - eighteen million assays and counting. Comb Chem HighThroughput Screen 2014;17:241–52.
22. Cerami E,Gao J,DogrusozU,Gross BE, Sumer SO, Aksoy BA, et al. The cBiocancer genomics portal: an open platform for exploring multidimensionalcancer genomics data. Cancer Discov 2012;2:401–4.
23. Gao J, Aksoy BA, Dogrusoz U, Dresdner G, Gross B, Sumer SO, et al.Integrative analysis of complex cancer genomics and clinical profiles usingthe cBioPortal. Sci Signal 2013;6:pl1.
24. Cowley GS, Weir BA, Vazquez F, Tamayo P, Scott JA, Rusin S, et al. Parallelgenome-scale loss of function screens in 216 cancer cell lines for theidentification of context-specific genetic dependencies. Sci Data 2014;1:140035.
25. Barretina J, Caponigro G, Stransky N, Venkatesan K, Margolin AA, Kim S,et al. The cancer cell line encyclopedia enables predictive modelling ofanticancer drug sensitivity. Nature 2012;483:603–7.
26. Domcke S, Sinha R, LevineDA, Sander C, Schultz N. Evaluating cell lines astumour models by comparison of genomic profiles. Nat Commun2013;4:2126.
27. Shapiro G. Beyond CDK4/6: Targeting additional cell cycle and transcrip-tional CDKs in breast cancer [abstract]. In: Proceedings of the Thirty-EighthAnnual CTRC-AACR San Antonio Breast Cancer Symposium; 2015 Dec 8–12; San Antonio, TX. Philadelphia (PA): AACR. Abstract nr MS1–1.
28. Chou TC.Drug combination studies and their synergy quantification usingthe Chou-Talalay method. Cancer Res 2010;70:440–6.
29. Gojo I, Zhang B, Fenton RG. The cyclin-dependent kinase inhibitorflavopiridol induces apoptosis in multiple myeloma cells through tran-scriptional repression and down-regulation of Mcl-1. Clin Cancer Res2002;8:3527–38.
30. Geng Y, Lee YM, Welcker M, Swanger J, Zagozdzon A, Winer JD, et al.Kinase-independent function of cyclin E. Mol Cell 2007;25:127–39.
31. Horiuchi D, Huskey NE, Kusdra L, Wohlbold L, Merrick KA, Zhang C, et al.Chemical-genetic analysis of cyclin dependent kinase 2 function reveals animportant role in cellular transformation bymultiple oncogenic pathways.Proc Natl Acad Sci U S A 2012;109:E1019–27.
32. Echalier A, Cot E, Camasses A, Hodimont E, Hoh F, Jay P, et al. Anintegrated chemical biology approach provides insight into Cdk2functional redundancy and inhibitor sensitivity. Chem Biol 2012;19:1028–40.
33. AsgharU,Witkiewicz AK, TurnerNC, Knudsen ES. The history and future oftargeting cyclin-dependent kinases in cancer therapy. Nat Rev Drug Discov2015;14:130–46.
34. Anglesio MS, Wiegand KC, Melnyk N, Chow C, Salamanca C, Prentice LM,et al. Type-specific cell linemodels for type-specific ovarian cancer research.PLoS ONE 2013;8:e72162.
35. Beaufort CM, Helmijr JC, Piskorz AM, Hoogstraat M, Ruigrok-Ritstier K,Besselink N, et al. Ovarian cancer cell line panel (OCCP): clinicalimportance of invitro morphological subtypes. PLoS ONE 2014;9:e103988.
36. Elias KM, Emori MM, Papp E, MacDuffie E, Konecny GE, Velculescu VE,et al. Beyond genomics: critical evaluation of cell line utility for ovariancancer research. Gynecol Oncol 2015;139:97–103.
37. Hu C, Dadon T, Chenna V, Yabuuchi S, Bannerji R, Booher R, et al.Combined inhibition of cyclin-dependent kinases (Dinaciclib) and AKT(MK-2206) blocks pancreatic tumor growth and metastases in patient-derived xenograft models. Mol Cancer Ther 2015;14:1532–9.
www.aacrjournals.org Clin Cancer Res; 2017 OF13
Targeting CCNE1-Amplified Cancer by CDK2 and AKT Inhibition
74

SUPPLEMENTARY METHODS
Gene suppression studies and Clonogenic Survival Assay
Methods and transfection conditions for siRNA studies have been previously described (18).
Following 24 hours of transfection, cells were trypsinized to form a single cell suspension,
counted using Coulter Counter and cell number equalised for each experimental condition.
Cells were then seeded at low density (500-2,000 cells) in a 6 well plate in triplicate. After 7-
10 days, cell colonies were fixed and stained with 20% (v/v) methanol and 0.1% (w/v) crystal
violet. Cells were rinsed in water, air-dried and discrete colonies counted using MetaMorph
(Molecular Devices, Sunnyvale, CA).
Drug sensitivity assays
Dinaciclib was obtained from Merck, ABT-737 from AbbVie, and MK-2206, GSK2110183,
ABT-263 and ABT-199 were purchased from SelleckChemicals. Drug sensitivity to
individual agents was determined using the CellTitre 96 Aqueous Non-Radioactive Cell
Proliferation Assay (Promega) as described previously (18). IC50 dose was approximated by
fitting a four-parameter dose-response curve (Hill equation) using Prism 6 (GraphPad
Software). Drug combination studies were performed according to the Chou-Talalay fixed
dose combination method (22), with dose response curves generated for both single agents
and in combination. A combination index (CI) was determined using CalcuSyn 2.0 (Biosoft),
and interactions interpreted as: CI < 1 synergistic; CI = 1 additive; CI > 1 antagonistic.
Western Blot analysis
Whole-cell protein lysates were boiled, resolved by SDS-PAGE using 12-15% (w/v)
acrylamide gels, and then transferred to polyvinylidene difluoride membranes. Blots were
75

blocked in 5% (w/v) non-fat milk powder in PBS-T (0.1% Tween in PBS) and probed
overnight at 4°C in primary antibody. The following primary antibodies were used: cyclin E1
(clone HE12), CDK2 (clone D-12; Santa Cruz Biotechnology), p-Rb (Ser807/811), p89
PARP1 caspase cleavage product, AKT, p-AKT (Ser473), AKT1, AKT2 (all Cell Signaling
Technology) and AKT3 (Merck Millipore). Membranes were washed in PBS-T and
incubated with peroxidase-conjugate secondary antibody for 1 hour at room temperature,
washed and developed by chemiluminescence before being exposed to radiographic film.
Blots were re-probed with α-tubulin or β-actin antibodies to assess protein loading.
Immunohistochemistry
Sections from formalin-fixed, paraffin embedded tissues were stained according to standard
protocols. Antibodies against Ki67 (Abcam), phosphorylated Rb (Ser807/811),
phosphorylated AKT (Ser473), and cleaved caspase 3 (all from Cell Signalling Technology)
were used. Images were captured using an Olympus BX61 microscope. To determine the
positive staining cells for Ki67 or cleaved caspase-3, one representative field was chosen for
3 different samples for each treatment group, and slides were analysed quantitatively using
Metamorph. The percentage of positive cells relative to total cells measured within each field
was plotted, and statistical analysis performed using ANOVA with Tukey’s multiple
comparison test to compare between treatment groups.
Flow Cytometry
Methods for cell-cycle and apoptosis analysis by FACS have been previously described (13,
24). Briefly, for cell-cycle analysis, cells were plated in 6 well plates and shRNA was
induced using doxycycline. Following 72 hours of induction, cells were rinsed in PBS,
trypsinized and fixed in 70% ice-cold ethanol. Cells were pelleted and resuspended in a
76

solution containing 50µg.mL-1
propidium iodide (PI) and 100U.mL-1
RNAase (Qiagen) for
30 minutes at room temperature. Up to 10,000 cells were then counted by FACSCanto II (BD
Biosciences). Viable cell-cycle profiles and percentage of cells in each cell-cycle phase was
determined using FlowLogic (Inivai Technologies Australia). For Annexin V-PI apoptosis
assay, cells were plated in 12 well plates and either drug treated or shRNA induced using
doxycycline. Following 24 hours (of drug treatment) or 72 hours (of shRNA induction), cells
were collected and stained with Annexin V antibody (BD Pharmingen) and 50µg.mL-1
PI.
Cells were incubated at room temperature for 15 minutes and then analysed by FACSCantoII.
Percentage of Annexin V and PI positive cells was determined using FlowLogic.
Proliferation assay
Cells were seeded in 96-well plates (500 cells per well, 6 replicates) and fixed and stained at
24, 48 and 72 hours with 2% Paraformaldehyde and DAPI. Cell density was quantified using
CellInsight cell imager (ThermoScientific).
Anchorage-independent growth assay
Cells were suspended in 50μL of 0.375% Agarose II (Amresco, Ohio, USA) and seeded over
a 0.75% agar base in 96 well plates (300 cells per well, 6 replicates). Plates were incubated at
37°C and 5% CO2 for three weeks, and then fixed with 2% Paraformaldehyde. 46 stages of
one microscopic field (4x magnification) per well were photographed using an Olympus
IX81 live cell imager and the number of colonies > 100μm were counted manually.
SUPPLEMENTARY FIGURE AND TABLE LEGENDS
Supplementary Figure S1. Validation of CCNE1 and CDK2 siRNA-mediated
knockdown.
77

(A) CCNE1 and CDK2 gene expression by RT-PCR after gene knockdown, normalised to no
siRNA control cells within each cell line. Data representative of 3 independently performed
experiments.
(B) Cyclin E1 (CCNE1) and CDK2 protein level after gene knockdown assessed by western
blot analysis.
(C) Baseline cyclin E1 gene expression by RT-PCR in panel of HGSC cell lines, relative to
CAOV3 (CCNE1 unamplified).
Supplementary Figure S2. Validation of CDK2 knockdown mediated by shRNA in vitro
and in vivo
(A) CDK2 and phosphorylated Rb protein level after induction of non-specific (NS) or
CDK2-shRNA (shRNA3 and shRNA6) with doxycycline in vitro, as assessed by Western
blot analysis.
(B) OVCAR3 (CCNE1 amplified) or CAOV3 (CCNE1 unamplified) cells transfected with
either non-specific (NS) or CDK2-shRNA (CDK2-sh6) induced with doxycycline for 24, 48
or 72 hours and then analysed using flow cytometry for Annexin V/propidium iodide
positivity. Error bars represent mean ± SEM, n=3.
(C) CDK2 gene expression by RT-PCR after induction with doxycycline in vivo, normalised
to parental cell line without shRNA; representative data shown.
Supplementary Figure S3. FACS plots validating incorporation and induction of
shRNA into OVCAR3 and CAOV3 cells
Proportion of mCherry and GFP expressing cells after induction of shRNA by doxycycline as
assessed by flow cytometry.
78

Supplementary Figure S4. Characterisation of CDK resistant lines and Supplementary
data supporting drug treatment
(A) IC50 values over increasing passages for independently generated OVCAR3-RD cell lines
resistant to dinaciclib. Dotted line indicates the IC50 value for parental cell lines.
(B-C) Average IC50 values for parental, OVCAR3-533533-R1, OVCAR3-RD1 cell lines
against (B) dinaciclib and (C) PHA533533 determined using a 72-hour MTS proliferation
assay. Bars represent mean ± SEM, n=3. **, p<0.01, ****, p<0.0001, unpaired t-test
(D) Western blot analysis of OVCAR3, OVCAR4 and Kuramochi cell lines after treatment
with vehicle, dinaciclib, MK-2206 and combination, demonstrating inhibition of
phosphorylated AKT, and increasing PARP cleavage indicative of apoptosis
(E) Viability of OVCAR3 cells following treatment with increasing doses of MK-2206
combined with siRNA-mediated knockdown of non-silencing (NS), CDK2, CDK1 and
CDK9. Bars represent mean ± SEM, n=3. **, p<0.001, unpaired t-test
(F) Retreatment of subcutaneous OVCAR3 xenografts with dinaciclib and MK-2206
following an initial period of exposure resulted in significant tumor regression. Plots
represent tumor volume from baseline ± SEM, n=4 in vehicle retreatment group, n=12 in
drug retreatment group. **, p<0.01, unpaired t test comparison of mean percentage volume
change between vehicle and re-treatment group.
Supplementary Figure S5. Extended Oncoprint figure from TCGA
Oncoprint figure from TCGA study of primary HGSC samples (n=316) illustrating cases
with genomic aberrations in CCNE1 and genes in PI3K-AKT-mTOR pathway. Statistical
significance derived from Fisher exact test. **, p<0.001
Supplementary Figure S6. Validation of FT282 over-expression constructs
79

(A) Gene expression assessed by RT-PCR of FT282 cells after transfection with cyclin E1,
AKT1, AKT2 or AKT3.
(B) Western blot analysis of FT282 cells following transfection with cyclin E1, AKT1, AKT2
and AKT3, demonstrating increased expression of downstream targets of AKT. EV = empty
vector
Supplementary Table S1
RT-PCR Primer sequences used in the study
Supplementary Table S2
CDK2 shRNA sequences used in the study
Supplementary Table S3
Cell lines and genes used in analysis from Project Achilles
Supplementary Table S4
EC50 values for compounds from primary screen for OVCAR3 and SKOV3 cell lines
Supplementary Table S5
EC50 values for compounds from primary screen for OVCAR3 and OVCAR3-R1 cell lines
Supplementary Table S6
List of compounds and their primary targets tested in the secondary screen for OVCAR3 and
SKOV3 cell lines
80

Supplementary Table S7
List of compounds and their primary targets tested in the secondary screen for OVCAR3 and
OVCAR3-R1 cell lines
Supplementary Table S8
List of combination indexes and type of interaction between compounds tested in the matrix
screen
81

O V C A R 3
log
2 m
RN
A r
ati
o t
o c
on
tro
l
N S C C N E 1 C D K 2
-4
-3
-2
-1
0
1
2
O V C A R 8
log
2 m
RN
A r
ati
o t
o c
on
tro
l
N S C C N E 1 C D K 2
-5
-4
-3
-2
-1
0
1
2
O V K A T E
log
2 m
RN
A r
ati
o t
o c
on
tro
l
N S C C N E 1 C D K 2
-4
-3
-2
-1
0
1
2
F U O V 1
log
2 m
RN
A r
ati
o t
o c
on
tro
l
N S C C N E 1 C D K 2
-8
-6
-4
-2
0
2
C A O V 3
log
2 m
RN
A r
ati
o t
o c
on
tro
l
N S C C N E 1 C D K 2
-4
-3
-2
-1
0
1
2
O A W 2 8
log
2 m
RN
A r
ati
o t
o c
on
tro
l
N S C C N E 1 C D K 2
-3
-2
-1
0
1
2
C C N E 1
C D K 2
C O V 3 1 8
log
2 m
RN
A r
ati
o t
o c
on
tro
l
N S C C N E 1 C D K 2
-4
-3
-2
-1
0
1
2
C C N E 1
C D K 2
Supplementary Figure S1.
A
B
siRNA
siRNA
CCNE1 amplified cell lines
CCNE1 unamplified cell lines
C
82
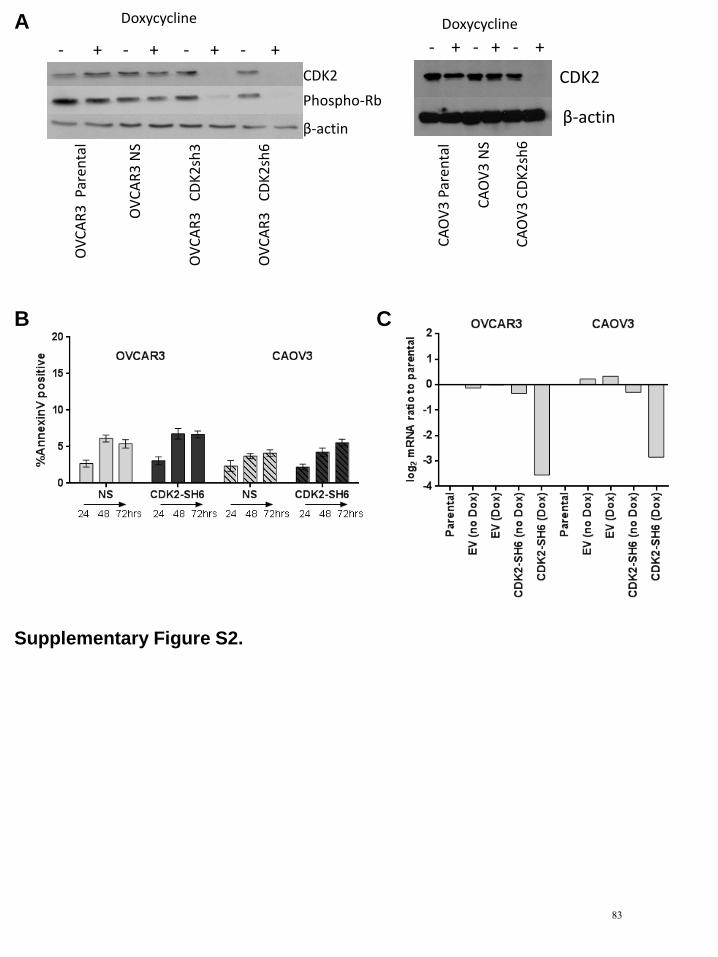
CDK2
β-actin
OV
CA
R3
Par
enta
l
OV
CA
R3
NS
OV
CA
R3
C
DK
2sh
3
OV
CA
R3
C
DK
2sh
6
Phospho-Rb
Doxycycline
- + - + - + - + - + - + - +
Doxycycline
CDK2
β-actin
CA
OV
3 P
aren
tal
CA
OV
3 N
S
CA
OV
3 C
DK
2sh
6
B
A
Supplementary Figure S2.
C
83

- Doxycycline + Doxycycline m
Ch
err
y
GFP
- Doxycycline + Doxycycline
Supplementary Figure S3.
CAOV3
CCNE1 unamplified
OVCAR3
CCNE1 amplified
84

D
Supplementary Figure S4.
Dinaciclib
MK-2206
Total Akt
Phospho Akt
Cleaved PARP
Tubulin
- + - + - + - + - + - + - - + + - - + + - - + +
OVCAR3 CCNE1
amplified
OVCAR4 Kuramochi
E
CCNE1 unamplified
C B A
F
85

Supplementary Figure S5.
**
86

A
Supplementary Figure S6.
B
87

SUPPLEMENTARY TABLE S1 - PRIMER SEQUENCESRT-PCR SEQUENCESLocus Left Sequence (Forward) Tm Right Sequence (Reverse) Tm Product size (bp)CCNE1 GAAATGGCCAAAATCGACAG 60.45 TCTTTGTCAGGTGTGGGGA 60.1 110CDK2 GGCCATCAAGCTAGCAGACT 59.6 GAATCTCCAGGGAATAGGGC 59.9 102CDK1 TGGATCTGAAGAAATACTTGGATTCTA 60.7 CAATCCCCTGTAGGATTTGG 59.2 96AKT1 ATGAGCGACGTGGCTATTG 59.8 GTAGCCAATGAAGGTGCCAT 60.0 114AKT2 TCCGAGGTCGACACAAGGTA 60.2 CTGGTCCAGCTCCAGTAAGC 60.1 105AKT3 TTTGATGAAGAATTTACAGCTCAGA 59.4 TCTCATTGTCCATGCAGTCC 59.6 88BCL-2* CCGCATCAGGAAGGCTAGAG 62.3 CTGGGACACAGGCAGGTTCT 62.6 95BCL-XL* TGGAGTCAGTTTAGTGATGTGGA 59.6 CCAGGATGGGTTGCCATTG 64.6 102BCL-W* GACAAGTGCAGGAGTGGATG 58.5 AAGGCCCCTACAGTTACCAG 58.7 208MCL-1* GTAAGGAGTCGGGGTCTTCC 59.9 CCCCACAGTAGAGGTTGAGT 56.6 108
*from Liu et al Gut 2015
88

SUPPLEMENTARY TABLE S2 - shRNA SEQUENCES
CDK2 shRNA ID SEQUENCE1 TGCTGTTGACAGTGAGCGCCGTACGGAGTTGTGTACAAAGTAGTGAAGCCACAGATGTACTTTGTACACAACTCCGTACGTTGCCTACTGCCTCGGA3 TGCTGTTGACAGTGAGCGCGGTTATATCCAATAGTAGAGTTAGTGAAGCCACAGATGTAACTCTACTATTGGATATAACCTTGCCTACTGCCTCGGA5 TGCTGTTGACAGTGAGCGACGAGAGATCTCTCTGCTTAAGTAGTGAAGCCACAGATGTACTTAAGCAGAGAGATCTCTCGGTGCCTACTGCCTCGGA6 TGCTGTTGACAGTGAGCGAAAGGATGAACAATTATATTTATAGTGAAGCCACAGATGTATAAATATAATTGTTCATCCTTCTGCCTACTGCCTCGGA8 TGCTGTTGACAGTGAGCGAAGGGATTGTGCTTCATTCCAATAGTGAAGCCACAGATGTATTGGAATGAAGCACAATCCCTGTGCCTACTGCCTCGGA
89

SUPPLEMENTARY TABLE S3 - DATASET FOR ANALYSIS FROM PROJECT ACHILLES
CELL LINE CCNE1 COPY NUMBER CCNE1 EXPRESSIONCAOV4_OVARY High HighEFO21_OVARY High HighJHOC5_OVARY High HighKURAMOCHI_OVARY High HighNIHOVCAR3_OVARY High HighOV90_OVARY High HighOVCAR4_OVARY High HighOVCAR8_OVARY High LowRMUGS_OVARY High HighCAOV3_OVARY Low HighCOV362_OVARY Low LowCOV504_OVARY Low LowCOV644_OVARY Low LowJHOM1_OVARY Low Low
GENES ANALYSEDAKT1AKT2AKT3BADCASP9CDK2CDKN1ACDKN1BCHEK1FOXO1FOXO3FOXO3BFOXO4GSK3AGSK3BMAP3K5MDM2MLST8MTORNOS3PDPK1PIK3CAPIK3R1PIK3R2PTENRAF1RHEBRICTORRPTORTSC1TSC2WNK1
90

SUPPLEMENTARY TABLE S4 - EC50 VALUES FOR PRIMARY SCREEN+DinaciclibCOMPOUND OVCAR3 SKOV3 Ratio10-DEBC hydrochloride 9.014 9.750 0.92517-DMAG 1.149 0.560 2.0522,3-Dimethoxy-1,4-naphthoquinone 8.824 3.472 2.5413,4-Dichloroisocoumarin 3.512 3.782 0.9293`-Fluorobenzylspiperone maleate 9.241 5.474 1.6885-azacytidine 1.984 7.997 0.2485-Nonyloxytryptamine oxalate 10.490 9.062 1.158A23187 1.228 0.371 3.310A-7 hydrochloride 8.833 8.623 1.024A-77636 hydrochloride 9.522 3.694 2.578ABT-199 6.934 5.436 1.276ABT-263 0.941 0.972 0.968ABT-737 5.597 3.955 1.415ABT-737 7.270 3.978 1.828AC220 7.099 3.893 1.824AC-220 7.820 5.666 1.380AC-93253 iodide 0.431 0.336 1.283AEE788 7.038 5.349 1.316AG13958 5.210 3.199 1.629AGK2 0.912 1.243 0.734Alexidine dihydrochloride 1.747 1.209 1.445AM 404 6.403 2.327 2.752AMG-47a 4.703 5.364 0.877AMG-Tie2-1 9.083 6.956 1.306Aminopurvalanol A 10.812 10.605 1.020Amlodipine 11.597 10.197 1.137Amsacrine hydrochloride 8.217 1.163 7.065Anacardic acid 7.747 9.217 0.841Anisomycin 0.755 0.623 1.212AP24534 1.385 0.740 1.872AP24534 2.517 1.316 1.913Apicidin 2.490 0.804 3.097Apomorphine hydrochloride 9.558 12.430 0.769Apomorphine hydrochloride hemihydrate 2.480 4.362 0.569AR-42 0.424 0.133 3.188ARP 101 10.354 1.471 7.039Astemizole 8.855 8.362 1.059AT9283 3.453 6.778 0.509Atovaquone 12.410 8.054 1.541Auranofin 1.139 1.153 0.988Auranofin 1.270 1.197 1.061Aurora A Inhibitor I 1.506 1.091 1.380AV-412 1.731 0.959 1.805Azathioprine 5.947 8.133 0.731AZD7762 1.973 1.697 1.163AZD7762 3.177 1.734 1.832Bax channel blocker 3.785 2.568 1.474
EC50 (μM)
91

Belinostat 2.425 8.754 0.277Benfluorex hydrochloride 11.057 7.706 1.435Benzethonium chloride 7.278 7.828 0.930Bepridil hydrochloride 8.516 6.145 1.386Beta-Escin 9.036 8.899 1.015beta-Lapachone 2.464 1.823 1.352BI 2536 0.905 0.970 0.933BI-2536 1.258 1.738 0.724BIBU 1361 dihydrochloride 4.615 3.268 1.412BIO 4.176 9.269 0.451BIX-01294 4.751 6.531 0.727BML-281 1.897 4.899 0.387BMS 191011 9.427 8.600 1.096BMS-193885 4.233 4.756 0.890BMS-2 6.640 5.523 1.202BNTX maleate 4.003 2.634 1.520Bosutinib 5.714 2.575 2.219Bosutinib 4.524 1.440 3.142Bromoacetyl alprenolol menthane 7.901 4.221 1.872BS-181 hydrochloride 8.993 4.905 1.833Butoconazole nitrate 4.203 11.301 0.372BVT 948 4.172 3.663 1.139BX795 8.288 10.053 0.824Calcimycin 0.275 0.970 0.284Calmidazolium chloride 2.352 1.107 2.125Camptothecin 0.189 3.129 0.060Cantharidic Acid 2.457 2.345 1.048Cantharidin 3.884 4.042 0.961Capsazepine 10.292 4.543 2.265Carvedilol 5.010 6.184 0.810CCT129202 3.666 3.879 0.945CD 1530 4.032 4.384 0.920CD 437 0.969 0.990 0.979Cediranib(AZD2171) 4.650 3.242 1.434CGK 733 10.734 6.133 1.750CGP 71683 3.875 3.427 1.131CGP 7930 11.000 6.239 1.763CGP-74514A hydrochloride 3.452 1.646 2.097CGP-7930 11.749 7.556 1.555Chelerythrine chloride 1.084 0.295 3.675Chicago sky blue 6B 10.991 6.585 1.669CHIR-258 8.213 3.263 2.517Chlorhexidine 4.296 3.002 1.431Chlorpromazine hcl 10.771 4.012 2.685Chlorpromazine hydrochloride 7.427 10.484 0.708Chlorpromazine hydrochloride 10.921 10.253 1.065Chlorprothixene 8.581 6.602 1.300Chlorprothixene hydrochloride 11.692 5.445 2.147Chrysene-1,4-quinone 2.729 1.122 2.432CI-1033 1.331 1.528 0.871
92

CI-1033 2.304 1.761 1.308CI-1040 6.458 7.722 0.836CI-1040 11.272 10.103 1.116CI-976 11.469 4.696 2.442Clemastine fumarate 9.841 7.216 1.364Clioquinol 10.680 7.354 1.452Clomipramine hydrochloride 8.879 4.310 2.060Cryptotanshinone 3.433 7.094 0.484CUDC-101 1.084 0.565 1.919Cyclosporin A 4.595 5.937 0.774CYT387 2.143 9.225 0.232Danusertib 5.887 5.679 1.037Dasatinib 1.636 4.033 0.406Dasatinib 1.481 3.049 0.486Daunorubicin hydrochloride 0.410 0.727 0.564Dequalinium dichloride 8.994 11.488 0.783Dihydroouabain 3.574 7.994 0.447Dimethisoquin hydrochloride 12.086 5.413 2.233Diphenyleneiodonium chloride 2.386 1.583 1.507DL-erythro-Dihydrosphingosine 5.851 8.954 0.653DL-Stearoylcarnitine chloride 10.806 10.631 1.016Doxorubicin hydrochloride 0.702 0.239 2.937Doxorubicin hydrochloride 1.971 0.642 3.070Droxinostat 6.558 6.282 1.044Ebastine 3.847 9.121 0.422Econazole nitrate 5.092 9.815 0.519Efavirenz 9.137 7.617 1.200Eliprodil 7.897 4.019 1.965Ellipticine 2.739 1.536 1.783Elvitegravir 9.848 9.744 1.011ENMD-2076 7.481 8.499 0.880EO 1428 5.161 2.973 1.736Estradiol Valerate 10.391 9.188 1.131ET-18-OCH3 4.211 5.623 0.749Ethynylestradiol 3-methyl ether 12.391 12.422 0.998EX 527 9.245 9.727 0.950Felodipine 4.366 8.357 0.522Fenbendazole 9.492 5.972 1.589Fendiline hydrochloride 3.124 2.901 1.077Fenretinide 4.481 3.260 1.375FIT 6.986 4.562 1.531Fluoxetine hydrochloride 8.948 3.499 2.557Fluphenazine dihydrochloride 9.309 9.277 1.003Fluspirilen 8.724 8.722 1.000Fluspirilene 9.818 5.728 1.714Formoterol 10.635 2.619 4.061Garcinol 4.010 7.607 0.527GBR 12909 11.230 11.936 0.941GBR 12909 dihydrochloride 9.428 4.884 1.930GBR 12935 dihydrochloride 12.200 12.044 1.013
93

GBR 13069 dihydrochloride 4.850 5.952 0.815GBR-12909 dihydrochloride 9.022 3.955 2.281GBR-12935 dihydrochloride 11.637 7.306 1.593GDC-0941 4.367 8.920 0.490GDC-0941 3.364 5.750 0.585Gefitinib 12.124 11.117 1.091GF 109203X 4.369 3.846 1.136Gossypol 5.864 10.591 0.554GR 127935 9.937 8.842 1.124GR 127935 hydrochloride hydrate 8.359 4.056 2.061GSK1059615 6.851 5.226 1.311GSK2126458 0.285 2.414 0.118GSKJ4 4.881 2.368 2.061Haloprogin 11.094 4.771 2.325Hesperadin 2.254 2.708 0.832Idazoxan hydrochloride 9.271 4.126 2.247IKK 16 2.298 1.377 1.669IMD 0354 0.894 1.025 0.872IMS2186 2.099 2.609 0.805INCA-6 7.330 6.566 1.116Indatraline hydrochloride 6.532 9.215 0.709Indatraline hydrochloride 3.264 2.838 1.150Indirubin-3`-oxime 7.276 9.324 0.780Indirubin-3`-oxime 7.841 6.698 1.171Intedanib 10.915 4.436 2.461IPA-3 10.060 4.903 2.052IPAG 4.772 3.221 1.482Iressa 11.423 4.534 2.519Irinotecan 3.153 4.575 0.689ITF2357 0.762 2.337 0.326Ivermectin 3.451 2.485 1.389Ivermectin 9.658 5.087 1.899JNJ-26481585 0.127 0.023 5.522JNJ26854165 11.981 6.630 1.807JQ1 0.755 2.741 0.275JTC 801 8.424 1.174 7.175K114 5.785 3.538 1.635Ki 8751 9.235 3.023 3.055Ki8751 6.873 5.509 1.248KU55933 12.472 12.492 0.998KU57788 4.777 6.426 0.743L-703,606 oxalate salt hydrate 8.842 2.645 3.343L-733,060 hydrochloride 12.045 10.259 1.174Lapatinib 6.527 4.786 1.364Lapatinib Ditosylate 6.303 3.907 1.613LAQ824 0.395 0.133 2.970LDE225 10.523 5.542 1.899LE 135 11.874 4.669 2.543Lidoflazine 5.108 10.896 0.469Loperamide hydrochloride 10.559 10.015 1.054
94

Lovastatin 10.566 11.425 0.925LY2228820 9.667 8.374 1.154LY2784544 4.941 6.511 0.759LY500307 11.677 11.625 1.004Lylamine hydrochloride 8.823 8.868 0.995Lynestrenol 12.042 11.851 1.016M-344 4.671 1.996 2.340Mefloquine hydrochloride 8.815 2.722 3.238Mercaptopurine 4.402 6.259 0.703Merck-22-6 4.491 2.175 2.065Metergoline 6.943 3.163 2.195Metergoline 9.602 2.846 3.374Methiothepin mesylate 11.130 4.429 2.513Methyl benzethonium chloride 4.682 2.848 1.644MG 132 0.718 1.042 0.689MGCD0103 3.077 9.336 0.330Mibefradil dihydrochloride 8.982 4.207 2.135Mibefradil dihydrochloride 8.653 3.303 2.620Miconazole 7.278 3.479 2.092Mitoxantrone 0.195 0.136 1.434Mitoxantrone dihydrochloride 0.296 0.288 1.028MK-2206 2.977 1.997 1.491MLN2238 0.185 0.623 0.297MLN9708 0.283 0.542 0.522MNS 3.691 3.498 1.055MS-275 0.945 3.767 0.251Nebivolol HCl 3.425 3.247 1.055Nemadipine-A 9.750 2.373 4.109Niclosamide 12.207 9.403 1.298Niguldipine hydrochloride 2.623 2.468 1.063Nilotinib 3.812 3.092 1.233Nilotinib 4.405 3.146 1.400NNC 05-2090 hydrochloride 9.112 8.768 1.039NNC 26-9100 8.865 5.025 1.764NNC 55-0396 2.171 2.133 1.018NNC 55-0396 dihydrochloride 3.800 2.741 1.386N-Oleoyldopamine 5.674 2.435 2.330NSC 3852 5.990 1.373 4.363NSC 663284 1.942 2.279 0.852NSC 95397 3.045 1.782 1.709NSC 95397 3.123 1.048 2.980NTNCB hydrochloride 8.858 3.144 2.817NVP-ADW742 4.098 2.766 1.482NVP-TAE684 2.968 3.148 0.943Obatoclax Mesylate 1.411 2.646 0.533Octoclothepin maleate 7.298 9.867 0.740OLDA 11.154 9.995 1.116OMDM-2 8.363 5.027 1.664Oxamflatin 3.215 5.879 0.547Oxiconazole Nitrate 5.786 10.348 0.559
95

PAC 1 6.662 6.304 1.057PAC-1 12.018 3.670 3.275Panobinostat 0.202 0.100 2.020Paroxetine Hydrochloride 2.735 1.324 2.066Paroxetine maleate 10.190 10.589 0.962Parthenolide 7.817 7.874 0.993PCI-24781 0.320 0.154 2.078PD 102807 12.100 4.079 2.966PD 198306 4.306 0.345 12.481PD 407824 5.017 3.076 1.631PD-166285 hydrate 0.586 0.524 1.118PD173955 4.952 6.145 0.806PD173955 9.400 11.073 0.849PD-184161 9.256 1.303 7.104PD-407824 3.537 2.554 1.385Pelitinib 0.521 0.445 1.171Perhexiline maleate 5.064 5.566 0.910Perphenazine 12.212 4.848 2.519PF-2341066 5.428 3.890 1.395PFI-1 5.735 9.033 0.635PHA 665752 3.759 2.567 1.464PHA-680632 8.362 5.154 1.622Phorbol 12-myristate 13-acetate 4.085 2.359 1.732PI103 2.842 5.889 0.483PIK-75 Hydrochloride 0.476 0.150 3.173Pimozide 2.082 3.768 0.553Prazosin hydrochloride 9.662 11.060 0.874Prazosin hydrochloride 8.148 7.484 1.089Prenylamine lactate 8.730 4.255 2.052Proadifen hydrochloride 12.496 10.587 1.180Prochlorperazine dimaleate 9.278 9.803 0.946Propylnorapomorphine hydrochloride 9.045 8.622 1.049Pyrimethamine 1.311 0.787 1.666Pyrimethamine 2.284 1.284 1.779Pyrvinium pamoate 2.538 1.229 2.065Quinacrine dihydrochloride 10.644 3.709 2.870Quinacrine dihydrochloride dihydrate 3.585 8.024 0.447R 59-022 10.955 8.049 1.361R406 10.128 7.621 1.329R406 8.443 5.717 1.477R428 4.563 3.033 1.504RAF265 10.472 5.686 1.842Retinoic acid p-hydroxyanilide 8.336 1.474 5.655Ro 08-2750 11.562 9.539 1.212Ro 31-8220 mesylate 3.681 1.267 2.905Ro 31-8425 6.119 3.989 1.534RO495 7.333 1.787 4.104Rocilinostat 5.506 11.841 0.465RS 17053 hydrochloride 8.344 8.127 1.027RS 39604 hydrochloride 3.270 2.473 1.322
96
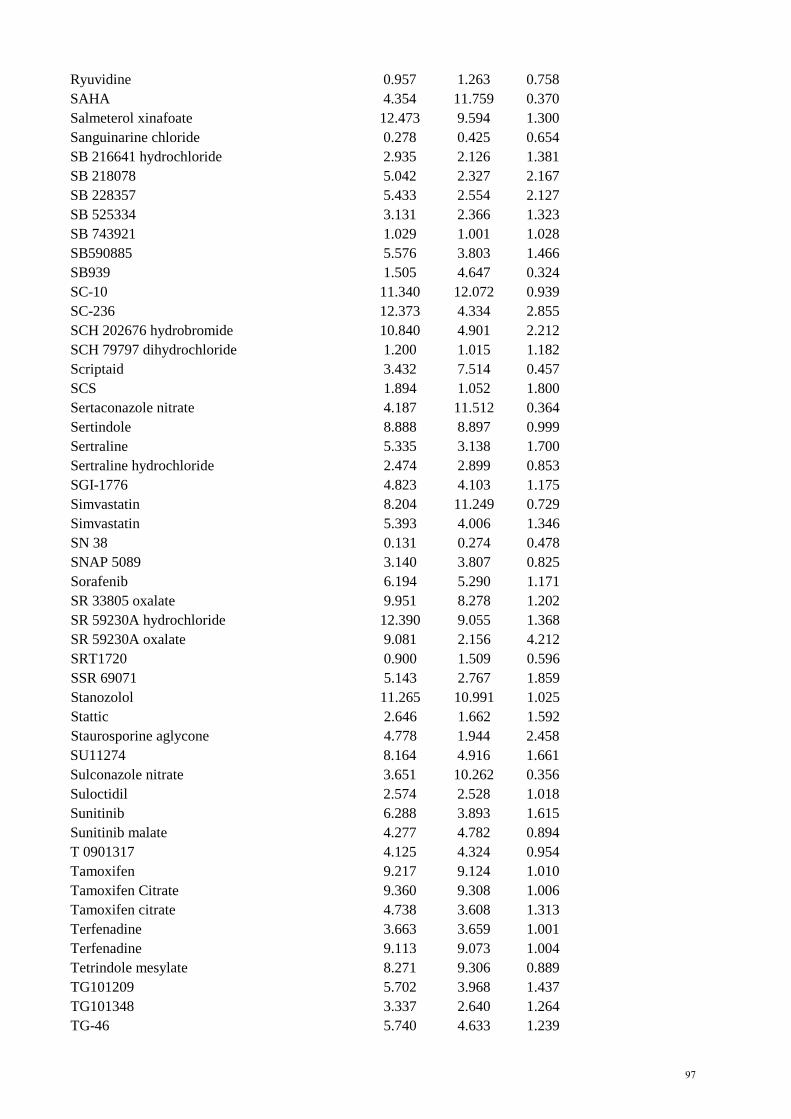
Ryuvidine 0.957 1.263 0.758SAHA 4.354 11.759 0.370Salmeterol xinafoate 12.473 9.594 1.300Sanguinarine chloride 0.278 0.425 0.654SB 216641 hydrochloride 2.935 2.126 1.381SB 218078 5.042 2.327 2.167SB 228357 5.433 2.554 2.127SB 525334 3.131 2.366 1.323SB 743921 1.029 1.001 1.028SB590885 5.576 3.803 1.466SB939 1.505 4.647 0.324SC-10 11.340 12.072 0.939SC-236 12.373 4.334 2.855SCH 202676 hydrobromide 10.840 4.901 2.212SCH 79797 dihydrochloride 1.200 1.015 1.182Scriptaid 3.432 7.514 0.457SCS 1.894 1.052 1.800Sertaconazole nitrate 4.187 11.512 0.364Sertindole 8.888 8.897 0.999Sertraline 5.335 3.138 1.700Sertraline hydrochloride 2.474 2.899 0.853SGI-1776 4.823 4.103 1.175Simvastatin 8.204 11.249 0.729Simvastatin 5.393 4.006 1.346SN 38 0.131 0.274 0.478SNAP 5089 3.140 3.807 0.825Sorafenib 6.194 5.290 1.171SR 33805 oxalate 9.951 8.278 1.202SR 59230A hydrochloride 12.390 9.055 1.368SR 59230A oxalate 9.081 2.156 4.212SRT1720 0.900 1.509 0.596SSR 69071 5.143 2.767 1.859Stanozolol 11.265 10.991 1.025Stattic 2.646 1.662 1.592Staurosporine aglycone 4.778 1.944 2.458SU11274 8.164 4.916 1.661Sulconazole nitrate 3.651 10.262 0.356Suloctidil 2.574 2.528 1.018Sunitinib 6.288 3.893 1.615Sunitinib malate 4.277 4.782 0.894T 0901317 4.125 4.324 0.954Tamoxifen 9.217 9.124 1.010Tamoxifen Citrate 9.360 9.308 1.006Tamoxifen citrate 4.738 3.608 1.313Terfenadine 3.663 3.659 1.001Terfenadine 9.113 9.073 1.004Tetrindole mesylate 8.271 9.306 0.889TG101209 5.702 3.968 1.437TG101348 3.337 2.640 1.264TG-46 5.740 4.633 1.239
97
TG-89 5.620 9.711 0.579Thapsigargin 0.787 0.698 1.128Thiethylperazine dimalate 10.365 1.250 8.292Thimerosal 2.060 1.853 1.112Thioridazine hydrochloride 8.539 2.934 2.910Thiostrepton 5.258 4.276 1.230Thonzonium bromide 9.016 9.466 0.952Tipifarnib 6.619 1.511 4.381Topotecan Hydrochloride 8.516 9.939 0.857Topotecan hydrochloride hydrate 5.025 0.737 6.818Toremifene 10.755 10.042 1.071Tribenoside 8.189 7.165 1.143Trichostatin A 0.353 1.978 0.178Triclosan 10.770 9.169 1.175Trifluoperazine dihydrochloride 3.340 3.312 1.008Triflupromazine hydrochloride 8.840 8.015 1.103TW-37 3.784 2.609 1.450Tyrphostin A9 2.069 9.502 0.218Tyrphostin AG 879 8.259 8.134 1.015UNC638A 9.548 2.823 3.382Vandetanib 8.510 6.896 1.234Verteporfin 9.724 10.530 0.923Vinorelbine 0.081 7.101 0.011Vinpocetine 11.961 5.771 2.073Vorinostat 0.564 1.750 0.322Vorinostat 4.767 11.818 0.403VX-770 4.299 3.652 1.177WAY 170523 7.491 6.125 1.223WEHI-0114223 11.395 4.741 2.404WIN 62,577 5.143 6.571 0.783WZ3146 1.029 1.572 0.655WZ4002 2.470 1.747 1.414WZ8040 2.410 2.278 1.058XL880 4.934 5.467 0.903XL880 3.995 3.998 0.999Y 29794 oxalate 4.756 3.957 1.202Ziprasidone hydrochloride monohydrate 11.891 4.417 2.692ZK 164015 8.314 4.718 1.762ZM 39923 hydrochloride 9.017 9.302 0.969ZM 39923 hydrochloride 6.027 4.335 1.390ZM 449829 5.870 3.664 1.602Zotepine 11.015 8.216 1.341ZSTK474 3.760 2.004 1.876Zuclopenthixol hydrochloride 10.435 5.508 1.895
98

SUPPLEMENTARY TABLE S5 - EC50 VALUES FOR PRIMARY SCREEN+DinaciclibCOMPOUND OVCAR3 OVCAR3-R1 Ratio10-DEBC hydrochloride 9.014 4.773 0.53017-DMAG 1.149 2.916 2.5382,3-Dimethoxy-1,4-naphthoquinone 8.824 2.737 0.3103,4-Dichloroisocoumarin 3.512 7.959 2.2663`-Fluorobenzylspiperone maleate 9.241 11.219 1.2145-azacytidine 1.984 9.745 4.9125-Nonyloxytryptamine oxalate 10.490 9.651 0.920A23187 1.228 1.715 1.397A-7 hydrochloride 8.833 10.536 1.193A-77636 hydrochloride 9.522 10.216 1.073ABT-199 6.934 5.821 0.839ABT-263 2.937 0.499 0.170ABT-737 9.810 1.454 0.148ABT-737 7.270 2.017 0.277AC220 7.099 4.601 0.648AC-220 7.820 6.674 0.853AC-93253 iodide 0.431 0.482 1.118AEE788 7.038 5.349 0.760AG13958 5.210 4.046 0.777AGK2 0.912 1.420 1.557Alexidine dihydrochloride 1.747 1.671 0.956AM 404 6.403 5.331 0.833AMG-47a 4.703 4.134 0.879AMG-Tie2-1 9.083 7.919 0.872Aminopurvalanol A 10.812 12.209 1.129Amlodipine 11.597 12.281 1.059Amlodipine besylate 8.251 5.192 0.629Amsacrine hydrochloride 8.217 8.825 1.074Anacardic acid 7.747 9.217 1.190Anisomycin 0.755 0.879 1.164AP24534 2.517 2.520 1.001AP24534 1.385 1.752 1.265Apicidin 2.490 0.804 0.323Apomorphine hydrochloride 9.558 8.645 0.904Apomorphine hydrochloride hemihydrate 2.480 3.185 1.284AR-42 0.424 0.133 0.314ARP 101 10.354 9.022 0.871Astemizole 8.855 3.854 0.435AT9283 3.453 3.175 0.919Atovaquone 12.410 12.266 0.988Auranofin 1.139 1.123 0.986Auranofin 1.270 1.390 1.094Aurora A Inhibitor I 1.506 1.729 1.148AV-412 1.731 2.178 1.258Azathioprine 5.947 5.629 0.947AZD7762 3.177 2.012 0.633Bax channel blocker 3.785 4.023 1.063
EC50 (μM)
99

Belinostat 0.471 0.251 0.533Belinostat 2.425 1.708 0.704Benfluorex hydrochloride 11.057 8.070 0.730Benzethonium chloride 7.278 8.493 1.167Bepridil hydrochloride 8.516 6.582 0.773Beta-Escin 9.036 8.876 0.982beta-Lapachone 2.464 0.778 0.316BI 2536 0.905 5.921 6.543BI-2536 1.258 5.879 4.673BIBU 1361 4.615 2.774 0.601BIO 4.176 1.482 0.355BIX 01294 trihydrochloride hydrate 10.014 8.804 0.879BIX-01294 4.751 6.531 1.375BML-281 1.897 1.265 0.667BMS 191011 9.427 9.396 0.997BMS-193885 4.233 10.746 2.539BMS-2 6.640 6.366 0.959BNTX maleate 4.003 9.956 2.487Bosutinib 4.524 2.339 0.517Bromoacetyl alprenolol menthane 7.901 3.907 0.494BS-181 hydrochloride 8.993 7.406 0.824Butoconazole nitrate 4.203 11.473 2.730BVT 948 4.172 3.913 0.938BX795 8.288 8.318 1.004Calcimycin 0.275 1.114 4.051Calmidazolium chloride 7.434 2.769 0.372Camptothecin 0.189 5.304 28.063Canertinib 1.331 0.730 0.548Cantharidic Acid 2.457 2.393 0.974Cantharidin 3.884 4.530 1.166Capsazepine 10.292 7.742 0.752Carvedilol 5.010 6.912 1.380CCT129202 3.666 2.620 0.715CD 1530 4.032 2.923 0.725CD 437 0.969 1.158 1.195Cediranib 4.650 5.446 1.171CGK 733 10.734 5.400 0.503CGP 71683 hydrochloride 3.875 3.656 0.943CGP 7930 11.000 11.801 1.073CGP-74514A hydrochloride 3.452 4.851 1.405CGP-7930 11.749 7.325 0.623Chelerythrine chloride 1.084 1.228 1.133Chicago sky blue 6B 10.991 9.821 0.894CHIR-258 8.213 9.324 1.135Chlorhexidine 4.296 6.148 1.431Chlorpromazine hcl 10.771 4.540 0.422Chlorpromazine hydrochloride 10.921 11.733 1.074Chlorpromazine hydrochloride 7.427 11.297 1.521Chlorprothixene 8.581 12.455 1.451Chlorprothixene hydrochloride 11.692 8.835 0.756
100

Chrysene-1,4-quinone 2.729 5.704 2.090CI-1033 2.304 2.373 1.030CI-1040 11.272 10.584 0.939CI-1040 6.458 7.722 1.196CI-976 11.469 4.538 0.396Clemastine fumarate 9.841 12.485 1.269Clioquinol 10.680 10.456 0.979Clomipramine hydrochloride 8.879 6.848 0.771Cryptotanshinone 3.433 3.346 0.975CUDC-101 1.084 0.565 0.521Cyclosporin A 4.595 4.756 1.035CYT387 2.143 8.609 4.017Danusertib 5.887 7.121 1.210Dasatinib 1.481 0.745 0.503Daunorubicin hydrochloride 0.410 1.603 3.910Dequalinium dichloride 8.994 11.828 1.315Dihydroouabain 3.574 9.922 2.776Dimethisoquin hydrochloride 12.086 11.013 0.911Diphenyleneiodonium chloride 2.386 3.126 1.310DL-erythro-Dihydrosphingosine 5.851 11.813 2.019DL-Stearoylcarnitine chloride 10.806 11.162 1.033Doxorubicin hydrochloride 1.971 4.566 2.317Droxinostat 6.558 6.282 0.958Ebastine 3.847 1.990 0.517Econazole nitrate 5.092 11.215 2.202Efavirenz 9.137 9.250 1.012Eliprodil 7.897 10.316 1.306Ellipticine 2.739 2.128 0.777Elvitegravir 9.848 9.744 0.989ENMD-2076 7.481 10.666 1.426EO 1428 5.161 12.182 2.360Estradiol Valerate 10.391 8.779 0.845ET-18-OCH3 4.211 12.076 2.868Ethynylestradiol 3-methyl ether 12.391 12.362 0.998EX 527 9.245 9.727 1.052Felodipine 9.048 5.807 0.642Felodipine 4.366 4.047 0.927Fenbendazole 9.492 12.391 1.305Fendiline hydrochloride 3.124 3.813 1.221Fenretinide 4.481 2.595 0.579FIT 6.986 6.268 0.897Fluoxetine hydrochloride 8.948 5.420 0.606Fluphenazine dihydrochloride 9.309 9.677 1.040Fluphenazine dihydrochloride 7.909 8.226 1.040Fluspirilen 8.724 8.675 0.994Fluspirilene 9.818 11.435 1.165Formoterol 10.635 2.495 0.235Garcinol 4.010 8.350 2.082GBR 12909 dihydrochloride 11.230 11.063 0.985GBR 12909 dihydrochloride 9.428 9.950 1.055
101

GBR 12935 dihydrochloride 12.200 12.209 1.001GBR 13069 dihydrochloride 4.850 9.707 2.001GBR-12909 dihydrochloride 9.022 9.242 1.024GBR-12935 dihydrochloride 11.637 7.976 0.685GDC-0941 3.364 1.459 0.434GDC-0941 4.367 2.324 0.532Gefitinib 12.124 8.494 0.701GF 109203X 4.369 7.918 1.812Gossypol 5.864 5.327 0.908GR 127935 hydrochloride 9.937 9.914 0.998GR 127935 hydrochloride hydrate 8.359 8.597 1.028GSK1059615 6.851 5.226 0.763GSK2126458 0.285 0.612 2.147GSKJ4 4.881 5.455 1.118Haloprogin 11.094 11.584 1.044Hesperadin 2.254 5.246 2.327Idazoxan hydrochloride 9.271 3.993 0.431IKK 16 2.298 0.413 0.180IMD 0354 0.894 1.928 2.157IMS2186 2.099 3.423 1.631INCA-6 7.330 12.105 1.651Indatraline hydrochloride 3.264 3.013 0.923Indirubin-3`-oxime 7.276 7.125 0.979Indirubin-3`-oxime 7.841 8.470 1.080Intedanib 10.915 7.708 0.706IPA-3 10.060 10.841 1.078IPAG 4.772 3.986 0.835Iressa 11.423 5.253 0.460Irinotecan 3.153 9.607 3.047ITF2357 0.246 0.085 0.346Ivermectin 3.451 2.956 0.857JNJ-26481585 0.127 0.023 0.181JNJ26854165 11.981 11.391 0.951JQ1 0.755 0.679 0.899JTC 801 8.424 8.021 0.952K114 5.785 5.672 0.980Ki 8751 9.235 5.342 0.578Ki8751 6.873 6.967 1.014KU55933 12.472 12.492 1.002KU57788 4.777 5.093 1.066L-703,606 oxalate salt hydrate 8.842 2.738 0.310L-733,060 hydrochloride 12.045 10.629 0.882Lapatinib 6.527 3.344 0.512Lapatinib Ditosylate 6.303 2.489 0.395LAQ824 0.395 0.133 0.337LDE225 10.523 10.739 1.021LE 135 11.874 10.890 0.917Lidoflazine 5.108 7.040 1.378Loperamide hydrochloride 10.559 11.973 1.134Lovastatin 10.566 9.353 0.885
102

Lovastatin 7.770 12.402 1.596LY2228820 9.667 8.640 0.894LY2784544 4.941 6.511 1.318LY500307 11.677 11.301 0.968Lylamine hydrochloride 8.823 8.895 1.008Lynestrenol 12.042 12.160 1.010M-344 4.671 1.996 0.427Mefloquine hydrochloride 8.815 4.750 0.539Mercaptopurine 4.402 7.700 1.749Merck-22-6 4.491 4.236 0.943Metergoline 9.602 8.345 0.869Methiothepin mesylate 11.130 5.160 0.464Methyl benzethonium chloride 4.682 3.465 0.740MG 132 0.718 1.949 2.714Mibefradil dihydrochloride 8.982 4.588 0.511Miconazole 7.278 4.466 0.614Mitoxantrone 0.195 0.728 3.733Mitoxantrone dihydrochloride 0.296 0.918 3.101MK-2206 2.977 1.061 0.356MLN2238 0.185 0.359 1.941MLN9708 0.283 0.542 1.915MNS 3.691 5.548 1.503Mocetinostat 3.077 9.336 3.034MS-275 0.945 1.347 1.425Nebivolol HCl 3.425 3.673 1.072Nemadipine-A 9.750 3.460 0.355Niclosamide 12.207 11.618 0.952Niguldipine hydrochloride 2.623 2.613 0.996Niguldipine hydrochloride 2.497 1.965 0.787Nilotinib 3.812 3.057 0.802Nilotinib 4.405 3.969 0.901NNC 05-2090 hydrochloride 9.112 5.278 0.579NNC 26-9100 8.865 6.445 0.727NNC 55-0396 2.171 2.622 1.208NNC 55-0396 dihydrochloride 3.800 2.306 0.607N-Oleoyldopamine 5.674 4.492 0.792NSC 3852 5.990 10.737 1.792NSC 663284 1.942 1.563 0.805NSC 95397 3.045 2.518 0.827NSC 95397 3.123 2.913 0.933NTNCB hydrochloride 8.858 3.747 0.423NVP-ADW742 4.098 2.001 0.488NVP-TAE684 2.968 2.914 0.982Obatoclax Mesylate 1.411 1.471 1.043Octoclothepin maleate 7.298 12.253 1.679OLDA 11.154 10.626 0.953OMDM-2 8.363 5.025 0.601Oxamflatin 3.215 2.055 0.639Oxiconazole Nitrate 5.786 9.689 1.675PAC 1 6.662 9.614 1.443
103

PAC-1 12.018 5.173 0.430Panobinostat 0.202 0.100 0.495Paroxetine Hydrochloride 2.735 6.961 2.545Paroxetine maleate 10.190 9.304 0.913Parthenolide 7.817 4.461 0.571PCI-24781 0.320 0.154 0.481PD 102807 12.100 5.297 0.438PD 198306 4.306 3.678 0.854PD 407824 5.017 2.563 0.511PD-166285 hydrate 0.586 0.609 1.039PD173955 4.952 6.896 1.393PD-184161 9.256 4.860 0.525PD-407824 3.537 2.281 0.645Pelitinib 0.521 0.434 0.833Perhexiline maleate 5.064 11.884 2.347Perphenazine 12.212 6.184 0.506PF-2341066 5.428 6.103 1.124PFI-1 5.735 6.164 1.075PHA 665752 3.759 2.907 0.773PHA-680632 8.362 6.954 0.832Phorbol 12-myristate 13-acetate 4.085 2.786 0.682PI103 2.842 2.177 0.766PIK-75 Hydrochloride 0.476 6.060 12.731Pimozide 5.338 4.330 0.811Prazosin hydrochloride 9.662 10.924 1.131Prazosin hydrochloride 8.148 10.620 1.303Prenylamine lactate 8.730 5.817 0.666Proadifen hydrochloride 12.496 12.148 0.972Prochlorperazine dimaleate 9.278 9.600 1.035Propylnorapomorphine hydrochloride 9.045 9.044 1.000Pyrimethamine 2.284 7.731 3.385Pyrvinium pamoate 2.538 5.249 2.068Quinacrine dihydrochloride 10.644 9.838 0.924Quinacrine dihydrochloride dihydrate 3.585 2.382 0.664R 59-022 10.955 6.815 0.622R406 10.128 5.552 0.548R406 8.443 5.912 0.700R428 4.563 10.216 2.239RAF265 10.472 5.686 0.543Retinoic acid 8.336 1.885 0.226Ro 08-2750 11.562 4.069 0.352Ro 31-8220 mesylate 3.681 9.511 2.584Ro 31-8425 6.119 6.479 1.059RO495 7.333 1.787 0.244Rocilinostat 5.506 3.910 0.710RS 17053 hydrochloride 8.344 2.718 0.326RS 39604 hydrochloride 3.270 2.191 0.670Ryuvidine 0.957 2.561 2.676SAHA 4.354 3.517 0.808Salmeterol xinafoate 12.473 9.431 0.756
104

Sanguinarine chloride 0.278 0.425 1.529SB 216641 hydrochloride 2.935 1.388 0.473SB 218078 5.042 1.664 0.330SB 228357 5.433 7.911 1.456SB 525334 3.131 8.580 2.740SB 743921 1.029 3.125 3.037SB590885 5.576 4.598 0.825SB939 0.393 0.163 0.415SB939 1.505 0.690 0.458SC-10 11.340 11.986 1.057SC-236 12.373 6.033 0.488SCH 202676 hydrobromide 10.840 11.931 1.101SCH 79797 dihydrochloride 1.200 1.917 1.598Scriptaid 3.432 2.964 0.864SCS 1.894 1.174 0.620Sertaconazole nitrate 4.187 11.532 2.754Sertindole 8.888 8.779 0.988Sertraline 5.335 12.005 2.250Sertraline hydrochloride 8.175 4.038 0.494SGI-1776 4.823 4.103 0.851Simvastatin 5.393 6.427 1.192SKI-606 5.714 4.626 0.810SN 38 0.131 0.613 4.679SNAP 5089 3.140 4.240 1.350Sorafenib 6.194 6.729 1.086SR 33805 oxalate 9.951 9.407 0.945SR 59230A hydrochloride 12.390 5.189 0.419SR 59230A oxalate 9.081 2.415 0.266SRT1720 0.900 1.509 1.677SSR 69071 5.143 7.761 1.509Stanozolol 11.265 5.241 0.465Stattic 2.646 2.403 0.908Staurosporine aglycone 4.778 2.806 0.587SU11274 8.164 8.545 1.047Sulconazole nitrate 3.651 10.222 2.800Suloctidil 2.574 8.127 3.157Sunitinib 12.123 7.977 0.658Sunitinib malate 4.277 8.510 1.990T 0901317 4.125 5.037 1.221Tamoxifen 9.217 10.257 1.113Tamoxifen Citrate 9.360 9.216 0.985Terfenadine 9.113 3.960 0.435Terfenadine 3.663 2.089 0.570Tetrindole mesylate 8.271 9.512 1.150TG101209 5.702 3.151 0.553TG101348 3.337 5.138 1.540TG-46 5.740 7.576 1.320TG-89 5.620 4.165 0.741Thapsigargin 0.787 0.353 0.449Thiethylperazine dimalate 10.365 6.042 0.583
105

Thimerosal 2.060 1.235 0.600Thioridazine hydrochloride 8.539 7.849 0.919Thioridazine hydrochloride 8.458 8.728 1.032Thiostrepton 5.258 7.387 1.405Thonzonium bromide 9.016 8.946 0.992Tipifarnib 6.619 4.529 0.684Topotecan Hydrochloride 8.516 8.918 1.047Topotecan hydrochloride hydrate 5.025 4.152 0.826Toremifene 10.755 11.280 1.049Tribenoside 8.189 9.487 1.159Trichostatin A 0.353 0.330 0.935Triclosan 10.770 10.593 0.984Trifluoperazine dihydrochloride 3.340 2.444 0.732Triflupromazine hydrochloride 6.654 7.420 1.115TW-37 3.784 2.609 0.689Tyrphostin A9 2.069 10.090 4.877Tyrphostin AG 879 8.259 11.326 1.371UNC638A 9.548 7.576 0.793Vandetanib 8.510 7.001 0.823Verteporfin 9.724 10.825 1.113Vinorelbine 0.081 7.101 87.667Vinpocetine 11.961 9.352 0.782Vorinostat 4.767 3.350 0.703Vorinostat 0.564 0.483 0.856VX-770 4.299 4.101 0.954WAY 170523 7.491 4.276 0.571WEHI-0114223 11.395 6.644 0.583WIN 62,577 5.143 4.684 0.911WZ3146 1.029 0.612 0.595WZ4002 2.470 1.761 0.713WZ8040 2.410 2.278 0.945XL880 4.934 6.243 1.265XL880 3.995 4.066 1.018Y 29794 oxalate 4.756 4.676 0.983Ziprasidone hydrochloride monohydrate 11.891 10.059 0.846ZK 164015 8.314 7.800 0.938ZM 39923 hydrochloride 6.027 6.794 1.127ZM 39923 hydrochloride 9.017 11.991 1.330ZM 449829 5.870 12.391 2.111Zotepine 11.015 10.403 0.944ZSTK474 3.760 2.004 0.533Zuclopenthixol hydrochloride 10.435 9.944 0.953
106

SUPPLEMENTARY TABLE S6 - COMPOUND LIST FOR SECONDARY SCREENOVCAR3 vs SKOV3 + DinaciclibCompound Primary TargetIdarubicin AntineoplasticAT9283 AURTW-37 Bcl-2Obatoclax mesylate Bcl-2ABT-199 Bcl-2JQ-1 BET Bromodomains inhibitorLidoflazine Ca++ channel activatorCalcimycin Ca2+ ionophoreIMS2186 Cell cycle inhibitorAZD7762 Chk1SB 218078 Chk1PD-407824 Chk1/Wee1Ketoconazole Cytochrome P450c17 enzyme; antifungal agent5-azacytidine DNA methyltransferase inhibitorMethylergonovine maleate Dopamine antagonistSulconazole nitrate Ergosterol synthesis inhibitionSertaconazole nitrate ergosterol synthesis inhibitorCHIR-99021 GSK-3Ebastine H1 receptor antagonistLBH589 HDACLAQ824 HDACMGCD0103 HDACMS-275 HDACBelinostat HDACSB939 HDACITF2357 HDACScriptaid HDACPCI-24781 HDACMC1568 HDACJNJ-26481585 HDACBML-210 HDACApicidin HDACFluoro-SAHA HDACOxamflatin HDACCI-994 HDACAR-42 HDACTrichostatin A HDAC inhibitorVorinostat HDAC inhibitorM-344 HDAC inhibitorCUDC-101 HDAC, EGFR, HER2ACY-1215 HDAC6 InhibitorBML-281 HDAC-6 inhibitorCYT387 JAK2CP690550 JAKsParthenolide MAP kinase inhibitorQuinacrine Monoamine oxydase inhibitorKU0063794 mTOR
107

Dasatinib Multi Kinase Inhibitors (Bcr-Abl SRC)Lapatinib Multi Kinase Inhibitors (EGFR family)2-Chloroadenosine P2Y receptor agonistVinorelbine p38 MAPKGSK2126458 PI3KPI103 PI3KGDC-0941 PI3KMLN2238 ProteasomeMG 132 ProteasomeMLN9708 ProteasomeITMN-191 ProteasomeBMS-232632 ProteasomeBortezomib ProteasomeClofarabine ribonucleotide reductaseEscitalopram selective serotonin reuptake inhibitorCryptotanshinone StatEtoposide Topoisomerase II inhibitor
108

SUPPLEMENTARY TABLE S7 - COMPOUND LIST FOR SECONDARY SCREENOVCAR3-R1 vs OVCAR3 + DinaciclibCompound Primary TargetMethiothepin mesylate 5-HT1E, 5-HT1F, 5-HT6BIO Activates Cl- conductance and hIK1 K+ channelsCI-976 Acyl coenzyme A: cholesterol acyltransferase inhibitorMK-2206 AKT10-DEBC hydrochloride AKTAkt-I-1 2 (Akti-1/2) AKTMerck-22-6 AKTBromoacetyl alprenolol menthane Alkylating beta adrenoceptor antagonistIvermectin Allosteric modulator of alpha7 nicotinic receptorsRS 17053 hydrochloride alpha1A antagonistIdazoxan hydrochloride Alpha2 agonistZM 447439 AURSNS-314 AURMLN8237 AURCYC-116 AURPifithrin-mu Bcl-2ABT-737 Bcl-2Obatoclax Mesylate Bcl-2Gossypol Bcl-2HA14-1 Bcl-2TW-37 Bcl-2ABT-199 Bcl-2ABT-263 Bcl-2 inhibitor- Bcl-XL- Bcl-XLFormoterol beta2-Adrenoceptor agonistSR 59230A oxalate beta3-Adrenoceptor antagonistNemadipine-A Calcium channel alpha1-subunit antagonistCalmidazolium chloride Calmodulin-dependent Ca2+-ATPasePAC-1 Caspase 3 activator; apoptosis inducerAZD7762 ChkSB 218078 ChkChlorpromazine Dopamine, potassium channelErlotinib EGFRLapatinib EGFR; HER2Astemizole H1 antagonistCUDC-101 HDACJNJ-26481585 HDACAR-42 HDACLAQ824 HDACITF2357 HDACSB939 HDACPCI-24781 HDACApicidin HDAC inhibitorM-344 HDAC inhibitorNVP-ADW742 IGF-1RIKK 16 IKK
109

beta-Lapachone Induces apoptosis in HL-60 cells; anticancer agentRo 08-2750 Inhibits NGF binding to p75NTR and TrkABisacodyl Na+ uptake inhibitorL-703,606 oxalate salt hydrate NK-1 tachykinin receptor antagonistNTNCB hydrochloride NPY Y5 antagonistGDC-0941 PI3KZSTK474 PI3KDanoprevir(ITMN-191) ProteasomeAtazanavir(BMS-232632) ProteasomeBortezomib ProteasomeMLN2238 ProteasomeMG 132 Proteasome2,3-Dimethoxy-1,4-naphthoquinone Redox cycling agentSB 216641 hydrochloride Selective h5-HT1B antagonistSertraline hydrochloride Selective serotonin reuptake inhibitorRO495 TYKRetinoic acid p-hydroxyanilide Vitamin A acid analog
110

SUPPLEMENTARY TABLE S8 - COMBINATION INDEXES AND INTERACTION BETWEEN COMPOUNDS TESTED IN MATRIX SCREEN
Cell line Drug A Drug B Drug B Target EC50 EC75 EC90 InteractionOVCAR3 Dinaciclib Belinostat HDAC 1.31 1.2 1.12 -
M-344 HDAC 0.97 1.22 1.56 -MLN9708 Proteasome 1.31 1.27 1.24 -PD407824 Wee1/Chk1 1.32 1.3 1.29 -
MS-275 HDAC 1.02 1.63 2.81 UndeterminedSB939 HDAC 1.4 1.7 2.07 UndeterminedPI-103 PI3K 5.49 0.61 1.03 Undetermined
OVCAR3-R1 Dinaciclib ABT-263 Bcl-2 0.5 0.49 0.49 +++ABT-737 Bcl-2 0.68 0.66 0.69 +++Lapatanib Multi-kinase 0.58 0.56 0.59 +++MK-2206 Akt 0.54 0.39 0.39 +++
NVP-ADW742 IGFR-1 0.75 0.73 0.72 ++SB218078 Chk1 0.27 0.6 1.33 UndeterminedBisacodyl Na+ channel 0.27 0.44 0.84 Undetermined
Legend<0.1 +++++0.1-0.3 ++++0.3-0.7 +++0.7-0.85 ++0.85-0.90 +0.90-1.10 ±1.10-1.20 -1.20-1.45 --1.45-3.3 ---3.3-10 ----
Slight synergism
Combination Index (CI)
Very strong synergismStrong synergismSynergismModerate synergism
Nearly additiveSlight antagonismModerate antagonismAntagonismStrong antagonism
111

3.3 Closing remarks In the context of this thesis, the findings presented in this chapter provide evidence to support
inhibition of CDK2 as a therapeutic target in CCNE1 amplified HGSC. The implications of the results
and future work will be discussed in Chapter 5.
Appendix 3.1. Etemadmoghadam D, et al. Resistance to CDK2 inhibitors is associated
with selection of polyploidy cells in CCNE1-amplified ovarian cancer. Clinical Cancer
Research 2013;19:5960-5971.
112

Cancer Therapy: Preclinical
Resistance toCDK2 Inhibitors IsAssociatedwithSelection ofPolyploid Cells in CCNE1-Amplified Ovarian Cancer
Dariush Etemadmoghadam1,3,4, George Au-Yeung1,5, Meaghan Wall2, Chris Mitchell1, Maya Kansara1,Elizabeth Loehrer1, Crisoula Batzios2, Joshy George1,5, Sarah Ftouni1, Barbara A. Weir8,9, Scott Carter9,Irma Gresshoff4,7, Linda Mileshkin1,3,6, Danny Rischin1,3,6, William C. Hahn8,9, Paul M. Waring4,7, Gad Getz9,Carleen Cullinane1, Lynda J. Campbell2, and David D. Bowtell1,3,4,5
AbstractPurpose: Amplification of cyclin E1 (CCNE1) is associated with poor outcome in breast, lung, and other
solid cancers, and is themost prominent structural variant associatedwith primary treatment failure in high-
grade serous ovarian cancer (HGSC). We have previously shown that CCNE1-amplified tumors show
amplicon-dependent sensitivity to CCNE1 suppression. Here, we explore targeting CDK2 as a novel
therapeutic strategy in CCNE1-amplified cancers and mechanisms of resistance.
Experimental Design:We examined the effect of CDK2 suppression using RNA interference and small-
molecule inhibitors in SK-OV-3,OVCAR-4, andOVCAR-3 ovarian cancer cell lines. To identifymechanisms
of resistance,wederivedmultiple, independent resistant sublines ofOVCAR-3 toCDK2 inhibitors. Resistant
cellswere extensively characterizedby gene expression and copynumber analysis, fluorescence-activated cell
sorting profiling and conventional karyotyping. In addition, we explored the relationship between CCNE1
amplification and polyploidy using data from primary tumors.
Results: We validate CDK2 as a therapeutic target in CCNE1-amplified cells by showing selective
sensitivity to suppression, either by gene knockdown or using small-molecule inhibitors. In addition, we
identified two resistance mechanisms, one involving upregulation of CDK2 and another novel mechanism
involving selection of polyploid cells from the pretreatment tumor population. Our analysis of genomic
data shows that polyploidy is a feature of cancer genomes with CCNE1 amplification.
Conclusions: These findings suggest that cyclinE1/CDK2 is an important therapeutic target inHGSC, but
that resistance to CDK2 inhibitors may emerge due to upregulation of CDK2 target protein and through
preexisting cellular polyploidy. Clin Cancer Res; 19(21); 5960–71. �2013 AACR.
IntroductionDeregulationof the cell cycle is a hallmark of cancer and is
therefore an attractive therapeutic target (1, 2). Despite this,the clinical usage of cell-cycle inhibitors has been disap-pointing to date. In contrast with the development of othertargeted agents in cancer, surprisingly few trials of cell-cycleinhibitors have involved selection of patients based on
molecular features (1). Identifying predictive biomarkersand patient subsets that are most likely to benefit from cell-cycle inhibitors is important to the clinical development ofthese agents.
High-grade serous ovarian cancer (HGSC) is the mostcommon subtype of epithelial ovarian cancer (3). Recentstudies have identified a high frequency of TP53mutations,BRCA dysfunction and clinically relevant gene expressionsubtypes (3). In addition, genomic instability and wide-spread copy number changes seem to be a mechanism oftumor evolution and may also influence treatment res-ponse. For example, genomic amplification of 19q12 incor-porating cyclin E1 (CCNE1) in approximately 20% ofHGSC is associated with poor overall survival (4) andprimary treatment failure (5).
Cyclin E1 forms a complex with CDK2 to regulate G1–Stransitionbyphosphorylationofdownstreamtargets includ-ing the tumor suppressor RB1. Deregulation of the cell cyclein tumors is thought to induce a hyper-proliferative pheno-type, leading to genomic instability and driving malignanttransformation (6). Recent functional studies in vitrohave shown "oncogene addiction" to maintained CCNE1
Authors' Affiliations: 1Peter MacCallum Cancer Centre, East Melbourne;2Victorian Cancer Cytogenetics Service, St Vincent's Hospital, Melbourne;3Sir Peter MacCallum Department of Oncology; 4Departments of Pathol-ogy, 5Biochemistry and Molecular Biology, and 6Medicine; 7Centre forTranslational Pathology, University of Melbourne, Parkville, Victoria, Aus-tralia; 8Dana-Farber Cancer Institute, Boston; and 9The Broad Institute ofHarvard and MIT, Cambridge, Massachusetts
Note: Supplementary data for this article are available at Clinical CancerResearch Online (http://clincancerres.aacrjournals.org/).
Corresponding Author: David D. Bowtell, Peter MacCallum Cancer Cen-tre, Locked Bag 1, A' Beckett St., East Melbourne, VIC 8006, Australia.Phone: 61-3-9656-1356; Fax: 011-61-3-9656-1414; E-mail:[email protected]
doi: 10.1158/1078-0432.CCR-13-1337
�2013 American Association for Cancer Research.
ClinicalCancer
Research
Clin Cancer Res; 19(21) November 1, 20135960
on March 17, 2014. © 2013 American Association for Cancer Research. clincancerres.aacrjournals.org Downloaded from
Published OnlineFirst September 4, 2013; DOI: 10.1158/1078-0432.CCR-13-1337
113

expression when amplified, evidenced by amplicon-depen-dent attenuation of cell viability, clonogenic survival,induced G1 arrest, and increased apoptosis after siRNA-mediated knockdown (7, 8). Therapeutically, CCNE1 func-tion may most readily be targeted via its partner kinaseCDK2. Currently, there are more than 20 small-moleculeCDK inhibitors in clinical trials for various cancer types (1,2). These compounds are generally classified as pan-CDK orhighly selective inhibitors and act by inducing cell-cyclearrest and apoptosis via inhibition of cell-cycle kinases(Cdk1,2,4,6) and/or transcriptional Cdks (Cdk7,8,9;ref. 9).We aimed to determine whether ovarian tumor cells with
CCNE1 gene amplification are selectively sensitive to inhi-bition ofCDK2by gene knockdownorwith small-moleculeinhibitors. We also explored potential mechanisms of resis-tance to CDK inhibition to preempt the likely emergence inpatients.
Materials and MethodsCell linesOvarian cell lines were obtained from the National Can-
cer Institute Repository (NCI, Bethesda, MD) and finger-printed using short tandem repeat (STR)markers to confirmidentity against the Cancer Genome Project database (Well-come Trust Sanger Institute, Cambridgeshire, United King-dom). Primer sequences for six STR markers (CSF1PO,TPOX, THO1, vWA, D16S539, D7S820, D5S818) and anal-ysis have been previously described (10).
Gene suppression studiesMethods and transfection conditions for siRNA studies
have been previously described (7). Microarray data fromshort hairpin RNA (shRNA) experiments were obtainedfrom the Integrative Genomics Portal and analyzed using
the GENE-E software (11). Cell line copy number data wereobtained from the Cancer Cell Line Encyclopedia (12).
Inhibitors and drug sensitivity assaysPHA-533533 was obtained from Pfizer and dinaciclib
from Merck. Cells were maintained at 37�C and 5%CO2 in RPMI-1640 containing 10% (v/v) fetal calf serum,50 U/mL penicillin, and 50 mg/mL streptomycin. Drugsensitivity was assessed using a 72-hour viability assay(MTS) and a 7-day clonogenic survival assay. For the via-bility assay, 5,000 cells were seeded in 96-well plates andallowed to attach overnight before the addition of drug atvarious concentrations. After 72 hours of drug incubation,cell viability was determined using theCellTiter 96AqueousNon-Radioactive Cell Proliferation Assay (Promega). Forclonogenic survival assays, single cells were seeded at lowdensity in 6-well plates, allowed to attach overnight beforethe addition of drug. After 7 days of growth in drug, cellcolonies were washed, fixed, and stained with 20% (v/v)methanol and 0.1% (w/v) crystal violet. Cells were rinsed inwater, air-dried, digitally scanned, and discrete colonies(>50 cells per colony) counted using MetaMorph (Molec-ular Devices). IC50 dose was approximated by fitting a four-parameter dose–response curve (Hill equation) using Prism5 (GraphPad Software).
Molecular methodsCell line DNAwas extracted using a DNeasy Kit (Qiagen)
for quantitative-PCR (qPCR) of CCNE1DNA copy numberstatus as described previously (5) or for single-nucleotidepolymorphism (SNP) microarray analysis (below). TotalRNA was extracted from cell pellets using the mirVana RNAIsolation Kit (Life Technologies) for gene expression pro-filing or reverse transcribed usingM-MLV (Promega) beforeSYBR green real-time PCR. Experimental details for geneexpression analysis, including primer sequences, have beendescribed elsewhere (5).
Western blot analysisWhole-cell protein lysates were boiled, resolved by SDS-
PAGE using 12.5% (w/v) acrylamide gels, and then trans-ferred to polyvinylidene difluoride membranes. Blots wereblocked in 5% (w/v) non-fat milk powder in PBS-T (0.1%Tween 20 in PBS) and probed overnight at 4�C in primaryantibody against cyclin E1 (clone HE12; Santa Cruz Bio-technology), CDK2 (clone D-12; Santa Cruz Biotechnolo-gy), p-Rb (Ser 807/811; Cell Signaling Technology), or thep89 PARP1 caspase cleavage fragment (Cell Signaling Tech-nology or Promega).Membraneswerewashed in PBS-T andincubated with peroxidase-conjugate secondary antibodyfor 1 hour at room temperature, washed, and developed bychemiluminescence before being exposed to radiographicfilm. Blots were reprobed with an antibody against a-tubu-lin to assess protein loading.
Generation of cell lines resistant to CDK inhibitorsSubconfluent cells in 6-well plates were treated with
PHA-533533 or dinaciclib at the IC50 dose (4 mmol/L and
Translational RelevanceCyclin E1 (CCNE1) is amplified in various tumor
types including high-grade serous ovarian cancer whereit is associated with poor clinical outcome.We show thatsuppression of the cyclin E1 partner kinase, CDK2,induces apoptosis in a CCNE1 amplicon-dependentmanner. Little is known of mechanisms of resistance toCDK inhibitors. We therefore generated cells withreduced sensitivity to CDK2 inhibitors and identifiedtwo bypass mechanisms, one involving CDK2 upregula-tion and another associated with the selection of pre-existing polyploid cells from a heterogeneous parentalpopulation. Using primary tumor data, we show for thefirst time that polyploidy is a common and specificfeature of CCNE1-amplified cancers. These findingsvalidate CDK2 as a novel therapeutic target in CCNE1-amplified tumors and preemptively identify mechan-isms of resistance that may influence clinical response.
Resistance to CDK2 Inhibitors in CCNE1-Amplified Cancer
www.aacrjournals.org Clin Cancer Res; 19(21) November 1, 2013 5961
on March 17, 2014. © 2013 American Association for Cancer Research. clincancerres.aacrjournals.org Downloaded from
Published OnlineFirst September 4, 2013; DOI: 10.1158/1078-0432.CCR-13-1337
114

10 nmol/L, respectively, based on a 72-hour cytotoxicityassays) for two 72-hour periods (media removed andfresh drug added) after which surviving cells were allowedto repopulate the culture for 96 hours. The process wasrepeated once and the remaining cells were cultured inthe presence of drug for three additional passages. Select-ed cells (passage 4) were then maintained either in thepresence or absence of drug to monitor the change in drugsensitivity over time. Cell pellets were collected on dry iceand stored at �80�C before nucleic acid extraction.
Proliferation assaysTo determine proliferation rate, 50,000 cells were seeded
in multiple wells of 6-well plates. Cells were collected fromtriplicate wells and counted using a Countess automatedcell counter (Invitrogen) every 24 hours for 4 days.
SNP and gene expression microarraysIllumina OmniExpress microarrays were run as a service
from Australian Genome Research Facility according to themanufacturer’s instructions. Data were extracted using Illu-mina’s GenomeStudio v2010.3 with Genotyping module1.8.4 software, with the default Illumina settings and Illu-mina HumanOmniExpress-12v1_H manifest cluster file.Normalized log2 R ratios (log2 ratio of observed normalizedsignal intensity to expected intensity) were segmented usingcircular binary segmentation (13) and the regions of copynumber change per gene estimated using the mean segmentvalue. Regions of gain or amplificationwere defined as thosewhere the mean segment log2 R ratio value was more than0.3; losses were defined as regions of log2 R less than �0.3.Data visualization was conducted using Partek GenomicsSuite 6.6 (Partek Inc.). Affymetrix Gene ST 1.0 microarrayswere conducted and data normalized using the GC robustmulti-array average (GCRMA) method available in the Rpackage as described previously (14). Molecular profiles ofstable and selected cells were compared with that of theparental cells and differentially expressed genes identifiedusing empirical Bayes methods available in the R-packagelimma (15). A gene was selected as differentially expressed ifthe false discovery rate (FDR) was less than 5%. Pathwayanalysiswas conducted ineitherGeneGo(ThomsonReuters)or Gene Set Enrichment Analysis (GSEA; Broad Institute ofHarvard andMIT, Cambridge, MA). Complete copy numberand gene expression microarray data are available from theGene ExpressionOmnibus (Accession IDGSE48921).Meth-ods for the analysis of copy number data obtained from TheCancer Genome Atlas (TCGA) are described elsewhere (16).
Cell-cycle analysisAll viable and dead cells were collected 48 hours after
drug treatment for death assessment and cell-cycle analysisby flow cytometry. For characterization of cell ploidy, viablecells were collected from subconfluent cultures. Collectedcells were fixed in ethanol and stained with propidiumiodide (PI) as described previously (7). Up to 10,000 singlecell events were recorded using a FACS Canto II flowcytometer (BDBiosciences). Cell-cycle profiles and percent-
age of cells in each cell-cycle phase for populations of eachploidy were modeled using Modfit LT (Beckman Coulter).
Cell sorting by ploidyApproximately 2 � 106 OVCAR-3 parental cells were
collected, resuspended as a single cell suspension, andfiltered through a 70 mmol/L filter to eliminate clumps andaggregates. Cells were then stained with the live-cell DNA-selective Vybrant DyeCycle Violet stain (Life Technologies),incubated at 37�C for 30 minutes, and hypotriploid (G1
subpopulation peak), and hyperpentaploid (G2 subpopu-lation peak) cells sorted by flow cytometery using the Aria IIsystem (BD Biosciences). Sorted cells were expanded, thenresorted, to further enrich for each population. Purity ofestablished cultures was assessed by PI staining as describedabove.
KaryotypingCells were treated with colcemid (0.2 mg/mL) for 30
minutes, harvested, incubated in 0.075 mol/L hypotonicKCl at 37�C for 30 minutes, fixed in methanol:acetic acid(3:1), dropped onto glass slides, andG-bandedwith trypsinand Leishman stain according to standard cytogenetictechniques.
ImmunohistochemistrySections from formalin-fixed paraffin embedded tissue
blocks were cut to 4 mm, dried at 60�C for 30 minutes, andstained with cyclin E1-specific clone HE12 on a VentanaBenchMark ULTRA immunostainer (Ventana Medical Sys-tems). The Ventana staining protocol using the OptiViewDAB IHC Detection Kit (Catalogue Number 760-700)included pretreatment with cell conditioner 1 (pH 8.5) for64 minutes, followed by incubation with diluted HE12antibody (Santa Cruz Biotechnology, Inc.) at 36�C for 12minutes. Antibody incubation was followed by counter-staining with hematoxylin II and bluing reagent for 4minutes each. Subsequently, slides were removed from theimmunostainer, washed in water with a drop of dishwash-ing detergent, and mounted. No chromogen was detectedwhen primary antibody cyclin E (HE12) was omitted.
ResultsCCNE1-amplified tumor cells requireCDK2 for survival
We selected tumor cell lines that either had no CCNE1copy number change (SK-OV-3), low-level gain (OVCAR-4), or high-level amplification (OVCAR-3) based on ourprevious analysis of 19q12 copy number (7). Copy numberof CCNE1 was strongly associated with gene expression inthese lines, but CDK2 expression was unrelated to CCNE1status (Supplementary Fig. S1A). We have previouslyreported an amplicon-dependent decrease in cell viabilityafter siRNA-mediated knockdown of CCNE1 (7). Consis-tent with this observation, we found that both CCNE1-gained and -amplified lines showed selective sensitivity tosiRNA-mediated CDK2 knockdown (Fig. 1A), validated atthe RNA (Supplementary Fig. S1B) and protein level (Fig.1B). The effect was less pronounced in short-term survival
Etemadmoghadam et al.
Clin Cancer Res; 19(21) November 1, 2013 Clinical Cancer Research5962
on March 17, 2014. © 2013 American Association for Cancer Research. clincancerres.aacrjournals.org Downloaded from
Published OnlineFirst September 4, 2013; DOI: 10.1158/1078-0432.CCR-13-1337
115

assays, where only the CCNE1-amplified OVCAR-3 cell lineshowed specific sensitivity to CCNE1 or CDK2 knockdown(Supplementary Fig. S1C).To validate our findings in a larger and diverse set of
tumor cell types, we made use of data from a genome-wideshRNA screen of 102 cancer cell lines with known copynumber status (12), including a high proportion of epithe-lial ovarian cancer (n¼ 25; ref. 11). Cells were infected witha pool of 54,020 shRNAs targeting 11,194 genes and grownfor at least 16 doublings. The abundance of shRNAsequence relative to a reference pool was measured bymicroarray (11) to identify genes essential for survival.Consistent with the siRNA data, we found a statistically
significant depletion of shRNAs against CCNE1 and CDK2in CCNE1-amplified cell lines across multiple tumor types(Fig. 1C). Of the lines assayed, 23 had a copy number gaininvolving CCNE1 (log2 ratio > 0.3), including 11 ovariancancer lines. The remaining 79 lines withoutCCNE1 ampli-fication included 14 ovarian cancers, providing a compar-ison group (Supplementary Fig. S2A). As each gene wastargeted with multiple independent shRNA, depletion ofindividual genes was estimated by considering the mediannormalized value of all shRNAs (n¼ 12 forCDK2; n¼ 4 forCCNE1). A statistically significant dependence onCDK2butnot CCNE1 was observed when restricting our analysis to
ovarian tumor cell lines alone (Fig. 1C), in part, due to thereduced sample size and the larger number of individualshRNAs that targeted CDK2 compared with CCNE1 (Fig.1D). For example, of the four shRNAs specific for CCNE1,only shRNA3 strongly discriminated tumors by amplifica-tion status (Fig. 1D and Supplementary Fig. S2B).
Cyclin E1 primarily interacts with CDK2 but can alsoactivate CDK1 and CDK3 (6); however, we found that onlydepletion of CDK2 shRNAs was significantly associatedwith reduced survival in CCNE1-amplified cells (Supple-mentary Table S1). shRNAs targeting CDK6 were enrichedin CCNE1-amplified cells, suggesting that CCNE1 amplifi-cation protects cells from inhibition ofCDK6. Alternatively,CDK6 expression may be essential in CCNE1 nonamplifiedcells and therefore associated with shRNA depletion.
CCNE1-amplified cells are sensitive to CDK2 small-molecule inhibitors
Two small-molecule CDK inhibitors, PHA-533533 (17)and dinaciclib (18), were obtained to examine the relativesensitivity in cell lines byCCNE1 amplification status. Thesecompounds were selected as they show high specificityagainst CDK2, however, both also have in vitro activityagainst other kinases. PHA-533533 inhibits CDK2/A,CDK2/E, CDK5/p25, CDK1/B, GSK3B (glycogen synthase
Figure 1. A, clonogenic survival after transfection withCCNE1 andCDK2 siRNAs in SK-OV-3 (CCNE1 unamplified), OVCAR-4 (CCNE1 gained), andOVCAR-3(CCNE1 amplified) ovarian tumor cell lines. Average percentage of discrete colonies formed after 7 days relative to no siRNA controls shown (n ¼ 3).Error bars indicate SEM. Statistical significance (t test) calculated by comparison with nonsilencing (NS) siRNA in the same cell line. B, CCNE1 and CDK2protein level after gene knockdown assessed by Western blot analysis. C, boxplots of median shRNA abundance in 102 tumor cell lines, and a subsetof 25ovarian cell lines, stratifiedbyCCNE1 copy number status. Data includemultiple shRNAhairpins targetingCCNE1 (n¼4) andCDK2 (n¼12).Depletion ofshRNA within a group suggests requirement for maintained expression of its target gene. D, microarray sample cluster showing relative abundance ofindividual shRNA hairpins against CCNE1 and CDK2 in ovarian cell lines. �, P < 0.05; ��, P < 0.01; ���, P < 0.001.
Resistance to CDK2 Inhibitors in CCNE1-Amplified Cancer
www.aacrjournals.org Clin Cancer Res; 19(21) November 1, 2013 5963
on March 17, 2014. © 2013 American Association for Cancer Research. clincancerres.aacrjournals.org Downloaded from
Published OnlineFirst September 4, 2013; DOI: 10.1158/1078-0432.CCR-13-1337
116

kinase 3b) andCDK4/D (IC50 values of 37, 55, 65, 208, 732nmol/L and >10 mmol/L, respectively; ref. 17), whereas themore potent inhibitor, dinaciclib, targets CDK2/E, CDK5/p35, CDK1/B, and CDK9/T (IC50 values of 1, 1, 3, and 4nmol/L, respectively; refs. 1, 18). We observed CCNE1amplicon-dependent sensitivity to both PHA-533533 (Fig.2A) and dinaciclib (Fig. 2B) in clonogenic survival assays.Differential effects were less apparent in short-term viabilityassays (Supplementary Fig. S3), with only OVCAR-3 cellsshowing heightened sensitivity to dinaciclib. These resultsare consistent with our gene suppression experiments,where the most pronounced effects of CCNE1 and CDK2inhibition were seen in 7-day siRNA clonogenic (Fig. 1A)and long-term shRNA culture experiments (Fig. 1C and D).Treatment with either inhibitor resulted in decreased phos-phorylation of the downstream target Rb at CDK-specificserine Ser 807/811 and initiation of apoptosis, indicated bythe presence of PARP cleavage products 24 hours aftertreatment (Fig. 2C and D). Consistent with the survivaldata, the strongest effects were observed in the OVCAR-3CCNE1-amplified cell line.
Resistance to CDK2 inhibition generated in vitro isstable and associated with cross-resistance
Resistance to single-agent molecularly targeted therapiesis a common clinical problem (19), yet little is known of
resistance mechanisms to CDK inhibitors (1). We thereforeinvestigated resistance after extended exposure of OVCAR-3CCNE1-amplified cells to CDK2 inhibitors, deriving fiveindependent cell lines that were resistant to PHA-533533(OVCAR3-533533-R1, -R3, -R5, -R6, and -R7). Cells werepulse treatedwithdrug at the IC50 concentration (4mmol/L)followed by recovery in media as outlined in Fig. 3A. Afterthe selection process, the average IC50 values in a 72-hourcytotoxicity assay shifted from approximately 4 to 8 mmol/L(average 2.1-fold increase in IC50 value, P < 0.001; Fig. 3B)and from 0.46 mmol/L to 2.9 mmol/L in clonogenic survivalassays for the R1 cell line (6.3-fold increase in IC50 value;Supplementary Fig. S4A). Although more pronounced inclonogenic survival assays, the level of resistance generatedwas modest. We therefore also attempted to generate resis-tant lines after continued drug exposure (without mediarecovery steps). However, we found this method to be lessreproducible anddidnot result in a higher level of resistance(data not shown). Similarly, wewere unable to derive stableresistant cell lines after treatment with escalating drug doses(up to 10 mmol/L), possibly due to an increase in off-targeteffects at higher concentrations.
A resistant line to dinaciclib was similarly derived (Sup-plementary Fig. S4B). Resistance was surprisingly stable inboth the 533533-R1 and dinaciclib-RD1 cell lines, andwe observed little attenuation of resistance for up to 40
Figure 2. A, PHA-533533 and (B) dinaciclib dose–response analysis of clonogenic survival in ovarian tumor cell lines. Bar graphs indicate IC50 values derivedfromdose–response curves plotted as the average percentage of discrete colonies formed comparedwith untreated controls (n¼ 3). C,Western blot analysisshowing decrease in phosphorylated-Rb (Ser 807/811) and appearance of PARP cleavage products with increasing concentration of PHA-533533 and(D) dinaciclib after 24 hours of drug exposure. Error bars indicate SEM. �, P < 0.05; ���, P < 0.001.
Etemadmoghadam et al.
Clin Cancer Res; 19(21) November 1, 2013 Clinical Cancer Research5964
on March 17, 2014. © 2013 American Association for Cancer Research. clincancerres.aacrjournals.org Downloaded from
Published OnlineFirst September 4, 2013; DOI: 10.1158/1078-0432.CCR-13-1337
117

passages in the absence of inhibitor (Fig. 3C and Supple-mentary Fig. S4C). Microsatellite fingerprinting of long-term cell cultures confirmed that resistant cells were derivedfrom the parental population, and not outgrowth of con-taminating cells (see Materials and Methods). As PHA-533533 is most selective for CDK2 (20), our subsequentanalyses focusedmainly on linesmade resistant to this drug.Wenext investigatedwhether resistance in the 533533-R1
cells also altered sensitivity to dinaciclib and other cytotoxicagents (Fig. 3D). We observed decreased sensitivity todinaciclib (P < 0.01) and cisplatin (P < 0.01). No cross-resistance was observed with doxorubicin (P ¼ 0.378).As both PHA-533533 and doxorubicin are substrates forthe p-glycoprotein drug efflux pump (M. Ciomei; personalcommunication), the lack of cross-resistance suggests thatupregulation of p-glycoprotein is unlikely to account forPHA-533533 resistance in R1 cells. Increased proliferationrates observed in resistant cells, suggest that altered drug
sensitivity was not due to a reduction in growth (Supple-mentary Fig. S4D).
We characterized Rb-phosphorylation and induction ofPARP cleavage in resistant and parental lines followingPHA-533533 exposure. The degree of Rb de-phosphoryla-tion following drug treatment was comparable in R1 andparental lines, andmarginally attenuated in the R6 cell line,suggesting that resistance was unlikely to be due todecreased CDK2 signaling via Rb (Fig. 3E). In contrast, theappearance of PARP cleavage products by Western blotanalysis and increased cell death, as determined by fluores-cence-activated cell sorting (FACS; Supplementary Fig. S5),was only apparent at higher drug doses in resistant lines,suggesting that the induction of apoptosis was impaireddownstream of Rb regulation. The observation of cross-resistance to cisplatin further supports a generalized mech-anism of resistance, possibly associated with increasedprosurvival signaling.
Figure 3. A, experimental schematic for deriving OVCAR-3 cell lines resistant to PHA-533533. B, PHA-533533 IC50 values determined using a 72-hour MTSproliferation assay for the parental cell line and resistant cell lines (n ¼ 5) immediately after drug selection (passage 1) and after maintained growth indrug (passage 4). Dose–response curves of individual 533533-R1–resistant cell line passages shows average normalized absorbance from triplicate wells.C, IC50 values for 533533-R1over time.Cellswere cultured in thepresence (solid line) or absenceof PHA-533533 (dashed line). The IC50 value for parental cellsis indicated by the dotted line. D, average IC50 values for the parental and 533533-R1 cell line against dinaciclib, cisplatin, and doxorubicin determinedusing a 72-hour MTS proliferation assay (n ¼ 3). Error bars indicate SEM. E, Western blot analysis of phosphorylated-Rb (Ser 807/811) and PARP cleavageproducts in OVCAR-3 parental, 533533-R1, and -R6–resistant cell lines, 24 hours after treatment with PHA-533533. ��, P < 0.01; ���, P < 0.001.
Resistance to CDK2 Inhibitors in CCNE1-Amplified Cancer
www.aacrjournals.org Clin Cancer Res; 19(21) November 1, 2013 5965
on March 17, 2014. © 2013 American Association for Cancer Research. clincancerres.aacrjournals.org Downloaded from
Published OnlineFirst September 4, 2013; DOI: 10.1158/1078-0432.CCR-13-1337
118
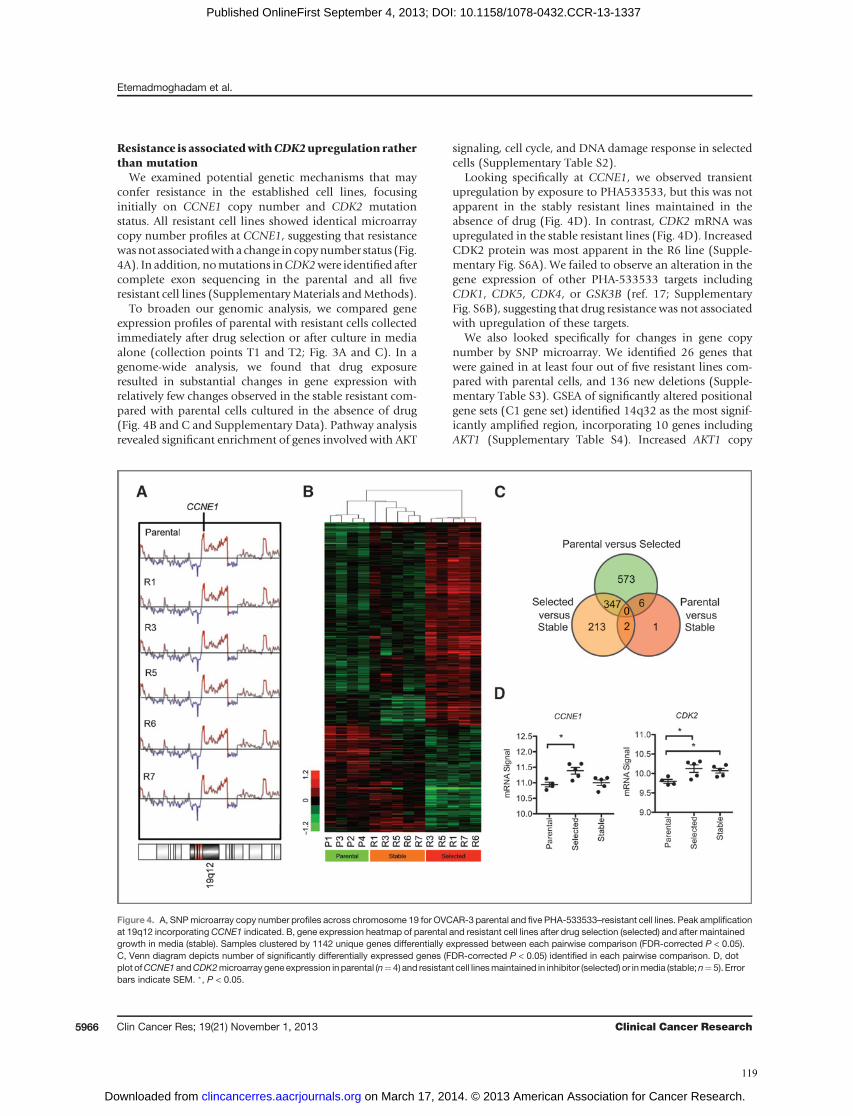
Resistance is associatedwithCDK2upregulation ratherthan mutation
We examined potential genetic mechanisms that mayconfer resistance in the established cell lines, focusinginitially on CCNE1 copy number and CDK2 mutationstatus. All resistant cell lines showed identical microarraycopy number profiles at CCNE1, suggesting that resistancewasnot associatedwith a change in copynumber status (Fig.4A). In addition, nomutations inCDK2were identifiedaftercomplete exon sequencing in the parental and all fiveresistant cell lines (SupplementaryMaterials andMethods).
To broaden our genomic analysis, we compared geneexpression profiles of parental with resistant cells collectedimmediately after drug selection or after culture in mediaalone (collection points T1 and T2; Fig. 3A and C). In agenome-wide analysis, we found that drug exposureresulted in substantial changes in gene expression withrelatively few changes observed in the stable resistant com-pared with parental cells cultured in the absence of drug(Fig. 4B and C and Supplementary Data). Pathway analysisrevealed significant enrichment of genes involved with AKT
signaling, cell cycle, and DNA damage response in selectedcells (Supplementary Table S2).
Looking specifically at CCNE1, we observed transientupregulation by exposure to PHA533533, but this was notapparent in the stably resistant lines maintained in theabsence of drug (Fig. 4D). In contrast, CDK2 mRNA wasupregulated in the stable resistant lines (Fig. 4D). IncreasedCDK2 protein was most apparent in the R6 line (Supple-mentary Fig. S6A). We failed to observe an alteration in thegene expression of other PHA-533533 targets includingCDK1, CDK5, CDK4, or GSK3B (ref. 17; SupplementaryFig. S6B), suggesting that drug resistance was not associatedwith upregulation of these targets.
We also looked specifically for changes in gene copynumber by SNP microarray. We identified 26 genes thatwere gained in at least four out of five resistant lines com-pared with parental cells, and 136 new deletions (Supple-mentary Table S3). GSEA of significantly altered positionalgene sets (C1 gene set) identified 14q32 as the most signif-icantly amplified region, incorporating 10 genes includingAKT1 (Supplementary Table S4). Increased AKT1 copy
Figure 4. A, SNPmicroarray copy number profiles across chromosome 19 for OVCAR-3 parental and five PHA-533533–resistant cell lines. Peak amplificationat 19q12 incorporatingCCNE1 indicated. B, gene expression heatmap of parental and resistant cell lines after drug selection (selected) and after maintainedgrowth in media (stable). Samples clustered by 1142 unique genes differentially expressed between each pairwise comparison (FDR-corrected P < 0.05).C, Venn diagram depicts number of significantly differentially expressed genes (FDR-corrected P < 0.05) identified in each pairwise comparison. D, dotplot ofCCNE1 andCDK2microarray gene expression in parental (n¼4) and resistant cell linesmaintained in inhibitor (selected) or inmedia (stable;n¼5). Errorbars indicate SEM. �, P < 0.05.
Etemadmoghadam et al.
Clin Cancer Res; 19(21) November 1, 2013 Clinical Cancer Research5966
on March 17, 2014. © 2013 American Association for Cancer Research. clincancerres.aacrjournals.org Downloaded from
Published OnlineFirst September 4, 2013; DOI: 10.1158/1078-0432.CCR-13-1337
119

number is consistent with AKT1 pathway upregulation incells cultured in the presence of drug (Supplementary TableS2), although does not seem to result in maintained geneupregulation in stable cells. The most significant regions ofloss were localized to 13q12, incorporating BRCA2, and22q13, including RBX1 (Supplementary Tables S3 andS4). Loss of RBX1 is intriguing, given its involvement withubiquitin-mediated degradation of cyclin E1 (21), suggest-ing a possible mechanism of pathway deregulation. Furtherfunctional analysis is required to validate the functionalsignificance of these and other identified changes.
Increased DNA ploidy is associated with resistance toCDK2 inhibitionWe conducted FACS analysis to characterize the cell-cycle
effects of inhibitors and noted a substantial shift in theDNAcontent of resistant cell lines (Fig. 5A and SupplementaryFig. S7A). Modeling of FACS data suggested the presence oftwo distinct populations in the parental line that werediploid or pseudo-diploid, and anotherwith approximatelydouble the DNA content that was possibly tetraploid ornear-tetraploid. In contrast, the near-tetraploid populationseemed to dominate the R1, R3, R5, and R7 cells (Fig. 5B).FACS analysis of OVCAR-3 cells that were selected forresistance to dinaciclib (RD1) also showed profoundenrichment of the near-tetraploid population (Supplemen-tary Fig. S7B). Interestingly, the FACS profile of the R6 cellline, which has the highest levels of CDK2 expression, moreclosely resembled the parental line.Analysis of FACS data is complicated by overlapping cell-
cycle profiles of multiple populations, we therefore con-ducted conventional karyotyping of the parental, R1 and R6cell lines (Supplementary Table S5), with the relative fre-quency of karyotypes estimated across 50metaphases (Sup-plementary Fig. S8A). Karyotyping confirmed the presenceof two populations in parental OVCAR-3 cells, one that washypotriploid (62–68 chromosomes) and a second that washyperpentaploid (118–128 chromosomes; Fig. 5C andSupplementary Fig. S8B). Shared structural rearrangementsbetween populations suggest that hyperpentaploid cells arelikely to have originated after duplication of the hypotri-ploid genome (Supplementary Table S5). In contrast, the R1cell line consisted almost entirely of hyperpentaploid cells(Fig. 5D and Supplementary Fig. S8C). As noted in the FACSanalysis, the R6 line contained both hypotriploid andhyperpentaploid cells (Supplementary Fig. S8D). Thesefindings suggested that cells with an increasedDNA contenthad a selective advantage in the presence of CDK2 inhibi-tors. Upregulation of CDK2 in the R6 cell line, and akaryotype that more closely resembled the parental line,was consistent with a different mechanism of resistance.To determine whether hyperpentaploid cells preexisting
in the parental population show intrinsic resistance toCDK2 inhibitors, we used flow cytometry to isolate livecells from each population. Hypotriploid cells in G1 (AG1)or hyperpentaploid cells in G2–M (BG2) were collected andexpanded in culture (Fig. 5E). FACS analysis of selected cellsestimate an enrichment of more than approximately 90%
purity of each population (Fig. 5F) and remained stablethroughout the course of our experiments. Dose–responseassays showed that hyperpentaploid cells had partial intrin-sic resistance to the PHA-533533 inhibitor compared withthe hypotriploid population, with the unsorted (parental)cells showing intermediate sensitivity (Fig. 5G). We did notsee an increased resistance to cisplatin (data not shown),suggesting that the reduced sensitivity of hyperpentaploidcells to PHA-533533 is specific.
Primary tumors with CCNE1 gene amplification areassociated with polyploidy
Cancer genomes of high DNA ploidy are thought to ariseas a result of discrete whole-genome–doubling (WGD)events, followed by further focal loss of chromosomalmaterial, resulting in variations in absolute DNA ploidyvalues (22). Using allele-specific copy number data derivedfrom SNP microarrays, it is possible to assess genome-doubling events and DNA ploidy bioinformatically, andwe took this approach to study the relationshipwithCCNE1copy number in existing data from TCGA (22).
We found that CCNE1 gain or high-level amplificationwas significantly associated with an increased proportion oftumors with evidence of WGD compared with unamplifiedtumors (c2P<0.0001; Fig. 6A). Furthermore, thenumber oftumors with increased DNA ploidy (>2) was higher inpatients with CCNE1 copy number amplification (c2 P <0.0001; Fig. 6B and Supplementary Fig. S9A). To determinewhether the association with WGD was specific to CCNE1amplification and not a generalized increase in copy num-ber events, we assessed the proportion of genome-amplifiedsegments in each tumor subset (16). Interestingly, tumorswith more than 1 WGD events had fewer regions of copynumber amplification, suggesting a specific associationwith CCNE1 (Fig. 6C). Moreover, tumors with increasedCCNE1 copy number did not show a higher proportion oftotal amplification events (Fig. 6D). Tumors that showedno evidence of either WGD (Supplementary Fig. S9B) orCCNE1 amplification (Supplementary Fig. S9C) had ahigher number of deletions, consistent with previousreports (22). Taken together these findings suggest thathigh ploidy genomes are a common property of tumorswith CCNE1 amplification. Genome-doubled HGSC sam-ples have previously been reported to have a greater increaseof cancer recurrence (22). Consistent with these findings,we found that samples without CCNE1 amplification andnoWGDhad improved overall survival over patientswith atleast one WGD event (Fig. 6E). In contrast, CCNE1-ampli-fied tumors, irrespective ofWGDstatus, showed the shortestoverall survival. Using immunohistochemistry to interro-gate primary tumor samples known to have CCNE1 geneamplification, we observed intense nuclear staining ofcyclin E1, and identified some positively stained cells thathad giant nuclei consistent with increased ploidy (Fig. 6F).
DiscussionTumors with amplification of the CCNE1 gene are
associated with poor clinical outcome in HGSC, and we
Resistance to CDK2 Inhibitors in CCNE1-Amplified Cancer
www.aacrjournals.org Clin Cancer Res; 19(21) November 1, 2013 5967
on March 17, 2014. © 2013 American Association for Cancer Research. clincancerres.aacrjournals.org Downloaded from
Published OnlineFirst September 4, 2013; DOI: 10.1158/1078-0432.CCR-13-1337
120
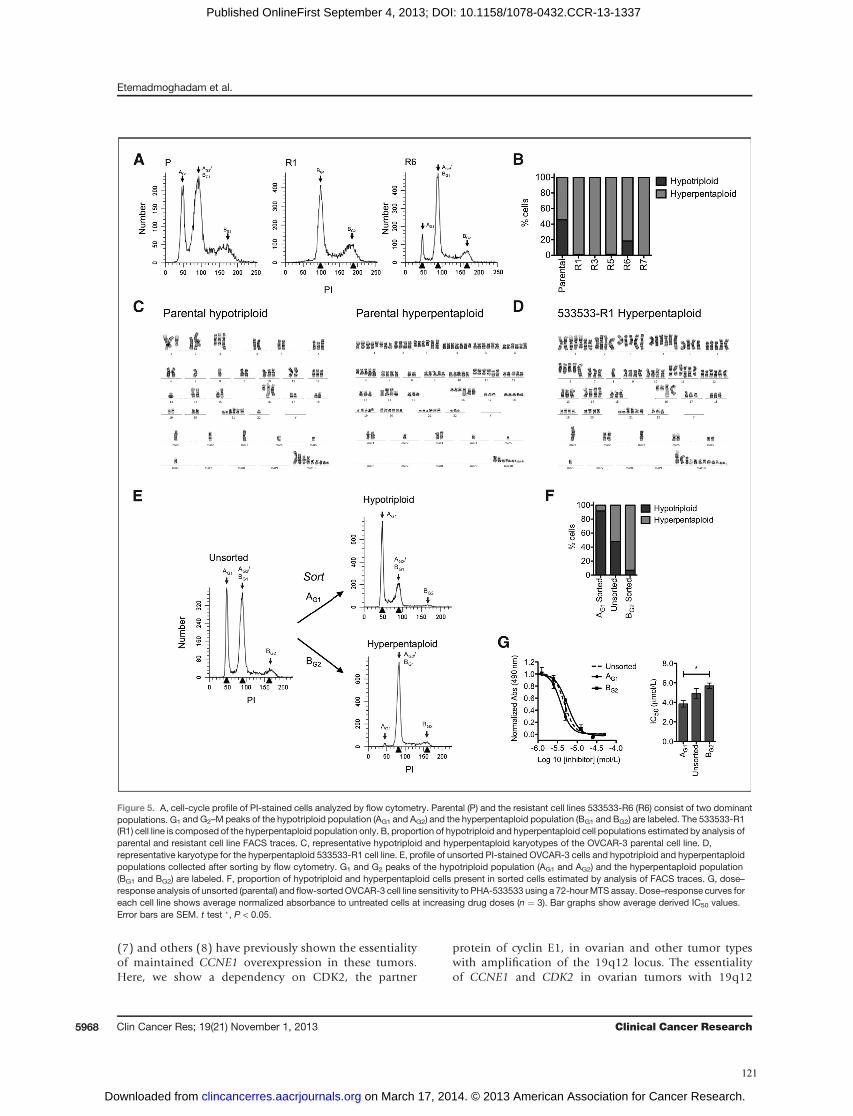
(7) and others (8) have previously shown the essentialityof maintained CCNE1 overexpression in these tumors.Here, we show a dependency on CDK2, the partner
protein of cyclin E1, in ovarian and other tumor typeswith amplification of the 19q12 locus. The essentialityof CCNE1 and CDK2 in ovarian tumors with 19q12
Figure 5. A, cell-cycle profile of PI-stained cells analyzed by flow cytometry. Parental (P) and the resistant cell lines 533533-R6 (R6) consist of two dominantpopulations. G1 and G2–M peaks of the hypotriploid population (AG1 and AG2) and the hyperpentaploid population (BG1 and BG2) are labeled. The 533533-R1(R1) cell line is composed of the hyperpentaploid population only. B, proportion of hypotriploid and hyperpentaploid cell populations estimated by analysis ofparental and resistant cell line FACS traces. C, representative hypotriploid and hyperpentaploid karyotypes of the OVCAR-3 parental cell line. D,representative karyotype for the hyperpentaploid 533533-R1 cell line. E, profile of unsorted PI-stained OVCAR-3 cells and hypotriploid and hyperpentaploidpopulations collected after sorting by flow cytometry. G1 and G2 peaks of the hypotriploid population (AG1 and AG2) and the hyperpentaploid population(BG1 and BG2) are labeled. F, proportion of hypotriploid and hyperpentaploid cells present in sorted cells estimated by analysis of FACS traces. G, dose–response analysis of unsorted (parental) and flow-sortedOVCAR-3 cell line sensitivity to PHA-533533 using a 72-hourMTS assay. Dose–response curves foreach cell line shows average normalized absorbance to untreated cells at increasing drug doses (n ¼ 3). Bar graphs show average derived IC50 values.Error bars are SEM. t test �, P < 0.05.
Etemadmoghadam et al.
Clin Cancer Res; 19(21) November 1, 2013 Clinical Cancer Research5968
on March 17, 2014. © 2013 American Association for Cancer Research. clincancerres.aacrjournals.org Downloaded from
Published OnlineFirst September 4, 2013; DOI: 10.1158/1078-0432.CCR-13-1337
121
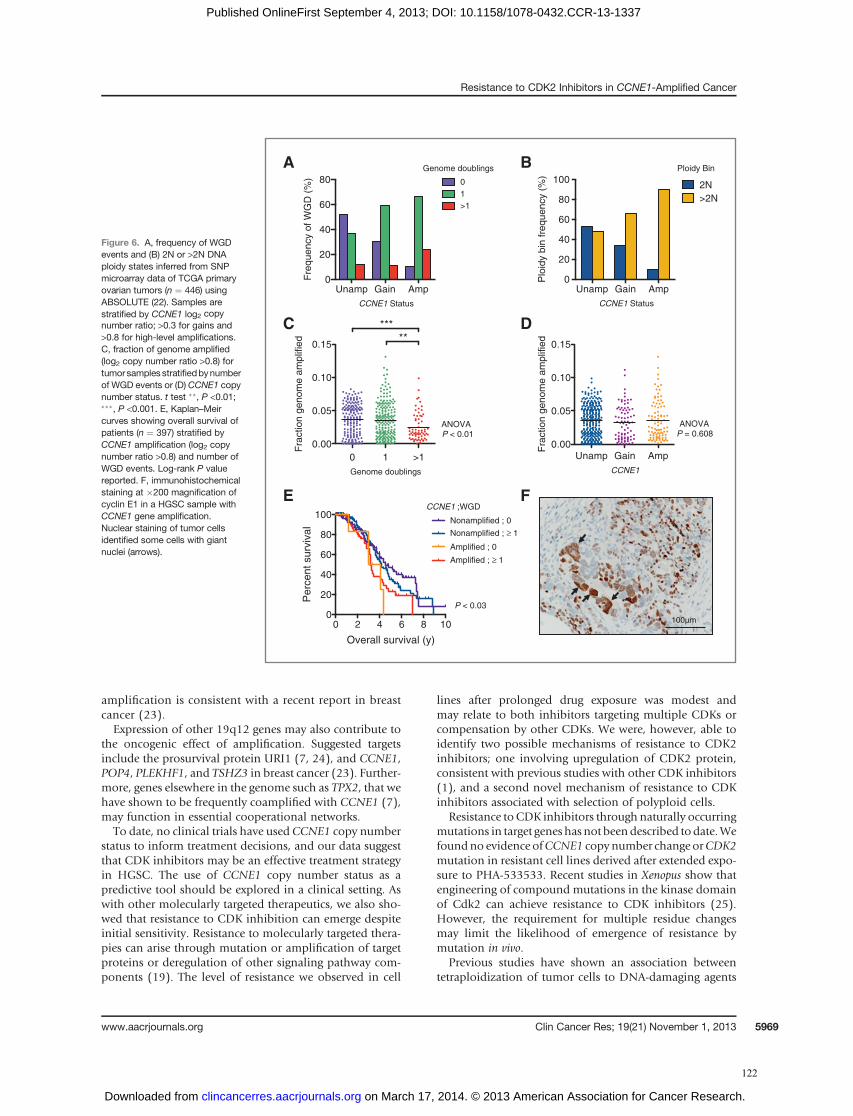
amplification is consistent with a recent report in breastcancer (23).Expression of other 19q12 genes may also contribute to
the oncogenic effect of amplification. Suggested targetsinclude the prosurvival protein URI1 (7, 24), and CCNE1,POP4, PLEKHF1, and TSHZ3 in breast cancer (23). Further-more, genes elsewhere in the genome such as TPX2, that wehave shown to be frequently coamplified with CCNE1 (7),may function in essential cooperational networks.To date, no clinical trials have used CCNE1 copy number
status to inform treatment decisions, and our data suggestthat CDK inhibitors may be an effective treatment strategyin HGSC. The use of CCNE1 copy number status as apredictive tool should be explored in a clinical setting. Aswith other molecularly targeted therapeutics, we also sho-wed that resistance to CDK inhibition can emerge despiteinitial sensitivity. Resistance to molecularly targeted thera-pies can arise through mutation or amplification of targetproteins or deregulation of other signaling pathway com-ponents (19). The level of resistance we observed in cell
lines after prolonged drug exposure was modest andmay relate to both inhibitors targeting multiple CDKs orcompensation by other CDKs. We were, however, able toidentify two possible mechanisms of resistance to CDK2inhibitors; one involving upregulation of CDK2 protein,consistent with previous studies with other CDK inhibitors(1), and a second novel mechanism of resistance to CDKinhibitors associated with selection of polyploid cells.
Resistance to CDK inhibitors through naturally occurringmutations in target genes has not beendescribed todate.Wefoundno evidence ofCCNE1 copynumber change orCDK2mutation in resistant cell lines derived after extended expo-sure to PHA-533533. Recent studies in Xenopus show thatengineering of compound mutations in the kinase domainof Cdk2 can achieve resistance to CDK inhibitors (25).However, the requirement for multiple residue changesmay limit the likelihood of emergence of resistance bymutation in vivo.
Previous studies have shown an association betweentetraploidization of tumor cells to DNA-damaging agents
0 1 >10.00
0.05
0.10
0.15
Genome doublings
*****
ANOVAP < 0.01
Fra
ctio
n ge
nom
e am
plifi
ed
Unamp Gain Amp0.00
0.05
0.10
0.15
CCNE1
ANOVAP = 0.608
Fra
ctio
n ge
nom
e am
plifi
ed
A B
C D
Unamp Gain Amp0
20
40
60
80
Fre
quen
cy o
f WG
D (
%) 0
1>1
Genome doublings
CCNE1 Status
Plo
idy
bin
freq
uenc
y (%
)
Unamp Gain Amp0
20
40
60
80
100 2N>2N
CCNE1 Status
Ploidy Bin
0 2 4 6 8 100
20
40
60
80
100
Overall survival (y)
Per
cent
sur
viva
l
Amplified ; 0
Nonamplified ; 0
Amplified ; ≥ 1
Nonamplified ; ≥ 1
P < 0.03
CCNE1 ;WGD
100µm
E F
Figure 6. A, frequency of WGDevents and (B) 2N or >2N DNAploidy states inferred from SNPmicroarray data of TCGA primaryovarian tumors (n ¼ 446) usingABSOLUTE (22). Samples arestratified by CCNE1 log2 copynumber ratio; >0.3 for gains and>0.8 for high-level amplifications.C, fraction of genome amplified(log2 copy number ratio >0.8) fortumorsamples stratifiedbynumberof WGD events or (D) CCNE1 copynumber status. t test ��, P <0.01;���, P <0.001. E, Kaplan–Meircurves showing overall survival ofpatients (n ¼ 397) stratified byCCNE1 amplification (log2 copynumber ratio >0.8) and number ofWGD events. Log-rank P valuereported. F, immunohistochemicalstaining at �200 magnification ofcyclin E1 in a HGSC sample withCCNE1 gene amplification.Nuclear staining of tumor cellsidentified some cells with giantnuclei (arrows).
Resistance to CDK2 Inhibitors in CCNE1-Amplified Cancer
www.aacrjournals.org Clin Cancer Res; 19(21) November 1, 2013 5969
on March 17, 2014. © 2013 American Association for Cancer Research. clincancerres.aacrjournals.org Downloaded from
Published OnlineFirst September 4, 2013; DOI: 10.1158/1078-0432.CCR-13-1337
122

(26) and targeted agents (27). In our study, rather thaninducing an increase in DNA ploidy leading to drug resis-tance, treatment with CDK2 inhibition seemed to select forpreexisting polyploid cells. Defective apoptotic pathways,facilitating the survival of polyploid cells, may also influ-ence their sensitivity to cytotoxic and targeted agents.Recently, tetraploid cells have been shown to have anincreased sensitivity to Aurora B inhibition (28), presentinga potential therapeutic approach for these tumors. Howev-er, we were unable to show increased sensitivity of the533533-R1 line or FACS-sorted hyperpentaploid cells toan Aurora B-specific inhibitor (data not shown).
Although flow cytometry-sorted hyperpentaploid cellshad increased resistance to CDK2 inhibition, this was notto the extent of cells selected in the presence of drug,suggesting that high DNA ploidy does not fully account forthe resistance observed in drug-exposed cell lines. Indeed,decreased genomic stability in polyploid cells may facilitatethe accumulation of further genomic changes. SNP-basedcopy number analysis and cell karyotyping revealed struc-tural and copy number changes that may contribute toincreased resistance, including increased copy number ofAKT1. Activation of the AKT pathway may promote DNArepair and cell survival and has been associated with resis-tance to chemo- and radiotherapy previously (29). The lackof resistance to cisplatin suggests that the reduced sensitivityof sortedhyperpentaploid cells to PHA-533533 is not due tothe selection of cells with a generalized attenuation ofapoptotic responses to cytotoxic agents.
Consistent with our in vitro data, we found a clear asso-ciation between CCNE1 copy number increase and highDNAploidy in primary tumors. The associationwas specificto CCNE1 gene amplification and not an increased numberof amplification events overall. Our analysis of primarytumor data is consistent with previous in vitro studiesshowing that constitutive overexpression of CCNE1 doesnot increase the overall number of gene amplificationevents, but does increase the frequency of polyploid tumor
cells (30). Expression of the hyperactive low-molecularweight isoform of CCNE1 has also been shown to lead tofailed cytokinesis and polyploidy in breast tumor cells (31).
Our findings show that although therapeutic strategiesdesigned to inhibit CDK2 function may prove useful in thetreatment ofCCNE1-amplified tumors, resistance related toa propensity for increased ploidy in these tumors is likely toemerge.
Disclosure of Potential Conflicts of InterestP.M. Waring has commercial research grant and a honoraria from speak-
ers’ bureau from Ventana Medical Systems. No potential conflicts of interestwere disclosed by the other authors.
Authors' ContributionsConception and design: D. Etemadmoghadam, D.D. BowtellDevelopment of methodology: D. EtemadmoghadamAcquisitionofdata (provided animals, acquired andmanagedpatients,provided facilities, etc.): D. Etemadmoghadam, G. Au-Yeung, M. Wall,C. Mitchell, M. Kansara, E. Loehrer, C. Batzios, S. Ftouni, I. Gresshoff, W.C.Hahn, P.M. WaringAnalysis and interpretation of data (e.g., statistical analysis, biosta-tistics, computational analysis): D. Etemadmoghadam, G. Au-Yeung, M.Wall, M. Kansara, C. Batzios, J. George, B.A. Weir, S.L. Carter, W.C. Hahn,C. Cullinane, L.J. Campbell, D.D. Bowtell, G. GetzWriting, review, and/or revision of the manuscript: D. Etemadmogha-dam, M. Wall, E. Loehrer, B.A. Weir, L. Mileshkin, D. Rischin, W.C. Hahn,P.M. Waring, C. Cullinane, L.J. Campbell, D.D. BowtellAdministrative, technical, or material support (i.e., reporting or orga-nizing data, constructing databases): D.D. BowtellStudy supervision: D. Etemadmoghadam, W.C. Hahn, D.D. Bowtell
AcknowledgmentsThe authors thank the assistance from Elaine Sanij, Sophie Kostakidis,
and Viki Milovac in conducting cell-sorting experiments by flowcytometry.
Grant SupportThisworkwas fundedby aNationalHealth andMedical ResearchCouncil
(NHMRC) project grant (APP 1042358).The costs of publication of this article were defrayed in part by the
payment of page charges. This article must therefore be hereby markedadvertisement in accordance with 18 U.S.C. Section 1734 solely to indicatethis fact.
Received May 17, 2013; revised July 31, 2013; accepted August 5, 2013;published OnlineFirst September 4, 2013.
References1. Stone A, Sutherland RL, Musgrove EA. Inhibitors of cell cycle kinases:
recent advances and future prospects as cancer therapeutics. Crit RevOncog 2012;17:175–98.
2. Krystof V, Uldrijan S. Cyclin-dependent kinase inhibitors as anticancerdrugs. Curr Drug Targets 2010;11:291–302.
3. Vaughan S, Coward JI, Bast RC, Berchuck A, Berek JS, Brenton JD,et al. Rethinking ovarian cancer: recommendations for improvingoutcomes. Nat Rev Cancer 2011;11:719–25.
4. Mayr D, Kanitz V, Anderegg B, Luthardt B, Engel J, L€ohrs U, et al.Analysis of gene amplification and prognostic markers in ovariancancer using comparative genomic hybridization for microarrays andimmunohistochemical analysis for tissuemicroarrays. AmJClin Pathol2006;126:101–9.
5. Etemadmoghadam D, Defazio A, Beroukhim R, Mermel C, George J,Getz G, et al. Integrated genome-wide DNA copy number andexpression analysis identifies distinct mechanisms of primary che-moresistance in ovarian carcinomas. Clin Cancer Res 2009;15:1417–27.
6. Caldon CE, Musgrove EA. Distinct and redundant functions of cyclinE1 and cyclin E2 in development and cancer. Cell Div 2010;5:2.
7. Etemadmoghadam D, George J, Cowin PA, Cullinane C, KansaraMAustralian Ovarian Cancer Study Group, et al. Amplicon-dependentCCNE1 expression is critical for clonogenic survival after cisplatintreatment and is correlated with 20q11 gain in ovarian cancer. PLoSONE 2010;5:e15498.
8. Nakayama N, Nakayama K, Shamima Y, IshikawaM, Katagiri A, Iida K,et al. Gene amplification CCNE1 is related to poor survival and potentialtherapeutic target in ovarian cancer. Cancer 2010;116:2621–34.
9. Wsierska-Gdek J, Maurer M, Zulehner N, Komina O. Whether to targetsingle ormultiple CDKs for therapy? That is the question. JCell Physiol2011;226:341–9.
10. Masibay A, Mozer TJ, Sprecher C. Promega Corporation revealsprimer sequences in its testing kits. J Forensic Sci 2000;45:1360–2.
11. Cheung HW, Cowley GS, Weir BA, Boehm JS, Rusin S, Scott JA, et al.Systematic investigation of genetic vulnerabilities across cancer celllines reveals lineage-specific dependencies in ovarian cancer. ProcNatl Acad Sci USA 2011;108:12372–7.
12. Barretina J, Caponigro G, Stransky N, Venkatesan K,Margolin AA, KimS, et al. The cancer cell line encyclopedia enables predictive modellingof anticancer drug sensitivity. Nature 2012;483:603–7.
Etemadmoghadam et al.
Clin Cancer Res; 19(21) November 1, 2013 Clinical Cancer Research5970
on March 17, 2014. © 2013 American Association for Cancer Research. clincancerres.aacrjournals.org Downloaded from
Published OnlineFirst September 4, 2013; DOI: 10.1158/1078-0432.CCR-13-1337
123

13. Olshen AB, Venkatraman ES, Lucito R, Wigler M. Circular binarysegmentation for the analysis of array-based DNA copy number data.Biostatistics 2004;5:557–72.
14. Cowin PA, George J, Fereday S, Loehrer E, Van Loo P, Cullinane C,et al. LRP1B deletion in high-grade serous ovarian cancers is asso-ciated with acquired chemotherapy resistance to liposomal doxoru-bicin. Cancer Res 2012;72:4060–73.
15. Smyth GK. Linear models and empirical bayes methods for assessingdifferential expression in microarray experiments. Stat Appl GenetMolBiol 2004;3:Article3.
16. George J, Alsop K, Etemadmoghadam D, Hondow H, Mikeska T,Dobrovic A, et al. Non-equivalent gene expression and copy numberalterations in high-grade serous ovarian cancers with BRCA1 andBRCA2 mutations. Clin Cancer Res 2013;19:3474–84.
17. Pevarello P, Brasca MG, Orsini P, Traquandi G, Longo A, Nesi M, et al.3-Aminopyrazole inhibitors of CDK2/cyclin A as antitumor agents. 2.Lead optimization. J Med Chem 2005;48:2944–56.
18. Parry D, Guzi T, Shanahan F, Davis N, Prabhavalkar D,Wiswell D, et al.Dinaciclib (SCH 727965), a novel and potent cyclin-dependent kinaseinhibitor. Mol Cancer Ther 2010;9:2344–53.
19. Lackner MR, Wilson TR, Settleman J. Mechanisms of acquiredresistance to targeted cancer therapies. Future Oncol 2012;8:999–1014.
20. DeansAJ,KhannaKK,McNeesCJ,MercurioC,Heierhorst J,McArthurGA. Cyclin-dependent kinase 2 functions in normal DNA repair and is atherapeutic target in BRCA1-deficient cancers. Cancer Res 2006;66:8219–26.
21. Akli S, Keyomarsi K. Cyclin E and its low molecular weight forms inhuman cancer and as targets for cancer therapy. Cancer Biol Ther2003;2:S38–47.
22. Carter SL, Cibulskis K, Helman E, McKenna A, Shen H, Zack T, et al.Absolute quantification of somatic DNA alterations in human cancer.Nat Biotechnol 2012;30:413–21.
23. Natrajan R, Mackay A, Wilkerson PM, Lambros MB, Wetterskog D,Arnedos M, et al. Functional characterization of the 19q12 amplicon ingrade III breast cancers. Breast Cancer Res 2012;14:R53.
24. Davis SJ, Sheppard KE, Pearson RB, Campbell IG, Gorringe KL,Simpson KJ. Functional analysis of genes in regions commonly ampli-fied in high-grade serous and endometrioid ovarian cancer. ClinCancer Res 2013;19:1–12.
25. Echalier A, Cot E, Camasses A, Hodimont E, Hoh F, Jay P, et al. Anintegrated chemical biology approach provides insight into Cdk2 func-tional redundancyand inhibitor sensitivity.ChemBiol 2012;19:1028–40.
26. Castedo M, Coquelle A, Vitale I, Vivet S, Mouhamad S, Viaud S, et al.Selective resistance of tetraploid cancer cells against DNA damage-induced apoptosis. Ann N Y Acad Sci 2006;1090:35–49.
27. Shen H, Moran DM, Maki CG. Transient nutlin-3a treatment promotesendoreduplication and the generation of therapy-resistant tetraploidcells. Cancer Res 2008;68:8260–8.
28. Marxer M, Foucar CE, Man WY, Chen Y, Ma HT, Poon RYC. Tetra-ploidization increases sensitivity to Aurora B kinase inhibition. CellCycle 2012;11:2567–77.
29. Xu N, Lao Y, Zhang Y, Gillespie DA. Akt: a double-edged sword in cellproliferation and genome stability. J Oncol 2012;2012:951724.
30. Spruck CH, Won KA, Reed SI. Deregulated cyclin E induces chromo-some instability. Nature 1999;401:297–300.
31. Bagheri-Yarmand R, Biernacka A, Hunt KK, Keyomarsi K. Lowmolec-ular weight cyclin E overexpression shortens mitosis, leading tochromosome missegregation and centrosome amplification. CancerRes 2010;70:5074–84.
Resistance to CDK2 Inhibitors in CCNE1-Amplified Cancer
www.aacrjournals.org Clin Cancer Res; 19(21) November 1, 2013 5971
on March 17, 2014. © 2013 American Association for Cancer Research. clincancerres.aacrjournals.org Downloaded from
Published OnlineFirst September 4, 2013; DOI: 10.1158/1078-0432.CCR-13-1337
124
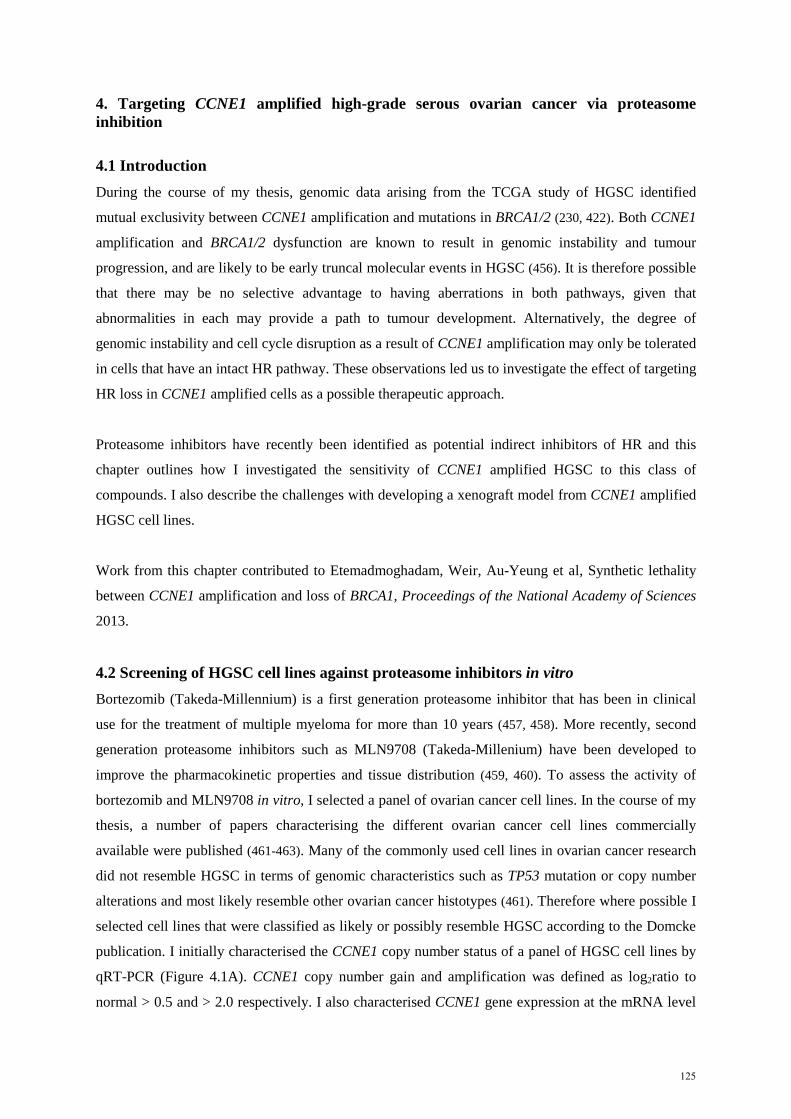
4. Targeting CCNE1 amplified high-grade serous ovarian cancer via proteasome inhibition
4.1 Introduction During the course of my thesis, genomic data arising from the TCGA study of HGSC identified
mutual exclusivity between CCNE1 amplification and mutations in BRCA1/2 (230, 422). Both CCNE1
amplification and BRCA1/2 dysfunction are known to result in genomic instability and tumour
progression, and are likely to be early truncal molecular events in HGSC (456). It is therefore possible
that there may be no selective advantage to having aberrations in both pathways, given that
abnormalities in each may provide a path to tumour development. Alternatively, the degree of
genomic instability and cell cycle disruption as a result of CCNE1 amplification may only be tolerated
in cells that have an intact HR pathway. These observations led us to investigate the effect of targeting
HR loss in CCNE1 amplified cells as a possible therapeutic approach.
Proteasome inhibitors have recently been identified as potential indirect inhibitors of HR and this
chapter outlines how I investigated the sensitivity of CCNE1 amplified HGSC to this class of
compounds. I also describe the challenges with developing a xenograft model from CCNE1 amplified
HGSC cell lines.
Work from this chapter contributed to Etemadmoghadam, Weir, Au-Yeung et al, Synthetic lethality
between CCNE1 amplification and loss of BRCA1, Proceedings of the National Academy of Sciences
2013.
4.2 Screening of HGSC cell lines against proteasome inhibitors in vitro Bortezomib (Takeda-Millennium) is a first generation proteasome inhibitor that has been in clinical
use for the treatment of multiple myeloma for more than 10 years (457, 458). More recently, second
generation proteasome inhibitors such as MLN9708 (Takeda-Millenium) have been developed to
improve the pharmacokinetic properties and tissue distribution (459, 460). To assess the activity of
bortezomib and MLN9708 in vitro, I selected a panel of ovarian cancer cell lines. In the course of my
thesis, a number of papers characterising the different ovarian cancer cell lines commercially
available were published (461-463). Many of the commonly used cell lines in ovarian cancer research
did not resemble HGSC in terms of genomic characteristics such as TP53 mutation or copy number
alterations and most likely resemble other ovarian cancer histotypes (461). Therefore where possible I
selected cell lines that were classified as likely or possibly resemble HGSC according to the Domcke
publication. I initially characterised the CCNE1 copy number status of a panel of HGSC cell lines by
qRT-PCR (Figure 4.1A). CCNE1 copy number gain and amplification was defined as log2ratio to
normal > 0.5 and > 2.0 respectively. I also characterised CCNE1 gene expression at the mRNA level
125

by qRT-PCR and observed good correlation between copy number amplification and expression
(Figure 4.1B).
Figure 4.1 CCNE1 copy number and expression of HGSC cell lines (A) CCNE1 copy number of HGSC cell lines assessed by qRT-PCR, where copy number gain and
amplification is defined as log2ratio to normal >0.5 and >2.0 respectively. Cell lines with CCNE1
high level amplification in red, unamplified or low level gain in blue. (B) CCNE1 gene expression
assessed by qRT-PCR, represented as relative to median expression across the group of cell lines.
To determine if proteasome inhibitors were selectively active against CCNE1 amplified HGSC, I
assessed the activity of bortezomib and MLN9708 across the panel of selected cell lines (Figure 4.2
and 4.3). Cells were seeded in a 96 well plate and allowed to adhere overnight before the addition of
drug across an 11-point titration. After 72 hours of drug treatment, cell viability was assessed using
the CellTitre 96 Aqueous Non-Radioactive Proliferation (MTS, Promega) Assay. The IC50 dose was
approximated by fitting a four-parameter dose-response curve (Hill equation) using Prism 7
(GraphPad Software). Cell lines with high level CCNE1 amplification demonstrated greatest
sensitivity to bortezomib and MLN9708 in vitro (Figure 4.2-4.3). Treatment with MLN9708 resulted
in apoptosis, as assessed by a dose dependent increase in PARP cleavage products demonstrated via
Western blot (Figure 4.3B). Interestingly, two cell lines with BRCA1 and/or BRCA2 mutations
(Kuramochi and JHOS2) were among the most resistant cell lines to bortezomib and MLN9708,
suggesting that intact HR is required for sensitivity to proteasome inhibitors.
126

Figure 4.2 In vitro sensitivity to bortezomib IC50 values for panel of ovarian cancer cell lines grouped by CCNE1 and BRCA1/2 mutation status.
(n=3 independent experiments performed in triplicate. Error bars indicate SEM).
Figure 4.3 In vitro sensitivity to MLN9708 (A) IC50 values for panel of ovarian cancer cell lines grouped by CCNE1 and BRCA1/2 mutation
status. (n=3 independent experiments performed in triplicate. Error bars indicate SEM). (B) Western
blot analysis demonstrating dose dependent increase in PARP cleavage products following treatment
with MLN9708.
127

4.3 Testing of proteasome inhibitors in vivo 4.3.1 Generating xenograft models of CCNE1 amplified HGSC
In order to test the efficacy of drugs targeting CCNE1 amplified HGSC, I first attempted to generate
subcutaneous xenograft models from two CCNE1 amplified HGSC cell lines, OVCAR3 and FUOV1.
I tried to generate xenografts using three different strains of immunocompromised female mice –
Balb/c nude, NOD/SCID, and NOD/SCID/IL2Rγ-/- (NSG). Despite testing multiple strains of mice,
and increasing the number of injected cells from 5 million to 10 million cells, I was unable to develop
robust xenograft models from the OVCAR3 or FUOV1 parental cell lines that would grow at
appropriate rates to test cytotoxic agents. The OVCAR3 cell line took almost 40 days to reach
100mm3, whilst the FUOV1 cell line did not establish xenografts at a suitable volume for drug studies
(Figure 4.4A-B). This is consistent with other reports in the literature (464).
Figure 4.4 Xenograft growth of CCNE1 amplified HGSC cell lines Tumour growth curves of two xenograft models derived from (A) OVCAR3 and (B) FUOV1 cell
lines. n=5 mice per group, error bars represent SEM.
Oestrogen pellets have previously been shown to improve the growth of HGSC xenografts in
immunocompromised mice (455). Therefore in order to improve the growth rate of the OVCAR cell
line, I implanted oestrogen pellets subcutaneously into NOD/SCID mice, as described in the Methods.
I also harvested tumour that eventually developed from the OVCAR3 cell line, and digested the
tumour to derive a cell line in culture. I then expanded the derived cell line, and re-implanted into
NOD/SCID mice with oestrogen pellets. By repeating this process twice, I was able to generate a cell
line that grew reliably in NOD/SCID mice with oestrogen pellets, and in NSG mice without oestrogen
pellets (Figure 4.5A-B).
128
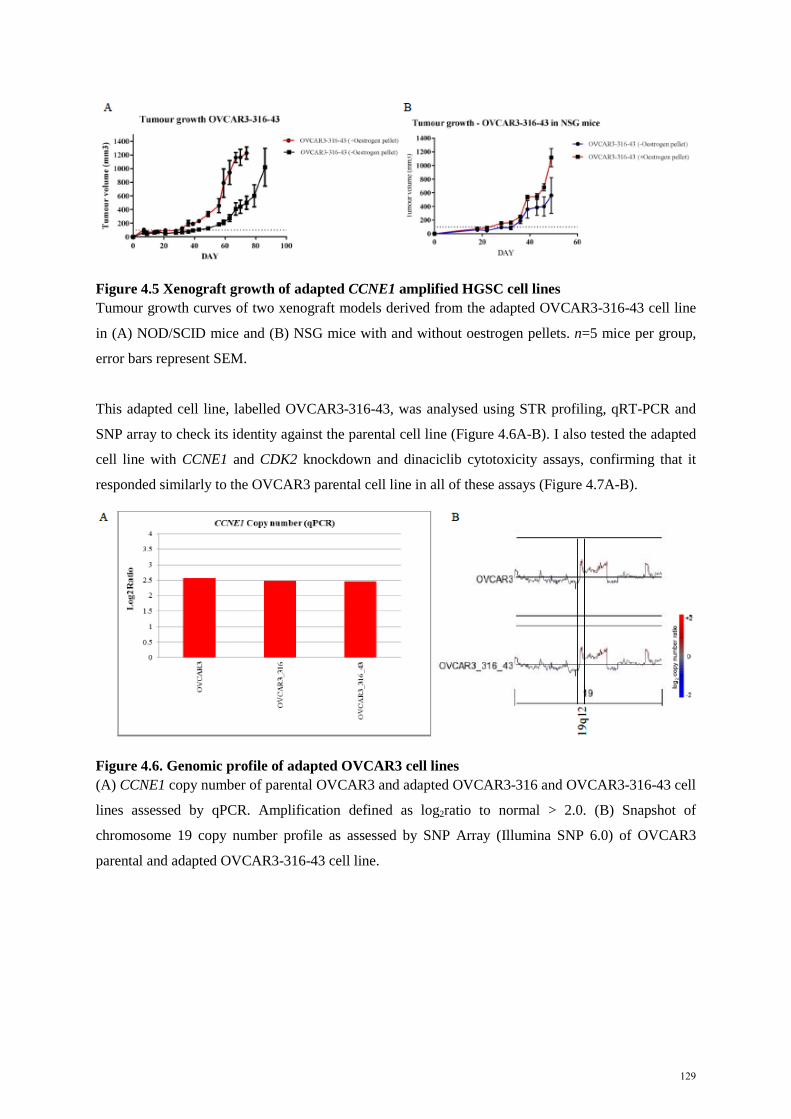
Figure 4.5 Xenograft growth of adapted CCNE1 amplified HGSC cell lines Tumour growth curves of two xenograft models derived from the adapted OVCAR3-316-43 cell line
in (A) NOD/SCID mice and (B) NSG mice with and without oestrogen pellets. n=5 mice per group,
error bars represent SEM.
This adapted cell line, labelled OVCAR3-316-43, was analysed using STR profiling, qRT-PCR and
SNP array to check its identity against the parental cell line (Figure 4.6A-B). I also tested the adapted
cell line with CCNE1 and CDK2 knockdown and dinaciclib cytotoxicity assays, confirming that it
responded similarly to the OVCAR3 parental cell line in all of these assays (Figure 4.7A-B).
Figure 4.6. Genomic profile of adapted OVCAR3 cell lines (A) CCNE1 copy number of parental OVCAR3 and adapted OVCAR3-316 and OVCAR3-316-43 cell
lines assessed by qPCR. Amplification defined as log2ratio to normal > 2.0. (B) Snapshot of
chromosome 19 copy number profile as assessed by SNP Array (Illumina SNP 6.0) of OVCAR3
parental and adapted OVCAR3-316-43 cell line.
129

Figure 4.7. Characterisation of adapted OVCAR3 cell lines (A) Clonogenic survival after transfection with CCNE1 and CDK2 siRNA in parental OVCAR3 and
adapted OVCAR3-316-43. Average percentage of discrete colonies formed after 7 days relative to no
siRNA controls shown (n=3 independently performed experiments). Error bars represent SEM. (B)
Dose response curves of parental OVCAR3 and adapted cell lines following treatment with dinaciclib.
4.3.2 Efficacy of proteasome inhibitors in vivo
To evaluate the effect of proteasome inhibitors on CCNE1-amplified HGCS, I treated mice bearing
xenografts derived from amplified (OVCAR3-316-43) and unamplified (CAOV3) cell lines with
bortezomib and MLN9708. Cells were injected into NSG mice subcutaneously, and xenografts were
measured twice weekly until they reached a volume of 100-150mm3. Mice were then randomised into
groups of 5 and treated with either vehicle or drug as described. Although bortezomib did not result in
significant tumour growth inhibition in either model (Figure 4.8A), the more pharmacologically
favourable MLN9708 resulted in significant tumour growth inhibition compared to vehicle in the
CCNE1 amplified OVCAR3 model (Figure 4.8B). There was no effect seen with MLN9708 in the
CCNE1 unamplified CAOV3 model, consistent with my in vitro results.
In a separate cohort of mice, tumours were harvested 24 hours after the third dose of MLN9708 to
assess proliferation (Ki67) and apoptosis (cleaved caspase-3) by IHC. One representative field was
chosen from each of 3 different samples per treatment group, and slides were quantitatively analysed
using Metamorph. The percentage of positive cells relative to total cells measured within each field
was plotted, and statistical analysis performed using Student’s t-test to compare between treatment
groups. Treatment with MLN9708 resulted in reduction of proliferation, as assessed by Ki67, and
increased apoptosis, as assessed by cleaved caspase-3 (Figure 4.8C). These effects were specific to the
CCNE1 amplified OVCAR3 model.
130

Figure 4.8 Activity of proteasome inhibitors in vivo
(A-B) Immunocompromised mice bearing OVCAR3 or CAOV3 tumour xenografts were treated with
either vehicle or drug as described in the Methods. Plots represent mean tumour volume change from
baseline ± SEM. n=5 mice per group. (C) Subcutaneous xenograft tumours were harvested after 24
hours of treatment with vehicle or drug and examined by IHC. Proliferation (Ki67) was inhibited and
apoptosis (cleaved caspase-3) induced by MLN9708, observed only in the OVCAR3 model.
In summary, I demonstrated selective sensitivity to proteasome inhibitors in vitro in CCNE1 amplified
HGSC cell lines, and selective tumour growth inhibition following treatment with MLN9708 in a
CCNE1 amplified xenograft model, with evidence of apoptosis and reduced proliferation.
131
4.4 Results from a high throughput screen Although tumour growth inhibition was noted following treatment of the CCNE1 amplified xenograft
model with MLN9708, there was no evidence of significant tumour regression. Therefore in order to
identify drugs that would selectively synergise with proteasome inhibitors, I performed a high
throughput compound screen in combination with bortezomib.
I began with a primary screen of 4,059 compounds in combination with a fixed dose of bortezomib
and identified putative combinations (hits) as described in the Methods. As described in Chapter 3, the
screen was performed with a CCNE1 amplified cell line (OVCAR3), an unamplified cell line
(SKOV3) and a cell line that was resistant to CDK inhibitors (OVCAR3-R1). As noted earlier, the
decision to use SKOV3 to compare with OVCAR3 predated the publication of the study by Domcke
et al (461). Cells were seeded into 384 well plates and allowed to adhere overnight. Library
compounds and bortezomib were added to cells using robotic pintool transfer. Following exposure to
drug for 48 hours, cell viability was measured using the CellTitre-Glo luminescent assay (Promega),
and average viability was normalised to DMSO control treated wells. Dose response curves and the
half maximal effective concentration (EC50) for each individual library compound for each cell line
was approximated by fitting a four-parameter dose-response curve using XLfit (IDBS). Dose response
curves were manually curated and library compounds where a curve could not be fitted were excluded
from the primary screen analysis. To select hits from the primary screen, each EC50 value was used to
make two pair-wise comparisons:
1. Library compound plus bortezomib comparing CCNE1-amplified (OVCAR3) to CCNE1-
unamplified (SKOV3)
2. Library compound plus bortezomib comparing parental (OVCAR3) to CDK inhibitor-
resistant (OVCAR3-R1)
Library compounds where the ratio of EC50 was less than 0.5 were selected as hits for that particular
comparison (Figure 4.9A-B, Appendix A-B). A total of 36 compounds in comparison 1 and 28
compounds in comparison 2 were identified as hits and taken forward for the secondary screen.
Additional compounds of biological interest such as BH3-mimetics and cell cycle inhibitors were
added for a final list of 64 compounds which optimised the space available on a 384 well plate
(Appendix C-D).
132

Figure 4.9 Results from primary screen
Scatter plots showing EC50 values for library compounds in combination with bortezomib from the
primary screen for the comparison between (A) CCNE1 amplified and unamplified and (B) resistant
versus parental. Data points in red represent compounds taken forward for secondary screen.
In the secondary screen, cells were treated with the selected library compounds across an 11-point
titration in the presence or absence of bortezomib. This enabled me to identify compounds that would
have an additive effective in combination with bortezomib. Similar to the primary screen, measured
cell viability at assay endpoint was used to generate dose response curves and determine the EC50 for
each library compound in the presence or absence of bortezomib (Figure 4.10-4.11). Hits were
selected if the EC50 for the combination was less than half the EC50 for the single agent. For the
CCNE1 amplified cell line (OVCAR3), 6 compounds were selected as hits from the secondary screen.
For the CDK inhibitor-resistant cell line (OVCAR3-R1), 8 compounds were selected. Hits from the
secondary screen were taken forward for formal evaluation of their interaction in combination with
bortezomib in a matrix screen that utilised the Chou-Talalay methodology for testing drug
combinations (Methods). Combination indexes quantifying the interaction between the library
compound and bortezomib were generated using CalcuSyn 2.0 software.
133

Figure 4.10 Dose response curves from secondary screen
Dose response curves for each library compound in the presence or absence of bortezomib for each
cell line as labelled. Compounds shown are those taken forward to matrix screen for the CCNE1
amplified cell line (OVCAR3).
134

Figure 4.11 Dose response curves from secondary screen
Dose response curves for each library compound in the presence or absence of bortezomib for each
cell line as labelled. Compounds shown are those taken forward to matrix screen for the CDK
inhibitor-resistant cell line (OVCAR3-R1).
Table 4.1 describes the combination indexes for the compounds tested in the matrix screen. In the
OVCAR3 cell line, bortezomib was noted to have a synergistic interaction with GW-843682X, a
polo-like kinase 1 (Plk1) inhibitor (465). In the OVCAR3-R1 cell line, bortezomib was noted to have
synergistic interactions with six different histone deacetylase (HDAC) inhibitors, suggestive of a class
effect, although the interactions varied between moderate synergism and additive (Table 4.5). HDAC
inhibitors have multiple mechanisms of action, and each differs in terms of their effects (discussed
below in Section 4.5.3), which may explain why there are varying levels of synergism. Of note, the
OVCAR3-R1 cell line is equally sensitive to bortezomib compared to the parental cell line, as is the
dinaciclib resistant cell line OVCAR3-RD1 (Figure 4.2). Further studies are required to determine if
the synergistic interaction between proteasome inhibitors and HDAC inhibitors is selective for CDK-
resistant cell lines.
Table 4.1 Combination indexes and interaction between compounds tested in matrix screen
135

4.5 Discussion 4.5.1 Mechanism of action of proteasome inhibitors
In this chapter, I have demonstrated selective activity of proteasome inhibitors in CCNE1 amplified
HGSC in vitro and in vivo. Furthermore, a high throughput screen identified multiple potential drug
combinations that may be synergistic with proteasome inhibitors in CCNE1 amplified cells. Given the
frequent emergence of resistance associated with the use of targeted therapies as single agents,
synergistic drug combinations may be a more effective strategy (466).
The ubiquitin-proteasome system is responsible for the degradation and turnover of most intracellular
proteins in human cells (467, 468). Mutations in the ubiquitin-proteasome pathway are associated with
multiple different cancers (468). The 26S proteasome is a large multi-subunit complex that is a key
part of the ubiquitin-proteasome system, and is the target for many currently available proteasome
inhibitors (468, 469). Bortezomib is a first generation proteasome inhibitor, and has a proven role in
multiple myeloma (457, 470). More recently a screen of over 16,000 compounds identified bortezomib
as a key inhibitor of the Fanconi Anaemia (FA) pathway (425). The FA pathway has been shown to be
critical to various aspects of the DNA repair process including HR. Central to the FA pathway is the
mono-ubiquitination of FANCD2, which co-ordinates multiple DNA repair activities (471). It is
hypothesised that interfering with protein degradation affects the ubiquitination of FANCD2, although
the direct mechanism of FA pathway inhibition has not been clearly defined (425). Proteasome
inhibition has also been shown to interfere with activation of Rad51, a key factor for HR (472).
However, non-homologous end joining repair was not significantly affected, with activation of ATM,
γH2AX and Mre11 all unaffected (472). Therefore additional studies to clearly define the impact of
proteasome inhibition on HR and DNA repair are required.
Consistent with these observations of the effects of proteasome inhibition on HR, analysis of data
from a genome wide screen identified multiple genes in the proteasome-ubiquitin system as being
required in CCNE1 amplified cells (473). A validation screen of 115 highest ranked genes
subsequently confirmed that the suppression of genes including UBA1 and RBX1 were associated with
the greatest impact on viability in CCNE1 amplified cells. UBA1, encoding for ubiquitin-activating
enzyme E1, is the enzyme that initiates the transfer of ubiquitin molecules to target proteins, tagging
them for degradation by the proteasome (474). UBA1 has been implicated as the key ubiquitylation
enzyme required for responses to DNA damage, particularly in the repair of double-stranded breaks
(475). Targeting of UBA1 has been shown to result in cell death in leukaemic cell lines (476), and
elicit an unfolded protein response similar to proteasome inhibitors (474). Direct inhibitors of
ubiquitin-activating enzyme E1 have been developed, although none have progressed to the clinical
setting (477, 478). Ring box protein 1 (RBX1) is an essential component of the Skp1/Cullins/F-box
(SCF) complex that is the largest multiunit E3 ubiquitin ligase, and co-ordinates ubiquitination of a
136

broad range of proteins (479). The role of RBX1 alterations across many types of cancers has been
studied, and expression of RBX1 has been identified as a prognostic marker in gastric cancer (480-
482). In HGSC, RBX1 downregulation is frequently observed, although the functional consequence of
this is unclear (481). Taken together with results from this chapter, there is increasing evidence to
support proteasome inhibitors as a potential therapeutic strategy to targeting CCNE1 amplified HGSC.
Resistance to proteasome inhibitors has also been studied. Polyploidy has been identified as a
potential resistance mechanism to bortezomib resistance in multiple myeloma (483, 484). Interestingly,
polyploidy was also noted to be a resistance mechanism to CDK2 inhibitors in CCNE1 amplified
cells, where excess cyclin E1 may contribute to endoreplication (445). However, I showed no
evidence of cross-resistance to bortezomib in the CDK-resistant cell lines OVCAR3-R1 and
OVCAR3-RD1. Generating CCNE1 amplified cell lines that are resistant to proteasome inhibitors
through chronic in vitro exposure may provide clinically useful information if these compounds
progress to the clinic in selected HGSC patients.
4.5.2 Polo-like kinase 1 (Plk1) inhibitors as a potential therapeutic strategy
My results from the high throughput screen indicated that Plk1 inhibitors may be synergistic in
combination with bortezomib in CCNE1 amplified HGSC cells. Plk1 is one of a family of 5
serine/threonine kinases, and has a key role in cell cycle regulation through its effects on chromosome
segregation, spindle assembly and cytokinesis (485). Plk1 has also been shown to regulate the DNA
damage checkpoint (486). Plk1 kinase activity has also been implicated in resistance to drugs such as
gemcitabine, paclitaxel and doxorubicin (487). In EOC, Plk isoform expression has been associated
with poor clinical outcome, although only Plk1 over-expression remained a prognostic factor in
multivariate analysis (488). Studies in other cancers such as non-small cell lung cancer, oesophago-
gastric, breast and colorectal cancer have shown similar results (489). Therefore Plk1 has been
proposed as a potential therapeutic target in cancer, and multiple Plk1 inhibitors are in clinical
development.
A recent randomised phase II study in unselected patients with recurrent platinum resistant or
refractory EOC compared investigator’s choice of chemotherapy with volasertib, a potent Plk1
inhibitor targeting the kinase domain (490). Treatment with volasertib was deemed to be tolerable,
although 61% of patients treated with volasertib suffered a grade 3 or higher haematological adverse
event, and 35% required a dose reduction. In terms of efficacy, clinical response rate and PFS was
similar between volasertib and chemotherapy. Exploratory analyses of Plk1, Ki-67, and
phosphorylated histone-3 expression by IHC did not demonstrate any relationship between these
markers and drug response. The study investigators concluded that further clinical development of
volasertib in this setting should only be pursued after a biomarker has been identified. Furthermore,
137

novel Plk1 inhibitors are now in development to reduce the potential off-target effects of volasertib
(491). Small molecule inhibitors of the protein-protein interactions of the polo-box domain of Plk1
have now been developed, with potent effects in pre-clinical studies on cell cycle arrest and apoptosis
(492).
Further studies in vitro and in vivo are required to confirm this result, and to investigate the potential
mechanism of action. If the results of future studies validate this finding, CCNE1 amplification may
be a potential biomarker to predict response to Plk1 inhibitors in combination with proteasome
inhibitors.
4.5.3 Histone deacetylase inhibitors (HDACi)
From the high throughput screen I conducted, bortezomib in combination with various HDACi were
noted to have synergistic or additive effects in the OVCAR3-R1 resistant cell line, suggesting a
possible class effect between proteasome inhibitors and HDACi.
Histone acetylation and deacetylation are important determinants of gene expression, and have been
implicated in multiple steps in oncogenesis including cell cycle regulation, DNA damage repair and
apoptosis (493). Histone deacetylatases (HDAC) are a complex family of enzymes of 18 different
HDACs classified into four different classes, with multiple protein targets and associations, reviewed
recently in West et al, Journal of Clinical Investigation 2014 (493). Therefore HDACi are known to
affect multiple cellular processes, including cell cycle arrest, differentiation, angiogenesis and
apoptosis (494)
HDACi have been tested as single agents and in combination with other drugs in multiple clinical
trials (495). However, although some success has been seen with vorinostat in haematological
malignancies such as peripheral T cell lymphoma, none are registered for use in Australia for solid
malignancies (496). In terms of EOC, vorinostat as a single agent had minimal clinical activity (497).
A phase I study combining vorinostat with carboplatin and gemcitabine in patients with recurrent
EOC was terminated early due to significant haematological toxicities (498), despite strong pre-
clinical rationale supporting synergy between HDACi and chemotherapy (499). More recently, a pre-
clinical study demonstrated that panobinostat led to down-regulation of cyclin E1 and HR pathway
genes such as BRCA1 in a limited number of ovarian cancer cell lines (500). In addition, the
investigators also observed synergism between panobinostat and olaparib, although this effect was not
specific to CCNE1 amplified cells.
The combination of panobinostat with bortezomib has been extensively studied in multiple myeloma
(501, 502), with promising clinical efficacy in refractory or relapsed disease. However, the same
138

combination of panobinostat and bortezomib failed to demonstrate any activity in recurrent pancreatic
cancer, and caused significant toxicity (503). Therefore further studies to elucidate the underlying
mechanisms of action, ideal patient selection and optimal drug combinations are required.
4.5.4 Concluding remarks
Proteasome inhibitors, potentially through inhibition of HR, may be another therapeutic strategy to
targeting CCNE1 amplified HGSC. Work in this chapter provides supporting evidence to consider a
clinical trial in patients with CCNE1 amplified HGSC using MLN9708, a second generation
proteasome inhibitor that is likely to have improved activity in solid tumours compared with
bortezomib. In addition, drugs such as HDACi and Plk1 inhibitors were noted to be synergistic with
bortezomib in a high throughput compound screen, and may potentially be more effective in vivo.
Future work to validate these compounds in additional clinically relevant models of CCNE1 amplified
HGSC will provide further impetus to designing rational biomarker driven clinical trials.
4.6 Appendix – Etemadmoghadam D, et al. Synthetic lethality between CCNE1 amplification and BRCA1 loss. Proceedings of the National Academy of Sciences USA 2013;110:19489-94.
139
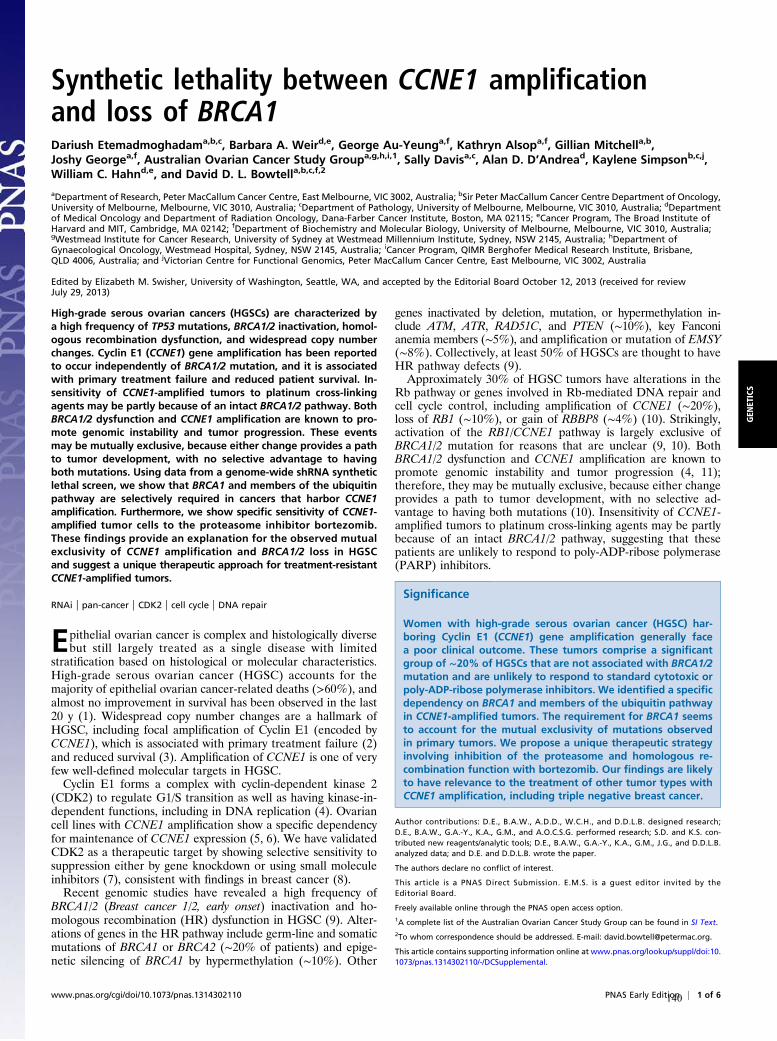
Synthetic lethality between CCNE1 amplificationand loss of BRCA1Dariush Etemadmoghadama,b,c, Barbara A. Weird,e, George Au-Yeunga,f, Kathryn Alsopa,f, Gillian Mitchella,b,Joshy Georgea,f, Australian Ovarian Cancer Study Groupa,g,h,i,1, Sally Davisa,c, Alan D. D’Andread, Kaylene Simpsonb,c,j,William C. Hahnd,e, and David D. L. Bowtella,b,c,f,2
aDepartment of Research, Peter MacCallum Cancer Centre, East Melbourne, VIC 3002, Australia; bSir Peter MacCallum Cancer Centre Department of Oncology,University of Melbourne, Melbourne, VIC 3010, Australia; cDepartment of Pathology, University of Melbourne, Melbourne, VIC 3010, Australia; dDepartmentof Medical Oncology and Department of Radiation Oncology, Dana-Farber Cancer Institute, Boston, MA 02115; eCancer Program, The Broad Institute ofHarvard and MIT, Cambridge, MA 02142; fDepartment of Biochemistry and Molecular Biology, University of Melbourne, Melbourne, VIC 3010, Australia;gWestmead Institute for Cancer Research, University of Sydney at Westmead Millennium Institute, Sydney, NSW 2145, Australia; hDepartment ofGynaecological Oncology, Westmead Hospital, Sydney, NSW 2145, Australia; iCancer Program, QIMR Berghofer Medical Research Institute, Brisbane,QLD 4006, Australia; and jVictorian Centre for Functional Genomics, Peter MacCallum Cancer Centre, East Melbourne, VIC 3002, Australia
Edited by Elizabeth M. Swisher, University of Washington, Seattle, WA, and accepted by the Editorial Board October 12, 2013 (received for reviewJuly 29, 2013)
High-grade serous ovarian cancers (HGSCs) are characterized bya high frequency of TP53 mutations, BRCA1/2 inactivation, homol-ogous recombination dysfunction, and widespread copy numberchanges. Cyclin E1 (CCNE1) gene amplification has been reportedto occur independently of BRCA1/2 mutation, and it is associatedwith primary treatment failure and reduced patient survival. In-sensitivity of CCNE1-amplified tumors to platinum cross-linkingagents may be partly because of an intact BRCA1/2 pathway. BothBRCA1/2 dysfunction and CCNE1 amplification are known to pro-mote genomic instability and tumor progression. These eventsmay be mutually exclusive, because either change provides a pathto tumor development, with no selective advantage to havingboth mutations. Using data from a genome-wide shRNA syntheticlethal screen, we show that BRCA1 and members of the ubiquitinpathway are selectively required in cancers that harbor CCNE1amplification. Furthermore, we show specific sensitivity of CCNE1-amplified tumor cells to the proteasome inhibitor bortezomib.These findings provide an explanation for the observed mutualexclusivity of CCNE1 amplification and BRCA1/2 loss in HGSCand suggest a unique therapeutic approach for treatment-resistantCCNE1-amplified tumors.
RNAi | pan-cancer | CDK2 | cell cycle | DNA repair
Epithelial ovarian cancer is complex and histologically diversebut still largely treated as a single disease with limited
stratification based on histological or molecular characteristics.High-grade serous ovarian cancer (HGSC) accounts for themajority of epithelial ovarian cancer-related deaths (>60%), andalmost no improvement in survival has been observed in the last20 y (1). Widespread copy number changes are a hallmark ofHGSC, including focal amplification of Cyclin E1 (encoded byCCNE1), which is associated with primary treatment failure (2)and reduced survival (3). Amplification of CCNE1 is one of veryfew well-defined molecular targets in HGSC.Cyclin E1 forms a complex with cyclin-dependent kinase 2
(CDK2) to regulate G1/S transition as well as having kinase-in-dependent functions, including in DNA replication (4). Ovariancell lines with CCNE1 amplification show a specific dependencyfor maintenance of CCNE1 expression (5, 6). We have validatedCDK2 as a therapeutic target by showing selective sensitivity tosuppression either by gene knockdown or using small moleculeinhibitors (7), consistent with findings in breast cancer (8).Recent genomic studies have revealed a high frequency of
BRCA1/2 (Breast cancer 1/2, early onset) inactivation and ho-mologous recombination (HR) dysfunction in HGSC (9). Alter-ations of genes in the HR pathway include germ-line and somaticmutations of BRCA1 or BRCA2 (∼20% of patients) and epige-netic silencing of BRCA1 by hypermethylation (∼10%). Other
genes inactivated by deletion, mutation, or hypermethylation in-clude ATM, ATR, RAD51C, and PTEN (∼10%), key Fanconianemia members (∼5%), and amplification or mutation of EMSY(∼8%). Collectively, at least 50% of HGSCs are thought to haveHR pathway defects (9).Approximately 30% of HGSC tumors have alterations in the
Rb pathway or genes involved in Rb-mediated DNA repair andcell cycle control, including amplification of CCNE1 (∼20%),loss of RB1 (∼10%), or gain of RBBP8 (∼4%) (10). Strikingly,activation of the RB1/CCNE1 pathway is largely exclusive ofBRCA1/2 mutation for reasons that are unclear (9, 10). BothBRCA1/2 dysfunction and CCNE1 amplification are known topromote genomic instability and tumor progression (4, 11);therefore, they may be mutually exclusive, because either changeprovides a path to tumor development, with no selective ad-vantage to having both mutations (10). Insensitivity of CCNE1-amplified tumors to platinum cross-linking agents may be partlybecause of an intact BRCA1/2 pathway, suggesting that thesepatients are unlikely to respond to poly-ADP-ribose polymerase(PARP) inhibitors.
Significance
Women with high-grade serous ovarian cancer (HGSC) har-boring Cyclin E1 (CCNE1) gene amplification generally facea poor clinical outcome. These tumors comprise a significantgroup of ∼20% of HGSCs that are not associated with BRCA1/2mutation and are unlikely to respond to standard cytotoxic orpoly-ADP-ribose polymerase inhibitors. We identified a specificdependency on BRCA1 and members of the ubiquitin pathwayin CCNE1-amplified tumors. The requirement for BRCA1 seemsto account for the mutual exclusivity of mutations observedin primary tumors. We propose a unique therapeutic strategyinvolving inhibition of the proteasome and homologous re-combination function with bortezomib. Our findings are likelyto have relevance to the treatment of other tumor types withCCNE1 amplification, including triple negative breast cancer.
Author contributions: D.E., B.A.W., A.D.D., W.C.H., and D.D.L.B. designed research;D.E., B.A.W., G.A.-Y., K.A., G.M., and A.O.C.S.G. performed research; S.D. and K.S. con-tributed new reagents/analytic tools; D.E., B.A.W., G.A.-Y., K.A., G.M., J.G., and D.D.L.B.analyzed data; and D.E. and D.D.L.B. wrote the paper.
The authors declare no conflict of interest.
This article is a PNAS Direct Submission. E.M.S. is a guest editor invited by theEditorial Board.
Freely available online through the PNAS open access option.1A complete list of the Australian Ovarian Cancer Study Group can be found in SI Text.2To whom correspondence should be addressed. E-mail: [email protected].
This article contains supporting information online at www.pnas.org/lookup/suppl/doi:10.1073/pnas.1314302110/-/DCSupplemental.
www.pnas.org/cgi/doi/10.1073/pnas.1314302110 PNAS Early Edition | 1 of 6
GEN
ETICS
140

Here, we show that BRCA1 and members of the ubiquitinpathway are selectively required in cancers that harbor CCNE1amplifications. Furthermore, we show specific sensitivity of CCNE1-amplified tumor cells to the proteasome inhibitor bortezomib.These findings provide an explanation for the observed mutualexclusivity of CCNE1 amplification and BRCA1/2 loss in HGSCsand suggest a unique therapeutic approach for treatment-resistantCCNE1-amplified tumors.
ResultsCCNE1 Gene Amplification in Primary Tumors. To better define thefrequency of CCNE1 amplification in solid cancers, we usedgenomic data from The Cancer Genome Atlas (TCGA) to per-form a pan-cancer analysis of 22 cancer types (Materials andMethods). We found that focal high-level amplification of 19q12involving CCNE1 occurs at a frequency of ∼5% in breast, lung,and gastric cancers and that it is most frequent (∼25%) inHGSCs (Fig. 1A). Consistent with our previous findings (5), themost significant or peak region of amplification always involvedCCNE1; however, genes neighboring CCNE1, such as prefoldin-like chaperone URI1, were present in peak regions in some tu-mor types. These findings suggest that the reported driver ac-tivity of URI (12) or other genes within the 19q12 amplicon (8)may be restricted to certain cancers.The previously reported mutual exclusivity of BRCA1/2 muta-
tions and CCNE1 amplification (9, 10) has not been validated inan independent dataset. We, therefore, stratified tumors from theAustralian Ovarian Cancer Study (n = 194) by BRCA1/2 germ-linemutation (13), somatic mutation, or methylation status (14) andaccurately measured CCNE1 copy number by quantitative PCR(qPCR) (Fig. 1B). Assessment of copy number by qPCR providesa more accurate measure of the extent of copy number change (2)than microarray-based estimates used in prior studies (9). Al-though low-level CCNE1 gain and BRCA1/2 mutation were ob-served, complete mutual exclusivity was seen between high-levelCCNE1 amplification (log2 ratio > 2; approximately eightcopies per genome) and BRCA1/2 germ-line mutations (Fishertest P value < 0.01). Although the study was not adequatelypowered for comparison with somatically mutated or methyl-ated samples, the same pattern was observed. Our findings suggestthat there is a functional difference between low- and high-levelCCNE1 copy number states and that there is a threshold ofCCNE1 amplification where BRCA1/2 inactivation is unlikelyto co-occur.
Dependencies of CCNE1-Amplified Cell Lines. We have recentlyshown oncogene addiction to Cyclin E1 and its partner kinase,CDK2, in CCNE1-amplified ovarian tumors (7), suggesting thatuse of CDK2 inhibitors may be effective in these cancers. Inaddition to CDK2, Cyclin E1 interacts with CDK1 and CDK3and has kinase-independent functions (4). Furthermore, Cyclin E1is regulated both positively and negatively by posttranslationalproteolysis (15). To better understand the dependencies of tumorcells with CCNE1 amplification and identify other potentialtherapeutic targets, we analyzed data from a genome-wideshRNA screen of 102 cancer cell lines with known copy numberstatus, including a high proportion of epithelial ovarian cancer(n = 25) (16). We included all available cell lines to obtain suf-ficient statistical power for the analysis. Cells infected with a poolof 54,020 shRNAs (targeting 11,194 genes) were grown for atleast 16 doublings, and the abundance of individual shRNAsequences was measured relative to a reference to identify genesessential for survival (16). In two separate analyses, we comparedCCNE1-amplified (n = 23) with nonamplified (n = 43) andCCNE1 high- (n = 15) with low-expressing (n = 41) cells. Toimprove specificity, we removed samples with CCNE1 copynumber or expression that fell into the midrange of values.Using a statistical approach that considered data from eitherthe second-best shRNA or an aggregate score from multipleshRNAs targeting the same gene (Materials and Methods), weidentified 835 essential genes in either CCNE1-amplified and/or overexpressing cancer cell lines (Table S1). We then con-sidered four additional factors as evidence of significant bi-ological relevance to further filter candidate genes (Fig. 2A)and identified those genes that were (i) among the top-rankedshRNA hits, (ii) located in recurrent amplicons reported byTCGA (9) and therefore, likely to be tumor drivers, (iii) coex-pressed with CCNE1 (Fig. S1 and Table S2), and (iv) locatedin pathways significantly enriched among hits (Gene Goanalysis) (Fig. S2). A total of 115 genes met at least one of ouradditional selection criteria (Fig. S3). High confidence hits,meeting three or more filtering criteria (n = 25), are shownin Fig. 2B.Importantly, CCNE1 and CDK2, as well as other associated
cell cycle genes, were ranked highly in our analysis, validating theexperimental approach and supporting CDK2 as a key thera-peutic target in CCNE1-amplified tumors (Fig. 2B). Other top-ranked hits included TPX2, a centromeric protein that maintainsmitotic spindle integrity and genome stability (17). We havepreviously shown that the TPX2 locus, located at 20q11, is fre-quently coamplified with CCNE1 (5). Our findings support the
WT
BR
CA
1/2
GL
BRC
A1
GL
BRC
A2
SO
M B
RC
A1
SO
M B
RC
A2
ME
TH B
RC
A1
-2
-1
0
1
2
3
4
5
CC
NE1
log 2
cop
y nu
mbe
r rat
io
***
0.5 - 2 2
0.5
0 5 10 15 20 25All cancers
All glialGlioblastoma multiformeColon adenocarcinoma
ColorectalLung adenocarcinoma
Breast invasiveAll epithelial cancers
All lung cancersLung squamous cell
Uterine corpus endometrioidStomach adenocarcinoma
Bladder urothelialOvarian serous
Frequency of Amplification (%)
CCNE1CCNE1, URI1
C19orf12, CCNE1, URI1CCNE1
CCNE1, URI1CCNE1, URI1CCNE1
7 genes6 genes
119 genes21 genesCCNE1
5 genesCCNE1
BA
Fig. 1. (A) Pan-cancer copy number analysis of 6,547 tumor samples comprising 22 cancer types from TCGA. Frequency of high-level amplification of peakregions of copy number change incorporating CCNE1 is shown for cancer types with amplification. Data were obtained from the TCGA Copy Number Portalusing all available data as of February of 2013. Name or total number of genes including CCNE1 within significant peak regions of amplification is indicated.(B) CCNE1 copy number assessed by qPCR in primary tumor samples from the Australian Ovarian Cancer Study (n = 193) stratified by WT, germ-line (GL), orsomatic (SOM) BRCA1/2 mutation or methylation (METH) status. Bars indicate mean and SD. t test. *P value < 0.05; **P value < 0.01.
2 of 6 | www.pnas.org/cgi/doi/10.1073/pnas.1314302110 Etemadmoghadam et al.141

view that cooperative amplification of 19q12 and 20q11 is im-portant to the genesis and/or maintenance of CCNE1-amplifiedtumors. No other genes within the 19q12 amplicon, includingURI1 (which was previously suggested to be a target of gene
amplification) (12), were found in our analysis of the shRNAscreen data. We also noted that genes involved in DNA damageresponse (DDR) were identified as essential genes in the screen,including BRCA1, XRCC2 (Fig. 2B), and ATR (Fig. S3). Thesefindings suggest that chromosomal segregation and DDR mech-anisms may be specific vulnerabilities of CCNE1-amplified oroverexpressing cells. Finally, Ubiquitin-like modifier activating en-zyme 1 (UBA1) was among the top 25 hits from the screen (Fig.2B). We also observed that other members of the ubiquitinpathway, including Ubiquitin B (UBB), Ubiquitin C (UBC), andRing-Box Protein 1 (RBX1), were among the top 115 rankedgenes in the initial screen (Fig. S3), and they were, therefore,included in the validation studies.
Acute Effects of Gene Suppression.We sought to validate hits fromthe shRNA screen using an orthogonal siRNA platform. Com-pared with the shRNA screen, shorter-term (5 d) siRNA experi-ments provide additional information on the acute effects of genesuppression on cell viability. We screened two cells lines, SK-OV-3(CCNE1-unamplified cells) and OVCAR-3 (CCNE1-amplifiedcells), against a boutique siRNA library of 115 highly ranked hitsfrom the shRNA screen (Fig. 2B and Fig. S3). Additionally, weincluded 27 candidate genes based on their biological relevance(Fig. S4). Selected candidates included cell cycle and DDRgenes in addition to genes involved with processing and deg-radation of CCNE1 protein (15). Suppression of PLK1 wasused as a positive (death) control (18). Cells were transfectedwith siRNA, and viability was measured 5 d after transfection.Volcano plots of P value significance against the effect on cellviability are shown for each cell line in Fig. S5, and all data areprovided in Table S3.The cell viability ratio between OVCAR-3 and SK-OV-3
plotted against the P value significance for OVCAR-3 cellshighlights significant hits with highest specificity to the CCNE1-amplified cell line (Fig. 3A). Among these genes were CCNE1,CDK2, and BRCA1 and other genes involved with cell divisionand DNA damage response and repair (ATM, CHEK1, andSMC2). The greatest impact on cell viability in CCNE1-amplifiedcells was associated with suppression of genes involved in theubiquitin pathway, including UBA1, UBC, and RBX1, in additionto CUL3 and FBXW7, which were included in the siRNA screenbased on their roles in CCNE1 processing (15).Although CCNE1 and CDK2 rank among the most significant
hits in the OVCAR-3 cell line, the magnitude of the effect on cellviability was limited (Table S3). This finding is consistent withour previous studies that show a greater effect of gene sup-pression using siRNA (5) or CDK-specific inhibitors (7) in clo-nogenic survival assays compared with short-term viability assays.Similarly, for BRCA1, we showed a greater effect of inhibitionof BRCA1 in clonogenic survival assays (∼50% reduction) thanobserved in the siRNA boutique screen (Fig. 3B and Fig. S5).Knockdown of each gene transcript was validated by real-timeqPCR (Fig. S6).
Targeting Homologous Recombination and the Proteasome. De-pendence on BRCA1 suggests that intact HR function is requiredfor the survival of CCNE1-amplified tumor cells. Fanconi Ane-mia (FA) pathway members coordinate multiple DNA repairmechanisms, including HR. Recently, a cell-based screen of over16,000 compounds identified the proteasome inhibitor bortezo-mib as a potent inhibitor of the FA pathway and double-strandbreak repair by HR (19). It is thought that disruption of proteindegradation by bortezomib either interferes with or is a re-quirement of FA pathway activity. The mutual exclusivity ob-served between HR pathway dysfunction and CCNE1 amplificationand the dependence on genes involved with protein degradationsuggested that CCNE1-amplified tumors may show selective sen-sitivity to bortezomib. We assessed ovarian cell line sensitivity to
Ess
ential
CCN
E1
Am
plif
ied
2nd B
est
p-v
alue
KS p
-val
ue
Ess
ential
CCN
E1 H
igh E
xpre
ssio
n
2nd B
est
p-v
alue
KS p
-val
ue
Loca
ted in a
n A
mplic
on (
TCG
A)
Co-e
xpre
ssed
with C
CN
E1 (
TCG
A)
In S
ignific
ant
Gen
eGo P
athw
ay
Top R
anki
ng s
hRN
A H
it
Num
ber
Sel
ection C
rite
ria
Met
Cel
l Cyc
le G
ene*
DN
A D
amag
e Res
ponse
/Rep
air
Gen
e*
High Confidence Hits
CDK2 D 0.0171 p<0.001 D p<0.001 p<0.001 Y D D 5 ll
CCNE1 C 0.0088 0.0269 C 0.0192 0.1069 Y NA C 4 ll
ACAT2 CA 0.0039 p<0.001 CA 0.0138 p<0.001 CA CA 4
CSE1L SE 0.1057 0.0153 SE 0.0133 p<0.001 SE SE 4
BRCA1 R 0.059 0.0096 0.1108 0.1836 R R 3 ll D
CCNA2 0.0878 0.0645 C 0.0263 0.0112 C C 3 ll
CDC42 D 0.0235 p<0.001 D 0.0099 0.007 D 3
CHD2 H p<0.001 0.0513 0.0533 0.7309 Y H 3
DDX17 D 0.0093 0.0028 D 0.0012 p<0.001 D 3
DUSP16 U p<0.001 0.0087 U 0.0035 0.0334 U 3
ENPP2 NP p<0.001 0.0046 NP 0.0031 0.0011 NP 3
HNRNPA3 N 0.0833 0.017 N p<0.001 0.0029 Y 3
IARS2 R p<0.001 0.0049 R p<0.001 0.0171 R 3
MYC 0.5835 0.8201 YC 0.213 0.014 Y YC 3
PSMA5 M 0.0443 0.0204 M 0.0083 p<0.001 M 3
RRM1 R 0.012 p<0.001 R p<0.001 0.0159 R 3
SLC35A3 C3 0.0293 0.0054 C3 p<0.001 0.0265 C3 3
SMC2 M 0.021 0.0072 M 0.0352 0.0051 M 3 ll
SPATA6 AT 0.0189 0.1308 AT p<0.001 0.0194 AT 3
SRBD1 RB 0.0246 0.0496 RB 0.0188 0.1869 Y 3
TPX2 X2 0.0036 p<0.001 0.0766 0.0746 Y X2 3 ll
TUBB B 0.0026 0.0018 B 0.0015 p<0.001 B 3
UBA1 BA 0.0325 0.0049 BA 0.5509 0.02 BA 3
VCP CP p<0.001 0.0049 CP p<0.001 p<0.001 CP 3 D
XRCC2 0.0366 0.0385 R 0.0211 0.0313 Y R 3 D
A
B
125
CCNE1 amplified n = 474
CCNE1 high
expression n = 486
Candidate essential genes n = 835
CCNE1 CDK2
Genes in amplified region
Genes co-expressed with CCNE1
Genes in enriched pathways
Top Ranked Hits
Fig. 2. (A) Venn diagram of candidate genes essential for the survival ofCCNE1-amplified (n = 474) and overexpressing (n = 486) cell lines identifiedin the shRNA synthetic lethal screen. Candidates were further filtered toinclude genes that were present in commonly amplified regions in ovariantumors, coexpressed with CCNE1, present in significantly enriched genepathways, or among top-ranking shRNA hits. (B) Top 25 ranking genes an-notated by inclusion criteria. Statistical significance of ranking by second-best scoring shRNA or a composite score of all shRNAs (KS statistic) given(Materials and Methods). *Go term processes: cell cycle, DNA repair, or re-sponse to DNA damage.
Etemadmoghadam et al. PNAS Early Edition | 3 of 6
GEN
ETICS
142

bortezomib in a panel of 10 cell lines (Fig. 4). FUOV-1 andOVCAR-3, which have high-level CCNE1 amplification andexpression, showed the greatest sensitivity to bortezomib. A2780,which lacks CCNE1 amplification but strongly expresses CCNE1,was also among the most sensitive lines. By contrast, Kuramochi,
with low-level CCNE1 gain, did not show heightened sensitivityto bortezomib. Interestingly, Kuramochi and IGROV-1, withreduced sensitivity to bortezomib, harbor mutations in BRCA2and BRCA1, respectively (20). We also examined two cell linesderived from the OVCAR-3 parental line that are resistant to twoCDK2-specific inhibitors PHA-533533 and dinaciclib (OVCAR-3-R1 and -RD1, respectively) (7). We found that both linesmaintained sensitivity to bortezomib, suggesting a specific mech-anism of resistance to CDK inhibitors in these cell lines.
DiscussionBRCA1/2 mutation is typically associated with platinum sensi-tivity and favorable clinical outcome (13). The absence of BRCApathway disruption from CCNE1-amplified cancers may partlyexplain the relatively poor outcome observed in CCNE1-amplified tumors (9). Mutual exclusivity of oncogenic muta-tions in genes in the rat sarcoma viral oncogene homolog(RAS) signaling pathway, seen in low-grade serous ovariancancer (21) and other solid cancers (22), seems to occur, be-cause there is no selective advantage of compound mutations.By contrast, we found that BRCA1 suppression is not tolerated incell lines that harbor CCNE1 amplifications. The specific re-quirement of BRCA1 compared with BRCA2 may relate to itswider roles in DNA repair as well as cell cycle regulation andcheckpoint activation (11).CCNE1 overexpression promotes unscheduled S-phase entry,
disrupted DNA replication, and genomic instability (15), po-tentially rendering cells dependent on intact HR repair path-ways. We also observed dependencies on genes involved inprocessing of CCNE1 and other components of protein degra-dation pathways. Synthetic lethality is seen as an important ap-proach to the development of new cancer therapeutics, becauseit suggests treatments that are likely to offer a wide therapeuticindex (23). Indeed, our findings suggest that the proteasomeinhibitor bortezomib, either through attenuation of HR or otheressential proteasome functions in CCNE1-amplified cells, offersa unique therapeutic approach in HGSCs and possibly othersolid cancers. Additionally, the lack of cross-resistance to bor-tezomib in cells previously rendered partially resistant to CDK2
NS
BRC
A1BR
CA2
CD
K2 NS
BRC
A1BR
CA2
CD
K2
0
20
40
60
80
100
120
% c
olon
ies
to n
o si
RN
A SK-OV-3OVCAR-3
****
***
-20-18-16-14-12-10-8-6-4-20
-2.5
-2.0
-1.5
-1.0
-0.5
0.0
0.5
1.0
1.5
log2 p-value OVCAR-3
log 2
via
bilit
y (O
VCAR
-3 /
SK-O
V-3)
PLK1
ABCG8AKT2
ANKRD17
ATMATR
BPTFBRCA1
BRCA2
C9
CAPN2
CAPZB
CCND1
CCNE1
CCNK
CDC23
CDC25A
CDC42
CDC5L
CDK1
CDK2
CDK4
CHAF1A
CHEK1
CHEK2
CKAP5
COL14A1COL9A2
CORO1C
CPAMD8
CSE1L
CUL1
CUL3
DDB1
DDX17
EIF6
FBXW7
HERC5
HNRNPA3
LGALS2
LSM4LSM5
MRPL12 MYC
NRBP2
NUP153 OR2AK2
PAX8
PCSK6PREPL
PSMA5
RAD50RALGDS
RB1
RBBP8
RBX1
RNF8
RPA3 RRM1
SIN3A
SLC38A2
SMC2
SNRPF
SRSF2
TMEM48TNFRSF11ATOP2A
TPX2
TUBB
UBA1
UBB
UBC
VCP
YWHAH ZNF383
CDK5
CDK9
0.25
0.50
p < 0.05
A B
Fig. 3. (A) Cells were transfected with a boutique siRNA library against 142 candidate genes, and the effect on cell viability was measured 5 d aftertransfection. Significance (t test P value) of hits in the OVCAR-3 (CCNE1-amplified) cell line plotted against the viability ratio of OVCAR-3 to SK-OV-3 (un-amplified) highlights significant hits specific to OVCAR-3. Average data from duplicate wells across three independent experiments are shown (n = 3). Thevertical dotted line is at P value = 0.05. (B) Clonogenic survival after siRNA transfection in SK-OV-3 (unamplified) and OVCAR-3 (CCNE1-amplified) ovarian celllines. Average percentage of discrete colonies formed after 7 d relative to no siRNA controls is shown (n = 3 independent experiments performed in trip-licate). Statistical significance (t test) was calculated by comparison with nonsilencing (NS) siRNA in the same cell line. *P value < 0.05; ***P value < 0.001. Errorbars indicate SEM.
Borte
zom
ib IC
50 (n
M)
OA
W-4
2
Kur
amoc
hi
OV
CA
R-8
IGR
OV-
1
OV
CA
R-5
SK
-OV
-3
OV
CA
R-4
A27
80
OV
CA
R-3
FUO
V-1
OV
CA
R-3
-R1
OV
CA
R-3
-RD
1
0
10
20
30
40
50
60
ExpressionCopy Number
CCNE1 Copy Number CCNE1 ExpressionUnamplifed LowGained HighAmplified
Fig. 4. Ovarian tumor cell line sensitivity to bortezomib ranked by average72-h cytotoxicity assay IC50 value (n = 3 independent experiments performedin triplicate). Error bars indicate SEM. CCNE1 copy number status was de-termined by qPCR, where copy number gain and amplification are definedas a log2 ratio to normal > 0.5 and > 2.0, respectively. CCNE1 gene expressionof each cell line above (high) or below (low) the median value of 10 parentallines is indicated. The OVCAR-3-R1 and -RD1 sublines were derived fromOVCAR-3 and are resistant to CDK2 inhibitors PHA-533533 and dinaciclib,respectively (7).
4 of 6 | www.pnas.org/cgi/doi/10.1073/pnas.1314302110 Etemadmoghadam et al.143

inhibitors (OVCAR3-R1/RD1) suggests that sequential treat-ment may be effective.HGSC patients with high-level CCNE1 amplification represent
an urgent unmet need given their high risk of treatment failure andlow probability of response to PARP inhibitors because of absenceof BRCA1/2 pathway dysfunction. Bortezomib is currently used inmultiple myelomas and mantle cell lymphoma, but it has not shownsignificant activity in other solid cancers, including ovarian cancer(24). The low frequency of high-level amplification of CCNE1 inHGSCs may require specific patient selection to observe a thera-peutic benefit. Here, a mutational interaction observed in patientsamples is explained molecularly, and a unique treatment ap-proach is defined.
Materials and MethodsEthics Statement. The Australian Ovarian Cancer Study was approved by theHuman Research Ethics Committees at the Peter MacCallum Cancer Centre,Queensland Institute of Medical Research (QIMR), University of Melbourneand all participating hospitals. Written informed consent was obtained fromall participants in this study.
Pan-Cancer Analysis of CCNE1 Copy Number. Peak regions of copy numberchange at the CCNE1 locus identified by GISTIC (25) were obtained from theTCGA Copy Number Portal (http://www.broadinstitute.org/tcga) using all avail-able data as of February of 2013 (dataset: 2013-02-21 stddata__2013_02_03).Analysis included a total of 6,547 tumor samples comprising 22 cancer types:breast invasive adenocarcinoma (n = 891), glioblastoma multiforme (n =563), ovarian serous cystadenocarcinoma (n = 559), kidney renal clear cellcarcinoma (n = 493), uterine corpus endometrioid carcinoma (n = 492),thyroid carcinoma (n = 430), colon adenocarcinoma (n = 413), lung adeno-carcinoma (n = 403), lung squamous cell carcinoma (n = 358), head and necksquamous cell carcinoma (n = 322), stomach adenocarcinoma (n = 237),cutaneous melanoma (n = 236), brain lower-grade glioma (n = 220), prostateadenocarcinoma (n = 177), rectum adenocarcinoma (n = 162), bladder uro-thelial carcinoma (n = 150), kidney renal papillary cell carcinoma (n = 117),cervical squamous cell carcinoma (n = 114), liver hepatocellular carcinoma(n = 97), kidney chromophobe (n = 66), sarcoma (n = 29), and diffuse largeB-cell lymphoma (n = 18).
BRCA1/2 and CCNE1 Status in Primary Ovarian Tumor Samples and Cell Lines.Wehave previously published our analysis of germ-line BRCA1/2 status (13) andsomatic analysis (14) of tumor samples from women enrolled in the AustralianOvarian Cancer Study. TCGA estimated the frequency of CCNE1 gain to be∼8% and 26% in BRCA1/2-altered and WT cases, respectively (9). We calcu-lated that analyses of ∼80 BRCA1/2-altered and 80 WT cases would give 80%power (sensitivity) to detect a difference between the two groups, where α =0.05 (probability of a false-positive result). Our final cohort (n = 193) included81 BRCA1/2 WT and 112 BRCA1/2-altered cases (Fig. 1B). The BRCA1/2-alteredgroup included samples with germ-line BRCA1 mutations (n = 52), germ-lineBRCA2 mutations (n = 29), somatic BRCA1 mutations (n = 5), somatic BRCA2mutations (n = 4), and BRCA1 methylation (n = 22). CCNE1 copy number rel-ative to normal female reference DNA (Novagen) and gene expression in celllines was determined using qPCR and previously described methods (5).
TCGA SNP and Gene Expression Data. Affymetrix SNP 6.0 and hthgu133a geneexpression data were obtained for 157 serous tumors from TCGA (www.cancergenome.nih.gov). All SNP CEL files were normalized in a single batchusing the R package aroma.affymetrix and then segmented using the cir-cular binary segmentation algorithm to improve the signal-to-noise ratio(26). CCNE1 copy number was estimated using the mean segment value, andamplification was called for samples where the mean segment log2 copynumber ratio value was greater than 0.3. Recurrently amplified genesidentified in the TCGA dataset have been previously published (9). Geneexpression CEL files were normalized using the GCRMA package in R (27).Pearson correlation coefficient was computed between CCNE1 and all otherprobes in the genome. Genes that had an false discovery rate (FDR)-cor-rected P value <0.05 and a correlation coefficient >0.25 or <−0.25 wereconsider to be coexpressed or anticorrelated with CCNE1, respectively. Weidentified 501 genes that were coexpressed with CCNE1 (Table S2). Pathwayanalysis of genes coexpressed with CCNE1 using GeneGo (Thomson Reuters)revealed an enrichment of gene lists involved with cycle and DNA damageresponse pathways (Fig. S1).
shRNA Screen Data. Cell line copy number data were obtained from theCancer Cell Line Encyclopedia (20). CCNE1 copy number and gene expressionstatus was assigned to each cell line with midrange samples removed fromthe analysis. Cell lines with a log2 copy number ratio > 0.3 over the CCNE1locus were defined as amplified (n = 23), and cell lines with a log2 copynumber ratio < 0 over the CCNE1 locus were defined as unamplified (n = 43).Cell lines with CCNE1 gene expression greater than median + 1 SD (n = 15)were classified as CCNE1 high expression, whereas cell lines with CCNE1 geneexpression less than median (n = 41) were classified as CCNE1 low expression.
Microarray data from shRNA experiments was obtained from the In-tegrative Genomics Portal (http://www.broadinstitute.org/igp).
Data were analyzed using the GenePattern module ScorebyClassCompand GENE-E software (28). The weight of evidence statistic was used for classdiscrimination between CCNE1-amplified and unamplified cells and CCNE1high- and low-expressing cell lines (16). Gene lists were created by collapsingshRNA ranks from each comparison, and then, they were ranked by signif-icance to identify top hits as described previously (16). First, we selected thetop 300 genes based on the second-best ranking shRNAs, and second, weselected the top 300 genes assessed using the Kolmogorov–Smirnov (KS)statistic, which uses a composite score for all shRNAs against each gene (28).The union of both analyses identified 474 essential genes in CCNE1-ampli-fied cell lines and 486 essential genes in CCNE1 high-expressing cell lines (Fig.2A and Table S1). Because each gene was targeted by multiple independentshRNAs (median n = 5 per gene), statistical assessment of essentiality may beaffected by the number of shRNAs used per gene. For example, a highernumber of shRNAs against CDK2 compared with CCNE1 and BRCA1 (n = 12,n = 4, and n = 7, respectively) may, in part, explain the higher ranked sig-nificance of CDK2 in our analysis (Table S1).
The candidate gene list was further refined using additional criteria asevidence of significant biological relevance, including if they were (i) amongthe top 10 shRNA hits ranked by either the second-best or KS method, (ii)located in recurrent minimal regions of amplification reported by TCGA (9),(iii) coexpressed with CCNE1 (see above), or (iv) located in pathways signif-icantly represented among all hits (Gene Go analysis). In total, 115 genes metat least one of our additional selection criteria (Fig. 2B and Fig. S3) and wereselected for validation studies.
Cell Lines.Ovarian cell lines were obtained from the National Cancer InstituteRepository and fingerprinted using short tandem repeat markers (29) toconfirm identity against the Cancer Genome Project database (WellcomeTrust Sanger Institute). Cells were maintained at 37 °C and 5% (vol/vol) CO2
in RPMI 1640 containing 10% (vol/vol) FCS, with transfection and drugsensitivity assays performed in the absence of antibiotics. Cell lines wereconfirmed to be mycoplasma-negative before siRNA studies.
siRNA Studies. A boutique On-Target Plus siRNA library was obtained fromDharmacon (Thermo Fisher Scientific) in 384-well plates containing 142candidate genes, a nonsilencing control, and a positive (death) control (PLK1).The library was hydrated and diluted to 1 μM in siRNA buffer (Dharmacon;Thermo Fisher Scientific). Cells were reverse transfected with DharmaFECTlipid reagents (Thermo Fisher Scientific) to a final concentration of 40 nMsiRNA using SciClone ALH 3000 (Caliper Life Sciences) and BioTek 406(BioTek) liquid handling robotics. Cell transfection densities were selected toachieve confluence 5 d after transfection (120 h; 800 cells per well forOVCAR-3; 500 cells per well for SK-OV-3). Selected transfection conditionsallowed for efficient siRNA transfection with no impact on cell viability(OVCAR-3, 0.04 μL DharmaFECT1 per well; SK-OV-3, 0.06 μL DharmaFECT2per well). During optimization experiments, nuclear localization of siGLOred RNA duplex (Dharmacon) was used to monitor transfection efficiency byfluorescence microscopy 24–48 h after transfection.
Cells were transfected in duplicate wells in three independent experi-ments. Cell viability was then assessed using the Cell Titer Glo luminescentassay (Promega) on the Synergy H4 high-throughput multimode microplatereader (BioTek). Average cell viability data for each gene were normalized tothe average signal from control wells containing lipid only (n = 12 per plate).Significance of change in cell viability (log2-transformed signal) comparedwith control wells was calculated using a t test (n = 3). Clonogenic survivalassays and real-time qPCR were performed as described previously (5).
Sensitivity to Bortezomib. Bortezomib was obtained from Millennium Phar-maceuticals, and drug sensitivity was determined using the CellTiter 96Aqueous Non-Radioactive Cell Proliferation Assay (Promega) as describedpreviously (5). IC50 dose was approximated by fitting a four-parameter dose–response curve (Hill equation) using Prism 6 (GraphPad Software).
Etemadmoghadam et al. PNAS Early Edition | 5 of 6
GEN
ETICS
144

ACKNOWLEDGMENTS. The authors acknowledge assistance from DanielThomas and Yanny Handoko in conducting siRNA experiments in the VictorianCentre for FunctionalGenomics, PeterMacCallumCancer Centre. TheAustralianOvarian Cancer Study (AOCS) acknowledges the cooperation of the participat-ing institutions in Australia and the contribution of the study nurses, researchassistants, and all clinical and scientific collaborators.We thank all of thewomenwho participated in the study. This study was funded by National Health andMedical Research Council (NHMRC) Project Grant APP 1042358, CancerAustralia Grant APP 1004673, and US National Institutes of Health GrantU01 CA176058. The AOCS was supported by US Army Medical ResearchandMateriel CommandGrantDAMD17-01-1-0729, theCancer Council Tasmania,the Cancer Foundation of Western Australia, and NHMRC Grant ID400413.
Genotyping of AOCS patient samples was supported by Ovarian CancerResearch Program of the US Department of Defense Grants W81XWH-08-1-0684 andW81XWH-08-1-0685; Cancer Australia and National Breast CancerFoundation Grants ID509303, CG-08-07, and ID509366; the Peter MacCal-lum Cancer Centre Foundation; and the Cancer Council Victoria. TheVictorian Centre for Functional Genomics is funded by the AustralianCancer Research Foundation and the Victorian Department of Industry,Innovation and Regional Development. The Australian Phenomics Network issupported by funding from the Australian Government’s Education InvestmentFund through the Super Science Initiative, the Australasian Genomics Technol-ogies Association, the Brockhoff Foundation, and the Peter MacCallumCancer Centre Foundation.
1. Bowtell DDL (2010) The genesis and evolution of high-grade serous ovarian cancer.Nat Rev Cancer 10(11):803–808.
2. Etemadmoghadam D, et al. (2009) Integrated genome-wide DNA copy number andexpression analysis identifies distinct mechanisms of primary chemoresistance inovarian carcinomas. Clin Cancer Res 15(4):1417–1427.
3. Mayr D, et al. (2006) Analysis of gene amplification and prognostic markers in ovariancancer using comparative genomic hybridization for microarrays and immunohisto-chemical analysis for tissue microarrays. Am J Clin Pathol 126(1):101–109.
4. Caldon CE, Musgrove EA (2010) Distinct and redundant functions of cyclin E1 andcyclin E2 in development and cancer. Cell Div 5:2.
5. Etemadmoghadam D, et al. (2010) Amplicon-dependent CCNE1 expression is criticalfor clonogenic survival after cisplatin treatment and is correlated with 20q11 gain inovarian cancer. PLoS One 5(11):e15498.
6. Nakayama N, et al. (2010) Gene amplification CCNE1 is related to poor survival andpotential therapeutic target in ovarian cancer. Cancer 116(11):2621–2634.
7. Etemadmoghadam D, et al. (2013) Resistance to CDK2 inhibitors is associated withselection of polyploid cells in CCNE1 amplified ovarian cancer. Clin Cancer Res 19(21):5960–5971.
8. Natrajan R, et al. (2012) Functional characterization of the 19q12 amplicon in grade IIIbreast cancers. Breast Cancer Res 14(2):R53.
9. Cancer Genome Atlas Research Network (2011) Integrated genomic analyses ofovarian carcinoma. Nature 474(7353):609–615.
10. Ciriello G, Cerami E, Sander C, Schultz N (2012) Mutual exclusivity analysis identifiesoncogenic network modules. Genome Res 22(2):398–406.
11. Roy R, Chun J, Powell SN (2012) BRCA1 and BRCA2: Different roles in a commonpathway of genome protection. Nat Rev Cancer 12(1):68–78.
12. Theurillat J-P, et al. (2011) URI is an oncogene amplified in ovarian cancer cells and isrequired for their survival. Cancer Cell 19(3):317–332.
13. Alsop K, et al. (2012) BRCA mutation frequency and patterns of treatment response inBRCA mutation-positive women with ovarian cancer: A report from the AustralianOvarian Cancer Study Group. J Clin Oncol 30(21):2654–2663.
14. George J, et al. (2013) Nonequivalent gene expression and copy number alterations inhigh-grade serous ovarian cancers with BRCA1 and BRCA2 mutations. Clin Cancer Res19(13):3474–3484.
15. Akli S, Keyomarsi K (2003) Cyclin E and its low molecular weight forms in humancancer and as targets for cancer therapy. Cancer Biol Ther 2(4 Suppl 1):S38–S47.
16. Cheung HW, et al. (2011) Systematic investigation of genetic vulnerabilities acrosscancer cell lines reveals lineage-specific dependencies in ovarian cancer. Proc NatlAcad Sci USA 108(30):12372–12377.
17. Aguirre-Portolés C, et al. (2012) Tpx2 controls spindle integrity, genome stability, andtumor development. Cancer Res 72(6):1518–1528.
18. Davis SJ, et al. (2013) Functional analysis of genes in regions commonly amplified inhigh-grade serous and endometrioid ovarian cancer. Clin Cancer Res 19(6):1411–1421.
19. Jacquemont C, Simon JA, D’Andrea AD, Taniguchi T (2012) Non-specific chemicalinhibition of the Fanconi anemia pathway sensitizes cancer cells to cisplatin. MolCancer 11(1):26.
20. Barretina J, et al. (2012) The Cancer Cell Line Encyclopedia enables predictive mod-elling of anticancer drug sensitivity. Nature 483(7391):603–607.
21. Shih IeM, Kurman RJ (2004) Ovarian tumorigenesis: A proposed model based onmorphological and molecular genetic analysis. Am J Pathol 164(5):1511–1518.
22. Davies H, et al. (2002) Mutations of the BRAF gene in human cancer. Nature417(6892):949–954.
23. Luo J, et al. (2009) A genome-wide RNAi screen identifies multiple synthetic lethalinteractions with the Ras oncogene. Cell 137(5):835–848.
24. Aghajanian C, et al. (2009) A phase II evaluation of bortezomib in the treatment ofrecurrent platinum-sensitive ovarian or primary peritoneal cancer: A GynecologicOncology Group study. Gynecol Oncol 115(2):215–220.
25. Mermel CH, et al. (2011) GISTIC2.0 facilitates sensitive and confident localization ofthe targets of focal somatic copy-number alteration in human cancers. Genome Biol12(4):R41.
26. Olshen AB, Venkatraman ES, Lucito R, Wigler M (2004) Circular binary segmentationfor the analysis of array-based DNA copy number data. Biostatistics 5(4):557–572.
27. Gautier L, Cope L, Bolstad BM, Irizarry RA (2004) affy—analysis of Affymetrix Gen-eChip data at the probe level. Bioinformatics 20(3):307–315.
28. Luo B, et al. (2008) Highly parallel identification of essential genes in cancer cells. ProcNatl Acad Sci USA 105(51):20380–20385.
29. Masibay A, Mozer TJ, Sprecher C (2000) Promega Corporation reveals primer se-quences in its testing kits. J Forensic Sci 45(6):1360–1362.
6 of 6 | www.pnas.org/cgi/doi/10.1073/pnas.1314302110 Etemadmoghadam et al.145

Supporting InformationEtemadmoghadam et al. 10.1073/pnas.1314302110SI TextThe Australian Ovarian Cancer Study Group. Management group:D. Bowtell, G. Chenevix-Trench, A. Green, P. Webb, A. DeFazio,and D. Gertig.Project and data managers: N. Traficante, S. Fereday, K. Alsop,
S. Moore, J. Hung, K. Harrap, T. Sadkowsky, and N. Pandeya.Research nurses and assistants: ACT: M. Malt; NSW: A.
Mellon, R. Robertson, T. Vanden Bergh,M. Jones, P.Mackenzie,J. Maidens, K. Nattres, Y. E. Chiew, A. Stenlake, and H. Sullivan;QLD: B. Alexander, P. Ashover, S. Brown, T. Corrish, L. Green,L. Jackman, K. Ferguson, K. Martin, A. Martyn, and B. Ranieri;SA: J. White; TAS: V. Jayde; VIC: L. Bowes, P. Mamers,L. Galletta, D. Giles, J. Hendley, and K. Alsop; WA: T. Schmidt,H. Shirley, C. Ball, C. Young, S. Viduka, H. Tran, S. Bilic,L. Glavinas, and J. Brooks.Clinical and scientific collaborators: ACT: R. Stuart-Harris;
NSW: F. Kirsten, J. Rutovitz, P. Clingan, A. Glasgow, A. Proietto,S. Braye, G. Otton, J. Shannon, T. Bonaventura, J. Stewart,S. Begbie, M. Friedlander, D. Bell, S. Baron-Hay, A. Ferrier (de-ceased), G. Gard, D. Nevell, N. Pavlakis, S. Valmadre, B. Young,
C. Camaris, R. Crouch, L. Edwards, N. Hacker, D. Marsden,G. Robertson, P. Beale, J. Beith, J. Carter, C. Dalrymple,R. Houghton, P. Russell, L. Anderson, M. Links, J. Grygiel, J. Hill,A. Brand, K. Byth, R. Jaworski, P. Harnett, R. Sharma, andG.Wain; QLD:D. Purdie, D.Whiteman, B.Ward, D. Papadimos,A. Crandon, M. Cummings, K. Horwood, A. Obermair, L. Perrin,D. Wyld, and J. Nicklin; SA: M. Davy, M. K. Oehler, C. Hall,T. Dodd, T. Healy, K. Pittman, D. Henderson, J. Miller, J. Pierdes,and A. Achan; TAS: P. Blomfield, D. Challis, R. McIntosh, andA. Parker; VIC: B. Brown, R. Rome, D. Allen, P. Grant, S. Hyde,R. Laurie, M. Robbie, D. Healy, T. Jobling, T. Manolitsas,J. McNealage, P. Rogers, B. Susil, E. Sumithran, I. Simpson,I. Haviv, K. Phillips, D. Rischin, S. Fox, D. Johnson, S. Lade,P.Waring, M. Loughrey, N. O’Callaghan, B. Murray, L. Mileshkin,P. Allan, V. Billson, J. Pyman, D. Neesham, M. Quinn,A. Hamilton, O. McNally, C. Underhill, R. Bell, L. F. Ng,R. Blum, and V. Ganju; WA: I. Hammond, A. McCartney (de-ceased), C. Stewart, Y. Leung, M. Buck, and N. Zeps (WARTN).Scientific advisory board: P. Gurry, A. Hamilton, S. Hankinson,
and P. Meltzer.
Etemadmoghadam et al. www.pnas.org/cgi/content/short/1314302110 1 of 7146
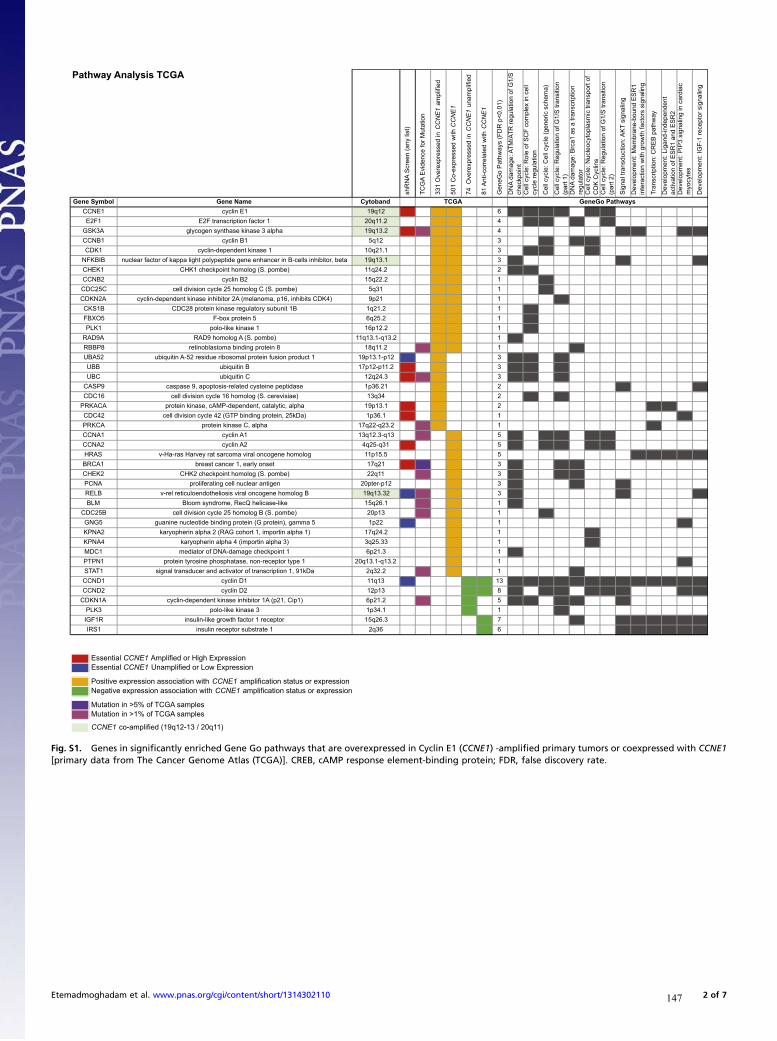
Essential CCNE1 Amplified or High ExpressionEssential CCNE1 Unamplified or Low Expression
Positive expression association with CCNE1 amplification status or expressionNegative expression association with CCNE1 amplification status or expression
Mutation in >5% of TCGA samplesMutation in >1% of TCGA samples
CCNE1 co-amplified (19q12-13 / 20q11)
Pathway Analysis TCGA
shR
NA
Scr
een
(any
list
)
TCG
A E
vide
nce
for M
utat
ion
331
Ove
rexp
ress
ed in
CC
NE
1 am
plifi
ed
501
Co-
expr
esse
d w
ith C
CN
E1
74 O
vere
xpre
ssed
in C
CN
E1
unam
plifi
ed
81 A
nti-c
orre
late
d w
ith C
CN
E1
Gen
eGo
Pat
hway
s (F
DR
p<0
.01)
DN
A da
mag
e: A
TM/A
TR re
gula
tion
of G
1/S
ch
eckp
oint
Cel
l cyc
le: R
ole
of S
CF
com
plex
in c
ell
cycl
e re
gula
tion
Cel
l cyc
le: C
ell c
ycle
(gen
eric
sch
ema)
Cel
l cyc
le: R
egul
atio
n of
G1/
S tr
ansi
tion
(par
t 1)
DN
A da
mag
e: B
rca1
as
a tra
nscr
iptio
n re
gula
tor
Cel
l cyc
le: N
ucle
ocyt
opla
smic
tran
spor
t of
CD
K C
yclin
sC
ell c
ycle
: Reg
ulat
ion
of G
1/S
tran
sitio
n (p
art 2
)
Sig
nal t
rans
duct
ion:
AK
T si
gnal
ing
Dev
elop
men
t: M
embr
ane-
boun
d E
SR
1 in
tera
ctio
n w
ith g
row
th fa
ctor
s si
gnal
ing
Tran
scrip
tion:
CR
EB
pat
hway
Dev
elop
men
t: Li
gand
-inde
pend
ent
activ
atio
n of
ES
R1
and
ES
R2
Dev
elop
men
t: P
IP3
sign
alin
g in
car
diac
m
yocy
tes
Dev
elop
men
t: IG
F-1
rece
ptor
sig
nalin
g
dnabotyCemaN eneGlobmyS eneG21q911E nilcyc1ENCC 1 1 1 6 01_
DN02_Cell
03_Cell
04_Cell
06_Cell
07_Cell
2.11q021 rotcaf noitpircsnart F2E1F2E 1 1 4 02_Cell
03_Cell
05_DN
07_Cell
2.31q91ahpla 3 esanik esahtnys negocylgA3KSG 1 1 1 1 4 08_Sig
09_De
12_De
13_De
21q51B nilcyc1BNCC 1 1 3 03_Cell
05_DN
06_Cell
1.12q011 esanik tnedneped-nilcyc1KDC 1 1 3 02_Cell
03_Cell
06_Cell
NFKBIB nuclear factor of kappa light polypeptide gene enhancer in B-cells inhibitor, beta 19q13.1 1 1 3 01_DN
08_Sig
13_De
2.42q11)ebmop .S( golomoh tniopkcehc 1KHC1KEHC 1 1 2 01_DN
02_Cell
2.22q512B nilcyc2BNCC 1 1 1 03_Cell
13q5)ebmop .S( C golomoh 52 elcyc noisivid llecC52CDC 1 1 1 03_Cell
CDKN2A cyclin-dependent kinase inhibitor 2A (melanoma, p16, inhibits CDK4) 9p21 1 1 1 04_Cell
2.12q1B1 tinubus yrotaluger esanik nietorp 82CDCB1SKC 1 1 1 02_Cell
2.52q65 nietorp xob-F5OXBF 1 1 1 02_Cell
2.21p611 esanik ekil-olop1KLP 1 1 1 02_Cell
2.31q-1.31q11)ebmop .S( A golomoh 9DARA9DAR 1 1 1 01_DN
2.11q818 nietorp gnidnib amotsalboniter8PBBR 1 1 1 1 05_DN
UBA52 ubiquitin A-52 residue ribosomal protein fusion product 1 19p13.1-p12 -1 1 3 01_DN
02_Cell
04_Cell
2.11p-21p71B nitiuqibuBBU 1 1 3 01_DN
02_Cell
04_Cell
3.42q21C nitiuqibuCBU 1 1 1 3 01_DN
02_Cell
04_Cell
CASP9 caspase 9, apoptosis-related cysteine peptidase 1p36.21 1 2 08_Sig
13_De
43q31)eaisiverec .S( golomoh 61 elcyc noisivid llec61CDC 1 2 02_Cell
04_Cell
PRKACA protein kinase, cAMP-dependent, catalytic, alpha 19p13.1 1 1 2 10_Tra
11_Dev
CDC42 cell division cycle 42 (GTP binding protein, 25kDa) 1p36.1 1 1 1 12_De
2.32q-22q71ahpla ,C esanik nietorpACKRP 1 1 1 10_Tra
31q-3.21q311A nilcyc1ANCC 1 1 5 01_DN
03_Cell
04_Cell
06_Cell
07_Cell
13q-52q42A nilcyc2ANCC 1 1 5 01_DN
03_Cell
04_Cell
06_Cell
07_Cell
HRAS v-Ha-ras Harvey rat sarcoma viral oncogene homolog 11p15.5 1 5 09_De
10_Tra
11_Dev
12_De
13_De
12q71tesno ylrae ,1 recnac tsaerb1ACRB 1 2 1 3 01_DN
04_Cell
05_DN
11q22)ebmop .S( golomoh tniopkcehc 2KHC2KEHC 1 1 3 01_DN
04_Cell
05_DN
21p-retp02negitna raelcun llec gnitarefilorpANCP 1 3 01_DN
05_DN
08_Sig
RELB v-rel reticuloendotheliosis viral oncogene homolog B 19q13.32 -1 1 1 3 01_DN
08_Sig
13_De
1.62q51ekil-esacileh QceR ,emordnys moolBMLB 1 1 1 01_DN
31p02)ebmop .S( B golomoh 52 elcyc noisivid llecB52CDC 1 1 1 03_Cell
GNG5 guanine nucleotide binding protein (G protein), gamma 5 1p22 -1 1 1 12_De
KPNA2 karyopherin alpha 2 (RAG cohort 1, importin alpha 1) 17q24.2 1 1 06_Cell
33.52q3)3 ahpla nitropmi( 4 ahpla nirehpoyrak4ANPK 1 1 06_Cell
3.12p61 tniopkcehc egamad-AND fo rotaidem1CDM 1 1 01_DN
PTPN1 protein tyrosine phosphatase, non-receptor type 1 20q13.1-q13.2 1 1 12_De
STAT1 signal transducer and activator of transcription 1, 91kDa 2q32.2 1 1 1 05_DN
31q111D nilcyc1DNCC -1 -1 -1 13 01_DN
02_Cell
03_Cell
04_Cell
05_DN
06_Cell
07_Cell
08_Sig
09_De
10_Tra
11_Dev
12_De
13_De
31p212D nilcyc2DNCC -1 -1 8 01_DN
03_Cell
04_Cell
06_Cell
07_Cell
08_Sig
12_De
13_De
CDKN1A cyclin-dependent kinase inhibitor 1A (p21, Cip1) 6p21.2 1 -1 5 01_DN
02_Cell
04_Cell
05_DN
08_Sig
1.43p13 esanik ekil-olop3KLP -1 1 04_Cell
3.62q51rotpecer 1 rotcaf htworg ekil-nilusniR1FGI -1 7 05_DN
08_Sig
09_De
10_Tra
11_Dev
12_De
13_De
63q21 etartsbus rotpecer nilusni1SRI -1 6 08_Sig
09_De
10_Tra
11_Dev
12_De
13_De
GeneGo PathwaysTCGA
Fig. S1. Genes in significantly enriched Gene Go pathways that are overexpressed in Cyclin E1 (CCNE1) -amplified primary tumors or coexpressed with CCNE1[primary data from The Cancer Genome Atlas (TCGA)]. CREB, cAMP response element-binding protein; FDR, false discovery rate.
Etemadmoghadam et al. www.pnas.org/cgi/content/short/1314302110 2 of 7147

Essential CCNE1 Amplified or High ExpressionEssential CCNE1 Unamplified or Low Expression
Positive expression association with CCNE1 amplification status or expressionNegative expression association with CCNE1 amplification status or expression
Mutation in >5% of TCGA samplesMutation in >1% of TCGA samples
CCNE1 co-amplified (19q12-13 / 20q11)
Pathway Analysis shRNA Screen
TCG
A E
vide
nce
for M
utat
ion
TCG
A C
CN
E1
Ass
ocia
ted
Exp
ress
ion
(any
lis
t)
474
Ess
entia
l CC
NE
1 A
mpl
ified
486
Ess
entia
l CC
NE
1 H
igh
Exp
ress
ion
481
Ess
entia
l CC
NE
1 U
nam
plifi
ed
483
Ess
entia
l CC
NE
1 Lo
w E
xpre
ssio
n
Gen
eGo
Pat
hway
s (F
DR
p<0
.01)
Cel
l cyc
le: R
ole
of S
CF
com
plex
in c
ell
cycl
e re
gula
tion
Cel
l cyc
le: R
egul
atio
n of
G1/
S tr
ansi
tion
(par
t 1)
DN
A da
mag
e: A
TM/A
TR re
gula
tion
of G
1/S
ch
eckp
oint
DN
A da
mag
e: In
hibi
tion
of te
lom
eras
e ac
tivity
and
cel
lula
r sen
esce
nce
Cel
l cyc
le: E
SR
1 re
gula
tion
of G
1/S
tra
nsiti
on
Cel
l cyc
le: c
ell c
ycle
(gen
eric
sch
ema)
Cel
l cyc
le: R
egul
atio
n of
G1/
S tr
ansi
tion
(par
t 2)
dnabotyCemaNeneGlobmySeneG31q212esaniktnedneped-nilcyc2KDC 1 1 1 7 Rol
e ofG1/S
ATM
Telom
ESR1
CellCyc
G1/S
21q911Enilcyc1ENCC 1 1 1 6 Role of
G1/S
ATM
ESR1
CellCyc
G1/S
32.11pX1emyznegnitavitcareifidomekil-nitiuqibu1ABU 1 1 1 Role of
41q214esaniktnedneped-nilcyc4KDC 1 7 Role of
G1/S
ATM
Telom
ESR1
CellCyc
G1/S
12p3)ebmop.S(Agolomoh52elcycnoisividllecA52CDC 1 5 Role of
G1/S
ATM
ESR1
CellCyc
2.21q61)031p(2ekil-amotsalboniter2LBR 1 1 5 Role of
Telom
ESR1
CellCyc
G1/S
3.42q21CnitiuqibuCBU 1 1 4 Role of
G1/S
ATM
ESR1
12q71tesnoylrae,1recnactsaerb1ACRB 2 1 1 3 G1/S
ATM
Telom
AKT3 v-akt murine thymoma viral oncogene homolog 3 (protein kinase B, gamma) 1q44 1 2 Telom
G1/S
3.42q611rotcafnoitacilperANDdnagnisnecilnitamorhc1TDC 1 1 Role of
PPP2R2C protein phosphatase 2, regulatory subunit B, gamma 4p16.1 1 1 1 G1/S
13q-52q42Anilcyc2ANCC 1 1 5 G1/S
ATM
ESR1
CellCyc
G1/S
2.11p-21p71BnitiuqibuBBU 1 4 Role of
G1/S
ATM
ESR1
2.31q22esagilnietorpnitiuqibu3E,1xob-gnir1XBR 1 3 Role of
G1/S
ESR1
AKT2 v-akt murine thymoma viral oncogene homolog 2 19q13.1-q13.2 1 2 Telom
G1/S
13q5)eaisiverec.S(golomoh32elcycnoisividllec32CDC 1 2 Role of
G1/S
MYC v-myc myelocytomatosis viral oncogene homolog (avian) 8q24.21 1 2 ATM
ESR1
42q-22q3detaler3daRdnaaisatceignaletaixataRTA 1 1 1 ATM
22q-12q76esaniktnedneped-nilcyc6KDC -1 -1 5 G1/S
Telom
ESR1
CellCyc
G1/S
13q401tinubusxelpmocgnitomorpesahpana01CPANA -1 -1 2 Role of
G1/S
UBA52 ubiquitin A-52 residue ribosomal protein fusion product 1 19p13.1-p12 1 -1 4 Role of
G1/S
ATM
ESR1
2.11q02)701p(1ekil-amotsalboniter1BRP/1LBR 1 -1 3 Telom
CellCyc
G1/S
3.31p91)alihposorD(1detaler02elcycnoisividllec/yzzif1RZF -1 2 Role of
G1/S
MNAT1 menage a trois homolog 1, cyclin H assembly factor (Xenopus laevis) 14q23 -1 1 G1/S
1.12q814rebmemylimafDAMS4DAMS -1 1 G1/S
31q111Dnilcyc1DNCC -1 -1 6 Role of
G1/S
ATM
ESR1
CellCyc
G1/S
PPP2CB protein phosphatase 2, catalytic subunit, beta isozyme 8p12 -1 2 G1/S
Telom
NFKBIA nuclear factor of kappa light polypeptide gene enhancer in B-cells inhibitor, alpha 14q13 -1 1 ATM
RELB v-rel reticuloendotheliosis viral oncogene homolog B 19q13.32 1 1 -1 1 ATM
TCGA shRNA Screen GeneGo Pathways
Fig. S2. Genes in significantly enriched Gene Go pathways essential to CCNE1-amplified or overexpressing cell lines. Inverse analyses of genes essential toCCNE1 unamplified or low-expressing cell lines also shown.
Etemadmoghadam et al. www.pnas.org/cgi/content/short/1314302110 3 of 7148

B A Ess
ential
CCN
E1
Am
plif
ied
2nd B
est
p-v
alue
KS p
-val
ue
Ess
ential
CCN
E1 H
igh E
xpre
ssio
n
2nd B
est
p-v
alue
KS p
-val
ue
Loca
ted in a
n A
mplic
on (
TCG
A)
Co-e
xpre
ssed
with C
CN
E1 (
TCG
A)
In S
ignific
ant
Gen
eGo P
athw
ay
Top R
anki
ng s
hRN
A H
it
Num
ber
Sel
ection C
rite
ria
Met
Cel
l Cyc
le G
ene*
DN
A D
amag
e Res
ponse
/Rep
air
Gen
e*
Ess
ential
CCN
E1
Am
plif
ied
2nd B
est
p-v
alue
KS p
-val
ue
Ess
ential
CCN
E1 H
igh E
xpre
ssio
n
2nd B
est
p-v
alue
KS p
-val
ue
Loca
ted in a
n A
mplic
on (
TCG
A)
Co-e
xpre
ssed
with C
CN
E1 (
TCG
A)
In S
ignific
ant
Gen
eGo P
athw
ay
Top R
anki
ng s
hRN
A H
it
Num
ber
Sel
ection C
rite
ria
Met
Cel
l Cyc
le G
ene*
DN
A D
amag
e Res
ponse
/Rep
air
Gen
e*
Essential CCNE1 Amplified Essential CCNE1 High Expression
ADAMTSL4 D 0.0254 0.2192 0.2614 0.9545 D 2 ABCG8 0.6293 0.0646 C 0.025 0.0034 C 2
AKAP6 AP 0.0198 p<0.001 0.0497 0.1589 AP 2 AKT2 0.2658 0.1313 T2 0.01 0.0012 T2 2
AKT3 T3 0.001 0.0056 0.2109 0.1671 T3 2 ATR 0.2465 0.0295 R 0.1289 0.0041 R 2 ll D
ANKRD17 N 0.0249 0.0167 0.1095 0.024 N 2 BPTF 0.0456 0.1109 TF p<0.001 0.0062 TF 2
APOBEC2 O 0.0355 0.0049 0.3573 0.3985 O 2 C9 0.2173 0.2309 C9 0.0205 0.1677 C9 2
BLMH M 0.6103 p<0.001 0.09 0.0966 M 2 CCNK 0.2416 0.0473 C 0.0094 p<0.001 C 2 ll
CALR3 AL 0.514 p<0.001 0.7186 0.9027 AL 2 CDC23 0.3141 0.1409 D 0.1026 0.0031 D 2 ll
CAPZB AP 0.5882 0.0081 0.1425 0.1967 AP 2 CDC5L 0.0705 0.0987 D 0.003 0.0137 D 2 ll
CDC25A D 0.0122 0.1423 0.0718 0.0706 D 2 ll CHRNA4 0.0718 0.6032 H 0.0019 0.1343 H 2 D
CDK4 D 0.1353 0.0188 0.2167 0.0715 D 2 ll COL9A2 0.4646 0.8269 OL 0.0275 0.0136 OL 2
CDT1 DT 0.4762 0.0059 0.3275 0.3759 DT 2 ll CXCL10 0.1744 0.3061 CL 0.0187 0.1123 CL 2
CHAF1A H 0.0708 0.0182 0.2181 0.2073 H 2 ll D DTNBP1 0.9635 0.8933 N 0.0677 0.0201 N 2
CKAP5 KA 0.0053 0.0733 0.2631 0.1401 KA 2 ll EFCAB2 0.0497 0.3068 CA 0.0225 0.6466 CA 2
COL14A1 OL 0.0175 0.0593 0.0895 0.301 OL 2 EIF6 0.1089 0.0296 F6 0.0073 0.013 F6 2
CORO1C O 0.0089 0.2089 0.0269 0.5914 O 2 FOXRED2 0.1448 0.1852 XR 0.0192 0.0017 XR 2
CPAMD8 A 0.0263 0.1662 0.5417 0.4067 A 2 GSK3A 0.0672 0.159 SK 0.0569 0.0163 SK 2
FN3K 3K 0.016 0.0026 0.0556 0.067 3K 2 H3F3C 0.0949 0.1704 3F 0.0132 0.1706 3F 2
GTSE1 TS 0.518 0.0061 0.3793 0.2771 TS 2 ILF3 0.2488 0.1941 F3 0.053 0.0116 F3 2
GUCA1B U 0.0181 0.121 0.1057 0.7273 U 2 INPP1 0.0518 0.0497 PP 0.0208 0.0346 PP 2
HERC5 ER 0.0134 0.0148 0.1313 0.0499 ER 2 KCNK5 0.0421 0.0829 C 0.0081 0.003 C 2
LNX1 X1 p<0.001 0.003 0.0459 0.039 X1 2 LGALS2 0.0779 0.5233 AL p<0.001 0.0211 AL 2
LSM4 M 0.0305 0.0087 0.0831 0.1392 M 2 LSM5 0.0317 0.0502 M 0.0332 0.0095 M 2
LYRM5 R 0.0094 0.0136 0.1367 0.3382 R 2 MLL3 0.278 0.4448 LL 0.1416 0.0169 LL 2
MARS AR 0.0211 0.1758 0.051 0.196 AR 2 MRPL12 0.3461 0.1342 RP 0.0134 0.0069 RP 2
MEP1B EP 0.0063 0.0572 0.0264 0.2182 EP 2 NUP153 0.3559 0.0907 UP 0.6727 0.0074 UP 2
NCAPD2 CA 0.0405 0.0147 0.1735 0.1051 CA 2 ll OR14A16 0.057 0.0209 R1 0.2167 0.0185 R1 2
NRBP2 RB 0.0457 0.0095 0.59 0.0707 RB 2 PA2G4 0.18 0.6014 2 0.0019 0.1431 2 2
OR2AK2 R2 0.0284 0.0029 0.1675 0.118 R2 2 PREPL 0.1032 0.256 EP 0.014 0.054 EP 2
PAX8 X8 0.0131 0.0018 0.2857 0.0505 X8 2 PRKACA 0.1027 0.0354 KA 0.0819 0.0185 KA 2
PCSK6 SK p<0.001 0.0249 0.1107 0.0353 SK 2 PTTG1 0.2914 0.0621 TG 0.2798 0.0133 TG 2 ll D
PITRM1 TR 0.0198 0.0848 0.4774 0.2539 TR 2 RBX1 0.0304 0.0218 BX 0.0028 0.0056 BX 2 D
PPP2R2C P2 0.0034 0.1967 0.3358 0.6358 P2 2 RFC4 0.0722 0.1628 C4 0.0191 0.0198 C4 2 D
PTPRB PR 0.0105 0.002 0.0966 0.0622 PR 2 RPA3 0.062 0.2542 A3 0.0277 p<0.001 A3 2 D
RALGDS AL p<0.001 0.0038 0.0976 0.1013 AL 2 SIN3A 0.2995 0.0787 N 0.011 p<0.001 N 2
RALGPS2 AL p<0.001 0.0037 0.0635 0.0223 AL 2 SLC38A1 0.0746 0.0975 C3 0.0051 0.0375 C3 2
RBL2 BL 0.0832 0.0048 0.671 0.5427 BL 2 ll SLC38A2 0.2088 0.0496 C3 0.0257 0.0017 C3 2
RHAG H 0.0054 0.2463 0.0374 0.2005 H 2 SLC6A19 0.2037 0.2718 C6 0.0019 0.1766 C6 2
RNF8 NF 0.0224 0.1128 0.1088 0.1331 NF 2 ll D SNX2 0.1939 0.2568 N p<0.001 0.003 N 2
SGCB G p<0.001 0.0034 0.5433 0.0713 G 2 SRSF2 0.9055 0.5984 RS p<0.001 p<0.001 RS 2
SLC4A5 C4 0.0062 p<0.001 0.1085 0.1527 C4 2 TOP2A 0.3417 0.3538 OP 0.0228 0.2685 OP 2 D
SNRPF N p<0.001 0.0137 0.0311 0.0334 N 2 TTC3 0.0584 0.3303 C3 p<0.001 0.1877 C3 2
TEAD1 A 0.0554 0.005 0.8053 0.569 A 2 UBB 0.2328 0.1984 B 0.0156 0.0261 B 2 D
TMEM48 M 0.0403 0.0109 0.0782 0.0305 M 2 YWHAH 0.4061 0.3459 W 0.0052 p<0.001 W 2
TNFRSF11A FR 0.001 p<0.001 0.2829 0.3301 FR 2 ZFR 0.3348 0.0794 R 0.052 0.0055 R 2
UBC B 0.0437 0.0204 0.414 0.4337 B 2 D
ZNF383 NF 0.016 p<0.001 0.1909 0.0345 NF 2
Fig. S3. Candidate genes essential in (A) CCNE1-amplified and (B) overexpressing cell lines annotated by inclusion criteria. Statistical significance of ranking bysecond-best scoring shRNA or a composite score of all shRNAs [Kolmogorov–Smirnov (KS) statistic] is given (Materials and Methods). *Go term processes: cellcycle, DNA repair, or response to DNA damage.
Etemadmoghadam et al. www.pnas.org/cgi/content/short/1314302110 4 of 7149

Ess
ential
CCN
E1
Am
plif
ied
2nd B
est
p-v
alue
KS p
-val
ue
Ess
ential
CCN
E1 H
igh E
xpre
ssio
n
2nd B
est
p-v
alue
KS p
-val
ue
Loca
ted in a
n A
mplic
on (
TCG
A)
Co-e
xpre
ssed
with C
CN
E1 (
TCG
A)
In S
ignific
ant
Gen
eGo P
athw
ay
Top R
anki
ng s
hRN
A H
it
Num
ber
Sel
ection C
rite
ria
Met
Ess
entia
l CC
NE
1 U
nam
plifi
ed
Ess
entia
l CC
NE
1 Lo
w E
xpre
ssio
n
Anti-c
orr
elat
ed E
xpre
ssio
n w
ith
CCN
E1
Cel
l Cyc
le G
ene*
DN
A D
amag
e Res
ponse
/Rep
air
Gen
e*
Additional Cell Cycle Genes
CCND1 0.9249 0.9597 0.9056 0.9728 0 C C ll D
CCNE2 0.0701 0.021 0.1356 0.301 0 ll
CDK1 0.5576 0.2403 0.8335 0.3561 0 ll
CDK3 0.4439 0.6075 0.2996 0.4403 0 ll
CDK5 D 0.7719 0.937 0.7959 0.6795 1 ll
CDK6 0.9315 0.9964 0.9362 0.9794 0 D D ll
CDK9 0.9849 0.905 D 0.8069 0.4726 1 ll
RB1 0.5662 0.5883 0.2403 0.2149 0 ll
Additional DNA Damage and Repair Genes
BRCA2 0.5839 0.6589 0.7116 0.4366 R 1 ll D
CHEK1 0.2856 0.2356 0.1932 0.049 H 1 ll D
CHEK2 0.6474 0.4237 0.876 0.7488 H 1 ll D
DDB1 D 0.0098 0.0027 0.1728 0.1939 1 D
RAD51 0.2789 0.1117 0.4584 0.2502 A 1 ll D
RBBP8 0.141 0.3774 0.3699 0.0643 BB 1 D
TP53BP1 0.4801 0.3749 53 0.035 0.0027 1 D
ATM 0.1251 0.0951 0.7525 0.2118 0 ll D
BRIP1 0.3652 0.3102 0.7908 0.9564 0 RI D
MRE11A 0.2111 0.6241 0.4898 0.6482 0 D
PARP1 0.3593 0.5567 0.8331 0.8647 0 RP D
RAD50 0.6544 0.6145 0.3686 0.3609 0 ll D
0ANANANANC15DAR D
0ANANANAND15DAR D
Cyclin E1 Processing Genes
CUL1 0.0853 0.041 0.1172 0.1087 UL 1
CAPN2 0.667 0.6625 0.7278 0.5343 0 AP
CUL3 0.3408 0.3832 0.1038 0.0226 0
ELANE 0.6242 0.7806 0.2956 0.3899 0
FBXW7 0.5144 0.2329 0.1443 0.1822 0
Fig. S4. Additional candidate genes selected based on biological relevance annotated by inclusion criteria used for ranking shRNA hits. Statistical significance ofranking by second-best scoring shRNA or a composite score of all shRNAs (KS statistic) is given. *Go term processes: cell cycle, DNA repair, or response to DNA damage.
Etemadmoghadam et al. www.pnas.org/cgi/content/short/1314302110 5 of 7150

-24-22-20-18-16-14-12-10-8-6-4-20
-6
-5
-4
-3
-2
-1
0
1
log2 p-value OVCAR-3
log 2
via
bilit
y O
VCAR
-3
NS
PLK1
ABCG8ACAT2ADAMTSL4
AKAP6AKT2AKT3ANKRD17
APOBEC2ATMATR
BLMH
BPTFBRCA1
BRCA2BRIP1
C9CALR3
CAPN2
CAPZB
CCNA2
CCND1CCNE1
CCNE2
CCNK
CDC23CDC25A
CDC42
CDC5L
CDK1CDK2
CDK3CDK4
CDK6CDT1
CHAF1A
CHD2
CHEK1
CHEK2CHRNA4
CKAP5
COL14A1COL9A2CORO1C
CPAMD8
CSE1L
CUL1
CUL3
CXCL10
DDB1DDX17DTNBP1DUSP16EFCAB2EIF6 ELANE
ENPP2 FBXW7
FN3KFOXRED2GSK3A
GTSE1GUCA1BH3F3C
HERC5HNRNPA3
IARS2ILF3INPP1 KCNK5 LGALS2LNX1
LSM4
LSM5
LYRM5MARSMEP1B
MLL3MRE11AMRPL12MYC
NCAPD2
NRBP2
NUP153OR14A16 OR2AK2PA2G4 PARP1
PAX8
PCSK6PITRM1PPP2R2C
PREPLPRKACA
PSMA5
PTPRBPTTG1
RAD50
RAD51RAD51C
RAD51D RALGDSRALGPS2RB1
RBBP8RBL2
RBX1
RFC4RHAGRNF8
RPA3
RRM1
SGCB
SIN3A
SLC35A3SLC38A1
SLC38A2SLC4A5
SLC6A19
SMC2
SNRPF
SNX2SPATA6
SRBD1
SRSF2
TEAD1TMEM48TNFRSF11A
TOP2A
TP53BP1
TPX2
TTC3
TUBB
UBA1
UBB
UBC
VCP
XRCC2YWHAH
ZFR
ZNF383
CDK5CDK9
12.5%
6.25%
3.13%
25%
50%
1.56%
p < 0.05
A
B
-24-22-20-18-16-14-12-10-8-6-4-20
-6
-5
-4
-3
-2
-1
0
1
log2 p-value SK-OV-3
log 2
via
bilit
y SK
-OV-
3
NS
PLK1
ABCG8ACAT2ADAMTSL4AKAP6 AKT2
AKT3ANKRD17APOBEC2ATMATRBLMH
BPTFBRCA1 BRCA2BRIP1
C9CALR3CAPN2
CAPZB
CCNA2
CCND1CCNE1CCNE2CCNK
CDC23
CDC25ACDC42
CDC5L
CDK1
CDK2CDK3
CDK4CDK6 CDT1
CHAF1A
CHD2CHEK1
CHEK2CHRNA4
CKAP5
COL14A1 COL9A2CORO1C
CPAMD8
CSE1L
CUL1
CUL3CXCL10
DDB1
DDX17DTNBP1
DUSP16EFCAB2
EIF6
ELANEENPP2
FBXW7FN3KFOXRED2 GSK3AGTSE1GUCA1B
H3F3C HERC5HNRNPA3IARS2 ILF3INPP1
KCNK5 LGALS2LNX1
LSM4
LSM5
LYRM5MARS
MEP1BMLL3MRE11AMRPL12
MYC
NCAPD2NRBP2NUP153
OR14A16 OR2AK2 PA2G4PARP1PAX8PCSK6
PITRM1PPP2R2CPREPLPRKACAPSMA5PTPRB
PTTG1RAD50
RAD51RAD51C
RAD51DRALGDSRALGPS2
RB1RBBP8 RBL2
RBX1
RFC4RHAG
RNF8
RPA3
RRM1
SGCBSIN3A
SLC35A3SLC38A1
SLC38A2SLC4A5
SLC6A19
SMC2
SNRPF
SNX2SPATA6 SRBD1
SRSF2
TEAD1TMEM48
TNFRSF11ATOP2A
TP53BP1
TPX2
TTC3TUBB
UBA1 UBB
UBC
VCP
XRCC2 YWHAHZFRZNF383
CDK5
CDK9
12.5%
6.25%
3.13%
1.56%
25%
50%
p < 0.05
Fig. S5. Volcano plots of log2 P value significance (t test) against the log2 viability for (A) OVCAR-3 and (B) SK-OV-3 cell lines. Cells were transfected witha boutique siRNA library against 142 candidate genes, and the effect on cell viability was measured 5 d after transfection. Data from duplicate wells acrossthree independent experiments are shown (n = 3). The vertical dotted line is at P value = 0.05.
SK-OV-3
NS
BRC
A1
BRC
A2
CD
K2
-4
-3
-2
-1
0
1 BRCA1BRCA2CDK2*
log 2
mR
NA
ratio
to c
ontro
l
OVCAR-3
NS
BRC
A1
BRC
A2
CD
K
-5
-4
-3
-2
-1
0
1 BRCA1BRCA2CDK2*
log 2
mR
NA
ratio
to c
ontro
l
B A
Fig. S6. Gene expression by RT-PCR after gene knockdown or with a nonsilencing (NS) siRNA normalized to (A) SK-OV-3 or (B) OVCAR-3 cells treated with lipidonly (no siRNA) within each cell line. Representative data are shown. *Detects both isoforms of CDK2.
Etemadmoghadam et al. www.pnas.org/cgi/content/short/1314302110 6 of 7151

Table S1. Genes essential for CCNE1-amplified or overexpressing cell lines derived from shRNA synthetic lethal screen
Table S1
Table S2. Genes coexpressed with CCNE1 in primary tumors (TCGA)
Table S2
Table S3. Normalized cell viability data from boutique siRNA screen
Table S3
Etemadmoghadam et al. www.pnas.org/cgi/content/short/1314302110 7 of 7152

5. Future directions 5.1 Summary of key findings HGSC patients with CCNE1 amplification have a clear, unmet need in terms of effective therapies. In
this thesis, I validate CDK2 as a selective target in CCNE1 amplified HGSC using siRNA and
shRNA-mediated gene suppression, both in vitro and in vivo. However, I did not observe similar
amplicon dependent sensitivity to single agent dinaciclib, a small molecule inhibitor of multiple
CDKs. I performed a high throughput compound screen to identify combinations that would be
synergistic in CCNE1 amplified HGSC cell lines. I identified a combination of dinaciclib and MK-
2206, an AKT inhibitor, to be selectively synergistic in in vitro and in vivo models of CCNE1
amplified HGSC. CCNE1 and AKT2 were noted to be co-amplified in primary HGSC samples, and a
number of genes in the AKT pathway were found to be required in CCNE1 amplified HGSC cell
lines. Cyclin E1 and AKT over-expression resulted in uncontrolled growth characteristics in TP53-
mutant FTSEC, the proposed cell of origin for HGSC. Taken together, these findings suggest that the
co-operative interaction between CCNE1 and the AKT pathway in HGSC may be exploited
therapeutically.
I also explored potential mechanisms of resistance to CDK inhibitors by generating cell lines resistant
to dinaciclib. A combination of dinaciclib and BH3-mimetics was noted to be synergistic in CDK
inhibitor-resistant cell lines, and up-regulation of multiple anti-apoptotic genes was observed in
resistant cell lines compared to parental sensitive cell lines. Dinaciclib in combination with MK-2206
was also synergistic in CDK inhibitor–resistant cell lines. This supported previous work that I
contributed to that identified increased AKT1 copy number and up-regulation of genes in the AKT
pathway as another mechanism of resistance to CDK inhibitors (445).
Proteasome inhibitors offer another strategy to target CCNE1 amplified HGSC, possibly through
indirect inhibition of HR (425). I showed that CCNE1 amplified HGSC cell lines were highly sensitive
to two proteasome inhibitors – bortezomib and MLN9708. Consistent with published reports about
the pharmacokinetics of MLN9708 (459), I observed improved in vivo activity with MLN9708
compared with bortezomib. A high throughput screen identified synergistic combinations with
bortezomib, particularly a number of HDAC inhibitors, suggesting a possible class effect.
Planned and potential future experiments building on work in this thesis are described below in the
context of the current literature.
153

5.2 Unravelling the differences between CDK2 gene suppression and CDK drug
inhibition The selective sensitivity of CCNE1 amplified HGSC to CDK2 knockdown mediated by siRNA and
shRNA, in vitro and in vivo, is an important finding of this thesis, and is consistent with data from two
different genome wide shRNA screens that have been performed, both of which identified CDK2 as a
highly selective target for CCNE1 amplified cells (Rottapel, unpublished data) (473, 504). Studies in
non-amplified cells have shown that depletion of CDK2 alone results in little change in cell cycle
profiles due to compensation by other CDK family members including CDK1 or CDK4 (505, 506).
Taken together, these findings suggest that CDK2 is a key selective target in CCNE1 amplified HGSC
and that effective targeting of it may provide a substantial therapeutic index in relation to tumour kill
and the impact on normal tissue. However, use of small molecule CDK inhibitors such as dinaciclib
did not phenocopy this effect. Differences between RNA interference and pharmacological
intervention have been observed previously (507). Possible explanations are outlined below.
5.2.1 Kinase independent functions of cyclin E1-CDK2 complex Cyclin E1 acts as a cell cycle regulator, binding to its primary CDK partner, CDK2, to activate
multiple proteins involved in cell cycle progression, histone biosynthesis, centrosome duplication and
DNA replication (390, 391). In order to isolate the specific role of cyclin E1, cyclin E1-null mouse
knockout models have been engineered (508, 509). Cyclin E1 null mice were noted to be
embryonically lethal, dying during mid-gestation due to placental abnormalities. By contrast, Cdk2
knockout mice were found to be viable, developing normally except for defective meiosis. This
implies that cyclin E1 has Cdk2 independent essential functions (395). Furthermore, truncated variants
of cyclin E1 that cannot bind to Cdk2 are able to induce transformation, and oncogenesis has been
associated with increased cyclin E1 activity in the absence of increased Cdk2 activity (398, 510-512).
Several kinase-independent functions of cyclin E1 have been identified. For example, Cyclin E1
interacts with DNA replicative helicase components, MCM2-MCM7, and facilitates the loading of
MCM proteins onto pre-initiation replication complexes that are essential for DNA synthesis when
cells enter the cell cycle after quiescence (391). This involvement in the formation of pre-initiation
complexes may also be crucial for endoreplication, where DNA is replicated without cell division.
This may explain the role of cyclin E1 in placental function where endoreplication is required in the
polyploidy giant trophoblastic cells (395).
There may also be kinase-independent functions of cell cycle CDKs (513). For example, Kollman et al
demonstrated that there are kinase independent functions of CDK6 (514). Over-expression of CDK6 in
B-cell leukaemic cells resulted in upregulation of VEGF-A, a key factor in angiogenesis (514). These
154

experiments demonstrated a link between cell cycle dysregulation and angiogenesis, two key
hallmarks of cancer (184). A recent study investigated kinase-independent roles of Cdk2 in mouse
models by inducing point mutations that ablated Cdk2 kinase activity without altering protein
expression levels (515). This approach allowed normal expression of Cdk2 protein and the formation
of complexes with cyclins, avoiding an excess of free cyclin proteins and preventing compensatory
activation of other Cdks that was previously observed in Cdk2 knockout models (393, 516).
Expression of the kinase-dead mutant Cdk2 was shown to mimic Cdk2 knockout models, with normal
cell cycle progression and proliferation but defective meiosis and infertility. These results led the
authors to conclude that Cdk2 has few or no kinase-independent functions (515). Whether similar
results would be observed in CCNE1 amplified cells, where clear amplicon dependent sensitivity to
CDK2 gene suppression is apparent, is unknown.
Understanding the dichotomy between CDK2 knockout and CDK2 inhibition in CCNE1 amplified
cells is central to ongoing attempts to therapeutically target CCNE1 amplified tumours. If there are
kinase independent functions of the cyclin E1-CDK2 complex that promote survival and growth in
CCNE1 amplified HGSC, small molecules targeting kinase function are unlikely to be successful.
Such a finding would de-prioritise current efforts in academic settings, biotechnology and
pharmaceutical companies to develop inhibitors with higher selectivity for CDK2 (see below).
Therefore, similar to the recent study by Chauhan and colleagues, future studies should investigate the
effect inducing mutations in the CDK2 kinase domain in the context of CCNE1 amplified HGSC
cells.
5.2.2 Challenges of designing specific CDK2 inhibitors Currently available CDK2 inhibitors typically target multiple CDKs (Section 1.5.4). This has
significant implications in the clinical setting, in that the effects of potent inhibition of CDK1, CDK2
or CDK9 in normal tissues result in significant toxicity (437). The significant side effects observed
limits dosing and therefore may prevent cytotoxic levels of drug being achieved tumours with CCNE1
amplification. This situation contrasts with recent development of CDK4/6 inhibitors, such as
palbociclib, which have been very effective in hormone receptor positive breast cancer (440-442).
Designing selective CDK2 inhibitors remains a challenge given the sequence homology between
CDKs. Our collaborators David Newell and colleagues at the Northern Institute for Cancer Research
(Newcastle, UK) continue to alter the structure of compounds in order to improve the selectivity of
novel compounds (517, 518). A selective CDK2 inhibitor may phenocopy CDK2 gene suppression in
CCNE1 amplified HGSC, although this assumes that there is no difference between CDK2 knockout
and CDK2 kinase inhibition (as discussed above).
155

One potential strategy to overcome the lack of selective CDK2 inhibitors is to target protein-protein
interactions (519). Peptide or small molecule inhibitors have been designed to specifically target the
interaction between CDKs and cyclins, acting as competitive inhibitor of substrate binding and CDK
activity (520-522). If there are critical kinase-independent functions of the cyclin E1-CDK2 complex
in CCNE1 amplified HGSC, disruptors of the complex may be more successful in phenocopying
CDK2 knockout. While some small molecules that target protein-protein interactions have reached the
clinic, such as the nutlins targeting the p53-MDM2 interaction (523), none of those designed to target
cyclin-CDK complex have yet progressed into the clinical setting. However, efforts to develop this
class of small molecule inhibitor are ongoing (524).
5.2.3 Potential for developing RNA interfering therapy Therapeutic RNA interference (RNAi) may also be a strategy to directly target CDK2. RNAi therapy
has been an attractive means of targeting oncogenes that have proved difficult to inhibit
pharmacologically, such as KRAS (525). The major barriers to successful application of RNAi include
difficulties with administration and delivery to target tissues, appropriate cellular uptake, and avoiding
excretion, degradation, immune recognition and extravasation (526). More recently, modifications to
synthetic siRNA have successfully addressed these barriers to allow delivery of RNAi. A phase I trial
of inclisiran, a synthetic siRNA directed against proprotein convertase subtilisin-kexin type 9
(PCSK9), was recently published (527), and demonstrated impressive tolerability and response. Given
the current challenges in targeting CDK2 with small molecule inhibitors, the use of nucleic acid based
therapy should be seriously considered in patients with CCNE1 amplified HGSC. The possibility of
delivering RNAi therapy directly into the peritoneal space, where disease is confined to the abdomen,
may provide a therapeutic advantage in this subset of patients.
5.3 HR and CCNE1 amplification Multiple lines of evidence now support targeting HR as a potential strategy in CCNE1-amplified
HGSC. Synthetic lethality was observed with BRCA1 loss in CCNE1 amplified cell lines (473). In
addition, mutual exclusivity was observed between high level CCNE1 amplification and defects in the
HR pathway in primary HGSC samples (230, 422). Consistent with these observations, an inverse
correlation between presence of a BRCA mutational signature and CCNE1 amplification has been
identified (231). Furthermore, in collaborative studies with our lab, Karst and colleagues found that
TP53-mutant FTSEC overexpressing cyclin E1 upregulated DNA repair proteins and showed
evidence of DNA damage with an increase in γ-H2AX nuclei foci (412). I observed selective
sensitivity of CCNE1 amplified HGSC to proteasome inhibitors, a proposed indirect inhibitor of HR
(Chapter 4). However, important questions regarding the interaction between CCNE1 amplification
and HR remain. These are discussed in detail below.
156

5.3.1 Mechanism of action of proteasome inhibitors in CCNE1 amplified HGSC DNA damage response and repair is a tightly regulated process that is subject to post-translational
modifications including phosphorylation, methylation, acetylation and ubiquitylation (528, 529). HR
has been shown to be particularly sensitive to proteasome inhibition (472). Drugs such as bortezomib
have been shown to block global ubiquitylation in cells and disrupt protein turnover of several DNA
damage response proteins such as MDC1, BRCA1 and RPA (530-532). Furthermore, a cell-based drug
screen of over 16,000 compounds identified bortezomib as a potent inhibitor of the Fanconi Anaemia
(FA) pathway (425). It is proposed that disruption of protein degradation by proteasome inhibition
may interfere with essential activity of proteins in the FA pathway or DNA damage response. Further
investigation of the downstream effects on components of the HR pathway in CCNE1-amplified
HGSC will assist in delineating the mechanism of action in this context.
Bortezomib is currently approved for treatment of multiple myeloma and mantle cell lymphoma (457,
533). In pre-clinical models of solid tumours, bortezomib has demonstrated anti-tumour effects (534-
536), however across a wide spectrum of advanced solid tumours, bortezomib has failed to
demonstrate significant clinical activity (537-541). In EOC, bortezomib either as a single agent or in
combination with chemotherapy did not result in any significant clinical efficacy (542-544). It has
been proposed that a lack of drug penetration into the tumour may explain the difference in activity
between haematological and solid tumours (459, 545). Newer generation proteasome inhibitors such as
MLN9708 have attempted to improve the pharmacokinetic and pharmacodynamics properties of
proteasome inhibitors in order to enhance anti-tumour effects in vivo (459, 546). In addition, none of
the previous trials of proteasome inhibitors in solid tumours were biomarker driven. Therefore
appropriate patient selection as well as improved drug design may result in higher clinical activity in
solid tumours.
5.3.2 Direct targeting of HR Although indirect targeting of HR through proteasome inhibitors may prove successful, attempts to
develop specific agents that directly target HR are underway. For example, our collaborator Professor
Ashok Venkitaraman and colleagues have developed a specific inhibitor against the protein-protein
interactions of RAD51 that are expected to disrupt interaction with BRCA2 (547, 548). Exploration of
this class of drug in CCNE1 amplified HGSC should be considered, bearing in mind that there may be
differences seen when targeting BRCA1 and BRCA2 in CCNE1 amplified HGSC (473). Whereas a
clear reduction in clonogenic survival was seen following BRCA1 knockdown mediated by siRNA in
CCNE1 amplified HGSC cell lines, the effect following BRCA2 knockdown was not as profound.
Additional functions for BRCA1/2 are emerging, including chromatin remodelling, gene expression
157

and regulation of mRNA polyadenylation (549). Furthermore, there are distinct differences in function
of BRCA1 and BRCA2, with BRCA1 implicated in wider roles including cell cycle regulation and
checkpoint activation (550). Through our collaboration with Professor Venkitaraman, we are now
investigating the direct HR-related functions of BRCA2, in order to isolate the differing functions of
these complex proteins.
5.4 Understanding the biology of CCNE1 amplified HGSC
5.4.1 Role of cyclin E1 in malignant transformation of FTSEC Although genomic and functional studies have improved the understanding of CCNE1 amplification
across multiple cancers, unanswered questions remain. Determining the role of cyclin E1 over-
expression in the absence of gene amplification, and whether these tumours behave similarly in
response to agents such as CDK2 inhibitors. Furthermore, it is unclear which genes and pathways
interact with CCNE1 and mutant TP53 to induce malignant transformation of FTSEC. Our
collaborators, Ronny Drapkin and colleagues at The University of Pennsylvannia (U.S.), have
previously performed a gain of function screen of 800 genes within recurrently amplified amplicons
in HGSC to identify genes that cooperate with CCNE1 amplification and mutant TP53 in FTSEC
(unpublished data). Ninety-three genes were selected as hits based on improved anchorage
independent growth and colony formation in soft agar assays, including AKT1 and AKT3, which
aligned with my own data (Chapter 3). However, the gain of function screen performed will not have
identified tumour suppressor genes that may cooperate with CCNE1 and mutant TP53. The rapid
development and utilisation of gene suppression or manipulation techniques such as CRISPR-Cas9
(clustered regularly interspaced short palindromic repeats) have enabled interrogation of the whole
genome (551, 552). These studies have the potential to improve our understanding of CCNE1
amplified HGSC, as well as uncovering other vulnerabilities in CCNE1 amplified cells that may be
therapeutic targets.
5.4.2 Generating clinically relevant models of CCNE1 amplified HGSC Murine models of cancer have been extensively used for cancer research – both in terms of
understanding basic biology as well as in drug development. Xenografts are commonly used because
of the ease of access and relative low cost involved. However, there are significant limitations, and in
particular, many agents that show consistent and potent activity in xenograft models fail to show any
activity in humans (553). One major criticism of xenograft models is that they typically lack an
immune system, which precludes the testing of immunomodulatory agents that are becoming
increasingly important in the clinic. In addition, xenografts fail to recapitulate the complex tumour
microenvironment. The development of genetically modified mouse (GEM) models that are more
faithful to human disease is important as a complement to xenograft models (553).
158

The recent development of a model system that reproduces the step-wise transformation from STIC to
HGSC has demonstrated the feasibility of producing models of HGSC in mice that resemble human
disease, morphologically and molecularly (79-85). The Perets model involves specific targeting of
Tp53, Pten, and Brca1 or Brca2 mutations to FTSEC, in part by driving expression of the Cre
recombinase from a Pax8 promoter (84). Pax8 is highly expressed in secretory epithelial cells of the
fallopian tube and a lineage marker for EOC. All mice in this model develop STIC by a specific time
point, followed by disseminated murine HGSC, predominantly affecting the ovaries and peritoneum,
similar to HGSC in humans. In collaboration with the Drapkin lab, a recently awarded Department of
Defense grant will enable adaption of this model by incorporating cyclin E1 over-expression. If
successful, a Ccne1 GEM model would represent an opportunity to further investigate the steps
required in transformation from STIC to HGSC, as well as future novel drug therapies including
immunotherapies.
In terms of xenografts, there are few CCNE1 amplified HGSC xenograft models available. As
described in Chapter 4, oestrogen pellets, repeated passaging and use of immuno-compromised mice
were required in order to generate a xenograft from one CCNE1 amplified cell line. All other
commercially available cell lines that have CCNE1 amplification fail to grow as a xenograft (Chapter
4). Therefore, through collaborations with local and international laboratories, our lab continues to
generate and identify new well characterised HGSC cell lines with CCNE1 amplification. In
particular, through our laboratory’s involvement with AOCS, we have access to recurrent ascites and
patient samples that we routinely put into culture and immunocompromised mice to establish patient
derived ascites cell lines or patient derived xenografts. At the time of writing, there are now 42
individual cell lines established from 29 different patients. I am actively continuing to analyse the
CCNE1 status of all established HGSC cell lines and PDXs, as well as attempting to generate
xenografts from ascites and cell lines with CCNE1 amplification. The aim is to develop a panel of
well characterised HGSC cell lines and PDXs with CCNE1 amplification for ongoing research. This is
of particular importance given that many commercially available cell lines that are frequently used in
research (such as the SKOV3 cell line used in the HTS in Chapter 3) have been shown to harbour
characteristics that are not consistent with HGSC (461).
5.5 CCNE1 amplification as a therapeutic target – is this precision medicine? The concept of precision or personalised medicine, where molecular analysis of an individual
patient’s tumour will allow selection of effective drugs to control or eradicate that tumour to improve
symptoms and survival, has become the focus of oncology treatment and research internationally (554-
556). Several exemplary forms of precision medicine, particularly in melanoma and non-small cell
lung cancer, have encouraged clinicians and researchers to expand the focus of precision medicine to
159
all forms of cancer (227, 228). Coupled with the rapid advances in molecular technologies, their
decreasing cost and increasing capability to deliver “real-time” comprehensive genomic profiles,
many clinical trials are now designed to demonstrate the superiority of precision medicine over the
previous standard of care (557). However, the capacity to deliver precision medicine to all cancer
patients remains a significant challenge, with multiple factors such as tumour biology, medicinal
chemistry and drug toxicities all aspects that need to be considered (558).
In HGSC, only two classes of “targeted therapies” have entered routine clinical care – anti-angiogenic
agents such as bevacizumab, and PARP inhibitors such as olaparib (as discussed in Section 1.5). It
could be argued that anti-angiogenic agents are not a typical example of precision medicine, given
that there are no validated predictive biomarkers to select patients for benefit from such agents. In
addition, although patients with germline or somatic BRCA1/2 mutations are most likely to respond to
PARP inhibitors, a recent study has demonstrated that a subset of patients whose tumours were
assessed as HR proficient still derived benefit from niraparib (329). Could this reflect a different
mechanism of action of PARP inhibitors in HR proficient tumours – and therefore an issue of
chemistry? Or was this due to inadequacies in the assay used to determine HR status – a question of
biology? It has been more than 7 years since the first phase I trial of olaparib was published (306), and
frustratingly the ideal role of PARP inhibitors in HGSC remains unclear (559).
Issues of tumour heterogeneity and emergence of drug resistance are also significant limitations to the
application of precision medicine. Rational drug combinations, such as those identified in this thesis,
are a potential way to overcome heterogeneity and resistance, however this is often limited by
overlapping toxicities in the clinical setting. Only 50% of combinations studied in clinical trials could
be used at the full doses recommended, and many combinations required significant dose reductions,
bringing into question the on-target effects (560, 561). A meta-analysis of patients treated on phase I
trials demonstrated a correlation between survival, response and increasing dose (562). It is also
sobering to consider that the likelihood of approval of an investigational anti-cancer agent tested in
phase I trials is less than 10% (563). This has implications for all phases of drug development such as
pre-clinical studies, medicinal chemistry, and trial design (564). Furthermore, it significantly
influences the financial considerations involved in delivering precision medicine, an increasingly
recognised issue of cancer care globally (565, 566).
Although there are significant challenges to precision medicine, the advances in genomic technology
and understanding also present opportunities. In particular, each patient recruited to a biomarker
driven trial testing a novel targeted therapy represents a chance to learn about that particular clinical
setting. This can include patient reported outcomes, an increasingly recognised trial endpoint (177).
Additionally, mandated tumour biopsies or assessment of circulating tumour DNA can provide
160

information regarding drug target engagement, alterations to tumour biology and potential
mechanisms of resistance (567). These types of translational studies are critical, so that even if a trial
is proven to be negative, there are opportunities for molecular studies into the possible explanations,
as well as to inform the design of future trials.
Targeting CCNE1 amplification represents a potential opportunity to apply precision medicine in
HGSC. I am not aware of any clinical trials across any tumour types that have pre-selected based on
CCNE1 amplification status, or indeed, any studies that have retrospectively examined CCNE1
amplification in tumours to identify subgroups of patients that may be more responsive to certain
targeted agents. CCNE1 amplification is also identified in other tumour types including uterine,
gastric and bladder cancers (see Figure 1.3). Many pre-clinical studies have similarly demonstrated
activity of small molecule inhibitors such as CDK2 inhibitors in CCNE1 amplified breast and uterine
cancers (408, 421, 568); however these have yet to be incorporated into biomarker driven clinical trials.
In attempting to design such studies, it is important to consider the challenges and limitations
discussed. As demonstrated in work from this thesis, issues with drug design have significantly
hampered the clinical development of CDK2 inhibitors. Furthermore, there are outstanding questions
regarding the function of the cyclin E1-CDK2 complex in the setting of CCNE1 amplification, and
whether there are kinase independent functions of cyclin E1-CDK2 that are essential to CCNE1
amplified cells. Addressing these and other questions outlined in this discussion in ongoing pre-
clinical studies, as well as appropriately designed clinical trials, is crucial to the progress of precision
medicine for patients with CCNE1 amplified tumours.
5.6 Closing remarks HGSC patients with high level CCNE1 amplification represent an unmet clinical need. The studies
completed in this thesis provide two potential novel therapeutic strategies involving either a
combination of CDK2 and AKT inhibitors (such as dinaciclib and MK-2206) or proteasome inhibitors
(such as MLN9708) that may be active in the clinical setting. I am committed towards developing
clinical trials specifically targeting HGSC patients with CCNE1 amplification. Together with
laboratory and clinical collaborators, I am leading the design of signal seeking trials that will aim to
demonstrate activity of drugs targeting CCNE1 amplification, as well as incorporate opportunities for
translational studies in order to learn from each of the patients enrolled onto such trials. Ongoing pre-
clinical studies will continue to improve our understanding of CCNE1 amplification, and may also
uncover new strategies to target CCNE1 amplification that can be translated into the clinical setting.
The key challenge is to demonstrate that these novel treatment strategies will translate into improved
clinical outcomes for HGSC patients with CCNE1 amplification.
161

References 1. Australian Institute of Health and Welfare & Cancer Australia 2012. Gynaecological cancers in Australia: an overview. Cancer series no. 70. Cat. no. CAN 66. Canberra: AIHW. 2. Melin AS, Lundholm C, Malki N, Swahn ML, Sparen P, Bergqvist A. Hormonal and surgical treatments for endometriosis and risk of epithelial ovarian cancer. Acta Obstet Gynecol Scand. 2013;92:546-54. 3. Wang KC, Chang WH, Lee WL, Huang N, Huang HY, Yen MS, et al. An increased risk of epithelial ovarian cancer in Taiwanese women with a new surgico-pathological diagnosis of endometriosis. BMC Cancer. 2014;14:831. 4. Domchek SM, Rebbeck TR. Prophylactic oophorectomy in women at increased cancer risk. Curr Opin Obstet Gynecol. 2007;19:27-30. 5. Domchek SM, Friebel TM, Singer CF, Evans DG, Lynch HT, Isaacs C, et al. Association of risk-reducing surgery in BRCA1 or BRCA2 mutation carriers with cancer risk and mortality. JAMA. 2010;304:967-75. 6. Siegel R, Ma J, Zou Z, Jemal A. Cancer statistics, 2014. CA Cancer J Clin. 2014;64:9-29. 7. Ferlay J, Shin HR, Bray F, Forman D, Mathers C, Parkin DM. Estimates of worldwide burden of cancer in 2008: GLOBOCAN 2008. Int J Cancer. 2010;127:2893-917. 8. Permuth-Wey J, Sellers TA. Epidemiology of ovarian cancer. Methods Mol Biol. 2009;472:413-37. 9. Wu ML, Whittemore AS, Paffenbarger RS, Jr., Sarles DL, Kampert JB, Grosser S, et al. Personal and environmental characteristics related to epithelial ovarian cancer. I. Reproductive and menstrual events and oral contraceptive use. Am J Epidemiol. 1988;128:1216-27. 10. Hankinson SE, Colditz GA, Hunter DJ, Willett WC, Stampfer MJ, Rosner B, et al. A prospective study of reproductive factors and risk of epithelial ovarian cancer. Cancer. 1995;76:284-90. 11. Anderson GL, Judd HL, Kaunitz AM, Barad DH, Beresford SA, Pettinger M, et al. Effects of estrogen plus progestin on gynecologic cancers and associated diagnostic procedures: the Women's Health Initiative randomized trial. JAMA. 2003;290:1739-48. 12. Danforth KN, Tworoger SS, Hecht JL, Rosner BA, Colditz GA, Hankinson SE. A prospective study of postmenopausal hormone use and ovarian cancer risk. Br J Cancer. 2007;96:151-6. 13. Beral V, Million Women Study C, Bull D, Green J, Reeves G. Ovarian cancer and hormone replacement therapy in the Million Women Study. Lancet. 2007;369:1703-10. 14. Lacey JV, Jr., Leitzmann M, Brinton LA, Lubin JH, Sherman ME, Schatzkin A, et al. Weight, height, and body mass index and risk for ovarian cancer in a cohort study. Ann Epidemiol. 2006;16:869-76. 15. Beehler GP, Sekhon M, Baker JA, Teter BE, McCann SE, Rodabaugh KJ, et al. Risk of ovarian cancer associated with BMI varies by menopausal status. J Nutr. 2006;136:2881-6. 16. Modugno F, Ness RB, Allen GO. Alcohol consumption and the risk of mucinous and nonmucinous epithelial ovarian cancer. Obstet Gynecol. 2003;102:1336-43. 17. Webb PM, Purdie DM, Bain CJ, Green AC. Alcohol, wine, and risk of epithelial ovarian cancer. Cancer Epidemiol Biomarkers Prev. 2004;13:592-9. 18. Modugno F, Ness RB, Cottreau CM. Cigarette smoking and the risk of mucinous and nonmucinous epithelial ovarian cancer. Epidemiology. 2002;13:467-71. 19. Jordan SJ, Whiteman DC, Purdie DM, Green AC, Webb PM. Does smoking increase risk of ovarian cancer? A systematic review. Gynecol Oncol. 2006;103:1122-9. 20. Huncharek M, Geschwind JF, Kupelnick B. Perineal application of cosmetic talc and risk of invasive epithelial ovarian cancer: a meta-analysis of 11,933 subjects from sixteen observational studies. Anticancer Res. 2003;23:1955-60. 21. Oriel KA, Hartenbach EM, Remington PL. Trends in United States ovarian cancer mortality, 1979-1995. Obstet Gynecol. 1999;93:30-3. 22. Kjaerbye-Thygesen A, Huusom LD, Frederiksen K, Kjaer SK. Trends in the incidence and mortality of ovarian cancer in Denmark 1978-2002. Comparison with other Nordic countries. Acta Obstet Gynecol Scand. 2005;84:1006-12. 23. Tracey EA, Roder DM, Francis J, Zorbas HM, Hacker NF, Bishop JF. Reasons for improved survival from ovarian cancer in New South Wales, Australia, between 1980 and 2003: implications for cancer control. Int J Gynecol Cancer. 2009;19:591-9. 24. Croswell JM, Ransohoff DF, Kramer BS. Principles of cancer screening: lessons from history and study design issues. Semin Oncol. 2010;37:202-15. 25. Pinsky PF. Principles of Cancer Screening. Surg Clin North Am. 2015;95:953-66. 26. Brawley OW, Kramer BS. Cancer screening in theory and in practice. J Clin Oncol. 2005;23:293-300. 27. Buys SS, Partridge E, Black A, Johnson CC, Lamerato L, Isaacs C, et al. Effect of screening on ovarian cancer mortality: the Prostate, Lung, Colorectal and Ovarian (PLCO) Cancer Screening Randomized Controlled Trial. JAMA. 2011;305:2295-303.
162

28. Pinsky PF, Yu K, Kramer BS, Black A, Buys SS, Partridge E, et al. Extended mortality results for ovarian cancer screening in the PLCO trial with median 15years follow-up. Gynecol Oncol. 2016. 29. Jacobs IJ, Menon U, Ryan A, Gentry-Maharaj A, Burnell M, Kalsi JK, et al. Ovarian cancer screening and mortality in the UK Collaborative Trial of Ovarian Cancer Screening (UKCTOCS): a randomised controlled trial. Lancet. 2016;387:945-56. 30. Skates SJ. Ovarian cancer screening: development of the risk of ovarian cancer algorithm (ROCA) and ROCA screening trials. Int J Gynecol Cancer. 2012;22 Suppl 1:S24-6. 31. Karlan BY, Raffel LJ, Crvenkovic G, Smrt C, Chen MD, Lopez E, et al. A multidisciplinary approach to the early detection of ovarian carcinoma: rationale, protocol design, and early results. Am J Obstet Gynecol. 1993;169:494-501. 32. Kauff ND, Satagopan JM, Robson ME, Scheuer L, Hensley M, Hudis CA, et al. Risk-reducing salpingo-oophorectomy in women with a BRCA1 or BRCA2 mutation. N Engl J Med. 2002;346:1609-15. 33. Hermsen BB, Olivier RI, Verheijen RH, van Beurden M, de Hullu JA, Massuger LF, et al. No efficacy of annual gynaecological screening in BRCA1/2 mutation carriers; an observational follow-up study. Br J Cancer. 2007;96:1335-42. 34. Stirling D, Evans DG, Pichert G, Shenton A, Kirk EN, Rimmer S, et al. Screening for familial ovarian cancer: failure of current protocols to detect ovarian cancer at an early stage according to the international Federation of gynecology and obstetrics system. J Clin Oncol. 2005;23:5588-96. 35. Chen VW, Ruiz B, Killeen JL, Cote TR, Wu XC, Correa CN. Pathology and classification of ovarian tumors. Cancer. 2003;97:2631-42. 36. Stewart B. W. and Kleihues P. (Eds): World Cancer Report. IARCPress. Lyon 2003. 37. Colombo N, Peiretti M, Garbi A, Carinelli S, Marini C, Sessa C, et al. Non-epithelial ovarian cancer: ESMO Clinical Practice Guidelines for diagnosis, treatment and follow-up. Ann Oncol. 2012;23 Suppl 7:vii20-6. 38. Prat J. Ovarian carcinomas: five distinct diseases with different origins, genetic alterations, and clinicopathological features. Virchows Arch. 2012;460:237-49. 39. Kelemen LE, Kobel M. Mucinous carcinomas of the ovary and colorectum: different organ, same dilemma. Lancet Oncol. 2011;12:1071-80. 40. del Carmen MG, Birrer M, Schorge JO. Clear cell carcinoma of the ovary: a review of the literature. Gynecol Oncol. 2012;126:481-90. 41. Storey DJ, Rush R, Stewart M, Rye T, Al-Nafussi A, Williams AR, et al. Endometrioid epithelial ovarian cancer : 20 years of prospectively collected data from a single center. Cancer. 2008;112:2211-20. 42. Benedet JL, Bender H, Jones H, 3rd, Ngan HY, Pecorelli S. FIGO staging classifications and clinical practice guidelines in the management of gynecologic cancers. FIGO Committee on Gynecologic Oncology. Int J Gynaecol Obstet. 2000;70:209-62. 43. Scully RE. World Health Organization classification and nomenclature of ovarian cancer. Natl Cancer Inst Monogr. 1975;42:5-7. 44. Shimizu Y, Kamoi S, Amada S, Akiyama F, Silverberg SG. Toward the development of a universal grading system for ovarian epithelial carcinoma: testing of a proposed system in a series of 461 patients with uniform treatment and follow-up. Cancer. 1998;82:893-901. 45. Malpica A, Deavers MT, Lu K, Bodurka DC, Atkinson EN, Gershenson DM, et al. Grading ovarian serous carcinoma using a two-tier system. Am J Surg Pathol. 2004;28:496-504. 46. Malpica A, Deavers MT, Tornos C, Kurman RJ, Soslow R, Seidman JD, et al. Interobserver and intraobserver variability of a two-tier system for grading ovarian serous carcinoma. Am J Surg Pathol. 2007;31:1168-74. 47. Seidman JD, Horkayne-Szakaly I, Cosin JA, Ryu HS, Haiba M, Boice CR, et al. Testing of two binary grading systems for FIGO stage III serous carcinoma of the ovary and peritoneum. Gynecol Oncol. 2006;103:703-8. 48. Diaz-Padilla I, Malpica AL, Minig L, Chiva LM, Gershenson DM, Gonzalez-Martin A. Ovarian low-grade serous carcinoma: a comprehensive update. Gynecol Oncol. 2012;126:279-85. 49. Vang R, Shih Ie M, Kurman RJ. Ovarian low-grade and high-grade serous carcinoma: pathogenesis, clinicopathologic and molecular biologic features, and diagnostic problems. Adv Anat Pathol. 2009;16:267-82. 50. Gilks CB, Prat J. Ovarian carcinoma pathology and genetics: recent advances. Hum Pathol. 2009;40:1213-23. 51. Shih Ie M, Kurman RJ. Ovarian tumorigenesis: a proposed model based on morphological and molecular genetic analysis. Am J Pathol. 2004;164:1511-8. 52. Kurman RJ, Shih Ie M. The origin and pathogenesis of epithelial ovarian cancer: a proposed unifying theory. Am J Surg Pathol. 2010;34:433-43. 53. Feeley KM, Wells M. Precursor lesions of ovarian epithelial malignancy. Histopathology. 2001;38:87-95.
163

54. Whittemore AS. Characteristics relating to ovarian cancer risk: implications for prevention and detection. Gynecol Oncol. 1994;55:S15-9. 55. Fraumeni JF, Jr., Lloyd JW, Smith EM, Wagoner JK. Cancer mortality among nuns: role of marital status in etiology of neoplastic disease in women. J Natl Cancer Inst. 1969;42:455-68. 56. Rossing MA, Daling JR, Weiss NS, Moore DE, Self SG. Ovarian tumors in a cohort of infertile women. N Engl J Med. 1994;331:771-6. 57. Fathalla MF. Incessant ovulation--a factor in ovarian neoplasia? Lancet. 1971;2:163. 58. Cramer DW, Welch WR. Determinants of ovarian cancer risk. II. Inferences regarding pathogenesis. J Natl Cancer Inst. 1983;71:717-21. 59. Cheng W, Liu J, Yoshida H, Rosen D, Naora H. Lineage infidelity of epithelial ovarian cancers is controlled by HOX genes that specify regional identity in the reproductive tract. Nat Med. 2005;11:531-7. 60. Lee KR, Young RH. The distinction between primary and metastatic mucinous carcinomas of the ovary: gross and histologic findings in 50 cases. Am J Surg Pathol. 2003;27:281-92. 61. Veras E, Mao TL, Ayhan A, Ueda S, Lai H, Hayran M, et al. Cystic and adenofibromatous clear cell carcinomas of the ovary: distinctive tumors that differ in their pathogenesis and behavior: a clinicopathologic analysis of 122 cases. Am J Surg Pathol. 2009;33:844-53. 62. Wiegand KC, Shah SP, Al-Agha OM, Zhao Y, Tse K, Zeng T, et al. ARID1A mutations in endometriosis-associated ovarian carcinomas. N Engl J Med. 2010;363:1532-43. 63. Jones S, Wang TL, Shih Ie M, Mao TL, Nakayama K, Roden R, et al. Frequent mutations of chromatin remodeling gene ARID1A in ovarian clear cell carcinoma. Science. 2010;330:228-31. 64. Zorn KK, Bonome T, Gangi L, Chandramouli GV, Awtrey CS, Gardner GJ, et al. Gene expression profiles of serous, endometrioid, and clear cell subtypes of ovarian and endometrial cancer. Clin Cancer Res. 2005;11:6422-30. 65. Anglesio MS, George J, Kulbe H, Friedlander M, Rischin D, Lemech C, et al. IL6-STAT3-HIF signaling and therapeutic response to the angiogenesis inhibitor sunitinib in ovarian clear cell cancer. Clin Cancer Res. 2011;17:2538-48. 66. Worley MJ, Welch WR, Berkowitz RS, Ng SW. Endometriosis-associated ovarian cancer: a review of pathogenesis. Int J Mol Sci. 2013;14:5367-79. 67. Burks RT, Sherman ME, Kurman RJ. Micropapillary serous carcinoma of the ovary. A distinctive low-grade carcinoma related to serous borderline tumors. Am J Surg Pathol. 1996;20:1319-30. 68. Shvartsman HS, Sun CC, Bodurka DC, Mahajan V, Crispens M, Lu KH, et al. Comparison of the clinical behavior of newly diagnosed stages II-IV low-grade serous carcinoma of the ovary with that of serous ovarian tumors of low malignant potential that recur as low-grade serous carcinoma. Gynecol Oncol. 2007;105:625-9. 69. Bell DA, Scully RE. Early de novo ovarian carcinoma. A study of fourteen cases. Cancer. 1994;73:1859-64. 70. King MC, Marks JH, Mandell JB, New York Breast Cancer Study G. Breast and ovarian cancer risks due to inherited mutations in BRCA1 and BRCA2. Science. 2003;302:643-6. 71. Piek JM, van Diest PJ, Zweemer RP, Jansen JW, Poort-Keesom RJ, Menko FH, et al. Dysplastic changes in prophylactically removed Fallopian tubes of women predisposed to developing ovarian cancer. J Pathol. 2001;195:451-6. 72. Carcangiu ML, Radice P, Manoukian S, Spatti G, Gobbo M, Pensotti V, et al. Atypical epithelial proliferation in fallopian tubes in prophylactic salpingo-oophorectomy specimens from BRCA1 and BRCA2 germline mutation carriers. Int J Gynecol Pathol. 2004;23:35-40. 73. Medeiros F, Muto MG, Lee Y, Elvin JA, Callahan MJ, Feltmate C, et al. The tubal fimbria is a preferred site for early adenocarcinoma in women with familial ovarian cancer syndrome. Am J Surg Pathol. 2006;30:230-6. 74. Lee Y, Miron A, Drapkin R, Nucci MR, Medeiros F, Saleemuddin A, et al. A candidate precursor to serous carcinoma that originates in the distal fallopian tube. J Pathol. 2007;211:26-35. 75. Kindelberger DW, Lee Y, Miron A, Hirsch MS, Feltmate C, Medeiros F, et al. Intraepithelial carcinoma of the fimbria and pelvic serous carcinoma: Evidence for a causal relationship. Am J Surg Pathol. 2007;31:161-9. 76. Carlson JW, Miron A, Jarboe EA, Parast MM, Hirsch MS, Lee Y, et al. Serous tubal intraepithelial carcinoma: its potential role in primary peritoneal serous carcinoma and serous cancer prevention. J Clin Oncol. 2008;26:4160-5. 77. Przybycin CG, Kurman RJ, Ronnett BM, Shih Ie M, Vang R. Are all pelvic (nonuterine) serous carcinomas of tubal origin? Am J Surg Pathol. 2010;34:1407-16. 78. Perets R, Drapkin R. It's Totally Tubular....Riding The New Wave of Ovarian Cancer Research. Cancer Res. 2016;76:10-7.
164

79. Levanon K, Ng V, Piao HY, Zhang Y, Chang MC, Roh MH, et al. Primary ex vivo cultures of human fallopian tube epithelium as a model for serous ovarian carcinogenesis. Oncogene. 2010;29:1103-13. 80. Karst AM, Levanon K, Drapkin R. Modeling high-grade serous ovarian carcinogenesis from the fallopian tube. Proc Natl Acad Sci U S A. 2011;108:7547-52. 81. Jazaeri AA, Bryant JL, Park H, Li H, Dahiya N, Stoler MH, et al. Molecular requirements for transformation of fallopian tube epithelial cells into serous carcinoma. Neoplasia. 2011;13:899-911. 82. Kim J, Coffey DM, Creighton CJ, Yu Z, Hawkins SM, Matzuk MM. High-grade serous ovarian cancer arises from fallopian tube in a mouse model. Proc Natl Acad Sci U S A. 2012;109:3921-6. 83. Lawrenson K, Notaridou M, Lee N, Benjamin E, Jacobs IJ, Jones C, et al. In vitro three-dimensional modeling of fallopian tube secretory epithelial cells. BMC Cell Biol. 2013;14:43. 84. Perets R, Wyant GA, Muto KW, Bijron JG, Poole BB, Chin KT, et al. Transformation of the fallopian tube secretory epithelium leads to high-grade serous ovarian cancer in Brca;Tp53;Pten models. Cancer Cell. 2013;24:751-65. 85. Sherman-Baust CA, Kuhn E, Valle BL, Shih Ie M, Kurman RJ, Wang TL, et al. A genetically engineered ovarian cancer mouse model based on fallopian tube transformation mimics human high-grade serous carcinoma development. J Pathol. 2014;233:228-37. 86. Powell CB, Swisher EM, Cass I, McLennan J, Norquist B, Garcia RL, et al. Long term follow up of BRCA1 and BRCA2 mutation carriers with unsuspected neoplasia identified at risk reducing salpingo-oophorectomy. Gynecol Oncol. 2013;129:364-71. 87. Wethington SL, Park KJ, Soslow RA, Kauff ND, Brown CL, Dao F, et al. Clinical outcome of isolated serous tubal intraepithelial carcinomas (STIC). Int J Gynecol Cancer. 2013;23:1603-11. 88. Conner JR, Meserve E, Pizer E, Garber J, Roh M, Urban N, et al. Outcome of unexpected adnexal neoplasia discovered during risk reduction salpingo-oophorectomy in women with germ-line BRCA1 or BRCA2 mutations. Gynecol Oncol. 2014;132:280-6. 89. Visvanathan K, Vang R, Shaw P, Gross A, Soslow R, Parkash V, et al. Diagnosis of serous tubal intraepithelial carcinoma based on morphologic and immunohistochemical features: a reproducibility study. Am J Surg Pathol. 2011;35:1766-75. 90. Bankhead CR, Collins C, Stokes-Lampard H, Rose P, Wilson S, Clements A, et al. Identifying symptoms of ovarian cancer: a qualitative and quantitative study. BJOG. 2008;115:1008-14. 91. Heintz AP, Odicino F, Maisonneuve P, Quinn MA, Benedet JL, Creasman WT, et al. Carcinoma of the ovary. FIGO 26th Annual Report on the Results of Treatment in Gynecological Cancer. Int J Gynaecol Obstet. 2006;95 Suppl 1:S161-92. 92. Goff BA, Mandel LS, Melancon CH, Muntz HG. Frequency of symptoms of ovarian cancer in women presenting to primary care clinics. JAMA. 2004;291:2705-12. 93. Hamilton W, Peters TJ, Bankhead C, Sharp D. Risk of ovarian cancer in women with symptoms in primary care: population based case-control study. BMJ. 2009;339:b2998. 94. Nagle CM, Francis JE, Nelson AE, Zorbas H, Luxford K, de Fazio A, et al. Reducing time to diagnosis does not improve outcomes for women with symptomatic ovarian cancer: a report from the Australian Ovarian Cancer Study Group. J Clin Oncol. 2011;29:2253-8. 95. Jayson GC, Kohn EC, Kitchener HC, Ledermann JA. Ovarian cancer. Lancet. 2014;384:1376-88. 96. Prat J, Oncology FCoG. Staging classification for cancer of the ovary, fallopian tube, and peritoneum. Int J Gynaecol Obstet. 2014;124:1-5. 97. Griffiths CT. Surgical resection of tumor bulk in the primary treatment of ovarian carcinoma. Natl Cancer Inst Monogr. 1975;42:101-4. 98. Markman M. Concept of optimal surgical cytoreduction in advanced ovarian cancer: a brief critique and a call for action. J Clin Oncol. 2007;25:4168-70. 99. . !!! INVALID CITATION !!! 100. Junor EJ, Hole DJ, McNulty L, Mason M, Young J. Specialist gynaecologists and survival outcome in ovarian cancer: a Scottish national study of 1866 patients. Br J Obstet Gynaecol. 1999;106:1130-6. 101. Kumpulainen S, Grenman S, Kyyronen P, Pukkala E, Sankila R. Evidence of benefit from centralised treatment of ovarian cancer: a nationwide population-based survival analysis in Finland. Int J Cancer. 2002;102:541-4. 102. Woo YL, Kyrgiou M, Bryant A, Everett T, Dickinson HO. Centralisation of services for gynaecological cancer. Cochrane Database Syst Rev. 2012:CD007945. 103. Hunter RW, Alexander ND, Soutter WP. Meta-analysis of surgery in advanced ovarian carcinoma: is maximum cytoreductive surgery an independent determinant of prognosis? Am J Obstet Gynecol. 1992;166:504-11. 104. Makar AP, Baekelandt M, Trope CG, Kristensen GB. The prognostic significance of residual disease, FIGO substage, tumor histology, and grade in patients with FIGO stage III ovarian cancer. Gynecol Oncol. 1995;56:175-80.
165

105. Bristow RE, Tomacruz RS, Armstrong DK, Trimble EL, Montz FJ. Survival effect of maximal cytoreductive surgery for advanced ovarian carcinoma during the platinum era: a meta-analysis. J Clin Oncol. 2002;20:1248-59. 106. Alberts DS, Liu PY, Hannigan EV, O'Toole R, Williams SD, Young JA, et al. Intraperitoneal cisplatin plus intravenous cyclophosphamide versus intravenous cisplatin plus intravenous cyclophosphamide for stage III ovarian cancer. N Engl J Med. 1996;335:1950-5. 107. du Bois A, Reuss A, Pujade-Lauraine E, Harter P, Ray-Coquard I, Pfisterer J. Role of surgical outcome as prognostic factor in advanced epithelial ovarian cancer: a combined exploratory analysis of 3 prospectively randomized phase 3 multicenter trials: by the Arbeitsgemeinschaft Gynaekologische Onkologie Studiengruppe Ovarialkarzinom (AGO-OVAR) and the Groupe d'Investigateurs Nationaux Pour les Etudes des Cancers de l'Ovaire (GINECO). Cancer. 2009;115:1234-44. 108. Aletti GD, Podratz KC, Moriarty JP, Cliby WA, Long KH. Aggressive and complex surgery for advanced ovarian cancer: an economic analysis. Gynecol Oncol. 2009;112:16-21. 109. Peiretti M, Zanagnolo V, Aletti GD, Bocciolone L, Colombo N, Landoni F, et al. Role of maximal primary cytoreductive surgery in patients with advanced epithelial ovarian and tubal cancer: Surgical and oncological outcomes. Single institution experience. Gynecol Oncol. 2010;119:259-64. 110. Rodriguez N, Miller A, Richard SD, Rungruang B, Hamilton CA, Bookman MA, et al. Upper abdominal procedures in advanced stage ovarian or primary peritoneal carcinoma patients with minimal or no gross residual disease: an analysis of Gynecologic Oncology Group (GOG) 182. Gynecol Oncol. 2013;130:487-92. 111. Nick AM, Coleman RL, Ramirez PT, Sood AK. A framework for a personalized surgical approach to ovarian cancer. Nat Rev Clin Oncol. 2015;12:239-45. 112. Hoskins WJ, Bundy BN, Thigpen JT, Omura GA. The influence of cytoreductive surgery on recurrence-free interval and survival in small-volume stage III epithelial ovarian cancer: a Gynecologic Oncology Group study. Gynecol Oncol. 1992;47:159-66. 113. Chi DS, Eisenhauer EL, Zivanovic O, Sonoda Y, Abu-Rustum NR, Levine DA, et al. Improved progression-free and overall survival in advanced ovarian cancer as a result of a change in surgical paradigm. Gynecol Oncol. 2009;114:26-31. 114. Hamilton CA, Miller A, Miller C, Krivak TC, Farley JH, Chernofsky MR, et al. The impact of disease distribution on survival in patients with stage III epithelial ovarian cancer cytoreduced to microscopic residual: a Gynecologic Oncology Group study. Gynecol Oncol. 2011;122:521-6. 115. Horowitz NS, Miller A, Rungruang B, Richard SD, Rodriguez N, Bookman MA, et al. Does aggressive surgery improve outcomes? Interaction between preoperative disease burden and complex surgery in patients with advanced-stage ovarian cancer: an analysis of GOG 182. J Clin Oncol. 2015;33:937-43. 116. Bookman MA. Update of randomized trials in first-line treatment. Ann Oncol. 2011;22 Suppl 8:viii52-viii60. 117. Williams CJ, Mead GM, Macbeth FR, Thompson J, Whitehouse JM, MacDonald H, et al. Cisplatin combination chemotherapy versus chlorambucil in advanced ovarian carcinoma: mature results of a randomized trial. J Clin Oncol. 1985;3:1455-62. 118. McGuire WP, Hoskins WJ, Brady MF, Kucera PR, Partridge EE, Look KY, et al. Cyclophosphamide and cisplatin compared with paclitaxel and cisplatin in patients with stage III and stage IV ovarian cancer. N Engl J Med. 1996;334:1-6. 119. Ozols RF, Bundy BN, Greer BE, Fowler JM, Clarke-Pearson D, Burger RA, et al. Phase III trial of carboplatin and paclitaxel compared with cisplatin and paclitaxel in patients with optimally resected stage III ovarian cancer: a Gynecologic Oncology Group study. J Clin Oncol. 2003;21:3194-200. 120. Bookman MA, Brady MF, McGuire WP, Harper PG, Alberts DS, Friedlander M, et al. Evaluation of new platinum-based treatment regimens in advanced-stage ovarian cancer: a Phase III Trial of the Gynecologic Cancer Intergroup. J Clin Oncol. 2009;27:1419-25. 121. Coleman RL, Monk BJ, Sood AK, Herzog TJ. Latest research and treatment of advanced-stage epithelial ovarian cancer. Nat Rev Clin Oncol. 2013;10:211-24. 122. Herzog TJ, Pothuri B. Ovarian cancer: a focus on management of recurrent disease. Nat Clin Pract Oncol. 2006;3:604-11. 123. Bell J, Brady MF, Young RC, Lage J, Walker JL, Look KY, et al. Randomized phase III trial of three versus six cycles of adjuvant carboplatin and paclitaxel in early stage epithelial ovarian carcinoma: a Gynecologic Oncology Group study. Gynecol Oncol. 2006;102:432-9. 124. Trimbos JB, Parmar M, Vergote I, Guthrie D, Bolis G, Colombo N, et al. International Collaborative Ovarian Neoplasm trial 1 and Adjuvant ChemoTherapy In Ovarian Neoplasm trial: two parallel randomized phase III trials of adjuvant chemotherapy in patients with early-stage ovarian carcinoma. J Natl Cancer Inst. 2003;95:105-12.
166

125. Winter-Roach BA, Kitchener HC, Lawrie TA. Adjuvant (post-surgery) chemotherapy for early stage epithelial ovarian cancer. Cochrane Database Syst Rev. 2012:CD004706. 126. Chan JK, Tian C, Fleming GF, Monk BJ, Herzog TJ, Kapp DS, et al. The potential benefit of 6 vs. 3 cycles of chemotherapy in subsets of women with early-stage high-risk epithelial ovarian cancer: an exploratory analysis of a Gynecologic Oncology Group study. Gynecol Oncol. 2010;116:301-6. 127. Chan JK, Tian C, Teoh D, Monk BJ, Herzog T, Kapp DS, et al. Survival after recurrence in early-stage high-risk epithelial ovarian cancer: a Gynecologic Oncology Group study. Gynecol Oncol. 2010;116:307-11. 128. McMurray EH, Jacobs AJ, Perez CA, Camel HM, Kao MS, Galakatos A. Carcinoma of the fallopian tube. Management and sites of failure. Cancer. 1986;58:2070-5. 129. Markman M, Walker JL. Intraperitoneal chemotherapy of ovarian cancer: a review, with a focus on practical aspects of treatment. J Clin Oncol. 2006;24:988-94. 130. Markman M, Bundy BN, Alberts DS, Fowler JM, Clark-Pearson DL, Carson LF, et al. Phase III trial of standard-dose intravenous cisplatin plus paclitaxel versus moderately high-dose carboplatin followed by intravenous paclitaxel and intraperitoneal cisplatin in small-volume stage III ovarian carcinoma: an intergroup study of the Gynecologic Oncology Group, Southwestern Oncology Group, and Eastern Cooperative Oncology Group. J Clin Oncol. 2001;19:1001-7. 131. Armstrong DK, Bundy B, Wenzel L, Huang HQ, Baergen R, Lele S, et al. Intraperitoneal cisplatin and paclitaxel in ovarian cancer. N Engl J Med. 2006;354:34-43. 132. Tewari D, Java JJ, Salani R, Armstrong DK, Markman M, Herzog T, et al. Long-term survival advantage and prognostic factors associated with intraperitoneal chemotherapy treatment in advanced ovarian cancer: a gynecologic oncology group study. J Clin Oncol. 2015;33:1460-6. 133. Hess LM, Benham-Hutchins M, Herzog TJ, Hsu CH, Malone DC, Skrepnek GH, et al. A meta-analysis of the efficacy of intraperitoneal cisplatin for the front-line treatment of ovarian cancer. Int J Gynecol Cancer. 2007;17:561-70. 134. Walker JL, Armstrong DK, Huang HQ, Fowler J, Webster K, Burger RA, et al. Intraperitoneal catheter outcomes in a phase III trial of intravenous versus intraperitoneal chemotherapy in optimal stage III ovarian and primary peritoneal cancer: a Gynecologic Oncology Group Study. Gynecol Oncol. 2006;100:27-32. 135. Blinman P, Gainford C, Donoghoe M, Martyn J, Blomfield P, Grant P, et al. Feasibility, acceptability and preferences for intraperitoneal chemotherapy with paclitaxel and cisplatin after optimal debulking surgery for ovarian and related cancers: an ANZGOG study. J Gynecol Oncol. 2013;24:359-66. 136. Bookman MA, Brady MF. Intraperitoneal chemotherapy: long-term outcomes revive a long-running debate. J Clin Oncol. 2015;33:1424-6. 137. Lesnock JL, Darcy KM, Tian C, Deloia JA, Thrall MM, Zahn C, et al. BRCA1 expression and improved survival in ovarian cancer patients treated with intraperitoneal cisplatin and paclitaxel: a Gynecologic Oncology Group Study. Br J Cancer. 2013;108:1231-7. 138. Green MC, Buzdar AU, Smith T, Ibrahim NK, Valero V, Rosales MF, et al. Weekly paclitaxel improves pathologic complete remission in operable breast cancer when compared with paclitaxel once every 3 weeks. J Clin Oncol. 2005;23:5983-92. 139. Seidman AD, Berry D, Cirrincione C, Harris L, Muss H, Marcom PK, et al. Randomized phase III trial of weekly compared with every-3-weeks paclitaxel for metastatic breast cancer, with trastuzumab for all HER-2 overexpressors and random assignment to trastuzumab or not in HER-2 nonoverexpressors: final results of Cancer and Leukemia Group B protocol 9840. J Clin Oncol. 2008;26:1642-9. 140. Torres K, Horwitz SB. Mechanisms of Taxol-induced cell death are concentration dependent. Cancer Res. 1998;58:3620-6. 141. Katsumata N, Yasuda M, Takahashi F, Isonishi S, Jobo T, Aoki D, et al. Dose-dense paclitaxel once a week in combination with carboplatin every 3 weeks for advanced ovarian cancer: a phase 3, open-label, randomised controlled trial. Lancet. 2009;374:1331-8. 142. Katsumata N, Yasuda M, Isonishi S, Takahashi F, Michimae H, Kimura E, et al. Long-term results of dose-dense paclitaxel and carboplatin versus conventional paclitaxel and carboplatin for treatment of advanced epithelial ovarian, fallopian tube, or primary peritoneal cancer (JGOG 3016): a randomised, controlled, open-label trial. Lancet Oncol. 2013;14:1020-6. 143. Pignata S, Scambia G, Katsaros D, Gallo C, Pujade-Lauraine E, De Placido S, et al. Carboplatin plus paclitaxel once a week versus every 3 weeks in patients with advanced ovarian cancer (MITO-7): a randomised, multicentre, open-label, phase 3 trial. Lancet Oncol. 2014;15:396-405. 144. Chan JK, Brady MF, Penson RT, Huang H, Birrer MJ, Walker JL, et al. Weekly vs. Every-3-Week Paclitaxel and Carboplatin for Ovarian Cancer. N Engl J Med. 2016;374:738-48. 145. Fuh KC, Shin JY, Kapp DS, Brooks RA, Ueda S, Urban RR, et al. Survival differences of Asian and Caucasian epithelial ovarian cancer patients in the United States. Gynecol Oncol. 2015;136:491-7. 146. Redman CW, Warwick J, Luesley DM, Varma R, Lawton FG, Blackledge GR. Intervention debulking surgery in advanced epithelial ovarian cancer. Br J Obstet Gynaecol. 1994;101:142-6.
167

147. van der Burg ME, van Lent M, Buyse M, Kobierska A, Colombo N, Favalli G, et al. The effect of debulking surgery after induction chemotherapy on the prognosis in advanced epithelial ovarian cancer. Gynecological Cancer Cooperative Group of the European Organization for Research and Treatment of Cancer. N Engl J Med. 1995;332:629-34. 148. Bristow RE, Chi DS. Platinum-based neoadjuvant chemotherapy and interval surgical cytoreduction for advanced ovarian cancer: a meta-analysis. Gynecol Oncol. 2006;103:1070-6. 149. Vergote I, Trope CG, Amant F, Kristensen GB, Ehlen T, Johnson N, et al. Neoadjuvant chemotherapy or primary surgery in stage IIIC or IV ovarian cancer. N Engl J Med. 2010;363:943-53. 150. Kang S, Nam BH. Does neoadjuvant chemotherapy increase optimal cytoreduction rate in advanced ovarian cancer? Meta-analysis of 21 studies. Ann Surg Oncol. 2009;16:2315-20. 151. Kehoe S, Hook J, Nankivell M, Jayson GC, Kitchener H, Lopes T, et al. Primary chemotherapy versus primary surgery for newly diagnosed advanced ovarian cancer (CHORUS): an open-label, randomised, controlled, non-inferiority trial. Lancet. 2015;386:249-57. 152. Fagotti A, Ferrandina G, Vizzielli G, Fanfani F, Gallotta V, Chiantera V, et al. Phase III randomised clinical trial comparing primary surgery versus neoadjuvant chemotherapy in advanced epithelial ovarian cancer with high tumour load (SCORPION trial): Final analysis of peri-operative outcome. Eur J Cancer. 2016;59:22-33. 153. Morrison J, Haldar K, Kehoe S, Lawrie TA. Chemotherapy versus surgery for initial treatment in advanced ovarian epithelial cancer. Cochrane Database Syst Rev. 2012:CD005343. 154. Kang S. Neoadjuvant chemotherapy for ovarian cancer: do we have enough evidence? Lancet. 2015;386:223-4. 155. Wright AA, Bohlke K, Armstrong DK, Bookman MA, Cliby WA, Coleman RL, et al. Neoadjuvant Chemotherapy for Newly Diagnosed, Advanced Ovarian Cancer: Society of Gynecologic Oncology and American Society of Clinical Oncology Clinical Practice Guideline. J Clin Oncol. 2016;34:3460-73. 156. Fagotti A, Ferrandina G, Fanfani F, Garganese G, Vizzielli G, Carone V, et al. Prospective validation of a laparoscopic predictive model for optimal cytoreduction in advanced ovarian carcinoma. Am J Obstet Gynecol. 2008;199:642 e1-6. 157. Al Rawahi T, Lopes AD, Bristow RE, Bryant A, Elattar A, Chattopadhyay S, et al. Surgical cytoreduction for recurrent epithelial ovarian cancer. Cochrane Database Syst Rev. 2013:CD008765. 158. Kunkler IH, Kerr GR, Ludgate SM. The value of follow-up in stage II carcinoma of the cervix. Clin Oncol (R Coll Radiol). 1991;3:28-31. 159. Kew FM, Roberts AP, Cruickshank DJ. The role of routine follow-up after gynecological malignancy. Int J Gynecol Cancer. 2005;15:413-9. 160. Rustin GJ, van der Burg ME, Griffin CL, Guthrie D, Lamont A, Jayson GC, et al. Early versus delayed treatment of relapsed ovarian cancer (MRC OV05/EORTC 55955): a randomised trial. Lancet. 2010;376:1155-63. 161. Kew F, Galaal K, Bryant A, Naik R. Evaluation of follow-up strategies for patients with epithelial ovarian cancer following completion of primary treatment. Cochrane Database Syst Rev. 2011:CD006119. 162. Morris RT, Monk BJ. Ovarian cancer: relevant therapy, not timing, is paramount. Lancet. 2010;376:1120-2. 163. Karam AK, Karlan BY. Ovarian cancer: the duplicity of CA125 measurement. Nat Rev Clin Oncol. 2010;7:335-9. 164. Salani R, Backes FJ, Fung MF, Holschneider CH, Parker LP, Bristow RE, et al. Posttreatment surveillance and diagnosis of recurrence in women with gynecologic malignancies: Society of Gynecologic Oncologists recommendations. Am J Obstet Gynecol. 2011;204:466-78. 165. Locker GY, Hamilton S, Harris J, Jessup JM, Kemeny N, Macdonald JS, et al. ASCO 2006 update of recommendations for the use of tumor markers in gastrointestinal cancer. J Clin Oncol. 2006;24:5313-27. 166. Markman M, Bookman MA. Second-line treatment of ovarian cancer. Oncologist. 2000;5:26-35. 167. Blackledge G, Lawton F, Redman C, Kelly K. Response of patients in phase II studies of chemotherapy in ovarian cancer: implications for patient treatment and the design of phase II trials. Br J Cancer. 1989;59:650-3. 168. Gore ME, Fryatt I, Wiltshaw E, Dawson T. Treatment of relapsed carcinoma of the ovary with cisplatin or carboplatin following initial treatment with these compounds. Gynecol Oncol. 1990;36:207-11. 169. Markman M, Reichman B, Hakes T, Jones W, Lewis JL, Jr., Rubin S, et al. Responses to second-line cisplatin-based intraperitoneal therapy in ovarian cancer: influence of a prior response to intravenous cisplatin. J Clin Oncol. 1991;9:1801-5. 170. Friedlander M, Trimble E, Tinker A, Alberts D, Avall-Lundqvist E, Brady M, et al. Clinical trials in recurrent ovarian cancer. Int J Gynecol Cancer. 2011;21:771-5. 171. Harter P, Hahmann M, Lueck HJ, Poelcher M, Wimberger P, Ortmann O, et al. Surgery for recurrent ovarian cancer: role of peritoneal carcinomatosis: exploratory analysis of the DESKTOP I Trial about risk
168

factors, surgical implications, and prognostic value of peritoneal carcinomatosis. Ann Surg Oncol. 2009;16:1324-30. 172. Zang RY, Harter P, Chi DS, Sehouli J, Jiang R, Trope CG, et al. Predictors of survival in patients with recurrent ovarian cancer undergoing secondary cytoreductive surgery based on the pooled analysis of an international collaborative cohort. Br J Cancer. 2011;105:890-6. 173. Hall M, Rustin G. Recurrent ovarian cancer: when and how to treat. Curr Oncol Rep. 2011;13:459-71. 174. Cooke SL, Brenton JD. Evolution of platinum resistance in high-grade serous ovarian cancer. Lancet Oncol. 2011;12:1169-74. 175. Naumann RW, Coleman RL. Management strategies for recurrent platinum-resistant ovarian cancer. Drugs. 2011;71:1397-412. 176. Pujade-Lauraine E, Hilpert F, Weber B, Reuss A, Poveda A, Kristensen G, et al. Bevacizumab combined with chemotherapy for platinum-resistant recurrent ovarian cancer: The AURELIA open-label randomized phase III trial. J Clin Oncol. 2014;32:1302-8. 177. King MT, Stockler MR, Butow P, O'Connell R, Voysey M, Oza AM, et al. Development of the measure of ovarian symptoms and treatment concerns: aiming for optimal measurement of patient-reported symptom benefit with chemotherapy for symptomatic ovarian cancer. Int J Gynecol Cancer. 2014;24:865-73. 178. Gonzalez-Martin A. Update on randomized trials on recurrent disease. Ann Oncol. 2013;24 Suppl 10:x48-x52. 179. Parmar MK, Ledermann JA, Colombo N, du Bois A, Delaloye JF, Kristensen GB, et al. Paclitaxel plus platinum-based chemotherapy versus conventional platinum-based chemotherapy in women with relapsed ovarian cancer: the ICON4/AGO-OVAR-2.2 trial. Lancet. 2003;361:2099-106. 180. Pfisterer J, Plante M, Vergote I, du Bois A, Hirte H, Lacave AJ, et al. Gemcitabine plus carboplatin compared with carboplatin in patients with platinum-sensitive recurrent ovarian cancer: an intergroup trial of the AGO-OVAR, the NCIC CTG, and the EORTC GCG. J Clin Oncol. 2006;24:4699-707. 181. Pujade-Lauraine E, Wagner U, Aavall-Lundqvist E, Gebski V, Heywood M, Vasey PA, et al. Pegylated liposomal Doxorubicin and Carboplatin compared with Paclitaxel and Carboplatin for patients with platinum-sensitive ovarian cancer in late relapse. J Clin Oncol. 2010;28:3323-9. 182. Wagner U, Marth C, Largillier R, Kaern J, Brown C, Heywood M, et al. Final overall survival results of phase III GCIG CALYPSO trial of pegylated liposomal doxorubicin and carboplatin vs paclitaxel and carboplatin in platinum-sensitive ovarian cancer patients. Br J Cancer. 2012;107:588-91. 183. Folkman J. Tumor angiogenesis: therapeutic implications. N Engl J Med. 1971;285:1182-6. 184. Hanahan D, Weinberg RA. Hallmarks of cancer: the next generation. Cell. 2011;144:646-74. 185. Bouck N, Stellmach V, Hsu SC. How tumors become angiogenic. Adv Cancer Res. 1996;69:135-74. 186. Hanahan D, Folkman J. Patterns and emerging mechanisms of the angiogenic switch during tumorigenesis. Cell. 1996;86:353-64. 187. Kim KJ, Li B, Winer J, Armanini M, Gillett N, Phillips HS, et al. Inhibition of vascular endothelial growth factor-induced angiogenesis suppresses tumour growth in vivo. Nature. 1993;362:841-4. 188. Veikkola T, Alitalo K. VEGFs, receptors and angiogenesis. Semin Cancer Biol. 1999;9:211-20. 189. Jain RK, Booth MF. What brings pericytes to tumor vessels? J Clin Invest. 2003;112:1134-6. 190. Rusnati M, Presta M. Fibroblast growth factors/fibroblast growth factor receptors as targets for the development of anti-angiogenesis strategies. Curr Pharm Des. 2007;13:2025-44. 191. Yancopoulos GD, Davis S, Gale NW, Rudge JS, Wiegand SJ, Holash J. Vascular-specific growth factors and blood vessel formation. Nature. 2000;407:242-8. 192. Eskander RN, Tewari KS. Incorporation of anti-angiogenesis therapy in the management of advanced ovarian carcinoma--mechanistics, review of phase III randomized clinical trials, and regulatory implications. Gynecol Oncol. 2014;132:496-505. 193. Dvorak HF, Brown LF, Detmar M, Dvorak AM. Vascular permeability factor/vascular endothelial growth factor, microvascular hyperpermeability, and angiogenesis. Am J Pathol. 1995;146:1029-39. 194. Shen GH, Ghazizadeh M, Kawanami O, Shimizu H, Jin E, Araki T, et al. Prognostic significance of vascular endothelial growth factor expression in human ovarian carcinoma. Br J Cancer. 2000;83:196-203. 195. Nagy JA, Masse EM, Herzberg KT, Meyers MS, Yeo KT, Yeo TK, et al. Pathogenesis of ascites tumor growth: vascular permeability factor, vascular hyperpermeability, and ascites fluid accumulation. Cancer Res. 1995;55:360-8. 196. Mesiano S, Ferrara N, Jaffe RB. Role of vascular endothelial growth factor in ovarian cancer: inhibition of ascites formation by immunoneutralization. Am J Pathol. 1998;153:1249-56. 197. Burger RA, Brady MF, Bookman MA, Fleming GF, Monk BJ, Huang H, et al. Incorporation of bevacizumab in the primary treatment of ovarian cancer. N Engl J Med. 2011;365:2473-83. 198. Perren TJ, Swart AM, Pfisterer J, Ledermann JA, Pujade-Lauraine E, Kristensen G, et al. A phase 3 trial of bevacizumab in ovarian cancer. N Engl J Med. 2011;365:2484-96.
169

199. Oza AM, Cook AD, Pfisterer J, Embleton A, Ledermann JA, Pujade-Lauraine E, et al. Standard chemotherapy with or without bevacizumab for women with newly diagnosed ovarian cancer (ICON7): overall survival results of a phase 3 randomised trial. Lancet Oncol. 2015;16:928-36. 200. Coleman RL, Burger RA, Brady M, Bookman MA, Fowler J, Birrer M, et al. Analysis of survivorship in high-risk patients on treated on GOG-218. Gynecol Oncol. 2013;130:e112-3. 201. Aghajanian C, Blank SV, Goff BA, Judson PL, Teneriello MG, Husain A, et al. OCEANS: a randomized, double-blind, placebo-controlled phase III trial of chemotherapy with or without bevacizumab in patients with platinum-sensitive recurrent epithelial ovarian, primary peritoneal, or fallopian tube cancer. J Clin Oncol. 2012;30:2039-45. 202. Stockler MR, Hilpert F, Friedlander M, King MT, Wenzel L, Lee CK, et al. Patient-reported outcome results from the open-label phase III AURELIA trial evaluating bevacizumab-containing therapy for platinum-resistant ovarian cancer. J Clin Oncol. 2014;32:1309-16. 203. Gourley C, McCavigan A, Perren T, Paul J, Michie CO, Churchman M, et al. Molecular subgroup of high-grade serous ovarian cancer (HGSOC) as a predictor of outcome following bevacizumab. J Clin Oncol. 2014;32:Abstr 5502. 204. Winterhoff BJN, Kommoss S, Oberg AL, Wang C, Riska SM, Konecny GE, et al. Bevacizumab and improvement of progression-free survival (PFS) for patients with the mesenchymal molecular subtype of ovarian cancer. J Clin Oncol. 2014;32:Abstr 5509. 205. Mitamura T, Gourley C, Sood AK. Prediction of anti-angiogenesis escape. Gynecol Oncol. 2016;141:80-5. 206. Alberts DS, Liu PY, Wilczynski SP, Jang A, Moon J, Ward JH, et al. Phase II trial of imatinib mesylate in recurrent, biomarker positive, ovarian cancer (Southwest Oncology Group Protocol S0211). Int J Gynecol Cancer. 2007;17:784-8. 207. Matei D, Emerson RE, Schilder J, Menning N, Baldridge LA, Johnson CS, et al. Imatinib mesylate in combination with docetaxel for the treatment of patients with advanced, platinum-resistant ovarian cancer and primary peritoneal carcinomatosis : a Hoosier Oncology Group trial. Cancer. 2008;113:723-32. 208. Yap TA, Carden CP, Kaye SB. Beyond chemotherapy: targeted therapies in ovarian cancer. Nat Rev Cancer. 2009;9:167-81. 209. Biagi JJ, Oza AM, Chalchal HI, Grimshaw R, Ellard SL, Lee U, et al. A phase II study of sunitinib in patients with recurrent epithelial ovarian and primary peritoneal carcinoma: an NCIC Clinical Trials Group Study. Ann Oncol. 2011;22:335-40. 210. Vergote IB, Jimeno A, Joly F, Katsaros D, Coens C, Despierre E, et al. Randomized phase III study of erlotinib versus observation in patients with no evidence of disease progression after first-line platin-based chemotherapy for ovarian carcinoma: a European Organisation for Research and Treatment of Cancer-Gynaecological Cancer Group, and Gynecologic Cancer Intergroup study. J Clin Oncol. 2014;32:320-6. 211. Toffoli G, Cernigoi C, Russo A, Gallo A, Bagnoli M, Boiocchi M. Overexpression of folate binding protein in ovarian cancers. Int J Cancer. 1997;74:193-8. 212. Elnakat H, Ratnam M. Role of folate receptor genes in reproduction and related cancers. Front Biosci. 2006;11:506-19. 213. Naumann RW, Coleman RL, Burger RA, Sausville EA, Kutarska E, Ghamande SA, et al. PRECEDENT: a randomized phase II trial comparing vintafolide (EC145) and pegylated liposomal doxorubicin (PLD) in combination versus PLD alone in patients with platinum-resistant ovarian cancer. J Clin Oncol. 2013;31:4400-6. 214. Armstrong DK, White AJ, Weil SC, Phillips M, Coleman RL. Farletuzumab (a monoclonal antibody against folate receptor alpha) in relapsed platinum-sensitive ovarian cancer. Gynecol Oncol. 2013;129:452-8. 215. Vergote I, Armstrong D, Scambia G, Teneriello M, Sehouli J, Schweizer C, et al. A Randomized, Double-Blind, Placebo-Controlled, Phase III Study to Assess Efficacy and Safety of Weekly Farletuzumab in Combination With Carboplatin and Taxane in Patients With Ovarian Cancer in First Platinum-Sensitive Relapse. J Clin Oncol. 2016;34:2271-8. 216. Reddy JA, Dorton R, Westrick E, Dawson A, Smith T, Xu LC, et al. Preclinical evaluation of EC145, a folate-vinca alkaloid conjugate. Cancer Res. 2007;67:4434-42. 217. Ledermann JA, Canevari S, Thigpen T. Targeting the folate receptor: diagnostic and therapeutic approaches to personalize cancer treatments. Ann Oncol. 2015;26:2034-43. 218. Dickson D. Wellcome funds cancer database. Nature. 1999;401:729. 219. Collins FS, Barker AD. Mapping the cancer genome. Pinpointing the genes involved in cancer will help chart a new course across the complex landscape of human malignancies. Sci Am. 2007;296:50-7. 220. International Cancer Genome C, Hudson TJ, Anderson W, Artez A, Barker AD, Bell C, et al. International network of cancer genome projects. Nature. 2010;464:993-8. 221. Stratton MR, Campbell PJ, Futreal PA. The cancer genome. Nature. 2009;458:719-24.
170

222. Vogelstein B, Papadopoulos N, Velculescu VE, Zhou S, Diaz LA, Jr., Kinzler KW. Cancer genome landscapes. Science. 2013;339:1546-58. 223. Greenman C, Stephens P, Smith R, Dalgliesh GL, Hunter C, Bignell G, et al. Patterns of somatic mutation in human cancer genomes. Nature. 2007;446:153-8. 224. DePinho RA. The age of cancer. Nature. 2000;408:248-54. 225. Alexandrov LB, Nik-Zainal S, Wedge DC, Aparicio SA, Behjati S, Biankin AV, et al. Signatures of mutational processes in human cancer. Nature. 2013;500:415-21. 226. Macconaill LE, Garraway LA. Clinical implications of the cancer genome. J Clin Oncol. 2010;28:5219-28. 227. Chapman PB, Hauschild A, Robert C, Haanen JB, Ascierto P, Larkin J, et al. Improved survival with vemurafenib in melanoma with BRAF V600E mutation. N Engl J Med. 2011;364:2507-16. 228. Mok TS, Wu YL, Thongprasert S, Yang CH, Chu DT, Saijo N, et al. Gefitinib or carboplatin-paclitaxel in pulmonary adenocarcinoma. N Engl J Med. 2009;361:947-57. 229. Lawrence MS, Stojanov P, Polak P, Kryukov GV, Cibulskis K, Sivachenko A, et al. Mutational heterogeneity in cancer and the search for new cancer-associated genes. Nature. 2013;499:214-8. 230. Cancer Genome Atlas Research N. Integrated genomic analyses of ovarian carcinoma. Nature. 2011;474:609-15. 231. Patch AM, Christie EL, Etemadmoghadam D, Garsed DW, George J, Fereday S, et al. Whole-genome characterization of chemoresistant ovarian cancer. Nature. 2015;521:489-94. 232. Liu J, Westin SN. Rational selection of biomarker driven therapies for gynecologic cancers: The more we know, the more we know we don't know. Gynecol Oncol. 2016;141:65-71. 233. Vogelstein B, Lane D, Levine AJ. Surfing the p53 network. Nature. 2000;408:307-10. 234. Kandoth C, McLellan MD, Vandin F, Ye K, Niu B, Lu C, et al. Mutational landscape and significance across 12 major cancer types. Nature. 2013;502:333-9. 235. Hall J, Paul J, Brown R. Critical evaluation of p53 as a prognostic marker in ovarian cancer. Expert Rev Mol Med. 2004;6:1-20. 236. Ahmed AA, Etemadmoghadam D, Temple J, Lynch AG, Riad M, Sharma R, et al. Driver mutations in TP53 are ubiquitous in high grade serous carcinoma of the ovary. J Pathol. 2010;221:49-56. 237. Vang R, Levine DA, Soslow RA, Zaloudek C, Shih Ie M, Kurman RJ. Molecular Alterations of TP53 are a Defining Feature of Ovarian High-Grade Serous Carcinoma: A Rereview of Cases Lacking TP53 Mutations in The Cancer Genome Atlas Ovarian Study. Int J Gynecol Pathol. 2016;35:48-55. 238. Brosh R, Rotter V. When mutants gain new powers: news from the mutant p53 field. Nat Rev Cancer. 2009;9:701-13. 239. Petitjean A, Mathe E, Kato S, Ishioka C, Tavtigian SV, Hainaut P, et al. Impact of mutant p53 functional properties on TP53 mutation patterns and tumor phenotype: lessons from recent developments in the IARC TP53 database. Hum Mutat. 2007;28:622-9. 240. Milner J, Medcalf EA. Cotranslation of activated mutant p53 with wild type drives the wild-type p53 protein into the mutant conformation. Cell. 1991;65:765-74. 241. Sigal A, Rotter V. Oncogenic mutations of the p53 tumor suppressor: the demons of the guardian of the genome. Cancer Res. 2000;60:6788-93. 242. Kato S, Han SY, Liu W, Otsuka K, Shibata H, Kanamaru R, et al. Understanding the function-structure and function-mutation relationships of p53 tumor suppressor protein by high-resolution missense mutation analysis. Proc Natl Acad Sci U S A. 2003;100:8424-9. 243. Dittmer D, Pati S, Zambetti G, Chu S, Teresky AK, Moore M, et al. Gain of function mutations in p53. Nat Genet. 1993;4:42-6. 244. Muller PA, Vousden KH. Mutant p53 in cancer: new functions and therapeutic opportunities. Cancer Cell. 2014;25:304-17. 245. Kobel M, Reuss A, du Bois A, Kommoss S, Kommoss F, Gao D, et al. The biological and clinical value of p53 expression in pelvic high-grade serous carcinomas. J Pathol. 2010;222:191-8. 246. Cole AJ, Dwight T, Gill AJ, Dickson KA, Zhu Y, Clarkson A, et al. Assessing mutant p53 in primary high-grade serous ovarian cancer using immunohistochemistry and massively parallel sequencing. Sci Rep. 2016;6:26191. 247. Kobel M, Rahimi K, Rambau PF, Naugler C, Le Page C, Meunier L, et al. An Immunohistochemical Algorithm for Ovarian Carcinoma Typing. Int J Gynecol Pathol. 2016;35:430-41. 248. Fransson A, Glaessgen D, Alfredsson J, Wiman KG, Bajalica-Lagercrantz S, Mohell N. Strong synergy with APR-246 and DNA-damaging drugs in primary cancer cells from patients with TP53 mutant High-Grade Serous ovarian cancer. J Ovarian Res. 2016;9:27. 249. Gourley C, Green J, Gabra H, Vergote I, Basu B, Brenton JD, et al. PISARRO: A EUTROC phase Ib study of APR-246 in combination with carboplatin (C) and pegylated liposomal doxorubicin (PLD) in platinum sensitive relapsed high grade serous ovarian cancer (HGSOC). J Clin Oncol. 2016;34:suppl; Abstr 5571.
171

250. Miki Y, Swensen J, Shattuck-Eidens D, Futreal PA, Harshman K, Tavtigian S, et al. A strong candidate for the breast and ovarian cancer susceptibility gene BRCA1. Science. 1994;266:66-71. 251. Wooster R, Bignell G, Lancaster J, Swift S, Seal S, Mangion J, et al. Identification of the breast cancer susceptibility gene BRCA2. Nature. 1995;378:789-92. 252. Curtin NJ. DNA repair dysregulation from cancer driver to therapeutic target. Nat Rev Cancer. 2012;12:801-17. 253. Mehta A, Haber JE. Sources of DNA double-strand breaks and models of recombinational DNA repair. Cold Spring Harb Perspect Biol. 2014;6:a016428. 254. Valerie K, Povirk LF. Regulation and mechanisms of mammalian double-strand break repair. Oncogene. 2003;22:5792-812. 255. Krejci L, Altmannova V, Spirek M, Zhao X. Homologous recombination and its regulation. Nucleic Acids Res. 2012;40:5795-818. 256. Walsh CS. Two decades beyond BRCA1/2: Homologous recombination, hereditary cancer risk and a target for ovarian cancer therapy. Gynecol Oncol. 2015;137:343-50. 257. Deans AJ, West SC. DNA interstrand crosslink repair and cancer. Nat Rev Cancer. 2011;11:467-80. 258. Alsop K, Fereday S, Meldrum C, deFazio A, Emmanuel C, George J, et al. BRCA mutation frequency and patterns of treatment response in BRCA mutation-positive women with ovarian cancer: a report from the Australian Ovarian Cancer Study Group. J Clin Oncol. 2012;30:2654-63. 259. Rubin SC, Benjamin I, Behbakht K, Takahashi H, Morgan MA, LiVolsi VA, et al. Clinical and pathological features of ovarian cancer in women with germ-line mutations of BRCA1. N Engl J Med. 1996;335:1413-6. 260. Pal T, Permuth-Wey J, Betts JA, Krischer JP, Fiorica J, Arango H, et al. BRCA1 and BRCA2 mutations account for a large proportion of ovarian carcinoma cases. Cancer. 2005;104:2807-16. 261. Risch HA, McLaughlin JR, Cole DE, Rosen B, Bradley L, Fan I, et al. Population BRCA1 and BRCA2 mutation frequencies and cancer penetrances: a kin-cohort study in Ontario, Canada. J Natl Cancer Inst. 2006;98:1694-706. 262. Bolton KL, Chenevix-Trench G, Goh C, Sadetzki S, Ramus SJ, Karlan BY, et al. Association between BRCA1 and BRCA2 mutations and survival in women with invasive epithelial ovarian cancer. JAMA. 2012;307:382-90. 263. Demsky R, McCuaig J, Maganti M, Murphy KJ, Rosen B, Armel SR. Keeping it simple: genetics referrals for all invasive serous ovarian cancers. Gynecol Oncol. 2013;130:329-33. 264. Robson ME, Bradbury AR, Arun B, Domchek SM, Ford JM, Hampel HL, et al. American Society of Clinical Oncology Policy Statement Update: Genetic and Genomic Testing for Cancer Susceptibility. J Clin Oncol. 2015;33:3660-7. 265. George A, Riddell D, Seal S, Talukdar S, Mahamdallie S, Ruark E, et al. Implementing rapid, robust, cost-effective, patient-centred, routine genetic testing in ovarian cancer patients. Sci Rep. 2016;6:29506. 266. Rebbeck TR, Mitra N, Wan F, Sinilnikova OM, Healey S, McGuffog L, et al. Association of type and location of BRCA1 and BRCA2 mutations with risk of breast and ovarian cancer. JAMA. 2015;313:1347-61. 267. Risch HA, McLaughlin JR, Cole DE, Rosen B, Bradley L, Kwan E, et al. Prevalence and penetrance of germline BRCA1 and BRCA2 mutations in a population series of 649 women with ovarian cancer. Am J Hum Genet. 2001;68:700-10. 268. Antoniou A, Pharoah PD, Narod S, Risch HA, Eyfjord JE, Hopper JL, et al. Average risks of breast and ovarian cancer associated with BRCA1 or BRCA2 mutations detected in case Series unselected for family history: a combined analysis of 22 studies. Am J Hum Genet. 2003;72:1117-30. 269. Kurian AW, Sigal BM, Plevritis SK. Survival analysis of cancer risk reduction strategies for BRCA1/2 mutation carriers. J Clin Oncol. 2010;28:222-31. 270. Finch AP, Lubinski J, Moller P, Singer CF, Karlan B, Senter L, et al. Impact of oophorectomy on cancer incidence and mortality in women with a BRCA1 or BRCA2 mutation. J Clin Oncol. 2014;32:1547-53. 271. Bradbury AR, Ibe CN, Dignam JJ, Cummings SA, Verp M, White MA, et al. Uptake and timing of bilateral prophylactic salpingo-oophorectomy among BRCA1 and BRCA2 mutation carriers. Genet Med. 2008;10:161-6. 272. Kwon JS, Tinker A, Pansegrau G, McAlpine J, Housty M, McCullum M, et al. Prophylactic salpingectomy and delayed oophorectomy as an alternative for BRCA mutation carriers. Obstet Gynecol. 2013;121:14-24. 273. Collins IM, Domchek SM, Huntsman DG, Mitchell G. The tubal hypothesis of ovarian cancer: caution needed. Lancet Oncol. 2011;12:1089-91. 274. Narod SA. Salpingectomy to prevent ovarian cancer: A Countercurrents Series. Curr Oncol. 2013;20:145-7. 275. Harmsen MG, Arts-de Jong M, Hoogerbrugge N, Maas AH, Prins JB, Bulten J, et al. Early salpingectomy (TUbectomy) with delayed oophorectomy to improve quality of life as alternative for risk-
172

reducing salpingo-oophorectomy in BRCA1/2 mutation carriers (TUBA study): a prospective non-randomised multicentre study. BMC Cancer. 2015;15:593. 276. Meindl A, Hellebrand H, Wiek C, Erven V, Wappenschmidt B, Niederacher D, et al. Germline mutations in breast and ovarian cancer pedigrees establish RAD51C as a human cancer susceptibility gene. Nat Genet. 2010;42:410-4. 277. Loveday C, Turnbull C, Ramsay E, Hughes D, Ruark E, Frankum JR, et al. Germline mutations in RAD51D confer susceptibility to ovarian cancer. Nat Genet. 2011;43:879-82. 278. Rafnar T, Gudbjartsson DF, Sulem P, Jonasdottir A, Sigurdsson A, Jonasdottir A, et al. Mutations in BRIP1 confer high risk of ovarian cancer. Nat Genet. 2011;43:1104-7. 279. Walsh T, Casadei S, Lee MK, Pennil CC, Nord AS, Thornton AM, et al. Mutations in 12 genes for inherited ovarian, fallopian tube, and peritoneal carcinoma identified by massively parallel sequencing. Proc Natl Acad Sci U S A. 2011;108:18032-7. 280. Pennington KP, Walsh T, Harrell MI, Lee MK, Pennil CC, Rendi MH, et al. Germline and somatic mutations in homologous recombination genes predict platinum response and survival in ovarian, fallopian tube, and peritoneal carcinomas. Clin Cancer Res. 2014;20:764-75. 281. Minion LE, Dolinsky JS, Chase DM, Dunlop CL, Chao EC, Monk BJ. Hereditary predisposition to ovarian cancer, looking beyond BRCA1/BRCA2. Gynecol Oncol. 2015;137:86-92. 282. Song H, Dicks E, Ramus SJ, Tyrer JP, Intermaggio MP, Hayward J, et al. Contribution of Germline Mutations in the RAD51B, RAD51C, and RAD51D Genes to Ovarian Cancer in the Population. J Clin Oncol. 2015;33:2901-7. 283. Norquist BM, Harrell MI, Brady MF, Walsh T, Lee MK, Gulsuner S, et al. Inherited Mutations in Women With Ovarian Carcinoma. JAMA Oncol. 2016;2:482-90. 284. Stoffel EM, Fearon ER. Germline Sequence Variants and Ovarian Cancer: Known-Knowns and Known-Unknowns. JAMA Oncol. 2016;2:491-2. 285. Hennessy BT, Timms KM, Carey MS, Gutin A, Meyer LA, Flake DD, 2nd, et al. Somatic mutations in BRCA1 and BRCA2 could expand the number of patients that benefit from poly (ADP ribose) polymerase inhibitors in ovarian cancer. J Clin Oncol. 2010;28:3570-6. 286. Baldwin RL, Nemeth E, Tran H, Shvartsman H, Cass I, Narod S, et al. BRCA1 promoter region hypermethylation in ovarian carcinoma: a population-based study. Cancer Res. 2000;60:5329-33. 287. Esteller M, Silva JM, Dominguez G, Bonilla F, Matias-Guiu X, Lerma E, et al. Promoter hypermethylation and BRCA1 inactivation in sporadic breast and ovarian tumors. J Natl Cancer Inst. 2000;92:564-9. 288. Ruscito I, Dimitrova D, Vasconcelos I, Gellhaus K, Schwachula T, Bellati F, et al. BRCA1 gene promoter methylation status in high-grade serous ovarian cancer patients--a study of the tumour Bank ovarian cancer (TOC) and ovarian cancer diagnosis consortium (OVCAD). Eur J Cancer. 2014;50:2090-8. 289. Konstantinopoulos PA, Ceccaldi R, Shapiro GI, D'Andrea AD. Homologous Recombination Deficiency: Exploiting the Fundamental Vulnerability of Ovarian Cancer. Cancer Discov. 2015;5:1137-54. 290. Hughes-Davies L, Huntsman D, Ruas M, Fuks F, Bye J, Chin SF, et al. EMSY links the BRCA2 pathway to sporadic breast and ovarian cancer. Cell. 2003;115:523-35. 291. Brown LA, Kalloger SE, Miller MA, Shih Ie M, McKinney SE, Santos JL, et al. Amplification of 11q13 in ovarian carcinoma. Genes Chromosomes Cancer. 2008;47:481-9. 292. Turner N, Tutt A, Ashworth A. Hallmarks of 'BRCAness' in sporadic cancers. Nat Rev Cancer. 2004;4:814-9. 293. Tan DS, Rothermundt C, Thomas K, Bancroft E, Eeles R, Shanley S, et al. "BRCAness" syndrome in ovarian cancer: a case-control study describing the clinical features and outcome of patients with epithelial ovarian cancer associated with BRCA1 and BRCA2 mutations. J Clin Oncol. 2008;26:5530-6. 294. Safra T, Borgato L, Nicoletto MO, Rolnitzky L, Pelles-Avraham S, Geva R, et al. BRCA mutation status and determinant of outcome in women with recurrent epithelial ovarian cancer treated with pegylated liposomal doxorubicin. Mol Cancer Ther. 2011;10:2000-7. 295. Kaye SB, Lubinski J, Matulonis U, Ang JE, Gourley C, Karlan BY, et al. Phase II, open-label, randomized, multicenter study comparing the efficacy and safety of olaparib, a poly (ADP-ribose) polymerase inhibitor, and pegylated liposomal doxorubicin in patients with BRCA1 or BRCA2 mutations and recurrent ovarian cancer. J Clin Oncol. 2012;30:372-9. 296. Candido-dos-Reis FJ, Song H, Goode EL, Cunningham JM, Fridley BL, Larson MC, et al. Germline mutation in BRCA1 or BRCA2 and ten-year survival for women diagnosed with epithelial ovarian cancer. Clin Cancer Res. 2015;21:652-7. 297. Soslow RA, Han G, Park KJ, Garg K, Olvera N, Spriggs DR, et al. Morphologic patterns associated with BRCA1 and BRCA2 genotype in ovarian carcinoma. Mod Pathol. 2012;25:625-36.
173

298. George J, Alsop K, Etemadmoghadam D, Hondow H, Mikeska T, Dobrovic A, et al. Nonequivalent gene expression and copy number alterations in high-grade serous ovarian cancers with BRCA1 and BRCA2 mutations. Clin Cancer Res. 2013;19:3474-84. 299. Strickland KC, Howitt BE, Shukla SA, Rodig S, Ritterhouse LL, Liu JF, et al. Association and prognostic significance of BRCA1/2-mutation status with neoantigen load, number of tumor-infiltrating lymphocytes and expression of PD-1/PD-L1 in high grade serous ovarian cancer. Oncotarget. 2016;7:13587-98. 300. Zhang L, Conejo-Garcia JR, Katsaros D, Gimotty PA, Massobrio M, Regnani G, et al. Intratumoral T cells, recurrence, and survival in epithelial ovarian cancer. N Engl J Med. 2003;348:203-13. 301. Adams SF, Levine DA, Cadungog MG, Hammond R, Facciabene A, Olvera N, et al. Intraepithelial T cells and tumor proliferation: impact on the benefit from surgical cytoreduction in advanced serous ovarian cancer. Cancer. 2009;115:2891-902. 302. Hwang WT, Adams SF, Tahirovic E, Hagemann IS, Coukos G. Prognostic significance of tumor-infiltrating T cells in ovarian cancer: a meta-analysis. Gynecol Oncol. 2012;124:192-8. 303. Bachmayr-Heyda A, Aust S, Heinze G, Polterauer S, Grimm C, Braicu EI, et al. Prognostic impact of tumor infiltrating CD8+ T cells in association with cell proliferation in ovarian cancer patients--a study of the OVCAD consortium. BMC Cancer. 2013;13:422. 304. Farmer H, McCabe N, Lord CJ, Tutt AN, Johnson DA, Richardson TB, et al. Targeting the DNA repair defect in BRCA mutant cells as a therapeutic strategy. Nature. 2005;434:917-21. 305. Bryant HE, Schultz N, Thomas HD, Parker KM, Flower D, Lopez E, et al. Specific killing of BRCA2-deficient tumours with inhibitors of poly(ADP-ribose) polymerase. Nature. 2005;434:913-7. 306. Fong PC, Boss DS, Yap TA, Tutt A, Wu P, Mergui-Roelvink M, et al. Inhibition of poly(ADP-ribose) polymerase in tumors from BRCA mutation carriers. N Engl J Med. 2009;361:123-34. 307. Audeh MW, Carmichael J, Penson RT, Friedlander M, Powell B, Bell-McGuinn KM, et al. Oral poly(ADP-ribose) polymerase inhibitor olaparib in patients with BRCA1 or BRCA2 mutations and recurrent ovarian cancer: a proof-of-concept trial. Lancet. 2010;376:245-51. 308. Gelmon KA, Tischkowitz M, Mackay H, Swenerton K, Robidoux A, Tonkin K, et al. Olaparib in patients with recurrent high-grade serous or poorly differentiated ovarian carcinoma or triple-negative breast cancer: a phase 2, multicentre, open-label, non-randomised study. Lancet Oncol. 2011;12:852-61. 309. Ledermann J, Harter P, Gourley C, Friedlander M, Vergote I, Rustin G, et al. Olaparib maintenance therapy in platinum-sensitive relapsed ovarian cancer. N Engl J Med. 2012;366:1382-92. 310. O'Shaughnessy J, Osborne C, Pippen JE, Yoffe M, Patt D, Rocha C, et al. Iniparib plus chemotherapy in metastatic triple-negative breast cancer. N Engl J Med. 2011;364:205-14. 311. Patel AG, De Lorenzo SB, Flatten KS, Poirier GG, Kaufmann SH. Failure of iniparib to inhibit poly(ADP-Ribose) polymerase in vitro. Clin Cancer Res. 2012;18:1655-62. 312. Ledermann J, Harter P, Gourley C, Friedlander M, Vergote I, Rustin G, et al. Olaparib maintenance therapy in patients with platinum-sensitive relapsed serous ovarian cancer: a preplanned retrospective analysis of outcomes by BRCA status in a randomised phase 2 trial. Lancet Oncol. 2014;15:852-61. 313. Ledermann JA, Harter P, Gourley C, Friedlander M, Vergote I, Rustin G, et al. Overall survival in patients with platinum-sensitive recurrent serous ovarian cancer receiving olaparib maintenance monotherapy: an updated analysis from a randomised, placebo-controlled, double-blind, phase 2 trial. Lancet Oncol. 2016;17:1579-89. 314. Matulonis UA, Harter P, Gourley C, Friedlander M, Vergote I, Rustin G, et al. Olaparib maintenance therapy in patients with platinum-sensitive, relapsed serous ovarian cancer and a BRCA mutation: Overall survival adjusted for postprogression poly(adenosine diphosphate ribose) polymerase inhibitor therapy. Cancer. 2016;122:1844-52. 315. Scott CL, Swisher EM, Kaufmann SH. Poly (ADP-ribose) polymerase inhibitors: recent advances and future development. J Clin Oncol. 2015;33:1397-406. 316. Fong PC, Yap TA, Boss DS, Carden CP, Mergui-Roelvink M, Gourley C, et al. Poly(ADP)-ribose polymerase inhibition: frequent durable responses in BRCA carrier ovarian cancer correlating with platinum-free interval. J Clin Oncol. 2010;28:2512-9. 317. Konstantinopoulos PA, Spentzos D, Karlan BY, Taniguchi T, Fountzilas E, Francoeur N, et al. Gene expression profile of BRCAness that correlates with responsiveness to chemotherapy and with outcome in patients with epithelial ovarian cancer. J Clin Oncol. 2010;28:3555-61. 318. Weberpals JI, Tu D, Squire JA, Amin MS, Islam S, Pelletier LB, et al. Breast cancer 1 (BRCA1) protein expression as a prognostic marker in sporadic epithelial ovarian carcinoma: an NCIC CTG OV.16 correlative study. Ann Oncol. 2011;22:2403-10. 319. Kang J, D'Andrea AD, Kozono D. A DNA repair pathway-focused score for prediction of outcomes in ovarian cancer treated with platinum-based chemotherapy. J Natl Cancer Inst. 2012;104:670-81. 320. Wang ZC, Birkbak NJ, Culhane AC, Drapkin R, Fatima A, Tian R, et al. Profiles of genomic instability in high-grade serous ovarian cancer predict treatment outcome. Clin Cancer Res. 2012;18:5806-15.
174

321. Watkins JA, Irshad S, Grigoriadis A, Tutt AN. Genomic scars as biomarkers of homologous recombination deficiency and drug response in breast and ovarian cancers. Breast Cancer Res. 2014;16:211. 322. Abkevich V, Timms KM, Hennessy BT, Potter J, Carey MS, Meyer LA, et al. Patterns of genomic loss of heterozygosity predict homologous recombination repair defects in epithelial ovarian cancer. Br J Cancer. 2012;107:1776-82. 323. Birkbak NJ, Wang ZC, Kim JY, Eklund AC, Li Q, Tian R, et al. Telomeric allelic imbalance indicates defective DNA repair and sensitivity to DNA-damaging agents. Cancer Discov. 2012;2:366-75. 324. Popova T, Manie E, Rieunier G, Caux-Moncoutier V, Tirapo C, Dubois T, et al. Ploidy and large-scale genomic instability consistently identify basal-like breast carcinomas with BRCA1/2 inactivation. Cancer Res. 2012;72:5454-62. 325. Swisher EM, Lin KK, Oza AM, Scott CL, Giordano H, Sun J, et al. Rucaparib in relapsed, platinum-sensitive high-grade ovarian carcinoma (ARIEL2 Part 1): an international, multicentre, open-label, phase 2 trial. Lancet Oncol. 2017;18:75-87. 326. Telli ML, Jensen KC, Vinayak S, Kurian AW, Lipson JA, Flaherty PJ, et al. Phase II Study of Gemcitabine, Carboplatin, and Iniparib As Neoadjuvant Therapy for Triple-Negative and BRCA1/2 Mutation-Associated Breast Cancer With Assessment of a Tumor-Based Measure of Genomic Instability: PrECOG 0105. J Clin Oncol. 2015;33:1895-901. 327. Telli ML, Timms KM, Reid J, Hennessy B, Mills GB, Jensen KC, et al. Homologous Recombination Deficiency (HRD) Score Predicts Response to Platinum-Containing Neoadjuvant Chemotherapy in Patients with Triple-Negative Breast Cancer. Clin Cancer Res. 2016;22:3764-73. 328. Stover EH, Konstantinopoulos PA, Matulonis UA, Swisher EM. Biomarkers of Response and Resistance to DNA Repair Targeted Therapies. Clin Cancer Res. 2016;22:5651-60. 329. Mirza MR, Monk BJ, Herrstedt J, Oza AM, Mahner S, Redondo A, et al. Niraparib Maintenance Therapy in Platinum-Sensitive, Recurrent Ovarian Cancer. N Engl J Med. 2016;375:2154-64. 330. Spriggs DR, Longo DL. PARP Inhibitors in Ovarian Cancer Treatment. N Engl J Med. 2016;375:2197-8. 331. Sakai W, Swisher EM, Karlan BY, Agarwal MK, Higgins J, Friedman C, et al. Secondary mutations as a mechanism of cisplatin resistance in BRCA2-mutated cancers. Nature. 2008;451:1116-20. 332. Edwards SL, Brough R, Lord CJ, Natrajan R, Vatcheva R, Levine DA, et al. Resistance to therapy caused by intragenic deletion in BRCA2. Nature. 2008;451:1111-5. 333. Swisher EM, Sakai W, Karlan BY, Wurz K, Urban N, Taniguchi T. Secondary BRCA1 mutations in BRCA1-mutated ovarian carcinomas with platinum resistance. Cancer Res. 2008;68:2581-6. 334. Sakai W, Swisher EM, Jacquemont C, Chandramohan KV, Couch FJ, Langdon SP, et al. Functional restoration of BRCA2 protein by secondary BRCA2 mutations in BRCA2-mutated ovarian carcinoma. Cancer Res. 2009;69:6381-6. 335. Lord CJ, Ashworth A. Mechanisms of resistance to therapies targeting BRCA-mutant cancers. Nat Med. 2013;19:1381-8. 336. Graeser M, McCarthy A, Lord CJ, Savage K, Hills M, Salter J, et al. A marker of homologous recombination predicts pathologic complete response to neoadjuvant chemotherapy in primary breast cancer. Clin Cancer Res. 2010;16:6159-68. 337. Chalasani P, Nagy D, Livingstone RB, Weterings E, Nagle R, Singh S, et al. Evaluating Rad51/geminin protein expression as an indicator of homologous recombination deficiency in breast cancer models. [abstract]. In: Proceedings of the Thirty-Eighth Annual CTRC-AACR San Antonio Breast Cancer Symposium: 2015 Dec 8-12; San Antonio, TX. Philadelphia (PA): AACR. Cancer Res. 2016;76(4 Suppl):Abstract nr P4-07-. 338. Liu JF, Barry WT, Birrer M, Lee JM, Buckanovich RJ, Fleming GF, et al. Combination cediranib and olaparib versus olaparib alone for women with recurrent platinum-sensitive ovarian cancer: a randomised phase 2 study. Lancet Oncol. 2014;15:1207-14. 339. Scambia G, Salutari V, Ferrandina G. Combining targeted therapies in ovarian cancer. Lancet Oncol. 2014;15:1179-81. 340. Beroukhim R, Mermel CH, Porter D, Wei G, Raychaudhuri S, Donovan J, et al. The landscape of somatic copy-number alteration across human cancers. Nature. 2010;463:899-905. 341. Ciriello G, Miller ML, Aksoy BA, Senbabaoglu Y, Schultz N, Sander C. Emerging landscape of oncogenic signatures across human cancers. Nat Genet. 2013;45:1127-33. 342. Rowley JD. Letter: A new consistent chromosomal abnormality in chronic myelogenous leukaemia identified by quinacrine fluorescence and Giemsa staining. Nature. 1973;243:290-3. 343. Shtivelman E, Lifshitz B, Gale RP, Canaani E. Fused transcript of abl and bcr genes in chronic myelogenous leukaemia. Nature. 1985;315:550-4.
175

344. Kantarjian H, Sawyers C, Hochhaus A, Guilhot F, Schiffer C, Gambacorti-Passerini C, et al. Hematologic and cytogenetic responses to imatinib mesylate in chronic myelogenous leukemia. N Engl J Med. 2002;346:645-52. 345. Garraway LA. Genomics-driven oncology: framework for an emerging paradigm. J Clin Oncol. 2013;31:1806-14. 346. Gorringe KL, Jacobs S, Thompson ER, Sridhar A, Qiu W, Choong DY, et al. High-resolution single nucleotide polymorphism array analysis of epithelial ovarian cancer reveals numerous microdeletions and amplifications. Clin Cancer Res. 2007;13:4731-9. 347. Cancer Genome Atlas N. Comprehensive molecular portraits of human breast tumours. Nature. 2012;490:61-70. 348. Cancer Genome Atlas Research N, Kandoth C, Schultz N, Cherniack AD, Akbani R, Liu Y, et al. Integrated genomic characterization of endometrial carcinoma. Nature. 2013;497:67-73. 349. Patel KJ, Yu VP, Lee H, Corcoran A, Thistlethwaite FC, Evans MJ, et al. Involvement of Brca2 in DNA repair. Mol Cell. 1998;1:347-57. 350. Xu X, Weaver Z, Linke SP, Li C, Gotay J, Wang XW, et al. Centrosome amplification and a defective G2-M cell cycle checkpoint induce genetic instability in BRCA1 exon 11 isoform-deficient cells. Mol Cell. 1999;3:389-95. 351. Venkitaraman AR. Linking the cellular functions of BRCA genes to cancer pathogenesis and treatment. Annu Rev Pathol. 2009;4:461-87. 352. Pennington KP, Walsh T, Lee M, Pennil C, Novetsky AP, Agnew KJ, et al. BRCA1, TP53, and CHEK2 germline mutations in uterine serous carcinoma. Cancer. 2013;119:332-8. 353. Frimer M, Levano KS, Rodriguez-Gabin A, Wang Y, Goldberg GL, Horwitz SB, et al. Germline mutations of the DNA repair pathways in uterine serous carcinoma. Gynecol Oncol. 2016;141:101-7. 354. Shu CA, Pike MC, Jotwani AR, Friebel TM, Soslow RA, Levine DA, et al. Uterine Cancer After Risk-Reducing Salpingo-oophorectomy Without Hysterectomy in Women With BRCA Mutations. JAMA Oncol. 2016;2:1434-40. 355. Etemadmoghadam D, deFazio A, Beroukhim R, Mermel C, George J, Getz G, et al. Integrated genome-wide DNA copy number and expression analysis identifies distinct mechanisms of primary chemoresistance in ovarian carcinomas. Clin Cancer Res. 2009;15:1417-27. 356. McBride DJ, Etemadmoghadam D, Cooke SL, Alsop K, George J, Butler A, et al. Tandem duplication of chromosomal segments is common in ovarian and breast cancer genomes. J Pathol. 2012;227:446-55. 357. Perou CM, Sorlie T, Eisen MB, van de Rijn M, Jeffrey SS, Rees CA, et al. Molecular portraits of human breast tumours. Nature. 2000;406:747-52. 358. Sorlie T, Perou CM, Tibshirani R, Aas T, Geisler S, Johnsen H, et al. Gene expression patterns of breast carcinomas distinguish tumor subclasses with clinical implications. Proc Natl Acad Sci U S A. 2001;98:10869-74. 359. Bhattacharjee A, Richards WG, Staunton J, Li C, Monti S, Vasa P, et al. Classification of human lung carcinomas by mRNA expression profiling reveals distinct adenocarcinoma subclasses. Proc Natl Acad Sci U S A. 2001;98:13790-5. 360. Tothill RW, Tinker AV, George J, Brown R, Fox SB, Lade S, et al. Novel molecular subtypes of serous and endometrioid ovarian cancer linked to clinical outcome. Clin Cancer Res. 2008;14:5198-208. 361. Helland A, Anglesio MS, George J, Cowin PA, Johnstone CN, House CM, et al. Deregulation of MYCN, LIN28B and LET7 in a molecular subtype of aggressive high-grade serous ovarian cancers. PLoS One. 2011;6:e18064. 362. Tan TZ, Miow QH, Huang RY, Wong MK, Ye J, Lau JA, et al. Functional genomics identifies five distinct molecular subtypes with clinical relevance and pathways for growth control in epithelial ovarian cancer. EMBO Mol Med. 2013;5:1051-66. 363. Konecny GE, Wang C, Hamidi H, Winterhoff B, Kalli KR, Dering J, et al. Prognostic and therapeutic relevance of molecular subtypes in high-grade serous ovarian cancer. J Natl Cancer Inst. 2014;106. 364. Verhaak RG, Tamayo P, Yang JY, Hubbard D, Zhang H, Creighton CJ, et al. Prognostically relevant gene signatures of high-grade serous ovarian carcinoma. J Clin Invest. 2013;123:517-25. 365. Leong HS, Galletta L, Etemadmoghadam D, George J, Australian Ovarian Cancer S, Kobel M, et al. Efficient molecular subtype classification of high-grade serous ovarian cancer. J Pathol. 2015;236:272-7. 366. Konecny GE, Winterhoff B, Wang C. Gene-expression signatures in ovarian cancer: Promise and challenges for patient stratification. Gynecol Oncol. 2016;141:379-85. 367. Wood LD, Parsons DW, Jones S, Lin J, Sjoblom T, Leary RJ, et al. The genomic landscapes of human breast and colorectal cancers. Science. 2007;318:1108-13. 368. Campbell PJ, Yachida S, Mudie LJ, Stephens PJ, Pleasance ED, Stebbings LA, et al. The patterns and dynamics of genomic instability in metastatic pancreatic cancer. Nature. 2010;467:1109-13.
176

369. Gerlinger M, Rowan AJ, Horswell S, Larkin J, Endesfelder D, Gronroos E, et al. Intratumor heterogeneity and branched evolution revealed by multiregion sequencing. N Engl J Med. 2012;366:883-92. 370. Khalique L, Ayhan A, Weale ME, Jacobs IJ, Ramus SJ, Gayther SA. Genetic intra-tumour heterogeneity in epithelial ovarian cancer and its implications for molecular diagnosis of tumours. J Pathol. 2007;211:286-95. 371. Bashashati A, Ha G, Tone A, Ding J, Prentice LM, Roth A, et al. Distinct evolutionary trajectories of primary high-grade serous ovarian cancers revealed through spatial mutational profiling. J Pathol. 2013;231:21-34. 372. Hoogstraat M, de Pagter MS, Cirkel GA, van Roosmalen MJ, Harkins TT, Duran K, et al. Genomic and transcriptomic plasticity in treatment-naive ovarian cancer. Genome Res. 2014;24:200-11. 373. Schwarz RF, Ng CK, Cooke SL, Newman S, Temple J, Piskorz AM, et al. Spatial and temporal heterogeneity in high-grade serous ovarian cancer: a phylogenetic analysis. PLoS Med. 2015;12:e1001789. 374. Fisher R, Pusztai L, Swanton C. Cancer heterogeneity: implications for targeted therapeutics. Br J Cancer. 2013;108:479-85. 375. Swanton C. Intratumor heterogeneity: evolution through space and time. Cancer Res. 2012;72:4875-82. 376. Blagden SP. Harnessing Pandemonium: The Clinical Implications of Tumor Heterogeneity in Ovarian Cancer. Front Oncol. 2015;5:149. 377. Lin L, Prescott MS, Zhu Z, Singh P, Chun SY, Kuick RD, et al. Identification and characterization of a 19q12 amplicon in esophageal adenocarcinomas reveals cyclin E as the best candidate gene for this amplicon. Cancer Res. 2000;60:7021-7. 378. Schraml P, Bucher C, Bissig H, Nocito A, Haas P, Wilber K, et al. Cyclin E overexpression and amplification in human tumours. J Pathol. 2003;200:375-82. 379. Gorringe KL, Boussioutas A, Bowtell DD, Melbourne Gastric Cancer Group PMMAF. Novel regions of chromosomal amplification at 6p21, 5p13, and 12q14 in gastric cancer identified by array comparative genomic hybridization. Genes Chromosomes Cancer. 2005;42:247-59. 380. Leung SY, Ho C, Tu IP, Li R, So S, Chu KM, et al. Comprehensive analysis of 19q12 amplicon in human gastric cancers. Mod Pathol. 2006;19:854-63. 381. Farley J, Smith LM, Darcy KM, Sobel E, O'Connor D, Henderson B, et al. Cyclin E expression is a significant predictor of survival in advanced, suboptimally debulked ovarian epithelial cancers: a Gynecologic Oncology Group study. Cancer Res. 2003;63:1235-41. 382. Engler DA, Gupta S, Growdon WB, Drapkin RI, Nitta M, Sergent PA, et al. Genome wide DNA copy number analysis of serous type ovarian carcinomas identifies genetic markers predictive of clinical outcome. PLoS One. 2012;7:e30996. 383. Sung CO, Song IH, Sohn I. A distinctive ovarian cancer molecular subgroup characterized by poor prognosis and somatic focal copy number amplifications at chromosome 19. Gynecol Oncol. 2014;132:343-50. 384. Theurillat JP, Metzler SC, Henzi N, Djouder N, Helbling M, Zimmermann AK, et al. URI is an oncogene amplified in ovarian cancer cells and is required for their survival. Cancer Cell. 2011;19:317-32. 385. Davis SJ, Sheppard KE, Pearson RB, Campbell IG, Gorringe KL, Simpson KJ. Functional analysis of genes in regions commonly amplified in high-grade serous and endometrioid ovarian cancer. Clin Cancer Res. 2013;19:1411-21. 386. Natrajan R, Mackay A, Wilkerson PM, Lambros MB, Wetterskog D, Arnedos M, et al. Functional characterization of the 19q12 amplicon in grade III breast cancers. Breast Cancer Res. 2012;14:R53. 387. Etemadmoghadam D, George J, Cowin PA, Cullinane C, Kansara M, Australian Ovarian Cancer Study G, et al. Amplicon-dependent CCNE1 expression is critical for clonogenic survival after cisplatin treatment and is correlated with 20q11 gain in ovarian cancer. PLoS One. 2010;5:e15498. 388. Nakayama N, Nakayama K, Shamima Y, Ishikawa M, Katagiri A, Iida K, et al. Gene amplification CCNE1 is related to poor survival and potential therapeutic target in ovarian cancer. Cancer. 2010;116:2621-34. 389. Noske A, Henricksen LA, LaFleur B, Zimmermann AK, Tubbs A, Singh S, et al. Characterization of the 19q12 amplification including CCNE1 and URI in different epithelial ovarian cancer subtypes. Exp Mol Pathol. 2015;98:47-54. 390. Siu KT, Rosner MR, Minella AC. An integrated view of cyclin E function and regulation. Cell Cycle. 2012;11:57-64. 391. Caldon CE, Musgrove EA. Distinct and redundant functions of cyclin E1 and cyclin E2 in development and cancer. Cell Div. 2010;5:2. 392. Satyanarayana A, Kaldis P. Mammalian cell-cycle regulation: several Cdks, numerous cyclins and diverse compensatory mechanisms. Oncogene. 2009;28:2925-39. 393. Aleem E, Kiyokawa H, Kaldis P. Cdc2-cyclin E complexes regulate the G1/S phase transition. Nat Cell Biol. 2005;7:831-6. 394. Odajima J, Wills ZP, Ndassa YM, Terunuma M, Kretschmannova K, Deeb TZ, et al. Cyclin E constrains Cdk5 activity to regulate synaptic plasticity and memory formation. Dev Cell. 2011;21:655-68.
177

395. Geng Y, Lee YM, Welcker M, Swanger J, Zagozdzon A, Winer JD, et al. Kinase-independent function of cyclin E. Mol Cell. 2007;25:127-39. 396. Bortner DM, Rosenberg MP. Induction of mammary gland hyperplasia and carcinomas in transgenic mice expressing human cyclin E. Mol Cell Biol. 1997;17:453-9. 397. Freemantle SJ, Dmitrovsky E. Cyclin E transgenic mice: discovery tools for lung cancer biology, therapy, and prevention. Cancer Prev Res (Phila). 2010;3:1513-8. 398. Geisen C, Moroy T. The oncogenic activity of cyclin E is not confined to Cdk2 activation alone but relies on several other, distinct functions of the protein. J Biol Chem. 2002;277:39909-18. 399. Keyomarsi K, Tucker SL, Buchholz TA, Callister M, Ding Y, Hortobagyi GN, et al. Cyclin E and survival in patients with breast cancer. N Engl J Med. 2002;347:1566-75. 400. Akli S, Keyomarsi K. Cyclin E and its low molecular weight forms in human cancer and as targets for cancer therapy. Cancer Biol Ther. 2003;2:S38-47. 401. Porter DC, Zhang N, Danes C, McGahren MJ, Harwell RM, Faruki S, et al. Tumor-specific proteolytic processing of cyclin E generates hyperactive lower-molecular-weight forms. Mol Cell Biol. 2001;21:6254-69. 402. Akli S, Zheng PJ, Multani AS, Wingate HF, Pathak S, Zhang N, et al. Tumor-specific low molecular weight forms of cyclin E induce genomic instability and resistance to p21, p27, and antiestrogens in breast cancer. Cancer Res. 2004;64:3198-208. 403. Bagheri-Yarmand R, Nanos-Webb A, Biernacka A, Bui T, Keyomarsi K. Cyclin E deregulation impairs mitotic progression through premature activation of Cdc25C. Cancer Res. 2010;70:5085-95. 404. Bagheri-Yarmand R, Biernacka A, Hunt KK, Keyomarsi K. Low molecular weight cyclin E overexpression shortens mitosis, leading to chromosome missegregation and centrosome amplification. Cancer Res. 2010;70:5074-84. 405. Davidson B, Skrede M, Silins I, Shih Ie M, Trope CG, Florenes VA. Low-molecular weight forms of cyclin E differentiate ovarian carcinoma from cells of mesothelial origin and are associated with poor survival in ovarian carcinoma. Cancer. 2007;110:1264-71. 406. Bales E, Mills L, Milam N, McGahren-Murray M, Bandyopadhyay D, Chen D, et al. The low molecular weight cyclin E isoforms augment angiogenesis and metastasis of human melanoma cells in vivo. Cancer Res. 2005;65:692-7. 407. Corin I, Di Giacomo MC, Lastella P, Bagnulo R, Guanti G, Simone C. Tumor-specific hyperactive low-molecular-weight cyclin E isoforms detection and characterization in non-metastatic colorectal tumors. Cancer Biol Ther. 2006;5:198-203. 408. Nanos-Webb A, Jabbour NA, Multani AS, Wingate H, Oumata N, Galons H, et al. Targeting low molecular weight cyclin E (LMW-E) in breast cancer. Breast Cancer Res Treat. 2012;132:575-88. 409. Inoue K, Fry EA. Novel Molecular Markers for Breast Cancer. Biomark Cancer. 2016;8:25-42. 410. Cerami E, Gao J, Dogrusoz U, Gross BE, Sumer SO, Aksoy BA, et al. The cBio cancer genomics portal: an open platform for exploring multidimensional cancer genomics data. Cancer Discov. 2012;2:401-4. 411. Gao J, Aksoy BA, Dogrusoz U, Dresdner G, Gross B, Sumer SO, et al. Integrative analysis of complex cancer genomics and clinical profiles using the cBioPortal. Sci Signal. 2013;6:pl1. 412. Karst AM, Jones PM, Vena N, Ligon AH, Liu JF, Hirsch MS, et al. Cyclin E1 deregulation occurs early in secretory cell transformation to promote formation of fallopian tube-derived high-grade serous ovarian cancers. Cancer Res. 2014;74:1141-52. 413. Koepp DM, Schaefer LK, Ye X, Keyomarsi K, Chu C, Harper JW, et al. Phosphorylation-dependent ubiquitination of cyclin E by the SCFFbw7 ubiquitin ligase. Science. 2001;294:173-7. 414. Strohmaier H, Spruck CH, Kaiser P, Won KA, Sangfelt O, Reed SI. Human F-box protein hCdc4 targets cyclin E for proteolysis and is mutated in a breast cancer cell line. Nature. 2001;413:316-22. 415. Kuhn E, Wu RC, Guan B, Wu G, Zhang J, Wang Y, et al. Identification of molecular pathway aberrations in uterine serous carcinoma by genome-wide analyses. J Natl Cancer Inst. 2012;104:1503-13. 416. Kuhn E, Wang TL, Doberstein K, Bahadirli-Talbott A, Ayhan A, Sehdev AS, et al. CCNE1 amplification and centrosome number abnormality in serous tubal intraepithelial carcinoma: further evidence supporting its role as a precursor of ovarian high-grade serous carcinoma. Mod Pathol. 2016;29:1254-61. 417. Sehdev AS, Kurman RJ, Kuhn E, Shih Ie M. Serous tubal intraepithelial carcinoma upregulates markers associated with high-grade serous carcinomas including Rsf-1 (HBXAP), cyclin E and fatty acid synthase. Mod Pathol. 2010;23:844-55. 418. Kuhn E, Bahadirli-Talbott A, Shih Ie M. Frequent CCNE1 amplification in endometrial intraepithelial carcinoma and uterine serous carcinoma. Mod Pathol. 2014;27:1014-9. 419. Yap TA, Gerlinger M, Futreal PA, Pusztai L, Swanton C. Intratumor heterogeneity: seeing the wood for the trees. Sci Transl Med. 2012;4:127ps10. 420. Galimberti F, Thompson SL, Liu X, Li H, Memoli V, Green SR, et al. Targeting the cyclin E-Cdk-2 complex represses lung cancer growth by triggering anaphase catastrophe. Clin Cancer Res. 2010;16:109-20.
178

421. Scaltriti M, Eichhorn PJ, Cortes J, Prudkin L, Aura C, Jimenez J, et al. Cyclin E amplification/overexpression is a mechanism of trastuzumab resistance in HER2+ breast cancer patients. Proc Natl Acad Sci U S A. 2011;108:3761-6. 422. Ciriello G, Cerami E, Sander C, Schultz N. Mutual exclusivity analysis identifies oncogenic network modules. Genome Res. 2012;22:398-406. 423. Ekholm-Reed S, Mendez J, Tedesco D, Zetterberg A, Stillman B, Reed SI. Deregulation of cyclin E in human cells interferes with prereplication complex assembly. J Cell Biol. 2004;165:789-800. 424. Kaelin WG, Jr. The concept of synthetic lethality in the context of anticancer therapy. Nat Rev Cancer. 2005;5:689-98. 425. Jacquemont C, Simon JA, D'Andrea AD, Taniguchi T. Non-specific chemical inhibition of the Fanconi anemia pathway sensitizes cancer cells to cisplatin. Mol Cancer. 2012;11:26. 426. Bang YJ, Van Cutsem E, Feyereislova A, Chung HC, Shen L, Sawaki A, et al. Trastuzumab in combination with chemotherapy versus chemotherapy alone for treatment of HER2-positive advanced gastric or gastro-oesophageal junction cancer (ToGA): a phase 3, open-label, randomised controlled trial. Lancet. 2010;376:687-97. 427. Van Cutsem E, Bang YJ, Feng-Yi F, Xu JM, Lee KW, Jiao SC, et al. HER2 screening data from ToGA: targeting HER2 in gastric and gastroesophageal junction cancer. Gastric Cancer. 2015;18:476-84. 428. Li J, Lupat R, Amarasinghe KC, Thompson ER, Doyle MA, Ryland GL, et al. CONTRA: copy number analysis for targeted resequencing. Bioinformatics. 2012;28:1307-13. 429. Frampton GM, Fichtenholtz A, Otto GA, Wang K, Downing SR, He J, et al. Development and validation of a clinical cancer genomic profiling test based on massively parallel DNA sequencing. Nat Biotechnol. 2013;31:1023-31. 430. Kondrashova O, Love CJ, Lunke S, Hsu AL, Australian Ovarian Cancer Study G, Waring PM, et al. High-Throughput Amplicon-Based Copy Number Detection of 11 Genes in Formalin-Fixed Paraffin-Embedded Ovarian Tumour Samples by MLPA-Seq. PLoS One. 2015;10:e0143006. 431. Gunderson CC, Rowland MR, Wright DL, Andrade KL, Mannel RS, McMeekin DS, et al. Initiation of a formalized precision medicine program in gynecologic oncology. Gynecol Oncol. 2016;141:24-8. 432. Wallbillich JJ, Forde B, Havrilesky LJ, Cohn DE. A personalized paradigm in the treatment of platinum-resistant ovarian cancer - A cost utility analysis of genomic-based versus cytotoxic therapy. Gynecol Oncol. 2016;142:144-9. 433. Shapiro GI. Cyclin-dependent kinase pathways as targets for cancer treatment. J Clin Oncol. 2006;24:1770-83. 434. Sedlacek H, Czech J, Naik R, Kaur G, Worland P, Losiewicz M, et al. Flavopiridol (L86 8275; NSC 649890), a new kinase inhibitor for tumor therapy. Int J Oncol. 1996;9:1143-68. 435. Whittaker SR, Walton MI, Garrett MD, Workman P. The Cyclin-dependent kinase inhibitor CYC202 (R-roscovitine) inhibits retinoblastoma protein phosphorylation, causes loss of Cyclin D1, and activates the mitogen-activated protein kinase pathway. Cancer Res. 2004;64:262-72. 436. Parry D, Guzi T, Shanahan F, Davis N, Prabhavalkar D, Wiswell D, et al. Dinaciclib (SCH 727965), a novel and potent cyclin-dependent kinase inhibitor. Mol Cancer Ther. 2010;9:2344-53. 437. Asghar U, Witkiewicz AK, Turner NC, Knudsen ES. The history and future of targeting cyclin-dependent kinases in cancer therapy. Nat Rev Drug Discov. 2015;14:130-46. 438. Payton M, Chung G, Yakowec P, Wong A, Powers D, Xiong L, et al. Discovery and evaluation of dual CDK1 and CDK2 inhibitors. Cancer Res. 2006;66:4299-308. 439. Mita MM, Joy AA, Mita A, Sankhala K, Jou YM, Zhang D, et al. Randomized phase II trial of the cyclin-dependent kinase inhibitor dinaciclib (MK-7965) versus capecitabine in patients with advanced breast cancer. Clin Breast Cancer. 2014;14:169-76. 440. Finn RS, Crown JP, Lang I, Boer K, Bondarenko IM, Kulyk SO, et al. The cyclin-dependent kinase 4/6 inhibitor palbociclib in combination with letrozole versus letrozole alone as first-line treatment of oestrogen receptor-positive, HER2-negative, advanced breast cancer (PALOMA-1/TRIO-18): a randomised phase 2 study. Lancet Oncol. 2015;16:25-35. 441. Turner NC, Ro J, Andre F, Loi S, Verma S, Iwata H, et al. Palbociclib in Hormone-Receptor-Positive Advanced Breast Cancer. N Engl J Med. 2015;373:209-19. 442. Hortobagyi GN, Stemmer SM, Burris HA, Yap YS, Sonke GS, Paluch-Shimon S, et al. Ribociclib as First-Line Therapy for HR-Positive, Advanced Breast Cancer. N Engl J Med. 2016;375:1738-48. 443. Carey LA, Perou CM. Palbociclib--Taking Breast-Cancer Cells Out of Gear. N Engl J Med. 2015;373:273-4. 444. Liu DS, Read M, Cullinane C, Azar WJ, Fennell CM, Montgomery KG, et al. APR-246 potently inhibits tumour growth and overcomes chemoresistance in preclinical models of oesophageal adenocarcinoma. Gut. 2015;64:1506-16.
179

445. Etemadmoghadam D, Au-Yeung G, Wall M, Mitchell C, Kansara M, Loehrer E, et al. Resistance to CDK2 inhibitors is associated with selection of polyploid cells in CCNE1-amplified ovarian cancer. Clin Cancer Res. 2013;19:5960-71. 446. Shih Ie M, Sheu JJ, Santillan A, Nakayama K, Yen MJ, Bristow RE, et al. Amplification of a chromatin remodeling gene, Rsf-1/HBXAP, in ovarian carcinoma. Proc Natl Acad Sci U S A. 2005;102:14004-9. 447. Wang TL, Maierhofer C, Speicher MR, Lengauer C, Vogelstein B, Kinzler KW, et al. Digital karyotyping. Proc Natl Acad Sci U S A. 2002;99:16156-61. 448. Reid Y, Storts D, Riss T, Minor L. Authentication of Human Cell Lines by STR DNA Profiling Analysis. In: Sittampalam GS, Coussens NP, Brimacombe K, Grossman A, Arkin M, Auld D, et al., editors. Assay Guidance Manual. Bethesda (MD)2004. 449. Fellmann C, Hoffmann T, Sridhar V, Hopfgartner B, Muhar M, Roth M, et al. An optimized microRNA backbone for effective single-copy RNAi. Cell Rep. 2013;5:1704-13. 450. Dow LE, Premsrirut PK, Zuber J, Fellmann C, McJunkin K, Miething C, et al. A pipeline for the generation of shRNA transgenic mice. Nat Protoc. 2012;7:374-93. 451. Vert JP, Foveau N, Lajaunie C, Vandenbrouck Y. An accurate and interpretable model for siRNA efficacy prediction. BMC Bioinformatics. 2006;7:520. 452. Lackovic K, Lessene G, Falk H, Leuchowius KJ, Baell J, Street I. A perspective on 10-years HTS experience at the Walter and Eliza Hall Institute of Medical Research - eighteen million assays and counting. Comb Chem High Throughput Screen. 2014;17:241-52. 453. Chou TC. Drug combination studies and their synergy quantification using the Chou-Talalay method. Cancer Res. 2010;70:440-6. 454. Mitra AK, Davis DA, Tomar S, Roy L, Gurler H, Xie J, et al. In vivo tumor growth of high-grade serous ovarian cancer cell lines. Gynecol Oncol. 2015;138:372-7. 455. Topp MD, Hartley L, Cook M, Heong V, Boehm E, McShane L, et al. Molecular correlates of platinum response in human high-grade serous ovarian cancer patient-derived xenografts. Mol Oncol. 2014;8:656-68. 456. Bowtell DD. The genesis and evolution of high-grade serous ovarian cancer. Nat Rev Cancer. 2010;10:803-8. 457. Richardson PG, Sonneveld P, Schuster MW, Irwin D, Stadtmauer EA, Facon T, et al. Bortezomib or high-dose dexamethasone for relapsed multiple myeloma. N Engl J Med. 2005;352:2487-98. 458. San Miguel JF, Schlag R, Khuageva NK, Dimopoulos MA, Shpilberg O, Kropff M, et al. Bortezomib plus melphalan and prednisone for initial treatment of multiple myeloma. N Engl J Med. 2008;359:906-17. 459. Kupperman E, Lee EC, Cao Y, Bannerman B, Fitzgerald M, Berger A, et al. Evaluation of the proteasome inhibitor MLN9708 in preclinical models of human cancer. Cancer Res. 2010;70:1970-80. 460. Kirk CJ. Discovery and development of second-generation proteasome inhibitors. Semin Hematol. 2012;49:207-14. 461. Domcke S, Sinha R, Levine DA, Sander C, Schultz N. Evaluating cell lines as tumour models by comparison of genomic profiles. Nat Commun. 2013;4:2126. 462. Anglesio MS, Wiegand KC, Melnyk N, Chow C, Salamanca C, Prentice LM, et al. Type-specific cell line models for type-specific ovarian cancer research. PLoS One. 2013;8:e72162. 463. Beaufort CM, Helmijr JC, Piskorz AM, Hoogstraat M, Ruigrok-Ritstier K, Besselink N, et al. Ovarian cancer cell line panel (OCCP): clinical importance of in vitro morphological subtypes. PLoS One. 2014;9:e103988. 464. Hernandez L, Kim MK, Lyle LT, Bunch KP, House CD, Ning F, et al. Characterization of ovarian cancer cell lines as in vivo models for preclinical studies. Gynecol Oncol. 2016;142:332-40. 465. Lansing TJ, McConnell RT, Duckett DR, Spehar GM, Knick VB, Hassler DF, et al. In vitro biological activity of a novel small-molecule inhibitor of polo-like kinase 1. Mol Cancer Ther. 2007;6:450-9. 466. Yap TA, Omlin A, de Bono JS. Development of therapeutic combinations targeting major cancer signaling pathways. J Clin Oncol. 2013;31:1592-605. 467. Wilkinson KD. Ubiquitin: a Nobel protein. Cell. 2004;119:741-5. 468. Micel LN, Tentler JJ, Smith PG, Eckhardt GS. Role of ubiquitin ligases and the proteasome in oncogenesis: novel targets for anticancer therapies. J Clin Oncol. 2013;31:1231-8. 469. Mani A, Gelmann EP. The ubiquitin-proteasome pathway and its role in cancer. J Clin Oncol. 2005;23:4776-89. 470. Adams J. The development of proteasome inhibitors as anticancer drugs. Cancer Cell. 2004;5:417-21. 471. Kim H, D'Andrea AD. Regulation of DNA cross-link repair by the Fanconi anemia/BRCA pathway. Genes Dev. 2012;26:1393-408. 472. Murakawa Y, Sonoda E, Barber LJ, Zeng W, Yokomori K, Kimura H, et al. Inhibitors of the proteasome suppress homologous DNA recombination in mammalian cells. Cancer Res. 2007;67:8536-43.
180

473. Etemadmoghadam D, Weir BA, Au-Yeung G, Alsop K, Mitchell G, George J, et al. Synthetic lethality between CCNE1 amplification and loss of BRCA1. Proc Natl Acad Sci U S A. 2013;110:19489-94. 474. Xu W, Lukkarila JL, da Silva SR, Paiva SL, Gunning PT, Schimmer AD. Targeting the ubiquitin E1 as a novel anti-cancer strategy. Curr Pharm Des. 2013;19:3201-9. 475. Moudry P, Lukas C, Macurek L, Hanzlikova H, Hodny Z, Lukas J, et al. Ubiquitin-activating enzyme UBA1 is required for cellular response to DNA damage. Cell Cycle. 2012;11:1573-82. 476. Xu GW, Ali M, Wood TE, Wong D, Maclean N, Wang X, et al. The ubiquitin-activating enzyme E1 as a therapeutic target for the treatment of leukemia and multiple myeloma. Blood. 2010;115:2251-9. 477. Yang Y, Kitagaki J, Dai RM, Tsai YC, Lorick KL, Ludwig RL, et al. Inhibitors of ubiquitin-activating enzyme (E1), a new class of potential cancer therapeutics. Cancer Res. 2007;67:9472-81. 478. Lub S, Maes K, Menu E, De Bruyne E, Vanderkerken K, Van Valckenborgh E. Novel strategies to target the ubiquitin proteasome system in multiple myeloma. Oncotarget. 2016;7:6521-37. 479. Kerscher O, Felberbaum R, Hochstrasser M. Modification of proteins by ubiquitin and ubiquitin-like proteins. Annu Rev Cell Dev Biol. 2006;22:159-80. 480. Migita K, Takayama T, Matsumoto S, Wakatsuki K, Tanaka T, Ito M, et al. Prognostic impact of RING box protein-1 (RBX1) expression in gastric cancer. Gastric Cancer. 2014;17:601-9. 481. Martinez VD, Vucic EA, Thu KL, Pikor LA, Hubaux R, Lam WL. Unique pattern of component gene disruption in the NRF2 inhibitor KEAP1/CUL3/RBX1 E3-ubiquitin ligase complex in serous ovarian cancer. Biomed Res Int. 2014;2014:159459. 482. Martinez VD, Vucic EA, Thu KL, Pikor LA, Lam S, Lam WL. Disruption of KEAP1/CUL3/RBX1 E3-ubiquitin ligase complex components by multiple genetic mechanisms: Association with poor prognosis in head and neck cancer. Head Neck. 2015;37:727-34. 483. Yuan J, Shah R, Kulharya A, Ustun C. Near-tetraploidy clone can evolve from a hyperdiploidy clone and cause resistance to lenalidomide and bortezomib in a multiple myeloma patient. Leuk Res. 2010;34:954-7. 484. Balsas P, Galan-Malo P, Marzo I, Naval J. Bortezomib resistance in a myeloma cell line is associated to PSMbeta5 overexpression and polyploidy. Leuk Res. 2012;36:212-8. 485. de Carcer G, Manning G, Malumbres M. From Plk1 to Plk5: functional evolution of polo-like kinases. Cell Cycle. 2011;10:2255-62. 486. Takaki T, Trenz K, Costanzo V, Petronczki M. Polo-like kinase 1 reaches beyond mitosis--cytokinesis, DNA damage response, and development. Curr Opin Cell Biol. 2008;20:650-60. 487. Gutteridge RE, Ndiaye MA, Liu X, Ahmad N. Plk1 Inhibitors in Cancer Therapy: From Laboratory to Clinics. Mol Cancer Ther. 2016;15:1427-35. 488. Weichert W, Denkert C, Schmidt M, Gekeler V, Wolf G, Kobel M, et al. Polo-like kinase isoform expression is a prognostic factor in ovarian carcinoma. Br J Cancer. 2004;90:815-21. 489. Takai N, Hamanaka R, Yoshimatsu J, Miyakawa I. Polo-like kinases (Plks) and cancer. Oncogene. 2005;24:287-91. 490. Pujade-Lauraine E, Selle F, Weber B, Ray-Coquard IL, Vergote I, Sufliarsky J, et al. Volasertib Versus Chemotherapy in Platinum-Resistant or -Refractory Ovarian Cancer: A Randomized Phase II Groupe des Investigateurs Nationaux pour l'Etude des Cancers de l'Ovaire Study. J Clin Oncol. 2016;34:706-13. 491. Raab M, Pachl F, Kramer A, Kurunci-Csacsko E, Dotsch C, Knecht R, et al. Quantitative chemical proteomics reveals a Plk1 inhibitor-compromised cell death pathway in human cells. Cell Res. 2014;24:1141-5. 492. Scharow A, Raab M, Saxena K, Sreeramulu S, Kudlinzki D, Gande S, et al. Optimized Plk1 PBD Inhibitors Based on Poloxin Induce Mitotic Arrest and Apoptosis in Tumor Cells. ACS Chem Biol. 2015;10:2570-9. 493. West AC, Johnstone RW. New and emerging HDAC inhibitors for cancer treatment. J Clin Invest. 2014;124:30-9. 494. Bolden JE, Peart MJ, Johnstone RW. Anticancer activities of histone deacetylase inhibitors. Nat Rev Drug Discov. 2006;5:769-84. 495. Qiu T, Zhou L, Zhu W, Wang T, Wang J, Shu Y, et al. Effects of treatment with histone deacetylase inhibitors in solid tumors: a review based on 30 clinical trials. Future Oncol. 2013;9:255-69. 496. Mann BS, Johnson JR, Cohen MH, Justice R, Pazdur R. FDA approval summary: vorinostat for treatment of advanced primary cutaneous T-cell lymphoma. Oncologist. 2007;12:1247-52. 497. Modesitt SC, Sill M, Hoffman JS, Bender DP, Gynecologic Oncology G. A phase II study of vorinostat in the treatment of persistent or recurrent epithelial ovarian or primary peritoneal carcinoma: a Gynecologic Oncology Group study. Gynecol Oncol. 2008;109:182-6. 498. Matulonis U, Berlin S, Lee H, Whalen C, Obermayer E, Penson R, et al. Phase I study of combination of vorinostat, carboplatin, and gemcitabine in women with recurrent, platinum-sensitive epithelial ovarian, fallopian tube, or peritoneal cancer. Cancer Chemother Pharmacol. 2015;76:417-23.
181

499. Cooper AL, Greenberg VL, Lancaster PS, van Nagell JR, Jr., Zimmer SG, Modesitt SC. In vitro and in vivo histone deacetylase inhibitor therapy with suberoylanilide hydroxamic acid (SAHA) and paclitaxel in ovarian cancer. Gynecol Oncol. 2007;104:596-601. 500. Wilson AJ, Sarfo-Kantanka K, Barrack T, Steck A, Saskowski J, Crispens MA, et al. Panobinostat sensitizes cyclin E high, homologous recombination-proficient ovarian cancer to olaparib. Gynecol Oncol. 2016;143:143-51. 501. Hideshima T, Richardson PG, Anderson KC. Mechanism of action of proteasome inhibitors and deacetylase inhibitors and the biological basis of synergy in multiple myeloma. Mol Cancer Ther. 2011;10:2034-42. 502. San-Miguel JF, Hungria VT, Yoon SS, Beksac M, Dimopoulos MA, Elghandour A, et al. Panobinostat plus bortezomib and dexamethasone versus placebo plus bortezomib and dexamethasone in patients with relapsed or relapsed and refractory multiple myeloma: a multicentre, randomised, double-blind phase 3 trial. Lancet Oncol. 2014;15:1195-206. 503. Wang H, Cao Q, Dudek AZ. Phase II study of panobinostat and bortezomib in patients with pancreatic cancer progressing on gemcitabine-based therapy. Anticancer Res. 2012;32:1027-31. 504. Marcotte R, Brown KR, Suarez F, Sayad A, Karamboulas K, Krzyzanowski PM, et al. Essential gene profiles in breast, pancreatic, and ovarian cancer cells. Cancer Discov. 2012;2:172-89. 505. Tetsu O, McCormick F. Proliferation of cancer cells despite CDK2 inhibition. Cancer Cell. 2003;3:233-45. 506. Cai D, Latham VM, Jr., Zhang X, Shapiro GI. Combined depletion of cell cycle and transcriptional cyclin-dependent kinase activities induces apoptosis in cancer cells. Cancer Res. 2006;66:9270-80. 507. Weiss WA, Taylor SS, Shokat KM. Recognizing and exploiting differences between RNAi and small-molecule inhibitors. Nat Chem Biol. 2007;3:739-44. 508. Geng Y, Yu Q, Sicinska E, Das M, Schneider JE, Bhattacharya S, et al. Cyclin E ablation in the mouse. Cell. 2003;114:431-43. 509. Parisi T, Beck AR, Rougier N, McNeil T, Lucian L, Werb Z, et al. Cyclins E1 and E2 are required for endoreplication in placental trophoblast giant cells. EMBO J. 2003;22:4794-803. 510. Lukas J, Herzinger T, Hansen K, Moroni MC, Resnitzky D, Helin K, et al. Cyclin E-induced S phase without activation of the pRb/E2F pathway. Genes Dev. 1997;11:1479-92. 511. Sweeney KJ, Swarbrick A, Sutherland RL, Musgrove EA. Lack of relationship between CDK activity and G1 cyclin expression in breast cancer cells. Oncogene. 1998;16:2865-78. 512. Karsunky H, Geisen C, Schmidt T, Haas K, Zevnik B, Gau E, et al. Oncogenic potential of cyclin E in T-cell lymphomagenesis in transgenic mice: evidence for cooperation between cyclin E and Ras but not Myc. Oncogene. 1999;18:7816-24. 513. Hydbring P, Malumbres M, Sicinski P. Non-canonical functions of cell cycle cyclins and cyclin-dependent kinases. Nat Rev Mol Cell Biol. 2016;17:280-92. 514. Kollmann K, Heller G, Schneckenleithner C, Warsch W, Scheicher R, Ott RG, et al. A kinase-independent function of CDK6 links the cell cycle to tumor angiogenesis. Cancer Cell. 2013;24:167-81. 515. Chauhan S, Diril MK, Lee JH, Bisteau X, Manoharan V, Adhikari D, et al. Cdk2 catalytic activity is essential for meiotic cell division in vivo. Biochem J. 2016;473:2783-98. 516. Berthet C, Klarmann KD, Hilton MB, Suh HC, Keller JR, Kiyokawa H, et al. Combined loss of Cdk2 and Cdk4 results in embryonic lethality and Rb hypophosphorylation. Dev Cell. 2006;10:563-73. 517. Davies TG, Bentley J, Arris CE, Boyle FT, Curtin NJ, Endicott JA, et al. Structure-based design of a potent purine-based cyclin-dependent kinase inhibitor. Nat Struct Biol. 2002;9:745-9. 518. Coxon CR, Anscombe E, Harnor SJ, Martin MP, Carbain BJ, Golding BT, et al. Cyclin-Dependent Kinase (CDK) Inhibitors; Structure-Activity Relationships and Insights into the CDK-2 Selectivity of 6-Substituted 2-Arylaminopurines. J Med Chem. 2016. 519. Peyressatre M, Prevel C, Pellerano M, Morris MC. Targeting cyclin-dependent kinases in human cancers: from small molecules to Peptide inhibitors. Cancers (Basel). 2015;7:179-237. 520. Ferguson M, Luciani MG, Finlan L, Rankin EM, Ibbotson S, Fersht A, et al. The development of a CDK2-docking site peptide that inhibits p53 and sensitizes cells to death. Cell Cycle. 2004;3:80-9. 521. Gondeau C, Gerbal-Chaloin S, Bello P, Aldrian-Herrada G, Morris MC, Divita G. Design of a novel class of peptide inhibitors of cyclin-dependent kinase/cyclin activation. J Biol Chem. 2005;280:13793-800. 522. Bagella L, Sun A, Tonini T, Abbadessa G, Cottone G, Paggi MG, et al. A small molecule based on the pRb2/p130 spacer domain leads to inhibition of cdk2 activity, cell cycle arrest and tumor growth reduction in vivo. Oncogene. 2007;26:1829-39. 523. Ray-Coquard I, Blay JY, Italiano A, Le Cesne A, Penel N, Zhi J, et al. Effect of the MDM2 antagonist RG7112 on the P53 pathway in patients with MDM2-amplified, well-differentiated or dedifferentiated liposarcoma: an exploratory proof-of-mechanism study. Lancet Oncol. 2012;13:1133-40.
182

524. Iyer VV. A Review of Stapled Peptides and Small Molecules to Inhibit Protein-Protein Interactions in Cancer. Curr Med Chem. 2016;23:3025-43. 525. Pecot CV, Wu SY, Bellister S, Filant J, Rupaimoole R, Hisamatsu T, et al. Therapeutic silencing of KRAS using systemically delivered siRNAs. Mol Cancer Ther. 2014;13:2876-85. 526. Wittrup A, Lieberman J. Knocking down disease: a progress report on siRNA therapeutics. Nat Rev Genet. 2015;16:543-52. 527. Fitzgerald K, White S, Borodovsky A, Bettencourt BR, Strahs A, Clausen V, et al. A Highly Durable RNAi Therapeutic Inhibitor of PCSK9. N Engl J Med. 2017;376:41-51. 528. Jackson SP, Durocher D. Regulation of DNA damage responses by ubiquitin and SUMO. Mol Cell. 2013;49:795-807. 529. Brown JS, Jackson SP. Ubiquitylation, neddylation and the DNA damage response. Open Biol. 2015;5:150018. 530. Shi W, Ma Z, Willers H, Akhtar K, Scott SP, Zhang J, et al. Disassembly of MDC1 foci is controlled by ubiquitin-proteasome-dependent degradation. J Biol Chem. 2008;283:31608-16. 531. Wu W, Sato K, Koike A, Nishikawa H, Koizumi H, Venkitaraman AR, et al. HERC2 is an E3 ligase that targets BRCA1 for degradation. Cancer Res. 2010;70:6384-92. 532. Galanty Y, Belotserkovskaya R, Coates J, Jackson SP. RNF4, a SUMO-targeted ubiquitin E3 ligase, promotes DNA double-strand break repair. Genes Dev. 2012;26:1179-95. 533. Moreau P, Richardson PG, Cavo M, Orlowski RZ, San Miguel JF, Palumbo A, et al. Proteasome inhibitors in multiple myeloma: 10 years later. Blood. 2012;120:947-59. 534. Adams J, Palombella VJ, Sausville EA, Johnson J, Destree A, Lazarus DD, et al. Proteasome inhibitors: a novel class of potent and effective antitumor agents. Cancer Res. 1999;59:2615-22. 535. Yin D, Zhou H, Kumagai T, Liu G, Ong JM, Black KL, et al. Proteasome inhibitor PS-341 causes cell growth arrest and apoptosis in human glioblastoma multiforme (GBM). Oncogene. 2005;24:344-54. 536. Mitsiades CS, McMillin D, Kotoula V, Poulaki V, McMullan C, Negri J, et al. Antitumor effects of the proteasome inhibitor bortezomib in medullary and anaplastic thyroid carcinoma cells in vitro. J Clin Endocrinol Metab. 2006;91:4013-21. 537. Aghajanian C, Soignet S, Dizon DS, Pien CS, Adams J, Elliott PJ, et al. A phase I trial of the novel proteasome inhibitor PS341 in advanced solid tumor malignancies. Clin Cancer Res. 2002;8:2505-11. 538. Davis NB, Taber DA, Ansari RH, Ryan CW, George C, Vokes EE, et al. Phase II trial of PS-341 in patients with renal cell cancer: a University of Chicago phase II consortium study. J Clin Oncol. 2004;22:115-9. 539. Kondagunta GV, Drucker B, Schwartz L, Bacik J, Marion S, Russo P, et al. Phase II trial of bortezomib for patients with advanced renal cell carcinoma. J Clin Oncol. 2004;22:3720-5. 540. Papandreou CN, Daliani DD, Nix D, Yang H, Madden T, Wang X, et al. Phase I trial of the proteasome inhibitor bortezomib in patients with advanced solid tumors with observations in androgen-independent prostate cancer. J Clin Oncol. 2004;22:2108-21. 541. Hamilton AL, Eder JP, Pavlick AC, Clark JW, Liebes L, Garcia-Carbonero R, et al. Proteasome inhibition with bortezomib (PS-341): a phase I study with pharmacodynamic end points using a day 1 and day 4 schedule in a 14-day cycle. J Clin Oncol. 2005;23:6107-16. 542. Aghajanian C, Dizon DS, Sabbatini P, Raizer JJ, Dupont J, Spriggs DR. Phase I trial of bortezomib and carboplatin in recurrent ovarian or primary peritoneal cancer. J Clin Oncol. 2005;23:5943-9. 543. Ramirez PT, Landen CN, Jr., Coleman RL, Milam MR, Levenback C, Johnston TA, et al. Phase I trial of the proteasome inhibitor bortezomib in combination with carboplatin in patients with platinum- and taxane-resistant ovarian cancer. Gynecol Oncol. 2008;108:68-71. 544. Aghajanian C, Blessing JA, Darcy KM, Reid G, DeGeest K, Rubin SC, et al. A phase II evaluation of bortezomib in the treatment of recurrent platinum-sensitive ovarian or primary peritoneal cancer: a Gynecologic Oncology Group study. Gynecol Oncol. 2009;115:215-20. 545. Dick LR, Fleming PE. Building on bortezomib: second-generation proteasome inhibitors as anti-cancer therapy. Drug Discov Today. 2010;15:243-9. 546. Dou QP, Zonder JA. Overview of proteasome inhibitor-based anti-cancer therapies: perspective on bortezomib and second generation proteasome inhibitors versus future generation inhibitors of ubiquitin-proteasome system. Curr Cancer Drug Targets. 2014;14:517-36. 547. Scott DE, Coyne AG, Venkitaraman A, Blundell TL, Abell C, Hyvonen M. Small-molecule inhibitors that target protein-protein interactions in the RAD51 family of recombinases. ChemMedChem. 2015;10:296-303. 548. Moschetti T, Sharpe T, Fischer G, Marsh ME, Ng HK, Morgan M, et al. Engineering Archeal Surrogate Systems for the Development of Protein-Protein Interaction Inhibitors against Human RAD51. J Mol Biol. 2016;428:4589-607. 549. Venkitaraman AR. Cancer suppression by the chromosome custodians, BRCA1 and BRCA2. Science. 2014;343:1470-5.
183

550. Roy R, Chun J, Powell SN. BRCA1 and BRCA2: different roles in a common pathway of genome protection. Nat Rev Cancer. 2011;12:68-78. 551. Ran FA, Hsu PD, Wright J, Agarwala V, Scott DA, Zhang F. Genome engineering using the CRISPR-Cas9 system. Nat Protoc. 2013;8:2281-308. 552. Shalem O, Sanjana NE, Hartenian E, Shi X, Scott DA, Mikkelsen TS, et al. Genome-scale CRISPR-Cas9 knockout screening in human cells. Science. 2014;343:84-7. 553. Sharpless NE, Depinho RA. The mighty mouse: genetically engineered mouse models in cancer drug development. Nat Rev Drug Discov. 2006;5:741-54. 554. Sawyers C. Targeted cancer therapy. Nature. 2004;432:294-7. 555. Schilsky RL. Personalized medicine in oncology: the future is now. Nat Rev Drug Discov. 2010;9:363-6. 556. Schwaederle M, Zhao M, Lee JJ, Eggermont AM, Schilsky RL, Mendelsohn J, et al. Impact of Precision Medicine in Diverse Cancers: A Meta-Analysis of Phase II Clinical Trials. J Clin Oncol. 2015;33:3817-25. 557. Tannock IF, Hickman JA. Limits to Personalized Cancer Medicine. N Engl J Med. 2016;375:1289-94. 558. Hait WN. Anticancer drug development: the grand challenges. Nat Rev Drug Discov. 2010;9:253-4. 559. Gonzalez Martin A. Progress in PARP inhibitors beyond BRCA mutant recurrent ovarian cancer? Lancet Oncol. 2017;18:8-9. 560. Liu S, Nikanjam M, Kurzrock R. Dosing de novo combinations of two targeted drugs: Towards a customized precision medicine approach to advanced cancers. Oncotarget. 2016;7:11310-20. 561. Nikanjam M, Liu S, Kurzrock R. Dosing targeted and cytotoxic two-drug combinations: Lessons learned from analysis of 24,326 patients reported 2010 through 2013. Int J Cancer. 2016;139:2135-41. 562. Gupta S, Hunsberger S, Boerner SA, Rubinstein L, Royds R, Ivy P, et al. Meta-analysis of the relationship between dose and benefit in phase I targeted agent trials. J Natl Cancer Inst. 2012;104:1860-6. 563. Hay M, Thomas DW, Craighead JL, Economides C, Rosenthal J. Clinical development success rates for investigational drugs. Nat Biotechnol. 2014;32:40-51. 564. Begley CG, Ellis LM. Drug development: Raise standards for preclinical cancer research. Nature. 2012;483:531-3. 565. Amir E, Seruga B, Martinez-Lopez J, Kwong R, Pandiella A, Tannock IF, et al. Oncogenic targets, magnitude of benefit, and market pricing of antineoplastic drugs. J Clin Oncol. 2011;29:2543-9. 566. Zafar SY, Abernethy AP. Financial toxicity, Part I: a new name for a growing problem. Oncology (Williston Park). 2013;27:80-1, 149. 567. Swanton C, Soria JC, Bardelli A, Biankin A, Caldas C, Chandarlapaty S, et al. Consensus on precision medicine for metastatic cancers: a report from the MAP conference. Ann Oncol. 2016;27:1443-8. 568. Cocco E, Lopez S, Black J, Bellone S, Bonazzoli E, Predolini F, et al. Dual CCNE1/PIK3CA targeting is synergistic in CCNE1-amplified/PIK3CA-mutated uterine serous carcinomas in vitro and in vivo. Br J Cancer. 2016;115:303-11.
184

Appendices
Appendix A. EC50 values for primary screen OVCAR3 vs SKOV3
EC50 (μM)
COMPOUND OVCAR3 SKOV3 Ratio MLN9708 0.065 1.346 0.0482912 Flubendazol 0.203 3.365 0.0603269 Digoxigenin 0.147 2.159 0.0680871 MLN2238 0.044 0.585 0.0752137 Amlodipine besylate 0.356 3.504 0.1015982 GSK2126458 (HYR-582) 0.415 3.355 0.123696 XL184 1.103 6.485 0.1700848 Dasatinib 2.112 12.034 0.1755027 ON-01910 0.35 1.825 0.1917808 PI103 2.122 8.703 0.243824 Doxorubicin hydrochloride 0.181 0.586 0.3088737 Gossypol 4.023 11.987 0.3356136 Cryptotanshinone 3.214 9.505 0.3381378 Daunorubicin hydrochloride 0.313 0.889 0.352081 CD 437 0.487 1.369 0.3557341 Topotecan Hydrochloride 1.566 4.309 0.3634254 TW-37 3.301 9.038 0.3652357 2-Methoxyestradiol 3.192 8.532 0.374121 MG 132 0.205 0.518 0.3957529 Mercaptopurine 1.324 3.325 0.3981955 BEZ235 1.062 2.659 0.3993983 Fenbendazole 1.856 4.624 0.4013841 Ro 08-2750 4.435 10.689 0.4149125 Ryuvidine 0.994 2.255 0.4407982 GDC-0941 3.754 8.279 0.4534364 GSK1059615 3.626 7.88 0.4601523 Mebendazole 2.556 5.505 0.4643052 Quinacrine dihydrochloride dihydrate 2.893 5.965 0.4849958 SNAP 5089 3.933 8.002 0.4915021 ZSTK474 2.59 5.252 0.4931455 Azathioprine 3.299 6.666 0.4948995 2,3-Dimethoxy-1,4-naphthoquinone 4.716 9.416 0.5008496 Parthenolide 3.899 7.667 0.5085431 Camptothecine 0.177 0.347 0.5100865 Mibefradil dihydrochloride 5.244 9.961 0.5264532 Thimerosal 0.997 1.831 0.5445112 SR 33805 oxalate 5.077 9.285 0.5467959 Cantharidin 1.55 2.807 0.552191 RAF265 6.272 11.158 0.5621079 AMG-47a 5.328 9.129 0.5836346 IMD 0354 1.104 1.861 0.5932294
185

COMPOUND OVCAR3 SKOV3 Ratio Clofarabine 1.535 2.581 0.5947307 CYT387 7.079 11.573 0.6116824 BML-284 0.376 0.611 0.6153846 Trifluoperazine dihydrochloride 3.074 4.871 0.6310819 Pimozide 2.717 4.237 0.6412556 SKF 96365 6.448 9.806 0.6575566 beta-Lapachone 2.155 3.194 0.6747026 LY500307 6.118 8.945 0.6839575 Fendiline hydrochloride 2.067 2.959 0.6985468 ABT-737 6.729 9.508 0.7077198 Tetrindole mesylate 5.806 8.001 0.7256593 ABT-263 3.663 4.97 0.7370221 Zuclopenthixol hydrochloride 7.479 10.119 0.7391047 Lapatinib 4.079 5.481 0.7442073 IC 261 5.303 6.92 0.7663295 PD 407824 2.969 3.863 0.7685736 Ziprasidone hydrochloride monohydrate 8.666 11.18 0.7751342 AGK2 9.5 12.232 0.7766514 Tamoxifen citrate 4.647 5.893 0.7885627 Miconazole 2.658 3.356 0.7920143 Niclosamide 3.406 4.298 0.7924616 BIO 2.455 3.096 0.7929587 BI-D1870 5.401 6.57 0.82207 WAY 170523 7.526 9.139 0.8235037 PHTPP 4.922 5.961 0.8257004 Estradiol Valerate 8.846 10.55 0.8384834 NSC 3852 1.039 1.237 0.8399353 Pyrvinium pamoate 1.141 1.358 0.8402062 Eliprodil 6.298 7.466 0.8435575 Prazosin hydrochloride 7.309 8.606 0.8492912 YK-4-279 4.326 5.038 0.8586741 Purvalanol A 10.761 12.492 0.8614313 Sertraline hydrochloride 2.046 2.372 0.8625632 EX 527 7.278 8.411 0.8652954 LY2784544 4.344 5.009 0.867239 AC220 7.114 8.068 0.8817551 NSC 95397 1.527 1.728 0.8836806 Pyrimethamine 1.145 1.291 0.8869094 Triflupromazine hydrochloride 4.459 5.023 0.8877165 WZ4002 2.287 2.574 0.8885004 Ivermectin 2.835 3.17 0.8943218 Hesperadin 2.614 2.92 0.8952055 Chrysene-1,4-quinone 1.079 1.197 0.9014202 SB 202190 3.739 4.105 0.9108404 PHA690509 7.435 8.105 0.917335
186
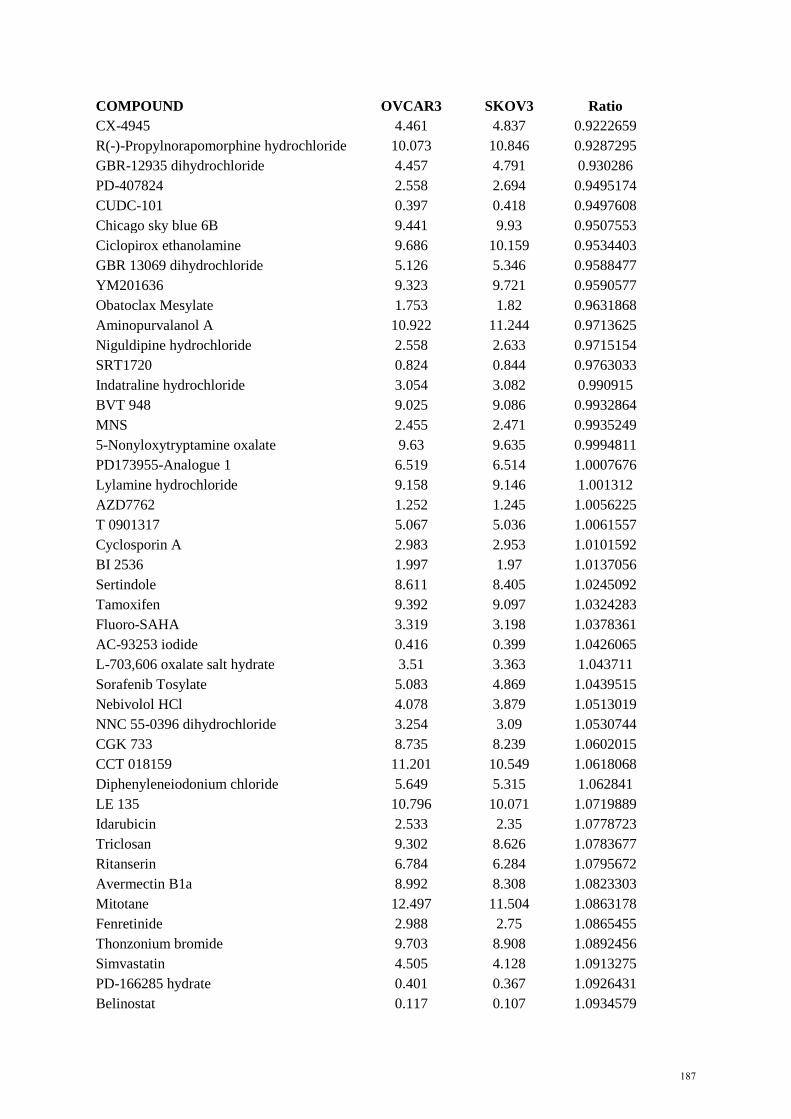
COMPOUND OVCAR3 SKOV3 Ratio CX-4945 4.461 4.837 0.9222659 R(-)-Propylnorapomorphine hydrochloride 10.073 10.846 0.9287295 GBR-12935 dihydrochloride 4.457 4.791 0.930286 PD-407824 2.558 2.694 0.9495174 CUDC-101 0.397 0.418 0.9497608 Chicago sky blue 6B 9.441 9.93 0.9507553 Ciclopirox ethanolamine 9.686 10.159 0.9534403 GBR 13069 dihydrochloride 5.126 5.346 0.9588477 YM201636 9.323 9.721 0.9590577 Obatoclax Mesylate 1.753 1.82 0.9631868 Aminopurvalanol A 10.922 11.244 0.9713625 Niguldipine hydrochloride 2.558 2.633 0.9715154 SRT1720 0.824 0.844 0.9763033 Indatraline hydrochloride 3.054 3.082 0.990915 BVT 948 9.025 9.086 0.9932864 MNS 2.455 2.471 0.9935249 5-Nonyloxytryptamine oxalate 9.63 9.635 0.9994811 PD173955-Analogue 1 6.519 6.514 1.0007676 Lylamine hydrochloride 9.158 9.146 1.001312 AZD7762 1.252 1.245 1.0056225 T 0901317 5.067 5.036 1.0061557 Cyclosporin A 2.983 2.953 1.0101592 BI 2536 1.997 1.97 1.0137056 Sertindole 8.611 8.405 1.0245092 Tamoxifen 9.392 9.097 1.0324283 Fluoro-SAHA 3.319 3.198 1.0378361 AC-93253 iodide 0.416 0.399 1.0426065 L-703,606 oxalate salt hydrate 3.51 3.363 1.043711 Sorafenib Tosylate 5.083 4.869 1.0439515 Nebivolol HCl 4.078 3.879 1.0513019 NNC 55-0396 dihydrochloride 3.254 3.09 1.0530744 CGK 733 8.735 8.239 1.0602015 CCT 018159 11.201 10.549 1.0618068 Diphenyleneiodonium chloride 5.649 5.315 1.062841 LE 135 10.796 10.071 1.0719889 Idarubicin 2.533 2.35 1.0778723 Triclosan 9.302 8.626 1.0783677 Ritanserin 6.784 6.284 1.0795672 Avermectin B1a 8.992 8.308 1.0823303 Mitotane 12.497 11.504 1.0863178 Fenretinide 2.988 2.75 1.0865455 Thonzonium bromide 9.703 8.908 1.0892456 Simvastatin 4.505 4.128 1.0913275 PD-166285 hydrate 0.401 0.367 1.0926431 Belinostat 0.117 0.107 1.0934579
187

COMPOUND OVCAR3 SKOV3 Ratio GF 109203X 5.743 5.227 1.0987182 Beta-Escin 9.38 8.527 1.1000352 Ellipticine 2.511 2.273 1.1047074 Suloctidil 3.837 3.464 1.107679 Methyl benzethonium chloride 3.345 3.011 1.1109266 AP24534 2.508 2.255 1.1121951 Axitinib 9.753 8.766 1.1125941 ZK 164015 8.246 7.407 1.1132712 ABT-869 9.242 8.269 1.1176684 NNC 26-9100 4.114 3.676 1.1191513 SB 216641 hydrochloride 2.726 2.423 1.1250516 PD 198306 4.175 3.708 1.1259439 CGP 71683 hydrochloride 3.98 3.526 1.1287578 Octoclothepin maleate 11.375 10.037 1.1333068 SR 59230A hydrochloride 9.777 8.573 1.1404409 KU57788 (NU7441) 5.89 5.161 1.1412517 GSK J4 2.662 2.307 1.1538795 Chlorpromazine hydrochloride 5.775 5.001 1.154769 WZ8040 2.377 2.045 1.1623472 Alfacalcidol 11.381 9.776 1.1641776 NSC 663284 3.337 2.842 1.1741731 BMS 191011 9.297 7.906 1.1759423 BIBU 1361 dihydrochloride 3.964 3.36 1.1797619 3`-Fluorobenzylspiperone maleate 3.713 3.146 1.1802289 Proadifen hydrochloride 12.496 10.587 1.1803155 BML-281 0.751 0.636 1.1808176 BMS-2 6.999 5.903 1.1856683 GR 127935 hydrochloride 10.067 8.463 1.1895309 NVP-ADW742 3.651 3.058 1.1939176 CI-1033 3.933 3.281 1.1987199 Chlorprothixene hydrochloride 8.066 6.674 1.2085706 Vandetanib 8.635 7.12 1.2127809 Clomipramine hydrochloride 3.726 3.062 1.2168517 Metergoline 4.331 3.556 1.2179415 Vinpocetine 10.591 8.663 1.2225557 Toremifene 11.325 9.197 1.2313798 ABT-199 6.372 5.173 1.2317804 Sunitinib malate 3.411 2.767 1.232743 PF-2341066 5.115 4.137 1.2364032 L-733,060 hydrochloride 10.209 8.249 1.2376046 Oxamflatin 0.99 0.799 1.2390488 Dicyclomine hydrochloride 12.362 9.961 1.2410401 ZK 93426 hydrochloride 12.013 9.628 1.247715 Clioquinol 10.979 8.77 1.2518814 ZM 39923 hydrochloride 10.054 7.998 1.2570643
188

COMPOUND OVCAR3 SKOV3 Ratio AG13958 4.096 3.24 1.2641975 THC 5.693 4.496 1.2662367 L-687,384 hydrochloride 7.043 5.535 1.2724481 BS-181 hydrochloride 9.007 7.063 1.2752372 Eticlopride hydrochloride 8.28 6.489 1.2760055 CD 1530 4.453 3.466 1.2847663 JNJ 26854165 9.941 7.723 1.2871941 SU11274 7.157 5.549 1.2897819 SDM25N hydrochloride 10.054 7.78 1.2922879 AMG-Tie2-1 8.209 6.342 1.2943866 Cantharidic Acid 3.078 2.368 1.2998311 Sertraline 3.703 2.847 1.3006674 BMS-3 0.589 0.452 1.3030973 Bax channel blocker 3.789 2.903 1.3052015 Bosutinib 3.66 2.793 1.3104189 Nilotinib 2.935 2.228 1.317325 Masitinib 8.634 6.532 1.3218004 Droxinostat 2.239 1.688 1.3264218 BNTX maleate 2.235 1.68 1.3303571 CGP-74514A hydrochloride 3.239 2.43 1.3329218 Isradipine 10.343 7.759 1.3330326 Thioridazine hydrochloride 4.494 3.343 1.3443015 GBR 12909 dihydrochloride 12.447 9.257 1.3446041 PD-156707 6.564 4.851 1.3531231 LAQ824 0.117 0.086 1.3604651 AR-42 0.101 0.074 1.3648649 JNJ-26481585 0.026 0.019 1.3684211 AEE788 7.524 5.497 1.3687466 Felodipine 7.927 5.758 1.3766933 Bepridil hydrochloride 8.516 6.145 1.3858421 AV-951 9.768 7.03 1.3894737 Lidoflazine 3.213 2.312 1.3897059 BIX-01294 2.609 1.863 1.4004294 Scriptaid 2.222 1.574 1.41169 Fluoxetine hydrochloride 12.454 8.814 1.4129794 Danusertib 5.958 4.197 1.4195854 PHA-793887 4.841 3.37 1.4364985 Stattic 3.131 2.172 1.4415285 Alexidine dihydrochloride 1.747 1.209 1.4449959 VX-770 4.139 2.858 1.4482155 Y 29794 oxalate 2.533 1.749 1.4482561 Fluphenazine dihydrochloride 3.094 2.124 1.4566855 BIBR-1048 10.09 6.925 1.4570397 Lynestrenol 12.335 8.443 1.4609736 PD-184161 4.762 3.245 1.4674884
189

COMPOUND OVCAR3 SKOV3 Ratio Cediranib(AZD2171) 4.446 3.027 1.468781 7-Cyclopentyl-5-(4-phenoxy)phenyl-7H-pyrrolo[2,3-d]pyrimidin-4-ylamine 10.722 7.297 1.469371 SB 228357 5.802 3.948 1.4696049 Thioguanosine 3.696 2.51 1.47251 Vorinostat 0.253 0.17 1.4882353 Chloroxine 8.651 5.795 1.4928387 M-344 1.766 1.18 1.4966102 Apicidin 0.664 0.442 1.5022624 Benzethonium chloride 3.42 2.248 1.5213523 3,4-Dichloroisocoumarin 6.752 4.421 1.5272563 N-Benzylnaltrindole hydrochloride 4.084 2.659 1.5359158 Anisomycin 1.006 0.654 1.5382263 Mocetinostat 0.918 0.595 1.5428571 PCI-24781 0.073 0.047 1.5531915 PD 102807 10.479 6.73 1.5570579 A-77636 hydrochloride 4.316 2.771 1.5575604 SGI-1776 5.24 3.339 1.5693321 Calcimycin 0.472 0.3 1.5733333 CGP-7930 10.532 6.651 1.5835213 Cilnidipine 6.101 3.852 1.5838525 SB939 0.097 0.061 1.5901639 Aurora A Inhibitor I 1.022 0.638 1.6018809 Bromoacetyl alprenolol menthane 4.851 3.005 1.6143095 SR 59230A oxalate 4.984 3.046 1.6362443 WZ3146 1.428 0.857 1.6662777 IMS2186 1.297 0.778 1.6670951 SC-236 9.011 5.367 1.678964 SNS-314 5.525 3.289 1.6798419 SCH 79797 dihydrochloride 1.474 0.875 1.6845714 Palmitoylcarnitine chloride 10.595 6.28 1.6871019 Econazole nitrate 6.709 3.937 1.7040894 PAC-1 9.255 5.422 1.7069347 PD173955 4.644 2.707 1.7155523 SAHA 2.298 1.325 1.7343396 cis-Diethyl tetrahydro-2,8-chrysenediol 11.416 6.551 1.7426347 Staurosporine aglycone 4.866 2.786 1.7465901 AC-220 10.442 5.975 1.7476151 TG-46 3.623 2.073 1.7477086 Dihydroouabain 4.638 2.653 1.7482096 Rocilinostat 2.555 1.449 1.763285 Methiothepin mesylate 9.451 5.356 1.7645631 CI-994 10.313 5.843 1.765018 Retinoic acid p-hydroxyanilide 3.428 1.942 1.7651905 BMS-193885 4.356 2.441 1.7845145
190

COMPOUND OVCAR3 SKOV3 Ratio SKF-525A hydrochloride 12.388 6.92 1.7901734 PAC 1 8.556 4.728 1.8096447 NVP-TAE684 2.478 1.362 1.8193833 Benfluorex hydrochloride 11.841 6.489 1.8247804 Nemadipine-A 4.904 2.67 1.8367041 10-DEBC hydrochloride 9.44 5.139 1.8369333 3-CPMT 5.309 2.884 1.840846 TG101348 5.141 2.775 1.8526126 Dequalinium dichloride 5.788 3.115 1.8581059 AV-412 1.779 0.955 1.8628272 Fluspirilene 9.777 5.216 1.8744248 ZM 449829 5.742 3.06 1.8764706 BAY 61-3606 hydrochloride hydrate 9.397 5 1.8794 RS 39604 hydrochloride 5.557 2.913 1.9076553 PPHT hydrochloride 10.879 5.659 1.9224245 AZ-960 3.679 1.907 1.9292082 SB590885 5.703 2.953 1.9312563 Bisindoylmaleimide X 7.517 3.88 1.9373711 TG101209 4.539 2.315 1.9606911 PD173952 1.938 0.983 1.9715158 Maprotiline hydrochloride 11.227 5.666 1.9814684 Haloprogin 8.556 4.287 1.9958013 Tyrphostin A9 3.956 1.978 2 MS-275 2.77 1.375 2.0145455 Chlorhexidine 4.865 2.402 2.0253955 Verteporfin 9.417 4.649 2.0255969 Isoconazole 11.941 5.894 2.0259586 ITF2357 0.493 0.243 2.0288066 Tyrphostin AG 879 8.028 3.931 2.0422284 K114 7.829 3.821 2.0489401 Prenylamine lactate 8.73 4.255 2.0517039 Calmidazolium chloride 2.784 1.355 2.0546125 A-674563 2.434 1.18 2.0627119 7-Chloro-4-hydroxy-2-phenyl-1,8-naphthyridine 10.349 4.964 2.0848106 R428 5.033 2.411 2.0875156 Dequalinium chloride hydrate 3.837 1.818 2.1105611 DL-erythro-Dihydrosphingosine 9.957 4.683 2.1262012 EO 1428 8.458 3.976 2.1272636 Clomiphene citrate 7.208 3.387 2.128137 AY 9944 11.344 5.307 2.1375542 GBR-12909 dihydrochloride 9.122 4.267 2.1378017 CGP 7930 9.795 4.537 2.1589156 IPAG 8.713 3.988 2.1848044 Terfenadine 4.453 2.03 2.1935961
191

COMPOUND OVCAR3 SKOV3 Ratio NNC 05-2090 hydrochloride 9.292 4.215 2.2045077 Salmeterol xinafoate 7.87 3.56 2.2106742 A-7 hydrochloride 9.271 4.187 2.2142345 SNS-314 Mesylate 6.423 2.897 2.2171212 Dimethisoquin hydrochloride 12.086 5.413 2.232773 Panobinostat 0.067 0.03 2.2333333 Trichostatin A 0.217 0.097 2.2371134 Auranofin 1.186 0.529 2.241966 INCA-6 10.148 4.497 2.2566155 LY2228820 10.837 4.799 2.2581788 Amsacrine hydrochloride 3.067 1.349 2.273536 Ebastine 8.31 3.649 2.2773363 A23187 0.727 0.319 2.2789969 AT-7519 4.529 1.986 2.2804632 Thiethylperazine dimalate 10.82 4.698 2.3031077 5-(N,N-hexamethylene)amiloride 9.353 3.985 2.3470514 TG-89 4.171 1.772 2.3538375 OLDA 7.432 3.155 2.355626 LY-367,265 11.878 4.932 2.4083536 Manidipine 11.227 4.632 2.423791 Sertaconazole nitrate 11.763 4.838 2.4313766 Fluspirilen 9.954 4.042 2.4626423 Loperamide hydrochloride 9.866 3.956 2.4939333 Floxuridine 7.062 2.82 2.5042553 JFD00244 9.396 3.706 2.5353481 NTNCB hydrochloride 8.575 3.356 2.5551251 CCT129202 3.673 1.431 2.5667365 WIN 62,577 5.456 2.111 2.5845571 2,3-DCPE hydrochloride 12.113 4.663 2.5976839 JTC 801 2.833 1.079 2.6255792 Oxiconazole Nitrate 10.796 4.098 2.6344558 Quinacrine dihydrochloride 6.771 2.557 2.648025 IKK 16 2.121 0.797 2.6612296 Astemizole 7.993 2.983 2.6795173 Sulconazole nitrate 10.973 4.037 2.7181075 Paroxetine Hydrochloride 7.007 2.561 2.7360406 DL-Stearoylcarnitine chloride 11.49 4.187 2.7442083 Tipifarnib 5.487 1.982 2.7684157 Ki8751 6.345 2.265 2.8013245 CP-31398 dihydrochloride hydrate 9.721 3.413 2.8482274 Lacidipine 10.311 3.604 2.8609878 Clemastine fumarate 12.004 4.167 2.8807295 N-Oleoyldopamine 9.045 3.088 2.9290803 17-DMAG 0.584 0.198 2.9494949 UNC638A 7.511 2.511 2.9912386
192

COMPOUND OVCAR3 SKOV3 Ratio GSK343 11.287 3.748 3.0114728 XL880 3.361 1.111 3.0252025 L-741,626 8.975 2.914 3.0799588 SSR 69071 10.52 3.354 3.1365534 Efavirenz 8.791 2.779 3.1633681 SB 525334 11.623 3.667 3.1696209 RS 17053 hydrochloride 8.115 2.526 3.2125891 Zotepine 11.913 3.703 3.2171213 Mefloquine hydrochloride 8.815 2.722 3.2384276 Prochlorperazine dimaleate 8.984 2.756 3.2597968 Merck-22-6 5.053 1.55 3.26 PHA 665752 8.577 2.627 3.264941 IPA-3 12.365 3.745 3.3017356 JQ1 1.396 0.42 3.3238095 Brefeldin A 1.153 0.339 3.4011799 Perphenazine 10.42 3.033 3.4355424 AM 404 8.5 2.458 3.458096 ARP 101 1.418 0.4 3.545 Raloxifene hydrochloride 12.26 3.099 3.9561149 Formoterol 9.011 2.263 3.9818825 Ro 31-8220 mesylate 10.114 2.483 4.0732984 Chelerythrine chloride 1.39 0.327 4.2507645 OMDM-2 11.693 2.734 4.2768837 Phorbol 12-myristate 13-acetate 10.141 2.352 4.3116497 NNC 55-0396 9.214 2.009 4.5863614 VX-680 9.49 2.058 4.6112731 AT13387 2.989 0.638 4.684953 Ki 8751 8.795 1.773 4.9605189 BIIB021 3.234 0.487 6.6406571 Tetraethylthiuram disulfide 6.878 0.261 26.35249
193

Appendix B. EC50 values for primary screen OVCAR3-R1 vs OVCAR3
EC50 (μM)
COMPOUND OVCAR3 OVCAR3-R1 Ratio VX-680 9.49 1.779 0.18746 LY2228820 10.837 2.205 0.20347 Ki8751 6.345 1.369 0.21576 SNS-314 Mesylate 6.423 1.516 0.236027 Miconazole 2.658 0.628 0.236268 RS 17053 hydrochloride 8.115 2.489 0.306716 PHA 665752 8.577 3.118 0.36353 NNC 05-2090 hydrochloride 9.292 3.466 0.373009 AM 404 8.5 3.258 0.383294 IPAG 8.713 3.349 0.384368 NTNCB hydrochloride 8.575 3.531 0.411778 Brefeldin A 1.153 0.477 0.413703 Rocilinostat 2.555 1.071 0.419178 Phorbol 12-myristate 13-acetate 10.141 4.271 0.421162 Thioguanosine 3.696 1.594 0.431277 GBR-12909 dihydrochloride 9.122 4.274 0.468538 Scriptaid 2.816 1.333 0.473366 Ki 8751 8.795 4.177 0.474929 Intedanib 10.4 4.985 0.479327 Prochlorperazine dimaleate 8.984 4.381 0.487645 GSK343 11.287 5.51 0.488172 Fluphenazine dihydrochloride 9.471 4.631 0.488966 Oxiconazole Nitrate 10.796 5.434 0.503335 JFD00244 9.396 4.733 0.503725 7-Chloro-4-hydroxy-2-phenyl-1,8-naphthyridine 10.349 5.227 0.505073 LE 135 10.796 5.567 0.515654 SB939 0.627 0.324 0.516746 BVT 948 9.025 4.704 0.521219 ABT-263 3.663 1.91 0.521431 Mefloquine hydrochloride 8.815 4.75 0.538854 CGK 733 8.735 4.745 0.543217 SDM25N hydrochloride 10.054 5.482 0.545256 2-Methoxyestradiol 8.255 4.548 0.550939 WZ3146 1.428 0.796 0.557423 VX-770 4.139 2.347 0.567045 Anisomycin 1.006 0.571 0.567594 LY-367,265 11.878 6.855 0.577117 DL-Stearoylcarnitine chloride 11.49 6.64 0.577894 Chelerythrine chloride 1.39 0.809 0.582014 BIBU 1361 dihydrochloride 3.964 2.316 0.584258 Loperamide hydrochloride 12.205 7.282 0.596641 CI-1033 3.933 2.369 0.602339
194

COMPOUND OVCAR3 OVCAR3-R1 Ratio OMDM-2 11.693 7.045 0.602497 Cryptotanshinone 3.214 1.949 0.606409 Fluspirilene 9.777 5.93 0.606526 Diphenyleneiodonium chloride 2.638 1.614 0.611827 ITF2357 0.493 0.302 0.612576 Ro 08-2750 4.435 2.734 0.61646 SR 59230A hydrochloride 9.777 6.038 0.617572 Calmidazolium chloride 2.784 1.734 0.622845 SSR 69071 10.52 6.625 0.629753 WAY 170523 7.526 4.758 0.632208 Vorinostat 2.833 1.803 0.636428 MS-275 0.336 0.214 0.636905 PD173952 1.938 1.25 0.644995 Manidipine 11.227 7.258 0.646477 Chlorhexidine 4.865 3.147 0.646865 Haloprogin 8.556 5.537 0.647148 Sulconazole nitrate 10.973 7.297 0.664996 Mocetinostat 0.918 0.611 0.665577 Prenylamine lactate 8.73 5.817 0.666323 Clemastine fumarate 12.004 8.003 0.666694 Ciclopirox ethanolamine 9.686 6.478 0.6688 AR-42 0.101 0.068 0.673267 Dihydroouabain 4.638 3.132 0.675291 AMG-Tie2-1 8.209 5.57 0.678524 Fluoro-SAHA 3.319 2.277 0.68605 INCA-6 10.148 6.982 0.688017 Obatoclax Mesylate 1.753 1.231 0.702225 Floxuridine 7.062 4.984 0.705749 Bromoacetyl alprenolol menthane 4.851 3.434 0.707895 BNTX maleate salt hydrate 9.121 6.477 0.71012 Daunorubicin hydrochloride 0.878 0.629 0.716401 CI-994 10.313 7.402 0.717735 Quinacrine dihydrochloride 6.771 4.869 0.719096 Apicidin 0.664 0.478 0.71988 AC-220 10.442 7.605 0.728309 Auranofin 1.681 1.225 0.728733 JNJ-26481585 0.026 0.019 0.730769 AZD7762 1.252 0.923 0.73722 OLDA 7.432 5.495 0.73937 PAC 1 8.556 6.38 0.745676 Panobinostat 0.067 0.05 0.746269 Paroxetine Hydrochloride 7.007 5.235 0.74711 Tipifarnib 5.487 4.124 0.751595 M-344 1.766 1.33 0.753114 BAY 61-3606 hydrochloride hydrate 9.397 7.127 0.758434
195

COMPOUND OVCAR3 OVCAR3-R1 Ratio EO 1428 8.458 6.418 0.758808 Trichostatin A 0.217 0.165 0.760369 LAQ824 0.117 0.089 0.760684 Isradipine 10.343 7.966 0.770183 Methiothepin mesylate 9.451 7.296 0.771982 Bepridil hydrochloride 8.516 6.582 0.772898 IPA-3 12.365 9.597 0.776142 ABT-869 9.242 7.175 0.776347 ABT-199 6.372 4.968 0.779661 Ivermectin 3.218 2.581 0.802051 WIN 62,577 5.456 4.379 0.802603 Staurosporine aglycone 4.866 3.92 0.80559 Masitinib 8.634 6.986 0.809127 Aminopurvalanol A 10.922 8.874 0.812489 KU57788 5.89 4.787 0.812733 Parthenolide 8.372 6.806 0.812948 Thioridazine hydrochloride 4.494 3.667 0.815977 AG13958 4.096 3.346 0.816895 Fenretinide 2.988 2.447 0.818942 Octoclothepin maleate 11.375 9.351 0.822066 PHTPP 4.922 4.074 0.827712 Merck-22-6 5.053 4.193 0.829804 beta-Lapachone 2.155 1.798 0.834339 PD-184161 4.762 3.994 0.838723 BIBR-1048 10.09 8.505 0.842914 CCT129202 3.673 3.103 0.844814 SU11274 7.157 6.077 0.849099 ZK 164015 8.246 7.028 0.852292 Tamoxifen citrate 4.059 3.486 0.858832 2,3-DCPE hydrochloride 12.113 10.409 0.859325 Oxamflatin 0.99 0.851 0.859596 NNC 55-0396 dihydrochloride 3.254 2.802 0.861094 GBR-12935 dihydrochloride 4.457 3.838 0.861117 L-703,606 oxalate salt hydrate 3.51 3.029 0.862963 Bisindoylmaleimide X (Ro 31-8425) 7.517 6.488 0.86311 Ellipticine 2.511 2.178 0.867384 Bosutinib (SKI-606) 2.804 2.439 0.869829 PD 198306 4.175 3.633 0.87018 Nilotinib 2.935 2.574 0.877002 CD 1530 4.453 3.906 0.877161 SAHA 2.298 2.017 0.87772 Propylnorapomorphine hydrochloride 10.073 8.854 0.878983 Sertaconazole nitrate 11.763 10.367 0.881323 LY500307 6.118 5.395 0.881824 Raloxifene hydrochloride 12.26 10.819 0.882463
196
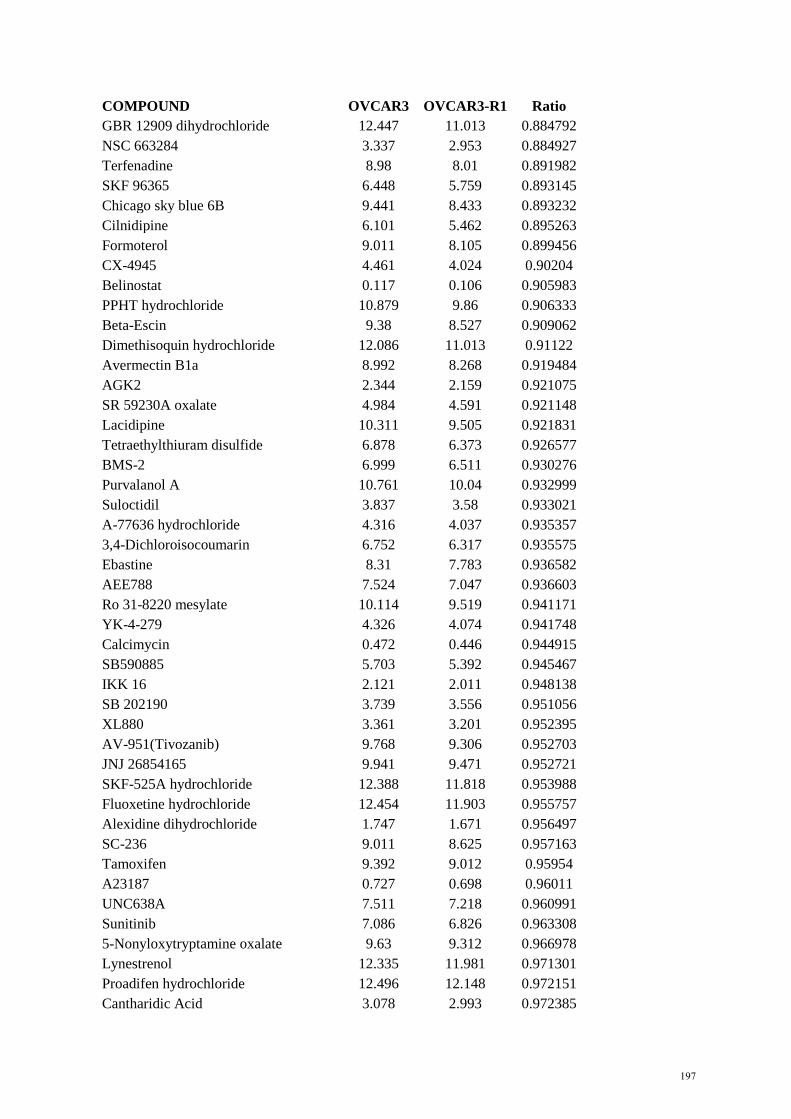
COMPOUND OVCAR3 OVCAR3-R1 Ratio GBR 12909 dihydrochloride 12.447 11.013 0.884792 NSC 663284 3.337 2.953 0.884927 Terfenadine 8.98 8.01 0.891982 SKF 96365 6.448 5.759 0.893145 Chicago sky blue 6B 9.441 8.433 0.893232 Cilnidipine 6.101 5.462 0.895263 Formoterol 9.011 8.105 0.899456 CX-4945 4.461 4.024 0.90204 Belinostat 0.117 0.106 0.905983 PPHT hydrochloride 10.879 9.86 0.906333 Beta-Escin 9.38 8.527 0.909062 Dimethisoquin hydrochloride 12.086 11.013 0.91122 Avermectin B1a 8.992 8.268 0.919484 AGK2 2.344 2.159 0.921075 SR 59230A oxalate 4.984 4.591 0.921148 Lacidipine 10.311 9.505 0.921831 Tetraethylthiuram disulfide 6.878 6.373 0.926577 BMS-2 6.999 6.511 0.930276 Purvalanol A 10.761 10.04 0.932999 Suloctidil 3.837 3.58 0.933021 A-77636 hydrochloride 4.316 4.037 0.935357 3,4-Dichloroisocoumarin 6.752 6.317 0.935575 Ebastine 8.31 7.783 0.936582 AEE788 7.524 7.047 0.936603 Ro 31-8220 mesylate 10.114 9.519 0.941171 YK-4-279 4.326 4.074 0.941748 Calcimycin 0.472 0.446 0.944915 SB590885 5.703 5.392 0.945467 IKK 16 2.121 2.011 0.948138 SB 202190 3.739 3.556 0.951056 XL880 3.361 3.201 0.952395 AV-951(Tivozanib) 9.768 9.306 0.952703 JNJ 26854165 9.941 9.471 0.952721 SKF-525A hydrochloride 12.388 11.818 0.953988 Fluoxetine hydrochloride 12.454 11.903 0.955757 Alexidine dihydrochloride 1.747 1.671 0.956497 SC-236 9.011 8.625 0.957163 Tamoxifen 9.392 9.012 0.95954 A23187 0.727 0.698 0.96011 UNC638A 7.511 7.218 0.960991 Sunitinib 7.086 6.826 0.963308 5-Nonyloxytryptamine oxalate 9.63 9.312 0.966978 Lynestrenol 12.335 11.981 0.971301 Proadifen hydrochloride 12.496 12.148 0.972151 Cantharidic Acid 3.078 2.993 0.972385
197

COMPOUND OVCAR3 OVCAR3-R1 Ratio Toremifene 11.325 11.013 0.97245 CUDC-101 8.374 8.159 0.974325 SB 228357 5.802 5.676 0.978283 Astemizole 7.993 7.823 0.978731 BIO 3.628 3.552 0.979052 SB 216641 hydrochloride 2.726 2.671 0.979824 Zotepine 11.913 11.675 0.980022 Nebivolol 4.078 3.998 0.980383 PD173955-Analogue 1 6.519 6.393 0.980672 SNS-314 5.525 5.453 0.986968 Mitotane 12.497 12.36 0.989037 BML-281 0.751 0.743 0.989348 BMS 191011 9.297 9.208 0.990427 TG101209 4.539 4.499 0.991187 Methyl benzethonium chloride 3.345 3.317 0.991629 Isoconazole 11.941 11.867 0.993803 Felodipine 3.672 3.656 0.995643 10-DEBC hydrochloride 9.44 9.401 0.995869 Stattic 3.131 3.122 0.997126 CGP 7930 9.795 9.785 0.998979 BML-284 0.376 0.377 1.00266 Ritanserin 6.784 6.818 1.005012 Chlorpromazine hydrochloride 10.521 10.574 1.005038 Cediranib 4.446 4.471 1.005623 Dicyclomine hydrochloride 12.362 12.467 1.008494 Pimozide 2.788 2.814 1.009326 ZK 93426 hydrochloride 12.013 12.143 1.010822 CYT387 7.079 7.158 1.01116 cis-Diethyl tetrahydro-2,8-chrysenediol 11.416 11.555 1.012176 Sertindole 8.611 8.724 1.013123 PCI-24781 0.073 0.074 1.013699 Palmitoylcarnitine chloride 10.595 10.776 1.017084 Benzethonium chloride 3.42 3.481 1.017836 Eliprodil 6.298 6.423 1.019848 Amsacrine hydrochloride 3.067 3.141 1.024128 PD173955 4.644 4.759 1.024763 Niguldipine hydrochloride 2.011 2.064 1.026355 Alfacalcidol 11.381 11.736 1.031192 NVP-ADW742 3.651 3.778 1.034785 SGI-1776 5.24 5.423 1.034924 CCT 018159 11.201 11.604 1.035979 Triclosan 9.302 9.65 1.037411 A-7 hydrochloride 9.271 9.623 1.037968 Clioquinol 10.979 11.401 1.038437 BMS-193885 4.356 4.532 1.040404
198

COMPOUND OVCAR3 OVCAR3-R1 Ratio Fluspirilen 9.954 10.38 1.042797 Lylamine hydrochloride 9.158 9.563 1.044224 AC-93253 iodide 0.416 0.435 1.045673 Benfluorex hydrochloride 11.841 12.397 1.046955 Vinpocetine 10.591 11.108 1.048815 PD-166285 0.401 0.422 1.052369 Azathioprine 3.299 3.476 1.053653 N-Oleoyldopamine 9.045 9.55 1.055832 GR 127935 hydrochloride 10.067 10.642 1.057117 TG-89 4.171 4.416 1.058739 AC220 7.114 7.554 1.06185 IMS2186 1.297 1.378 1.062452 ZM 39923 hydrochloride 4.453 4.752 1.067146 Sorafenib Tosylate 5.083 5.428 1.067873 Thonzonium bromide 9.703 10.369 1.068639 Y-29794 2.533 2.707 1.068693 SB 525334 11.623 12.439 1.070206 Tyrphostin AG 879 8.028 8.592 1.070254 Efavirenz 8.791 9.445 1.074394 Retinoic acid p-hydroxyanilide 3.428 3.689 1.076138 Maprotiline hydrochloride 11.227 12.106 1.078293 ZM 449829 5.742 6.235 1.085859 Chlorprothixene 9.102 9.893 1.086904 BIIB021 3.234 3.533 1.092455 Trifluoperazine dihydrochloride 2.817 3.09 1.096912 AY 9944 11.344 12.458 1.098202 R428 5.033 5.564 1.105504 DL-erythro-Dihydrosphingosine 9.957 11.013 1.106056 Perphenazine 10.42 11.603 1.113532 MLN2238 0.044 0.049 1.113636 T 0901317 5.067 5.646 1.114269 Verteporfin 9.417 10.534 1.118615 RS 39604 hydrochloride 5.557 6.257 1.125967 ABT-737 6.729 7.581 1.126616 7-Cyclopentyl-5-(4-phenoxy)phenyl-7H-pyrrolo[2,3-d]pyrimidin-4-ylamine 10.722 12.092 1.127775 JQ1 1.396 1.581 1.132521 CGP-7930 10.532 11.952 1.134827 Cyclosporin A 2.983 3.423 1.147503 Thiethylperazine dimalate 10.82 12.479 1.153327 BS-181 hydrochloride 9.007 10.391 1.153658 MLN9708 0.065 0.075 1.153846 TG101348 5.141 5.935 1.154445 GF 109203X 5.743 6.668 1.161066 Tyrphostin A9 3.956 4.594 1.161274
199

COMPOUND OVCAR3 OVCAR3-R1 Ratio AZ-960 3.679 4.283 1.164175 GSK J4 2.662 3.108 1.167543 Econazole nitrate 6.709 7.878 1.174244 PD 102807 10.479 12.391 1.18246 Dequalinium dichloride 5.788 6.847 1.182965 TG-46 3.623 4.287 1.183274 AV-412 1.779 2.107 1.184373 Salmeterol xinafoate 7.87 9.353 1.188437 Mercaptopurine 1.324 1.574 1.188822 L-733,060 hydrochloride 10.209 12.279 1.202762 5-(N,N-hexamethylene)amiloride 9.353 11.374 1.21608 Dequalinium chloride hydrate 3.837 4.692 1.22283 NSC 95397 1.855 2.275 1.226415 SNAP 5089 3.933 4.848 1.232647 CP-31398 dihydrochloride hydrate 9.721 12.001 1.234544 Prazosin hydrochloride 7.309 9.029 1.235326 Digoxigenin 0.147 0.184 1.251701 Danusertib 5.958 7.467 1.253273 PD 407824 2.969 3.729 1.255978 Clomipramine hydrochloride 3.726 4.681 1.256307 Axitinib 9.753 12.391 1.270481 YM201636 9.323 11.858 1.271908 AP24534 2.508 3.21 1.279904 EX 527 7.278 9.354 1.285243 Triflupromazine hydrochloride 4.459 5.92 1.327652 AT-7519 4.529 6.034 1.332303 WZ8040 2.377 3.227 1.357594 K114 7.829 10.659 1.361477 Vandetanib 8.635 11.782 1.364447 2,3-Dimethoxy-1,4-naphthoquinone 4.716 6.463 1.370441 Estradiol Valerate 8.846 12.173 1.376102 Gossypol 4.023 5.539 1.376833 Lidoflazine 3.213 4.426 1.377529 BI-D1870 5.401 7.441 1.377708 Ziprasidone 8.666 11.946 1.378491 PD-407824 2.558 3.529 1.379593 L-741,626 8.975 12.413 1.383064 Indatraline hydrochloride 3.054 4.244 1.389653 Chloroxine 8.651 12.023 1.389782 L-687,384 hydrochloride 7.043 9.857 1.399546 JTC 801 2.833 3.967 1.400282 Eticlopride hydrochloride 8.28 11.723 1.415821 Hesperadin 2.614 3.713 1.420428 PF-2341066 5.115 7.303 1.427761 PHA-793887 4.841 6.964 1.438546
200

COMPOUND OVCAR3 OVCAR3-R1 Ratio GDC-0941 4.648 6.692 1.439759 Metergoline 4.331 6.237 1.440083 ZSTK474 2.59 3.731 1.440541 MG 132 0.205 0.299 1.458537 Aurora A Inhibitor I 1.022 1.498 1.465753 Niclosamide 3.406 5.086 1.493247 AMG-47a 5.328 8.069 1.514452 Tetrindole mesylate 5.806 8.805 1.516535 BIX 01294 trihydrochloride hydrate 6.15 9.363 1.522439 IMD 0354 1.104 1.687 1.52808 Cantharidin 3.655 5.631 1.540629 LY2784544 4.344 6.715 1.54581 Clomiphene citrate (Z,E) 7.208 11.333 1.572281 PHA690509 7.435 11.739 1.578884 NVP-TAE684 2.478 3.993 1.61138 MNS 2.455 3.958 1.61222 SCH 79797 dihydrochloride 1.474 2.394 1.624152 Zuclopenthixol hydrochloride 7.479 12.279 1.641797 Simvastatin 4.505 7.49 1.662597 Mibefradil dihydrochloride 5.244 8.799 1.677918 PD-156707 6.564 11.086 1.688909 Pyrimethamine 2.106 3.559 1.689934 Camptothecine 0.177 0.31 1.751412 3`-Fluorobenzylspiperone maleate 3.713 6.506 1.752222 Droxinostat 2.239 3.953 1.76552 WZ4002 2.287 4.107 1.795802 TW-37 3.301 6.18 1.87216 Doxorubicin hydrochloride 0.402 0.756 1.880597 BMS-3 0.589 1.119 1.89983 Amlodipine besylate 5.262 10.162 1.931205 SR 33805 oxalate 5.077 9.832 1.936577 ARP 101 1.418 2.749 1.938646 RAF265 6.272 12.205 1.94595 IC 261 5.303 10.335 1.948897 Thimerosal 0.997 1.978 1.983952 SRT1720 0.824 1.638 1.987864 NNC 26-9100 4.114 8.211 1.995868 Dasatinib 2.112 4.216 1.996212 GBR 13069 dihydrochloride 5.126 10.311 2.01151 AT13387 2.989 6.063 2.028438 ON-01910 0.35 0.717 2.048571 THC 5.693 11.789 2.070789 3-CPMT 5.309 11.105 2.091731 17-DMAG 0.584 1.24 2.123288 A-674563 2.434 5.347 2.196795
201
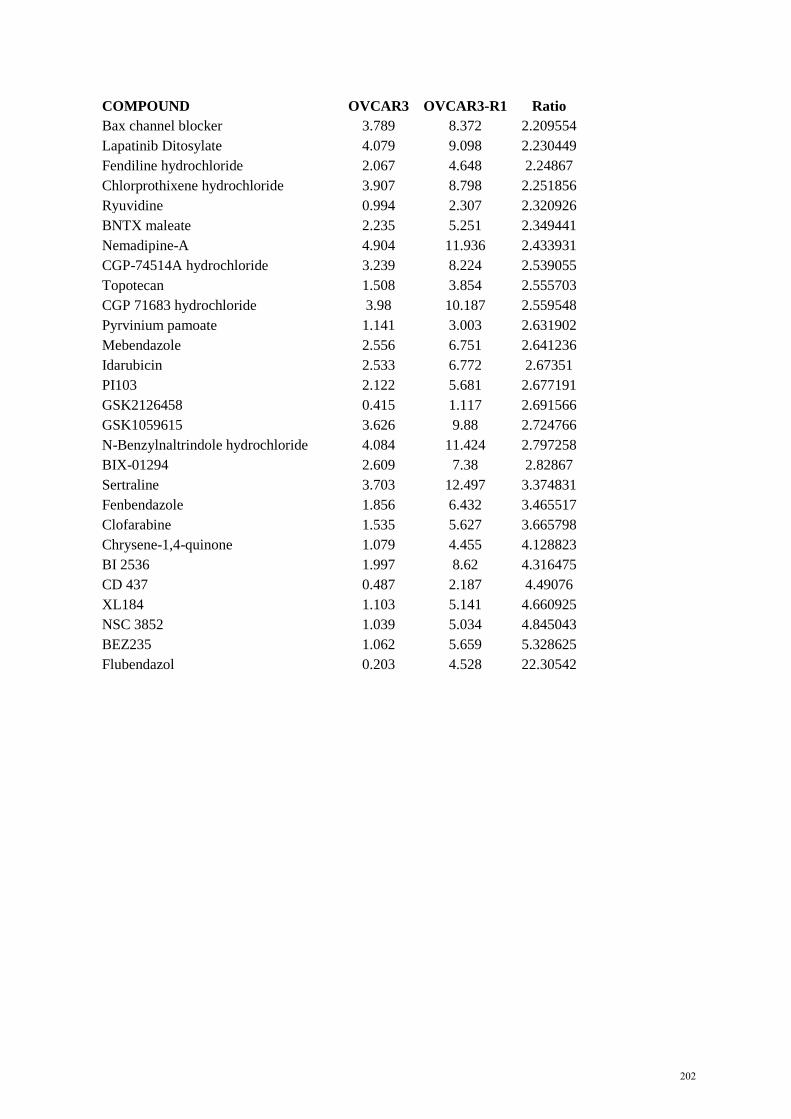
COMPOUND OVCAR3 OVCAR3-R1 Ratio Bax channel blocker 3.789 8.372 2.209554 Lapatinib Ditosylate 4.079 9.098 2.230449 Fendiline hydrochloride 2.067 4.648 2.24867 Chlorprothixene hydrochloride 3.907 8.798 2.251856 Ryuvidine 0.994 2.307 2.320926 BNTX maleate 2.235 5.251 2.349441 Nemadipine-A 4.904 11.936 2.433931 CGP-74514A hydrochloride 3.239 8.224 2.539055 Topotecan 1.508 3.854 2.555703 CGP 71683 hydrochloride 3.98 10.187 2.559548 Pyrvinium pamoate 1.141 3.003 2.631902 Mebendazole 2.556 6.751 2.641236 Idarubicin 2.533 6.772 2.67351 PI103 2.122 5.681 2.677191 GSK2126458 0.415 1.117 2.691566 GSK1059615 3.626 9.88 2.724766 N-Benzylnaltrindole hydrochloride 4.084 11.424 2.797258 BIX-01294 2.609 7.38 2.82867 Sertraline 3.703 12.497 3.374831 Fenbendazole 1.856 6.432 3.465517 Clofarabine 1.535 5.627 3.665798 Chrysene-1,4-quinone 1.079 4.455 4.128823 BI 2536 1.997 8.62 4.316475 CD 437 0.487 2.187 4.49076 XL184 1.103 5.141 4.660925 NSC 3852 1.039 5.034 4.845043 BEZ235 1.062 5.659 5.328625 Flubendazol 0.203 4.528 22.30542
202

Appendix C. Compound list for secondary screen OVCAR3 vs SKOV3 Compound Primary Target Azathioprine Anti-metabolite AT9283 AUR TW-37 Bcl-2 Gossypol Bcl-2 ABT-199 Bcl-2 Obatoclax Mesylate Bcl-2 ABT-737 Bcl-2 HA14-1 Bcl-2 Pifithrin-mu Bcl-2 ABT-263 Bcl-2 ABT-x1 Bcl-XL ABT-x2 Bcl-XL Flavopiridol CDK JNJ7706621 CDK AT-7519 CDK SNS-032 CDK Purvalanol B CDK PHA690509 CDK A-674563 CDK BS-181 hydrochloride CDK PD0332991 CDK PHA-793887 CDK Roscovitine CDK Indirubin CDK NSC 693868 CDK NU2058 CDK NU6027 CDK Kenpaullone CDK SB 218078 Chk1 PD-407824 Chk1 AZD7762 Chk1 Doxorubicin hydrochloride DNA intercalating Daunorubicin hydrochloride DNA intercalating RAF265 RAF kinase inhibitor Ro 08-2750 NGF inhibitor AZD1480 JAK Parthenolide MAP kinase inhibitor Quinacrine dihydrochloride Monoamine oxydase inhibitor Dasatinib Multi-kinase inhibitor (Bcr-Abl, Src) MP-470 Multi-kinase inhibitor (c-Met, c-Kit, PDGFR, Flt3, Src) Pazopanib Multi-kinase inhibitor (VEGFR, c-Kit, PDGFR) XL184 Multi-kinase inhibitor (VEGFR, c-Met, Flt, Tie-2, c-Kit) Apomorphine hydrochloride Non-selective dopamine receptor agonist ABT-888 PARP
203
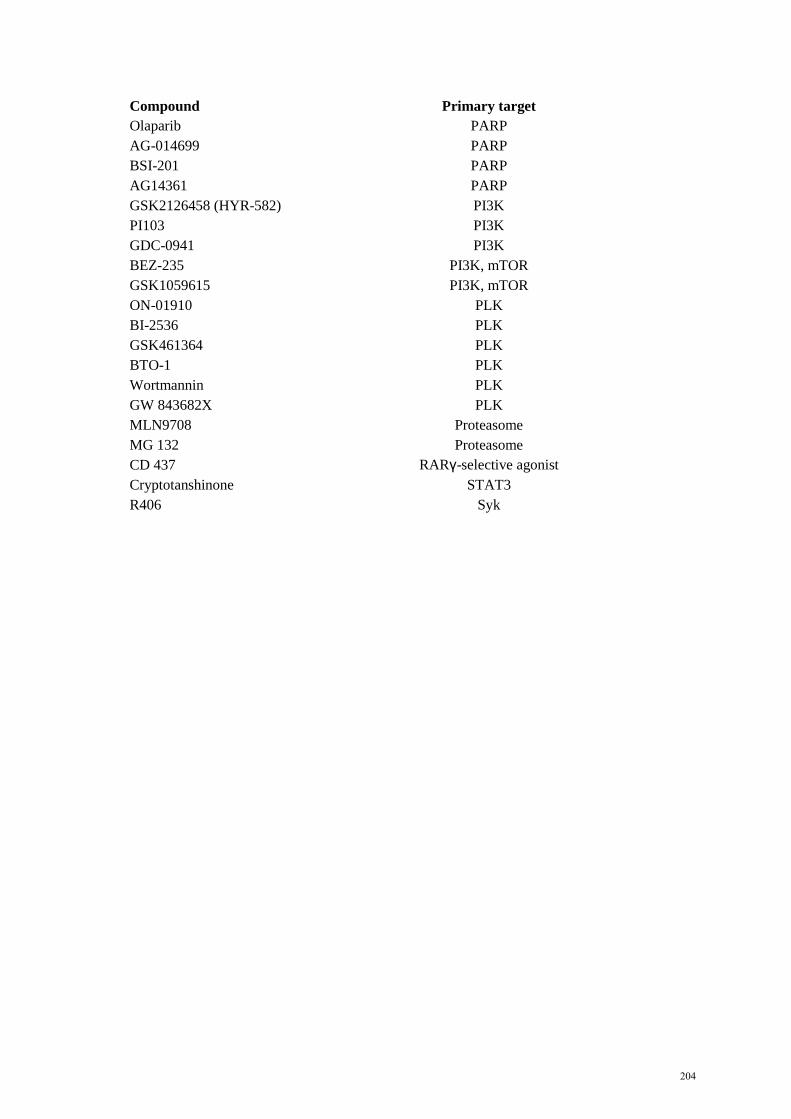
Compound Primary target Olaparib PARP AG-014699 PARP BSI-201 PARP AG14361 PARP GSK2126458 (HYR-582) PI3K PI103 PI3K GDC-0941 PI3K BEZ-235 PI3K, mTOR GSK1059615 PI3K, mTOR ON-01910 PLK BI-2536 PLK GSK461364 PLK BTO-1 PLK Wortmannin PLK GW 843682X PLK MLN9708 Proteasome MG 132 Proteasome CD 437 RARγ-selective agonist Cryptotanshinone STAT3 R406 Syk
204

Appendix D. Compound list for secondary screen OVCAR3-R1 vs OVCAR3 Compound Primary Target Phorbol 12-myristate 13-acetate Activates protein kinase C MK-2206 AKT 10-DEBC hydrochloride AKT/PKB AM 404 Anandamide transport inhibitor Thioguanosine Anti-metabolite Ivermectin Anti-parasitic KU55933 ATM SNS-314 AUR ABT-263 Bcl-2 Pifithrin µ Bcl-2 ABT-737 Bcl-2 Obatoclax Mesylate Bcl-2 Gossypol Bcl-2 TW-37 Bcl-2 ABT-199 Bcl-2 ABT-x1 Bcl-XL ABT-x2 Bcl-XL GDC-0879 B-RAF NNC 55-0396 Calcium channel blocker Mibefradil dihydrochloride Calcium channel blocker AZD7762 CHK Fluphenazine dihydrochloride D1/D2 dopamine receptor antagonist 7-Hydroxy-PIPAT maleate D3 agonist (D3 > D2) Prochlorperazine dimaleate Dopamine receptor antagonist GBR 12909 dihydrochloride Dopamine reuptake inhibitor Pelitinib EGFR WZ3146 EGFR Erlotinib EGFR Gefitinib EGFR Canertinib EGFR BMS-599626 EGFR, HER2 Neratinib EGFR, HER2 AEE788 EGFR, HER2 GW2974 EGFR, HER2 GW583340 EGFR, HER2 GSK343 EZH2 Scriptaid HDAC SB939 HDAC MS-275 HDAC Mocetinostat HDAC Vorinostat HDAC Rocilinostat HDAC 17-AAG (Geldanamycin) HSP90 SB202190 MAPK
205

Compound Primary target SB242235 MAPK SD169 MAPK TAK-715 MAPK RWJ-67657 MAPK PHA 665752 MET Sorafenib Multi-kinase inhibitor (VEGFR, c-Kit, PDGFR) Pazopanib Multi-kinase inhibitor (VEGFR, c-Kit, PDGFR) Ki8751 Multi-kinase inhibitor (VEGFR, c-Kit, PDGFR, FGFR) Sunitinib Multi-kinase inhibitor (VEGFR, PDGFR, BRAF) ABT-869 Multi-kinase inhibitor (VEGFR, PDGFR, CSF-1R) NTNCB hydrochloride Neuropeptide Y antagonist LY2228820 p38 MAPK PIK-75 Hydrochloride PI3K, DNA-PK BEZ-235 PI3K, mTOR GR 127935 Selective 5-HT1B/1D serotonin receptor antagonist Demethylasterriquinone B1 Selective insulin RTK activator Bosutinib Src RO495 TYK2 RS-17053 α1A-adrenoceptor antagonist IPAG σ-receptor antagonist
206

Minerva Access is the Institutional Repository of The University of Melbourne
Author/s:
Au-Yeung, George
Title:
Cyclin E1 as a therapeutic target in high grade serous ovarian cancer
Date:
2017
Persistent Link:
http://hdl.handle.net/11343/191772
File Description:
Complete thesis: Cyclin E1 as a therapeutic target in high grade serous ovarian cancer
Terms and Conditions:
Terms and Conditions: Copyright in works deposited in Minerva Access is retained by the
copyright owner. The work may not be altered without permission from the copyright owner.
Readers may only download, print and save electronic copies of whole works for their own
personal non-commercial use. Any use that exceeds these limits requires permission from
the copyright owner. Attribution is essential when quoting or paraphrasing from these works.