Embed Size (px)
Citation preview

1
Geophysics for Sediment Hosted Copper and Gold Mineralisation,
The Role of 3DIP
B. Bourne, Principal Consultant, Terra ResourcesL. Beinke , Senior Consultant, Terra Resources 21st February 2017(E) [email protected] (P) +61 409 493 485(W) www.terraresources.com.au

2
Introduction
Sediment hosted copper Lumwana copper deposit Caribou Dome copper deposit
Acknowledgements to Barrick Gold and Polar X Thank you to Terra Resources geophysicists (my co-
author Lynelle and Anthony)

3
Introduction - Sediment Hosted Cu Deposits
Sediment-hosted, Stratiform Base Metal Deposits
Two subclasses
1. Sediment-Hosted Copper2.Sediment Hosted Pb-Zn Deposits (SedEx- Sedimentary Exhalative)
SedEx (Sedimentary Exhalative Deposits) are defined as the formation of precipitated ore deposits due to the interaction of metal bearing hydrothermal fluids and seawater.
Economically a major source of Lead and Zinc. Also Cu, Au, Ag and W amongst other minerals.
Occur as clusters or stacked lenses
Major deposits formed within reduced pyritic, organic-rich, calcareous shales an metamorphic equivalent. Remaining third occurring within sandstones.
Host rocks occur as anoxic coastal marine sediments overlying oxidised continental clastic sediments. Forming through precipitation
Abundant deposits within Upper Proterzoic and Upper Paleozoic rocks deposited in arid and semi-arid area in continental rift environments
Figure 1. Generalised genetic model for deposit scale sedimenthosted stratiform Cu deposits (Brown 1992) Pore withinfootwall redbeds occupied by aqueous brine containingdissolved copper. Interaction with in situ sulphides duringmigration into basal greybeds results in cupriferous sulphideprecipitates.

4
Central African Copper Belt – Regional Geological Setting
Overview of the Central African Copperbelt outlining the international boundaries of the basement-proximal Zambian Copperbelt and basement-distal DRC Copperbelt.

5
Katanga Supergroup- Stratigraphic Column
Simplified representation of the stratigraphic column and graphs outlining the transgressive-regressive sedimentary cycles in oreformation within the Copperbelt (Eden, 1974). Ore bodies are restricted to the Lower Roan Group of the Katanga Supergroup.

6
Kamoa Cu Deposit (DRC) - Ivanhoe

7
ANGOLA
Roan GroupPost-Kundelungu
Basement
Muva SedimentsKaroo Sediments
Mufapanda100km
DEMOCRATIC REPUBLICOF CONGO
ZAMBIA2010 Cu productionProject Name
Labels
Nkana(Mopani)
197Kt
Kamoto56Kt
Nchanga217Kt
Konkola80Kt Mufulira
(Mopani)
Kansanshi230Kt
Tenke Fungurume120Kt
LUMWANA
Lumwana Copper Mine
ANGOLIA10 - 20 Mt
> 3
5 - 10 Mt
Historical
1 - 3
1 - 5 Mt
Development
0.5 - 1
0 - 1 Mt
Operating
0 - 0.5Cu Grade %
Cu Endowment
Project Status

8
Zambia DR Congo
(modified from Cailteux et al., 1994)
Lumwana CuZn
Kipushi
Kansanshi
Frontier
ZCB-proper Deposit Types
Central African Copperbelt Stratigraphy

9
Bi-lobate open dome of old Proterozoic Basement similar but more metamorphosed than the Copperbelt Basement
Internal geology comprise a number stacked thrusts sheets composed predominantly of Basement with some Katangan
Separated from the younger Katangan by a major layer parallel shear zone
Cu deposits hosted within sheared & altered Basement
Mutoma
Odile
Malundwe
Lubwe
Chimiwungo
10km Basement
Rimming QuartziteKatangan
FaultThrust Sheets
Lumwana - Geology

10
Lumwana – Stratigraphy
Basement GneissBasement Gneiss
MALUNDWE SHEET CHIMIWUNGO SHEET
Upper Ore SchistMalundwe Ore Schist
Top of Early Shear Zone
Thrust
Mottled Schist
Hanging WallOre PackageFootwallNguba / Kundelungo
Mottled SchistEpidote Schist
Main Ore Schist
Lower Ore Schist
Basement Gneiss &Mottled Schist
Locally QuartziteLower Roan
Middle Gneiss
Lower Gneiss
Quartzite Lower RoanMuscovite-Quartz Schist
Lower Roan?
Carbonates, amphibolites,gabbros & pelites
Vertical Scale
50m

11
Chimiwungo Sequence
Sect
ion
Chimiwungo - Geology

12
500m
S (Looking West)
1000RL
1500RLN
Leached overburdenHangingwall gneissOxide oreOre schistsMiddle gneissFootwall schist
$1.20/ lb Cu P it Shell
$2.50/ lb CuPit Shell
Hangingwall Gneiss• pink to grey qtz-fsp-biotite gneiss to schist
Upper Ore Schist• grey mus-phl-qtz-ky-cpy+ py-po schist
Middle Gneiss• grey qtz-fsp-biotite gneiss to schist
Middle Ore Schist• mus-phl-qtz-ky-cpy+ bn
$3.50/ lb CuPit Shell
Chimiwungo - Geology

13
Chimiwungo - Mineralisation
5mm
Cpy – py – po with earlier cpy – bn in lower ore schist

14
Chimiwungo – Petrophysics
Strong correlation of copper mineralisation and increased chargeability
Chargeability greater than 16msec – ore Chargeability from 12-16msec - ore dominant
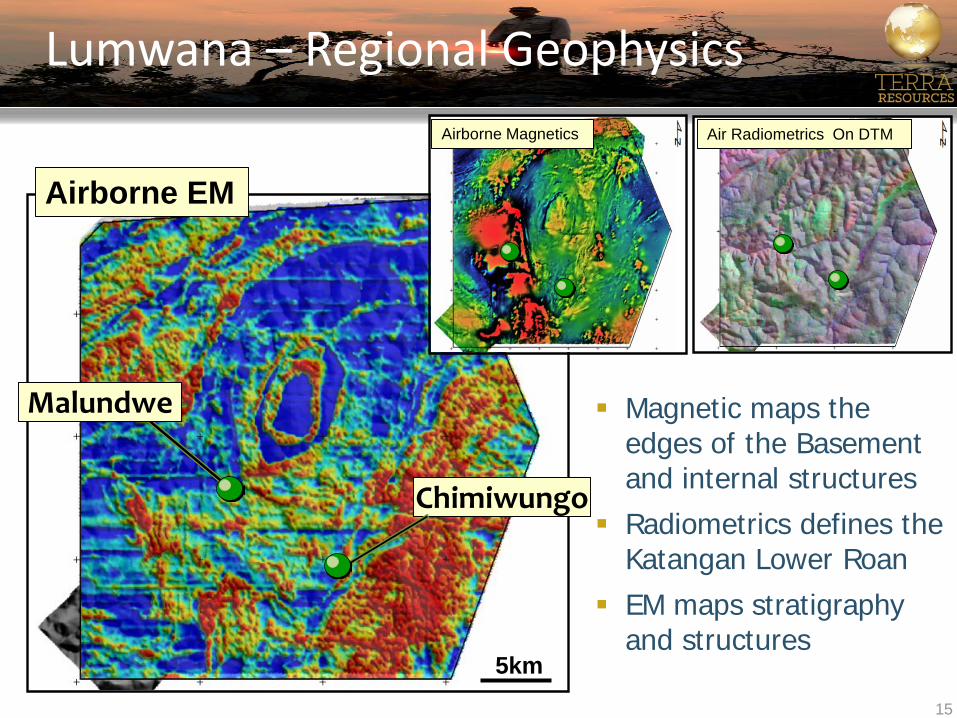
15
Magnetic maps the edges of the Basement and internal structures
Radiometrics defines the Katangan Lower Roan
EM maps stratigraphyand structures
Chimiwungo
Airborne EM
5km
Air Radiometrics On DTM Airborne Magnetics
Malundwe
Lumwana – Regional Geophysics

16
Chimiwungo IP – Survey DetailsArray Type Double Offset Pole-Dipole IP
Transmitter Search WB30 30KVa
Receiver Search SSIP 96 channel, full waveform
Current Electrode 2 foil pits per station
Potential Electrode CuSO4 pot
Input Current: 0.5-5.1A
Frequency 0.125Hz
Tx Infinite >2.5km
Tx Line Spacing 400m
Tx Pole Spacing 100m
Rx Line Spacing 400m (200m from Tx line)
Rx Dipole (A) Spacing 100m (200m, 400m derived)
Line Orientation Chimi Nth, Mutoma – E-W; Chimi SW – WNW-ESE

17
Chimiwungo IP – Survey Details

18
Chimiwungo IP – Processing and ModellingProcessingScientific Computing Application TQIPdb software1) correcting for transmitter and receiver station locations;2) checking input currents and voltage potentials;3) reviewing measured resistivity and chargeability values. Poor data (based on repeatability and decay) were removed before being averaged into Newmont Standard time windows (450-1100ms) to perform 3D modelling. The large amount of data redundancy allowed for the removal of poor data without any effect of the quality of the modelling results.
ModellingUBC’s DCIP3D modelling software.Numerous 2D and 3D models were undertaken order to choose the most optimal parameterisation in terms of the following:1) Resistivity % error and error floor;2) IP % error and error floor;3) Cell/mesh definitions;4) Length/Alpha scale:5) Regularisation mode and Chi-factor and;6) Number of iterations.

19
Chimiwungo IP/resistivity – Results
Depth of investigation +500m

20
Chimiwungo IP – Results

21
Chimiwungo IP – Results
Resistivity maps Chimi South Fault and Katanganstratigraphy
Chimi SthFault
1250mRL (-150m)

22
Sediment Hosted – Replacement Style
Australian examples are atypical sediment hosted copper deposits (Mt Isa)
Variations from SEDEX to epigenetic Cu
Good grade (Average 1.77% Cu)
Associated base metals as pathfinders or ore
OC and UG potential
Moderate to large footprint

23
Caribou Dome – Regional Geology

24
Caribou Dome – Geology
5km

25
Caribou Dome – Mineralisation
Sample COV0002

26
Caribou Dome – Petrophysics
Sample Information SCIP Inductive ConductivitySample Comments Resistivity Chargeability Conductivity Conductivity Conductivity
ID (Ω∙m) (mV/V) S/m S/m S/mCOV0001B Block- coil parallel to fabric 57.89 86.75 4.30 3.90 3.60COV0001A Block – coil perpendicular to fabric 24.16 67.21 2.40 2.20 2.60COV0002 Quarter Core n/a n/a 0.10 0.00 0.00
Sample COV0001BSample COV0001A Sample COV0002

27
Caribou Dome – Airborne Magnetics
Aeromagnetic data valuable in prioritising IP anomalies.
Highest-priority IP anomalies are located at or near the contact between the magnetic volcanic sequence of rocks and the non-magnetic sedimentary sequence of rocks.
Aeromagnetic data define this preferred stratigraphic level well.
High priority IP targets on image of airborne magnetics data.
28
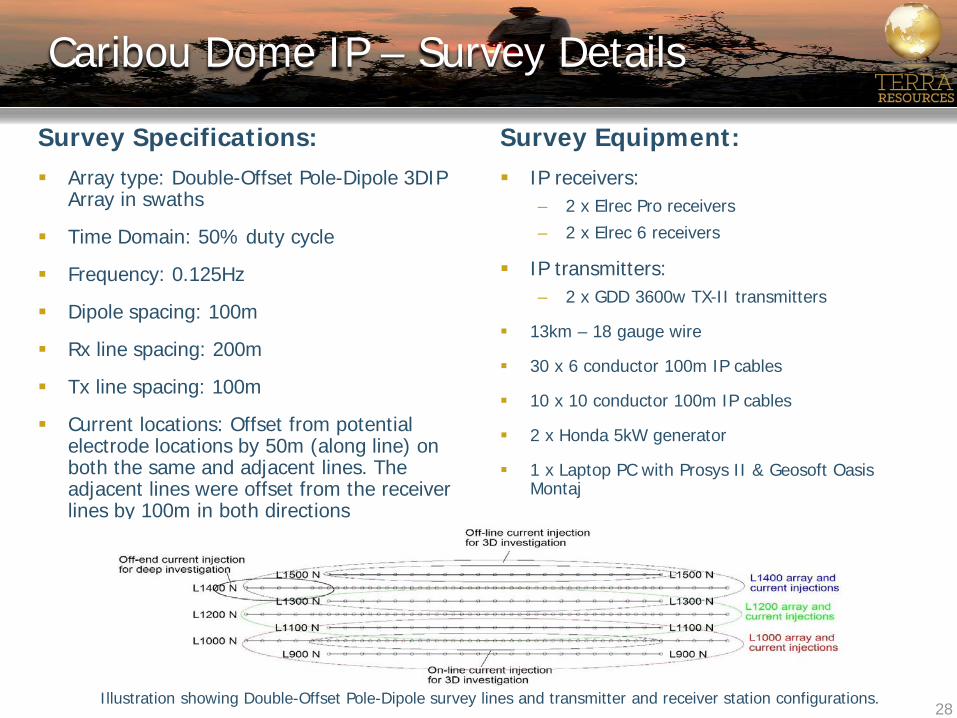
Caribou Dome IP – Survey Details
Survey Specifications: Array type: Double-Offset Pole-Dipole 3DIP
Array in swaths
Time Domain: 50% duty cycle
Frequency: 0.125Hz
Dipole spacing: 100m
Rx line spacing: 200m
Tx line spacing: 100m
Current locations: Offset from potential electrode locations by 50m (along line) on both the same and adjacent lines. The adjacent lines were offset from the receiver lines by 100m in both directions
Survey Equipment: IP receivers:
– 2 x Elrec Pro receivers– 2 x Elrec 6 receivers
IP transmitters:– 2 x GDD 3600w TX-II transmitters
13km – 18 gauge wire
30 x 6 conductor 100m IP cables
10 x 10 conductor 100m IP cables
2 x Honda 5kW generator
1 x Laptop PC with Prosys II & Geosoft Oasis Montaj
Illustration showing Double-Offset Pole-Dipole survey lines and transmitter and receiver station configurations.

29
Caribou Dome IP – Survey Details
Map of survey area showing location of IP lines and station locations on elevation image. Final modelling area depicted in black polygon
Broad coverage with enough detail to resolve geological problem
Achieve greater depth penetration (off-end Tx injection)
Good lateral and across-line resolution
High data redundancy so noisy data points can be ignored

30
Caribou Dome IP – Terrain

31
Caribou Dome IP - Processing & Modelling
Results of 3D PDIP modelling showing resistivity volume in local coordinates.
Results of 3D PDIP modelling showing chargeability volume in local coordinates.
96 x lines (32 blocks) total to n=6
Corrected for Tx/Rx station locations
QA/QC input currents (I) and voltage potentials (Vp’s), remove noisy and/or poorly recorded data, within TQIPdb
Averaged in Newmont Standard time windows (450-1100ms) and output to perform modelling within UBC3D
Optimal inversion parameters chosen from numerous preliminary 2D and 3D modelling

32
Caribou Dome IP – Results
Map of survey area showing location of high priority (black outlines) and lower priority (blue outline) IP targets with respect to chargeability at -100m below surface. Red areas show known zones of mineralisation.

33
Caribou Dome IP – Results
Map of survey area showing location of high priority (black outlines) and lower priority (blue outline) IP targets with respect to resistivity at -100m below surface. Red areas show known zones of mineralisation.

34
Caribou Dome IP – Results
Map of survey area showing location of high priority (black outlines) and lower priority (blue outline) IP targets with respect to surface sampling for copper concentrations. Red areas show known zones of mineralisation.

35
Caribou Dome – Induced Polarisation

36
Conclusion
The two examples show the sediment hosted copper deposits are not inductively conductive and the dominant EM response is pyritic siltstones/shales The petrophysics have been important in determining
which geophysical techniques to apply and how to best target mineralisation Both Cu deposits are chargeable and were able to be
targeted directly with 3DIP

37
Geophysics for Sediment Hosted Copper and Gold Mineralisation,
The Role of 3DIP
B. Bourne, Principal Consultant, Terra ResourcesL. Beinke , Senior Consultant, Terra Resources 21st February 2017(E) [email protected] (P) +61 409 493 485(W) www.terraresources.com.au


![[2014] Sediment-Hosted Gold Deposits of the World](https://img.dokumen.tips/doc/110x75/55cf882455034664618dc19c/2014-sediment-hosted-gold-deposits-of-the-world.jpg)