Embed Size (px)
Citation preview

I I I I I I I I I I I I I I I I I I I
GEOPHYSICAL SURVEYS REPORT
on the
BUTT URANIUM RARE EARTH PROPERTY
BUTT TOWNSHIP
DISTRICT OF NIPISSING
ONTARIO
FOR 2. 45460
RECEIVED GRIFTCO CORPORATION
prepared by:
JUN 1 6 2010
GEOSCIENCE ASSESSMENT OFFICE
Dan Patrie Exploration Ltd.
L.D.S. Winter, P.Geo.
7 June 2010

I I I I I I I I I I I I I I I I I I I
TABLE OF CONTENTS
1. Introduction
2. Property 2.1 Property Description 2.2 Location, Access and Infrastructure
3. Geology
4. Instrumentation and Work Done
5. Results 5.1 Magnetometer Survey 5.2 Induced Polarization Survey
6. Summary and Conclusions
7. Recommendations
8. Personnel
9. Expenditures
References Certificate of Qualification
Figure 1 : Location Map Figure 2: Claims Map Figure 3: Regional Geology Figure 4: Property Grid
LIST OF FIGURES
Figure 5: Induced Polarization (IP) Chargeability Anomalies
LIST OF MAPS
Map 1: Total Magnetic Intensity Survey- Contoured Readings 1:5 000 8 pseudosections 1:5 000
PAGE
3
3 3 4
5
6
8 8 9
13
14
14
15
16 17
2

I I I I I I I I I I I I I I I I I I I
1. INTRODUCTION
Griftco Corporation (Griftco or the Company) holds 10 claims containing 88 units
and covering 1408 ha in Butt township, District of Nipissing, Ontario at 79° -5.8'W
longitude, 45°-42.5'N latitude (Figure 1 ). The claims are held under option from Dan
Patrie Exploration Ltd. (OPEL) and were acquired for their potential to host uranium
and rare earth mineralization of economic interest. Between 6 April and 20 April
2010 the Company carried out line cutting and a magnetometer survey followed by
an Induced Polarization (IP) survey on part of the Property. The following report
describes the work carried out on the subject claims and the results obtained.
2. PROPERTY
2.1 PROPERTY DESCRIPTION
The Butt Uranium Rare Earth Property ("the Property") is comprised of 10
unpatented contiguous mining claims containing 1 0 units and covering 1408 ha as
listed in Table 1 and as illustrated in Figure 2. The Property is located within the
Butt township claim map area (M-0064). The claims are held in the name of Dan
Patrie Exploration Ltd. and the Property is under option to Griftco Corporation by an
agreement dated 8 January 2010.
3

I I I I I I I I I I I I I I I I
FIGURE 1
I GRIFTCO CORPORATION
I BUTT URANIUM RARE EARTH PROPERTY
Location Map
I Scale 1:750 000 June 2010

I I I I I I I I I I I I I I I I I I I
TABLE 1
GRIFTCO CORPORATION
BUTT URANIUM RARE EARTH PROPERTY
Township Claim Number Claim Due Date Units Area (ha)
Butt 4214914 201 0-Jul-25 12 192
Butt 4214915 201 0-Jul-25 12 192
Butt 4214916 201 0-Jul-25 8 128
Butt 4214917 201 0-Jul-25 12 192
Butt 4214918 201 0-Jul-25 12 192
Butt 4219905 201 0-Jul-25 12 192
Butt 4246897 2011-May-12 2 32
Butt 4246898 2011-May-12 3 48
Butt 4246899 2011-May-12 3 48
Butt 4246900 2011-May-12 12 192
TOTAL 88 1408
2.2 LOCATION, ACCESS AND INFRASTRUCTURE
The Property is located approximately 50 km north-northeast of Huntsville,
Ontario at 79°-5.8'W longitude, 45°-42.5'N latitude and centred at UTM, NAD 83,
Zone 17 co-ordinates 650000mE; 5062500mN (Figure 2).
Access to the Property is by road from Provincial Highway #11 at Elmsdale,
Ontario about 20 km north of Huntsville. From Elmsdale, Provincial Highway 518
leads east to Kearney (10 km) then proceed north from here an additional 10 km to
Sand Lake. From Sand Lake to the Property is about 12 km on the Forestry Tower
Road. A number of logging roads provide good access to all sections of the
Property.
4

-----------------
\
y
After Claim Map M-0064, 1 Butt Township Scale: 1:40 000 UTM Zone 17, NAD 83
4219905
421 4914
4214917
421491 8
-
FIGURE 2
GRIFTCO CORPORATION BUTT URANIUM RARE EARTH PROPERTY
Claim Map June 2010

I I I I I I I I I I I I I I I I I I I
Algonquin Park is immediately east of the Property and the Cal Graphite
Property is immediately to the north (Figure 2).
3. GEOLOGY
The Butt Uranium Rare Earth Property is located within the Kiosk domain of the
Algonquin Terrain of the Central Gneiss Belt of the Western Grenville Province,
Ontario (Figure 3). The central Gneiss Belt and the Central Metasedimentary Belt
are the 2 major subdivisions of the Grenville Province in Ontario.
The Central Gneiss Belt consists mainly of upper amphibolite and local granulite
facies, quartzo-feldspathic gneisses chiefly of igneous origin with subordinate
paragneiss. The dominant structural trend is northeasterly, however, northwesterly
trends occur along Georgian Bay. The Central Gneiss Belt consists of a variety of
Archean to Mesoproterozoic crustal segments, all of which have been affected by
the "Grenville Orogeny". Rocks of 3 main ages are present. North of the French
River, reworked Archean and Paleoproterozoic gneisses of the Nipissing Terrane
are intruded by Mesoproterozoic (1700 to 1350 Ma) plutonic rocks, with granitic and
monzonitic rocks predominant. The bulk of the Central Gneiss Belt (Algonquin and
Tomiko terranes) consists of Mesoproterozoic gneisses (1800 to 1600 Ma) intruded
by 1500 to 1400 million-year-old granitic and monzonitic plutons that may represent
an extension of the Eastern Granite-Rhyolite Province across the Grenville Front.
The Parry Sound Terrane consists of mafic to intermediate rocks extracted from the
mantle at about 1450 to 1350 Ma.
Distinctive lithotectonic terranes, some further sub-divided into domains, have
been identified within the Central Gneiss Belt. The terranes and domains are
distinguished by differences in rock types, internal structure, metamorphic grade,
geologic history and locally by geophysical signature. They are bounded by zones
of intensely deformed layered rocks traceable for tens of kilometres.
5

I I I I I I I I I I I I I I I I I I I
Georgian
Bay
Abbreviations A Ahmic Domain 8 Britt Domain
Be Beoverstone Domain CMBBZ CenTral Metosedimentory Belt
Boundary Zone F Fishog Domain
GFTZ Grenville Front Tectonic Zone
• PROPERTY
Age of crust or major period of magmatism
~ 1170 10 1100 Ma
Q 1300 to 1250 Mo
- 1450 to 1350 Mo
Lake Ontario.
GH Go Home Domain H Huntsville Domain K Kiosk Domain
Me McCraney Domain Mel McClintock Domain MR Moan River Domain N Navar Domain
FIGURE 3
GRIFTCO CORPORATION
BUTT URANIUM RARE EARTH PROPERTY Regional Geological Framework
After: OGS, Geology of Ontario
Part 2, p. 720
~ 1800 to 1600, ~ 1500 to 1400 Ma
~ 2700 to 2300 Ma
m Paleozoic cover rocks
/ Terrane boundary
/ Domain boundary
NE Nepewassi Domain 0 Opeongo Domain P Powossan Domain
PS Parry Sound Domain R Rosseau Domain S Seguin Domain
TL Tilden Lake Domain
June 2010

I I I I I I I I I I I I I I I I I I I
The Algonquin Terrane consists of quartzo-feldspathic gneisses of plutonic and
supracrustal origin characterized by a complex pattern of structural domains. Thus,
the Algonquin Terrane is an area of Mesoproterozoic, polycyclic rocks, consisting of
a number of domains (domains and subdomains ). The southern and western parts
of the Algonquin Terrane have been subdivided into the Britt, Ahmic, Kiosk,
Rosseau, Go Home, Huntsville, Novar, McClintock doamins interpreted to represent
the lowest portion of a stacked succession of thrust sheets in this region. Large
folded sheets of gneissic granites with primary isotopic ages in the 1500 to 1400
million year range occur in all these domains. Rocks of this age are common in the
Eastern Granite-Rhyolite Province and the Algonquin Terrane and probably
represent a section of Mesoproterozoic crust (1800 to 1600 Ma) extensively injected
by granitic magmas of the Eastern Granite-Rhyolite Province. (Central Gneiss Belt,
Grenville Province, Part 2, Section 19, Geology of Ontario, Easton, 1992).
The Butt Uranium Rare Earth Property which lies within the Kiosk domain, is
underlain by mafic, quartzo-feldspathic and metapelitic units at the amphibolite to
granulite grade of metamorphism. In turn these units host radioactive pegmatite
dykes which host allanite, uraninite, pyrochlore, columbite and other rare earth and
uranium-bearing minerals (Ferguson, 1971; Hewitt, 1967).
4. INS"rRUMENTATION AND WORK DONE
Line cutting was carried out on the Property between 6 April and 17 April 2010
inclusive by OPEL with 27 line-km being cut.
Between 17 April and 20 April 2010 inclusive, a program of geophysical
surveying along the previously cut lines at 100 m spacings was carried out over part
of the Property (Figure 4). A total field magnetometer survey with readings being
taken at 25 m intervals was carried out over 27 line-kilometres (Map 1) .
The survey was carried out using 2 Scintrex Envi magnetometer units. The Envi
Mag has the capability to measure the total field combined with an Envi
6

I I I I
I ~
I
BUTT TWP.
URANIUM
RARE EARTH
PROPERTY
FIGURE 4
GRIFTCO CORPORATION
I BUTT URANIUM RARE EARTH PROPERTY Survey Grid
I
N

I I I I I I I I I I I I I I I I I I I
Magnetometer as a base station for correcting magnetic diurnal drift. These are
total field magnetometers which measure the magnetic field through the use of
proton processional effects caused by the interaction of a magnetic field with a spin
aligned, proton rich fluid.
An instrument accuracy precision and resolution of 0.1 nt may be obtained with
these instruments under ideal conditions. While in gradient mode which was not
done at this time, the unit has the means of measuring both the total field and the
gradient of the total field with two sensors simultaneously. In gradient mode, the
instrument sharply defines the magnetic responses determined by the total field. It
individually delineates closely spaced anomalies rather than collectively identifying
them under one broad magnetic response. Also, when doing a gradient survey the
instrument enables one to conduct a gradient survey during a magnetic storm
because the technique of simultaneously measuring with the two sensors cancels
out the effects of diurnal magnetic variations.
Microprocessors contained in these instruments allow for the collection of the
readings along with the time and its position in digital form suitable for downloading
to a computer for date processing.
A total of 27 km of magnetic readings were taken along the lines at 100 m apart
with 25 m station intervals. The field measurements were corrected for diurnal
variations of the earth's magnetic field by direct subtraction of the base station
readings from the reading taken at the same moment in the field units. The
corrected data was downloaded to a computer for plotting. The results are
presented in Map 1.
A total of 17 km of induced polarization readings were taken on the Butt Property
grid with an "a" spacing of 25 m and with 6 levels being read (N = 6). The IP survey
was a time domain pole-dipole survey and it was carried out with a Walcer 9000
transmitter in combination with a Honda 18 HP motor generator and a Scintrex IPR-
12 receiver. The motor generator and transmitter were stationary on the end of the
7

I I I I I I I I I I I I I I I I I I I
line being read with the current being transmitted through a wire with an electrode
into the ground for contact. A second wire and electrode (the live electrode) was
moved along the line being surveyed as per the survey protocol. At all times, the
transmitter man, live electrode man and receiver personnel were in radio contact.
Ahead of the live current electrode was a crew of men with electrodes at 25 m
intervals. These electrodes are connected to the receiver where the receiver
operator obtains and records the readings. The data is downloaded from the
receiver at the end of the day to a computer where the resistivity and chargeability
are calculated and plotted using pseudosections and/or maps using Geosoft
software.
The geophysical surveys were carried out by Dan Patrie Exploration Ltd.,
Massey, Ontario an experienced geophysical contractor. The survey personnel are
listed in Section 8. The IP survey was performed between 17 April and 20 April
2010 (inclusive).
5. RESULTS
5.1 MAGNETOMETER SURVEY
In an earlier report on the Property the writer (Winter, 2009) wrote, 'The total
field magnetic readings taken on the Butt Township Property indicate that the
property is divided into 2 magnetic domains along a line trending approximately 330°
(N60°W). To the northeast of this line, the magnetic readings are generally low and
vary between approximately 55000 nT to 55500 nT with scattered, more elevated
values to a maximum of approximately 56000 nT. Two trends appear to be present,
330° and 060° - 070° with the 330° trend being more noticeable. The southwestern
part of the Property has in general a higher magnetic susceptibility with values
generally in the 55600 nT to 56200 nT range".
The current survey was done in the eastern part of the earlier survey area and
shows the pattern originally reported, i.e., higher magnetic values to the south and
8

I I I I I I I I I I I I I I I I I I I
lower values to the north with the boundary between the 2 domains trending about
330° (northwest-southeast) (Map 1 ).
For the current survey, the highest values occur in an irregular pattern in the
southern 25% of the grid. Here values are generally in the range of 55300 nT to
occasionally over 55800 nT. Apart from the overall 330° trend, two other general
trends are apparent, east-west and northeasterly.
North of the baseline at 30+00N {UTM northing 5063000mN) the magnetic
readings are generally less than 55250 nT and range to lows in the 55100 nT range.
Some high values to a maximum of 56048 nT occur at the northern end of L22+00E
between 38+00N and 39+00N (Map 1 ).
In summary, it is considered that the magnetic values indicate the presence of
two magnetic domains, one to the north where the magnetic susceptibilities of the
rocks are lower (55250 nT to 55100 nT) and one to the south where magnetic values
range from about 55300 nT to over 55800 nT. Three overall magnetic trends are
present, northwesterly (330°), east-west and northeasterly.
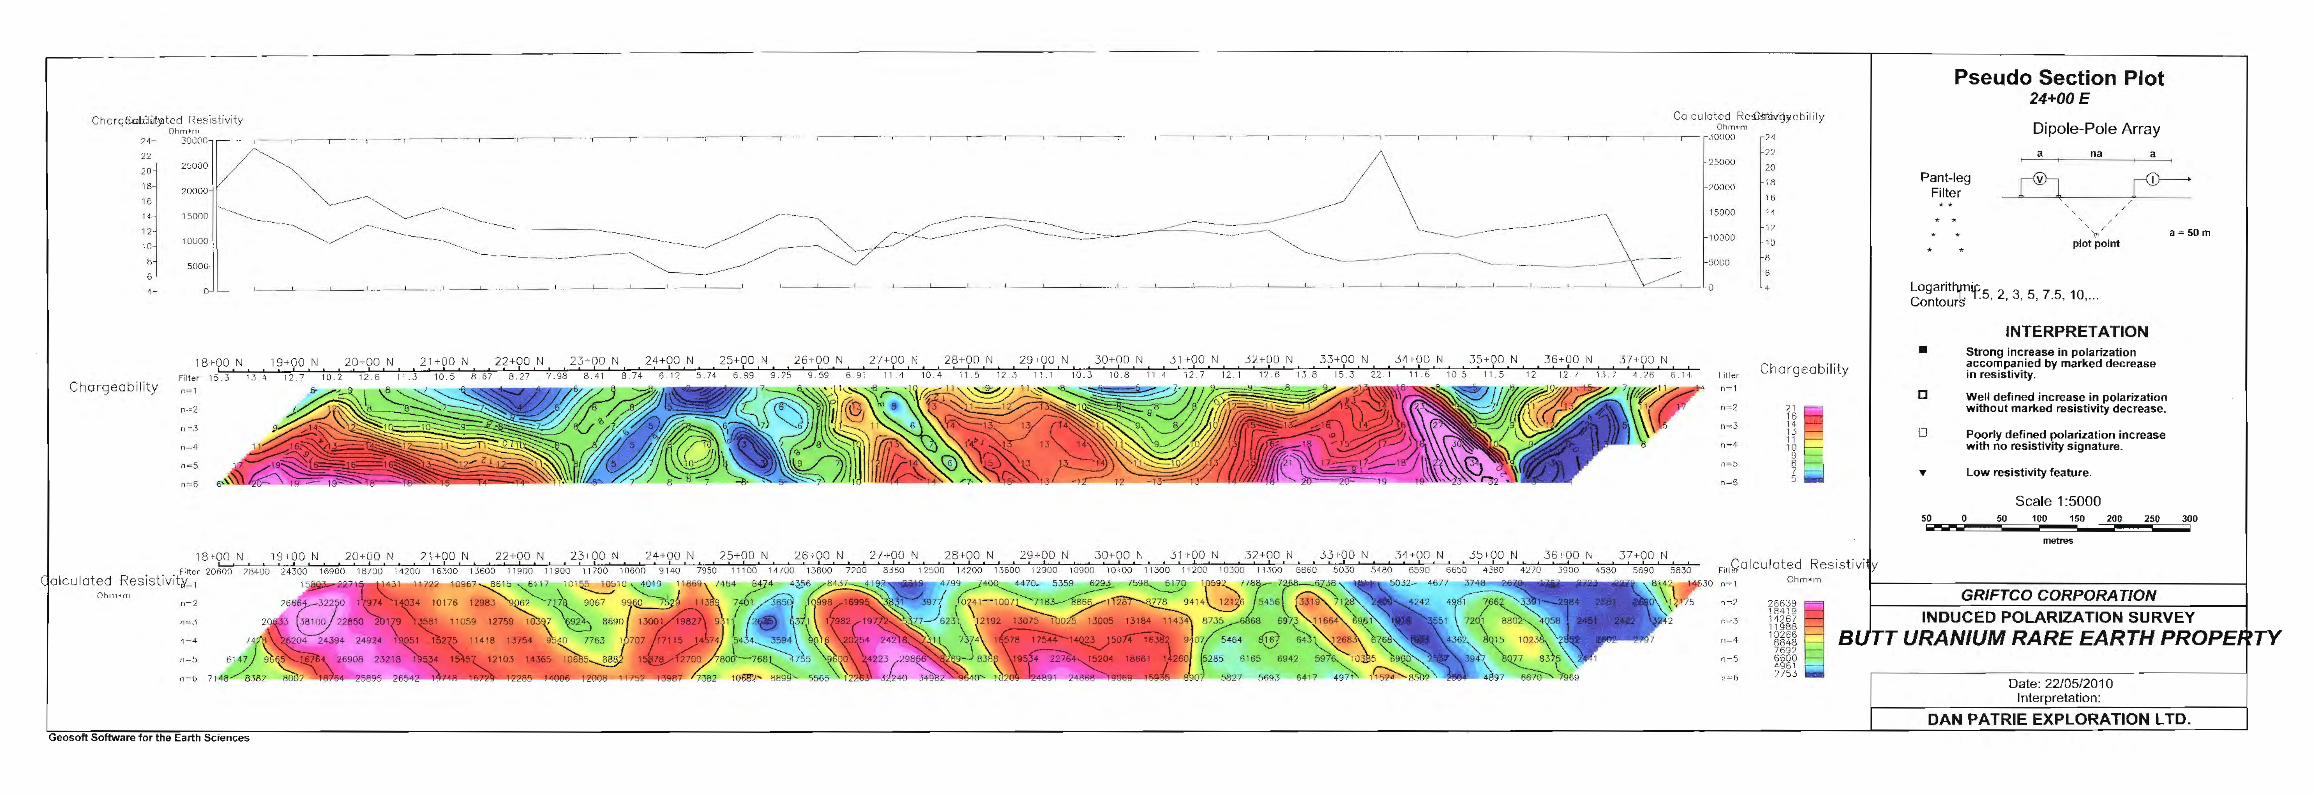
5.2 INDUCED POLARIZATION (IP) SURVEY
A total of 17 line-km were surveyed during the IP survey with the results for each
pseudosection summarized in Table 2. Pseudosections for partial lines from
17+00E to 25+00E and the baseline are provided in the pockets of the report (8
pseudosections). Figure 5 is a plan map, compiled from the pseudosections which
shows diagrammatically the location of and the trends of the main zones of
increased chargeability.
In general the background chargeability values range from <0 mVN to 5 mVN to
10 mVN. Zones of increased chargeabilities range up to 66 mVN, however, most
anomalous values are in the 20-30 m VN range i.e., the areas of increased
chargeability are in the order of 2 x to 6 x background. The areas of increased
9

I I I I I I I I I I I I I I I I I I I
chargeability show, in general, two types of patterns.
Figure 5 shows the zones of increased chargeability interpreted from the
pseudosections (n = 1 ). From about 29+00N to 34+00N on lines 17+00E to 25+00E
the interpreted IP zones show combined northeast to east-west trends with the
northeasterly trend being dominant. In the southern part of the grid, the IP zones
have a dominant northwest trend; 19+00E to 25+00E and 17+00N to 24+00N.
Resistivities are variable. In some cases increased chargeabilities occur with
increased resistivity while in other cases low resistivities are associated with higher
chargeabilities.
10

I I I I I I I I I I I I I I I I I
BL
FIGURE 5
GRIFTCO CORPORATION BUTT URANIUM RARE EARTH PROPERTY
Induced Polarization (IP) Chargeability Anomalies
Scale: line spacing 100 m June 2010 ·

I I I I I I I I I I I I I I I I I I I
LINE
17+00E
18+00E
19+00E
20+00E
TABLE 2 GRIFTCO CORPORATION
BUTT URANIUM RARE EARTH PROPERTY ZONES OF ANOMALOUS CHARGEABILITY
CHARGEABILITY VALUES STATION BACKGROUND ANOMALY
mVN mVN
From end of line (30+00N) to <0 to 5 >5 to 26
33+50N
From end of line (30+00N) to <0 to 5 >5 to 34
33+50N
40+00N to north end of line
<0 to 5 >5 to 9
From end of line {20+00N) to <0 to 10 >10 to 20
24+00N
28+00N to <0 to 10 10 to 28
31+50N
41+00N
22+00N to 24+00N
<0 to 10 10 to 30
28+00N to <0 to 10 10 to 20
32+50N
COMMENTS
Broad zone at south end of line with 2 more anomalous sections at 30+00N and 32+50N. Coincident with high resistivity 2 x to >14 x background.
Broad zone at south end of line with one more anomalous section at 30+00N. Coincident with high resistivity 2 x to 20 x background.
Increasing chargeability with increasing resistivity at north end of line.
Broad zone of increased chargeability with highest values at 23+50N. Variable resistivity.
Broad zone of increased chargeability with 2 more anomalous sections at 28+75N and 31+00N. Section at 31+00N has highest chargeabilities. Section at 28+ 75N shows higher resistivities while that at 31+00N shows lower resistivities.
Increasing chargeability and resistivity at end of line.
Broad zone of increased chargeability. In general coincident, high resistivity.
Broad zone of increased chargeability separated into a northern and southern section. Southern section at 29+00N has higher associated resistivities.
11

I I I I I I I I I I I I I I I I I I I
22+00E
23+00E
24+00E
25+00E
19+00N to <0 to 10
22+00N
30+00N to 3 to 10
32+00N
17 +OON at south end of line to 0 to 10
19+00N
30+00N to 35+00N
<0 to 10
18+00N at south end of line to 4 to 10
22+50N
26+00N to 34+00N
3 to 10
17 +OON at south end of line to 0 to 10
18+00N
26+00N to 33+00N
3 to 8
33+00N to 1 to 10
34+00N
Broad zone of increased chargeability with 2 more
10 to 32 anomalous sections at 19+00N - 20+00N and 22+00N with coincident increased resistivity.
200 m wide zone of increased
10 to 24 chargeability, increasing with depth. In part low and in part higher resistivity.
200 m wide zone of increased 10 to 32 chargeability with coincident
high resistivity.
Broad irregular zone of increased chargeability with
10 to 23 generally low resistivity except for a small zone at 33+00N -34+00N of higher values.
Broad zone of increased 10 to 19 chargeability below n = 3 with
associated high resistivity.
Broad zone of increased chargeability with 3 narrow sections of more anomalous values at 26+00N, 27+50 to
10 to 34 29+00N and 31+50N to 34+00N. The first 2 sections show increased resistivity whereas the 3rd section has low resistivity.
Modest increase in 10 to 17 chargeability with low
resistivity.
Modest irregular increase in 8 to 12 chargeability with high
resistivity.
Approximately 1 00 m wide zone of high chargeability with
10 to 66 associated low resistivity. This zone contains the highest chargeability values obtained during the survey.
12

I I I I I I I I I I I I I I I I I I I
6. SUMMARY AND CONCLUSIONS
A total field magnetometer survey was carried out on 27 line-km of cut lines
spaced at 100 m in the eastern part of the Property. An earlier survey (Winter,
2009) indicated two magnetic domains on the Property, one with lower magnetic
susceptibilities to the north and one with higher magnetic susceptibilities to the south
with the boundary between the 2 domains trending northwest-southeast (330°). This
overall pattern also shows up in the current survey with the general boundary
between the 2 domains being at about 30+00N (UTM 5063000mN). In addition to
the 300° trend, two other trends, east-west and northeasterly are also present.
The IP survey chargeability results show 2 main zones of anomalous
chargeabilities/interest. The first area lies at and north of the baseline (29+00N to
34+00N) and from 17+00E to 25+00E. Within this area, anomalous zones show
northeasterly and east-west trends. The second area of anomalous values lies from
17+00N to 24+00N and between 19+00E and 25+00E, in the southeastern part of
the grid.
Previous work in the 1950's identified a number of radioactive showings, for the
most part hosted in pegmatite dykes. Some of these reported showings lie adjacent
to the anomalous chargeability zones, however, for other showings there appears to
be no correlation.
In summary, the magnetometer survey returned similar results to the earlier
survey (Winter, 2009) and within the area surveyed confirmed the presence of two
mqgnetic domains, an area of low magnetic susceptibility to the north and an area of
higher magnetic susceptibility to the south. Three general trends or patterns are
indicated by the magnetic survey, northwesterly (330°), northeasterly and east-west.
The IP survey identified two areas of anomalous chargeability values, one in the
north-central part of the grid and one in the southeastern part of the grid. The IP
anomalies also show the same 3 trends as shown by the magnetic survey.
13

I I I I I I I I I I I I I I I I I I I
At this point, there is no apparent direct correlation between the IP anomalies
and areas of known radioactivity.
7. RECOMMENDATIONS
At this point, it is considered to be important to determine, if possible, what is the
cause of the increased IP chargeability and if there is any relationship between areas of
known radioactivity and the IP and/or magnetic survey results. To this effect, it is
recommended that;
1. the Property be geologically mapped and,
2. all showings be cleaned out, mapped and sampled.
Based on the prospecting and sampling work from the 1950's, it is considered
that the Property has considerable potential to host uranium and rare earth element
(REE) mineralization of economic interest. Once the recommended mapping and
sampling are completed, the results can be correlated with the geophysical survey
results and then a comprehensive evaluation program can be implemented.
8. PERSONNEL
The surveys were carried out by Dan Patrie Exploration Ltd., Massey, Ontario
using the following personnel.
Mike Faulkner, Walford, Ontario
Gab Roy, Elliot Lake, Ontario
Mike Whalen, Walford, Ontario.
Bronson Ede, Sudbury, Ontario
Andy Desjardins, Espanola, Ontario
Tyler Gagan, Espanola, Ontario
Cliff Moffatt, Sudbury, Ontario
Matt Mandigo, Massey, Ontario
Brent Patrie, Val Therese, Ontario.
14

I I I I I I I I I I I I I I I I I I I
9.
1.
2.
3.
4.
5.
6.
EXPENDITURES
TABLE 3 GRIFTCO CORPORATION
BUTT URANIUM RARE EARTH PROPERTY EXPLORATION EXPENDITURES APRIL 2010
Line cutting: 27 km@ $650/km
Magnetometer Survey: 27 km @ $150/km
IP Survey: a= 25m; n = 6: 17 km@ $1600/km
Two mobilization trips; one for line cutting and
one for geophysical surveys@ $1600 each
Data Processing/printing maps
Report (6 copies)
Total
$ 17,550
4,050
27,200
3,200
2,000
2,600
$ 56,600
The expenditures were made on three (3) claims in the following proportions:
4246900
4214917
4214918
33.3%
42.6%
24.1%
Total 100.0%
L.D.S. Winter, P.Geo.
7 June 2010
15

I I I I I I I I I I I I I I I I I I I
1.
2.
3.
4.
5.
REFERENCES
Easton, R.M., 1992
The Grenville Province and the Proterozoic History of Southern and Central Ontario; p. 715-754, The Central Gneiss Belt, in Geology of Ontario, Part 2, MNDM.
Ferguson, S.A., 1971
Columbium (Niobium) Deposits of Ontario, ODM, Mineral Resources Circular 14, p. 49.
Hewitt, D.F., 1967
Uranium and Thorium Deposits of Southern Ontario, ODM, Mineral Resources Circular No. 4, p. 47.
Marmot, C. and Johnston, M., 1987
Mineral Deposits Studies in the Huntsville-Parry Sound-Powassan Area -A Progress Report, OFR 5647, OGS, Mines & Minerals Division.
Winter, L.D.S., 2009
Magnetometer Survey Report on the Butt Township Property, Butt Twp., Dist. of Nipissing, Ontario for Dan Patrie Exploration Ltd., 11 pages, 4 Figures, 2 Maps.
16

I I I I I I I I I I I I I I I I I I I
L.D.S. Winter
1849 Oriole Drive, Sudbury, ON P3E 2W5 (705) 560-6967
(705) 560-6997 (fax) email: [email protected]
CERTIFICATE OF AUTHOR
I, Lionel Donald Stewart Winter, P. Geo. do hereby certify that:
1. I am currently an independent consulting geologist.
2. I graduated with a degree in Mining Engineering (B.A.Sc.) from the University of Toronto in 1957. In addition, I have obtained a Master of Science (Applied) (M.Sc. App.) from McGill University, Montreal, QC.
3. I am a Life Member of the Canadian Institute of Mining, a Life Member of the Prospectors and Developers Association of Canada, a Registered Geoscientist in Ontario and in British Columbia (P.Geo.).
4. I have worked as a geologist for a total of 50 years since my graduation from university.
5. I have read the definition of "qualified person" set out in National Instrument 43-101 ("NI43-1 01 ") and certify that by reason of my education, affiliation with a professional association (as defined in Nl 43-101) and past relevant work experience, I fulfill the requirements to be a "qualified person" for the purposes of Nl43-101.
6. I am the author responsible for the preparation of the Geophysical Survey Report titled "Geophysical Surveys Report on the Butt Uranium Rare Earth Property, District of Nipissing, Ontario" and dated June 7, 2010 (the "Technical Report").
Dated this th Day of June, 2010
L.D.S. Winter P.Geo.
17

700 800 900 I "-- - ,-- -----"';"-----
1000 1100 "" 1-'' ---'-';"
0 0 N v
0 0 0 v
0 0 ro M
0 0 m M
0 0
;;\
0 0
"' "'
0 0 N M
0 0
"'
0 0 0
"'
0 0
"' N
0 0 ro N
0 0 ~ N
0 0 w N
~~ 0 0 v N
0 0 M-N
0 0 N N
0 0
N
0 0 0 N
0 0
'"
o : o ' ro ~
0 0 w
0 0 m ~
0 0 .,.
700 800 .. --'o---ccOc::--900 1000 1100 ' 1200 1300
1400 1 500 __ 1._,6o;:.0000 _ 1700 1800 1900 2000-__ _,2_1,00
--o2occo"oc---2=-1"'oo ' 1400 ' 1600 1500 1700 1800 1900
2200 2300 T-----------· I
2400 2500 ·-·r
"' 0 0
:% 0 0
w ~ 0 0
w
'" 0 0
w ~ 0 0
w '"' !o 0
w w 0 0
w ~ 0 0
w ~
0 0
w 0 0 0
" w 0 0
"' m 0 0
"' ..., 0 0
~
"' 0 0
"' '" 0 0
"' "' 0 0
"' w 0 0
"' "' 0 0
"' ~ 0 0
N 0 0 0
.g:; 0
- ~ 0
..., 0 0
"' 0 0
~
~ 0 0
"' 0 0
24o-o - --2so"'o _ _j
55719
55628
55563 55528 55502 55479
55461
55446 55432 55420
55407 55397 55384 55373 55361 55351
55340 55331 55323
55312
55302
55292 55281
55270 55259 55249
55240 55231
55223 55213 55204 551 97 55188
55178 55166 55153
55136 55112
FULL COLOR SCALE BAR CONTOURED@ 100nT & 1000nT
Scale 1:5000 100 0 100 200 300 ~-- I
metres
MAP1
GRIFTCO CORPORATION L TO. TOTAL FIELD MAGNETICS SURVEY
BUTT URANIUM RARE EARTH PROPERTY 1--- ::_::__:_ DATUM SUBTRACTED; OnT
REFERENCE FIELD; 55256nT INSTRUMENT USED. SCENTREX ENVI SYSTEM
DAN PATRIE EXPLORATION LTD.

ChcrgcllDHrihii:IYJl~d Rcsisl ivi!.y Ohm,.m
251 ;.>~ OG-0 I :>O ?.O:JGO-
---.---· .. r a••••••'"
1~000
10 10000
5-
---,---· ., . . - --r- ... 1 - -.----· .. , ... - -,--..... , - _,.- ... ... .,..-- -.--· . I ,.-- - .- .... '--1
--:~~ .. ----.-~:.>( _____ - -· -····--·----~
......... ...- ""'- ~
-----·-.. ·- -- ··-..... ..::~_-_::~~-~---·_·: -_-_----------~ --............. ---~--- - - _ _ -_--_- ... :== .=.-.:..~-:-
=-~
Calc u' otcd l ~e~G:Iil!Wvi\J!o bi lily Ohrn•1n
74000 ·25 ?OOIYJ ?0
1~000 15
~ ()()i)(} 11)
5 5000
0 -
:,:mo1
?oon I --~. ___ ) __ _ ---'--· _ ___ I ~- · - . .1-.--. t___ I . ---- ·-· ' _ __J _ _ ,-J__ . .L---L-- I -~- ___ .J... ___ , ... I - - ··- ·· .--L-. . --L- .. ~ I 200G ()
Cha rgeabil ity
29+00 N .50r00 N 3 1+00 N :~?+00 N 33+00 N j4rQQ N j~·rOO N ."~6+00 N 37+00 N :>:> .6 23.9 u.~. 11 .4 13 .8 1o.7 1€- . 3 149 a.111 7 . i 4 6.0<~ -1-.95 3 . 74 ?.:2 :> . 4 1. 43
38r00 N .59 r 00 N 40+00 N fitter i8 n - 1
iiite'" Chargeability n~1
n~2
n-.1
n-:-4
fl-~)
,.,- 6
~t=2 2~
~ 1/
n-:j 15 11
1'•' 4 7
" j n .. !; ?
1 ,,.E; -·1
29+00 N 3o~oo N . F;l\er 22900 HOOO 8680
alcu lated Res1stiv:it¥~ 1
3 1+00 N 32+00 N JJ •OO N 3~+00 ~ 35+00 N 36+00 N 37•00 N 38~00 N 39f 00 N ~0+00 N Fill~a l culated Resistivi
39 n .... 1 :Jhrr1•r~•
Ohm•m .-;=2
n=J
n-4
o=6
o~2
'"" ~ n-.3 1~iJ~ 793~
n u~ 6858 B 56.51 .. <1.157 _ ..
.,,s 3015 23?0
ll -"t:i 1~63
Geosoft Software for the Earth Sciences
Pseudo Section Plot 17+00 E
Dipole-Pole Array
a na a
Pant-leg Filter
* * * *
* "
/ ' / ' / ' / ' / ~~
* * plot point
Logarithplif Contour-S .5, 2, 3, 5, 7 .5, 1 0, ...
-· []
0
50
INTERPRETATION Strong increase In polarization accompanied by marked decrease in resistivity.
Well -defined increase in polarization without marked resistivity decrease.
Poorly defined polarization increase with no resistivity s ignature.
Low res istivity feature.
Scale 1:5000 0 50 100 150 200 250
metres
GRIFTCO CORPORATION
a= 50 m
300
INDUCED POLARIZATION SURVEY
TT URANIUM RARE EARTH PROPE
Date: 22/05/2010 Interpretation:
DAN PATRIE EXPLORATION LTD.
TY

Calculated Re~H~lkillv!j~obi ity Ohm•rn
ChorCJ(>Al:Uxtl.iJJYJled Resistivity onm"rn
,··-·----,----.-----,---,----, ··-rl4()()()
r·l:woo
35 14()(j() --,-- I ·······.-- -r--· ,--, . . ·-r-·... - ···~- ······---.----~··
jQ :2000
-~-/~) 10000
20 ......
25 ·IOCOC
/0
35
3G
ROr>O· -·80GO ':5· "I!)
5000 ,. .... ~·'· 10 ......
-6000 10
5 4000· 4UUU 5
0 2000· ~--~--L--~--L- -?000 0
/.9i·OO N 30+00 N .11 +00 N J2100 N jjiOO N 34100 N 35~00 N 36+00 N 37+00 N jH+OO N .:'>CJ+OO N 4C+OO N 41 I 00 N Chargeability
Chorgeability Filter 31 5 n~1
29. I
r 2
,, _I
o-4
n-!)
1=6 9
29+00 N hlter 92'10
alculated Resistivit,y-_ 1
5140
n=3
n=4
n=5
Geosoft Software for the Earth Sciences
.?C 9 16.R L\ 1 -~. 1 H .:s 13.9 9.95 9.54 6.78 5.42 3.77 3.23 3.32 2.46 :.81 2.53 ?. 55 ;I.'- 4 08 2.8 6.24 6.53 8.06 rilter
u=2
n=3
(1--1
'1-6
-(g l 11
A -6 4 2 I
-0
30+00 N :S1+00 N 32+00 N .D+OO N 34+00 N 35+00 N 36+00 N 37-fCO N 38+00 N 40+00 N 41+00 N Filt~alculated Resistivi 6640 10400 1.3!:>00 12500 1 0~00 9230 7220 3990 ~ 1 w :lo:lo 3St>O 3020 2()30 3520 3650 4050 4220 t:.580 4990 5850 6530
6/ n = 1 Ohrn•m
n-2 22771
I 9:.>22
n~:s /-.$!':> 6.)94
n=4 5662 B '·832 .590':>
n~5 :\T\6 261~
n=O 1605
4641
4~~r:.~ 6629
loiBim:,.-1'9-t-7~--? 2 35 4064 409 1 ~;, 3572 j.5'<9 j /
98-- 3190 3 126 3267 4205~~821
S518 3885 4 157 3778 ~:,t,-57
~7 3961 5032._ 4725 _5088 5249
3625 33 16 5196 48 7/\ :l453 5743 5629
401\fi.-- 4--100 40813 .3~ 81 .3656 4994-652-2--644
Pseudo Section Plot 18+00 E
Dipole-Pole Array
a na a
Pant-leg Cj ru---Filter '
/ /
' /
' /
' /
* * ,,
* plot point
Logarithp1ip Contours .5, 2, 3, 5, 7.5, 10, ...
•
0
50
INTERPRETATION Strong increase in potarization accompanied by marked decrease in resistivity.
Well defined increase in polarization without marked resistivity decrease.
Poorly defined polarization increase with no resistivity signature.
Low resistivity feature.
Scale 1 :5000 0 50 100 150 200 250
metres
GRIFTCO CORPORATION
a=50 m
300
INDUCED POLARIZATION SURVEY TT URANIUM RARE EARTH PROPE
1-----·-·-----·--------------------1 Date: 22/05/2010
Interpretation:
DAN PATRIE EXPLORATION LTD.
TY

Chorgecrukiit~ted l~esistivi ty
;l()l 1tl
I()
I I,
OH'n•n
1 :?.-
10
~
6 ·
~ -
2
0 ·-··- -·~ I _ J .. ---··~--- 1
19-tUO N 20 +00 N 21+00 N 22~00 N 2.3-t·OO t-.1
Chargeability 11 . 2 12.1 10 . 2 11 . 9 14
n~4
n-6
19+00 N ~0+00 N 21 +00 N 22 100 N 2.3 100 N • F;ltcr :w~oo
olcu lated Res 1 stivit¥~ 1 19900 :wzou /.'>300 23700 / 0.500 1800C Hl/00 15600
n-5
n....:t)
Geosoft Software for the Earth Sciences
l --L - '--- - L _: _ _ _ .._L • •• - I _ _J - I
24+00 N 2~ ~oo N ~ 6+CO N 2 / +00 N 28+00 N 29+0C N 1? 12 . 7 12 .2 8 .09 5 .88 6 . 12 7 . ~9 5 .94 8 . 15 9.49 13 .6 15 . 6
?6-+00 N 28+0[) N 2~J +OO N 9i00 10600 9~5C 91 90 15500 1 /900 15200 ., ~)300
)?952 7836
;);;.___';290 ~~~~?"
_ _ _ _ I -
30+00 N 15. 1 12. 4
Co1cu.oled Re~y.obilily Ql'lru• m
-- \ -,---- I --,--,-- .,.-,-.,.-------,--. . '-r-1 . I ' --r-·1- 1 l f/}>COO
~ 12COOO
........... . ·1!)()00
--- - - - - ___ - - -~- 11()000
--------- --- ----~===-=-=------------- -~-=-------------=----- 5000 ~~~-:;::.::;- ---------------- l J . _ _l_ l _ ____..... __ - - . L · --1 . I ·-'- ~ .l-. __1. -...,._ __I I - ·-· I . _.1 1.-.. ...L _ _ J •• _. ()
.32+00 N JJ+OO N 5'1+00 N J !.l+OO N JS+OO N J/+00 N 58+00 N .:59+00 N ?O •UO N 41-100"' 15 .. ~ 19.3 19 . 1 !2 . 7 17..7 5 . 5 7 ~ . 1/1 3 . 09 7. . 84 1.18 7. .83
u=- /
n-.3
n- ' ..
70
16
-10
t\
-lj
4
0
Chargeabll ity
30-IOG "J 3 1100 N 32 100N 33 ·10 0N 34 100 N 351·00 N .'36·100 N 37 100N 38 100N 391 00N 4C~OON 41100 N f'i l t~alculated Resistivi y
B
n=6
Pseudo Section Plot 19+00 E
Dipole-Pole Array
a na a
Pant-leg Filter " ..
* " * *
/ ' / ' / ' / ' / ) ,
* " plot point
Log a rit'lf.'if Contours .5, 2, 3, 5, 7.5, 10, ...
• []
0
50
INTERPRETATION Strong· increase in polarization accompanied by marked decrease in resistivity.
Well defined Increase in polarization without marked resistivity decrease.
Poorly defined polarization increase w ith no resistivity s ignature.
Low resistivity feature.
Scale 1:5000 0 50 100 150 200 250
metres
GRIFTCO CORPORATION
·-f
a =50 m
300
INDUCED POLARIZATION SURVEY
T URANIUM RARE EARTH PROPE
Date: 22/05/2010 Interpretation:
DAN PATRIE EXPLORATION LTD.
TY

Chorgcclxilii!JDtcd r~esistivil y Ct: lculo I ed Rc!fit:ti'f'g~<Jbi !i l y
15
5
0
Ohm tr ·r Otun •in ~2000· - ·-···- : - ···- ··-,-····· - ···- o· ··--· ··-,-· ····· ·-- I - ·--·· r· ,--,-, - ---,,.-- - ,,----,- - , '''' ·r--···· ' I
?0.100 -- - ~ HSUOO- .-···- -·--\ ' ~ ~
.,- ·.......---.....---..-..,....--r---.--, --- -,--.-- .. , ' --~--...----,---~- 22000
!~~-1L-----: .-- --~ /-~------ ~ / ~ -- -----=~~-------- -, __ C\~100 -, ____ .. -- ' '. /' ''----------.,. "--········-··-····· ",. -·- ---------// .. / .. ' ',· .... ,, . ''·······-..... -----··
... '·-....... ,.,.... .... __ -·-- ........................ ------...__ --··-·- --·-------~/.... OtJOO
6000] .. _ ./ --------~-~==--- . ------------===-----======---- _/ . ~-000
7.00()()
1/lOOO
1500':)
14000
17000
10000
1\000
1000 - -- .. - ._ - - - ·------- -------------/.000- ·---'-- · - -·L- l - - L··-··-· 1---•--•--.. 1.-. 1 - -·..i.. '-- 1 - .. ··· - •--L---'- ' --1--.L---- · · ·\ L _.1 ·J:::=:=-:r-: I .J . .. --l- t-·-· 1 .. .L-- '--- L-- .... /()()0
2!.> 1-oo N :to+oo N 2 1 1 oo N 2S+co N 29+00 N .Ju 1 oo N .5 1 +OO \1 32+00 N
20
10
Filter
r. ~ 1
14 . 1
19•00 N 14.9 14.
LU•OO N 21 <00 N 13.? 1J . 4 13./ 1)
<11 t-OO N 33 I 00 N . .5-'11·00 1\J .S!i-'-00 N .36+00 1\ 'J/ I uu N .JB+OO N .19+00 N '10+00 N 1.~ 4 .95 ~ . '/!> 1 .•17 1 .61 <;.7•1 10.1 995 :1.5 13.7 '1/.!) 1 .~. 1 11 14.3 13 .2 I .27 2.96 6.91 11. 3 H. H 6. /,S ~> ll6 1 . 22 3. 96 3 . .3') 3. 59 3. 13 .\. lil ') 19 S :55 2 . 5& .3. 09 '1. IS 2. 66 il. I Chargeability
Chargeability
12
19100 N 70+00 N 71+00 N 1 1 I 1 1 e 1 I t I t I I t
24100 N I I I I
, 2~1-90 .N , . 7?+~)0 1 N /!+~):1 .N 2R+OON . , 2?190 .N , . 39190 ,N .Sl+OON 7!>90 se 1c 1 0:~oo 16400 2
1
1200 ' ,s~oc' 16400 19Joo 1 7Coo 1 c~ll.'\J 1~1r)o ' ,Aoo' I' iller 1 OSOO 1 UDO 10/:i(JO 901 0 1 01 00 1 1800 alculatcd Resistivit:v~ 1
n-7.
Geosoft Software for the Earth Sciences
I 4
6
:s/+OO N 3310o N .3410o N .J!:+OO N .)o+CO N 37100 N 38100 N , , .s?~·~>o ,N . , '~9+90 ,N. 4119o.N I 71
1
50 I 7410 561
101 48?l) I -'!4
1
/l() I ~ 1 /Q I .'S61fi{) I .'l460 I 2 i 90
1 2sso 1 30
170
1 J67Q 1 s/70
1
.lfi()(J H9() 41\;'>-:J 5880 6410 7050 ~520
590 1 3455 3659
3390 3954 :~9 1 7 4060 3939 .>7 17
n ·2
n - 5
n=4
n=::>
r-=6
1i ~ 12 10
6 , 3 2 c
1 ;n~alculated 9 4 r.=1
n= /
n-3
n= 4
?.7 1'-'8 ~ 162u· 1 2l9~ 1 0f>U6 900/. 7171 .. ~892 4Utl15 - · J2U9 / 154
B
Pseudo Section Plot 20+00 E
Dipole-Pole Array
na a
Pant-leg Filter
* * * *
* * *
" ' " ' , ' " ' " "' plot point
Logarithmic Conto~r1"T.5, 2, 3, 5, 7.5, 10, ...
• D
0
.,
INTERPRETATION Strong increase in polarization accompanied by marked decrease in resistivity.
Well defined increase in _polarizatioo w ithout marked resistivity decrease.
Poorly defined polarization increase w ith no resistivity signature.
Low resistiv ity feature.
Scale 1 :5000 50 0 50 100 150 200 250 ~
metres
GRIFTCO CORPORATION
a= 50m
300 I
INDUCED POLARIZATION SURVEY TT URANIUM RARE EARTH PROPE
Date: 22/05/2010 Interpretation:
DAN PATRIE EXPLORATION L TO.
TY

.----- ----- - - - ----- - - ---- - - - - -- - ----- ---- - - - - - - - --- ------- ------ - - - - --- ------
7.4·1 22 ?() -
\8-
16
8·
I)·
4
Chargeability
1 7 +90 IN I . 1 ~ +yo . N f'iller i 6 . 1 '. 7. 6 /.?.. 3
n= 1
1 9~oo N ?O+OO N 1 /
1
0> 01
. ·/ :!c . 8 1
.) 1 I
n- ?
n.·-3
n - 0
l/1 00 N 18+00 N 19+00 N 20 100 N
Geosoft Software for the Earth Sciences
2 1 +00 N 7.2; CO N 2.3+00 N 2.4 ,·00 N 25+00 N /6+00 N 21; 00 N 28100 N 29+0D N .30+00 N HI. ·16
1
.41 ls.5 · t
16 • 1 ~. 4 · 16.~, ~ 6.s9 ~ -, .'o l 1 i .. 1l 1
61
.38 . 6.!4 · 9 . 17~,· ::J .4 'H.1
721 7. :37 I/o 9.9?
18
1
821 9 .. 11 1
131. 7
1
21 +00 N n•OO 1\i 2.3+00 N 24+00 N /5 ·1·00 N 26+00 N '2.7 100 N 28·~00 N 29+00 N 30 +00 N ,,,/CO zo·; co •. ~800 20800 19700
1/
31 +00 N -~L I 00 N ,5j I 00 N 34+00 N 35+00 N 36+00 N I 1.3
1
• I 1 l 1 6 1
! 11
• 7 1 h. 8 1
1(;1
5 I J I . l 1
101
8 1 i 0 . l I 7
1
!1~) 1 6. 52 I 5
1
72
.11+00 N 3<1 +00 N ~ 11\0 4~30
35+00 N 1171G 4' .. 30
36+00 N 2590
.5 7·t·OO N 5/:l·f00 N f .
1
02 I 9.72 I f..1
/' ;' 4. !9
37+00 N 38+00 N 27 <1.0 .Yi70 4080 .~940
777'2
Filter Chargea bility n~ 1
0"•2 29
i 19
n- 3 15 13
n...-4 ~ 1 10
n=~ ~ 6
n =6 2
Filt~a lc u loted Resistivi n-=1
n - 4
/!l41.3 ; 17190 IH68 12517 10941 B22U l_ 749~ . '311 ?R ·
1~n
B
Pseudo Section Plot 22+00E
Dipole-Pole Array
a na a
Pant-leg Filter
., *
* * * •
' / ' / ' / ' / ' / \-<
* • plot point
Logarithf.'if Contours .5, 2, 3, 5, 7.5, 10, ...
• 0
0
50
INTERPRETATION Strong increase in polarization accompanied by marked decrease in resistiv ity.
Well defined increase in polarization without marked resistivity decrease.
Poorly defined polarization increase with no resistivity signature.
Low resistivity feature.
Scale 1 :5000 0 50 100 150 200
metres
GRIFTCO CORPORATION
a=50 m
INDUCED POLARIZATION SURVEY TT URANIUM RARE EARTH PROPE
Date: 22/05/2010 Interpretation:
DAN PATRIE EXPLORATION LTD.
TY

Chorg&t.nli.iiYJietl Rcsist ivi;y Colcu 1otcd Rc~g¥obility
241 ??
20
1A
16
1 ~
1:.1.
10
Chargeability
I - -.---.----~--~ ---r---.--- ~-- I - ~~---r---.---~---- 1 Ohm•m :::l'l I ; • ~ I I I I I
1~000 ~ / > .... ------·~ ..... 1200 __ / ""'-- -- - .- ··- ····· ·.::.::::., , ··, ·.,, __ _ - .. - -· ------. _____ ...... --- ~ .. - ------
1()0(;()-- ./ ""-, .... __ __ ______ •• --...... , .,_ - ·· _,----···-·········"""~ / - - -··· / ·......_ _____ , ,,, -- v ::1-- -- ... ·-. ------ .. _/ "--------- ... ____________ --------- __ ;·-----~ ----... _ //··-------------------------------- ---------/··-·-------------- <----., - ,_ /~- :::::,__ --- . -.:.~--2000 _ _ L. _, _J_ . I __ . ..L_ L .. _ .J I _ I__ ---'---·'-- J .... , ___ .l, 1 .. L . J.. .1 I. .1- --- I ----'-- .._ __ __ .! __ _,_ ___ : _______ ~ _ , .. :--~---L- :21_
16+00 N 17+00 N 18t00 N 19+00 N 20+00 N Filt~r 15
1. 7 . is .2 ·2C
1.3
1 ;6~ · ,6·.7 · .h .?. ' ;' 01. 1 . 17.4 1 1/~ '
21+0DN :n1·00N 2 j•OvN 2'1 ·•·00 N 25+00N 26+00N 2/• GON 7.R+OO N 29+00N jQ+OON 3l+OON .52 t OOt\l 3:-'>+00N j~•yo ,N .• 3~+90,NI 1
3?+QO .NI 13?+QC
1N _ . 3~+90_N_ I
1, 2' 4 ' 9.96 'a .'2L. ?14 ' s .'c7 ' 5.s5 · ~ .·66 . '1.6 1
5176 .741 'g'o:,' / . 7:s ' 1o 2 ' 9.35 ' g ~ g · :i .R6 · R1
91
11.4 ·,1·_,· 9.8 ·"·~· i oil ' ,,', g ' iz.:., ' 11· . ~ · 9.Hi tdll 11.1 7.33 7 35 r.~ 6 . 2 1 7 . 65 4 .5 5.75 4 . 54 12
n-4
N 'i7·00 N : s~oo N 6770 5090 4820 9250
4 1
t>1
n - 1 ~6 1 5 yg{).1 \.."'./
6 728 1336 8391
78~0 9758
n- 6 ?0018§.-"''IIM:4-•HH 52 8649 11611/ r;;;~S....,_ 9400
Geosoft Software for the Earth Sciences
f!hm•fTl 1HuUO
1€0GO
HOOO
120GO
1GOGO
8000
5000
4 000
;.'()(){)
tiitcr
n- 1
n= 2
rt=4
n=5
:>~
2:i
20
- 18
16
11
·12
10
-H
6
Chargeobility
}j 17 1~ 11 10
9 R 7 ~ ?
: ;u~alculated Resistivi Ohrn~m
n = 7 ??010
i 16168
<1 =3 '1319G 1021:)
n= 4 8501 B /19.5 6157
n= tl 1871 3395
n= 6 2002
Pseudo Section Plot 23+00 E
Dipole-Pole Array
a na a
Pant-leg Filter
* *
* *
' / ' / ' / ' / ' / ~'!'
plot point
Logarithf.ip Contours .5, 2, 3, 5, 7.5, 10, ...
• D
0
50
INTERPRETATION Strong increase in polarization accompanied by marked decrease in resistivity.
Well defined increase in polarization without marked resistivity decrease.
Poorly defined polarization increase with no resistivity signature.
Low resistivity feature.
Scale 1 :5000 0 150 200 250
-.r:w .W metres
GRIFTCO CORPORATION
a=50m
300
INDUCED POLARIZATION SURVEY
T URANIUM RARE EARTH PROPE
Date: 22/05/2010 Interpretation:
DAN PATRIE EXPLORATION L TO.
TY
Chor<;(~UdJ-YJtcd l~esistivity OhrrHrll
Ca cu lot('d RcSJroillf~ JI Obilily Ohm"m
:?1 - .. ,-- , .--,-- ·- ··,----, --~--.--- --~-· ... ,--~ T --, --~-- ; - - ··· I --,---r--r-~-~--r--~---r- .lQ{)Q(j
2 2
201 i8
16
14.1 12
·.r.
H
6
~.-
Chargeabi lity
10000 : ------~//-. ...... ______ • ............ _ - .. "---.. --------·-----... ________ _ _..,///~/ - --~ ____ //~-==: ...... --·--·~-~-=-~-=.:-~~~==--~=---~ \. .... ___ .. -----·--· ________ ...... ·"\ soouj ·-- ----.. -------·-- -............~--------··-·--/~ ~ ··-- ·------------------ · 'i.- - ---~,
O 1. . • I~ 1 , _ L_ I _ _ •.. 1. L - _I_. _ l _L_ . - 1 - - 1 - ~ .
riua: 8;~~ .N h .4 1 ~;29~ .N lo.2 20~29~ · N; ' .3 2 ~ ;J~ .N A. s~ 2?;~~ .N 'l .9a 2?;_~~ .N 8.74
2~;~;. IN 5.74 21:.~~ IN 9 . 7 ~ 2?;~~ .N 6 9; 2 {;?~ I ~ io. 4
2?~?~ ,N Lu 291'~~~ IN 1o.3 39~2.~ ,N ; , . ~ .5) ;~~ .N 12.; .5{;7.~~ IN 1.d
3:;~~ .N 2?. .1 J~ ;,9~ '1-J 1o.s 3?;,9~ _N
36+00 N 37+00 N e s I t o o e I o 1 1
12 12 . 1 u .7 4.ro fi .H. r. = 1 &
n-=2
.. - .)
n - IJ
n= 6
18•00 N 19;00 N 20+00 N 2i +OU N 22+00 N 24+00 N ?.5+00 N 2/+0U N 28+00 N 29~-oo N 30+00 1\ J1 ~oo N .37..+00 N .),31·00 N 36!·00 1\i 37+00 N 169CO 7950 11100 14/00 13800 7?00 8j5Q 12:)00 14200 13600 !29UO 10900 I 1.~00 6tlt>O 4270 3900 4580 18/::lO ; 4200 16300 1.3600 I 1900 11900 1 I 700 '!0600 9140
4 .)1 11-2 10967~" ~ ~H)o~·a ~019 I
f:lter 206(}() 7MOO 24300 a leu Ia ted Resistivit¥_1
10176 12983 9~ /17~ ()067 911~~ 11059 12759 i"ro~ \~ H690 1
11418 13754 ~'-0 1763 l 707
03 14365 ~0~
Ohn1• 1T1 n - 2
n-6
Geosoft Software for the Earth Sciences
·25000
/ fj()()()
15000
10000
!j()(;Q
·0
I iller
n-1
2/.
20
. ~ ll
1f:i
' ~
'o /
10
0
·I>
· 4
Chargeability
7.1 1 16 14 1.5 11 10
9 8 ?. ... ::>
Fin~alculated Resist ivi
n- 4
n-5
Chm• m
265:59 I 18419 \ '1261 11988 1a266 B H848 769/ 6600 .!!.961 .
:J J':Jj
Pseudo Section Plot 24+00 E
Dipole-Pole Array
a na a
Pant-leg Filter
* * * *
/ ' / ' / ' /
',t'/
* .. plot point
Logarithmic Conto~r1' 1.51 2, 3, 5, 7.5, 10, ...
•
D
0
50
INTERPRETATION Strong increase in po larization accompanied by marked decrease in resist ivity.
Well def ined increase in polarizati on without marked resistivity decrease.
Poorly defined polarization increase with no resistivity signature.
Low resistivity feature.
Scale 1 :5000 0 50 100 1SO 200 2SO
metres
GRIFTCO CORPORATION
a = 50 m
300
INDUCED POLARIZATION SURVEY TT URANIUM RARE EARTH PROPE
Date: 22/05/201 0 Interpretation:
DAN PATRIE EXPLORATION L TO.
TY

Chargw~xiiWtl)Zitcd i~e~;i st ivity ColculotecJ Re$ltltril'f(j~obili~y Chm-..,.,
.'01 25
~::1 \0
=~
o-
Ohrn1;t· , --,- i.l:ono
· 18000
16000
;::r-- ~ , -~ ~ _; -~-· ---,- --. ---. ----, ··-.-·· .--, ·- ·---. -~ ,- · -~- ·~ -~ .. . ~~~\····-·r-~-
H U00 j I ·········- --- -·-- ·······-· . --::~::: _____ ... ·--·-- I ····-·---... _______________ -------------······-··-.,, _________ _____ /--------·-········---.. / .... ______________ -----------------·--___ ......... / \ ___ .... -··············---- ·1 0000
- .................. ,1 -- ---- - --- ------- .---··
HOGO
::1 ---------......_=-)---------... ____ - . -·-·-···--·-·--- ----·-- ·------------- ·-·-... ________________ -------------- ---- ·.:::><:.... ..... ···-----...._ j' ~~:.:~: 4 ;)(){)-' - - - - -----///__...----... ___ '-_ - ··--- 4000
2Q(1()J ... . I 1.---1... - 1 .. ---L -L-- j -'----l.. • I •• I -· . .L_,_ - ·J.. -.J.__ -- ! .... l2Q0Q
r~: 125 ·20
1/-100 N 1~+00 N 19•00 N 20•00 N 21t00 N 22+00 N 2S·•OO "l /1.·100 N /.5+00 N 16.3 12 .!:1 7 9 10.2 9.96 !1 . ?.4 8 . 38 !>.73 4 . 77 4 . 43 5.5'1 6.'1 7.14 IU:il 5.17 6.35 I. II 7 . 04
2/100 N /R+OO N 29t-DO N 3/+00 N 8.f~ 6.31 7 .89 8 . 66 7.60 9 . 42 10 . :~ 10. i '•?. 6
33 •00 N .J-1 +00 N 1~ . ? 30 .8 30 . ~ 16. ·, 18.5 10.9 22. 1 Fi1tt!J
11'!":1
Chargeobility Chorgeability
9
~~~
7 6
5~~~8 :)' ,) 7 8 H
7 _.-- R c- i 9 9 G
( - 9 H 11 --.......J 10 9 10 7
1~a e. (7 ~~ a 9 a. 9 9
,_o.qe-- - a
6
7
6
n -. fi
1 7+CO f\1 18•·00 N 19•00 N 20+00 N 71 +00 N 22 +00 N 24; 00 N / 5+00 N 26+00 N /.8-00 N :.:i~le.'
alculoted Resistivit¥- 1
4500 50..10 ~i020 498C 1530C 18.10(} 19~0:.1 15100 1.S900 13500 10100 89JO 11200 9970
Ohm•m n-2
n-.l
n-4
n- 6
Geosoft Software for the Earth Sciences
9
29+00 N .30+00 N Jl •·00 N ..52 •00 N 3.)+00 N 9/10 96.30 l.i6!i0 /74{j
5845 8 J!l() 798.~
19 ~ 91/0
8471~9A.1
~ · 2
' I-!)
.38 I ~7 11 9 fl
1 6 ~ 4
r•u¥a lculated Resistivi n-1
n=- 4
n-5
n-5
on,..,.,•m
22867 ~ 15.3 71 125~.5 ~ o·i l 1 91 3\ ... 8465 - . !7!:::1 -:-)9~5 -1583 -2981
B
Pseudo Section Plot 25+00E
Dipole-Pole Array
a na a
Pant-leg Filter .. "'
* "
/ ' / ' / ' / ' / '\-
plot point
Logarithf:llf Contours .5, 2, 3, 5, 7.5, 1 0, ...
• 0
0
50
INTERPRETATION Strong increase in polarization accompanied by marked decrease in resis ti'lity.
Well defined increase in polarization without marked resistiv ity decrease.
Poorly defined polarization increase w ith no resistlvlty signature.
Low resistivity feature.
Scale 1:5000 0 50 100 150 200 250
metres
GRIFTCO CORPORATION
a=SOm
300
INDUCED POLARIZATION SURVEY
TT URANIUM RARE EARTH PROPE
Date: 22/05/2010 Interpretation:
DAN PATRIE EXPLORATION LTD.
TY