Embed Size (px)
Citation preview

Division of Geological & Geophysical Surveys
GEOPHYSICAL REPORT 2000-41
PORTFOLIO OF AEROMAGNETIC AND RESISTIVITY MAPS OF PART OF THE ANIAK AND IDITAROD MINING DISTRICTS,
SOUTHWESTERN ALASKA
SOUTHERN IDITAROD & NORTHERN SLEETMUTE QUADRANGLES
by
Laurel E. Burns
September 2000
THIS REPORT HAS NOT BEEN REVIEWED FOR TECHNICAL CONTENT (EXCEPT AS NOTED IN TEXT) OR FOR
CONFORMITY TO THE EDITORIAL STANDARDS OF DGGS.
Released by
STATE OF ALASKA DEPARTMENT OF NATURAL RESOURCES
Division of Geological & Geophysical Surveys 794 University Avenue, Suite 200
Fairbanks, Alaska 99709-3645
2 of 12 GPR 2000-41
PORTFOLIO OF AEROMAGNETIC AND RESISTIVITY MAPS OF PART
OF THE ANIAK AND IDITAROD MINING DISTRICTS, ALASKA
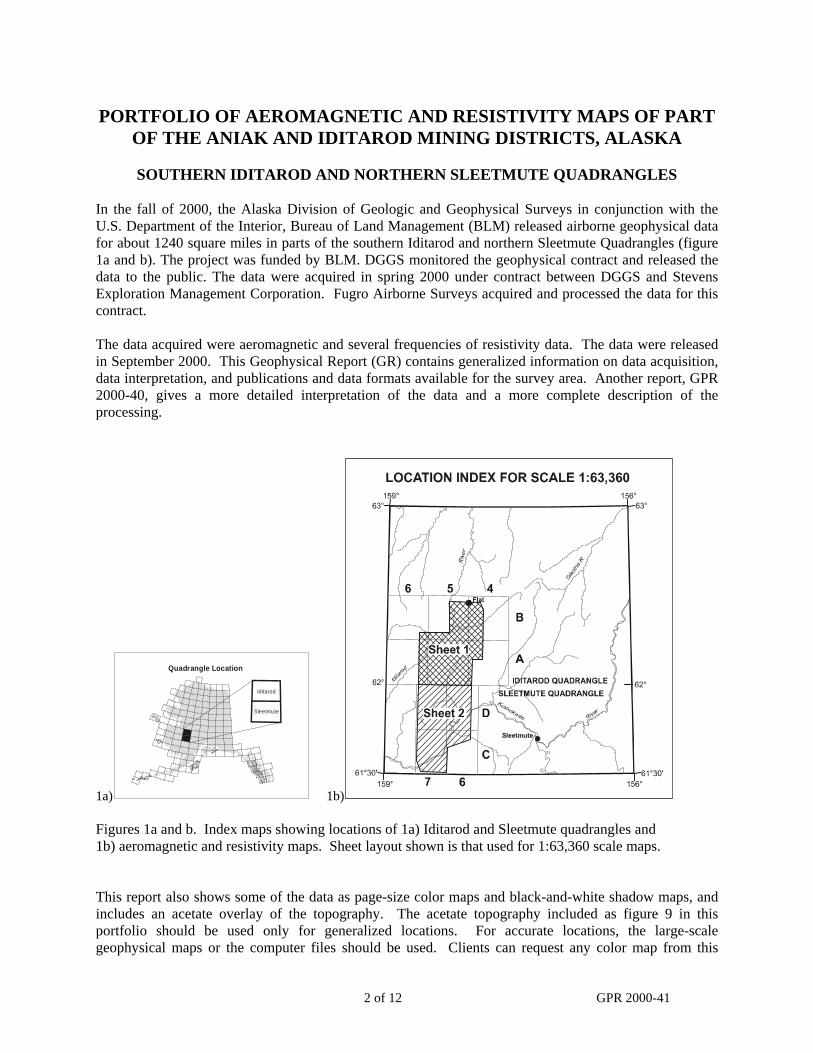
SOUTHERN IDITAROD AND NORTHERN SLEETMUTE QUADRANGLES In the fall of 2000, the Alaska Division of Geologic and Geophysical Surveys in conjunction with the U.S. Department of the Interior, Bureau of Land Management (BLM) released airborne geophysical data for about 1240 square miles in parts of the southern Iditarod and northern Sleetmute Quadrangles (figure 1a and b). The project was funded by BLM. DGGS monitored the geophysical contract and released the data to the public. The data were acquired in spring 2000 under contract between DGGS and Stevens Exploration Management Corporation. Fugro Airborne Surveys acquired and processed the data for this contract. The data acquired were aeromagnetic and several frequencies of resistivity data. The data were released in September 2000. This Geophysical Report (GR) contains generalized information on data acquisition, data interpretation, and publications and data formats available for the survey area. Another report, GPR 2000-40, gives a more detailed interpretation of the data and a more complete description of the processing.
1a)
Quadrangle Location
Iditarod
Sleetmute
1b) Figures 1a and b. Index maps showing locations of 1a) Iditarod and Sleetmute quadrangles and 1b) aeromagnetic and resistivity maps. Sheet layout shown is that used for 1:63,360 scale maps. This report also shows some of the data as page-size color maps and black-and-white shadow maps, and includes an acetate overlay of the topography. The acetate topography included as figure 9 in this portfolio should be used only for generalized locations. For accurate locations, the large-scale geophysical maps or the computer files should be used. Clients can request any color map from this

3 of 12 GPR 2000-41
portfolio at scale of 1:63,360 (1 inch = 1 mile) from the Alaska Division of Geological & Geophysical Surveys, 794 University Avenue, Suite 200, Fairbanks, Alaska, 99709-3645. Phone: (907) 451-5020. Fax: (907) 451-5050. Other maps showing variations of the data can also be made at any scale at the DGGS office for a reasonable fee. The area surveyed includes parts of the Iditarod A-4, A-5, A-6, B-4, B-5, and B-6 quadrangles and parts of the Sleetmute C-6, C-7, D-6 and D-7 quadrangles. Figures 1b and 2 show the map layout for 1:63,360 and 1:31,680, respectively.
Figure 2. Index map for aeromagnetic maps available at 1:31,680 scale. Only aeromagnetic maps are available at this scale. These maps contain topography, magnetic contours, and detailed EM anomalies. The detailed EM anomalies are shown as a symbol that denotes signal strength and an interpretation as to the source of the EM anomaly. Survey history, instrumentation, and data processing The following indented section describes the instrumentation and processing and is taken from the maps produced by Stevens Exploration Management Corporation and Fugro Airborne Surveys, the contractor and subcontractor, in conjunction with DGGS.
Geophysical data were acquired with a DIGHEMV Electromagnetic (EM) system and a Scintrex cesium magnetometer. Both were flown at a height of 100 feet. In addition, the survey recorded data from a radar altimeter, GPS navigation system, 50/60 Hz monitors, and a video camera. Flights were performed with a AS350B-2 Squirrel helicopter at a mean terrain clearance of 200 feet along NW-SE (340°)survey flight lines with a spacing of a quarter of a mile. Tie lines were flown perpendicular to the flight lines at intervals of approximately three miles. An Ashtech GG24 NAVSTAR/GLONASS Global Positioning System (RT-DGPS) was used for navigation. The helicopter position was derived every 0.5 seconds using post-flight

4 of 12 GPR 2000-41
differential positioning to a relative accuracy of better than 5 m. Flight path positions were projected onto the Clark 1866 (UTM zone 4) spheroid, 1927 North American datum using a central meridian (CM) of 159 degrees, a north constant of 0 and an east constant of 500,000. Positional accuracy of the presented data is better than 5 m with respect to the UTM grid. Total Field Magnetics: The total field magnetic data were acquired with a sampling interval of 0.1 seconds, and were (1) corrected for diurnal variations by subtraction of the digitally recorded base station magnetic data, (2) leveled to the tie line data, and (3) interpolated onto a regular 100 m grid using a modified Akima (1970) technique. The regional variation (or IGRF gradient, 2000 updated to May, 2000) was removed from the leveled magnetic data. Resistivity: The DighemV EM system measured inphase and quadrature components at five frequencies. Two vertical coaxial coil-pairs operated at 900 and 5500 Hz while three horizontal coplanar coil-pairs operated at 900, 7200, and 56,000 Hz. EM data were sampled at 0.1 second intervals. The EM system responds to bedrock conductors, conductive overburden, and cultural sources. Apparent resistivity is generated from the in-phase and quadrature components of the 7200 Hz using the pseudo-layer half space model. Akima, H., 1970, A new method of interpolation and smooth curve fitting based on local procedures:
Journal of the Association of Computing Machinery, v. 17, no. 4, p. 589-602. Fraser, D.C., 1978, Resistivity mapping with an airborne multicoil electromagnetic system:
Geophysics, v. 43, p. 589-602.
Magnetic data The magnetometer is a passive instrument that measures the earth’s magnetic field in nanoteslas (nT). Rocks with high magnetic susceptibilities (measured in SI units) locally attenuate or dampen these magnetic signals producing the relative highs and lows. Iron-rich magnetic minerals such as magnetite, ilmenite, and pyrrhotite have the highest magnetic susceptibility. These minerals commonly occur in mafic volcanic rocks (such as basalt), mafic and ultramafic plutonic rocks (such as serpentinite, clinopyroxenite, and gabbro), some skarns, and in some other geologic units. Rocks with low to no iron tend to produce little variation in the magnetic signal. These include silicic volcanic rocks (rhyolites), silicic plutonic rocks (granites), and most sedimentary rocks (for example, limestone, sandstone, and shale). Some iron-rich minerals—such as pyrite—are not magnetic and do not produce a magnetic signal. Different types of ore deposits have different magnetic signatures. A bedrock gold deposit associated with the top of a granitic pluton would likely be an aeromagnetic low whereas a magnetite-bearing gold skarn would be an aeromagnetic high. A gold deposit hosted by a low-angle (thrust) fault has a different signature than one hosted by a high-angle fault. Figure 3 shows the aeromagnetic data for the survey area. The high values (in nanoteslas) are purple and orange and indicate appreciably magnetic rocks. The low values are the blues and greens. A gradual change in color indicates a gradual change in the magnetic field strength. This can be caused by either a gradual change in magnetic susceptibility of rocks near the surface, the gradual burial of a rock unit of relatively constant magnetic susceptibility, or the introduction of a new unit at depth. Conversely, an abrupt change in color indicates an abrupt change in the magnetic susceptibility. This is caused by juxtaposing two rock units with very different magnetic susceptibilities such as is the case with faults, volcanic dikes, or some mineralized zones. Faults can be inferred on aeromagnetic maps from linear or

5 of 12 GPR 2000-41
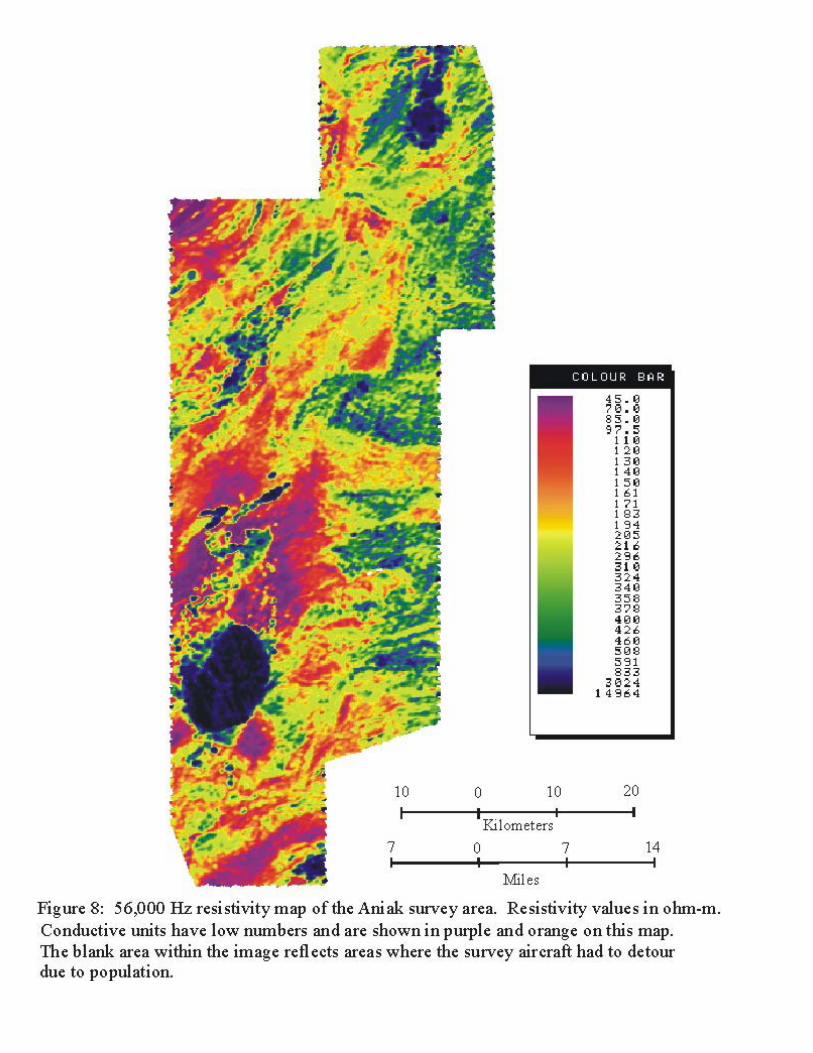
curvilinear features composed of discontinuous aeromagnetic highs or lows. Figure 4 shows the aeromagnetic data presented as a traditional “shadow” map. This three-dimensional map simulates a light source shining on the data. The higher values appear bright like the mountain tops struck by sunlight. The light source can be rotated in a complete circle with 0° (north) clockwise to 180° (south) and back to 360° (north). Shadow maps can enhance structures, such as faults, intrusions, and the trend of stratigraphic layers. A different type of shadow map containing three sources of illumination is shown in figure 5. Here red illumination is shown from the west, blue from the southeast, and green from the northeast combine to highlight different trends on the same diagram. Resistivity data The electromagnetic (EM) system is an active instrument that measures the resistivity of the rocks below it by sending out electromagnetic signals at different frequencies and recording the signals that are returned from the earth. The high values (measured in ohm-m) are indicative of resistive (low conductivity) rocks, such as quartzite. Low resistivity (high conductivity) values are present for bedrock conductors (water-saturated clays, graphite, concentrations of certain sulfides, some alteration halos), conductive overburden (water-saturated zones), and cultural sources (e.g. powerlines). The main conductive minerals are graphite, most sulfides, (but not sphalerite), and water-saturated clays. Rocks hydrothermally altered to clay minerals also are conductive. Some faults will show up very well on the resistivity maps, because they either offer a conduit for ground water or they separate rocks with markedly different resistivities. The EM instrument (bird) contains 5 or more transmitting coils in front and 5 matching (paired) receiver coils in the rear. Three of these pairs are coplanar—the axes of the coils are perpendicular to the long axis of the bird. Two of these pairs are coaxial—the axes of the coils are parallel to the long axis of the bird. These two major geometric configurations, coplanar and coaxial, record different information about the conductivity of the rocks below. Coplanar coils emphasize horizontal and flat lying conductive units. Coaxial coils emphasize vertical to near vertical conductive units. The EM coplanar coil pairs are processed to produce apparent resistivity maps, shown in figures 6, 7, and 8. For these Hz resistivity maps, the resistivity is generated from the inphase and quadrature component of the coplanar 900, 7200, and 56,000 Hz using the pseudo-layer half space model. Since ground penetration correlates inversely with frequency, the 56,000 Hz reflects near surface rocks and the 900 Hz adds the influence of deeper rocks in general. However, the depth of penetration is variable depending on the resistivity of the rocks the signal is passing through. Although the color bars in these figures differ, each figure has the most conductive rocks shown as purple and orange. The electromagnetic anomalies shown as circular symbols along flight lines on some of the aeromagnetic maps represent information derived from the coaxial electromagnetic pairs. These data emphasize vertically- or near-vertically-dipping “discrete” bedrock conductors. The 1 inch = 1 mile scale maps show anomaly symbols denoting strength of the signal, those caused by a concentration of magnetite, and those interpreted to have formed from cultural sources. More detailed interpretations for the electromagnetic anomalies are shown on the aeromagnetic maps produced at the 1:31,680 scale. This information is also available on the CD-ROM. The project report prepared by Fugro Airborne Surveys, GPR 2000-40, gives a more detailed discussion of these EM anomalies. Items to note for this particular survey A small area around the current Donlin Creek mining camp was avoided due to population. These areas show up as blanks in the geophysical grids and white in the colored maps.

6 of 12 GPR 2000-41
Description of selected products All the publications associated with this geophysical survey are of the Geophysical Report series (GPR). The publication numbers are listed at end of this portfolio. A short description of some of the publications is included here for clarity. Full color versions of the aeromagnetic data, 900 Hz coplanar resistivity data, or 7200 Hz coplanar resistivity data are available with either topographic contours or data contours at a scale of 1:63,360 (inch to a mile). The electromagnetic anomaly symbols, and flight lines are not included in any of these maps. The blueline format for the aeromagnetic data, 900 Hz coplanar resistivity data, and 7200 Hz coplanar resistivity data contain data contours and section lines, but do not show topography. The blueline aeromagnetic maps show simplified electromagnetic anomaly symbols (discussed above) along the flight lines. This aeromagnetic map is also available on mylar. The flight line maps, also produced as a bluelines, contain topography. Any of these blueline maps can be printed on the plotter for a higher price ($13/sheet as of Sept. 2000). Two publications contain digital data on CD-ROMs. GPR 2000-38 consists of two CD-ROMS, which contain profile data, gridded data, vector data, and location information. This CD-ROM is useful for someone who would like to view the original processed data or take out different mathematical trends. The files on GPR 2000-39 are a subset of those on GPR 2000-38, and consist of gridded data, vector data, and location information. In both publications, the gridded data are available as both Geosoft grids and ASCII format. Data contour lines and section grids are present in dxf vector format. A computer program capable of viewing these files in Geosoft format or converting files to another format is necessary to view the files. If you need assistance, please contact our office.

7 of 12 GPR 2000-41
DGGS PUBLICATIONS PRODUCED FOR THE ANIAK AND IDITAROD MINING DISTRICT SURVEY
AEROMAGNETIC MAPS GPR 2000-25. Total magnetic field of parts of the Aniak and Iditarod mining districts, southwestern Alaska, 2 sheets, scale 1:63,360. Topography included. Full-color plot from electronic file, 600 dpi. Made on request.
GPR 2000-26. Total magnetic field of parts of the Aniak and Iditarod mining districts, southwestern Alaska, 2 sheets, scale 1:63,360. Magnetic contours and section lines included. Full-color plot from electronic file, 600 dpi. Made on request.
GPR 2000-27. Color shadow magnetic map of parts of the Aniak and Iditarod mining districts, southwestern Alaska, 2 sheets, scale 1:63,360. Full-color plot from electronic file, 600 dpi. Made on request.
GPR 2000-28. Total magnetic field and electromagnetic anomalies of parts of the Aniak and Iditarod mining districts, southwestern Alaska, 2 sheets, scale 1:63,360. Magnetic contours, simplified electromagnetic anomalies, and section lines included. Clear mylar. Made on request.
GPR 2000-29. Total magnetic field and electromagnetic anomalies of parts of the Aniak and Iditarod mining districts, southwestern Alaska, 2 sheets, scale 1:63,360. Magnetic contours, simplified electromagnetic anomalies, and section lines included. Blueline.
GPR 2000-30A. Total magnetic field and detailed electromagnetic anomalies of parts of the Aniak and Iditarod mining districts, southwestern Alaska, 1 sheet, scale 1:31,680 (parts of Iditarod B-5 and B-6 quadrangles). Magnetic contours, detailed electromagnetic anomalies, and section lines included. Blueline.
GPR 2000-30B. Total magnetic field and detailed electromagnetic anomalies of parts of the Aniak and Iditarod mining districts, southwestern Alaska, 1 sheet, scale 1:31, (parts of Iditarod B-4 and B-5 quadrangles). Magnetic contours, detailed electromagnetic anomalies, and section lines included. Blueline.
GPR 2000-30C. Total magnetic field and detailed electromagnetic anomalies of parts of the Aniak and Iditarod mining districts, southwestern Alaska, 1 sheet, scale 1:31,680 (parts of Iditarod A-5 and A-6 quadrangles). Magnetic contours, detailed electromagnetic anomalies, and section lines included. Blueline.
GPR 2000-30D. Total magnetic field and detailed electromagnetic anomalies of parts of the Aniak and Iditarod mining districts, southwestern Alaska, 1 sheet, scale 1:31,680 (parts of Iditarod A-4 and A-5 quadrangles). Magnetic contours, detailed electromagnetic anomalies, and section lines included. Blueline.
GPR 2000-30E. Total magnetic field and detailed electromagnetic anomalies of parts of the Aniak and Iditarod mining districts, southwestern Alaska, 1 sheet, scale 1:31,680 (parts of Sleetmute D-7 quadrangles). Magnetic contours, detailed electromagnetic anomalies, and section lines included. Blueline.
GPR 2000-30F. Total magnetic field and detailed electromagnetic anomalies of parts of the Aniak and Iditarod mining districts, southwestern Alaska, 1 sheet, scale 1:31,680 (parts of Sleetmute D-6 quadrangles). Magnetic contours, detailed electromagnetic anomalies, and section lines included. Blueline.
GPR 2000-30G. Total magnetic field and detailed electromagnetic anomalies of parts of the Aniak
8 of 12 GPR 2000-41
and Iditarod mining districts, southwestern Alaska, 1 sheet, scale 1:31,680 (parts of Sleetmute C-7 quadrangles). Magnetic contours, detailed electromagnetic anomalies, and section lines included. Blueline.
GPR 2000-30H. Total magnetic field and detailed electromagnetic anomalies of parts of the Aniak and Iditarod mining districts, southwestern Alaska, 1 sheet, scale 1:31,680 (parts of Sleetmute C-6 quadrangles). Magnetic contours, detailed electromagnetic anomalies, and section lines included. Blueline.
RESISTIVITY MAPS GPR 2000-31. 7200 Hz coplanar resistivity of parts of the Aniak and Iditarod mining districts, southwestern Alaska, 2 sheets, scale 1:63,360. Topography included. Full-color plot from electronic file, 600 dpi. Made on request.
GPR 2000-32. 7200 Hz coplanar resistivity of parts of the Aniak and Iditarod mining districts, southwestern Alaska, 2 sheets, scale 1:63,360. Resistivity contours and section lines included. Full-color plot from electronic file, 600 dpi. Made on request.
GPR 2000-33. 7200 Hz coplanar resistivity of parts of the Aniak and Iditarod mining districts, southwestern Alaska, 2 sheets, scale 1:63,360. Resistivity contours and section lines included. Blueline.
GPR 2000-34. 900 Hz coplanar resistivity of parts of the Aniak and Iditarod mining districts, southwestern Alaska, 2 sheets, scale 1:63,360. Topography included. Full-color plot from electronic file, 600 dpi. Made on request.
GPR 2000-35. 900 Hz coplanar resistivity of parts of the Aniak and Iditarod mining districts, southwestern Alaska, 2 sheets, scale 1:63,360. Resistivity contours and section lines included. Full-color plot from electronic file, 600 dpi. Made on request.
GPR 2000-36. 900 Hz coplanar resistivity of parts of the Aniak and Iditarod mining districts, southwestern Alaska, 2 sheets, scale 1:63,360. Resistivity contours and section lines included. Blueline.
DIGITAL FILES, PROJECT REPORTS AND MISCELLANEOUS ITEMS GPR 2000-37. Flight lines of parts of the Aniak and Iditarod mining districts, southwestern Alaska, 2 sheets, scale 1:63,360. Topography included. Blueline.
GPR 2000-38. Set of 2 CD-ROMs containing profile data, gridded data, vector data, and location information of 2000 geophysical survey data for parts of the Aniak and Iditarod mining districts, southwestern Alaska. Gridded data in Geosoft and ASCII format. Vector data consists of data contour lines and is in dxf format.
GPR 2000-39. CD-ROM containing gridded data, vector data, and location information of 2000 geophysical survey data for parts of the Aniak and Iditarod mining districts, southwestern Alaska. Gridded data in Geosoft and ASCII format. Vector data consists of data contour lines and is in dxf format.
GPR 2000-40. Project report of the Geophysical Survey of parts of the Aniak and Iditarod mining districts, southwestern Alaska; by Mark Stephens of Fugro Airborne Surveys.
GPR 2000-41. Portfolio of aeromagnetic and resistivity maps of parts of the Aniak and Iditarod mining districts, southwestern Alaska. Includes color and shadow maps. Maps fit 8½” x 11” sheet.

9 of 12 GPR 2000-41
SOME AVAILABLE REFERENCES FOR THE ANIAK AND IDITAROD MINING DISTRICTS
Bailey, Elizabeth A., and Gray, John E., 1997, Mercury in the terrestrial environment, Kuskokwim Mountains
region, Southwestern Alaska, in Dumoulin, Julie A., and Gray, John E., editors, Geologic studies in Alaska by the U.S. Geological Survey, 1995: U.S. Geological Survey Professional Paper 1574, p. 41-56.
Barnes, David F., 1978, Gravity map of the western part of southern Alaska: U.S. Geological Survey Open-File Report 77-169-H.
Beikman, Helen M., Holloway, C. D., and MacKevett, Edward M., Jr., 1978, Generalized geologic map of the western part of southern Alaska: U.S. Geological Survey Open-File Report 77-169-G.
Bennett, G. J., Gray, John E., and Taylor, C. D., 1988, Mineralogy and sample locality map of the nonmagnetic, heavy-mineral-concentrate samples, Iditarod Quadrangle, Alaska: U.S. Geological Survey Open-File Report 88-0032.
Bottge, R. G., 1988, Special publication - Availability of land for Mineral exploration and development in western Alaska, 1986: U. S. Bureau of Mines Special Publication, 47 p., 38 sheets.
Bundtzen, T. K., Miller, Marti L., Laird, Gregory M., and Bull, Katherine F., 1992, Geology and mineral resources of Iditarod mining district, Iditarod B-4 and eastern B-5 quadrangles, Southwestern Alaska: Alaska. Division of Geological & Geophysical Surveys Professional Report 97.
Bundtzen, T. K., Cox, B. C., and Veach, N. C., 1987, Heavy mineral provenance studies in the Iditarod and Innoko districts, western Alaska: Alaska Division of Geological & Geophysical Surveys Public-Data File 87-16, 25 p.
Bundtzen, T. K., Miller, M., Bull, K. F., and Laird, G. M., 1992, Geologic map of the Iditarod B-4 and Eastern B-5 Quadrangle, Alaska: Alaska Division of Geological & Geophysical Surveys Professional Report 97, 64 p., 1 sheet, scale 1:63,360.
Cady, John W., 1989, Geologic implications of topographic, gravity, and aeromagnetic data in the northern Yukon-Koyukuk Province and its borderlands, Alaska, in Patton, William W., Jr., and Box, Stephen E., editors, Special section on Yukon-Koyukuk Basin and its borderlands, western Alaska: Journal of Geophysical Research, B, Solid Earth and Planets, , vol. 94, No. 11, p. 15,821-15,841.
Cobb, Edward H., 1972, Metallic mineral resources map of the Sleetmute Quadrangle, Alaska, U.S: Geological Survey Miscellaneous Field Studies Map MF-0368.
Cobb, Edward H., 1974, Nickel occurrences in Alaska: Mineral Investigations Resources Map, MR-0063. Decker, John E., Bergman, Steven C., Blodgett, Robert B., Box, Stephen E., Bundtzen, Thomas K., Clough,
James G., Coonrad, Warren L., Gilbert, Wyatt G., Miller, Marti L., Murphy, John M., Robinson, Mark S., and Wallace, Wesley K., 1994, Geology of Southwestern Alaska, in Plafker, George, and Berg, Henry C., editors, The geology of Alaska: vol. G-1, p. 285-310.
Decker, J., Reifenstuhl, R. R., and Coonrad, W. L., 1984, Compilation of geologic data from the Iditarod A-5 Quadrangle: Alaska Division of Geological & Geophysical Surveys Report of Investigations 84-17, 1 sheet, scale 1:63,360.
Decker, J., Reifenstuhl, R. R., and Coonrad, W. L., 1984, Compilation of geologic data from the Sleetmute A-5 Quadrangle: Alaska Division of Geological & Geophysical Surveys Report of Investigations 84-29, 1 sheet, scale 1:63,360. Decker, J., Reifenstuhl, R. R., and Coonrad, W. L., 1984, Compilation of geologic data from the Sleetmute B-5 quadrangle, southwestern Alaska: Alaska Division of Geological & Geophysical Surveys Public-Data File 84-44, 1 sheet, scale 1:63,360.
Decker, J., Reifenstuhl, R. R., and Coonrad, W. L., 1985, Compilation of geologic data from the Sleetmute A-7 Quadrangle, southwestern Alaska: Alaska Division of Geological & Geophysical Surveys Report of Investigations 85-1, 1 sheet, scale 1:63,360.
Decker, John E., Reifenstuhl, Rocky, Robinson, M. S., Waythomas, Christopher F., and Clough, James G., 1995, Geology of the Sleetmute A-5, A-6, B-5, and B-6 quadrangles, Southwestern Alaska, Professional Report: Alaska. Division of Geological & Geophysical Surveys, 99.
Dickinson, K. A., and Campbell, John A., 1978, Epigenetic mineralization and areas favorable for uranium

10 of 12 GPR 2000-41
exploration in Tertiary continental sedimentary rock in South-central Alaska; a preliminary report: U.S. Geological Survey Open-File Report 78-757.
Eakin, H. M., 1914, The Iditarod--Ruby region, Alaska: U. S. Geological Survey Bulletin 578, 45 p., 1 sheet, scale 1:250,000.
Foley, J. Y., Burns, L. E., Schneider, C. L., and Forbes, R. B., 1989, Preliminary report of platinum group element occurrences in Alaska: Alaska Division of Geological & Geophysical Surveys Public-Data File 89-20, 33 p., 1 sheet, scale 1:2,500,000.
Gray, John E., Arbogast, Belinda F., and Hudson, A. E., 1988, Geochemical results and sample locality map of the stream sediment and nonmagnetic, heavy-mineral-concentrate samples from the Iditarod Quadrangle, Alaska: U.S. Geological Survey Open-File Report 88-0221.
Gray, John E., Hageman, Philip L., and Ryder, Jean L., 1992, Comparison of the effectiveness of stream-sediment, heavy-mineral-concentrate, aquatic-moss, and stream-water geochemical sample media for the mineral assessment study of the Iditarod Quadrangle, Alaska, in Bradley, Dwight C., and Dusel-Bacon, Cynthia, editors, Geologic studies in Alaska by the U.S. Geological Survey, 1991: U.S. Geological Survey Bulletin 2041, p. 49-59.
Gray, John E., Theodorakos, Peter M., Bradley, Leon A., and Bullock, John H., Jr., 1993, Favorable areas for metallic mineral resources in and near the Horn Mountains, Sleetmute Quadrangle, Southwestern Alaska, in Dusel-Bacon, Cynthia, and Till, Alison B., editors, Geologic studies in Alaska: U.S. Geological Survey, 1992: U.S. Geological Survey Bulletin 2068, p. 79-90.
Gray, John E., Theodorakos, Peter M., Budahn, James R., and O'Leary, Richard M., 1994, Mercury in the environment and its implications, Kuskokwim River region, Southwestern Alaska, in Till, Alison B., and Moore, Thomas E., editors, Geologic studies in Alaska: U.S. Geological Survey, 1993: U.S. Geological Survey Bulletin 2107, p. 3-13.
Gray, John E., and Theodorakos, Peter M., 1997, Areas favorable for metallic mineral resources and newly discovered mineral occurrences in the Buckstock Mountains area, Southwestern Alaska, in Dumoulin, Julie A., and Gray, John E., editors, Geologic studies in Alaska by the U.S. Geological Survey, 1995: U.S. Geological Survey Professional Paper 1574, p. 111-123.
Holloway, C. D., 1978, Map showing coal fields and distribution of coal bearing rocks in the western part of southern Alaska: U.S. Geological Survey Open-File Report 77-169-I.
Holt, Andrew W. and Smith, Steven M., 1997, NURE HSSR Study: Iditarod Quadrangle, Alaska: U.S. Geological Survey National Geochemical Database Open-File Report 97-492, Internet: http://greenwood.cr.usgs.gov/pub/open-file-reports/ofr-97-0492/quad_ak/q_iditar.htm
Holzheimer, F. W., 1926, Lode mining activity, Otter Creek, Iditarod District, Alaska: Alaska Territorial Department of Mines Miscellaneous Report 73-1, 8 p.
Holzheimer, F. W., 1926, Placer operations, Iditarod District: Alaska Territorial Department of Mines Miscellaneous Report 73-3, 8 p.
Keith, W. J., and Miller, M. L., 1996, Alaska Resource Data File: Iditarod Quadrangle: U. S. Geological Survey Open-File Report 96-540, 35 p., Internet: http://ardf.wr.usgs.gov/quads/html/Iditarod.html
Keith, W. J., and Miller, Marti L., 1997, Alaska Resource Data File; Sleetmute Quadrangle: U.S. Geological Survey Open-File Report 97-0032, Internet:http://ardf.wr.usgs.gov/quads/html/Sleetmute.html
Krause, K. J., 1984, Photointerpretive map of morphological flood-plain deposits and materials resources, middle Kuskokwim River from Sleetmute to Kalskag: Alaska Division of Geological & Geophysical Surveys Report of Investigations 84-2, 4 p., 5 sheets, scale 1:63,360.
Laird, G. M., and Bundtzen, T. K., 1985, Resource evaluation, southcentral Kuskokwim Mountains, Alaska: Alaska Division of Geological & Geophysical Surveys Public-Data File 85-25, 2 p.
MacKevett, Edward M., Jr., and Holloway, C. D., 1978, Map showing metalliferous mineral deposits in the western part of southern Alaska: U.S. Geological Survey Open-File Report 77-169-F.
Maloney, R. P., 1962, Investigation of mercury-antimony deposits near Flat, Yukon River region, Alaska: U. S. Bureau of Mines Report of Investigations 5991, 44 p.
McGimsey, Robert G., Miller, Marti L., and Arbogast, Belinda F., 1988, Paper version of analytical results, and sample locality map for rock samples from the Iditarod Quadrangle, Alaska: U.S. Geological Survey Open-File Report 88-0421-A.
11 of 12 GPR 2000-41
Meyer, M. P., 1983, Mineral investigation of the Iditarod-George planning block, central Kuskokwim River Area, Alaska: U. S. Bureau of Mines, Report for Bureau of Land Management, 253 p., 4 sheets.
Miller, M. L., Belkin, H. E., Blodgett, R. B., Bundtzen, T. K., Cady, J. M., Goldfarb, R. G., Gray, J. E., McGimsey, R. G., and Simpson, S. L., 1989, Pre-field study and mineral resource assessment of the Sleetmute quadrangle, southwestern Alaska: U. S. Geological Survey Open-File Report 89-363, 115 p., 3 sheets, scale 1:250,000.
Miller, Marti L., and Bundtzen, Thomas K., 1985, Metamorphic rocks in the western Iditarod Quadrangle, west-central Alaska, in Bartsch-Winkler, Susan, and Reed, Katherine M., editors, The United States Geological Survey in Alaska; accomplishments during 1983: U.S. Geological Survey Circular 0945, p. 24-28.
Miller, Marti L., and Bundtzen, Thomas K., 1994, Generalized geologic map of the Iditarod Quadrangle, Alaska, showing potassium-argon, major-oxide, trace-element, fossil, paleocurrent, and archaeological sample localities: U.S. Geological Survey Miscellaneous Field Studies Map MF-2219-A.
Newberry, R. J., 1995, An update on skarn deposits of Alaska: Alaska Division of Geological and Geophysical Surveys Public-Data File 95-20, 72 p., 1 disk.
Patton, William W., Jr., and Box, Stephen E., 1989, Special section on Yukon-Koyukuk Basin and its borderlands, western Alaska, Journal of Geophysical Research, B, Solid Earth and Planets, vol. 94, No. 11, p. 15,805-16,020.
Patton, William W., Jr., Box, Stephen E., Moll-Stalcup, Elizabeth J., and Miller, Thomas P., 1994, Geology of West-Central Alaska, in Plafker, George, and Berg, Henry C., editors, The geology of Alaska: vol. G-1, p. 241-269. Reifenstuhl, R. R., Decker, J., Murphy, J. M., and Coonrad, W. L., 1984, Compilation of geologic data from the Sleetmute A-6 Quadrangle, southwestern Alaska: Alaska Division of Geological and Geophysical Surveys Public-Data File 84-43, 1 sheet, scale 1:63,360.
Reifenstuhl, R. R., Robinson, M. S., Smith, T. E., Albanese, M. D., and Allegro, G. A., 1984, Geologic map of the Sleetmute B-6 Quadrangle: Alaska Division of Geological & Geophysical Surveys Report of Investigations 84-12, 1 sheet, scale 1:40,000.
Robinson, M. S., 1984, Rock, pan-concentrate, and stream-sediment geochemistry, Sleetmute B-6 Quadrangle: Alaska Division of Geological & Geophysical Surveys Report of Investigations 84-11, 1 sheet, scale 1:40,000.
Robinson, M. S., 1986, Basic statistical analysis of geochemical results for rock, pan-concentrate, and stream-sediment samples from the Sleetmute A-5, A-6, B-5, and B-6 Quadrangles, southwest Alaska: Alaska Division of Geological & Geophysical Surveys Public-Data File 86-6, 81 p., 3 sheets, scale 1:63,360.
Robinson, M. S., Decker, J., Reifenstuhl, R. R., Murphy, J. M., and Box, S. E., 1984, Geologic map of the Sleetmute B-5 quadrangle: Alaska Division of Geologic and Geophysical Surveys Report of Investigations 84-10, 1 sheet, scale 1:40,000.
Robinson, M. S., Nye, C. J., and Decker, J., 1986, Preliminary whole rock major oxide and trace element geochemistry of selected igneous rocks from the Sleetmute, Russian Mission, and Taylor Mountains quadrangles, southwestern Alaska: Alaska Division of Geological & Geophysical Surveys Public-Data File 86-98, 8 p.
Roehm, J. C., 1939, Aniak-Tuluksak, Goodnews Bay and Kuskokwim Districts - excerpts: Alaska Territorial Department of Mines Miscellaneous Report 91-2, 2 p., 1 sheet.
Slaughter, K. E., Gray, John E., Hageman, P. L., Kilburn, James E., Love, A. H., and Peacock, R. T., 1990,
Geochemical data and sample locality maps for stream water and vegetation samples collected near five cinnabar-stibnite mineral occurrences in the Kuskokwim River region, southwestern Alaska: U.S. Geological Survey Open-File Report 90-0340-A.
Szumigala, David J., 1995, Mineralization and zoning of polymetallic veins in the Beaver Mountains volcano-plutonic complex, Iditarod Quadrangle, westcentral Alaska, in, Combellick, R. A. and Tannian, F., eds. Short notes on Alaska Geology 1995: Alaska Division of Geological & Geophysical Surveys Professional Report 117, p. 79-95.
Theodorakos, P. M., Borden, J. Carter, Bullock, John H., Jr., Gray, John E., and Hageman, P. L., 1992,

12 of 12 GPR 2000-41
Analytical data and sample locality map of stream-sediment and heavy-mineral-concentrate samples collected from the Horn Mountains area, Sleetmute Quadrangle: Southwest Alaska: U.S. Geological Survey Open-File Report 92-0708-A.
Theodorakos, P. M., Borden, J. Carter, Bullock, John H., Jr., Gray, John E., and Hageman, P. L., 1992, Analytical data and sample locality map of stream-sediment and heavy-mineral-concentrate samples collected from the Horn Mountains area, Sleetmute Quadrangle, Southwest Alaska: U.S. Geological Survey Open-File Report 92-0708-B.

THIS PAGE INTENDED TO BE PRINTED ON CLEAR ACETATE/MYLAR