Embed Size (px)
Citation preview

Marine Geology 303–306 (2012) 63–74
Contents lists available at SciVerse ScienceDirect
Marine Geology
j ourna l homepage: www.e lsev ie r .com/ locate /margeo
Geophysical evidence of a late Pleistocene glaciation and paleo-ice stream on theAtlantic Continental Shelf offshore Massachusetts, USA
Jacob Siegel a,⁎, Brandon Dugan a, Daniel Lizarralde b, Mark Person c, Whitney DeFoor c, Nathaniel Miller d
a Department of Earth Science, Rice University, Houston, TX, USAb Department of Geology and Geophysics, Woods Hole Oceanographic Institution, Woods Hole, MA, USAc Department of Earth and Environmental Sciences, New Mexico Institute of Mining and Technology, Socorro, NM, USAd Marine Geology and Geophysics, MIT/WHOI Joint Program, Woods Hole, MA, USA
⁎ Corresponding author. Tel.: +1 510 717 8433; fax:E-mail address: [email protected] (J. Siegel).
0025-3227/$ – see front matter © 2012 Elsevier B.V. Alldoi:10.1016/j.margeo.2012.01.007
a b s t r a c t
a r t i c l e i n f oArticle history:Received 24 May 2011Received in revised form 28 January 2012Accepted 30 January 2012Available online 7 February 2012
Communicated by: D.J.W. Piper
Keywords:offshore Massachusettsglacial erosionlate Pleistocene glaciationhigh-resolution seismic dataice stream
Interpretations of seismic reflection data collected offshore Massachusetts, USA, reveal the first conclusivegeophysical evidence of a pre-Wisconsinan glaciation that extended beyond the limits of the Last GlacialMaximum (LGM) in the region. The data image numerous glacial geomorphic features that define the extentof a paleo-ice stream, including: (1) a regionally distributed erosion surface that forms a 50 km wide trough,with steeply eroded sidewalls (4°–18°) and nearly 100 m in relief at the margins; (2) a network of sub-icesheet meltwater channels; and (3) a transparent, glacigenic seismic unit. The orientation of the paleo-ice streamtrough indicates that the ice streamflowed to the south-southwest, toward the shelf break. This suggests that theice stream formed further to the north, where it appears that Georges Bank (southeast of the Gulf of Maine, USA)redirected ice flow. Limited well data constrain the glacial erosion event (up to 300 m below sea-level) to occurwithin the Pleistocene. The glacial event represents a timeof larger ice volumeon the northernAtlantic continentalshelf, as compared to the LGM; thus, we suggest that the event corresponds to marine oxygen isotope stage 12(late Pleistocene) when the first major Pleistocene shelf-crossing glaciation began offshore southeastern Canada.These geophysical constraints on a late Pleistocene glaciation offshore Massachusetts have important implica-tions for: (1)models of the Laurentide Ice Sheet, as the geomorphic evidence of pre-LGM ice streams are difficultto characterize yet account for most of the ice sheet's mass flux; and (2) the pore water salinity pattern offshoreNew England, as sedimentary basins near an ice sheet margin often contain large volumes of glacially emplacedfreshwater.
© 2012 Elsevier B.V. All rights reserved.
1. Introduction
Geophysical evidence of Pleistocene ice sheets and ice streams arecritical to reconstruct the timing and extent of Pleistocene glaciations(Dyke and Prest, 1987; Anderson et al., 2002; Dyke et al., 2002), to con-strain models of Pleistocene ice sheet formation (Denton and Hughes,2002;Marshall et al., 2002; Boulton and Hagdorn, 2006), and to evaluatethe influences of Pleistocene ice sheets on subsurface freshwater distri-bution (Person et al., 2007; Cohen et al., 2010). The Wisconsin ice sheethas been well documented throughout the northern US and CanadianAtlantic shelf with the use of bathymetric data, sediment cores, andnear-surface seismic data (Schlee and Pratt, 1970; Tucholke andHollister, 1973; Uchupi et al., 2001; Shaw et al., 2006). Near-surface seis-mic data, multibeam data, and sediment cores have helped to character-ize the distribution of the Wisconsin ice sheet; however, pre-
+1 713 348 5214.
rights reserved.
Wisconsinan ice sheet deposits are too deeply buried to be characterizedwith these shallow-imaging methods (Piper, 1988). In many areas, theevidence of pre-Wisconsinan glaciation has been removed by erosionduring the Wisconsinan glaciation (Giosan et al., 2002). Many studieshave dated deposits of glacially eroded sediments on the continentalslope offshore southeastern Canada to infer the timing of pre-Wisconsinan ice sheets (Alam and Piper, 1977; Piper, 1988; Amos andMiller, 1990; Piper et al., 1994). Although these methods establish thetiming of Pleistocene glacial cycles offshore, they do not provide conclu-sive evidence for the location and extent of ice sheet erosion on the con-tinental shelf.
Offshore Massachusetts, USA, is a prime region to constrain theoffshore extent of Pleistocene glaciations as it marks the transitionfrom the repeatedly glaciated Gulf of Maine to the proglacial conti-nental shelf offshore New Jersey, USA. Many studies of shallow,well-preserved glacial features have been used to infer the maximumextent of the Wisconsin ice sheet offshore Massachusetts (Fig. 1) in-cluding: (1) major erosion observed in near-surface seismic data(Uchupi, 1966; Oldale et al., 1974); (2) the distribution of gravel insurface sediment samples (Pratt and Schlee, 1969; Schlee and Pratt,1970); and (3) moraines and glacio-tectonic structures on Martha's

100 km
400
4001000
1000
2000
2000
0 100 200 300 400
GeorgesBank
Georges Basin /Southeast Channel
FranklinBasin
Gulf of Maine
NantucketShoals
N
AMCOR 6012AMCOR 6013
USGS 6001
ENW-50
USGS Line 12
NH
MA
RI
NY
NJ
CT
MI
NH
100 km
300 km
N
GreatSouth
Channel
72˚ 71˚ 70˚ 69˚ 68˚ 67˚
40˚
41˚
42˚
43˚
Water Depth (m)
1
2
34
LGM2LGM1
44˚
40˚
68˚76˚
ME
Fig. 1. Regional basemap showing seismic lines (solid black lines) and wells (diamonds) used in this study. Black lines mark location of single-channel, shallow seismic profiles(Uchupi, 1966; Knott and Hoskins, 1968), multi channel USGS seismic profiles (Schlee et al., 1976), and high-resolution, multi-channel seismic reflection profiles. Black diamondsmark the locations of AMCOR and UCGS wells (Folger et al., 1978; Hathaway et al., 1979). Black dashed lines mark the inferred boundary of the maximum extent of the LaurentideIce Sheet from previous studies, LGM1 (Uchupi et al., 2001), LGM2 (Schlee and Pratt, 1970; Tucholke and Hollister, 1973). Black lines with arrows show LGM ice flow direction(Shaw et al., 2006). Inset basemap shows location of study region offshore New England, USA, with the four geographic regions used to define the Pleistocene glacial history:(1) offshore New Jersey; (2) offshore Massachusetts; (3) offshore Maine (Gulf of Maine); and (4) offshore southeastern Canada.
64 J. Siegel et al. / Marine Geology 303–306 (2012) 63–74
Vineyard, MA, USA and Nantucket Island, MA, USA (Oldale andO'Hara, 1984; Uchupi and Mulligan, 2006). These studies did not in-terpret pre-Wisconsinan ice sheet margins.
In August, 2009, we collected a high-resolution, multi-channelseismic survey offshore Massachusetts as part of an IntegratedOcean Drilling Program (IODP) site survey. Here, we present evidencefor the extent of a late Pleistocene glaciation offshore Massachusettsbased on our interpretations of the seismic data. The data image a re-gionally extensive erosion surface that has glacial–geomorphic fea-tures consistent with a paleo-ice stream trough. The direction ofice-stream flow was to the south-southwest and indicates that theice stream originated to the north, near Georges Bank (southeast ofthe Gulf of Maine). Georges Bank contains similar glacial geomorphicfeatures that we assume are contemporaneous with the glacial fea-tures offshore Massachusetts. From this we develop a regional inter-pretation for a paleo-ice stream that extended from the Gulf ofMaine to offshore Massachusetts, and we infer a potential ice sheet
margin. The interpreted glacial extent has a geometry similar to theWisconsin ice sheet. Our interpretation of the seismic data suggeststhat the late Pleistocene glaciation extended farther south acrossthe Massachusetts continental shelf than previously thought. Thishas important implications as it can help constrain hydrogeologicmodels used to predict the emplacement of sub-surface freshwater,and glacial models used to predict the formation of Pleistocene icesheets.
2. Geologic setting
2.1. Continental shelf
Our study region lies on the passive continental margin offshoreMassachusetts. The formation of the continental shelf beganwith riftingof the Atlantic during the late Triassic to early Jurassic. The riftingformed basement rock comprised of a series of normal fault blocks

65J. Siegel et al. / Marine Geology 303–306 (2012) 63–74
(Hutchinson et al., 1986). As the basement rock subsided, a thick sedi-mentary wedge accumulated from the Cretaceous through the present.The result was a passivemargin with a sedimentary wedge up to 14 kmthick (Schlee et al., 1976; Poag, 1978).
41°
40°
71° 70°
line 12line 24
line 7
line 17
line 14
line 13
line 10
line 15
line 16
line 9
line 2 line 5
line 20
line 1
line 8
line 4
line 3
NMartha’sVineyard
NantucketA
A’
B
B’
C’
C
30 km
Fig. 2. Basemap showing location of high-resolution, multi-channel seismic reflection linescollected for this study offshoreMartha's Vineyard andNantucket Islands, USA. Seismic linesare labeled by their acquisition line number. The gray box defines the region of the isopachmaps (Fig. 4).
2.2. Pleistocene glacial history
We define four geographic regions on the Atlantic continental shelfto address its Pleistocene glacial history: (1) offshore New Jersey;(2) offshore Massachusetts; (3) offshore Maine (Gulf of Maine); and(4) offshore southeastern Canada (Fig. 1). To the south of our primarystudy region, offshore New Jersey shows little evidence of Pleistoceneglaciations (Carey et al., 2005). North of our study region, offshoreMaine and offshore southeastern Canada contain abundant evidenceof multiple Pleistocene glaciations (Piper et al., 1994). Offshore Massa-chusetts, there is limited information on Pleistocene glaciations andtheir extent beyond the Laurentide Ice Sheet during the LGM, whichreached the islands of Martha's Vineyard and Nantucket (Fig. 1).
Much of the understanding of Pleistocene ice sheets on the Atlanticcontinental shelf comes from interpretations of glacially derived sedi-ments on the continental slope offshore southeastern Canadian. Piperet al. (1994) interpreted variations in sediment type and thickness ob-served in a 20 mpiston core sample obtained on the continental rise off-shore southeastern Canada as evidence for numerous episodes ofglaciation in the late Pleistocene. They noted that isotope stages 14and 12 were the first widespread Pleistocene glaciations on the conti-nental shelf as indicated by the significant erosion of Cretaceous to Ter-tiary sediments, and their deposition on the slope. Interpretations ofseismic reflection data on the continental slope offshore Nova Scotiaalso show that isotope stage 12 was the first wide-spread Pleistoceneglacial event (Piper and Normark, 1989; Berry and Piper, 1993). Tothe north, sediments offshore Newfoundland show that the mid-Illinoian ice sheet (marine oxygen isotope stages 8 and 6) coveredmost of Grand Banks and reached the shelf break, extending fartherthan the Wisconsin ice sheet (Alam and Piper, 1977; Huppertz andPiper, 2009). These studies suggest that during the early Pleistocene,glaciations did not reach the southeastern Canadian shelf, as there arefew glacially derived sediments. Thus, the onset of shelf-crossing glaci-ations appears to have started in the middle to late Pleistocene.
The Gulf of Maine also contains evidence of repeated Pleistoceneglaciations. Core data from the Gulf of Maine show several episodesof glacial erosion, till deposition, and glacial outwash (Pratt andSchlee, 1969; Schlee and Pratt, 1970; Uchupi, 1970; Oldale andO'Hara, 1984). Interpretations from low-resolution seismic data off-shore Massachusetts show Pleistocene glacial unconformities andlarge, buried channels associated with glacial scouring (Knott andHoskins, 1968; McMaster and Ashraf, 1973a, 1973b). Glacio-tectonicthrust structures identified on sea cliffs on Martha's Vineyard andNantucket also reflect repeated Pleistocene glaciations (Oldale andO'Hara, 1984). These studies show evidence of multiple Pleistoceneice sheet advances; however, the ability to constrain maximum gla-cial extent offshore Massachusetts has been limited by the availabledata.
The marine oxygen isotope record supports the interpretations ofgeologic data on the Atlantic continental shelf and shows that thePleistocene contained multiple episodes of widespread ice accumula-tion (Giosan et al., 2002). In the late Pleistocene, glacial cyclicity chan-ged to an approximately 100 ka cycle with a corresponding largeraccumulation of ice volume during glacial cycles (Williams et al.,1988; Balco and Rovey, 2010). The longer period of ice accumulationduring the late Pleistocene led to an increased ice extent onto the con-tinental shelves, as indicated in the geologic record (Piper et al.,1994). Thus, sedimentologic and isotopic data indicate that the largestPleistocene advances of ice sheets onto theAtlantic continental shelf ap-pear to have been more common in the late Pleistocene.
3. Data and methods
We collected a grid of high-resolution, multi-channel seismic dataoffshore Massachusetts using the Scripps Institution of Oceanogra-phy's portable seismic system. The system employs a 45 in.3/105 in.3, generator–injector (GI) air gun source that produces fre-quencies up to 200 Hz, and a digital streamer with 48 hydrophonegroups spaced at 12.5 m. We collected seven north–south (dip)lines, and 11 east–west (strike) lines (Fig. 2). Seismic processing in-cluded outside trace muting, bandpass filtering, true amplitude re-covery, velocity filtering in the f–k and radon transform domains,deconvolution in the tau–p domain, normal moveout (NMO) correc-tion, post-stack deconvolution, Kirchhoff post-stack depth migration,and deconvolution in the f–x domain. In 50–150 m water depth, thewater bottom multiple has been sufficiently suppressed by our pro-cessing. In 25–50 m water depth, the water bottom multiple inter-feres with true reflections, and interpretation is more difficult in theshallow section. Stacking velocity analysis was performed every500 m. Interval velocities, based on the stacking velocities, wereused for depth migration. Our data achieve a horizontal and verticalresolution of 4–9 m, assuming peak frequency of 100 Hz and an averagecompressional wave velocity of 1800 m/s.
Data processing produced clear, interpretable images, enabling usto identify prominent reflections, infer depositional units, and con-strain time stratigraphic sequences up to 800 m in depth. We relatesediment deposition styles to glacial and non-glacial processes.

66 J. Siegel et al. / Marine Geology 303–306 (2012) 63–74
4. Observations, interpretations, and age estimates
Six stratigraphic units (A, B, C, D, E, and F) and two regional uncon-formities (U1 and U2) are identified based on their seismic character,amplitude, and bounding surfaces (Fig. 3).
There are no direct well ties to the seismic lines we acquired; thusage estimates rely on correlation of observed stratigraphic architec-ture offshore Massachusetts with dated stratigraphic architectureinterpreted on high-resolution seismic reflection profiles collectedoffshore New Jersey (Poulsen et al., 1998; Steckler et al., 1999;Duncan et al., 2000; Metzger et al., 2000; Goff et al., 2005;Monteverde et al., 2008; Nordfjord et al., 2009) and on shallow,low-resolution seismic profiles collected offshore Martha's Vineyard(Knott and Hoskins, 1968; McMaster and Ashraf, 1973a). The unitsinterpreted from the New Jersey seismic data are tied to Ocean DrillingProgram (ODP) sites,which provide good age control for theNew Jerseyseismic units. Thus, the dated seismic data offshore New Jersey help usestimate the age of seismic units offshore Massachusetts based on ob-served similarities in their seismic sequence architectures. For example,the deeper, pre-glacial sediments offshoreMassachusetts change from apredominantly parallel-aggradational reflection package (unit D inFig. 3) to a progradational reflection package with greater dip (unit Cin Fig. 3). This change in reflection stacking pattern is also observed off-shore New Jersey, where it is interpreted to represent a 20 fold greatersiliciclastic sediment supply during the Oligocene and Miocene relativeto the Cretaceous and Eocene (Poulsen et al., 1998; Steckler et al., 1999;Monteverde et al., 2008). In addition,we estimate age by correlating seis-mic surfaces observed in USGS seismic data offshore Massachusetts withnearby Atlantic Margin Coring Project (AMCOR) well data (Hathaway
0
200
400
600
800
0
200
400
600
800
dept
h (m
bsl)
14813712
unit A - Pleistocene/
N
A
unit E - Cretaceous
unit F - Jurassic
subunit B1 - Pleistocene
U1
A
B
-
-
-
-
-
-
-
-
-
-
dept
h (m
bsl)
Fig. 3. (A) Uninterpreted seismic line 1 (A–A′) and (B) interpreted line drawing of major dprofile indicate the location of crossing seismic lines (Fig. 2).
et al., 1979) and USGS well data (Figs. 1 and 5) (Folger et al., 1978; Hallet al., 1980).
4.1. Pre-Pleistocene, non-glacial units
4.1.1. Unit F — Jurassic basementUnit F is the deepest unit interpreted, and represents the limit of
penetration from the seismic source. The unit contains few internalreflections. A high impedance contrast produces the top, high-amplitude bounding reflection, where unit F has an average P-wavevelocity of 5 km/s and the overlying strata have an average P-wavevelocity of 2–3 km/s. The unit is interpreted as acoustic basementbased on its high velocity. McMaster and Ashraf (1973a) observedacoustic basement of similar seismic character, depth, and dip in seis-mic profiles southwest of Martha's Vineyard. Folger et al. (1978) de-scribe Jurassic basalt at 460 m below sea-level (mbsl) on NantucketIsland in USGS 6001 well data (Fig. 1). We conclude unit F is Jurassicbasement.
4.1.2. Units E and D — Cretaceous to Eocene carbonate mudUnit E is bounded below by unit F. It is mainly transparent and con-
tains few continuous, sub-horizontal reflections that have a dip directionto the south (Fig. 3). The unit is interpreted as Cretaceous as it overliesthe Jurassic basement. Cretaceous strata offshore Martha's Vineyard(McMaster and Ashraf, 1973a) and offshore New Jersey (Steckler et al.,1999) display similar seismic character to unit E. Steckler et al. (1999)identified the Cretaceous–Tertiary boundary reflection ranging indepth from 0.5 km near shore to 1.5 km near the shelf break offshoreNew Jersey, a similar depth range of unit E.
1610159a
unit D -Paleocene/
Eocene
unit C-Oligocene/Miocene
Holocene sea-floor
S
A’
25 km
U1subunit B2 - Pleistocene
U2
epositional units. Seismic line 1 (A–A′) is located in Fig. 2. Numbers at the top of the

67J. Siegel et al. / Marine Geology 303–306 (2012) 63–74
Unit D overlies unit E, and is bounded above by the U1 unconfor-mity and unit C. Within unit D, seismic reflections are continuous,sub-horizontal, and high-amplitude (Fig. 3). The reflections have anaggradational stacking pattern and a dip direction to the south, withan average dip of 0.35°. Unit D thickens from 50 m in the north to300 m in the south (Fig. 4). The high-amplitude, continuous, aggrad-ing reflection pattern of unit D is similar to reflection patterns of latePaleocene and early Eocene strata observed in the New Jersey seismicdata (Steckler et al., 1999).
Steckler et al. (1999) determined that the late Cretaceous to earlyEocene represented a time when sedimentation was low, subsidencewas high, and carbonate precipitation dominated sediment input.This produced parallel, sub-horizontal reflections. Given the interpretedage of units E and D, and their correlation with the stratigraphic archi-tecture offshore New Jersey, the units are inferred to be dominated bycarbonate mud.
70˚40˚
41˚
120
140
220
180
70˚40˚
41˚
100
200
140
140
100
70˚40˚
41˚
40
40
40
4040
4040
40 60
60
B) Unit BA) Unit C
D) Unit A
70.5˚
70.5˚
70.5˚
N N
N
30 km 30 km
30 km40˚
41˚
8080
70˚70.5˚
C) Subunit B2
30 km
N
Nantucket Nantucket
tekcutnaNtekcutnaN
20
20
Fig. 4. Isopach maps of seismic stratigraphic units (A) unit C, (B) unit B, (C) subunit B2,and (D) unit A. Contours are thickness in intervals of 20 m. Bold contours are labeledfor clarity. Arrows show our interpreted direction of sediment outbuilding based onorientation of internal reflection geometry. (C) Black lines mark mapped locations ofunit B clinoform rollovers which are also used to estimate direction of sedimentoutbuilding.
4.1.3. Unit C — Oligocene and Miocene siliciclasticsNo major correlative surface separates unit D from unit C; however,
a change in their seismic stacking patterns exists. Unit C is boundedabove by an unconformity (U1). Unit C reflections have higher ampli-tudes and steeper dip (0.6°) than unit D and form a progradationalpackage (Fig. 3). Unit C does not exist in the north, but forms a south-ward thickening wedge that reaches 400 m in the south (Fig. 4). Weinfer unit C was originally thicker in the south, and extended furtherto the north, but erosion removed much of the sediment (Fig. 6).
The change from aggradation (unit D) to progradation (unit C)likely corresponds to an increase in sediment supply or an increasedfrequency of eustatic rise and fall. In this case, the observed changein stratigraphic architecture correlates with an increase in sedimentsupply during the Oligocene and Miocene observed offshore New Jer-sey, when the siliciclastic sediment input increased 20 fold (Poulsenet al., 1998; Steckler et al., 1999; Monteverde et al., 2008). The ob-served change from aggradation to progradation also correlateswith a global pattern of continental margin stratigraphic architectureduring the Oligocene and Miocene (Bartek et al., 1991). Based on unitC's similarity to the stratigraphic architecture of Oligocene and Mio-cene strata observed offshore New Jersey, we conclude the unit tobe of Oligocene and Miocene age.
4.2. Pleistocene non-glacial units
4.2.1. Unit B — Pleistocene siliciclasticsUnit B is underlain by a regional unconformity (U1) and overlain
by a regional unconformity (U2). We divide the unit into two sub-units: B1 and B2. B1 comprises the majority of the unit, and containsprominent reflections that are considered to be non-glacial siliciclas-tic sediments, as they exhibit a progradational clinoformmorphology.B2 is a mainly transparent layer that overlies the deeper portions ofthe U1 unconformity in the south and is considered glacial in origin,as the sediments build-out landward.
Reflections in subunit B1 form high-amplitude clinoforms (Fig. 3).In the north, reflections are sub-horizontal with shallow channels upto 15 m deep and up to 300 m wide. Clinoforms with components ofaggradation and progradation overlie and downlap onto the transparentlayer in the south. Individual clinoforms within B1 can be correlatedthrough most of the data, which allows us to map clinoform rollovers.Clinoform rollovers have a north-northeast strike, indicating prograda-tion to the east-southeast (Fig. 4). Seaward of the clinoform rollovers, re-flections are sub-horizontal. Metzger et al. (2000) describe a similar,non-glacial, Pleistocene depositional character in seismic data offshoreNew Jersey. They interpreted the seismic architecture to be the resultof high sediment input with deposition responding to sea-level change.Based on these similarities, we suggest unit B1 is Pleistocene.
A Pleistocene age is also consistent with age estimates fromAMCOR and USGS well data, which are used to infer the depth ofthe base of Pleistocene across our seismic data. We map several seis-mic horizons observed in USGS line 12 that correlate with AMCORwells 6012 and 6013 (Fig. 5). AMCOR well 6012 is 80 km west ofour seismic data. AMCOR well 6012 penetrated Pleistocene sedimentsfrom 0 to 290 m below the seafloor (mbsf) and Miocene sediments at~290 mbsf; Pliocene sediments were absent (Hathaway et al., 1979).AMCORwell 6013 is located 60 km east of our seismic lines. It penetrat-ed Pleistocene sediments to 300 mbsf (Hathaway et al., 1979). In USGSline 12, a mapped horizon correlates with the Miocene–Pleistoceneboundary in AMCOR well 6012. This horizon is assumed to representthe base of the Pleistocene in USGS line 12. The base of the Pleistocenehorizon crosses our high-resolution seismic data at a depth of approxi-mately 450 mbsl in the southern extent of our seismic lines (Fig. 5). Thisis approximately 50 m below the base of unit B. We also project themapped base of unit B to well ENW-50 on Martha's Vineyard, approxi-mately 20 km north of line 1 (Fig. 1). The projected base of unit B

100
200
300
400
500
dept
h (m
bsl)
sandsiltclay
Pleistocene
Sea Floor
20 km
0
1I
2I
5I
AMCOR6012
AMCOR6013
Miocene
100
200
300
400
500
dept
h (m
bsl)
20 km
0
1I
2I
5Iwest eastA
B
Fig. 5. (A) Uninterpreted USGS seismic line 12 data and (B) interpreted USGS seismic line 12 with interpreted lithology from AMCOR well data. The deepest mapped horizon isassumed to correlate with the base of AMCOR 2012 that separates Miocene sediments from Pleistocene sediments. Numbers at the top of the profiles mark the location of crossingseismic lines (Fig. 2).
68 J. Siegel et al. / Marine Geology 303–306 (2012) 63–74
approximately coincides with the base of Pleistocene sediments onMartha's Vineyard identified by Hall et al. (1980).
Martha's Vineyard and Nantucket Island well data show that Pleisto-cene sediments are predominantly sand inter-beddedwith thin layers ofsilt (Folger et al., 1978; Hall et al., 1980). Pleistocene sediments inAMCOR well 6013 were sand-dominated, while Pleistocene sedimentsin AMCOR 6012 were silt- and clay-dominated (Fig. 5) (Hathaway, etal., 1979). Based on these regional well data, we interpret unit B is com-posed of layers of sand, silt, and clay of various thickness.
4.2.2. U2 unconformityU2 is a shallow, erosional unconformity that parallels the seafloor.
The unconformity is a high-amplitude reflection that separates unit Breflections below from sub-horizontal, downlapping unit A reflectionsabove.
The shallow depth of U2 suggests it is a young feature. Studies off-shore New Jersey (Duncan et al., 2000; Goff et al., 2005; Nordfjordet al., 2009) identified a shallow sequence boundary that is similar toU2; the sequence boundary formed during the last sea-level fall approx-imately 40 ka–30 ka. Based on the similarity of U2 with the sequenceboundary offshore New Jersey, we conclude U2 is the sequence bound-ary formed during the last sea-level fall, and it separates Pleistocene de-posits below from late Pleistocene to Holocene deposits above.
4.2.3. Unit A — Late Pleistocene and Holocene siliciclasticsUnit A is bounded by a large, regional unconformity (U2) below
and the seafloor above. The sequence contains low-amplitude, sub-horizontal reflections that prograde to the south (Fig. 3). Reflectionsin the north have small channel incisions tens of meters wide andup to 10 m deep. In the north, the sequence is thin with a near-constant thickness of approximately 40 m. In the south, the sequencethickens to 60 m as U2 deepens (Fig. 4).
We conclude that unit A represents deposition during the latePleistocene and Holocene. Studies of shallow sediment structure
offshore New Jersey (Duncan et al., 2000; Goff et al., 2005;Nordfjord et al., 2009) identified a similar late Pleistocene to Holo-cene sequence. Shallow sediment core data offshore Massachusettsshow sediment accumulation rates between 0.625 mm/yr–1.25 mm/yr (Bothner et al., 1981). These sedimentation rates place the baseof unit A (40 mbsf) between 32 ka and 64 ka, which is consistentwith our age estimate of late Pleistocene to Holocene.
Well data show near-surface sediments offshore New Jersey aresandy silt and clayey sand (Metzger et al., 2000). Shallow sedimentsamples offshore Massachusetts document that sediments in the top6 m grade from sand in the northeast to 70% silt and clay in the south-west (Bothner et al., 1981). Based on the regional well data, we inferunit A consists of sandy silt and clayey sand.
4.3. Pleistocene glacial units
4.3.1. U1 unconformityU1 is a regional unconformity that ranges in depth from 50 m to
350 mbsl. It is a high-amplitude reflection that truncates units D and C(Fig. 3). In the south, the unconformity has many incision featuresthat are up to several kilometers wide and tens of meters deep (Fig. 7).
U1 has an overall dip direction to the southeast. However, in itsmost southeastern extent, the unconformity has a dip direction tothe north (Figs. 3 and 6). U1 contains several steep, erosional edges(4°–18°) with relief up to 100 m in the southeast (line 5) and 80 min the west (lines 9 and 14) (Fig. 6A–C). The structure map of U1shows a 50 km-wide trough with steeply eroded edges forming thesoutheastern and western margins of the trough and a gentler reliefforming the northeastern margin (Fig. 6D). The trough representsnearly 100 m of erosion from units C and D (Paleocene through Mio-cene), and potentially unit B (Pleistocene). We interpret U1 as a Pleis-tocene erosional unconformity as it truncates unit C of Miocene age, isoverlain by subunit B2 of Pleistocene age, and is shallower than thebase of Pleistocene identified with AMCOR and USGS well data.

50
350
dept
h (m
bsl)
41.45˚
39.8˚70.85˚ 69.45˚
25 km
N
gradualerosiongradient
SN
5 km 100
m
W E
5 km 100
m
W E
5 km 100
m
D) Structure Map of U1
troughh
ice streamflow direction
g
18°
4°
9°
A) Line 14
B) Line 9
C) Line 5
A
B
C
Fig. 6. (A–C) Seismic data showing the U1 unconformity (black horizon) and the steeply dipping erosional surfaces. The steeply dipping surfaces mark the margin of a paleo-icestream. The black arrows show the location of the steeply dipping erosion surfaces plotted on the adjacent structure map. (D) Structure map of the U1 unconformity. Contoursare depth (mbsl) in intervals of 20 m. The deep trough is assumed to be the remnant of a paleo-ice stream, with ice flowing in a south-southwest direction.
69J. Siegel et al. / Marine Geology 303–306 (2012) 63–74
4.3.2. Subunit B2 — Pleistocene glacigenic sedimentsSubunit B2 overlays U1 in the deeper portions of the unconformity.
It consists of a 25–75 m thick, mainly transparent, seismic reflectionpackage with few discernible internal reflections (Fig. 7). The subunitis the only seismic package that thickens to the south-southwest(Fig. 4). Reflections on individual seismic lines have an apparent dip di-rection to the north; overlying and underlying sediments have an ap-parent dip direction to the south (Fig. 3). Horizon 1, a prominentreflection within subunit B2, is correlated through multiple seismiclines (Fig. 7). This surface has a dip direction to the north-northeastand forms a large, wedge-shaped package that thickens to the south-southwest. Other reflections within subunit B2 are assumed to have asimilar dip direction. This geometry is indicative of landward prograda-tion of subunit B2. The north-northeast dip direction of reflectionswith-in subunit B2, as well as the landward sediment building, suggests adifferent mechanism and sediment source for this subunit when com-pared to overlying and underlying units whose surfaces dip to thesouth and prograde basinward.
5. Interpretation of a late Pleistocene glaciation and ice stream
Based on our observations, we suggest the U1 unconformity re-cords an episode of glacial erosion offshore Massachusetts. U1 hascharacteristics associated with glacial processes including; (1) it is
wide-spread; (2) it contains a broad trough with a width-to-depthratio similar to glacial troughs; (3) it is bounded above by glacigenicsediments (subunit B2); and (4) it contains a network of channelsinterpreted as sub-glacial drainage channels.
5.1. Glacial erosion and a paleo-ice stream
The geomorphic features of U1 suggest a glacial origin. The uncon-formity extends across our seismic study region, nearly to the conti-nental shelf edge. Glacial erosion surfaces on continental shelves areoften recognized by their basin-scale, regionally-distributed erosion(Vorren et al., 1989; Bart and Anderson, 1996), where erosion fromthe ice sheet truncates the underlying sedimentary layers of the con-tinental shelf.
The erosion associated with U1 extends to nearly 400 mbsl, far toodeep for subaerial erosion during a sea-level lowstand. Even if subsi-dence were fast (0.05 mm/yr) during the Pleistocene (Carey et al.,2005), allowing 100 m of subsidence, the unconformity would stillbe at subaqueous depths during a sea-level lowstand. Several edgesof the unconformity dip steeply (4°–18° dip) and exhibit nearly100 m of relief. This is more relief than is typical of many lowstandfluvial valleys on continental shelves, and the width-to-depth ratio(50 km wide–100 m deep) is not consistent with river valleys (100sof m wide–10s of m deep) (Anderson et al., 1996; Goff et al., 2005).

15I
10I
16I
2I
1I
4I
5I
200
300
400
dept
h (m
bsl)
200
300
400
dept
h (m
bsl)
sub-glacialdrainage channels sub-glacial
drainage channels
sub-glacialdrainage channels
steeperosional
edge
glacigenicsediment layer
glacigenicsediment layer
N S
A) Line 15
B) Line 5
U1
U1
’CC
B’B
12.5 km
150
350
dept
h (m
bsl)
EW
C) Structure map of back-stepping surface 1
1
1
40.3˚
40.75˚
69.7˚70.35˚
N
25 km
Fig. 7. (A–B) Seismic lines 15 and 5 (located in Fig. 2) showing the deeper portions of glacial unconformity U1. Large channels are interpreted to indicate sub-glacial drainage networks.We interpret the transparent layer above the unconformity as back-stepping glacigenic sediments. Note that these surfaces have a dip direction that is opposite to the underlying andoverlying sedimentary units. Numbers at the top of the profiles mark the location of crossing seismic lines (Fig. 2). (C) Structure map of horizon 1 within the glacigenic sedimentlayer, contours are in intervals of 5 m. The surface dips to the north-northeast, as indicated by the black arrow.
70 J. Siegel et al. / Marine Geology 303–306 (2012) 63–74
Moreover, there is little evidence of an opposing, steeply eroded,high-relief wall; the steeply eroded sediment edges are only seen inthe southeast (line 5) and west (lines 9 and 14). This lack of symme-try further indicates these are not lowstand fluvial valleys.
The trough identified in the structure map of U1 contains severalgeomorphic features commonly associated with ice streams, andtherefore, we interpret it as the record of a paleo-ice stream. Thewidth of the trough (approximately 50 km) is consistent with thatof an ice stream (Stokes and Clark, 1999). Higher-latitude troughshave been observed with widths ranging from 50 to 150 km (Bartand Anderson, 1996; Wellner et al., 2001). The steep erosionaledges are interpreted to represent the edge of the paleo-ice streamand mark the shear zone that forms between the fast flowing icestream and slow moving ice sheet (Stokes and Clark, 1999). Thisalso explains the asymmetric nature of the trough, as the ice streammay have more strongly eroded the eastern edge of the trough.Ottesen et al. (2005) show that several paleo-ice stream troughs off-shore Norway are asymmetrical, where steep ridges are only ob-served on one side of the trough.
The direction of the paleo-ice stream flow is inferred to be to thesouth-southwest based on the orientation of the trough and the dipof the trough floor (Fig. 5). The ice stream eroded nearly 100 m ofunits C and D. This is a significant amount of erosion, but not uncom-mon for glacial erosion (Hallet et al., 1996; Smith and Anderson,2010), particularly near the ice-sheet margin where glaciers arewet-based and upflow of groundwater can induce low effective-stress conditions (Boulton et al., 2001). Glacial erosion rates arethought to vary between 0.05 and 15 mm/yr depending on tectonicregime (Iverson and Person, 2011). This implies a minimum of
7000 years to erode 100 m of sediments within the trough, well withina typical Pleistocene glacial period (Williams et al., 1988).
The large amount of sediments eroded by the ice stream, and theinterpreted direction of ice stream flow, suggests there should be alarge accumulation of sediments (a trough mouth fan) on the conti-nental slope south of the ice stream trough (Stokes and Clark,1999). Inspection of bathymetry south of the paleo-ice stream troughdoes not reveal the topographic features of such a deposit. The ab-sence of such a deposit, however, does not preclude the presence ofan ice stream (Stokes and Clark, 2001). Given the limitations of our2D seismic survey and its extent, it is reasonable to suggest an icestreamwas responsible for the formation of the trough given the geo-morphic features present.
5.2. Glacigenic sediments
The seismic character, back-stepping sediment fill pattern, north-northeast dip direction, and location of the transparent unit (subunitB2) all suggest a glacial origin for subunit B2. The lack of prominent,mappable surfaces, and the lack of sediment sampling prevents de-tailed analysis of the unit. For simplicity, we refer to the unit as glaci-genic, as it is inferred to have a glacial origin, but the mechanism ofsedimentation is not well constrained.
We suggest glacifluvial backfill as a possible mechanism for subu-nit B2. This process is often observed in glacial tunnel valleys. As anice sheet retreats, channelized sub-glacial meltwater delivers erodedsediments to the ice sheet margin. The sediments then build land-ward as the ice sheet retreats (Kristensen et al., 2008). Glacifluvialbackfill can be recognized in seismic data by back-stepping
71J. Siegel et al. / Marine Geology 303–306 (2012) 63–74
clinoforms and a sometimes transparent or chaotic seismic facies(Huuse and Lykke-Andersen, 2000; Praeg, 2003). The proposed icestream offshore Massachusetts would have retreated to the north-northeast. Backfilling sediments would thus build to the north-northeast; similar to the back-stepping clinoforms observed in subu-nit B2. Glacifluvial backfill explains the north-northeast dip directionand landward sediment building observed in subunit B2 as related tothe retreating ice stream.
N
N
S
S
~5 km 100
ms
~5 km 100
ms
D
E GB
GB
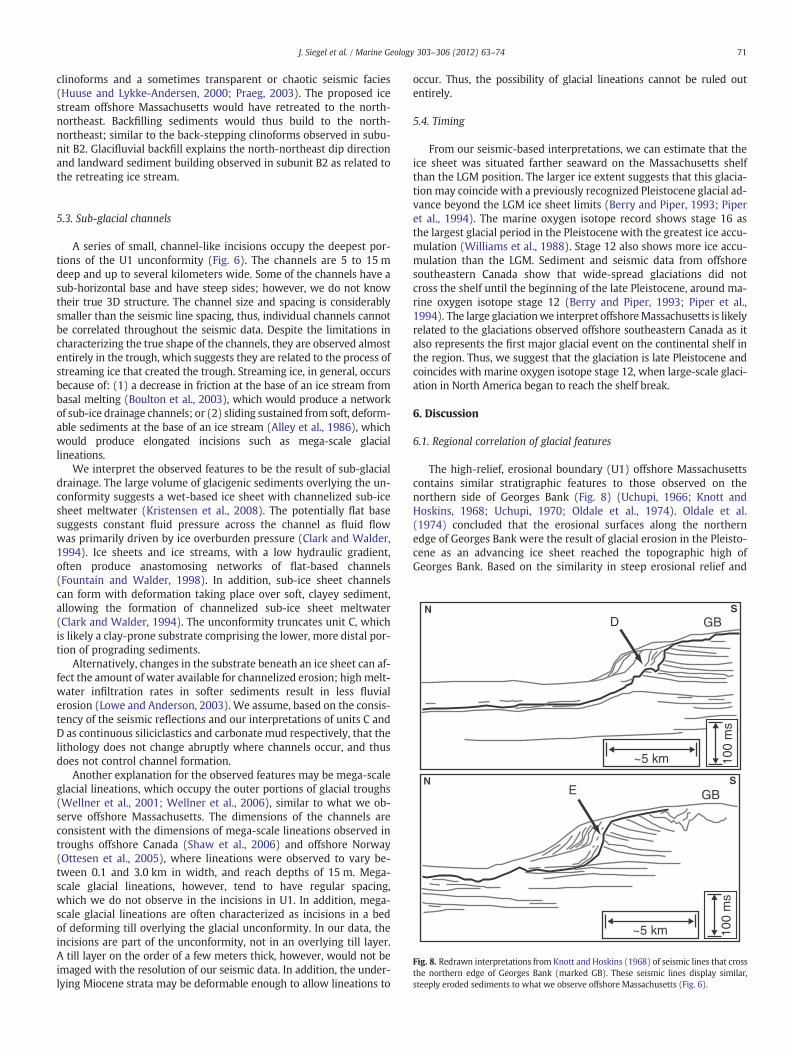
Fig. 8. Redrawn interpretations from Knott and Hoskins (1968) of seismic lines that crossthe northern edge of Georges Bank (marked GB). These seismic lines display similar,steeply eroded sediments to what we observe offshore Massachusetts (Fig. 6).
5.3. Sub-glacial channels
A series of small, channel-like incisions occupy the deepest por-tions of the U1 unconformity (Fig. 6). The channels are 5 to 15 mdeep and up to several kilometers wide. Some of the channels have asub-horizontal base and have steep sides; however, we do not knowtheir true 3D structure. The channel size and spacing is considerablysmaller than the seismic line spacing, thus, individual channels cannotbe correlated throughout the seismic data. Despite the limitations incharacterizing the true shape of the channels, they are observed almostentirely in the trough, which suggests they are related to the process ofstreaming ice that created the trough. Streaming ice, in general, occursbecause of: (1) a decrease in friction at the base of an ice stream frombasal melting (Boulton et al., 2003), which would produce a networkof sub-ice drainage channels; or (2) sliding sustained from soft, deform-able sediments at the base of an ice stream (Alley et al., 1986), whichwould produce elongated incisions such as mega-scale glaciallineations.
We interpret the observed features to be the result of sub-glacialdrainage. The large volume of glacigenic sediments overlying the un-conformity suggests a wet-based ice sheet with channelized sub-icesheet meltwater (Kristensen et al., 2008). The potentially flat basesuggests constant fluid pressure across the channel as fluid flowwas primarily driven by ice overburden pressure (Clark and Walder,1994). Ice sheets and ice streams, with a low hydraulic gradient,often produce anastomosing networks of flat-based channels(Fountain and Walder, 1998). In addition, sub-ice sheet channelscan form with deformation taking place over soft, clayey sediment,allowing the formation of channelized sub-ice sheet meltwater(Clark and Walder, 1994). The unconformity truncates unit C, whichis likely a clay-prone substrate comprising the lower, more distal por-tion of prograding sediments.
Alternatively, changes in the substrate beneath an ice sheet can af-fect the amount of water available for channelized erosion; high melt-water infiltration rates in softer sediments result in less fluvialerosion (Lowe and Anderson, 2003). We assume, based on the consis-tency of the seismic reflections and our interpretations of units C andD as continuous siliciclastics and carbonate mud respectively, that thelithology does not change abruptly where channels occur, and thusdoes not control channel formation.
Another explanation for the observed features may be mega-scaleglacial lineations, which occupy the outer portions of glacial troughs(Wellner et al., 2001; Wellner et al., 2006), similar to what we ob-serve offshore Massachusetts. The dimensions of the channels areconsistent with the dimensions of mega-scale lineations observed introughs offshore Canada (Shaw et al., 2006) and offshore Norway(Ottesen et al., 2005), where lineations were observed to vary be-tween 0.1 and 3.0 km in width, and reach depths of 15 m. Mega-scale glacial lineations, however, tend to have regular spacing,which we do not observe in the incisions in U1. In addition, mega-scale glacial lineations are often characterized as incisions in a bedof deforming till overlying the glacial unconformity. In our data, theincisions are part of the unconformity, not in an overlying till layer.A till layer on the order of a few meters thick, however, would not beimaged with the resolution of our seismic data. In addition, the under-lying Miocene strata may be deformable enough to allow lineations to
occur. Thus, the possibility of glacial lineations cannot be ruled outentirely.
5.4. Timing
From our seismic-based interpretations, we can estimate that theice sheet was situated farther seaward on the Massachusetts shelfthan the LGM position. The larger ice extent suggests that this glacia-tion may coincide with a previously recognized Pleistocene glacial ad-vance beyond the LGM ice sheet limits (Berry and Piper, 1993; Piperet al., 1994). The marine oxygen isotope record shows stage 16 asthe largest glacial period in the Pleistocene with the greatest ice accu-mulation (Williams et al., 1988). Stage 12 also shows more ice accu-mulation than the LGM. Sediment and seismic data from offshoresoutheastern Canada show that wide-spread glaciations did notcross the shelf until the beginning of the late Pleistocene, around ma-rine oxygen isotope stage 12 (Berry and Piper, 1993; Piper et al.,1994). The large glaciationwe interpret offshoreMassachusetts is likelyrelated to the glaciations observed offshore southeastern Canada as italso represents the first major glacial event on the continental shelf inthe region. Thus, we suggest that the glaciation is late Pleistocene andcoincides with marine oxygen isotope stage 12, when large-scale glaci-ation in North America began to reach the shelf break.
6. Discussion
6.1. Regional correlation of glacial features
The high-relief, erosional boundary (U1) offshore Massachusettscontains similar stratigraphic features to those observed on thenorthern side of Georges Bank (Fig. 8) (Uchupi, 1966; Knott andHoskins, 1968; Uchupi, 1970; Oldale et al., 1974). Oldale et al.(1974) concluded that the erosional surfaces along the northernedge of Georges Bank were the result of glacial erosion in the Pleisto-cene as an advancing ice sheet reached the topographic high ofGeorges Bank. Based on the similarity in steep erosional relief and

72 J. Siegel et al. / Marine Geology 303–306 (2012) 63–74
subsurface depth, we assume the same ice sheet created the featureson Georges Bank and offshore Massachusetts.
The large troughwe observe in U1 is similar in size, scale, and orien-tation to basins that surroundGeorges Bank. Core data showPleistocenesediments greater than 80 m thick fill basins on the northern edge ofGeorges Bank (Fig. 9) (Schlee and Pratt, 1970; Uchupi, 1970). Seismicdata image a large unconformity, interpreted as a glacial erosion surfaceat the base of Pleistocene sediments in the Franklin Basin, just north ofGeorges Bank (Fig. 1) (Oldale et al., 1974). Uchupi (1970) suggestedthat Georges Bank acted as a barrier to ice sheet flow, and redirectedice movement to the south. As the ice flowed to the south, it erodedand over-deepened the basins around Georges Bank. Ice streams tendto form in basins because of increased basal melting from the greaterice overburden (Boulton et al., 2003). The deep basins of GeorgesBank may have facilitated the development of an ice stream that wasconsequently diverted to the south-southwest by the topographichigh of Georges Bank. We suggest that as the ice stream advancedsouth-southwest past Georges Bank, it continued to advance to the
100
300
500
72˚ 71˚ 70˚
100
structure ofU1 unconformity
100 km
C
B
A
Ninferreglacia
40˚
41˚
42˚
43˚
300
?
Fig. 9. Reconstruction of the late Pleistocene glaciation from our seismic interpretations andU1 unconformity, same as (Fig. 6D), is shown. Gray circles (labeled A–E) mark the locationlines with arrows show the inferred direction of ice movement, and the black lines mark thesimilar direction to the Wisconsin ice sheet and was redirected to the south-southwest wheto advance to the south-southwest and carved the deep trough and steeply eroded sedimenedge beyond the ice stream margins.
south-southwest and eroded shelf sediments offshore Massachusetts(Fig. 9). The ice advance, and subsequent erosion, created the troughobserved in the offshore Massachusetts seismic data (Figs. 6 and 9).
From the distribution of glacial geomorphic features, including thesteeply eroded edges and the orientation of the glacial trough (Fig. 6),a regional picture of the late Pleistocene glaciation in our study regionemerges (Fig. 9). We assume a similar initial direction of ice advancefor the late Pleistocene glaciation as the Laurentide Ice Sheet duringthe LGM, which advanced to the south-southeast across the Gulf ofMaine (Fig. 1) (Schlee and Pratt, 1970; Stokes and Clark, 2001; Dykeet al., 2002). During the LGM, the topography of the Gulf of Mainechanneled ice towards the southeast; however, the ice was redirectedto the east, over-deepening the Southeast Channel and forming an icestream that ran along the northern edge of Georges Bank (Fig. 1)(Shaw et al., 2006). During the late Pleistocene glaciation, we inferthat a greater volume of ice flowed through the Gulf of Maine andforced an additional ice stream to develop near the western edge ofGeorges Bank, which then directed ice movement to the south.
100
100
100
300
0
500
69˚ 68˚ 67˚
100
100
10000
3000
deep Pleistocene sediment basins D
E
Georges Bank
d continuous edge of lly eroded sediments
inferredice stream
ice sheetice flow linespossible ice sheet edge
?
0
from previous observations on northern Georges Bank (Fig. 8). The morphology of theof steeply dipping erosional surfaces observed in seismic data (Figs. 6 and 8). The grayinferred continuous edge of the ice stream. We assume the ice originally advanced in an it encountered Georges Bank. The redirected ice formed an ice stream that continuedts observed offshore Massachusetts. The dashed black line marks the possible ice sheet

73J. Siegel et al. / Marine Geology 303–306 (2012) 63–74
Assuming the ice stream reached its maximum extent during a sea-level lowstand (sea-level 100 m below present), the ice stream wasgrounded in 250 m of water. This water depth implies a minimumice thickness of 275 m for the ice to remain grounded, assuming icedensity is 90% of sea-water density.
There is no definitive evidence of the maximum extent of the latePleistocene ice sheet in our study region; however, based on the loca-tion of the ice stream, it is reasonable to assume a southern extensionof the ice sheet to near the shelf break just beyond the extent of our seis-mic data, more than 125 km offshoreMassachusetts (Fig. 9). Shaw et al.(2006) showed that the Wisconsin ice sheet that streamed around thenorthern edge of Georges Bank was also the ice margin. It is possiblethat the ice stream we propose was also the ice sheet margin alongthe western edge of Georges Bank. Though, as the ice traveled farthersouth to offshore Massachusetts, the ice sheet may have continued towiden and erode the shelf sediments (Fig. 9). This is indicated by thecontinuation of the glacial erosion beyond the edge of the ice stream,as the glacial erosion surface (U1) extends further to the south(Fig. 6C) and to the west (Fig. 6A) beyond the steeply eroded edges.
The regional picture of the late Pleistocene ice sheet is consistentwith marine-based studies of Pleistocene ice sheets offshore south-eastern Canada (Berry and Piper, 1993; Piper et al., 1994). Evidencefrom land also shows late Pleistocene ice sheets achieving a greaterice extent than the LGM (Stanford, 1993; Bierman et al., 1999;Ridge, 2004; Balco and Rovey, 2010). Pre-Illinoian ice sheets are inter-preted to have advanced 40 km farther than the Laurentide Ice Sheet inNew Jersey (Stanford, 1993; Ridge, 2004). Balco and Rovey (2010)dated till sequences in Missouri, USA, that recorded several Pleistoceneadvances of the Laurentide Ice Sheet; they show that major advances ofthe Laurentide Ice Sheet were more common after the mid-Pleistocenetransition to longer periods of ice accumulation. Our regional inter-pretation of a late Pleistocene ice sheet advance beyond thelimits of the LGM is consistent with marine- and shore-basedstudies of the Laurentide Ice Sheet. Our observations provide fur-ther geophysical evidence for the extent of a late Pleistocene icesheets offshore Massachusetts and the location of a paleo-icestream.
6.2. Implications for shelf pore water salinity
Pleistocene ice sheets have a strong control on the emplacementof subsurface freshwater onshore and offshore (Person et al., 2007;Bense and Person, 2008; Cohen et al., 2010). Geochemical analysisfrom USGS and AMCOR wells offshore Massachusetts show freshwa-ter at depths that are greater than expected for equilibrium with pre-sent sea-level (Folger et al., 1978; Hathaway et al., 1979). Theobserved freshwater cannot be explained by modern topographyand sea-level conditions, and likely was emplaced by sub-glacial re-charge from the Laurentide Ice Sheet (Person et al., 2003;Marksamer et al., 2007). Several numerical modeling studies haveattempted to predict the amount of freshwater emplaced offshorebased on Pleistocene climate cycles; however, these studies only im-posed the LGM for their glacial boundary condition (Person et al.,2003; Marksamer et al., 2007), and under-estimated the extent of atleast one late Pleistocene glaciation interpreted from our data. Sub-surface freshwater emplacement from ice sheets into permeableunits within sedimentary basins and continental shelves can extend50–100 km beyond the ice sheet margin (Marksamer et al., 2007;Bense and Person, 2008; McIntosh et al., 2011) and to depths ofover 1 km (Lemieux et al., 2008). Thus, the regional extent and poten-tial timing of a late Pleistocene ice sheet offshore Massachusetts en-hances our ability to predict the emplacement of sub-surfacefreshwater offshore. Using an increased ice extent for Pleistocene gla-ciations from this study in a 2D numerical model doubled the amountof freshwater predicted offshore Massachusetts (DeFoor, 2011).
7. Conclusions
Weused high-resolution, multi-channel seismic data to characterize alate Pleistocene glaciation that extended 125 km offshore Massachusetts.The agewas estimated based on correlationswith AMCOR and USGSwelldata offshore Massachusetts and adjacent seismic data offshore New Jer-sey.We suggest that the event may be related to oxygen isotope stage 12when the first extensive Pleistocene glaciation was shown to cross thecontinental shelf offshore southeastern Canada.
The late Pleistocene glaciation is characterized by a regionally dis-tributed erosion surface, and contains a 50 km wide trough withsteep erosional edges. The trough is interpreted as the record of apaleo-ice stream. The base of the ice stream trough contains manysmall, incised features interpreted to be a network of sub-glacialdrainage channels. Meltwater delivered sediments to the retreatingice stream margin, which produced glacigenic backfill sedimentsthat overlay the unconformity.
The glacial geomorphic features we observe are similar to featuresobserved on the northern side of Georges Bank.We assume the featureson Georges Bank and offshoreMassachusetts are contemporaneous anddefine the regional distribution of a late Pleistocene ice sheet. The basinsof Georges Bank facilitated the development of an ice stream withGeorges Bank acting as a barrier to ice flow and redirecting ice move-ment to the south-southwest. The ice stream over-deepened basinsaroundGeorges Bank and eroded the glacial troughwe observe offshoreMassachusetts.
Our observations have important implications for understandingPleistocene glacial cycles on the Atlantic continental shelf. The latePleistocene ice stream was previously unknown and can be used toconstrain models of Pleistocene ice sheet accumulation and icesheet mass flux. In addition, the greater extent of the late Pleistoceneice sheet offshore Massachusetts as compared to the LGM, suggest apotentially greater volume of emplaced sub-glacial meltwater in theshallow shelf sediments than previously predicted.
Acknowledgments
This work was funded by NSF-OCE-0824368. Seismic data werecollected on the R/V Endeavor (cruise EN465) using Scripps Institutionof Oceanography's portable seismic system. We thank the Scrippstechnicians and the crew of the R/V Endeavor for their assistance incollecting the data. D. Praeg, D. J. W. Piper, and an anonymous reviewerprovided insightful comments that improved this manuscript. We alsothank J. Anderson for helpful discussions.
References
Alam, M., Piper, D.J.W., 1977. Pre-Wisconsin stratigraphy and paleoclimates off AtlanticCanada, and its bearing on glaciation in Quebec. Géographie Physique et Quaternaire31, 15–22.
Amos, C.L., Miller, A.A.L., 1990. The Quaternary stratigraphy of southwest Sable IslandBank, eastern Canada. Geological Society of America Bulletin 102 (7), 915–934.
Alley, R.B., Blankenship, D.D., Bentley, C.R., Rooney, S.T., 1986. Deformation of till beneathice stream B, West Antarctica. Nature 322, 57–59.
Anderson, J.B., Abdulah, K., Sarzalejo, S., Siringan, F., Thomas, M.A., 1996. Late Quaternarysedimentation and high-resolution sequence stratigraphy of the east Texas shelf.Geological Society of London Special Publication 117, 95–124.
Anderson, J.B., Shipp, S.S., Lowe, A.L., Wellner, J.S., Mosola, A.B., 2002. The Antarctic IceSheet during the Last Glacial Maximum and its subsequent retreat history: a review.Quaternary Science Reviews 21, 49–70.
Balco, G., Rovey II, C.W., 2010. Absolute chronology for major Pleistocene advances ofthe Laurentide Ice Sheet. Geology 38 (9), 795–798.
Bart, P.J., Anderson, J.B., 1996. Seismic expression of depositional sequences associatedwith expansion and contraction of ice sheets on northwestern Antarctic Peninsulacontinental shelf. Geological Society of London Special Publication 117, 171–186.
Bartek, L.R., Vail, P.R., Anderson, J.B., Emmet, P.A., Wu, S., 1991. Effects of Cenozoic icesheet fluctuations in Antarctica on the stratigraphic signature of the Neogene. Journalof Geophysical Research 96 (B4), 6758–6778.
Bense, V.F., Person, M.A., 2008. Transient hydrodynamics within intercratonic sedimentarybasins during glacial cycles. Journal of Geophysical Research 113, 1–17.
Berry, J.A., Piper, D.J.W., 1993. Seismic stratigraphy of the central Scotian Rise: a recordof continental margin glaciation. Geo-Marine Letters 13, 197–206.

74 J. Siegel et al. / Marine Geology 303–306 (2012) 63–74
Bierman, P.R., Marsella, K.A., Patterson, C., Davis, P.T., Caffee, M., 1999. Mid-Pleistocenecosmogenic minimum-age limits for pre-Wisconsinan glacial surfaces in southwesternMinnesota and southern Baffin Island: a multiple nuclide approach. Geomorphology27, 25–39.
Bothner, M.H., Spiker, E.C., Johnson, P.P., Rendigs, R.R., 1981. Geochemical evidence formodern sediment accumulation on the continental shelf off southern New England.Journal of Sedimentary Petrology 51 (1), 281–292.
Boulton, G.S., Dongelmans, P., Punkari, M., Broadgate, M., 2001. Palaeoglaciology of anice sheet through a glacial cycle: the European ice sheet through the Weichselian.Quaternary Science Reviews 20, 591–625.
Boulton, G., Hagdorn, M., Hulton, N.R.J., 2003. Streaming flow in an ice sheet through aglacial cycle. Annals of Glaciology 117–128.
Boulton, G., Hagdorn, M., 2006. Glaciology of the British Isles Ice Sheet during the lastglacial cycle: form, flow, streams and lobes. Quaternary Science Reviews 25,3359–3390.
Carey, J.S., Sheridan, R.E., Ashley, G.M., Uptegrove, J., 2005. Glacially-influenced latePleistocene stratigraphy of a passivemargin: New Jersey record of the North Americanice sheet. Marine Geology 218, 155–173.
Clark, P.U., Walder, J.S., 1994. Subglacial drainage, eskers, and deforming beds beneaththe Laurentide and Eurasian ice sheets. GSA Bulletin 106, 304–314.
Cohen, D., Person, M., Wang, P., Gable, C.W., Hutchinson, D., Marksamer, A., Dugan, B.,Kooi, H., Groen, K., Lizarralde, D., Evans, R.L., Day-Lewis, F.D., Lane Jr., J.W., 2010.Origin and extent of fresh paleowaters on the Atlantic Continental Shelf, USA.Ground Water 48 (1), 143–158.
Defoor, W., 2011, Paleo-hydrogeologic Models of Freshwater Emplacement on the AtlanticContinental Shelf: OffshoreMartha's Vineyard Island, M.S. thesis, NewMexico Instituteof Mining and Technology.
Denton, G.H., Hughes, T.J., 2002. Reconstructing the Antarctic Ice Sheet at the Last GlacialMaximum. Quaternary Science Reviews 21, 193–202.
Duncan, C.S., Goff, J.A., Austin Jr., J.A., Fulthorpe, C.S., 2000. Tracking the last sea-levelcycle: seafloor morphology and shallow stratigraphy of the latest QuaternaryNew Jersey middle continental shelf. Marine Geology 170, 395–421.
Dyke, A.S., Andrews, J.T., Clark, P.U., England, J.H., Miller, G.H., Shaw, J., Veillette, J.J.,2002. The Laurentide and Innuitian ice sheets during the Last Glacial Maximum.Quaternary Science Reviews 21, 9–31.
Dyke, A.S., Prest, V.K., 1987. Late Wisconsinan and Holocene history of the LaurentideIce Sheet. Géographie physique et Quaternaire 41, 237–263.
Folger, D.W., Hathaway, J.C., Christopher, R.A., Valentine, P.C., Poag, C.W., 1978. Stratigraphictest well, Nantucket Island, Massachusetts. US Geological Survey Circular, 773.
Fountain, A.G., Walder, J.S., 1998. Water flow through temperate glaciers. Reviews ofGeophysics 36 (3), 299–328.
Goff, J.A., Austin Jr., J.A., Gulick, S., Nordfjord, S., Christensen, B., Sommerfield, C., Olson,H., Alexander, C., 2005. Recent and modern marine erosion on the New Jerseyouter shelf. Marine Geology 216, 275–296.
Giosan, L., Flood, R.D., Grützner, J., Mudie, P., 2002. Paleoceanographic significance of sedi-ment color onwesternNorth Atlantic Drifts: II. Late Pliocene–Pleistocene sedimentation.Marine Geology 189, 43–61.
Hall, R.E., Poppe, L.J., Ferrebee, W.M., 1980. A stratigraphic test well, Martha's Vineyard,Massachusetts. Geological Survey Bulletin, 1488.
Hallet, B., Hunter, L., Bogen, J., 1996. Rates of erosion and sediment evacuation by glaciers: areview of field data and their implications. Global and Planetary Change 12, 213–235.
Hathaway, J.C., Poag, C.W., Valentine, P.C., Miller, R.E., Schultz, D.M., Manheim, F.T.,Kohout, F.A., Bothner, M.H., Sangrey, D.A., 1979. U.S. Geologic Survey core drillingon the Atlantic Shelf. Science 206 (4418), 515–527.
Huppertz, T.J., Piper, D.J.W., 2009. The influence of shelf-crossing glaciation on continentalslope sedimentation, Flemish Pass, eastern Canadian continental margin. MarineGeology 265, 67–85.
Hutchinson, D.R., Klitgord, K.D., Detrick, R.S., 1986. Rift basins of the Long Island platform.GSA Bulletin 97, 688–702.
Huuse, M., Lykke-Andersen, H., 2000. Overdeepened Quaternary valleys in the easternDanish North Sea: morphology and origin. Quaternary Science Reviews 19,1233–1253.
Iverson, N., Person, M., 2011. Glacier-bed geomorphic processes and hydrological con-ditions relevant to nuclear waste disposal. Geofluids. doi:10.1111/j1468-8123.2011.00355x.
Knott, S.T., Hoskins, H., 1968. Evidence of Pleistocene events in the structure of thecontinental shelf off the northeastern United States. Marine Geology 6, 5–43.
Kristensen, T.B., Piotrowski, J.A., Huuse, M., Clausen, O.R., Hamberg, L., 2008. Time-transgressive tunnel valley formation indicated by infill sediment structure,North Sea — the role of glaciohydraulic supercooling. Earth Surface Processes andLandforms 33, 546–559.
Lemieux, J.-M., Sudicky, E.A., Peltier, W.R., Tarasov, L., 2008. Simulating the impact ofglaciations on continental groundwater flow systems: 2. Model application to theWisconsinian glaciation over the Canadian landscape. Journal of GeophysicalResearch 113, 1–13.
Lowe, A.L., Anderson, J.B., 2003. Evidence for abundant subglacial meltwater beneath thepaleo-ice sheet in Pine IslandBay, Antarctica. Journal of Glaciology 49 (164), 125–138.
Marksamer, A.J., Person, M., Day-Lewis, F., Lane, J.W., Cohen, D., Dugan, B., Kooi, H.,Willett, M., 2007. Integrating geophysical, hydrochemical, and hydrologic data tounderstand the freshwater resources on Nantucket Island, Massachusetts. SubsurfaceHydrology Data Integration in Subsurface Hydrology, pp. 1–54.
Marshall, S.J., James, T.S., Clark, G.K.C., 2002. North American Ice Sheet reconstructionsat the Last Glacial Maximum. Quaternary Science Reviews 21, 175–192.
Metzger, J.M., Flemings, P.B., Christie-Blick, N., Mountain, G.S., Austin Jr., J.A., Hesselbo,S.P., 2000. Late Miocene to Pleistocene sequences at the New Jersey outer continentalshelf (ODP leg 174A, sites 1071 and 1072). Sedimentary Geology 134, 149–180.
McIntosh, J.C., Graven, G., Hanor, J.S., 2011. Impacts of Pleistocene glaciation on large-scalegroundwater flow and salinity in the Michigan Basin. Geofluids 11, 18–33.
McMaster, R.L., Ashraf, A., 1973a. Drowned and buried valleys on the southern New Englandcontinental shelf. Marine Geology 15, 249–268.
McMaster, R.L., Ashraf, A., 1973b. Extent and formation of deeply buried channels onthe continental shelf off southern New England. Journal of Geology 81, 374–379.
Monteverde, D.H., Mountain, G.S., Miller, K.G., 2008. Early Miocene sequence developmentacross the New Jersey margin. Basin Research 20, 249–267.
Nordfjord, S., Goff, J.A., Austin Jr., J.A., Duncan, L.S., 2009. Shallow stratigraphic andcomplex transgressive ravinement on the New Jersey middle and outer continentalshelf. Marine Geology 266, 232–243.
Oldale, R.N., O'Hara, C.J., 1984. Glaciotectonic origin of the Massachusetts coastal endmoraines and a fluctuating late Wisconsinan ice margin. GSA Bulletin 95, 61–74.
Oldale, R.N., Hathaway, J.C., Dillon, W.P., Hendricks, J.D., Robb, J.M., 1974. Geophysicalobservations on northern part of Georges Bank and adjacent basins of Gulf ofMaine. AAPG Bulletin 58 (12), 2411–2427.
Ottesen, D., Dowdeswell, J.A., Rise, L., 2005. Submarine landforms and the reconstructionof fast-flowing ice streams within a large Quaternary ice sheet: The 2500-km-longNorwegian–Svalbard margin (57°–80°N). GSA Bulletin 117 (7/8), 1033–1050.
Person, M., Dugan, B., Swenson, J., Urbano, L., Stott, C., Taylor, J., Willett, M., 2003. Pleistocenehydrogeology of the Atlantic continental shelf, New England. Geological Society ofAmerica Bulletin 115, 1324–1343.
Person, M., McIntosh, J., Bense, V., Remenda, V.H., 2007. Pleistocene hydrology of NorthAmerica: the role of ice sheets in reorganizing groundwater flow systems. Reviewsof Geophysics 45, 1–28.
Piper, D.J.W., 1988. Glaciomarine sedimentation on the continental slope off easternCanada. Geoscience Canada 15 (1), 23–28.
Piper, D.J.W., Mudie, P.J., Aksu, A.E., Skene, K.I., 1994. A 1 Ma record of sediment fluxsouth of the Grand Banks used to infer the development of glaciation in southeasternCanada. Quaternary Science Reviews 13, 23–37.
Piper, D.J.W., Normark, W.R., 1989. Late Cenozoic sea-level changes and the onset ofglaciation: impact on continental slope progradation off eastern Canada. Marineand Petroleum Geology 6, 336–347.
Poulsen, C.J., Flemings, P.B., Robinson, R.A.J., Metzger, J.M., 1998. Three-dimensional strat-igraphic evolution of the Miocene Baltimore Canyon region: implications for eustaticinterpretations and the systems tract model. GSA Bulletin 110 (9), 1105–1122.
Poag, C.W., 1978. Stratigraphy of the Atlantic continental shelf and slope of the UnitedStates. Annual Review of Earth and Planetary Science 6, 251–280.
Praeg, D., 2003. Seismic imaging of mid-Pleistocene tunnel-valleys in the North Sea Basin— high resolution from low frequencies. Journal of Applied Geophysics 53, 273–298.
Pratt, R.M., Schlee, J., 1969. Glaciation on the continental margin of New England. GSABulletin 80, 2335–2342.
Ridge, J.C., 2004. The Quaternary glaciation of western England with correlations tosurrounding areas. Developments in Quaternary Science 2 (2), 169–199.
Shaw, J., Piper, D.J.W., Fader, G.B.J., King, E.L., Todd, B.J., Bell, T., Batterson, M.J.,Liverman, D.G.E., 2006. A conceptual model of the deglaciation of Atlantic Canada.Quaternary Science Reviews 25, 2059–2081.
Schlee, J., Behrendt, J.C., Grow, J.A., Robb, J.M., Mattick, R.E., Taylor, P.T., Lawson, B.J.,1976. Regional geologic framework off northeastern United States. AAPG Bulletin60 (6), 926–951.
Schlee, J., Pratt, R.M., 1970. Atlantic continental shelf and slope of the United States— gravelsof the northeastern part. U.S. Geological Survey Professional Paper 529-H. . 39 pp.
Smith, R.T., Anderson, J.B., 2010. Ice-sheet evolution in James Ross Basin, Weddell Seamargin of the Antarctic Peninsula: the seismic stratigraphic record. GSA Bulletin122 (5/6), 830–842.
Stanford, S.D., 1993. Late Cenozoic surficial deposits and valley evolution of unglaciatednorthern New Jersey. Geomorphology 7, 267–288.
Steckler, M.S., Mountain, G.S., Miller, K.G., Christie-Blick, N., 1999. Reconstruction ofTertiary progradation and clinoform development on the New Jersey passive marginby 2-D backstripping. Marine Geology 154, 399–420.
Stokes, C., Clark, C.D., 1999. Geomorphic criteria for identifying Pleistocene ice streams.Annals of Glaciology 28, 67–74.
Stokes, C.R., Clark, C.D., 2001. Palaeo-ice streams. Quaternary Science Reviews 20,1437–1457.
Tucholke, B.E., Hollister, C.D., 1973. Late Wisconsin glaciation of the southwestern Gulf ofMaine: new evidence from the marine environment. GSA Bulletin 84, 3279–3296.
Uchupi, E., 1966. Structural framework of the Gulf of Maine. Journal of Geophysical Research71 (12), 3013–3028.
Uchupi, E., 1970. Atlantic continental shelf and slope of the United States — shallowstructure. U.S. Geologic Survey Professional Paper 529-I, pp. I1–I44.
Uchupi, E., Mulligan, A.E., 2006. Late Pleistocene stratigraphy of Upper Cape Cod andNantucket Sounds, Massachusetts. Marine Geology 227, 93–118.
Uchupi, E., Driscolla, N., Ballardb, R.D., Bolmer, S.T., 2001. Drainage of late Wisconsin glaciallakes and themorphology and late quaternary stratigraphy of theNew Jersey–southernNew England continental shelf and slope. Marine Geology 172, 117–145.
Vorren, T.O., Lebesbye, E., Andreassen, K., Larsen, K.B., 1989. Glacigenic sediments on a pas-sive continentalmargin as exemplified by the Barents Sea.MarineGeology 85, 251–272.
Wellner, J.S., Lowe, A.L., Shipp, S.S., Anderson, J.B., 2001. Distribution of glacial geomorphicfeatures on the Antarctic continental shelf and correlation with substrate: implicationfor ice behavior. Journal of Glaciology 47 (158), 397–411.
Wellner, J.S., Heroy, D.C., Anderson, J.B., 2006. The death mask of the Antarctic ice sheet:comparison of glacial geomorphic features across the continental shelf. Geomorphology75, 157–171.
Williams, D.F., Thunell, R.C., Tappa, E., Rio, D., Raffi, I., 1988. Chronology of the Pleistoceneoxygen isotope record: 0–1.88 m.y. B.P. Palaeogeography, Palaeoclimatology,Palaeoecology 64, 221–240.