Embed Size (px)
Citation preview

Retrospective Theses and Dissertations Iowa State University Capstones, Theses andDissertations
1981
Geomorphology, stratigraphy, and soildevelopment in the Iowa and Cedar River valleys insoutheastern IowaThomas James BickiIowa State University
Follow this and additional works at: https://lib.dr.iastate.edu/rtd
Part of the Agricultural Science Commons, Agriculture Commons, and the Agronomy and CropSciences Commons
This Dissertation is brought to you for free and open access by the Iowa State University Capstones, Theses and Dissertations at Iowa State UniversityDigital Repository. It has been accepted for inclusion in Retrospective Theses and Dissertations by an authorized administrator of Iowa State UniversityDigital Repository. For more information, please contact [email protected].
Recommended CitationBicki, Thomas James, "Geomorphology, stratigraphy, and soil development in the Iowa and Cedar River valleys in southeastern Iowa "(1981). Retrospective Theses and Dissertations. 6872.https://lib.dr.iastate.edu/rtd/6872

8123117
BICKI, THOMAS JAMES
GEOMORPHOLOGY, STRATIGRAPHY, AND SOIL DEVELOPMENT IN THE IOWA AND CEDAR RIVER VALLEYS IN SOUTHEASTERN IOWA
Iowa State University PH.D. 1981
University Microfilms
internstionsl 300 N. Zeeb Road. Ann Arbor, MI 48106

PLEASE NOTE:
In all cases this material has been filmed in the best possible way from the available copy. Problems encountered with this document have been identified here with a check mark V •
1. Glossy photographs or pages
2. Colored illustrations, paper or print
3. Photographs with dark background
4. Illustrations are poor copy
5. Pages with black marks, not original copy
6. Print shows through as there is text on both sides of page
7. Indistinct, broken or small print on several pages
8. Print exceeds margin requirements
9. Tightly bound copy with print lost in spine
10. Computer printout pages with indistinct print
11. Page(s) lacking when material received, and not available from school or author.
12. Page(s) seem to be missing in numbering only as text follows.
13. Two pages numbered . Text follows.
14. Curling and wrinkled pages
15. Other
University Microfilms
International

Geomorphology, stratigraphy, and soil development in the
Iowa and Cedar River valleys in southeastern Iowa
by
Thomas James Bicki
A Dissertation Submitted to the
Graduate Faculty in Partial Fulfillment of the
Requirements for the Degree of
DOCTOR OF PHILOSOPHY
Department : Agronomy Major I Soil Morphology and Genesis
Approved »
In Chc^ge of Major Work
Fe the Major Department
For the Graduate College
Iowa State University Ames, Iowa
1981
Signature was redacted for privacy.
Signature was redacted for privacy.
Signature was redacted for privacy.

ii
TABLE OF CONTENTS
Page
INTRODUCTION 1
BACKGROUND 3
Geomorphology and Stratigraphy of the Lake Calvin Region 3
Pedological Background of the Lake Calvin Region 12
METHODS AND PROCEDURES 17
Field Methods 17
Sample collection 17 Terminology 17
Laboratory Procedures 18
Soil profile and weathering zone descriptions 18 Particle size analysis 19 Soil pH 19 Total cartoon 19 Available phosphorus 19 Total phosphorus 20 Matrix calcite and dolomite 20 Sand fractionation 20 Semiquantitative analysis of clay mineralogy 20
RESULTS AND DISCUSSION 23
Geomorphic and Stratigraphie Investigations of the Lake Calvin Region 23
Riverside transect 23 Hills transect 33 Gladwyn transect 41 Lone Tree transect 50 West Liberty I transect 55 West Liberty II transect 66 West Liberty IV transect 72 Iowa City East transect 78 Nichols and Conesville transects 82 Low, intermediate, and Iowa-Cedar terraces 93 Columbus Junction transect 95

iii
Page
Pédologie Investigations in the Lake Calvin Region 112
West Liberty III transect 114 Soil groups 114 Characteristics of group No. I Tama soils 115 Characteristics of group No. I Clinton soils 125 Characteristics of group No. II Tama soils 134 Characteristics of group No. II
Clinton and Inton soils 143 Characteristics of group No. II soils
with restricted drainage 152 Characteristics of group No. Ill Tama soils 167 Characteristics of a group No. Ill
Clinton soil 175 Tama soils from east-central Iowa 178 Comparison of group No. I» II, and III
Tama soils and representative Tama soils from east-central Iowa 179
Comparison of group No. I. ÏI, and III Clinton soils and group No. II Inton soils 197
Soils with restricted drainage from east-central Iowa 205
Comparison of group No. II and RECI soils with restricted drainage 206
SUMMARY AND CONCLUSIONS 226
Geomorphic and Stratigraphie Investigations in the Lake Calvin Region 226
Pédologie Investigations in the Lake Calvin Region 228
Morphological characteristics 228 Clay 229 pH 229 Available phosphorus 229 Total phosphorus 230
LITERATURE CITED 232
ACKNOWLEDGMENTS 239
APPENDIX A. PROFILE DESCRIPTIONS 240
APPENDIX B. LABORATORY DATA 307

iv
Table 1.
Table 2.
Table 3.
Table 4.
Table 5,
Table 6.
Table 7.
Table 8.
Table 9.
Table 10.
Table 11.
Table 12.
LIST OF TABLES
Page
Soil series of the Tama-Muscatine and Otley-Ladoga soil association areas arrayed by biosequence and natural drainage class 14
Distribution of sand size fractions and gravel for selected depths from cores of the Riverside transect 28
Distribution of sand size fractions for selected depths from cores of the Hills, Gladwyn, Lone Tree, and West Liberty I and IV transects 39
Summary of the depth to aeolian sand for cores of the West Liberty I, II, IV, and Lone Tree transects 77
Distribution of sand size fractions and gravels for selected depths from cores of the Nichols and Conesville transects 86
Present Pleistocene stratigraphie nomenclature for eastern Iowa 105
Summary of clay mineralogy for tills in southeast Iowa 107
Summary of clay mineralogy for cores of the Columbus Junction transect 109
Summary of the percentages of calcite and dolomite, calcite/dolomite ratio, and total carbonate content for cores of the Columbus Junction transect
Soils and related soil characteristics of the study area
Characteristics of group No. I, II, III, and RECI Tama soils
Available phosphorus data for group No. I, II, III, and RECI Tama soils
111
113
180
189

V
Table 13.
Table 14.
Table 15,
Table 16.
Table 17.
Table 18.
Table 19.
Page
Total phosphorus data for the group No. I, II, III, and RECI Tama soils 193
Characteristics of group No. I, II, and III Clinton and Inton soils 19 8
Available phosphorus data for the group No. I, II, and III Clinton and Inton soils 202
Total phosphorus data for the group No. I, II, and III Clinton and Inton soils 203
Characteristics of the group No. II and RECI soils with restricted drainage 207
Available phosphorus data for group No. II Muscatine, Garwin, and Sperry soils and RECI Muscatine and Garwin soils 216
Total phosphorus data for group No. II Muscatine, Garwin, and Sperry soils and RECI Muscatine and Garwin soils 221

vi
LIST OF FIGURES
Figure 1.
Figure 2.
Figure 3.
Figure 4.
Figure 5.
Figure 6.
Figure 7.
Figure 8.
Figure 9.
Figure 10.
Figure 11.
Figure 12.
Location of the study area in southeastern Iowa
Map of the Lake Calvin region and inset maps showing the course of Leverett's channel as proposed by Schoewe (1920); lowan surface from Ruhe et al. (1968) and Miller (1974)
A portion of the USGS Riverside quadrangle topographic map showing the location of the cores of the Riverside transect
Stratigraphie cross section of the Riverside transect
A portion of the USGS Hills quadrangle topographic map showing the location of the cores of the Hills transect
Stratigraphie cross section of the Hills transect
A portion of the USGS Lone Tree quadrangle topographic map showing tne location of the cores of the Gladwyn transect
Stratigraphie cross section of the Gladwyn transect
Depth distributions of total and available phosphorus for the alluvium and the paleo-sol developed in alluvium in core 58BE107
Depth distributions of clay, fine silt, coarse silt, and sand for the paleosol developed in alluvium in core 58BE107
A portion of the USGS Lone Tree quadrangle topographic map showing the location of the cores of the Lone Tree transect
Stratigraphie cross section of the Lone Tree transect
Page
4
24
26
35
37
43
44
47
49
52
53

vii
Page
Figure 13.
Figure 14,
Figure 15.
Figure 16,
Figure 17.
Figure 18.
Figure 19.
Figure 20a.
A portion of the USGS West Liberty SW quadrangle map showing the location of the cores of the West Liberty I transect
Stratigraphie cross section of the West Liberty I transect
Depth distributions of pH, clay, fine silt, coarse silt, and sand in the paleosol developed in alluvium in core 52BE120
A portion of the USGS West Liberty SW quadrangle map showing the location of the cores of the West Liberty II transect
Stratigraphie cross section of the West Liberty II transect
A portion of the USGS West Liberty SW quadrangle map showing the location of the cores of the West Liberty IV transect
Stratigraphie cross section of the West Liberty IV and Iowa City East transects
A portion of the USGS West Liberty SW quadrangle map showing the location of the cores of the Iowa City East transect
Figure 20b. A portion of the USGS Nichols and Lone Tree quadrangle maps showing the location of the cores of the Nichols transect
Figure 21.
Figure 22.
Figure 23.
Figure 24.
Stratigraphie cross section of the Nichols and Conesville transects
57
59
63
68
69
74
75
80
84
85
A portion of the USGS Cotter and Columbus Junction quadrangle maps showing the location of the cores of the Conesville transect 89
Revised map of the Lake Calvin region; lowan surface from Ruhe et al. (1968) and Miller (1974) 96
A portion of the USGS Cotter quadrangle map showing the location of the cores of the Columbus Junction transect 98

viii
Figure 25.
Figure 26.
Figure 27.
Figure 28,
Figure 29,
Figure 30.
Figure 31.
Figure 32.
Figure 33.
Figure 34.
Figure 35.
Figure 36,
Figure 37.
Figure 38.
Figure 39.
Page
Stratigraphie cross section of the Columbus Junction transect 99
Clay and pH depth distributions for the group No. I Tama soils, 52B205 and 52B107 117
Clay and pH depth distributions for the group No. I Tama soils, 52B109 and 52B217 118
Total carbon depth distributions for the group No. I Tama soils 120
Available phosphorus depth distributions for the group No. I Tama soils 122
Total phosphorus depth distributions for the group No. I Tama soils 124
Clay and pH depth distributions for the group No. I Clinton soils 127
Total carbon depth distributions for the group No. I Clinton soils 129
Available phosphorus depth distributions for the group No. I Clinton soils 131
Total phosphorus depth distributions for the group No. I Clinton soils 133
Clay and pH depth distributions for the group No. II Tama soils, 52B204 and 52B116 135
Clay and pH depth distributions for the group No. II Tama soils, 52B207 and 52B211 136
Total carbon depth distributions for the group No. II Tama soils 138
Available phosphorus depth distributions for the group No. II Tama soils 140
Total phosphorus depth distributions for the group No. II Tama soils 142

145
147
149
151
154
155
157
158
160
161
163
164
169
170
ix
Clay and pH depth distributions for the group No. II and III Clinton and Inton soils
Total carbon depth distributions for the group No. II and III Clinton and Inton soils
Available phosphorus depth distributions for the group No. II and III Clinton and Inton soils
Total phosphorus depth distributions for the group No. II and III Clinton and Inton soils
Clay and pH depth distributions for the group No. II Muscatine soils
Clay and pH depth distributions for the group No. II Garwin and Sperry soils
Total carbon depth distributions for the group No. II Muscatine soils
Total carbon depth distributions for the group No. II Garwin and Sperry soils
Available phosphorus depth distributions for the group No. II Muscatine soils
Available phosphorus depth distributions for the group No. II Garwin and Sperry soils
Total phosphorus depth distributions for the group No. II Muscatine soils
Total phosphorus depth distributions for the group No. II Garwin and Sperry soils
Clay and pH depth distributions for the group No. Ill Tama soils, 52B104 and 52B108
Clay and pH depth distributions for the group No. Ill Tama soils, 52B101 and 52BE111

X
Page
Figure 54. Total carbon depth distributions for the group No. Ill Tama soils 172
Figure 55. Available phosphorus depth distributions for the group No. Ill Tama soils 174
Figure 56. Total phosphorus depth distributions for the group No. Ill Tama soils 176
Figure 57. Clay and pH depth distributions for RECI Tama soils 183
Figure 58, Total carbon depth distributions for RECI Tama soils 187
Figure 59. Available phosphorus depth distributions for RECI Tama soils 190
Figure 60. Total phosphorus depth distributions for RECI Tama soils 194
Figure 61. Clay and pH depth distributions for RECI Muscatine soils 208
Figure 62. Clay and pH depth distributions for RECI Garwin soils 210
Figure 63. Total carbon depth distributions for RECI Muscatine soils 212
Figure 64. Total carbon depth distributions for RECI Garwin soils 213
Figure 65. Available phosphorus depth distributions for RECI Muscatine soils 215
Figure 66. Available phosphorus depth distributions for RECI Garwin soils 219
Figure 67. Total phosphorus depth distributions for RECI Muscatine soils 223
Figure 68. Total phosphorus depth distributions for RECI Garwin soils 225

1
INTRODUCTION
Geomorphic and stratigraphie investigations have been
conducted in the geographic area along the Iowa and Cedar
Rivers, known as the Lake Calvin region, for over 60 years.
Conflicting interpretations as to the chronology of the Lake
Calvin region in the Quaternary of Iowa have been proposed
throughout that time period.
Soil survey mapping in Cedar and Johnson counties initi
ated a renewed interest in the Lake Calvin region and resulted
in the Bicentennial Lake Calvin Study in 1976. Soil surveys
are presently underway in Henry, Louisa, Muscatine, and
Washington counties.
The present field mapping strategy in the Lake Calvin
region does not separate loess-derived soils underlain with
sand from loess-derived soils without a subjacent sand zone.
In most instances, the sand is located below the control sec
tion and is not penetrated with a hand probe.
The ongoing controversy as to the chronology of the Lake
Calvin region in the Quaternary of Iowa and the present soil
mapping strategy in the Lake Calvin region initiated a re
examination of the Lake Calvin region through a joint effort
of the Iowa State University Agronomy Department, Iowa Geo
logical Survey, and the University of Iowa Geology Department.
The objectives of this study are to:
1. Examine the stratigraphy and geomorphology of the

2
high terrace in the Lake Calvin basin and the
adjacent uplands.
2. Define the extent of paleosols on the high terrace
along the Iowa River portion of the Lake Calvin
basin.
3. Characterize the ground soils and nature of the
parent materials on the intermediate terrace.
4. Determine the morphological, chemical, and physical
properties of selected soils developed on the high
terrace.
5. Compare the morphological, chemical, and physical
properties of soils developed on the high terrace
geomorphic surface to soils developed on stable up
land landscape positions in the Lake Calvin region
and to representative soils from east-central Iowa.

3
BACKGROUND
Geomorphology and Stratigraphy of the Lake Calvin Region
The floodplains and terraces of the Iowa and Cedar
Rivers and several of their tributary streams mark the bounda
ries of the Lake Calvin basin. The Lake Calvin basin occupies
portions of Cedar, Johnson, Louisa, Muscatine, Soctt, and
Washington counties in southeastern Iowa. The general loca
tion of the Lake Calvin basin is shown in Figure 1. The
basin is surrounded on all sides by glacial drift uplands,
Pre-Illinoian drift on the north (lowan erosion surface),
west and south, and Illinoian drift on the southeast and
east (Ruhe, 196 8).
Within the lake basin, Schoewe (1920) identified three
geomorphic surfaces which were named the high, intermediate,
and low terraces based on differences in elevation. Schoewe
restricted the low terrace to the Iowa River valley portion
of the basin. The high terrace was identified primarily in
the Iowa River valley, although it was also identified in
some tributary valleys of the Cedar River. As the Iowa and
Cedar River valleys merge south of Columbus Junction, Iowa,
the high and intermediate terraces merge. Schoewe (1920)
referred to the terrace formed below the junction of the two
river valleys as the Iowa-Cedar terrace. The locations of the
various terraces in the Lake Calvin basin, according to


Figure 2. Map of the Lake Calvin region and inset maps showing the course of Leverett's channel as proposed by Schoewe (1920); lowan surface from Ruhe et al. (1968) and Miller (1974)

Alluvium
S C O T T
Iowa-Cedar terrace
g Low terrace dor cf e r
Intermediate terrace
High terrace
S C A T I N E
LOUIS
CALVIN Muscat
m

7
Schoewe (1920), are shown in Figure 2.
Schoewe (1920) considered the sediments of the high and
intermediate terraces to be loess-capped lacustrine sediments
closely related in time. Earlier work by Udden (1899) sug
gested a lacustrine origin for the sediments of the inter
mediate terrace in Muscatine County. This hypothesis was
later abandoned by Udden (l90l) when he concluded that the
terraces along the Iowa and Cedar Rivers were fluvial in
origin and had been built up in part at the time of the lowan
ice invasion. The lowan, at that time, was thought to be an
early Wisconsin glacial stage. Ruhe et al. (1958) have since
identified it as an erosional surface developed on Pre-
Illinoian till. Udden's second hypothesis was supported by
Norton (1901) in a report on the geology of Cedar County,
Iowa. Leighton (1916) and Alden and Leighton (1917) also
attributed some of the terraces along the Iowa River to the
lowan stage of glaciation or, as Ruhe et al. (1968) would
state, part of the lowan erosion surface geomorphic system.
Leverett (1942) considered the terrace to be fluvial rather
than lacustrine in origin, based on the stratigraphy of the
sediments and the downstream gradient of the terraces.
Ruhe (1968) and Ruhe and Prior (1970) identified the
stratigraphy of the high and intermediate terraces as alluvial
terrace sediments overlain with loess ranging in thickness
from 1.5 meters to 4.6 meters. However, soil profiles col
lected by the USDA SCS National Soil Survey Laboratory and

8
Iowa State University on the intermediate terrace near
Nichols, Iowa, were developed in alluvial sediments.^ The
lack of a loess cover on the intermediate, terrace suggests
that the high and intermediate terraces cannot be closely
related in time, as postulated by Schoewe (1920).
Schoewe (1920) considered the low terrace to be glacio-
fluvial in origin because it could be traced back to the
lowan drift plain (now the lowan erosion surface) and was
thought to be composed of lowan outwash material. The ab
sence of a loess mantle on the low and intermediate terraces
suggests that they may be closely related in time. Since
loess deposition ceased in Iowa approximately 14,000 years
ago (Ruhe, 1969), the low and intermediate terraces must be
younger than 14,000 years old and separated in time from the
high terrace which is loess covered.
The unusual width of the Cedar River valley and the
topography of the surrounding country led Calvin (1896) to
suggest the existence of a former glacial lake in the region.
Limiting his observations to the geology of Muscatine County,
Udden (1899) arrived at a similar conclusion and named the
extensive lowlands along the Cedar River, glacial Lake Calvin,
in honor of Dr. Samuel Calvin, then the director of the Iowa
Geological Survey. Schoewe (1920) proposed a hypothesis to
^Warren Lynn, National Soil Survey Laboratory, Lincoln, Nebraska, personal communication, 1977.

9
establish the existence of Lake Calvin and to describe the
complete extent of the glacial lake. According to Schoewe
(1920), the advance of Illinoian glacier ice into eastern
Iowa caused displacement of the Mississippi River westward to
the "Goose Lake Channel" (McGee, 1891) in Jackson and Clinton
counties and then into the Wapsipinicon River and Mud Creek.
These combined waters then crossed the sag in the divide be
tween the two Mud Creeks and flowed into the Cedar River,
which was displaced along the Illinoian ice front from Moscow
to Columbus Junction. Blockage of the Iowa-Cedar River system
by the Illinoian ice sheet and the combined waters of the
Mississippi, Maquoketa, Wapsipinicon, Cedar, and Iowa Rivers
caused extensive flooding in the valleys of the Iowa and
Cedar hivers and several of their tributary streams. The
lake level rose until the level of a sag in the divide south
and southwest of Columbus Junction, Iowa, was reached and
afforded an outlet. Water flowed through this outlet to a
channel discovered by Leverett (1899), and presently occupied
by separate streams in Louisa, Washington, Henry, and Lee
counties in Iowa. This channel rejoins the present course of
the Mississippi River a few miles below Fort Madison, Iowa
(Figure 2).
After retreat of the Illinoian ice, the Mississippi
River extended northward above Fort Madison, Iowa, to its
present course, and the extension of its tributaries resulted
in piracy of the Lake Calvin system.

10
Schoewe (1920) believed Lake Calvin was long lived and
persisted until lowan time. Trowbridge et al. (1941) and
Leverett (1941, 1942), however, believed Lake Calvin was of
short duration, and with retreat of Illinoian ice from south
eastern Iowa and western Illinois, the Mississippi River
reverted to its former course. Regardless of its duration.
Lake Calvin was considered to be Illinoian in age.
Shaffer (1954) was the first investigator to suggest that
Lake Calvin was not related to the Illinoian glacial episode.
Examination of terraces in the lower Iowa River valley near
Wapello, Iowa, revealed loess-covered terrace sediments over
lying material Shaffer (1954) described as a Sangamon peat.
The terrace sediments had to be younger than the Sangamon peat
and were interpreted by Shaffer as being related to the
Tazewell terrace remnants below Muscatine, Iowa. Shaffer
concluded that if the high terrace described by Schoewe (1920)
was an upstream equivalent of the terrace near Wapello, Iowa,
then it was post-Sangamon and not Illinoian as regarded by
Schoewe. Radiocarbon dating of peat samples collected sev
eral years later at Shaffer's site near Wapello, Iowa, yielded
dates of 23,750 ± 600 and 23,050 ± 820 years before present
(Ruhe, 1968; Ruhe and Prior, 1970).
While the radiocarbon dates discredit Shaffer's (1954)
interpretation of the peat as being Sangamon in age, they do
substantiate Shaffer's hypothesis that the overlying terrace
sediments are, in fact, within the presently accepted Tazewell

11
radiocarbon time framework in Iowa (Ruhe, 1956, 1969).
More recently, Rvihe (1968), Ruhe et al. (1968), and
Rùhe and Prior (1970) have concluded that Lake Calvin could
not be Illinoian in age because the high terrace in Lake
Calvin is inset below the Late Sangamon erosion surface and,
therefore, must be younger than Late Sangamon. Furthermore,
they stated that if the terrace sediments were Illinoian in
age as Schoewe (1920) had suggested, and if the lake were
short lived as Leverett (1942) had suggested, then a paleosol
should be present between the terrace sediments and the
Wisconsinan loess. Investigations by Ruhe (1968), Ruhe et al.
(1968), and Ruhe and Prior (1970) did not find paleosols
developed in the loess-covered terrace sediments, and they
concluded that the terrace sediments must be more closely
related in time to the overlying loess which is Wisconsinan
in age. Ruhe et al. (1968) have suggested that erosional
debris from the lowan erosion surface formed in the Iowa
and Cedar River basins above Lake Calvin had to be transported
downstream into Lake Calvin and beyond. The landforms in the
Lake Calvin basin were interpreted as down-valley deposition-
al components of the lowan erosion surface.
In 1976, a cooperative study of Lake Calvin was under
taken by the USDA SCS National Soil Survey Laboratory and
Iowa State University. A site, sampled on a high terrace in
Johnson County, Iowa, yielded a peat overlying a paleosol
developed in terrace sediments. The peat was radiocarbon

12
dated at 21,960 ±480 years before present. Applying the
principle of superposition, the paleosol below the peat must
be older. Hallberg et al. (1980b) have also identified a
paleosol developed in high terrace alluvium near Wapello,
Iowa. The A horizon of the paleosol was radiocarbon dated
at 21,770 ± 340 years before present. The paleosol was
interpreted by Hallberg et al. (1980b) as being a Late Sanga
mon paleosol developed in terrace alluvium.
The identification of a paleosol on the high terrace of
Lake Calvin has renewed the controversy as to the chronology
of Lake Calvin in the Quaternary of Iowa.
Pedological Background of the Lake Calvin Region
Presently, an active cooperative soil survey program by
the USDA Soil Conservation Service, Iowa Agriculture and
Home Economics Experiment Station, Cooperative Extension
Service of Iowa State University, and the Department of Soil
Conservation, State of Iowa, is underway in the Lake Calvin
area. The Soil Survey of Cedar County. Iowa (Schermerhorn,
1979) has been completed and field work and soil mapping for
a modern soil survey of Johnson County, Iowa, were recently
completed. Currently, field work and soil mapping are under
way in Henry, Louisa, Muscatine, and Washington counties.
The majority of the uplands surrounding the Lake Calvin
basin and the loess-mantled high terrace are within the
boundaries of the Tama-Muscatine, Otley-Mahaska, and Ladoga-

13
Clinton soil associations (Iowa Agriculture and Home Eco
nomics Experiment Station, 1978). The soil series of the
Tama-Muscatine, Otley-Mahaska and Ladoga-Clinton soil asso
ciation areas of eastern Iowa are arrayed by biosequence and
natural drainage class in Table 1.
Some of the Tama soils in Cedar, Muscatine, and Scott
counties have morphologies which are atypical of modal Tama
soils. These atypical Tama soils have moderate to heavy coat
ings of light gray, silt-sized grains (neo-skeletons) on the
faces of the peds in the B horizon (Smith et al., 1950; Arnold
and Riecken, 1964; Miller, 1974; Schermerhorn, 1979). Arnold
(1965) has proposed a soil-landscape model which implies that
forest vegetation has had a distinct influence on the genesis
and morphology of Tama soils in eastern Iowa.
Miller (1974) has described well- and moderately well-
drained Tama soils with atypical morphologies on the primary
divide between the Cedar and Wapsipinicon Rivers in Cedar
County, Iowa. This primary divide can be characterized as a
broad, tabular divide with microtopography consisting of
swell-swale features. The swell-swale features are related
to the presence or absence of sand at the base of the loess.
The well- and moderately well-drained soils on the pri
mary divide differ from modal Tama soils in that they have a
lower clay content in the solum, greater depth to clay maxi
mum, 2% to 5% less clay in the A horizon, a higher available
phosphorus (AP) content in the subsoil and greater depth to

Table 1. Soil series of the Tama-Muscatine and Otley-Ladoga soil association areas arrayed by biosequence and natural drainage class
Natural drainage class
Soil association Biosequence Well Somewhat poor Poor
Tama-Muscatine
Otley-Ladoga
Prairie
Trans itional
Forest
Prairie
Transitional
Forest
Tama
Downs
Fayette
Otley
Ladoga
Clinton
Muscatine
Atterberry
Stronghurst
Mahaska
Givin
Keomah
Garwin
Walford
Traer
Taintor
Rubio
Rushville

15
the maximum AP content, a higher weighted organic carbon con
tent from 0 to 38 cm, and abundant light gray ped coatings in
the 66 cm to 86 cm zone (Miller, 1974).
Schermerhorn (1979) has identified a Tama variant silt
loam with grainy gray ped coatings in the B horizon on the
primary divide between the Cedar and Iowa Rivers in Cedar
County. The landscape of the divide was characterized by a
broad flat with swell-swale microtopography similar to that
described by Miller (1974).
Miller (1974) has suggested that soil water movement on
the tabular divide is unidirectional and occurs as run in,
and that sands at the base of the loess increased vertical
movement of water. Ruhe (1969) and Wollenhaupt (1980) have
also suggested that more intensive leaching occurs in soils
developed in loess which is underlain by sand.
In the ongoing soil survey program in Iowa, soil series
mapped on loess-covered terraces are separated from their up
land counterparts by the use of soil phases. Two soil phase
separations within the series that are commonly used on loess-
covered terraces are the terrace phase or substratum phase.
A soil phase is defined as a subdivision of a soil series or
other unit in the soil classification system based on differ
ences in the soil that affect its use and management (Soil
Survey Staff, 1951). The present soil mapping strategy in the
Lake Calvin region does not separate stable upland loess-
derived soils from stable upland loess-derived soils underlain

16
by sand.
Numerous investigations on the genesis and morphology
of upland loess-derived soils have been conducted in southern
and southeastern Iowa. In contrast, soils developed on
loess-mantled stream terraces have received only minor ex
amination (Corliss and Ruhe, 1955; Fenton, 1966; Ruhe, 1969;
Wollenhaupt, 1980). The loess-mantled high terrace along
the Iowa and Cedar Rivers in the Lake Calvin basin provides
an extensive area in which to study the morphology of the
loess-derived soils underlain by aeolian sand and/or alluvial
sediments.

17
METHODS AND PROCEDURES
Field Methods
Sample collection
The approach to this investigation involved the ex
amination of cores along several transects and from selected
sites in the Lake Calvin region. Samples were collected
with a truck-mounted Giddings hydraulic soil probe, mobile
B 40 rotary flight auger, and from a fresh exposure. The
gross morphology of the stratigraphie units and weathering
zones was described and recorded in the field. The cores
were wrapped in white freezer paper, stored in cardboard
core boxes, and placed in refrigerated storage.
Terminology
Transects were assigned names based on the name of the
United States Geology Survey (USGS) 7.5-minute topographic
map in which the transect was located. If more than one
transect was located on a single USGS topographic map, the
transect name was assigned a Roman numeral or the name of an
adjacent city or town was used.
Coreholes were identified using a system patterned after
a system devised by Miller (1974) in which a series of nu
merical and alphic characters were assigned to each corehole.
The characters designate the county number, investigator's
initials, field season, and corehole number. The investigators

18
for each corehole are listed with the soil profile descrip
tions in Appendix A. Core samples were collected over a
three-year period and were assigned numbers 0, i, and 2,
designating the first, second, or third field season, re
spectively. The corehole numbers were assigned by the
chronological order in which the cores were collected in
the field. For example, core 92BE101 indicates the core was
from Washington County (92) and was collected by T. Bicki and
S. Esling (BE) in the second field season (1) and was the
first in the series collected that year (Ol).
Laboratory Procedures
Soil profile and weathering zone descriptions
Frozen soil cores were thawed and described in a green
house under natural daylight conditions. Detailed soil pro-
f ile descriptions were made using the descriptive terminology
of the Soil Survey Manual (Soil Survey Staff, 1951). Weather
ing zones were described using standard weathering zone
terminology as outlined by Hallberg et ai. (1978a). After
the soil profile and weathering zone descriptions were com
pleted, the cores were allowed to air-dry. The air-dried
samples were then subdivided into smaller segments, ground
for analysis, and placed in soil sample bags.

19
Particle size analysis
Particle size distribution of the less than 2 mm ground
samples was determined by a modification of the pipette
method outlined by Kilmer and Alexander (1949), and used by
the Iowa State University Soil Survey Laboratory (Walter
et al., 1978).
Soil £«
A Beckman Zeromatic pH Meter was used for determination
of pH on a 1:1 soil to water mixture. The soil suspension
was stirred three times following the addition of distilled
water and was allowed to stand for 30 minutes. A Corning
Combination Electrode was placed in the supernatant liquid
and the pH was measured. The pH meter was standardized with
buffer solutions of pH 4.0 and 7.0.
Total carbon
Total carbon (TC) was determined by the Leco 70-second
carbon analyzer following the procedure of Tabatabai and
Bremner (1970). The value obtained for the total carbon
percentage was interpreted to be derived from organic sources
if the soil pH was less than 7.5.
Available phosphorus
Available phosphorus. Bray 1 (AP), was determined by a
modification of the Bray and Kurtz (1945) procedure as out
lined by Miller (1974). Analyses were performed on samples

20
ground to pass a 60 mesh sieve.
Total phosphorus
Total phosphorus (TP) was determined by a modification
of the Dick and Tabatabai (1977) procedure as outlined by
Collins (1977).
Matrix calcite and dolomite
Matrix calcite and dolomite were determined by a modi
fied version of a procedure outlined by Dreimanis (1962)
and used by the Iowa State University Soil Survey Laboratory
(Walter and Hallberg, 1980), The percentages of calcite and
dolomite were calculated from known empirical graphs relating
the volumes of carbon dioxide that were evolved from known
amounts of calcite and dolomite.
Sand fractionation
The sand fractions, 62-125, 125-250, 250-500, 500-1000,
and 1000-2000 microns, and gravels >2000 microns (Ruhe, 1969)
were determined by sieving with a Cenco-Meinzer Sieve Shaker
(Central Scientific Company, Chicago, Illinois). The percent
ages of the various size fractions were calculated on an
oven-dry weight basis.
Semiquantitative analysis of clav mineralogy
Semiquantitative analysis of clay mineralogy was deter
mined by a method used by the Iowa Geological Survey and out
lined by Hallberg et al. (1978b). The clay sample was mounted

21
on a glass pétrographie slide. The slide was placed in a
General Electric XRD-5 sample holder and exposed to copper
radiation of 1.5418 Angstroms with nickel filtration. The
sample was scanned from 2° to 35°20 at a scanning speed of
2° per minute, with the voltage set at 50 kilovolts and 15
milliamps. The counting function was set for a logarithmic
scale which was calibrated to a range of 10,000 counts full
scale. The spectrogoniometer was set up with a 1° medium
range beam slit, a medium range soller slit, and a 0.2°
detector slit.
The actual semiquantitative analysis of clay mineralogy
is based on determining the log counts per second (CPS) from
a logarithmic baseline curve drawn on the x-ray diffractogram.
The CPS are taken from the expandable clay or smectite
peak (glycolated 5.2°20, 17 Â), the illite peak (8.8°29,
lO Â), and the kaolinite + chlorite peak (12.4°20, 7,1 Â).
Using these counts, the relative percentages are calculated
as follows:
1. E (expandables) = CPS from baseline to top of peak at 5.2°29 (glycolated sample).
2. I (illite) = 3 times CPS from baseline to top of peak at 8.8°20.
3. K (kaolinite + chlorite) = 2 times CPS from baseline to top of peak at 12.4°28.
4. T (total) = E + I + K.
5. % expandables = (E/T) times lOO.
6. % illite = (l/T) times lOO.

22
7. % kaolinite + chlorite = (K/T) times 100.
This method does not represent a precise measure of the
relative percentages of the clay minerals present. The
method is a relatively rapid and inexpensive method that
provides consistent percentages which can be used as a tool
for stratigraphie analysis as well as a relative measure of
the clay mineralogy. The method has been used for these
purposes in Illinois with excellent results (Frye et al.,
1962, 1968).

23
RESULTS AND DISCUSSION
Geomorphic and Stratigraphie Investigations of the Lake Calvin Region
Riverside transect
The Riverside transect is located in the Riverside USGS
topographic quadrangle and consists of cores 92BE105, 92BE104,
92BE103, 92BE102, 92B111, 92BE26, 92BE115, 92BE28, and
92BE112 (Figure 3). The transect originates on the primary
divide between the English River and Davis Creek, continues
in a northeastward direction across several interfluves, and
descends to a high terrace remnant south of the English River.
The transect further descends to a low terrace, then ascends
to a high terrace remnant north of the English River, and
continues to an interfluve in the adjacent uplands. Detailed
profile descriptions for each core are given in Appendix A
and selected laboratory data are in Appendix B.
Cores 92BE105 and 92BE104 are located on the primary
divide between the English River and Davis Creek. They con
sist of thin loess above a thick zone of aeolian sand. The
sand in core 92BE105 is underlain by noncalcareous loess,
a Basal Wisconsin loess-derived paleosol, and a truncated
Yarmouth-Sangamon paleosol developed in till-derived sediments.
The stratigraphie distribution of materials and weathering
zones for the cores of the Riverside transect is shown in
Figure 4. The loess thickness for cores 92BE105 and 92BE104

24
R ew
b»o i:?'
) f 3)6ewif« Oiipo
M 92BB115
,2,^^ jWzieiG.-'î --a "92BÉ2f ]
krni ' 92BE102
92BE103
fM&i
Figure 3. A portion of the USGS Riverside quadrangle topographic map showing the location of the cores of the Riverside transect

Figure 4. Stratigraphie cross section of the Riverside transect

26
235
230
225
220
215
210
205
200
195
190 .
0
100
200
300
400
500
600
700 .
800
900 •
1000 •
1100 -
1200 -
1300 -
I
s I
m -d" cn o O o f-4 i-H ft w M w pq pq pq evi CM IN a\ a\ ON
«
•
Çv|
s g as
vO
i o>
u
P P c c
L—I Wisconsin loess
E23 Wisconsin loess and aeolian sand
Wisconsin aeolian sand
Sand
H+fti Recent alluvium
Alluvium
Pre-Illinoian till
I Basal Wisconsin paleosol
I Late Sangamon paleosol
I Yarmouth-Sangamon paleosol

27
is 112 cm and 180 cm, respectively. The loess contains
less than 5% sand. The thickness of the sand zone in core
92BE105 is 312 cm. The full zone of sand at core 92BE104
could not be determined due to collapse of the corehole at a
depth of 396 cm. Within the sand zone of 92BE105, medium
sand accounts for 43.4% and fine sand accounts for 35.2% of
the total sand fraction (Table 2). Small amounts of coarse
sand and trace amounts of very coarse sand are also present.
A similar particle size distribution of the sand zone was
present in core 92BE104. Medium sand accounts for 49.1% and
fine sand accounts for 32.1% of the total sand fraction at a
depth of 274 cm to 305 cm (Table 2). The loess from 450 cm
to 579 cm is oxidized and noncalcareous and ranges in pH from
7.3 at 460 cm to 7.2 at 579 cm.
Cores 92BE103 and 92BE102 are located along interfluves
in a series of stepped levels from the divide summit to the
high terrace on the English River. Core 92BE103 consists of
178 cm of oxidized loess, 279 cm of aeolian sand which con
tains a zone of loess at a depth of 305 cm to 366 cm, 46 cm
of intercalated loess and sand, 76 cm of oxidized loess, and
a Late Sangamon paleosol developed in pedisediment and glacial
till (Figure 4). The loess from 0 to 178 cm contains less
than 5% sand, while the loess zone from 305 cm to 366 cm and
from 503 cm to 579 cm contains 17.5% and 9.7% sand, respec
tively. The sand zone in core 92BE103 contains a higher per
centage of fine and very fine sand than the sand zones in

Table 2. Distribution of sand size fractions and gravel for selected depths from cores of the Riverside transect
Gravels Sand size fraction (microns)
>2000 2000- 1000- 500- 250- 125-Depth % of total 1000 500 250 125 62
Core (cm) sample % of total sand
92BE105 366-396 0.7 9.0 43.4 35.2 11.8
92BE104 188-203 0.4 5.1 46.8 36.6 11.1 274-305 0.2 6.9 49.1 32.1 11.6
92BE103 193-201 1.5 36.6 41.1 20.8
92BE26 366-396 0.7 13.2 48.0 26.3 11.8 396-518 0.1 8.6 57.1 26.5 7.7 518-732 0.2 6.2 49.2 31.5 12.9 884-960 0.1 2.8 19.2 49.8 19.4 8.8 1189-1280 0.7 5.8 26.9 45.8 14.5 7.0
92BE28 366-396 0.5 45.9 35.8 17.8 457-549 3.9 4.5 62.4 24.7 4.5 549-671 1.5 10.8 62.5 18.2 7.1 701-732 0.3 2.0 27.8 44.4 16.4 9.4 732-853 0.2 4.0 27.8 46.9 14.5 6.6 853-945 0.1 0.5 11.4 26.9 51.7 9.5 975-1006 5.2 13.4 31.8 29.2 15 .5 10.1 1036-1128 2.5 9.1 35.6 35.1 14.4 5.8

29
cores 92BE105 and 92BE104. The fine sand fraction comprises
up to 41.1% of the total sand fraction in core 92BE103. The
medium sand fraction and very fine sand fraction accounts
for 35.6% and 20.8%, respectively, of the total sand fraction.
Core 92BE102 consists of 102 cm of loess and 76 cm of non-
calcareous Pre-Illinoian glacial till which overlies calcare
ous Pre-Illinoian glacial till. Sand or a paleosol are not
present between the loess and noncalcareous glacial till
(Figure 4).
Cores 92B111, 92BE26, and 92BE28 are on high terrace
remnants on the English River (Figure 3). Core 92B111 is
on a dune-like feature and consists of 305 cm of loess and
183 cm of aeolian sand. Core 92BE26 consists of 244 cm of
oxidized loess, 488 cm of sand which contains a zone of loess
from 335 cm to 396 cm, and 152 cm of silt loam and heavy
silty clay loam textured sediments which grade into coarse
textured gravelly sands at the base of the core (Figure 4).
No evidence of a paleosol was found in the silt loam and
heavy silty clay loam sediments. Within the upper sand zone,
the medium sand accounts for 57.1% and fine sand accounts for
26.5% of the total sand fraction. Small amounts of coarse
sand and trace amounts of very coarse sand are also present.
Within the sand zone at the base of the core, medium and
coarse sand accounts for 45.8% and 26.9%, respectively, of
the total sand fraction (Table 2). Very coarse sand accounts
for 5.8% of the total sample and trace amounts of gravel are
30
present. Core 92BE28 consists of 305 cm of oxidized loess,
61 cm of aeolian sand, 79 cm of sand "with thin intercalated
bands of loess, 693 cm of noncalcareous sand, and a weakly
developed paleosol formed in stratified alluvium (Figure 4).
The sediments within the paleosol are noncalcareous but con
tain secondary carbonates. The sediments below the paleosol
are calcareous and contain primary and secondary carbonates,
within the thick sand zone, the particle size distribution of
the sand becomes coarser and less sorted with depth. Medium
and fine sand make up the bulk of the particle size fractions
at a depth of 457 cm to 549 cm. Medium sand accounts for
62.4% of the total sand fraction. At a depth of 701 cm to
732 cm, medium sand accounts for 44.4% and coarse sand ac
counts for 27% of the total sand fraction. The sands are
less sorted at a depth of 975 cm to 1006 cm with medium,
coarse, and fine sand accounting for 29.2%, 31.8%, and 10.1%,
respectively, of the total sand fraction. Very coarse sand
accounts for 13.4% of the sand fraction and gravel accounts
for 5.2% of the total sample (Table 2).
Core 92BE115 is located on the low terrace adjacent to
the English River and consists of 224 cm of stratified alluvi
um overlying sands and gravels (Figure 4).
Core 92BE112 is located in the uplands, on a secondary
interfluve north of the English River (Figure 4). The core
consists of 396 cm of loess, which overlies a Basal Wisconsin
loess-derived paleosol, and a truncated Yarmouth-Sangamon

31
paleosol developed in Pre-Illinoian glacial till (Figure 4).
Secondary calcium carbonate is present at the base of the
Basal Wisconsin paleosol and in the Yarmouth-Sangamon paleo
sol. No sand zone separates the loess from the underlying
paleosols.
The Riverside transect illustrates several important
features common to the Lake Calvin region. The large quan
tity of aeolian sand in the uplands throughout the Lake
Calvin region suggests that some portion of the sand on the
high terrace could be aeolian or wind reworked sand. Loess
below 91 cm of sand in core 92BE26 confirmed that some por
tion of the sand on the high terrace was, in fact, aeolian.
Hallberg et al. (1980b) has also reported the presence of
aeolian sand on a high terrace north of Wapello, Iowa. Addi
tional cores collected on the high terrace revealed that
topography of the ground surface reflected the subsurface
topography of the aeolian sand. The aeolian sand is respon
sible for the local relief on the high terrace. Considerable
reworking of the sand has occurred, as prominent dune fea
tures are evident throughout the high terrace. Ruhe (1968)
also recognized dune features on the extensive high terrace
east of the Iowa River in Johnson County. However, Ruhe
considered the sand to be wind reworked stream terrace
deposits.
A north to northwest prevailing wind direction during
the period of aeolian sand deposition in the English River

32
drainage basin appears evident. No aeolian sand was found
in the uplands north of the English River. Core 92BE112
typifies the stratigraphy of the uplands north of the
English River. Aeolian sand was found to extend into the
uplands several kilometers south of the English River as far
south as Davis Creek. Cores 92BE103, 92BE104, and 92BE105
are characteristic of the stratigraphy in the uplands, south
of the English River. Aeolian sand was found outcropping on
sideslopes south of the English River.
The presence of a paleosol developed in alluvium in core
92BE28 would indicate that burial of the terrace occurred
after a period of soil formation and that the loess and sand
are not closely related in time to the underlying paleosol.
The paleosol is interpreted to be contemporaneous with the
high terrace paleosols identified north of Wapello, Iowa,
and south of Iowa City, Iowa, based on similar morphology and
stratigraphy. Hallberg et al. (1980b) radiocarbon dated the
A horizon of a Basal Wisconsin loess-derived paleosol in the
high terrace near Wapello at 18,590 ± 635 years before present.
Below the Basal Wisconsin paleosol, the A horizon of the
paleosol developed in alluvium was dated at 21,770 ± 340 years
before present. A peat sample from the high terrace paleosol
collected during the Bicentennial Lake Calvin Study in Johnson
County was dated at 21,960 ± 480 years before present. Hall
berg et al. (1980b) have interpreted the paleosol to be Late
Sangamon in age. The absence of an identifiable paleosol in

33
the alluvial sediments in core 92BE26 may be related to dis
turbance of the samples during collection. Samples from core
92BE26 below the depth of 396 cm were collected with a rotary
flight auger.
The processes responsible for the deposition of the sand
zone below the aeolian sand and above the paleosol developed
in alluvium are less clearly defined. The sand contains
small amounts of very coarse sand and trace to small amounts
of gravels (Table 2) and are interpreted as alluvial deposits.
The sand may represent a combination of alluvium deposited on
a preexisting terrace and alluvial fan deposits from the
adjacent uplands. The alluvium may be materials transported
downstream into the Lake Calvin basin from the lowan erosion
surface, and deposited on the high terrace paleosolic surface.
Ruhe et al. (1968) did not identify paleosols on the high
terrace and interpreted the materials below the loess as
materials transported downstream from the lowan erosion
surface.
Hills transect
The Hills transect is located in the Hills USGS topo
graphic quadrangle and consists of cores 52B115, 52B116, and
52B207. The transect is situated on a high terrace remnant
adjacent to Old Man's Creek, a tributary of the Iowa River,
and in the adjacent uplands (Figure 5). The stratigraphie
distribution of materials and weathering zones for the cores

Figure 5. A portion of the USGS Hills quadrangle topographie map showing the location of the cores of the Hills transect

R.6W. SCALE 1:24000
52B2071
52B116
Banner
MANS
CO ui

36
of the Hills transect is shown in Figure 6. Detailed pro
file descriptions for each core are given in Appendix A and
selected laboratory data are in Appendix B.
Core 52B115 is located on the sideslope of an inter-
fluve divide. It consists of 38l cm of loess which contains
a lO-cm sand band at 323 cm, 107 cm of loess with thin bands
of intercalated sand, 71 cm of loess with a high sand con
tent, a Basal Wisconsin loess-derived paleosol, 40 cm of
pedisediment, and a Late Sangamon paleosol developed in pedi-
sediment and Pre-Illinoian glacial till. Within the paleosol,
a stone line separates the pedisediment from the underlying
till. The loess from 0 to 323 cm is oxidized, noncalcareous,
and contains less than 5% sand. The loess from 323 cm to
381 cm is oxidized, noncalcareous, and contains 8.9% sand.
The loess from 381 cm to 488 cm is oxidized, noncalcareous,
and contains numerous bands of intercalated sand. The loess
from 488 cm to 559 cm is deoxidized, calcareous, and contains
13.9% sand.
Cores 52B116 and 52B207 are located on a high terrace
remnant north of Old Man's Creek. Core 52B116 consists of
213 cm of loess, 41 cm of loess with a high sand content, 81
cm of aeolian sand, 41 cm of loess with a high sand content,
15 cm of aeolian sand, a Basal Wisconsin loess-derived paleo
sol, 99 cm of laminated alluvium, a 2-cm iron-rich band, 130
cm of alluvium, and a paleosol developed in alluvium. The
entire sequence of loess and aeolian sand is oxidized and

37
210
205
200
0
100 —,
200
300
400
500
600
700
800
§ H
1
5
I
52B115 58B116
II -J • Wisconsin loess
58B207
f t Il Wisconsin loess and aeolian sand
Wisconsin aeolian sand
Sand
Pedisediment
Basal Wisconsin paleosol
Late Sangamon paleosol
Figure 5. Stratigraphie cross section of the Hills transect

38
noncalcareous to the depth of the Basal Wisconsin paleosol.
The loess from 213 cm to 254 cm contains 28.4% sand. The
aeolian sand zone from 254 cm to 335 cm is predominantly
medium and fine sand. Medium sand accounts for 52.7%, while
fine and very fine sand accounts for 25.5% and 17.5% of the
total sand fraction (Table 3). The loess from 335 cm to 376
cm contains 24.1% sand. The aeolian sand zone from 376 cm
to 391 cm is composed of 42.7% medium sand, 26,3% very fine
sand and 24.1% fine sand (Table 3). Small amounts of coarse
and trace amounts of very coarse sand are also present. The
Basal Wisconsin paleosol contains 23.6% sand while the allu
vium from 455 cm to 554 cm contains 26.7%. In contrast, the
underlying alluvium contains less than 9% sand. The alluvial
zone from 554 cm to 587 cm is calcareous. The alluvial zone
from 587 cm to 686 cm and the paleosol are noncalcareous.
Core 52B207 is located on a prominent dune-like feature
on the high terrace. The core consists of 282 cm of loess,
38 cm of loess with a high sand content, and 76 cm of aeolian
sand. Collapse of the core hole prevented further sampling
below a depth of 396 cm. The loess from 0 to 282 cm is
oxidized, noncalcareous, and contains less than 6% sand. The
loess from 282 cm to 320 cm ranges in sand content from 33.]%
to 36.9% sand. The aeolian sand zone from 320 cm to 396 cm
contains 31.1%, 31.5%, and 36.6% of the total sand fraction
for the medium, fine, and very fine sand, respectively
(Table 3).

Table 3. Distribution of sand size fractions for selected depths from cores of the Hills, Gladwyn, Lone Tree, and West Liberty I and IV transects
Gravels Sand size fractions (microns)
>2000, 2000- lOOO- 500- 250 125-Depth % of total 1000 500 250 125 62
Transect Core (cm) sample — % of total sand
Hills 52B116 254-279 4.3 52.7 25.5 17.5 376-391 0.5 6.4 42.7 24.1 26.3
52B207 320-396 0.1 3.7 31.1 31.5 36.6
Gladwyn 58BE107 592-607 0.1 0.6 7.8 77.6 13.4 0.6 653-704 2.0 9.6 29.1 46.5 14.7 0.1 704-734 35.6 11.7 33.4 50.5 4.0 0.3 734-826 5.4 11.9 43.4 38.7 5.7 0.3 836-848 10.9 47.2 44.9 6.9 0.5 0.4 866-881 100
Lone Tree 52BE111 279-305 0.3 11.3 42.6 35.4 10.4
52BE101 201-236 3.0 44.9 39.4 12.7 295-305 0.1 7.4 28.5 38.0 26.0
West Liberty I 52BE120 213-229 0.2 17.3 42.8 39.7 427-459 0.1 0.2 11.7 37.4 50.6 549-671 14.2 24.9 11.2 31.5 18.2
West Liberty IV 52B206 150-168 7.7 37.8 37.5 17.0
52B104 224-269 0.1 8.8 40.3 33.6 17.2
Iowa City East 52B204 701-823 13.1 35.6 37.0 14.3

40
Deposition of aeolian sand along various tributary
streams of the Iowa River is varied. The aeolian sand associ
ated with core 52B115, the core from the uplands, is pri
marily thin intercalated bands, or is incorporated into the
loess to produce a loess with a higher sand content. In con
trast, the aeolian sand in cores 92BE103, 92BE104, and 92BE105
from the Riverside transect, is a discrete zone. No prevail
ing wind direction appears dominant, as aeolian sand is found
throughout the uplands surrounding Old Man's Creek.
The texture and morphology of the sediments which over
lie the paleosol in core 52B116 are different from those
which overlie the paleosol in core 92BE28. The sediments
above the paleosol in core 52B116 are unoxidized, calcareous,
and noncalcareous silt loam textured alluvium, whereas the
sediments above the paleosol in core 92BE28 are oxidized and
noncalcareous sand.
The Late Sangamon paleosolic surface is present at the
summit of the interfluve divide^, on the sideslope, and on
the high terrace. The Late Sangamon paleosol is at an ele
vation of 201 meters in core 52B115 while the paleosol in
core 52B116 is at an elevation of 195 meters. The paleosol
in the uplands and on the high terrace may be components of
the same Late Sangamon surface.
^Steven Esling, Research Assistant, Dept. of Geology, University of Iowa, Iowa City, Iowa, personal communication, 1980.

41
Gladwvn transect
The Gladwyn transect is located in the Lone Tree USGS
topographic quadrangle and consists of cores 5 8BE108, 58BE109,
and 58BE107 (Figure 7). The transect originates in the up
lands and descends to a high terrace remnant on the west side
of the Iowa River. The stratigraphie distribution of materi
als and weathering zones for the cores of the Gladwyn
transect is shown in Figure 8. Detailed profile descrip
tions for each core are given in Appendix A and selected
laboratory data are in Appendix B.
Core 58BE108 is located on the primary divide between
Goose Creek and the Iowa River. It consists of 457 cm of
loess, a Basal Wisconsin loess-derived paleosol, and a
Yarmouth-Sangamon paleosol developed in till-derived sedi
ments, The loess from 0 to 366 cm is oxidized, noncalcare-
ous, and contains less than 5% sand. The loess from 366 cm
to 457 cm is oxidized, noncalcareous, and contains less than
3% sand. The pH of the Basal Wisconsin paleosol ranges from
7.3 to 7.1. The pH of the Yarmouth-Sangamon paleosol is 7.1.
The neutral reaction of the paleosols in the Gladwyn transect,
as well as in other transects throughout the Lake Calvin
region, results from translocation of calcium carbonate from
overlying, previously calcareous material. The occurrence
of secondary carbonates in paleosols at other locations in
Iowa has been discussed by Fenton (1966), Miller (1974),
Bicki (1980), and Hallberg et al. (1980b).

Figure 7. À portion of the USGS Lone Tree qimdrangle topographic map showing the location of the cores of the Gladwyn transect

SCALE 1:24000
jW?596
58BE108
58BE107
^58BE109
R. G Vf. R. 5 W.

230
225
220
215
210
205
200
195
0
100
200
300
400
500
600
700
800
900
1000
1100.
1200
8 .
8
I
44
S
A
58BE108 58BE109
I j Wisconsin loess
Sands and gravels
I! : ! Alluvium
58BE107
am
Pre-Illlnolan till
Basal Wisconsin paleosol
Late Sangamon paleosol
mm Yarmouth-Sangamon paleosol
ratigraphic cross section of the Gladwyn transect

45
Core 58BE109 is located on the summit of an interfluve
divide. The core consists of 262 cm of loess, a 73-cm thick
Basal Wisconsin loess-derived paleosol and a Late Sangamon
paleosol developed in pedisediment and Pre-Illinoian glacial
till. The entire loess zone is oxidized, noncalcareous, and
contains less than 5% sand. The Basal Wisconsin paleosol and
Late Sangamon paleosol have a neutral soil reaction and range
in pH from 6.7 to 7.1.
Core 58BE107 is located on the only high terrace remnant
west of the Iowa River which is situated immediately adjacent
to the river. A cutbank in the high terrace exposes the
entire stratigraphie section of the terrace. Core 58BE107
penetrated the section to a depth of 592 cm and the remainder
of the section was sampled from a freshly exposed cutbank.
The core contains 427 cm of loess, 38 cm of alluvium, a
paleosol developed in alluvium, 274 cm of alluvial sands and
gravels which contain two bands of finer textured alluvium,
15 cm of gravels and cobbles, and Pre-Illinoian glacial till.
The loess from 0 to 6l cm is oxidized and noncalcareous and
contains less than 5% sand. The loess from 61 cm to 427 cm
is deoxidized, noncalcareous, and contains less than 7% sand.
The 38 cm of alluvium above the paleosol consists of a 2-cm
organic-rich band, an 8-cm iron-rich band, a 15-cm zone of
very pale brown (lOYR 8/4) alluvial sediments, a 5-cm organic-
rich band, and an 8-cm zone of alluvial silts. The 2-cm
organic-rich band is silt loam in texture, and contains

46
1.64% total carbon (TC). The 2-cm organic-rich band had 759
ppm of total phosphorus (TP), and 22.4 ppm of available phos
phorus (AP). The 8-cm iron-rich band is silty clay loam in
texture and contains 1762 ppm of TP and 41.4 ppm of AP. The
extremely high TP content probably results from fixation of
phosphorus as iron phosphate. The l5-cm zone of alluvium
is very pale brown (lOYR 8/4) in the soil core but where it
is exposed in the cutbank it is red (2.SYR 5/8). The zone
ranges in thickness from 15 cm to 38 cm in the cutbank. The
very pale brown alluvial zone contains 0.34% TC, 715 ppm of
TP, and 42.7 ppm of AP. The 5-cm organic-rich band contains
1.95% TC, 1246 ppm of TP, and 107.3 ppm of AP. The 8 cm of
alluvial silts above the paleosol contains 0.40% TC, 374 ppm
of TP, and 104 ppm of AP. The depth distribution of total
and available phosphorus for the alluvium and the paleosol
developed in alluvium is shown in Figure 9.
The clay content of the paleosolum varies from 39.0% in
the Ab horizon to a maximum of 45.6% in the B21b horizon.
The clay content then decreases with depth to a minimum of
33.7% in the B3b horizon. The fine silt content of the
paleosolum decreases with depth from a maximum of 42.7% in
the Ab horizon to a minimum of 34.4% in the B22b horizon and
then increases with depth to 40.3% in the B3b horizon. The
coarse silt content is fairly uniform throughout the paleo
solum. The sand content increases with depth and ranges from
2.5% in the Ab horizon to 10.7% in the B3b horizon. The

TOTAL PHOSPHORUS (ppm)
100 200 300 400 500 600 700 800 1000 400
440 -
480 -
S 520-
# TOTAL PHOSPHORUS 560
O AVAILABLE PHOSPHORUS
600
10 30 50 70 90 110
AVAILABLE PHOSPHORUS (ppm)
Figure 9. Depth distributions of total and available phosphorus for the alluvium and the paleosol developed in alluvium in core 58BE107

48
depth distributions of the clay, silt, and sand fractions
for the paleosol are shown in Figure lO. The soil pH has a
narrow range of 6.6 to 6.7 throughout the paieosolum.
The maximum TP content of the paieosolum is 206 ppm and
is in the Ab horizon. The TP content decreases with depth
to a minimum of 125 ppm in the B23tb horizon then increases
with depth to a maximum of 210 ppm in the C horizon. The
low TP content and weakly expressed eluvial and illuvial TP
distribution indicates that either extensive weathering of
the paleosol has occurred or the TP content of the parent
material was initially low. If the paleosol is Late Sangamon
in age, then extensive weathering of the paleosol should have
occurred and the results appear consistent with TP distribu
tions for other paleosols. Bicki (1980) and Coleman (1980)
have reported low Tp contents for several paleosols developed
in glacial till or till-derived sediments in southeastern
and southern Iowa. Available phosphorus is highest in the
Ab horizon (71.5 ppm) and decreases with depth to a minimum
of 13.4 ppm in the lower B horizon.
The alluvial sands and gravels below the paleosol are
stratified, cross-bedded, and grade into coarse size fractions
with depth. The total sample from 704 to 734 cm contains
35.6% gravel (Table 3). The pH of the sand zone ranges from
6.4 to 5.9. Bands of alluvium with a texture of light silty
clay loam are at depths of 826 cm and 848 cm. The lower zone
of alluvium contains 0.31% TC. The gravels and cobbles below

49
450
20
PARTICLE SIZE FRACTIONS (%)
40 60 80 100
475 —
500 —
g
r 550 —
575
CLAY FINE SILT COARSE SILT SAND
600
Figure lO, Depth distributions of clay, fine silt, coarse silt, and sand for the paleosol developed in alluvium in core 58BE107

50
the sand zone have red (7.5YR 5/8) iron oxide coatings and
range in size from 1 cm to l5 cm in diameter.
The lower portion of the cutbank is heavy loam and loam
textured Pre-Illinoian glacial till. The upper 16 cm of till
is jointed, reduced, and noncalcareous. The subjacent till
is jointed, mottled, unoxidized, and calcareous. The base
of the cutbank contains unoxidized, calcareous glacial till.
The Gladwyn transect differs from the Riverside, Hills,
and other transects in the Lake Calvin basin in that no
aeolian sand zone is in the loess or above the paleosol. In
contrast, the high terrace east of the Iowa River contains a
thick zone of sand and aeolian sand extends into the uplands
for several kilometers.
Lone Tree transect
The Lone Tree transect is located in the Lone Tree and
Nichols USGS topographic quadrangles and consists of cores
52BE111, 52BE101, 52B103, and 52B102 (Figure 11). The
transect is located in the uplands at the southernmost ex
tension of the primary divide between the Iowa and Cedar
Rivers. The stratigraphie distribution of materials and
weathering zones for the cores of the Lone Tree transect is
shown in Figure 12.
Core 52BE111 is located in the uplands adjacent to the
high terrace of the Iowa River. It consists of 205 cm of
oxidized, noncalcareous loess and 99 cm of aeolian sand.

Figure 11. A portion of the USGS Lone Tree quadrangle topographic map showing the location of the cores of the Lone Tree transect

52BEiil,
52B101,
52B103
52B102

53
220 -
215 -
210
0"
100 —J
200 —
300
400
500 —
600""
700—
I 52BE111
I
52B101 52B103
CD Wisconsin loess
[• S !j Wisconsin loess and sand
Wisconsin aeollan sand
Basal Wisconsin paleosol
Late Sangamon paleosol
52B102
Figure 12. Stratigraphie cross section of the Lone Tree transect
54
The aeolian sand from the 279 cm to 305 cm depth is composed
of 42.6% medium sand and 35.4% fine sand. Coarse and very
fine sand account for 11.3% and 10.4%, respectively, of the
total sand fraction (Table 3).
Core 52B101 consists of l85 cm of oxidized, noncalcare-
ous loess, 16 cm of loess with a high sand content, 35 cm of
oxidized aeolian sand which contains thin bands of deoxidized
loess, 21 cm of stratified bands of deoxidized, noncalcareous
loess and aeolian sand, 38 cm of deoxidized loess and 10 cm
of aeolian sand. Collapse of the corehole prevented further
sampling. The aeolian sand from the 20i cm to 236 cm depth
is composed of 44.9% medium sand and 39.4% fine sand. Very
fine sand and coarse sand account for 12.7% and 3.0%, re
spectively, of the total sand fraction (Table 3). The sand
zone from the 295 cm to 305 cm depth is composed of 38.0%
fine sand and 28.5% medium sand. Very fine sand and coarse
sand account for 26.0% and 7.4%, respectively, of the total
sand fraction.
Core 52B103 consists of 165 cm of oxidized, noncalcare
ous loess, 28 cm of loess with a high sand content, 173 cm
of aeolian sand which contains thin bands of deoxidized
loess, 152 cm of aeolian sand, and a Basal Wisconsin loess-
derived paleosol.
Core 52B102 is located in the uplands adjacent to the
intermediate terrace of the Cedar River. It consists of

55
549 cm of oxidized, noncalcareous loess, a 31 cm thick Basal
Wisconsin loess-derived paleosol, and a Late Sangamon paleo-
sol developed in glacial till.
Preliminary subsurface investigations by Ruhe (1958)
identified aeolian sand beneath 335 cm of loess in the up
lands north of Lone Tree, Iowa. The Lone Tree transect.
West Liberty I, West Liberty II, and West Liberty IV transects
define the extent of the aeolian sand and characterize the
stratigraphy of the uplands between the Iowa and Cedar Rivers.
The aeolian sand within the loess zone is restricted to the
western half of the uplands, indicating that the Iowa River
arm of the Lake Calvin basin was the source of the sand.
Aeolian sand extends 2 to 3 kilometers into the uplands and
parallels the extensive high terrace east of the Iowa River.
Aeolian sand is not present in the eastern half of the up
lands adjacent to the intermediate terrace.
West Liberty I transect
The West Liberty I transect is located in the West
Liberty SW USGS topographic quadrangle and consists of
cores 52BE120, 52B105, and 52BE122 (Figure 13). The transect
originates on the high terrace east of the Iowa River and
ascends to the uplands between the Iowa and Cedar River
valleys. The stratigraphie distribution of materials and
weathering zones for the cores of the West Liberty I transect
is shown in Figure 14. Detailed profile descriptions for

Figure 13. A portion of the USGS West Liberty SW quadrangle map showing the location of the cores of the West Liberty I transect

R. 6 W. R. 5 W. \ IOWA CITY 4 MI. SCALE 1:24000
# 52B217-, i
. E BM
i 52BE120
CJ
[TraHér ParW - •
k 52B105
ui

Figure 14. Stratigraphie cross seetion of the West Liberty I transect

59
225—1
G.
i 215— H
210 —
205 __
0 •
100 .
200 —
300 —
400-
500 —
600""
700"
800""
900 —
1000—
1100—
52BE120
lllllllllllil
52B105 52BE122
I I Wisconsin loess
Wisconsin aeolian sand
P Z Z) Wisconsin loess and aeolian sand
1 Sand
Alluvium
Basal Wisconsin paleosol
Peat and peaty muck
Late Sangamon paleosol
Yarmouth-Sangamon paleosol

60
each core are given in Appendix A and selected laboratory
data are in Appendix B.
Core 52BE120 is located on the high terrace on a dune
like feature approximately 225 meters from the low terrace
of the Iowa River. It consists of 147 cm of loess, 49 cm of
loess which has a high sand content, 17 cm of intercalated
loess and sand, 184 cm of aeolian sand which contains thin
bands of loess, and a Basal Wisconsin loess-derived paleosol.
Below the Basal Wisconsin paleosol, a thick sequence of
alluvial sediments is composed of 244 cm of stratified allu
vial sands, 35 cm of loamy sediments which contain thin
bands of sand, 117 cm of alluvial sediments which are silt
loam in texture, 6i cm of mucky peat, and a paleosol de
veloped in alluvium. The loess from 0 to 147 cm is oxi
dized, noncalcareous, and contains less than 6% sand. The
loess from 147 cm to 196 cm is oxidized, noncalcareous, and
has a sand content which ranges from 8.9% to l8.2%. The
loess from 196 cm to 213 cm is oxidized, noncalcareous, and
contains 25.4% sand. Thin intercalated bands of sand are
also present in this zone. The aeolian sand from 213 cm to
397 cm is oxidized, noncalcareous, and contains thin bands
of loess. From 213 cm to 299 cm the fine and very fine sand
account for 42.8% and 39.7%, respectively, of the total sand
fraction. This zone also contains 17.3% medium sand and a
trace amount of coarse sand (Table 3). The presence of a
Basal Wisconsin loess-derived paleosol from 397 cm to 427 cm

51
indicates that the overlying sediments are aeolian in origin.
The sand zone from 427 cm to 671 cm is oxidized and noncal-
careous. From 427 cm to 459 cm the very fine and fine sand
account for 50.6% and 37.4%, respectively, of the total sand
fraction. This zone also contains 11.7% medium sand and a
trace amount of coarse and very coarse sand (Table 3). The
sand size distribution of the zone from 427 cm to 459 cm is
similar to that of the overlying aeolian sand. However, this
zone is interpreted as alluvial in origin based on stratifica
tion and cross-bedding of the sands. A sand zone from 549 cm
to 671 cm is less sorted and contains 3l.5% fine sand, 24.9%
coarse sand, 18.2% very fine sand, 14.2% very coarse sand,
and 11.2% medium sand (Table 3). The sediments from 67i cm
to 706 cm are oxidized, calcareous, and loam in texture.
The sediments contain thin intercalated bands of sand. The
sediments from 706 cm to 737 cm are unoxidized, calcareous,
and silt loam in texture. The sediments from 737 cm to 787
cm are reduced, calcareous, and silt loam in texture. The
sediments from 787 cm to 823 cm are reduced, noncalcareous,
and silt loam in texture. The peat zone from 823 cm to 884
cm has a total carbon content of 40.9% on an air-dry weight
basis. The zone from 884 cm to 991 cm contains a paieosol
developed in alluvium.
The clay content of the paleosolum ranges from 27.2%
in the Alb horizon to a maximum of 37.8% in the B2t horizon.
The clay content then decreases with depth to a minimum of

62
33.1% in the B3b horizon. The fine silt content of the
paleosolum decreases with depth from a maximum of 37.1% in
the Alb horizon to a minimum of 14.7% in the B3tb horizon.
The coarse silt content of the paleosolum decreases with
depth from a maximum of 22.8% to a minimum of 15.7% in the
B3tb horizon. The sand content increases with depth and
ranges from 9.3% in the A12b horizon to 36.5% in the B3tb
horizon. The depth distributions of the clay, silt, and
sand fractions-for the paleosol are shown in Figure 15. The
soil pH increases with depth and ranges from 7.5 in the Alb
horizon to 8.0 in the B3tb horizon.
The maximum total phosphorus (TP) content of the paleo
solum is 295 ppm and is in the Alb horizon. Below this hori
zon the TP content decreases with depth to a minimum of 195
ppm in the B2ltb horizon. The TP content increases with
depth to a maximum of 289 ppm in the lower B3tb. The TP
content of the paleosol is low and is comparable to the TP
content of the paleosol developed in alluvium in core
58BE107 of the Gladwyn transect.
The available phosphorus (AP) content of the paleosolum
is also low. The low AP content is probably due to the high
pH and/or poor natural drainage. The effect of high pH and
poor natural drainage on AP distributions has been discussed
by Runge and Riecken (1966), Smeck (1973), Tembhare (1973),
and Miller (1974). Available phosphorus is highest in the
Alb horizon (44.5 ppm) and decreases with depth to a minimum

PARTICLE SIZE FRACTIONS (cumulative %)
FINE SILT COARSE SILTX SAND CLAY
Figure 15. Depth distributions of pH, clay, fine silt, coarse silt, and sand in the paleosol developed in alluvium in core 52BE120

64
of 2.0 ppm in the B3t horizon.
A site containing a paleosol developed in alluvium,
located approximately 2 kilometers north of core 52BE120,
has been radiocarbon dated. A peat sample above the paleosol
was radiocarbon dated at 21,960 ± 480 years before present
by the Lake Calvin Bicentennial Study. The site was identi
fied as site S76-IA-103-1 in that study. Core 52BE120 dif
fers stratigraphically from S76-IA-103-1 in that it contains
a thick zone of aeolian sand and alluvial sand. Core 52BE120
is located on a large dune-like feature which may account
for the thicker zone of aeolian sand. The close proximity
of core 52BE120 to the low terrace may explain the presence
of alluvial sands above the peat and paleosol. The alluvial
sediments may represent overbank deposits from the Iowa
River. A similar sequence of alluvial sands above the paleo
sol developed in alluvium was identified in core 92BE28.
Core 92BE28 is on a high terrace remnant adjacent to the
English River in Washington County. The processes responsible
for the deposition of the alluvial sand in core 92BE28 are
unclear. The sands may represent overbank deposits, alluvial
fan deposits, or sediments carried down preexisting drainage-
ways on the paleosurface. The hypothesis that the alluvial
sands are derived from the uplands appears invalid for core
52BE120 because it is located several kilometers from the
uplands.
Core 52B105 is located in the uplands on an interfluve

65
divide adjacent to the high terrace. It consists of 320 cm
of loess, 13 cm of loess which contains thin intercalated
bands of sand, 96 cm of loess which has a high sand content,
84 cm of loess, a Basal Wisconsin loess-derived paleosol and
a Late Sangamon paleosol developed in pedisediment and
glacial till. A stone line separates the pedisediment and
glacial till. The loess from 0 to 185 cm is oxidized, non-
calcareous, and contains less than 6% sand. The loess from
l85 cm to 320 cm is oxidized, noncalcareous, and ranges in
sand content from 5.2% to 11.5%. The loess from 320 cm to
333 cm contains numerous thin, intercalated bands of sand.
The loess from 333 cm to 345 cm is oxidized, noncalcareous,
and contains 15.7% sand. The loess from 345 cm to 429 cm is
oxidized, calcareous, and ranges in sand content from 15.3%
to 9.2%. The loess from 429 cm to 513 cm is deoxidized,
calcareous, and ranges in sand content from 4.8% to 2.3%.
The Basal Wisconsin paleosol is neutral in reaction, silt
loam in texture, and contains 14.9% sand. The Late Sangamon
paleosol is developed in 40 cm of pedisediment which ranges
in texture from silt loam to clay loam, a 5-cm stone line,
and Pre-Illinoian glacial till.
Core 52BE122 is located in the uplands on an interfluve
of the primary divide between the Iowa and Cedar Rivers. The
core consists of 472 cm of loess, a Basal Wisconsin loess-
derived paleosol, and a truncated Yarmouth-Sangamon paleosol
developed in till-derived sediments. The loess from 0 to 409

66
cm is oxidized, noncalcareous, and contains less than 7%
sand. The loess from 409 cm to 467 cm is deoxidized, cal
careous, and contains less than 2% sand. The loess from 467
cm to 472 cm is oxidized, calcareous, and contains thin
iron-rich bands. The Basal Wisconsin paleosol is silt loam
in texture and neutral in reaction. The Yarmouth-Sangamon
paleosol ranges in texture from heavy silty clay loam to
clay and has a neutral reaction.
West Liberty II transect
The West Liberty II transect is located in the West
Liberty SW USGS topographic quadrangle and consists of
cores 52B211, 52B108, 52B107, 52B205, and 52B109 (Figure 16).
The transect originates on the high terrace east of the Iowa
River and ascends to the uplands between the Iowa and Cedar
River valleys. The stratigraphie distribution of materials
and weathering zones for the cores of the West Liberty II
transect is shown in Figure 17. Detailed profile descriptions
for each core are given in Appendix A and selected laboratory
data are in Appendix B.
Core 52B211 is located on the high terrace approximately
5 kilometers southeast of core 52BE120 of the West Liberty I
transect. The core consists of 175 cm of oxidized, noncal
careous loess which has less than 7% sand, 13 cm of deoxidized,
noncalcareous loess which has 13% sand, and 41 cm of oxidized,
noncalcareous sand which contains thin bands of loess.

Figure 16. A portion of the USGS West Liberty SW quadrangle map showing the location of the cores of the West Liberty II transect

52B107
S2B109 52B205:
52B108 7^ tl
,28212
«52B211
IT-

69
230
225 —
220
215
210
205 —
0 —
100 —1
200-
300.
400-
500-
600.
700-
§ H
i
K H
I
52B211 52B108 52B107 52B205 52B109
• Wisconsin loess Wisconsin loess and aeolian sand
|S S? Wisconsin aeolian sand
Basal Wisconsin paleosol
Late Sangamon paleosol
Yarmouth-Sangamon paleosol
Figure 17. Stratigraphie cross section of the West Liberty II transect

70
Collapse of the corehole at 229 cm prevented further
sampling.
Core 52B108 is located in the uplands on an interfluve
of the primary divide between the Iowa and Cedar Rivers.
The core consists of 290 cm of loess, 15 cm of loess which
contains thin bands of aeolian sand, 61 cm of aeolian sand
which contains thin bands of loess, 84 cm of loess, a Basal
Wisconsin loess-derived paleosol and a Yarmouth-Sangamon
paleosol developed in swale-fill sediments. The loess from
0 to 153 cm 'is oxidized, noncalcareous, and contains less
than 1% sand. The loess from 163 cm to 254 cm is oxidized,
noncalcareous, and ranges in sand content from 6,9% to 18.9%.
The loess from 254 cm to 290 cm is deoxidized, noncalcareous,
and contains 18.8% sand. The loess from 290 cm to 305 cm is
deoxidized, noncalcareous, and contains many thin inter
calated bands of sand. The aeolian sand from 305 cm to 366
cm is oxidized, noncalcareous, and contains many thin bands
of loess. The loess from 366 cm to 40l cm is oxidized, non
calcareous and contains 29% sand. The zone from 401 cm to
406 cm contains a 3-cm manganese-rich band and a 2-cm iron-
rich band. The loess from 406 cm to 450 cm is deoxidized,
calcareous, and contains less than 6% sand. The Basal Wis
consin paleosol is 99 cm thick, silt loam in texture, and
neutral in reaction. The Yarmouth-Sangamon paleosol ranges
in texture from silty clay loam to silty clay and is neutral
in soil reaction.

71
Core 52B107 is located in the uplands on an interfluve
divide. The core consists of 485 cm of loess^ a Basal Wis
consin loess-derived paleosol, and a Late Sangamon paleosol de
veloped in pedisediment and Pre-Illinoian glacial till.
The loess from 0 to 290 cm is oxidized, noncalcareous and
contains less than 6% sand. The loess from 290 cm to 389 cm
is oxidized, calcareous, and contains 5.4% sand. The loess
from 389 cm to 485 cm is deoxidized, calcareous, and con
tains less than 5.1% sand. The Basal Wisconsin paleosol is
43 cm thick, silt loam in texture, and neutral in reaction.
The Late Sangamon paleosol is developed in 33 cm of pedi
sediment and Pre-Illinoian glacial till. The paleosol
ranges in texture from heavy silty clay loam to clay and
has a slightly acid to neutral reaction.
Cores 52B205 and 52B109 are located in the uplands on
interfluve divides east of core 52B107, Core 52B205 consists
of 195 cm of oxidized, noncalcareous loess and 33 cm of de
oxidized, noncalcareous loess. Core 52B109 consists of 221
cm of oxidized, noncalcareous loess and 84 cm of deoxidized,
noncalcareous loess. The cores were collected to characterize
the Tama series in the uplands where the stratigraphie se
quence of materials does not contain an aeolian sand zone.

72
West Liberty IV transect
The West Liberty IV transect is the southernmost tran
sect located in the West Liberty SW USGS topographic quad
rangle and consists of cores 52B206 and 52B104 (Figure 18).
The transect originates on the high terrace east of the Iowa
River and ascends to the uplands between the Iowa and Cedar
River valleys. The stratigraphie distribution of materials
and weathering zones for the cores of the West Liberty IV
transect is shown in Figure 19. Detailed profile descrip
tions for each core are given in Appendix A and selected
laboratory data are in Appendix B.
Core 52B206 is located on the high terrace approximately
750 meters from the low terrace of the Iowa River. The core
consists of 150 cm of loess, 18 cm of aeolian sand which con
tains thin bands of loess, and 228 cm of sand. The loess
from 0 to 150 cm is oxidized, noncalcareous, and ranges in
sand content from 15.3% in the Ap horizon to 2.7% in the
B22t horizon. The aeolian sand from 150 cm to 168 cm is
oxidized, noncalcareous, and contains thin bands of loess.
The sand zone from 168 cm to 229 cm contains 37.8% medium
sand, 37,5% fine sand, 17.0% very fine sand, and 7.7% coarse
sand (Table 3).
Core 52B104 is located on an interfluve of the primary
divide approximately 6 kilometers from the high terrace. The
core consists of 224 cm of loess, 66 cm of aeolian sand, 274
cm of loess and Basal Wisconsin loess-derived paleosol. The

Figure 18. A portion of the USGS West Liberty SW quadrangle map showing the location of the cores of the West Liberty IV transect

52B209*
• S2B206
24-
52B208.
52BIfl4;

75
230 —f
225
220
215
210 •
205 •
200 —
0 -
100 —I
200 —
300 —
400-
500-
600—"
700—
800 —
900-—
§ 1
S
I
52B206 52B104 52B204 52B217
•
Figure 19.
Wisconsin loess
Wisconsin loess and sand
Wisconsin aeolian sand
Basal Wisconsin paleosol
Sand
Stratigraphie cross section of the West Liberty IV and Iowa City East transects

76
loess from 0 to 193 cm is oxidized, noncalcareous, and con
tains less than 6% sand. The loess from 193 cm to 224 cm
is oxidized, noncalcareous, and ranges in sand content from
7.3% to 11.8%. The aeolian sand from 224 cm to 269 cm is
oxidized and noncalcareous. The sand fraction is 40.3%
medium sand, 33.6% fine sand, 17.2% very fine sand, 8.8%
coarse, and 0.1% very coarse sand (Table 3). The aeolian
sand from 269 cm to 290 cm is oxidized, noncalcareous, and
contains thin bands of deoxidized loess. The loess from 290
cm to 305 cm is deoxidized, noncalcareous, and contains thin
bands of oxidized sand. The loess from 305 cm to 427 cm is
deoxidized, noncalcareous, and contains 12.1% sand. The
loess from 427 cm to 564 cm is deoxidized, calcareous, and
contains 11.8% sand. The Basal Wisconsin paleosol is silt
loam in texture and neutral in soil reaction. Site S76-IA-
103-2 of the Lake Calvin Bicentennial Study is located be
tween core 52B206 and 52B104 in the uplands adjacent to the
high terrace. The core from site S76-IA-103-2 consists of
162 cm of oxidized, noncalcareous loess, 422 cm of oxidized,
noncalcareous aeolian sand, 40 cm of deoxidized, noncalcareous
aeolian sand, 140 cm of deoxidized, noncalcareous loess, and
a Yarmouth-Sangamon paleosol.
The West Liberty I, II, IV, and Lone Tree transects
document the extent of aeolian sand in the upland between the
Iowa and Cedar River valleys. Table 4 summarizes the depth
to the aeolian sand zone for these transects. The West

77
Table 4. Summary of the depth to aeolian sand for cores of the West Liberty I, II, IV, and Lone Tree transects
Depth to aeolian
Landscape sand Transect Core position (cm)
West Liberty I 52BE120 High terrace 196
52B105 Upland 320
52BE122 Upland
West Liberty II 52B211 High terrace 188
52B108 Upland 305
52B107 Upland
West Liberty IV 52B206 High terrace 150
S76-IA-103-2 Upland 162
52B104 Upland 224
Lone Tree 52BE111 Upland 206
52B101 Upland 201
52B103 Upland 193
52B102 Upland
Liberty I, II, and IV transects show a general trend of in-
creasing depth to aeolian sand from west to east away from
the Iowa River. The Lone Tree transect shows a general
trend of decreasing depth to aeolian sand from west to east.
The high terraces form the western boundary of the uplands
in the vicinity of the West Liberty transects and form the
western and southern boundaries in the area of the Lone Tree

78
transect (Figure 2). The terrace south of the transect may-
have been another source area for aeolian sand and may
account for the decreasing depth to aeolian sand away from
the Iowa River.
Iowa City East transect
The Iowa City East transect is located in the Iowa City
East and West Liberty SW USGS topographic quadrangle and
consists of cores 52B204 and 52B217. The transect originates
on the high terrace east of the Iowa River and ascends to the
uplands between the Iowa and Cedar River valleys (Figure 20a).
The stratigraphie distribution of materials and weathering
zones for the cores of the Iowa City East transect is shown in
Figure 19. Detailed profile descriptions for each core are
given in Appendix A and selected laboratory data are given
in Appendix B.
Core 52B204 is located on the high terrace approximately
7 kilometers southeast of Iowa City. The core consists of
625 cm of loess, 26 cm of loess which has a high sand con
tent, a 50-cm thick Basal Wisconsin paleosol developed in
loess with a high sand content, and 122 cm of sand. The
loess from 457 cm to 549 cm is mottled, deoxidized, noncal-
careous, and contains less than 5% sand. The loess from
549 cm to 625 cm is mottled, deoxidized, calcareous, and
contains less than 6% sand. The loess from 625 cm to 651 cm
is oxidized, calcareous, and contains less than 20% sand.

Figure 20a. A portion of the USGS West Liberty SW quadrangle map showing the location of the cores of the Iowa City East transect

R.5 w. SCALE 1:24000
52B204: /
I
œ o

81
The Basal Wisconsin paleosol is yellowish brown in color,
mildly alkaline in reaction, light silt loam in texture, and
developed in loess which contains 26% sand. The sand from
701 cm to 823 cm is oxidized and calcareous. The sand
fraction is composed of 37% fine sand, 35.6% medium sand,
14.3% very fine sand, and 13,1% coarse sand (Table 3).
Core 52B204 penetrated the thickest zone of loess for
all cores collected on the high terrace in the study area.
Thin loess zones identified on the high terrace east of
Hills, Iowa, by Ruhe (1968), led him to conclude that the
high terrace fits into the latter part of the Wisconsin loess
episode. The thick zone of loess in core 52B204 and in other
cores throughout the high terrace, together with the identi
fication of a paleosol developed in alluvium below the loess,
confirms that the high terrace existed throughout the Wiscon
sin loess episode.
Core 52B217 is located in the uplands on a convex inter-
fluve. The core consists of 193 cm of oxidized, noncalcare-
ous loess. The loess from 0 to 140 cm contains less than 5%
sand and the loess from 140 cm to 193 cm contains 7.6% sand.
The site was sampled to obtain a representative Tama silty
clay loam soil from the uplands in the study area.

82
Nichols and Conesville transects
The Nichols and Conesville transects were sampled to
characterize the materials of the intermediate terrace of
the Cedar River. The Nichols transect is located in the
Nichols and Lone Tree USGS topographic quadrangles and con
sists of cores 52BB101, 70BB102, and 70BB103 (Figure 20b).
The transect originates on the intermediate terrace adjacent
to the high terrace of the Iowa River and continues eastward
toward the Cedar River. The stratigraphie distribution of
materials and weathering zones for the cores of the Nichols
transect is shown in Figure 21. Detailed profile descrip
tions for each core are given in Appendix A and selected
laboratory data are in Appendix B.
Core 52BB101 is located on the intermediate terrace
adjacent to the high terrace of the Iowa River. The core
was collected approximately 150 meters southeast of stop
No. 13 of the Geological Society of America Field Confer
ence (Ruhe, 1958), The core consists of 234 cm of alluvium
which ranges in texture from silt loam to silty clay and 82
cm of loamy sand. The alluvium from 0 to 234 cm ranges in
clay content from 18.4% to 47.4% and in sand content from
1.4% to 9.5%. The sand fraction from 234 cm to 244 cm con
tains 59.6% fine sand, 37.2% very fine sand, 2.8% medium
sand, and 0.4% coarse sand (Table 5). The zone ffrom 152 cm
to 244 cm is mildly alkaline in reaction.
Core 70BB102 is located approximately 3.8 kilometers

Figure 20b. A portion of the USGS Nichols and Lone Tree quadrangle maps showing the location of the cores of the Nichols transect

C T^ O L - ~ M mi
58NE65 58BEN4, 58BB107 '58BEN2
Ffailer Pa,h
redonia
Sewage 0<sp:sa
Columbus Junction
Columhu Columb

190
185-
180
G-
100 —
200 —
300.
400-
500 —
600—
700—
§ M
1 52BB101 70BB102 70BB103 58BB104 58BB105
g# Silty alluvium
Sandy alluvium
70BB106
Sand
Figure 21. Stratigraphie cross section of the Nichols and Conesville transects

Table 5. Distribution of sand size fractions and gravels for selected depths from cores of the Nichols and Conesville transects
Gravels Sand size fractions (microns)
>2000, 2000- 1000- 500- 250- 125-Depth % of total lOOO 500 250 125 62
Transect Core (cm) sample % of total sand fraction
Nichols
Conesville
52BB101 234-244 0.4 2.8 59.6 37.2
70BB102 203-244 3.4 40.4 46.3 9.0 0.9
70BB103 48-61 16.6 34.6 22.2 26.6 112-183 1.0 1.1 15.3 55.6 18.8 8.2
58BB104 0-28 3.1 20.2 38.6 38.1 97-137 0.1 1.8 68.6 19.8 9.7 254-264 2.6 54.9 30.2 12.3 290-300 2.0 54.4 28.6 15.0
58BB105 68-84 13.1 47.3 26.7 12.9 137-191 2.0 0.1 0.5 52.3 41.3 3.8 191-305 0.3 0.1 9.3 72.6 15.7 2.0
58BB106 0-28 0.1 28-41 0.3 41-53 0.8 69-81 0.4 0.6 8.9 46.4 37.0 6.7
191-229 1.9 2.6 21.4 42.8 27.9 3.4

87
east of core 52BB101. The core consists of 203 cm of alluvi-
xim which ranges in texture from heavy silt loam to silty clay
and 11 cm of sand. The alluvium from 0 to 203 cm ranges in
clay content from 26.8% to 44.4% and in sand content from
1.9% to 8.3%. The sand fraction from 203 cm to 244 cm con
tains 46.3% medium sand, 40,4% coarse sand, 9.0% fine sand,
3.4% very coarse sand, and 0.9% very fine sand.
Core 70BB103 is located east of core 70BB102 approxi
mately 1.5 kilometers from the present floodplain of the
Cedar River (Figure 20b), The core consists of 112 cm of
alluvium which ranges in texture from loamy sand to sandy
loam and 6l cm of sand. The alluvium from 0 to 112 cm ranges
in clay content from 7.8% to 11.9% and in sand content from
62.4% to 81.0%. The sand fraction from 112 cm to 183 cm con
tains 55.6% medium sand, 18.8% fine sand, 15.3% coarse sand,
8,2% very fine sand, and 1.1% very coarse sand. The total
sample from 112 cm to 183 cm contains 1% gravel (Table 5).
The Conesville transect is located in the Cotter and
Columbus Junction USGS topographic quadrangles and consists
of cores 58BB104, 58BB105, and 70BB106 (Figure 22). The
stratigraphie distribution of materials and weathering zones
for the cores of the Conesville transect is shown in Figure
21. Detailed profile descriptions for each core are given in
Appendix A and selected laboratory data are in Appendix B.
Core 58BB104 is located on the intermediate terrace
adjacent to the present floodplain of the Iowa River. The

Figure 22. A portion of the USGS Cotter and Columbus Junction quadrangle maps showing the location of the cores of the Conesville transect

I—
70U102 70BB103
/ L.
joroisoNi
I—
R.5W. • R.4W. ,

90
core was collected from the summit of a prominent dune-like
feature on the intermediate terrace. The core consists of
2 8 cm of fine sand, 15 cm of loamy sand, 15 cm of sand, 79 cm
of loamy sand, 36 cm of sandy loam, and 127 cm of sand. The
sand fraction from 0 to 28 cm contains 38.6% fine sand, 38.1%
very fine sand, 20.2% medium sand, and 3.1% coarse sand (Table
5). The sand fraction from 97 cm to 137 cm contains 68.6%
medium sand, 19.8% fine sand, 9.7% very fine sand, 1.8%
coarse sand, and a trace amount of very coarse sand. The
sand fraction from 254 cm to 264 cm contains 54.9% medium
sand, 30.2% fine sand, 12.3% very fine sand, and 2.6% coarse
sand. The sand fraction from 290 cm to 300 cm contains 54.4%
medium sand, 28.6% fine sand, 15.0% very fine sand, and 2.0%
coarse sand.
Core 58BB105 is located in the Cotter USGS topographic
quadrangle, approximately 2.6 kilometers east of core 5 8BB104.
The core consists of 104 cm of loamy sand, 33 cm of strati
fied sediments with a sandy loam texture, and 168 cm of
stratified sand. The sand fraction from 68 cm to 84 cm con
tains 47.3% medium sand, 26.7% fine sand, 13.1% coarse sand,
and 12.9% very fine sand. The sand fraction from 137 cm to
191 cm contains 52.3% medium sand, 41.3% fine sand, 3.8%
very fine sand, 0.5% coarse sand, and a trace amount of very
coarse sand. The total sample from 137 cm to 191 cm contains
2% gravel. The sand fraction from 191 cm to 305 cm contains
72.6% medium sand, 15.7% fine sand, 9.3% coarse sand, 2.0%

91
very fine sand, and trace amounts of very coarse sand and
gravel (Table 5).
Core 70BB106 is located in the Columbus Junction USGS
topographic quadrangle approximately 1 kilometer west of the
present floodplain of the Cedar River. The core consists
of 125 cm of sand and 180 cm of stratified sand. The entire
core contains trace amounts to small amounts of gravel. The
sand fraction from 59 cm to 8l cm contains 46.4% medium
sand, 37.0% fine sand, 8.9% coarse sand, 6.7% very fine sand,
and 0.6% very coarse sand (Table 5). The sand fraction from
191 cm to 229 cm contains 42.8% medium sand, 27.9% fine sand,
21.4% coarse sand, 3.4% very fine sand, and 2.6% very coarse
sand. The total sample from 69 cm to 8l cm and from 191 cm
to 229 cm contains a trace amount of gravel and 1.9% gravel,
respectively.
The loess-mantled Pre-Illinoian uplands, high terrace,
and the present floodplain of the Iowa River form the western
boundary of the intermediate terrace (Figure 2). The Nichols
transect is situated on the intermediate terrace where the
high terrace of the Iowa River forms the western boundary of
the intermediate terrace. The textural class of the sediments
becomes coarser from west to east across the intermediate
terrace in the Nichols transect. The textural class of the
B22 horizon of cores 52BB101, 52BB102, and 52BB103 are silty
clay, heavy silty clay loam, and sandy loam, respectively.
This trend is also evident in samples collected on the inter

92
mediate terrace along Iowa highway 22 for the Geological
Society of America Field Conference (Ruhe, 1968) and the
Lake Calvin Bicentennial Study^. The Pre-Illinoian uplands
mark the western boundary of the intermediate terrace along
Iowa highway 22.
The present floodplain of the Iowa River marks the
western boundary of the intermediate terrace along the
Conesville transect. The materials have a coarse texture
along the entire transect and range in texture from loamy
sand to sand. The variation in texture of the materials
across the intermediate terrace, the stratification of the
materials, and the presence of gravel throughout the sola
and weathering zones of several cores of the Nichols and
Conesville transects and the transect along Iowa highway 22
confirm that the materials on the intermediate terrace are
alluvial sediments. Ruhe (1968) examined the intermediate
terrace and misinterpreted the materials of the terrace as
being loess overlying terrace sediments. The sand along the
eastern boundary of the intermediate terrace was interpreted
by Ruhe (1968) as aeolian lateral facies in the loess. The
absence of loess on the intermediate terrace confirms that
the high and intermediate terrace cannot be closely related
^Warren Lynn, National Soil Survey Laboratory, Lincoln, Nebraska, personal communication, 1977.

93
in time as proposed by Schoewe (1920). Although Ruhe
(1968) considered the intermediate terrace to be loess covered,
he did not consider it to be closely related in time to the
high terrace because the intermediate terrace is inset 11 to
12 meters below the high terrace. The absence of a loess
mantle on the low and intermediate terrace indicates that
these surfaces are younger than 14,000 years before present
and suggests that they may be closely related in time.
Low, intermediate. and Iowa-Cedar terraces
East of the Iowa River there is an extensive geomorphic
surface which Schoewe (1920) named the high terrace. Schoewe
(1920) identified two extensions of the high terrace along the
east bank of the Iowa River, one in sections 24 and 25 (T77N,
R6W) and sections 19, 29, 30, 31, and 32 (T77N, R5W), and
another in sections 9, 10, 15, and 16 (T76N, R5W). On the
west bank of the Iowa River, midway between the two high
terrace extensions, Schoewe identified a low terrace remnant
located in sections 6, 7, and 8 (T76N, R5W). The elevation
of the low terrace remnant is 189 to 192 meters. The land-
forms identified by Schoewe as extensions of the high terrace
are, in fact, low terrace remnants on the east bank of the
Iowa River because the landforms are not loess covered and
are found at elevations of 189 to 192 meters.
The geomorphic surface in sections 9, 10, 15, and 16
(T76N, R5W) and in sections 24 and 25 (T77N, R6W) and 19, 29,

94
30, 31, and 32 (T77N, R5W) has been renamed a low terrace
remnant in this study. The low terrace remnant in sections
9, 10, 15, and 16 (T76N, R5w) is separated from the inter
mediate terrace of the Cedar River by Cone Marsh, a series
of oxbow lakes and cutoff channels on the present floodplain
of the Iowa River. East of Cone Marsh lies the extensive
terrace designated by Schoewe (1920) as the intermediate
terrace. Schoewe considered the intermediate terrace to be
3 to 8 meters higher in elevation than the low terrace. In
the vicinity of Cone Marsh the terrace has an elevation of
186 to 189 meters. Consequently, the intermediate terrace is
3 meters lower than the low terrace along the boundary of
Cone Marsh. Furthermore, at similar latitudes throughout the
Lake Calvin basin, the elevations of the low terrace and the
terrace identified by Schoewe (1920) as the intermediate
terrace are similar.
Although the materials which comprise the low and inter
mediate terraces are different in morphology and physical
properties, the terraces do merge with the floodplain of the
Iowa River in the vicinity of Cone Marsh and are considered
contemporaneous terraces which occupy separate river valleys.
Schoewe (1920) identified the terraces below the conflu
ence of the Iowa and Cedar Rivers as the Iowa-Cedar terrace.
Based on similar morphology, physical properties, stratigraphy,
and elevation, the intermediate and Iowa-Cedar terraces are
considered to be contemporaneous. In view of these

95
similarities, renaming of the terraces appears necessary.
The term low terrace will be retained but redefined to in
clude the landforms previously identified as the low, inter
mediate, and Iowa-Cedar terraces (Figure 23).
Columbus Junction transect
The Columbus Junction transect is located in the Cotter
USGS topographic quadrangle and consists of cores 58BEN5,
58BB107, 58BEN2, 58BEN4, and 58NE65 (Figure 24). The
transect originates on the summit of the divide between
Longs Creek and Monkey Run Creek and continues westward where
it descends to a saddle along the divide, then ascends to the
summit of the divide. The stratigraphie distribution of
materials and weathering zones for the cores of the Columbus
Junction transect is shown in Figure 25. Detailed profile
descriptions for each core are given in Appendix A and
selected laboratory data are in Appendix B,
Core 58BEN5 is located on the summit of the divide west
of the Iowa River. The core consists of 285 cm of loess,
48 cm of pedisediment, a 112-cm thick Late Sangamon paleosol
developed in pedisediment and glacial till, 96 cm of glacial
till which contains a 30-cm inclusion of paleosolic material,
53 cm of till-derived sediments, 46 cm of glacial till, a 41-
cm thick truncated Dysart paleosol and 233 cm of glacial till.
The loess from 0 to 285 cm is noncalcareous and contains
less than 5% sand. The loess from 0 to 61 cm is oxidized and

J O H N S O N ,
S C O T T
B o r a e r
5rV M U S C A T I N E
Alluvium
Low terrcce
High terrace LOUISA
LAKE CALVIN
Figure 23. Revised surface (1974)
map of the Lake Calvin region; lowan from Ruhe et al. (1968) and Miller

Figure 24. A portion of the USGS Cotter quadrangle map showing the location of the cores of the Columbus Junction transect

Lake
58BB10^ 58BB104
70BB106
500
\ 27 29:#.

99
225 •
220
215
210 •
0 n
100 —I
200 —
300 —
400-
500-
600-
700—
800——
900 —
1000—
58BEN5 58BB107
I
58BEN2 58BEN4
I • Wisconsin loess
Basal Wisconsin paleosol
Pedisediment
Late Sangamon paleosol
Pliiiil Pre-Illlnolan till
Dysart paleosol
Yarmouth-Sangamon paleosol
58NE65
Figure 25. Stratigraphie cross section of the Columbus Junction transect

100
the loess from 61 to 285 cm is deoxidized. The pedisediment
from 285 cm to 333 cm is oxidized, noncalcareous, and ranges
in sand content from 16,5% to 29.4%, The truncated paleosol
from 333 cm to 445 cm is developed in 20 cm of pedisediment
and 92 cm of glacial till. The paleosol is brown and
yellowish brown in color, neutral in reaction, and ranges in
texture from light clay loam to clay. The segment of
paleosol-like material from 445 cm to 475 cm is olive gray
in color, neutral in reaction, and silty clay in texture.
The material is interpreted as paleosol-like material in
corporated into the underlying till. The contrasting color,
low sand content, and abrupt boundaries suggest that it is
not related to the superjacent paleosol developed in glacial
till. The glacial till from 475 cm to 506 cm is mottled,
oxidized, calcareous, and loam in texture. The glacial till
from 506 cm to 526 cm is reduced, calcareous, and clay loam
in texture. The glacial till from 526 to 541 cm is mottled,
oxidized, calcareous, and heavy loam in texture. The till or
till-derived sediments from 541 cm to 594 cm are reduced,
calcareous, and silty clay loam in texture, except for a zone
from 551 cm to 559 cm which is noncalcareous and heavy silty
clay loam in texture. The glacial till from 594 cm to 640 cm
is jointed, oxidized, calcareous, and loam in texture. The
truncated paleosol from 640 cm to 681 cm is brown and yellow
ish brown in color, neutral in reaction, clay in texture,
and developed in glacial till. The glacial till from 681 cm

lOl
to 914 cm is mottled, oxidized, calcareous, and ranges in ^
texture from loam to light loam. The glacial till in core
58BEN5 is considered to be an undifferentiated till of the
Wolf Creek Formation.
Core 58BB107 is located on the saddle of the divide
west of core 58BEN5. The core consists of 330 cm of loess,
a 38-cm thick Basal Wisconsin paleosol, a l65-cm thick Late
Sangamon paleosol, 31 cm of glacial till, a 20-cm thick in
clusion of paleosol-like material, and 56 cm of glacial till.
The loess from 0 to 330 cm is noncalcareous and contains
less than 4% sand. The loess from 0 to 48 cm is oxidized
and the loess from 48 cm to 330 cm is deoxidized. The Basal
Wisconsin paleosol from 330 cm to 368 cm is developed in a
mixture of loess and sediment, is neutral in reaction, and
ranges in sand content from 17.8% to 22.8%. The paleosol
from 368 cm to 533 cm is developed in 89 cm of pedisediment
and 76 cm of glacial till. The segment of paleosol from 368
cm to 457 cm is dark brown, very dark grayish brown, and
grayish brown in color, neutral in reaction, and ranges in
texture from light clay loam to light clay. The segment of
paleosol from 457 cm to 533 cm is grayish brown in color,
neutral in reaction, and light clay loam in texture. The
glacial till from 533 cm to 564 cm is mottled, oxidized, non-
calcareous, and loam in texture.
The material from 564 cm to 584 cm is interpreted as an
inclusion of paleosol-like material in the glacial till based

102
on the abrupt contact of the material with the subjacent
till. An alternate hypothesis would be to consider the
material as an incipient paleosol. The glacial till from 584
cm to 640 cm is jointed, mottled, oxidized, calcareous, and
loam in texture.
Core 5 8BEN2 is also located on the saddle of the divide
approximately 380 meters west of core 5 8BB107. The core con
sists of 285 cm of loess, a 5-cm thick iron-rich band, a
lO-cm thick Basal Wisconsin loess-derived paleosol, a l55-cm
thick Late Sangamon paleosol, and 398 cm of glacial till.
The loess from 51 cm to 147 cm is mottled, deoxidized, non-
calcareous, and contains less than 5% sand. The loess from
147 cm to 285 cm is deoxidized, calcareous, and ranges in
sand content from 4.3% to 10.6%, The iron-rich band from
285 cm to 290 cm is oxidized, noncalcareous, and contains
1.7% sand. The Basal Wisconsin loess-derived paleosol has a
light silt loam texture and neutral soil reaction. The Late
Sangamon paleosol from 300 cm to 455 cm is developed in 119
cm of pedisediment and 36 cm of glacial till. The paleosol
from 300 cm to 419 cm is dark gray and gray in color, neutral
in reaction, and ranges in texture from silt loam to light
loam. The paleosol from 419 cm to 455 cm is strong brown in
color, neutral in reaction and light clay loam in texture.
The glacial till from 455 cm to 483 cm is jointed, mottled,
oxidized, noncalcareous, and loam in texture. The glacial
till from 483 cm to 577 cm is jointed, oxidized, noncalcareous.

103
and loam in texture. The glacial till from 549 cm to 577 cm
is jointed, oxidized, and noncalcareous, but contains secon
dary calcium carbonate on the faces of joints. The glacial
till from 577 cm to 853 cm is jointed, oxidized, calcareous,
and loam in texture.
Core 58BEN4 is located on the summit of the divide,
upslope from core 58BEN2 (Figure 24). The core consists of
323 cm of loess, a 2-cm Basal Wisconsin loess-derived paleo-
sol, and a 528-cm thick Yarmouth-Sangamon paleosol. The
loess from 0 to 323 cm is noncalcareous and contains less
than 4% sand. Within the loess, the zone from 0 to 56 cm
is oxidized and the zone from 56 cm to 323 cm is mottled and
deoxidized. The Basal Wisconsin loess-derived paleosol is
dark grayish brown in color, heavy silt loam in texture,
neutral in reaction, and contains less than 2% sand. The
Yarmouth-Sangamon paleosol is gray, dark gray, and dark
grayish brown in color, neutral in reaction, ranges in tex
ture from heavy silty clay loam to light silty clay, and is
developed in swale-fill sediments.
Core 5 8NE65 is located on the summit of the primary
divide approximately 4 meters higher in elevation than core
58BEN4. The core consists of 292 cm of loess, a 66-cm thick
Basal Wisconsin paleosol developed in a mixture of loess and
sediments, and a 343-cm thick Yarmouth-Sangamon paleosol
developed in till-derived sediments and glacial till. The
loess from 86 cm to 279 cm is mottled, deoxidized, and

104
noncalcareous. The Basal Wisconsin paleosol is yellowish
brown in color, silt loam in texture, and neutral in reaction.
The Yarmouth-Sangamon paleosol from 358 cm to 701 cm is de
veloped in 102 cm of till-derived sediments and 241 cm of
glacial till. The paleosol is similar in morphology to
Yarmouth-Sangamon paleosols on better drained positions of the
the Yarmouth-Sangamon surface described by Ruhe et al. (1967).
The segment of the paleosol developed in till-derived sedi
ments is dark grayish brown and dark gray in color, neutral
in reaction, and ranges in texture from light silty clay loam
to light silty clay. The segment of paleosol from 460 cm to
701 cm is brown, dark yellowish brown, yellowish brown, and
strong brown in color, loam to heavy clay loam in texture,
and developed in undifferentiated glacial till of the Wolf
Creek Formation. Oxidized and unleached glacial till was
penetrated at a depth of 1006 cm.
The Pleistocene stratigraphie framework for southeastern
Iowa has been outlined by Hallberg et al. (1980a) and is
shown in Table 6. The Pre-Illinoian glacial tills were
deposited by glaciers which moved through Iowa, whereas the
Illinoian age glacial till was deposited by the Lake Michigan
lobe which moved through Illinois into eastern Iowa (Hallberg
et al., 1980a, 1980b; Wickham, 1980). The differences in
provenance of the glacial tills result in differences in the
mineralogy and physical properties of the glacial deposits.
The glacial deposits are recognized and correlated by their

Table 6. Present Pleistocene stratigraphie nomenclature for eastern Iowa (from Hallberg et al., 1980a)
Time stratigraphy- Rock stratigraphy Soil stratigraphy
WISCONSINAN STAGE Wisconsinan loess
Basal loess sediments and peat' Basal loess Paleosol
SANGAMON STAGE
ILLINOIAN STAGE
YAEMOUTH STAGE
PRE-ILLINOIAN STAGES
undifferentiated
I (0 -H XJ D Q) dJ 4J m m
-H
0 a 0) m k 01 <D c rd (w m -H
o m
CO 0) >H s
Unnamed sediments; includes Sangamon & Late Sangamon Pedisediment and Alluvium; and undifferentiated sediments
Sangamon and Late-Sangamon Paleosols
GLASFORD FORMATION Kellerville Till Member, superglacial and subglacial-basal till facies
WOLF CREEK FORMATION (including unnamed, undifferentiated sediments)
Yarmouth Paleosol
Hickory Hills Till Member
Aurora Till Member
Winthrop Till Member
Dysart Paleosol
Franklin Paleosol
Westburg Paleosol
ALBURNETT FORMATION unnamed sediments, unnamed till members.
§
i ri! H CO O I 01
O (0 SOh
G
^Informal names,

106
physical stratigraphy, pebble lithologies, quantitative char
acterization of their clay mineralogy, particle size distribu
tion, matrix carbonates, and sand fraction lithologies
(Hallberg et al., 1980a). The glacial till units in Iowa
and Illinois have been differentiated on the basis of their
clay minéralogie composition.
Hallberg et al. (1980a), Wickham (1980), Lineback (1979),
and Willman and Frye (1970) have found that the clay size
fraction of Illinoian age till (Glasford Formation) has
higher percentages of illite than the quantity of kaolinite
and chlorite. The clay size fraction of Pre-Illinoian tills
(Wolf Creek Formation and Alburnett Formation) nearly always
has higher percentages of kaolinite plus chlorite than
illite. The amounts of the clay mineral species for the
Illinoian (Glasford Formation) and Pre-Illinoian tills (Wolf
Creek Formation and Alburnett Formation) have been summarized
by Hallberg et al. (1980a) and are shown in Table 7.
The carbonate materials in the matrix of tills is a
result of the incorporation of calcareous rock materials
in the till. The nature and amount of carbonate materials
present is dependent upon many complex factors but the prove
nance of the tills is a major factor. The Kellerville Till
Member of the Glasford Formation has matrix carbonate
(calcite/dolomite) ratios of less than 0.40, whereas 99% of
all Wolf Creek and Alburnett Formation till samples analyzed
by the Iowa Geological Survey have calcite/dolomite ratios

107
Table 7. Summary of clay mineralogy for tills in southeast Iowa (data from Hallberg et al., 1980a)
Clav mineralogy^
Ex. % 111. % K+C. %
Mean ± s.d. Mean ± s.d. Mean ± s.d.
Illinoian Till
Glasford Formation - Kellerville Till Member
n=l50 (IGS)b 46 ± 7.6 34 ± 6.3 n=52 (ISGS) 49 ± 9.8 32 ± 9.0
Pre-Illinoian Till
Wolf Creek Formation - all till samples
n=125 (IGS) 59 ± 3.3 18 ± 2.6 n=44 (ISGS) 60 ± 5.6 19 ± 3.3
Alburnett Formation - all till samples
n=12 (IGS) 44 ± 5.7 24 ± 3.5 n=l8 (ISGS) 45 ± 4.3 25 ± 3.2
^Ex, expandable clay minerals (smectite); 111, illite; K+C, kaolinite plus chlorite.
^IGS, analysis by Iowa Geological Survey; ISGS, analysis by Illinois State Geological Survey.
20 ± 3.5 19 ± 2.9
23 ± 2.5 21 ± 2.7
32 ± 4.L 30 ± 3.1

108
greater than 0.35 (Kemmis and Hallberg, 1980).
The clay mineralogy, calcite content, dolomite content,
calcite/dolomite (C/D) ratio, and total carbonate content
were determined on till samples from the Columbus Junction
transect. The clay mineralogy of the till samples from the
Columbus Junction transect is shown in Table 8. The percent
ages of the various clay mineral species were estimated using
a semiquantitative method outlined by Hallberg et al. (1978b).
The samples contain an overall average content of 60.2%
expandable clay minerals (smectite), 18.8% illite,
and 21.0% kaolinite plus chlorite. The percentages
of the various clay minerals in the samples are within the
limits of the Wolf Creek Formation as identified by Hallberg
et al. (l980a) (Table 7). The kaolinite plus chlorite con
tent of the till samples is significantly higher (^o,01,1,34
= 10.71**) than the illite content. The Kellerville Till
Member of the Glasford Formation sampled in Iowa has an aver
age illite content of 34% (Table 7). The till samples from
the Columbus Junction transect average 18.8% illite (Table 8).
The till in the cores of the Columbus Junction transect is
interpreted as part of the Wolf Creek Formation based on the
higher content of kaolinite plus chlorite than illite and
the low illite content of the till.
Calcite content, dolomite content, calcite/dolomite
ratio (C/D), and total carbonate content were determined on
samples from the Columbus Junction transect. In core 58BEN5

109
Table 8, Summary of clay mineralogy for cores of the Columbus Junction transect
Clay mineralogy
Core Depth (cm)
Expandables mite %
Kaolinite & chlorite
58BEN5 475-506 58 20 22 526-541 56 22 22 559-594 70 14 16 594-640 56 21 23 800-851 54 23 23 851-914 55 22 23
58BEN2 483-549 65 15 20 549-577 62 18 20 577-625 60 19 21 635-648 61 19 20 671-701 61 18 21 843-853 60 19 21
58BB107 457-475 62 17 21 475-493 63 18 19 564-584 62 18 20 584-610 60 19 21 610-625 60 18 22 625-640 59 18 23
Mean 60.2 18.8 21.0
SD 3.8 2.3 1.8
110
the till from 187 cm to 234 cm has a C/D ratio which ranges
from 0.27 to 0,39 and a total carbonate content which ranges
from 3.9% to 13.6% (Table 9). The till from 594 cm to 914 cm
has a C/D ratio which ranges from 0.38 to 0.60 and a total
carbonate content which ranges from 11.3% to 18.7%. The
till at the base of core 58BB107 has a C/D ratio which
ranges from 4.3 to 8.4 and a total carbonate content which
ranges from 6.4% to 8.8%. The till at the base of core
58BEN2 has a C/D ratio of 1.4 to 2.8 and a total carbonate
content of 1.2% to 10.4%.
About 95% of the Pre-Illinoian tills sampled by the Iowa
Geological Survey to this date have C/D ratios higher than
0.40 and 99% are higher than 0.35. Cores 58BEN5, 58BB107,
and 58BEN2 are interpreted as Pre-Illinoian till and members
of the Wolf Creek Formation because their C/D ratios are
greater than 0.40. The C/D ratios for the till from 475 cm
to 594 cm in core 58BEN5 are borderline values for Pre-
Illinoian till but their clay mineralogy suggests they are
Pre-Illinoian.
The Columbus Junction transect traverses the area de
scribed by Schoewe (1920) as a sag in the divide and con
sidered by Schoewe to be Leverett's (l899) channel and the
outlet of Lake Calvin. No stratigraphie evidence of any
fluvial sediments were found in cores 5 8BB107 or 58BEN2 of
the Columbus Junction transect. The transect consisted of
loess-covered Late-Sangamon paleosols developed in pedisedi-

Ill
Table 9. Summary of the percentages of calcite and dolomite, calcite/dolomite ratio, and total carbonate content for cores of the Columbus Junction transect
Depth % % C/D Total Core (cm) calcite dolomite ratio carbonate
58BEN5 475-506 2.8 10.4 0.27 13.2 506-526 2.0 5.7 0.35 7.7 526-541 1.9 6.1 0.31 8.0 541-551 3.8 9.8 0.39 13.6 559-594 1.1 2.8 0.39 3.9 594-640 3.5 7.8 0.38 11.3 681-719 4.2 9.5 0.44 14.7 719-754 4.2 9.3 0.45 13.5 754-800 4.1 11.1 0.37 15.2 800-851 5.3 11.3 0.47 16.6 851-914 7.0 11.7 0.60 18.7
58BB107 584-610 5.2 1.2 4.3 6.4 610-625 7.6 1.2 6.3 8.8 625-640 7.6 0.9 8.4 8.5
58BEN2 549-577 0.7 0.5 1.4 1.2 577-625 6.4 4.0 1.6 10.4 635-648 5.4 1.9 2.8 7.3
92BE102 216-277 2.9 5.4 0.54 8.3
ment and till (cores 58BEN5, 58BB107, and 58BEN2) and loess-
covered Yarmouth-Sangamon paleosols developed in swale-fill
sediments, till-derived sediments, and till (cores 58BEN4
and 58NE65). If Lake Calvin existed, the saddle in the
divide south and west of Columbus Junction was not its out
let. The till deposits in the area around Columbus Junction
are recognized as Pre-Illinoian till based on the identifica
tion of Late Sangamon and Yarmouth-Sangamon paleosols and the

112
clay mineralogy and calcite/dolomite ratios of the till.
Schoewe (1920) considered the till in the vicinity of
Columbus Junction to be Illinoian in age. Hallberg et al.
(1980a, 1980b) have investigated the Illinoian till in Des
Moines County, Henry County, and southern Louisa County.
A current study involved with the Illinoian terminus and
Leverett's channel has identified the Kellerville Till Member
of the Glasford Formation west of the Iowa River in the
vicinity of Longs Creek in Louisa County (Gerald Nott,
graduate student. Department of Geology, University of Iowa,
Iowa City, Iowa, personal communication).
Pédologie Investigations in the Lake Calvin Region
A total of 23 soil profiles were examined from the study
area and are listed in Table lO. Additional information in
Table lO includes the transects from which the profiles were
obtained, the profile (core) number, soil type, landscape
position, parent material, and the depth to sand or other
contrasting parent material for each of the soil profiles.
Eighteen well-drained soil profiles were obtained from cores
of the stratigraphie transects. The 18 soil profiles con
sist of 12 Tama soil profiles,five Clinton soil profiles,
and one Inton soil profile. The remaining five soil profiles
compose the West Liberty III transect. This transect has
three somewhat poorly drained soils, one poorly drained soil,
and one very poorly drained soil.
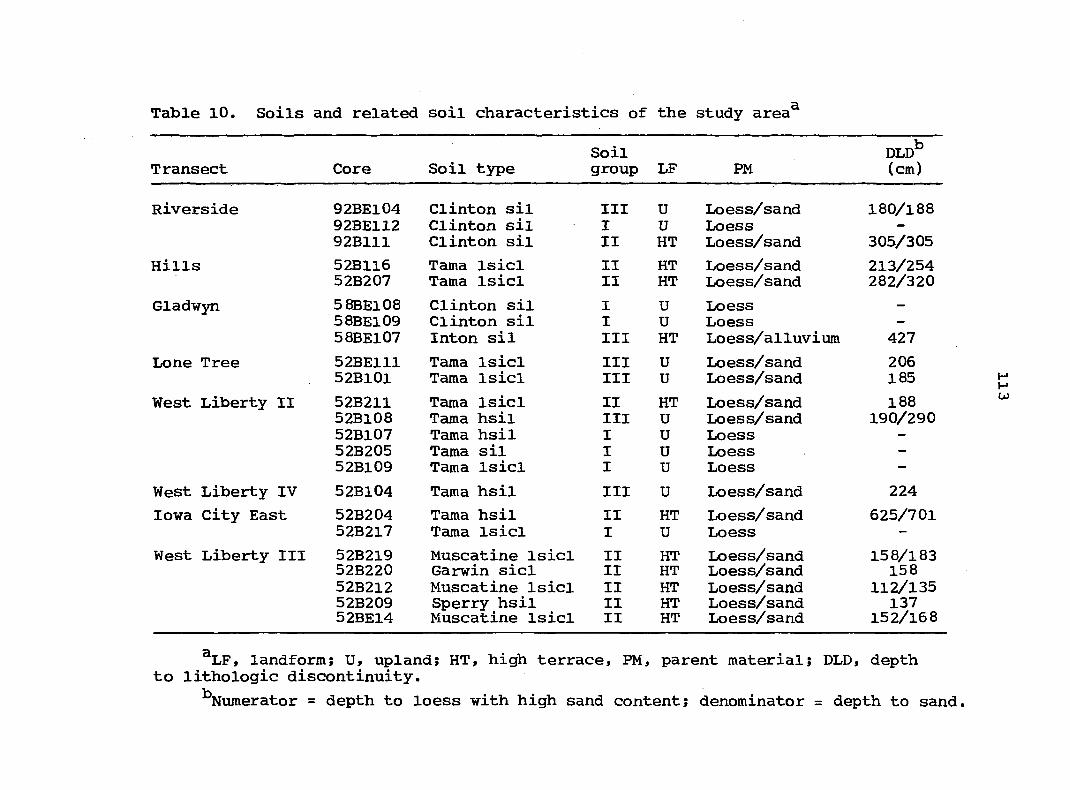
Table 10. Soils and related soil characteristics of the study area^
Soil DLD^ Transect Core Soil type group LF PM (cm)
Riverside 92BE104 Clinton sil III U Loess/sand 180/188 92BE112 Clinton sil I U Loess -
92B111 Clinton sil II HT Loess/sand 305/305
Hills 52B116 Tama Isicl II HT Loess/sand 213/254 52B207 Tama Isicl II HT Loess/sand 282/320
Gladwyn 5 8BE108 Clinton sil I U Loess -Gladwyn 58BE109 Clinton sil I U Loess -
58BE107 Inton sil III HT Loess/alluvium 427
Lone Tree 52BE111 Tama Isicl III U Loess/sand 206 52B101 Tama Isicl III U Loess/sand 185
West Liberty II 52B211 Tama Isicl II HT Loess/sand 188 52B108 Tama hsil III U Loess/sand 190/290 52B107 Tama hsil I U Loess -
52B205 Tama sil I U Loess -
52B109 Tama Isicl I U Loess -
West Liberty IV 52B104 Tama hsil III U Loess/sand 224
Iowa City East 52B204 Tama hsil II HT Loess/sand 625/701 52B217 Tama Isicl I U Loess -
West Liberty III 52B219 Muscatine Isicl II HT Loess/sand 158/183 West Liberty III 52B220 Garwin sicl II HT Loess/sand 158 52B212 Muscatine Isicl II HT Loess/sand 112/135 52B209 Sperry hsil II HT Loess/sand 137 52BE14 Muscatine Isicl II HT Loess/sand 152/168
^LF, landform; U, upland; HT, high terrace, PM, parent material; DLD, depth to lithologie discontinuity.
^Numerator = depth to loess with high sand content; denominator = depth to sand.

114
West Liberty III transect
The West Liberty III transect is located in the West
Liberty SW USGS topographic quadrangle and consists of
profiles 52BE14, 52B209, 52B212, 52B219, and 52B220. Refer
to Figures 16 and 18 for the location of the West Liberty III
profiles. Detailed descriptions for each profile are given
in Appendix A and selected laboratory data are given in
Appendix B.
Soil groups
One objective of this study was to compare the proper
ties of soils developed on the high terrace geomorphic sur
face to soils developed on stable upland landscape positions
in the Lake Calvin region. The soils formed on the geo
morphic surfaces were partitioned into three groups on the
basis of their stratigraphy and parent material.
Group No. I Soil group No. I consists of well-
drained soils on gently sloping convex summits. The stra
tigraphy of soil group No. I is Wisconsin loess and Late
Sangamon and/or Yarmouth-Sangamon surfaces. The loess zone
has a low sand content and is free of intercalated aeolian
sand. Aeolian sand does not intervene between the loess and
the subjacent paleosol. Soil group No. I consists of Tama
profiles 52B107, 52B205, 52B109, 52B217, and Clinton pro
files 58BE108, 58BE109, and 92BE112.

115
Group No. II Soil group No. II consists of well-
drained soils on gently sloping convex positions on the high
terrace and soils with restricted drainage on nearly level
positions on the high terrace. Soil group No. II is char
acterized by a stratigraphie sequence of Wisconsin loess
overlying aeolian sand and/or alluvial sand, or alluvium and
a Late Sangamon paleosol developed in alluvium. The loess
superjacent to the sand ranges in sand content from 11% to
37%. Soil group No. II consists of Tama profiles 52B204,
52B116, 52B207, and 52B211, Clinton profile 92B111, and Inton
profile 58BE107. The group No. II soils with restricted
drainage consist of profiles 52B212, 52B219, 52BE14, 52B220,
and 52B209.
Group No. Ill Soil group No. Ill consists of well-
drained soils on gently sloping, convex, upland summits. The
stratigraphy of soil group No. Ill is Wisconsin loess and
aeolian sand mantled Late Sangamon and Yarmouth-Sangamon
surfaces. The loess has either bands of intercalated aeolian
sand or a zone of aeolian sand between the loess and paleosol.
Soil group No. Ill consists of Tama profiles 52B104, 52B101,
52BE111, and Clinton profile 92BE104.
Characteristics of group No. % Tama soils
Morphological characteristics The thickness of the
sola in profiles 52B107, 52B205, 52B109, and 52B217 are 117
cm, 152 cm, 147 cm, and 140 cm, respectively. The mean solum

116
thickness for the group No. I soils is 139 cm with a standard
deviation of 15.5 cm. Moderate medium prismatic structure
parting to moderate medium and fine subangular blocky and
angular blocky structure is predominant in the B horizons of
profiles 52B107, 52B205, and 52B217. Profile 52B109 is char
acterized by weak medium prismatic structure parting to
strong fine and medium angular blocky structure in the B
horizon. Profiles 52B107, 52B205, and 52B217 contain thin
patchy to thin discontinuous light gray (lOYR 7/2, dry) ped
coatings in the B horizon. Profile 52B109 contains light
gray ped coatings which range from thin patchy to medium
nearly continuous coatings.
Clay The profile distributions of the percentage of
<2 micron clay are plotted in Figures 26 and 27 for the group
No. I Tama soils. Profiles 52B107 and 52B205 have surface
horizons which are heavy silt loam in texture. The maximum
clay contents are in the B horizon, and are 35.4% and 34.1% at
a depth of 49.5 cm and 54 cm, respectively. The weighted
mean clay contents in the 25 cm to l02 cm zone are 33.8% and
32.2%. Profiles 52B109 and 52B217 have surface horizons
which are light silty clay loam in texture. The maximum clay
contents are 33.7% and 34.4% at depths of 72.5 cm and 54.5 cm,
respectively. The weighted mean clay contents of the 25 cm
to 102 cm zone are 32.3% and 33.0%, respectively. Below a
depth of 125 cm, the four soils have a very uniform clay
distribution.

117
CLAY (%) pH
S s-*'
-125 I
-175
-200 • 52B205
O 52B107
•225
Figure 26. Clay and pH depth distributions for the group No. I Tama soils, 52B205 and 52B107

118
CLAY (%) PH
-100
§
-125 g
I -150
-175
-200 A 52B109
O 52B217
-225
Figure 27. Clay and pH depth distributions for the group No. I Tama soils, 52B109 and 52B217

119
The B/A clay ratio has been used as an indicator of
horizon differentiation and profile development (McKim,
1972). The B/A clay ratio is a measurement of the propor
tion of maximum clay content in the B horizon to minimum
clay content in the A horizon. Collins (1977) has reported
B/A clay ratios for the biosequence Tama-Downs-Fayette on
stable upland positions in east central Iowa. The B/A clay
ratios were: Tama, 1.2; Downs# 1.3; and Fayette, 1.7. The
B/A clay ratios for the group No. I Tama soils are 1.45,
1.39, 1.25, and 1.27 for profiles 52B107, 52B205, 52B109,
and 52B217, respectively. The mean B/A clay ratio for the
four profiles is 1.34 with a standard deviation of O.lO.
The group No. I Tama soils have B/A clay ratios similar to
the ratio for the Downs soil reported by Collins.
Profiles 52B107, 52B205, and 52B217 meet the requirements
for an argillic horizon (Soil Survey Staff, 1975) and are
classified as Typic Argiudolls. The profiles have a 20%
increase in clay content within 30 vertical cm and the B
horizons have clay films (argillans) on ped faces and prisms.
Profile 52B109 does not meet the requirements for an argillic
horizon and is classified as a Typic Hapludoll. Miller
(1974) has also identified Tama soils in Cedar County, Iowa,
which were classified as Typic Argiudolls and Hapludolls.
Total carbon The percentage of total carbon (TC)
for the group No. I Tama soils is shown in Figure 28. The
total carbon content of the surface horizons ranges from 2.13%

120
TOTAL CARBON (%)
1.5 2.0 15
-70
-80
-90
A 52B109
• 52B205
O 52B107
O 52B217
Figure 28. Total carbon depth distributions for the group No. I Tama soils

121
to 2.40%, Profile 52B205 contains the highest TC content in
the surface horizon and profile 52B217 has the lowest TC
content in the surface horizon. However, profile 52B205
has the shallowest depth to 0.58% TC and profile 52B217 has
the greatest depth to 0.58% TC. The depth to 0.58% TC is
51 cm, 43 cm, 56 cm, and 66 cm for profiles 52B107, 52B205,
52B109, and 52B217, respectively.
pH The pH distributions for the group No. I Tama
soils are shown in Figures 26 and 27. The pH ranges from
6.8 to 7.1 in the surface horizons of profiles 52B107 and
52B205. The surface horizon pH in profiles 52B109 and
52B217 is 6.0 and 5.7. The pH minimum in profiles 52B107,
52B205, 52B109, and 52B217 is at depths of 91 cm to 117 cm,
51 cm to 61 cm, 33 cm to 41 cm, and 13 cm to 46 cm, re
spectively.
Available phosphorus Available phosphorus (AP) depth
distributions for the group No. I Tama soils are shown in
Figure 29. The minimum content of AP is 6.2 ppm, 8.3 ppm,
4.3 ppm, and 6.1 ppm at depths of 44.5 cm, 32 cm, 5l cm, and
48.5 cm for profiles 52B107, 52B205, 52B109, and 52B217,
respectively. The maximum content of AP in the B horizon is
49.6 ppm, 39.1 ppm, 33.3 ppm, and 31.0 ppm at depths of
96.5 cm, 87.5 cm, 81.0 cm, and 77.5 cm for profiles 52B107,
52B205, 52B109, and 52B217, respectively. The minimum AP
content of the solum and maximum AP content in the B horizon
are greater in the Tama profiles which have surface textures

122
AVAILABLE PHOSPHORUS (ppm)
-100
? -125
-150
-175
-200 A 52B109
• 52B205
O 52B107
O 52B217 -225
Figure 29. Available phosphorus depth distributions for the group No. I Tama soils

123
of heavy silt loam. The slightly higher AP may be related
to the differences in pH between the Tama heavy silt loam
and Tama light silty clay loam. The minimum AP content in
the solum is at a shallower depth and the maximum AP in the
B horizon is at a greater depth in the Tama profiles which
have surface textures of heavy silt loam. The depth to clay
maximum in all group No. I soils is higher in the B horizon
than the depth to AP maximum. Similar results have been re
ported by Miller (1974) and Collins (1977).
Total phosphorus Total phosphorus (TP) depth dis
tributions for the group No. I Tama soils are shown in
Figure 30. The minimum content of TP is 366 ppm, 377 ppm,
478 ppm, and 488 ppm at depths of 33 cm, 39.5 cm, 62.5 cm,
and 62 cm for profiles 52B107, 52B205, 52B109, and 52B217,
respectively. Each profile has a zone of TP eluviation and
the depth to the zone of eluviation varies with soil type.
The minimum TP content of the solum is less and at shallower
depths in the Tama heavy silt loam profiles than in the Tama
light silty clay loam profiles. The depth to the minimum TP
has been shown to be related to the native vegetation of the
soil. In soil biosequences, the zone of eluviation is shal
lowest in the forested member, deepest in the prairie, and
intermediate in the transition member (Collins, 1977; Fenton
et al., 1967; Pearson et al., 1940). The shallower depth to
the TP minimum in the Tama heavy silt loam profiles suggests
that their genesis may have been influenced more by forest

124
TOTAL PHOSPHORUS (ppm)
600 400 200
r25
-100
g
te H
I -150
^ 52B107
• 52B205
-200 ° 52B109
O 52B217
-225
Figure 30. Total phosphorus depth distributions for the group No. I Tama soils

125
vegetation than the Tama profiles with surface textures of
light silty clay loam. Subsequent to the initial decrease
of TP, the soils display a trend of increasing TP with depth
(Figure 30), The maximum content of TP in the B horizon is
607 ppm, 539 ppm, 748 ppm, and 673 ppm and is at depths of
105,5 cm, 127 cm, 141 cm, and 135 cm for profiles 52B107,
52B205, 52B109, and 52B217, respectively. The Tama heavy
silt loam profiles contain a lesser amount of TP in the B
horizon than the Tama light silty clay loam profiles and the
maximum in the B horizon is at a shallower depth in the Tama
heavy silt loam profiles. The TP content of group No. I
Tama soils increases with depth and the maximum TP is in the
C horizon. Similar results have been reported by Collins
(1977), Fenton (1956), Runge and Riecken (1956), Smith et al.
(1950), and Pearson et al. (1940). The maximum TP content of
the profiles is 5 85 ppm, 595 ppm, 766 ppm, and 70l ppm and
is at depths of 267 cm, 212.5 cm, 203 cm, and 165.5 cm, in
profiles 52B107, 52B205, 52B109, and 52B217, respectively.
Characteristics of group No. I Clinton soils
Morphological characteristics The thickness of the
solum in profiles 58BE108, 58BE109, and 92BE112 is 196 cm,
l85 cm, and 175 cm, respectively. The mean solum thickness
for the group No. I Clinton soils is 185 cm with a standard
deviation of 10.5 cm. Moderate medium prismatic structure
parting to strong and moderate fine and medium angular blocky

126
structure is predominant in the B horizons of profiles
58BE108 and 58BE109. Profile 92BE112 has weak medium pris
matic structure parting to moderate fine and medium angular
blocky structure in the upper B horizon. The lower B hori
zon has moderate medium prismatic structure parting to weak
fine and medium angular blocky structure. Profiles 5 8BE108
and 5 8BE109 have thick continuous light gray (lOYR 7/2, dry)
coatings on peds in the upper part of the B horizon and thin
patchy (lOYR 7/2, dry) coatings in the lower part of the B
horizon. Profile 92BE112 contains thin patchy (lOYR 7/2,
dry) coatings in the B horizon.
Clay The profile distributions of the percentage of
<2 micron clay are plotted in Figure 31 for the group No. I
Clinton soils. Profiles 58BE108 and 58BE109 have surface
horizons which are light silt loam in texture. Profile
92BE112 has a surface horizon which is silt loam in texture.
The maximum clay contents of profiles 58BE108, 58BE109, and
92BE112 are 40,7%, 37.6%, and 39.0% at depths of 65 cm, 62
cm, and 59.5 cm, respectively. The B/A clay ratio is 2.38 in
profile 58BE108, 2.16 for profile 58BE109, and 1.80 for pro
file 92BE112.
The B/A clay ratios of the group No. I Clinton soils
are within the range of B/A clay ratios for other Clinton
profiles sampled in southern Iowa. B/A clay ratios of
Clinton soils range from 2.43 (Bicki, 1977) for a Clinton soil
sampled in Wapello County, Iowa, to 1.69 (Luce, 1973) for a

127
CLAY (%) pH
-100
g
-125 g
I
-175
-200 A 92BE112
• 58BE109
O 58BE108 -225
Figure 31. Clay and pH depth distributions for the group No. I Clinton soils

128
Clinton soil sampled in Marion County, Iowa. The B/A
clay ratio for two Clinton profiles sampled in Washington
County, Iowa, is 2.0 (Illinois Agricultural Experiment
Station, 1955). The weighted mean clay content of the 25 cm
to 102 cm zone is 33.9%, 34.3%, and 35.4% for profiles
5 8BE108, 5 8BE109, and 92BE112, respectively. The weighted
mean clay content of the control section is 36.1%, 36.4%,
and 35.8% for profiles 58BE108, 5 8BE109, and 92BE112, re
spectively. The weighted mean clay content of the control
section in profiles 5 8BE108 and 5 8BE109 is within the range
of the official Clinton series (Soil Survey Staff, 1979).
The weighted mean clay content in the control section of the
official Clinton series ranges from 36% to 42% clay. Pro
file 92BE112 contains 35.8% clay in the control section and
is borderline to being within the range of the Clinton series.
Profiles 58BE108, 58BE109, and 92BE111 are classified as
Typic Hapludalfs (Soil Survey Staff, 1975).
Total carbon The percentages of total carbon (TC)
for the group No. I Clinton soils are shown in Figure 32.
The depth to 0.58% TC is 20 cm, 25 cm, and 23 cm for pro
files 58BE108, 58BE109, and 92BE112, respectively.
pH The pH distribution for the group No. I Clinton
soils is shown in Figure 31. The pH distribution of profiles
58BE108 and 92BE112 are similar in the upper 48 cm of the
solum. The pH of the upper 48 cm of profile 58BE109 is con
siderably higher than 58BE108 and 92BE112. Within the upper

129
TOTAL CARBON (%)
-30 •
g
A 92BE112
• 58BE109
O 58BE108
Figure 32. Total carbon depth distributions for the group No. I Clinton soils

130
48 cm, the pH ranges from 6.6 to 4.6 in profile 5 8BE108,
6.4 to 419 in profile 92BE112, and 6.9 to 6.0 in profile
58BE109. The minimum pH in the solum is at a depth of 53 cm
to 61 cm in profile 5 8BE108, 46 cm to 53 cm in profile 92BE112,
and 86 cm to 112 cm in profile 58BE109.
Available phosphorus Available phosphorus (AP)
depth distributions for the group No. I Clinton soils are
shown in Figure 33. The minimum content of AP is 14.9 ppm,
39.5 ppm, and 17.2 ppm at depths of 42 cm, 44.5 cm, and 39.5
cm, respectively, for profiles 58BE108, 58BE109, and 92BE112.
The great disparity in the amount of AP in the zone of
eluviation may be related to the pH of the 0 to 48 cm depth
and current use and management of the site. Profiles 58BE108
and 92BE112 were collected from sites in pasture while pro
file 58BE109 was collected from a cultivated field and
probably received substantially larger amounts of phosphorus
fertilizer and calcium carbonate. The maximum content of
AP in the B horizon is 50.9 ppm at a depth of 102 cm in pro
file 58BE108, 60.9 ppm at a depth of 81 cm in profile 58BE109,
and 40.9 ppm at a depth of 107 cm in profile 92BE112. Below
the zone of illuviation in profile 58BE109, the AP decreases
much more rapidly than in profiles 58BE108 and 92BE112. The
depth to the clay maximum in all group No. I Clinton soils is
higher in the B horizon than the depth to the AP maximum.
Similar results were found for the soil group No. I Tama
profiles.

131
AVAILABLE iPHÔSPHÔRUS (ppm)
-125
•150
-175
-200 A 92BE112 • 58BE109
O 58BE108 -225
Figure 33. Available phosphorus depth distributions for the group No. I Clinton soils

132
Total phosphorus Total phosphorus (TP) depth dis
tributions for the group No. I Clinton soils are shown in
Figure 34. The minimum content of TP in the zone of TP
eluviation is 295 ppm, 429 ppm, and 398 ppm at depths of
33.5 cm, 44.5 cm, and 28.0 cm for profiles 58BE108, 58BE109,
and 92BE112, respectively.
Profile 58BE109 has a substantially higher quantity of
TP in the Ap horizon than profiles 58BE108 and 92BE112. Sub
sequent to the initial decrease of TP, the soils display a
trend of increasing TP with depth to the B2 horizon, then a
slight decrease of TP in the B3 and C horizons. The maximum
content of TP in the B horizon is 616 ppm at a depth of 135
cm in profile 58BE108, 594 ppm at a depth of 142 cm in pro
file 58BE109, and 660 ppm at a depth of 143.5 cm for profile
92BE112.
The TP content of the C horizon in the group No. I
Clinton soils is 588 ppm, 531 ppm, and 629 ppm for profiles
58BE108, 5 8BE109, and 92BE112, respectively. The general
trend of TP distributions is that TP shows an increase with
depth from the B horizon to the C horizon (Godfrey, 1951;
Godfrey and Riecken, 1954; Pearson et al., 1940; Smith et al.,
1950). The group No. I Clinton profiles have a slight de
crease in TP below the maximum TP in the B horizon. Several
studies have reported TP distributions with a slight decrease
of TP in the C horizon (Collins, 1977; Runge and Riecken,
1966; Smeck, 1973). If it is assumed that the parent material

133
TOTAL raOSPHORÙS (ppm)
600 200
-100
S
-125
-150
-175 ^ 92BE112
• 58BE109
-200 O 58BE108
-225
Figure 34. Total phosphorus depth distributions for the group No. I Clinton soils

134
had a uniform phosphorus content, then it would appear that
the zone of illuviation could contain a larger quantity of
TP than the parent material.
Characteristics of group No. II Tama soils
Morphological characteristics The thickness of the
solum in profiles 52B204, 52B116, 52B207, and 52B211 is 185
cm, 173 cm, 188 cm, and 175 cm, respectively. The mean
solum thickness for the group No. II Tama soils is 180 cm
with a standard deviation of 7.4 cm. Moderate fine and very
fine subangular blocky and angular blocky structure pre
dominates in the upper part of the B horizon. Moderate
medium prismatic structure parting to weak and moderate fine
and medium angular blocky structure predominates in the
lower part of the B horizon. Profiles 52B204 and 52B116
contain thin patchy to thin discontinuous light gray (lOYR
7/2, dry) ped coatings in the B horizon. Profiles 52B207
and 52B211 do not contain light gray ped coatings in the B
horizon.
Clay The depth distributions of the percentage of
<2 micron clay for the group No. II Tama soils are shown in
Figures 35 and 36. Profile 52B204 has a surface horizon
texture of heavy silt loam. The remaining profiles have
surface horizon textures of light silty clay loam. The
maximum clay contents are 35.9% at a depth of 75 cm, 33.6%
at a depth of 62 cm, 35.2% at a depth of 62 cm, and 34.0%

135
CLAY (%) pH
-125
-175
• 52B116
O 52B204
-225
Figure 35. Clay and pH depth distributions for the group No. II Tama soils, 52B204 and 52B116

136
CLAY (%) pH
-225
70 M
-100
A % 6
A 52B207
O 52B211 A 52B211
O 52B207
Ô
Figure 36. Clay and pH depth distributions for the group No. II Tama soils, 52B207 and 52B211

137
at a depth of 72.5 cm for profiles 52B204, 52B116, 52B207,
and 52B211, respectively. The B/A clay ratio is 1.35 for
profile 52B204, 1.20 for profile 52B116, 1,27 for profile
52B207, and 1.21 for profile 52B211. The weighted mean clay
content in the 25 cm to 102 cm zone is 32.5%, 31.5%, 32.5%,
and 32.2%, respectively, for profiles 52B204, 52B116,
52B207, and 52B211. Profiles 52B204, 52B116, 52B207, and
52B211 do not meet the requirements for an argillic horizon
and are classified as Typic Hapludolls (Soil Survey Staff,
1975).
Total carbon The percentage of total carbon (TC)
for the group No. II Tama soils is shown in Figure 37. The
TC content of the surface horizons ranges from a high of
2.40% in profile 52B116 to a low of 1.83% in profile 52B207.
All profiles were collected from cultivated fields. Profiles
52B204 and 52B211 are intermediate in TC content between pro
files 52B116 and 52B207, Profiles 52B207 and 52B211 have very
similar TC depth distributions and are part of the Hills
transect. Below a depth of 50 cm the TC content changes
over a narrow range for all profiles. The depth to 0.58%
TC is 57 cm, 44.5 cm, 51 cm, and 44.5 cm for profiles 52B204,
52B116, 52B207, and 52B211, respectively.
pH The pH depth distributions for the group No. II
Tama soils are shown in Figures 35 and 36. The pH ranges
from 6.8 to 7.2 in the surface horizons of profiles 52B204,
52B116, and 52B211. The pH of the surface horizon in profile

138
TOTAL CARBON (%)
0.5 1.0 1.5 2.0 2.5
A 52B207
• 52B116
O 52B204
O 52B211
Figure 37. Total carbon depth distributions for the group No. II Tama soils

139
52B207 is 5.7. The variation in pH in the A horizon is
probably related to management practices such as fertiliza
tion. The pH minimum in profiles 52B204, 52B207, 52B116,
and 52B211 is at depths of 53 cm to 6l cm, 58 cm to 56 cm,
38 cm to 46 cm, and 69 cm to 76 cm, respectively. Below a
depth of 75 cm the pH ranges from 5.4 to 6.2 for all profiles.
Available phosphorus Available phosphorus (AP) depth
distributions for the group No. II Tama soils are shown in
Figure 38. within the zone of phosphorus eluviation, the
minimum AP content is 7.0 ppm, 6.1 ppm, 4.5 ppm, and 2.6 ppm
at depths of 57 cm, 44.5 cm, 54.5 cm, and 56 cm for profiles
52B204, 52B116, 52B207, and 52B211, respectively. The low
AP content of the surface horizon in profile 52B207 may be
related to the low pH of the surface horizon. The maximum
content of AP in the B horizon is 26.0 ppm at a depth of 102
cm in profile 52B204, 36.2 ppm at a depth of 85 cm in profile
52B115, 39.6 ppm at a depth of 107 cm in profile 52B207, and
38.1 ppm at a depth of 91.5 cm in profile 52B211. The depth
to clay maximum in all group No. II Tama soils is higher in
the B horizon than the depth to AP maximum. Similar results
were found for the soil group No. I Tama profiles. Below
the zone of maximum AP in the B horizon, profiles 52B204,
52B116, and 52B211 have similar AP distributions with depth.
Profile 52B207 contains the largest quantity of AP in the B
horizon. The AP maximum of profile 52B207 is at a greater
depth than the other profiles of the group No. II Tama soils.

140
AVAILABLE PHOSPHORUS (ppm)
-100
-125 g
I -150
-200 A 52B207 • 52B116
O 52B204
O 52B211 -225
Figure 38. Available phosphorus depth distributions for the group No. II Tama soils

141
Below the zone of maximum AP, the AP content of profile
52B207 remains several ppm higher than profiles 52B204,
52B116, and 52B211.
Total phosphorus Total phosphorus (TP) depth dis
tributions for the group No. II Tama soils are shown in
Figure 39, Within the zone of TP eluviation, the minimum
content of TP is 388 ppm, 340 ppm, 377 ppm, and 390 ppm at
depths of 57 cm, 53 cm, 54.5 cm, and 56 cm for profiles
52B204, 52B116, 52B207, and 52B211, respectively. The maxi
mum content of AP in the B horizon is 585 ppm at a depth of
172.5 cm in profile 52B204, 667 ppm at a depth of 155 cm in
profile 52B116, 703 ppm at a depth of 181.5 cm in profile
52B207, and 760 ppm at a depth of 137 cm in profile 52B211.
In profiles 52B116 and 52B211, the maximum TP content is in
the B horizon. In profiles 52B204 and 52B207, the maximum
TP content is in the C horizon (Figure 39). Below the zone
of maximum TP content, the group No. II Tama soils decrease
in TP with depth to the contact of the loamy sand or sandy
loam. The TP content of the loess superjacent to the loamy
sand or sandy loam is 525 ppm in profile 52B204, 657 ppm in
profile 52B116, 690 ppm in profile 52B207, and 663 ppm in
profile 52B211. The TP content of the loamy sand subjacent
to the loess in profiles 52B116 and 52B204 is 210 ppm and
204 ppm, respectively. The TP content of the sandy loam
subjacent to the loess in profiles 52B207 and 52B211 is 227
ppm and 30l ppm, respectively. The decrease in TP with depth

142
TOTAL PHOSPHORUS (ppm)
400 500 200
-100 g
-125
-150
A 52B207
• 52B116
-200 O 52B204 O 52B211 Cr
-225
Figure 39. Total phosphorus depth distributions for the group No. II Tama soils

143
below the maximum TP in the profile is interpreted as elavia
tion of TP due to the highly permeable underlying loamy sand
and sandy loam. The TP content of the loamy sand and sandy
loam is considered relatively high for coarse textured sedi
ments and may represent an accumulation of TP from the over
lying loess.
Characteristics of group No. II Clinton and Inton soils
Morphological characteristics The thickness of the
solum in profiles 92B111 and 58BE107 is 241 cm and 285 cm,
respectively. The mean solum thickness for the group No. II
Clinton and Inton soils is 263 cm. Profile 92B111 has strong
medium and fine angular blocky structure in the upper part
of the B horizon. The lower part of the B horizon has mod
erate medium prismatic structure parting to strong medium
angular blocky structure. Profile 58BE107 has strong medium
angular blocky structure and moderate coarse prismatic struc
ture parting to strong medium angular blocky structure in the
upper part of the B horizon. The lower part of the B horizon
has weak medium prismatic structure. Profile 92B111 has
medium continuous light gray (lOYR 7/2, dry) ped coatings in
the upper part of the B horizon and thin patchy ped coatings
in the lower part of the B horizon. Profile 58BE107 has thin
patchy to thin discontinuous light gray (lOYR 7/2, dry) ped
coatings in the B horizon.

144
Clay The depth distributions of the percentage of
<2 micron clay are plotted in Figure 40 for the group No. II
Clinton and Inton soils. The maximum clay content of profile
92B111 is lower and is at a greater depth than in profile
58BE107. Profile 92B111 has a clay maximum of 37.7% at a
depth of 76 cm and profile 58BE107 has a clay maximum of
39.2% at a depth of 55 cm. Below a depth of 90 cm, profile
92B111 contains 2% to 4% more clay throughout the solum than
profile 58BE107. The B/A clay ratio of profiles 92B111 and
5 8BE107 are 1.81 and 2.09, respectively. The B/A clay ratios
of the group No. II Clinton and Inton soils fall within the
range of B/A clay ratios for other Clinton profiles sampled
in southern Iowa (Bicki, 1977; Luce, 1973; Illinois Agricul
tural Experiment Station, 1950). The weighted mean clay con
tent of the 25 cm to 102 cm zone is 33.1% for the profile
92B111 and 34.1% for profile 58BE107. The weighted mean clay
content in the control section is 35.2% and 36.7% for profiles
92B111 and 58BE107, respectively. Profile 92B111 is theo
retically outside the range for the official Clinton series
(Soil Survey Staff, 1979). Based on the B/A clay ratio and
the maximum clay content in the B horizon, profile 92B111
will be considered a Clinton soil. The deoxidized color and
mottles in the subsoil of the Inton soil are considered
relict features. Profiles 92B111 and 58BE107 are classified
as Typic Hapludalfs (Soil Survey Staff, 1975).

145
10 CLAY (%)
20 30 pH
5J0 6.0
1
h25
-50
•75
-100
-125
-150
-175
-200
-225
•
h
Group II
9 60 58BE107 Inton
0 92BE111 Clinton
Group III
A92BE104 Clinton
Figure 40. Clay and pH depth distributions for the group No, II and III Clinton and Inton soils

146
Total carbon The percentages of total carbon (TC)
for the group No. II Clinton and Inton soils are shown in
Figure 41. The TC distribution with depth is similar for
profiles 92B111 and 5 8BE107. The TC content of the A2l
horizon in profile 5 8BE107 is higher than the TC content of
the A21 horizon in profile 92B111 but the remainder of the
solum has a very similar TC content. The sites from which
profiles 92B111 and 5 8BE107 were sampled are in pasture. The
depth to 0.58% TC is 39.5 cm for profiles 92B111 and 58BE107.
pH The pH depth distributions for the group No. II
Clinton and Inton soils are shown in Figure 40. The pH of
the surface horizons in the group No. II Clinton and Inton
soils is similar. The surface horizon of profile 92B111
has a pH of 6.8 and the surface horizon of profile 58BE107
has a pH of 5.9. However, below the surface horizon and to a
depth of 90 cm, the pH varies widely, with profile 58BE107
being considerably more acidic than profile 92B111. At a
depth of 25 cm, the pH of profile 92B111 is 6.7 and the pH
of profile 58BE107 is 4.7. Below a depth of 110 cm, profile
92B111 becomes more acidic than profile 58BE107. Below the
110 cm depth, the pH depth distribution of profile 92B111
changes over a narrower range and the pH of profile 5 8BE107
changes over a wider range. At a depth of llO cm, the pH of
profile 92B111 is 5.4 and the pH of profile 58BE107 is 5.5.
At a depth of 225 cm, the pH of profile 92B111 is 5.5 and
the pH of profile 5 8BE107 is 6.3.

147
0.5 1.0 TOTAL CARBON (%)
1.5 2.0 2.5 10 as —T 1 1
f
—1 r 1 • 1
-10 ' '
-20 ; py
•30
-40 j!:
-w
•eof
Ù
-70 Group II
• 58BE107 Inton
-80 092BE111 Clinton
Group III
-90 A92BE104 Clinton
I
Figure 41. Total carbon depth distributions for the group No. II and III Clinton and Inton soils

148
Available phosphorus The available phosphorus (AP)
depth distribution for the group No. II Clinton and Inton
profiles is shown in Figure 42. The surface horizon of
profile 92B111 contains 7.9 , ppm of AP and the surface hori
zon of profile 58BE107 contains 44.5 ppm of AP. Within the
zone of phosphorus eluviation, the minimum AP is 13.6 ppm at
a depth of 48 cm in profile 92B111 and 18.2 ppm at a depth
of 25.5 cm in profile 58BE107. Profile 92B111 has a sub
stantial loss of AP in the A22, Bl, and B2 horizons and a
substantial gain in the lower B2 horizons. The maximum con
tent of AP in the B horizon is 58.7 ppm in profile 92B111 and
57.0 ppm in profile 58BE107. The maximum content of AP in
the B horizon is at a depth of 113.5 cm in profile 92B111
and 87.5 cm in profile 5 8BE107. The depth to the clay maxi
mum in profiles 92B111 and 58BE107 is higher in the B horizon
than the depth to the AP maximum. The maximum AP content in
the B horizon and the depth to the AP maximum in profile
5 8BE107 is within the range of the maximum AP content and
the depth to the AP maximum in the group No. I Clinton soils.
The AP maximum in profile 92B111 is also within the range of
the maximum AP content of the group No. I Clinton soils, but
is at a substantially greater depth than the group No. I
Clinton soils. Below the AP maximum, the AP decreases at a
faster rate in profile 58BE107 than profile 92B111.
Total phosphorus The total phosphorus (TP) depth
distribution for the group No. II Clinton and Inton soils is

149
AVAILABLE PHOSPHORUS (ppm)
-100
§ •'
-125
-175 Group II
• 58BE107 Inton
0 92BE111 Clinton
Group III
A92BE104 Clinton
-200
-225
Figure 42. Available phosphorus depth distributions for the group No. II and III Clinton and Inton soils

150
shown in Figure 43. Within the zone of TP eluviation, the
minimum content of TP is 355 ppm and 373 ppm for profiles
92B111 and 5 8BE107, respectively. The depth to the TP mini
mum is 39.5 cm in both profiles. The maximum content of TP
in the B horizon is 643 ppm at a depth of 177.5 cm in profile
92B111 and 603 ppm at a depth of 137 cm in profile 58BE107.
In profiles 92B111 and 58BE107, the maximum TP content is in
the B horizon. Profile 92B111 has a trend of decreasing TP
content in the lower A and upper B horizons, an increase in
the B horizon to a maximum in the B32 horizon, and a gradual
decrease in TP with depth into the C horizon. A similar
trend in TP distribution was found in the group No. II Tama
profiles (Figure 39). The decrease in TP with depth is in
terpreted as eluviation of TP due to the highly permeable
underlying sandy loam. The TP maximum in profile 5 8BE107
is at the contact of the oxidized and deoxidized loess.
within the deoxidized loess, considerable variability in TP
content with depth was found (Figure 43). Similar results
were reported for TP distributions in deoxidized loess by
Bicki (1980) and Runge and Riecken (1966). Runge and
Riecken (1966) related the variability in TP to the precipita
tion of phosphorus in the mottles and iron segregations
(pipestems) in the deoxidized loess.
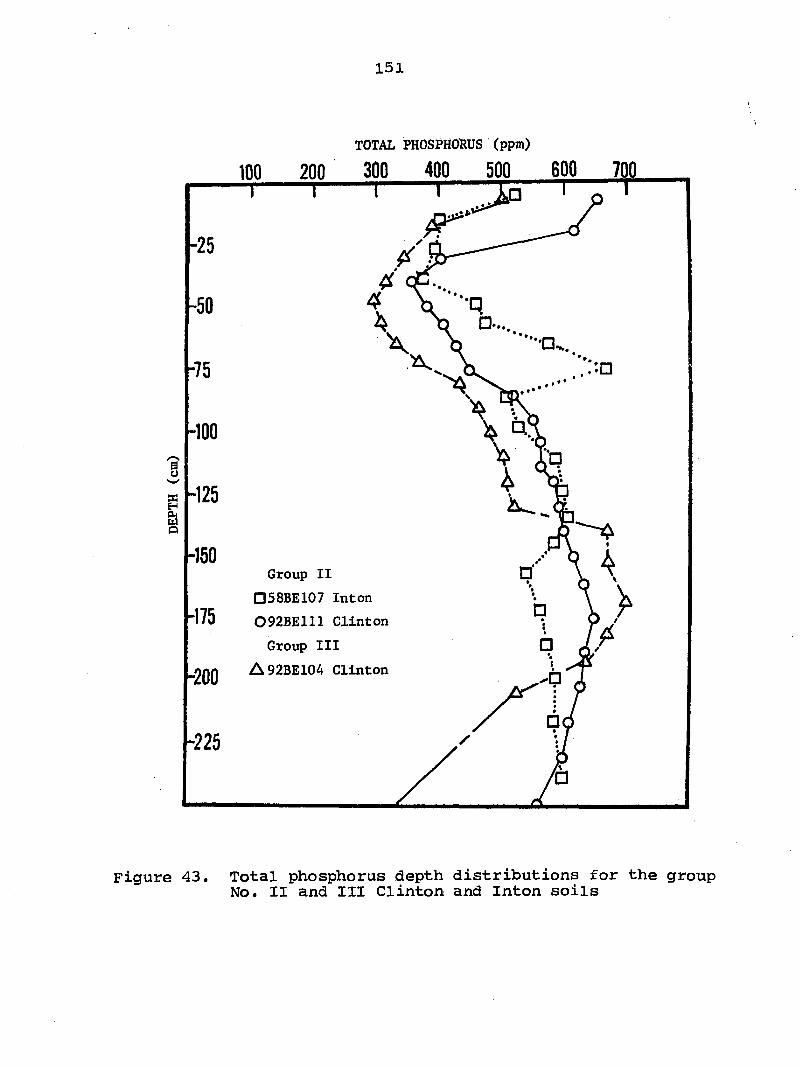
151
TOTAL PHOSPHORUS (ppm)
100 200 300 400 500 600 700.
I
-25
-50
-75
-100
-125
-150
-175
-200
-225
T T
Group II
•58BE107 Inton
092BE111 Clinton
Group III
A92BE104 Clinton
Figure 43. Total phosphorus depth distributions for the group No. II and III Clinton and Inton soils

152
Characteristics of group No. II soils with restricted drainage
Morphological characteristics The group No. II soils
with restricted drainage consists of three Muscatine profiles
(52B212, 52B219, and 52BE14), one Garvin profile (52B220),
and one Sperry profile (52B209). The thickness of the solum
in profiles 52B212, 52B219, 52BE14, 52B220, and 52B209 is 135
cm, 183 cm, 152 cm, 15 8 cm, and 137 cm, respectively. The
sola of the group No. II soils with restricted drainage are
thinner than the sola of the well-drained group No. II Tama
soils. The group No. II Muscatine soils (52B212, 52B219,
and 52BE14) predominantly have moderate fine and very fine
subangular blocky structure in the upper B horizon. Profile
52B212 has moderate medium prismatic structure in the lower
B horizon and profiles 52B219 and 52BE14 have weak coarse
prismatic structure in the lower B horizon. The Garwin soil
(52B220) has moderate fine and medium subangular blocky struc
ture and moderate medium prismatic structure parting to mod
erate medium subangular blocky structure in the upper B hori
zon. The lower B horizon has weak coarse prismatic struc
ture. The Sperry soil (52B209) has moderate medium prismatic
structure parting to moderate fine and very fine angular
blocky structure in the upper B horizon. The lower B horizon
has weak medium prismatic structure parting to weak coarse
angular blocky structure. The subsoil of the Muscatine and
Garwin soils do not meet the requirements for an argillic

153
horizon. The Muscatine soils (52B212, 52B219, and 52BE14)
are classified as Aquic Hapludolls and the Garwin soil
(52B220) is classified as a Typic Haplaquoll. The Sperry
soil (52B209) has an albic and argillic horizon and is
classified as a Typic Argialboll (Soil Survey Staff, 1975).
Clay The profile distributions of the percentage of
<2 micron clay are plotted in Figures 44 and 45 for the group
No. II soils with restricted drainage. The Muscatine soils
(52B212, 52B219, and 52BE14) have surface horizons which are
light silty clay loam in texture. The maximum clay contents
are 33.4% at a depth of 55 cm in profile 52B212, 33.8% at a
depth of 70 cm in profile 52B219, and 34.2% at a depth of
76.5 cm in profile 52BE14. The B/A clay ratios are 1.14,
1.18, and 1,24 for profiles 52B212, 52B219, and 52BE14, re
spectively. The weighted mean clay content of the 25 cm to
102 cm control section is 30.8% for profile 52B212, 31.2% for
profile 52B219, and 34.2% for profile 52BE14. The Garwin
soil (52B220) has a surface horizon which is silty clay loam
in texture. The maximum clay content of profile 52B220 is
37.0% at a depth of 37.5 cm. The B/A clay ratio is l.Oi and
the weighted mean clay content of the 25 cm to 102 cm control
section is 33.0%. The Sperry soil (52B209) has a surface
horizon which is heavy silt loam in texture. The maximum
clay content of profile 52B209 is 43.4% at a depth of 52 cm.
The B/A clay ratio is 1.62 and the weighted mean clay content
of the 25 cm to 102 cm zone is 35%.

154
CLAY (%) PH
-100
? -125
-175
-200 ^ 52BE14
• 52B219
O 52B212 -225
Figure 44. Clay and pH depth distributions for the group No. II Muscatine soils

155
CLAY (%) P"
-100
• 52B209 Sperry
O 52B220 Garwin
•225
Figure 45. Clay and pH depth distributions for the group No. II Garwin and Sperry soils

156
Total carbon The percentages of total carbon (TC)
for the group No. II soils with restricted drainage are
shown in Figures 46 and 47. The Garwin soil (52B220) has
the highest TC content in the surface horizon. The Sperry
soil (52B209) has the lowest TC content in the surface hori
zon and the Muscatine soils (52B212, 52B219, and 52BE14) are
intermediate in TC content. The depth to 0.58% TC is 65 cm,
70 cm, 67.5 cm, 67.5, and 55.6 cm for profiles 52B212, 52B219,
52BE14, 52B220, and 52B209, respectively.
pH The pH distributions for the group No. II soils
with restricted drainage are shown in Figures 44 and 45. The
pH values for the group No. II soils with restricted drainage
indicate that the Muscatine soils are the most acid, the
Garwin soil is the most alkaline, and the Sperry soil is
intermediate in soil reaction. With depth, the pH values
varied the most in the Muscatine soils. The pH distributions
of the three Muscatine soils (52B212, 52B219, and 52BE14)
are very similar. The pH of the surface horizon ranges from
6.7 to 7.2. The soils decrease in pH with depth and range
from 5.3 to 5.7 at a depth of 50 cm. Below a depth of 50 cm,
the pH changes over a narrow range. The zone of minimum pH
is at similar depths in the Muscatine soils. The minimum pH
in profiles 52B212, 52B219, and 52BE14 is at depths of 53 cm
to 94 cm, 43 cm to 8i cm, and 61 cm to 89 cm, respectively.
The minimum pH in the Garwin soil (52B220) is in the surface
horizon. The Garwin soil exhibits a slight increase in pH
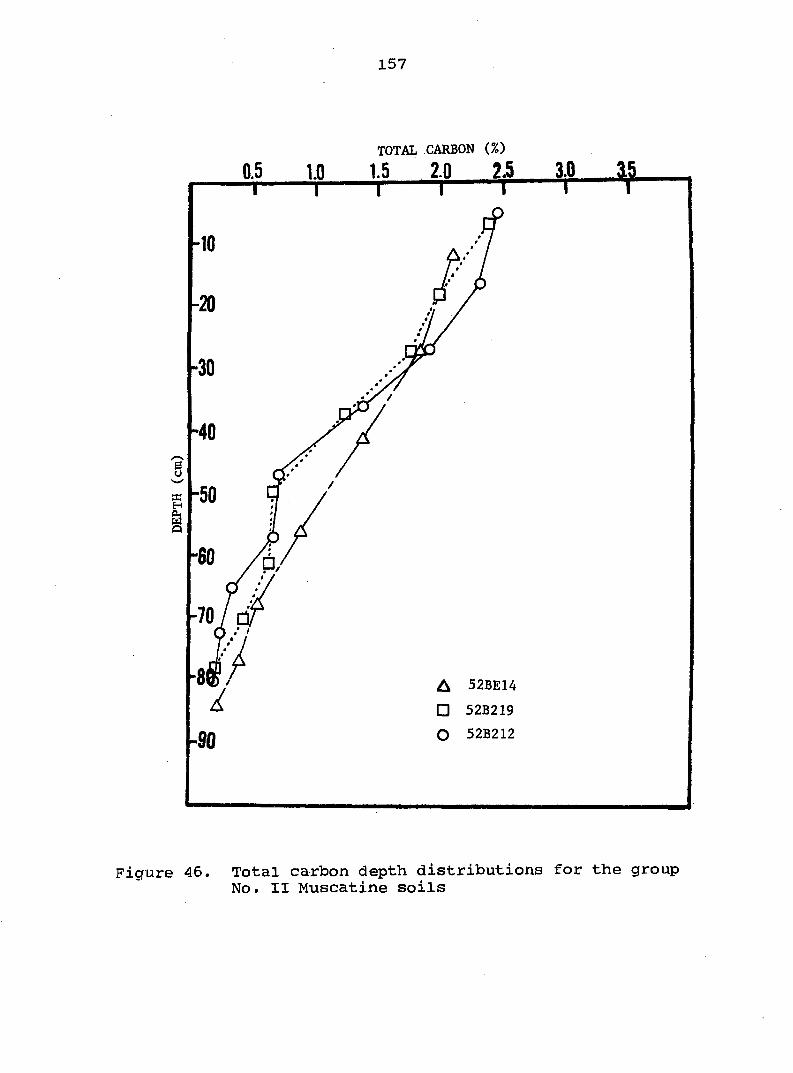
157
TOTAL CARBON (%)
-20
A 52BE14
• 52B219
O 52B212
Figure 46. Total carbon depth distributions for the group No. II Muscatine soils

15 8
TOTAL CARBON (%)
-30
g
• 52B209 Sperry
O 523220 Garwin
Figure 47. Total carbon depth distributions for the group No. II Garwin and Sperry soils

159
with increasing depth to the contact of the underlying sand.
The pH of the Garvin soil does not exceed 7.1. The pH of
the surface horizon of the Sperry soil is 7.2. The pH de
creases with depth to a minimum of 6.2 at a depth of 54 cm
to 76 cm and then increases to 6.7 at the contact of the
underlying sand. The group No. II soils with restricted
drainage exhibit a slight decrease in pH in the underlying
sand.
Available phosphorus The available phosphorus (AP)
distributions for the group No. II soils with restricted
drainage are shown in Figures 48 and 49. All of the group
No. II soils with restricted drainage exhibit zones of AP
eluviation and illuviation. In the Muscatine soils, the
minimum AP content is 3.0 ppm at a depth of 57 cm in profile
52B212, 3.0 ppm at a depth of 61 cm in profile 52B219, and
19.0 ppm at a depth of 56 cm in profile 52BE14 (Figure 48).
The Muscatine soils exhibit a wide range in the maximum AP
content in the B horizon and the depth to the maximum TP
content in the B horizon. Profile 52B219 has the thickest
zone of AP eluviation and the greatest depth to the AP
maximum. Profile 52BE14 has the thinnest zone of AP eluvia
tion and the shallowest depth to the AP maximum. The maxi
mum content of AP in the B horizon is 23.7 ppm at a depth of
98 cm, 29.5 ppm at a depth of 132 cm, and 39.5 ppm at a depth
of 84 cm in profiles 52B212, 52B219, and 52BE14, respectively.

160
AVAILABLE PHOSPHORUS (ppm)
-100
1
-125
-150
-175
-200 A 52BE14
• 52B219
-225 Q 52B212
Figure 48. Available phosphorus depth distributions for the group No. II Muscatine soils

151
AVAILABLE'PHOSPHORUS (ppm)
-100
a -125
-175
-200 A 52B220 Garwin
Q 52B209 Sperry
-225
Figure 49. Available phosphorus depth distributions for the group No. II Garwin and Sperry soils

162
The AP content of the surface horizon in the Garwin soil
(52B220) is 27.5 ppm and decreases to a minimum of 1.4 ppm
at a depth of 60 cm. The AP content increases to 12.2 ppm
at a depth of 107 cm and then decreases to 3 ppm at a depth
of 170 cm (Figure 49). The Sperry soil (52B209) has two
AP eluvial and illuvial-like zones (Figure 49). The AP con
tent of the surface horizon is 50.6 ppm. The AP content
decreases to a minimum of 2.1 ppm at a depth of 52 cm and
then increases to 12.4 ppm at a depth of 78.5 cm. The Sperry
soil has another decrease in AP content to 7.8 ppm at a depth
of 96.5 cm. The AP content increases to a maximum of 20.1
ppm at a depth of 155 cm in the IIC horizon and decreases to
3 ppm at a depth of 188 cm. The depth to clay maximum in
all of the group No. II soils with restricted drainage is at
a shallower depth in the B horizon than the depth to maximum
AP content. The poorly drained Garwin soil (52B220) and the
very poorly drained Sperry soil (52B209) have lesser amounts
of AP in their sola than the somewhat poorly drained Muscatine
soils (52B212, 52B219, and 52BE14) and well-drained group No.
II Tama soils. Similar results have been reported by Collins
(1977), Runge and Riecken (1966), and Tembhare (1973).
Total phosphorus The total phosphorus (TP) distribu
tions for the group No. II soils with restricted drainage are
shown in Figures 50 and 5i, Each profile has a zone of TP
eluviation and illuviation as discussed by Runge and Riecken
(1966). The depth to the zone of TP eluviation for the

163
TOTAL PHOSPHORUS (ppm)
200 300 600
-25
-175
-200 ^52BE14
• 52B219
^225 O 52B212
Figure 50. Total phosphorus depth distributions for the group No. II Muscatine soils

164
TOTAL PHOSPHORUS (ppm)
200
pr
TI
-100
-125
-150
-175 cr
-200 Q 52B220 Garwin
• 52B209 Sperry
-225
Figure 51, Total phosphorus depth distributions for the group No. II Garwin and Sperry soils

165
Muscatine soils (52B212, 52B219, and 52BE14) is similar but
the TP content is variable. The TP content in the zone of
eluviation ranges from 256 ppm at a depth of 77.5 cm in pro
file 52B219, to 456 ppm at a depth of 67.5 cm in profile
52BE14. Profile 52B212 was intermediate in TP content with
308 ppm at a depth of 65 cm. The maximum TP content of the
Muscatine soils is similar and is located in the upper B3
horizon. The maximum TP content is 664 ppm, 638 ppm, and
668 ppm at depths of 107 cm, 122 cm, and 126 cm, for profiles
52B212, 52B219, and 52BE14, respectively. The Muscatine soils
have a decrease in TP content in the lower B horizon and a
sharp decrease in TP content in the underlying IIC horizons.
Profile 52B214 has the greatest decrease in TP content in
the lower B3 horizon and profile 52B212 the most gradual
decrease. The decrease in TP content appears to be related
to the increasing sand content and decreasing clay content of
the loess and underlying sand. This relation is expressed by
the equation:
z = 597.78 - 5.33X + 3.39y = 0.96
where z is the TP content in ppm, x is the sand content in
percent, and y is the clay content in percent. The Garwin
soil (52B220) and the Sperry soil (52B209) also have well-
expressed zones of TP eluviation and illuviation. The
Garwin soil has a greater quantity of TP in the zone of
eluviation and a shallower depth to the TP minimum than the
Muscatine profiles. The TP content in the zone of eluviation

166
is 38i ppm at a depth of 60 cm in profile 52B220.
The Sperry soil (52B209) is the most highly differenti
ated of the group No. II soils with restricted drainage and
has the most strongly expressed zone of TP eluviation
(Figure 5l). The zone of TP eluviation in the Sperry soil
contains 170 ppm TP at a depth of 44.5 cm. The low TP con
tent is associated with an albic horizon in profile 52B209.
The maximum TP content in the zone of illuviation in the
Garwin and Sperry soils is similar to the Muscatine profiles.
However, the Garwin soil (52B220) has only a slight decrease
in TP content with depth in the B3 horizon and the Sperry
soil (52B209) has a sharp decrease in TP content with depth
in the B3 horizon. The TP content of the underlying IIC
horizon is 277 ppm in profile 52B220 and 177 ppm in profile
52B209. Within the zone of TP eluviation, the TP content of
the group No. II soils with restricted drainage is lower than
the TP content in well-drained group No. II Tama profiles.
This trend is similar to results reported by Collins (1977),
Fenton (1966), and Runge and Riecken (1966). Within the zone
of TP illuviation, the TP content of the group No. II soils
with restricted drainage and the well-drained group No. II
Tama soils is similar. Runge and Riecken (1966) have reported
a lower maximum TP content in the zone of illuviation for
soils with restricted drainage than for well-drained soils,
within a soil hydrosequence, Collins (1977) and Fenton (1966)
have reported higher quantities of TP in the zone of illuvia-

167
tion for Muscatine and Garwin soils with restricted drainage
than for well-drained Tama soils.
Characteristics of group No. Ill Tama soils
Morphological characteristics The thickness of the
solum in profiles 52B104, 52B108, 52B101, and 52BE111 is 180
cm, 163 cm, 201 cm, and 183 cm, respectively. The mean
solum thickness for the group No. Ill Tama soils is 182 cm
with a standard deviation of 15.6 cm. Profiles 52B104 and
52B101 have moderate medium angular blocky structure and
moderate medium prismatic structure parting to strong medium
angular blocky structure in the upper part of the B horizon.
Profile 52B104 has thin patchy and thin continuous light gray
(lOYR 7/2, dry) ped coatings and profile 52B101 has thick
continuous light gray (lOYR 7/2, dry) ped coatings in the
upper part of the B horizon. The lower part of the B horizon
has moderate medium prismatic structure parting to moderate
medium angular blocky structure and thin discontinuous and
medium continuous, light gray (lOYR 7/2, dry) ped coatings.
Profiles 52B108 and 52BE111 have moderate fine angular blocky
structure parting to moderate fine subangular blocky struc
ture in the upper part of the B horizon. Profile 52B108 has
thin continuous light gray (lOYR 7/2, dry) ped coatings in
the upper part of the B horizon. Profile 52BE111 does not
contain light gray ped coatings. The lower part of the B
horizon in profile 52B108 has strong medium prismatic

16 8
structure parting to strong medium angular blocky structure
and thin discontinuous light gray (lOYR 7/2, dry) ped coat
ings. The lower part of the B horizon in profile 52BE111 has
moderate medium prismatic structure parting to moderate
medium angular blocky structure.
Profiles 52B104, 52B101, and 52B108 have several char
acteristics in common with Tama soils on the primary divide
between the Cedar and Wapsipinicon Rivers in Cedar County,
Iowa (Miller, 1974). The soils have abundant light gray
(lOYR 7/2, dry) ped coatings, a greater depth to clay maxi
mum than modal Tama soils, and are underlain by sand. The
group No. Ill Tama soils differ from Tama soils described
by Miller (1974) in that they are on secondary and tertiary
interfluves and profiles 52B104 and 52B101 have argillic
horizons.
Clay The profile distributions of the percentage of
<2 micron clay are plotted in Figures 52 and 53 for the group
No. Ill Tama soils. Profiles 52B104 and 52B108 have surface
horizons which are heavy silt loam in texture. The maximum
clay content in the B horizon is 34.7% at a depth of 69 cm in
profile 52B104 and 35.5% at a depth of 77.5 cm in profile
52B108. The B/A clay ratio is 1.38 and 1.33 and the weighted
mean clay content of the 25 cm to 102 cm zone is 32.1% and
32.6% for profiles 52B104 and 52B108, respectively. Profiles
52B101 and 52BE111 have surface horizons which are light silty
clay loam in texture. The maximum clay content in the B

169
CLAY (%) pH
-100
-125 n
I
-150
-175
-200 A 52B104
O 52B108
-225
Figure 52. Clay and pH depth distributions for the group No. Ill Tama soils, 52B104 and 52B108

170
CLAY (%) pH
-100
-125
-175
-200 • 52B101
O 52BE111
-225
Figure 53. Clay and pH depth distributions for the group No. Ill Tama soils, 52Bl0l and 52BE111

171
horizon is 34.6% at a depth of 66 cm in profile 52Bl0i and
35,2% at a depth of 79 cm in profile 52BE111, The B/A clay
ratio is 1.27 for profiles 52Bl0i and 52BE111. The weighted
mean clay content in the 25 cm to 102 cm control section is
31.9% and 33,5% for profiles 52B101 and 52BE111, respectively.
Profiles 52B104 and 52B101 have argillic horizons and pro
files 52B108 and 52BE111 do not have argillic horizons. Pro
file 52B101 is the only Tama soil sampled in this study with
a surface horizon texture of light silty clay loam that has
an argillic horizon. Profiles 52B104 and 52Bl0l are classi
fied as Typic Argiudolls and profiles 52B108 and 52BE111 are
classified as Typic Hapludolls (Soil Survey Staff, 1975).
Total carbon The percentages of total carbon (TC)
for the group No. Ill Tama soils are shown in Figure 54. The
surface horizons of profiles 52B104, 52B101, 52BE111, and
52B108 have 1.88%, 1.95%, 2.12%, and 2.20% TC, respectively.
Profiles 52B104, 52Bl0l, 52B108, and 52BE111 were sampled in
cultivated fields. The depth to 0.58% TC is 60 cm, 59.5 cm,
58.5 cm, and 67.5 cm for profiles 52B104, 52B108, 52B101, and
52BE111, respectively. Below a depth of 25 cm, profile
52B101 has the lowest TC content and profile 52BE111 has the
highest TC content. Profiles 52B104 and 52B108 are intermedi
ate in TC content between profiles 52B101 and 52BE111,
Eîi The iSl distributions of the group No. Ill Tama
soils are shown in Figures 52 and 53. The pH of the surface
horizon ranges from 5.7 in profile 52B104 to 6.4 in profile

172
TOTAL CARBON (%)
Figure 54. Total carbon depth distributions for the group No. Ill Tama soils

173
52B108. Profiles 52BE111 and 52B101 have a pH of 6.0 and
6.3, respectively, in the surface horizon. The group No.
Ill Tama soils have their greatest variability in pH from the
surface to a depth of 115 cm. From 150 cm to a depth of 190
cm, profiles 52B101, 52B104, and 52BE111 are medium acid in
reaction and range in pH from 5.5 to 5.8 in each profile.
From 150 cm to a depth of 190 cm, profile 52B108 is strongly
acid in reaction and ranges in pH from 5.3 to 5.5. The pH
minimum in profiles 52B104, 52B108, 52B101, and 52BE111 is
at depths of 41 cm to 64 cm, 36 cm to 53 cm, 46 cm to 170
cm, and 43 cm to 61 cm, respectively.
Available phosphorus The available phosphorus (AP)
depth distributions for the group No. Ill Tama soils are
shown in Figure 55. The surface horizon of profiles 52B104,
52B101, and 52BE111 contains 28 ppm, 45.5 ppm, and 34.2 ppm,
respectively. Profile 52B104 has the shallowest depth to AP
minimum and the lowest content of AP of the group No. Ill
Tama soils. Within the zone of phosphorus eluviation, the
minimum AP is 2.2 ppm at a depth of 43.5 cm in profile 52B104,
8.9 ppm at a depth of 57 cm in profile 52B101, and 11.4 ppm
at a depth of 57 cm in profile 52BE111. The maximum content
of AP in the B horizon is 33,6 ppm, 39.3 ppm, and 41.1 ppm
at depths of 99 cm, lOOcm, and 113 cm, for profiles 52B104,
52B101, and 52BE111, respectively. The depth to clay maximum
in the group No. Ill Tama soils is higher in the solum than
the depth to AP maximum. Profile 52B104, the Tama soil with

174
AVAILABLE PHOSPHORUS (ppm)
-100
-125
-150
-175
A 52B104
• 52B101
O 52BE111 ^225
Figure 55. Available phosphorus depth distributions for the group No. Ill Tama soils

175
the heavy silt loam surface texture, contains the lowest
quantity of AP in the zones of phosphorus eluviation and
illuviation for all group No. Ill Tama soils.
Total phosphorus Total phosphorus (TP) depth dis
tributions for group No. Ill Tama soils are shown in Figure
56. The TP content of the surface horizons is very similar
and ranges from 580 ppm in profile 52BE111 to 6l0 ppm in
profile 52B101. The surface horizon of profile 52B104 con
tains 607 ppm of TP. Within the zone of TP eluviation, the
minimum content of TP is 355 ppm, 420 ppm, and 392 ppm at
depths of 60 cm, 56 cm, and 57 cm in profiles 52B104, 52B101,
and 52BE111, respectively. The maximum content of TP is in
the B3 horizon and decreases in the CI and IIC2 horizons.
The maximum content of TP in the B horizon is 695 ppm at a
depth of 162 cm in profile 52B104, 698 ppm at a depth of 139
cm in profile 52B101, and 699 ppm at a depth of 135 cm in
profile 52BE111. The decrease in TP in the lower part of the
B3 horizon and in the C horizon is interpreted as eluviation
of TP due to the highly permeable underlying loamy sand.
Characteristics of a group No. Ill Clinton soil
Morphological characteristics The thickness of the
solum in profile 92BE104 is 188 cm. The solum is developed
in 180 cm of loess and 8 cm of aeolian sand. Profile 92BE104
has moderate fine and very fine subangular blocky structure
and strong medium angular blocky structure in the upper part

176
TOTAL PHOSPHORUS (ppm)
400 500 600 700 200
-100
-125
-150
"175 ^ 52BE111
• 52B101
-200 O 52B104
-225
Figure 56. Total phosphorus depth distributions for the group No. Ill Tama soils

177
of the B horizon. The lower part of the B horizon has mod
erate medium prismatic structure parting to strong and moder
ate medium angular blocky structure. The I and IIB34 horizon
has weak medium prismatic structure. Profile 92BE104 has
thin continuous light gray (lOYR 7/2, dry) ped coatings in
the upper B horizon and thin discontinuous and thin patchy
light gray ped coatings in the lower part of the B horizon.
Clay The profile distribution of the percentage of
<2 micron clay is plotted in Figure 40. The maximum clay
content of the solum is 38.4% at a depth of 82 cm. The B/A
clay ratio of profile 92BE104 is 1.85 and is within the range
of B/A clay ratios for other Clinton soils sampled in southern
Iowa (Bicki, 1977; Luce, 1973; Illinois Agricultural Experi
ment Station, 1955). The weighted mean clay content of the
25 cm to 105 cm zone is 34.5%. The weighted mean clay con
tent of the control section of profile 92BE104 is 37.4% and
is within the range of the official Clinton series (Soil
Survey Staff, 1979). Profile 92BE104 is classified as a
Typic Hapludalf (Soil Survey Staff, 1975).
Total carbon The percentage of total carbon (TC) in
profile 92BE104 is shown in Figure 41. The surface horizon
contains 1.55% TC and the depth to <0.58% TC is 39.5 cm.
PH The pH distribution for profile 92BE104 is shown
in Figure 40. The pH of the surface horizon is 6.5. At a
depth of 36 cm to 188 cm, the pH is very uniform and ranges
f rom 5.1 to 5.2.

178
Available phosphorus The available phosphorus (AP)
depth distribution for profile 92BE104 is shown in Figure 42.
The minimum content of AP is 4.7 ppm at a depth of 56 cm.
The maximum AP is 38 ppm at a depth of 155 cm. The maximum
AP content is in the B33t horizon. The IIC2 horizon ranges
in AP content from 32.6 ppm to 27.0 ppm. The high AP content
of the loamy sand probably represents illuviation of phos
phorus from the superjacent loess.
Total phosphorus The total phosphorus (TP) depth
distribution for profile 92BE104 is shown in Figure 43.
Within the zone of eluviation, the minimum TP content is 297
ppm at a depth of 60 cm. The maximum TP content is in the
B33t horizon and is 695 ppm at a depth of 171.5 cm. Below
the B33t horizon, the TP content decreases with depth. At a
depth of 366 cm, the TP content of the loamy sand is 112 ppm.
Tama soils from east-central Iowa
Representative Tama soils from east-central Iowa which
were selected for comparison with the group No. I, II, and
III Tama soils are profiles PALI (Fenton, 1966), COL-86-1
(Collins, 1977), 50-7 (Oparaugo, 1979), S59-IA-86-1 (Soil
Survey Staff, 1966), and 86-24^, a profile from Tama County
with unpublished data. The representative Tama soils from
east-central Iowa will be referred to as the RECI (repre-
^Unpublished data from Iowa State University Agronomy Department files, sampled by H. Huddleston, 1968.

179
sentative east-central Iowa) Tama soils. Selected profile
characteristics and laboratory data for the group No. 1, II,
and III Tama soils and PALI, COL-86-l, 50-7, S59-IA-86-1, and
86-24 are presented in Tables 11, 12, and 13. The AP depth
distribution of PALI was obtained from Dr. T. E. Fenton
(Professor, Department of Agronomy, Iowa State University,
Ames, Iowa, personal communication, 1981).
Comparison of group No. I, II, and III Tama soils and representative Tama soils from east-central Iowa
Morphological characteristics The solum thickness for
the group No. I Tama soils is similar to the solum thickness
for the representative Tama soils from east-central Iowa
(RECl). The solum thickness for the group No. I Tama soils
ranges from 117 cm to 152 cm (Table 11). The solum thickness
for the RECI Tama soils ranges from 106 cm to 130 cm. The
solum thickness for the group II and III Tama soils is similar
and ranges from 173 cm to 188 cm in the group II Tama soils
and 163 cm to 20l cm in the group No. Ill Tama soils. An F
test (Snedecor and Cochran, 1967) was used to test the null
hypothesis that the mean solum thickness for the group No. I,
II, III, and RECI Tama soils was equal. The F test revealed
that there were no significant differences between the group
No. I and RECI Tama soils. There were no significant dif
ferences in solum thickness for the group No. II and III
Tama soils; however, highly significant differences

Table 11. Characteristics of group No. I, II, III, and RECI Tama soils^
Soil group
Profile number Soil type
Solum thickness
CMx (%)
DCMx (cm)
Arg. hor.
B./A clay ratio
WtMC 23-102 cm (%)
WtKCCS (%)
I 52B107 Tama hsil 117 36.4 44.5 + 1.45 33.8 31.4 52B205 hsil 152 34.1 65.6 + 1.39 32.2 33.3 52B109 Isicl 147 33.7 72.5 - 1.25 32.3 31.5 52B217 Isicl 140 34.3 54.5 — 1.27 33.0 32.1
Mean 139 34.6 59.3 1.34 32.8 32.1
II 52B204 Tama hsil 185 35.9 75.0 + 1.35 32.5 33.7 52B116 Isicl 173 33.6 62.0 - 1.20 31.5 30.5 52B207 Isicl 188 35.2 62.0 - 1.27 33.2 32.4 52B211 Isicl 175 34.0 72.5 — 1.21 32.5 32.4
Mean 180 34.7 67.9 1.26 32.4 32.3
III 52B104 Tama hsil 180 34.7 69.0 + 1.38 32.1 31.9 52B108 hsil 163 35.5 77.5 - 1.33 32.6 32.8 52B101 Isicl 201 34.6 66.0 + 1.27 31.9 30.6 52BE111 Isicl 183 35.2 79.0 - 1.27 33.5 34.3
Mean 182 35.0 72.8 1.31 32.5 32.4
RECI PALI Tama Isicl 117 33.8 58.5 — 1.16 31.9 29.9 COL-86-6 Isicl 109 34.3 50.5 - 1.23 31.7 29.7 50-7 Isicl 122 36.5 38.1 - 1.13 33.4 30.0 S59-IA-86--1 Isicl 130 35.6 45.7 - 1.24 32.6 30.1 86-24 Isicl 106 35.6 38.1 - 1.18 32.4 30.0
Mean 117 35.2 46.2 1.19 32.4 29.9
CMx = clay maximum; DCMx = depth to clay maximum; Arg. hor. = argillic horizon; WtMC = weighted mean clay content; WtMCCS = weighted mean clay content in control section.

181
(Fn m n = 89.5**) were found between the solum thickness U•U1flflU
of the group No. II and III Tama soils and the RECI Tama
soils» There were highly significant differences
(FQ oi 1 10 ~ 29.18**) between the solum thickness of the
group No. I Tama soils and the group No. II and III Tama
soils. Fenton (1966) reported no significant difference in
solum thickness for a Tama bench-phase profile (GS-4) and
PALI in Tama County. Miller (1974) reported differences in
solum thickness for Tama soils developed in loess and loess
over sand in Cedar and Scott counties. Wollenhaupt (1980)
also reported a slightly thicker solum for a Fayette soil
profile developed in loess overlying sand and gravel in
Clayton County. The grade and type of structural units of
the group No. I» II, and III Tama soils differs from that of
the RECI Tama soils. The group No. I, II, and III Tama
soils, in general, exhibit stronger grades of structure in
the lower part of the B horizon. The RECI Tama soils pri
marily have a moderate to weak grade of structure and the
group No. I, II, and III Tama soils have a strong to moderate
grade of structure. The structural units in the lower part
of the B horizon of the RECI Tama soils are predominantly
prismatic parting to subangular blocky structure, while the
structural units of the group No. I, II, and III Tama soils
are predominantly prismatic parting to angular blocky
structure. The group No. Ill Tama soils contain a greater
abundance of light gray (lOYR 7/2, dry) ped coatings in the

182
B horizon than the group No. II and III Tama soils and the
RECI Tama soils.
Miller (1974) has also described soils in Cedar and
Scott counties which have thick light gray ped coatings in
the B horizon. Arnold and Riecken (1964) and Arnold (1965)
concluded that the presence of grainy ped coatings in soils
from east-central and eastern Iowa is related to a relict
forest influence. The group No. II Tama soils on the high
terrace have the weakest expression of light gray ped
coatings.
Clay The clay distributions in the sola for the
group No. I Tama soils and the RECI Tama soils are similar in
maximum clay content in the solum, depth to maximum clay con
tent, average weighted clay content in the 25 cm to 102 cm
control section (Table 11), and are considered within the
range of the official Tama series (Soil Survey Staff, 1979).
The clay and pH depth distributions of the RECI Tama soils
are shown in Figure 57, The control section for Tama soils
will be considered the 25 cm to 102 cm portion of the solum.
Theoretically, the control section should be the upper 51 cm
of the argillic horizon for Tama soils classified as Typic
Argiudolls (Soil Survey Staff, 1975). Since the majority of
Tama soils in the Lake Calvin region are classified as Typic
Hapludolls (E. Schermerhorn, Soil Scientist, Johnson County,
Iowa, personal communication, 1980), the control section
will be considered the 25 cm to 102 cm portion of the solum.

183
CLAY (%) pH
-100
-125 I
-150
-175
-200 A PALI
• 50-7
O COL-86-6 -225
Figure 57, Clay and pH depth distributions for RECI Tama soils

184
The group No. I Tama soils have a significantly greater
(FQ 05 1 7 ~ 10.55*) B/A clay ratio than the RECI Tama soils.
The greater B/A clay ratio of the group No. I Tama soils is
due to the lower clay content of the surface horizon and a
similar maximum clay content in the B horizon. The Tama
soils with surface horizon textures of heavy silt loam have
greater B/A clay ratios than the Tama soils with surface
horizon textures of light silty clay loam in all soil groups.
There is no significant difference in the maximum clay con
tent in the solum and the weighted mean clay content of the
25 cm to 102 cm control section in the group No. I, II, III,
and RECI Tama soils (Table 11). The range in characteristics
for the Tama series in Iowa is well defined. If significant
differences in maximum clay content in the solum and the
weighted mean clay content in the 25 cm to 102 cm control
section were found, the group No. I, II, and III Tama soils
would probably be outside the range of the official Tama
series (Soil Survey Staff, 1979). There are highly signifi
cant differences (Fq oi 1 15 ~ 15.05**) between the depth to clay maximum in the group No. II and III Tama soils and the
group No. I and RECI Tama soils. The mean depth to clay
maximum in the group No. I, II, III, and RECI Tama soils is
59.1 cm, 67.9 cm, 72.8 cm, and 45.2 cm, respectively. Highly
significant differences (Fq oi l 15 ~ 9.53**) were found be
tween the B/A clay ratio of the group No. I, II, and III Tama
soils and the RECI Tama soils. The average B/A clay ratio

185
for the group No. I, II, III, and RECI Tama soils is 1.34,
1.26, 1.31, and 1.19, respectively. There are highly sig
nificant (Fq oi 1 15 ~ 14.97**) differences between the
average weighted clay content of the 60 cm to 120 cm zone of
group No. I, II, and III Tama soils and RECI Tama profiles.
The average weighted mean clay content of the 60 cm to 120
cm zone in the group No. I, II, and III Tama soils and the
RECI Tama soils is 32.1%, 32.3%, 32.2%, and 29.9%, respec
tively. The greater depth to clay maximum in the solum and
the higher clay content in the 60 cm to 120 cm zone suggests
that clay is formed and/or translocated to a greater depth
in the group No. II and III Tama soils than in the RECI Tama
soils. A greater translocation of clay in the group No. II
and III Tama soils may be related to the highly permeable
character of the underlying sand and an increase in precipita
tion from east-central Iowa to southeastern Iowa. Ruhe (1969)
compared four Tama profiles from four different topographic
levels in Tama County, Iowa. The depth to clay maximum was
greater in the Tama profile on a terrace than in Tama pro
files from three different upland topographic levels.
Total carbon The total carbon (TC) depth distribu
tion was partitioned into three variables for statistical
analysis. The three variables consist of the TC content
from the 0 to 25 cm depth, the TC content from the 25 cm to
50 cm depth, and the TC content below 50 cm. The group No.
I, II, and III Tama soils and the RECI Tama soils have similar

186
TC contents at depths of 0 to 25 cm and greater than 50 cm.
The TC depth distributions of the RECI Tama soils are shown
in Figure 58. The group No. I Tama soils have a signifi
cantly lower TC content at a depth of 25 cm to 50 cm
(Fo 05 1 15 ~ 8.34*) than the group No. II, III, and RECI
Tama soils. The weighted average TC content of the 25 cm to
50 cm zone is 0.85%, 1.14%, 1.31%, and 1.23% for the group
No. I, II, III, and RECI Tama soils, respectively. The lower
TC content of the 25 cm to 50 cm depth is associated with the
Tama profiles with surface horizon textures of heavy silt loam.
DH The group No. I and No. II Tama soils have a
wider range in pH than the group No. Ill Tama soils at a depth
of 0 to 25 cm. There is no significant difference in the
weighted average pH in the 25 cm to 102 cm control section
in the group No. I, II, III, and RECI Tama soils. The
group No. I, II, and III Tama soils have a significantly
lower pH in the 60 cm to 120 cm zone than the RECI Tama soils.
The weighted average pH of the 50 cm to 120 cm depth is 5.5,
5.7, 5.5, and 5.9 for group No. I, II, III, and RECI Tama
soils, respectively.
Available phosphorus The minimum available phosphorus
(AP) content in the zone of AP eluviation is similar for the
group No. I, II, III, and RECI Tama soils, but the depth to
AP minimum differs significantly. The mean AP content in the
zone of eluviation is 6.2 ppm, 5.1 ppm, 7.5 ppm, and 5.9 ppm
for the group No. I, II, III, and RECI Tama soils, respectively

187
TOTAL CARBON (%)
? -50 SB
H
I
A PALI
• 50-7
O COL—86—6
Figure 58. Total carbon depth distributions for RECI Tama soils

188
(Table 12). The depth to minimum AP content in the group
No. I and RECI Tama soils is 44.0 cm and 45.0 cm, respective
ly. The AP depth distributions of the RECI Tama soils are
shown in Figure 59, The depth to minimum AP content in the
group No. II and III Tama soils is 53 cm and 52.5 cm, re
spectively. The depth to minimum AP in the group No. I and
RECI Tama soils is at a significantly shallower depth
(FQ 05 1 12 ~ 5.72*) in the solum than the group No. II and
III Tama soils. The AP depth distribution may be related
to the clay depth distribution in the sola of the group No.
I, II, III, and RECI Tama soils. The depth to the maximum
clay content in the group No. I and RECI Tama soils is at a
shallower depth in the solum than the group No. II and III
Tama soils. Tembhare (1973) reported that different amounts
of AP at different depths in the soil profile were related
to the clay content and the depth of the maximum clay content
in the soil profile. If the depth of the maximum clay zone
was shallow, the depth of the maximum AP content was also
shallow. Miller (1974) noted that the different amounts of
AP at different depths in the B horizon and B-C horizon
interface are dependent on several parameters. The parameters
include (1) the depth to the maximum clay content, (2) the
distribution of clay in the profile, (3) the depth to sub
jacent sand or till units, and (4) the depth to subjacent
carbonates. Tembhare (1973) has suggested that the distribu
tion of AP in the solum is related to the degree of profile

Table 12. Available phosphorus data for group No. I, II, III, and RECI Tama soils^
Soil Profile MnAP DMnAP MxAP DMxAP WtMAPCS group number Soil type (ppm) (cm) (ppm) (cm) (ppm)
I 52B107 Tama hsil 6.2 44.5 49.6 96.5 23.1 52B205 hsil 8.3 32.0 39.1 87.5 16.9 52B109 Isicl 4.3 51.0 33.3 81.0 18.8 52B217 Isicl 6.1 48.5 31.0 77.5 19.4
Mean 6.2 44.0 38.3 85.6 19.6
II 52B204 Tama hsil 7.0 57.0 26.0 102.0 14.9 52B116 Isicl 6.1 44.5 36.2 85.0 20.0 52B207 Isicl 4.5 54.4 39.6 107.0 17.6 52B211 Isicl 2.6 56.0 38.1 91.5 15.2
Mean 5.1 53.0 35.0 96.4 16.9
III 52B104 Tama hsil 2.2 43.5 33.6 99.0 11.3 52B108 hsil 52B101 Isicl 8.9 57.0 39.3 100.5 22.7 52B111 Isicl 11.4 57.0 41.1 113.0 19.9
Mean 7.5 52.5 38.0 104.2 18.0
RECI PALI Tama Isicl 6 .6 47.0 30.0 94.0 17.5 COL-86-6 Isicl 7.5 50.5 30.5 81.0 19.5 50-7 Isicl S59-IA-86-1 Isicl 86-24 Isicl 3.5 37.5 20.5 71.0 24.4
Mean 5.9 45.0 27.0 82.0 20.5
^nAP = minimum available phosphorus; DMnAP = depth to available phosphorus minimum; MxAP = maximum available phosphorus; DMxAP = depth to available phosphorus maximum; WtKAPCS = weighted mean available phosphorus content in control section.

190
AVAILABLE PffOSMORUS (ppm)
-100
§
-150
-175 I
^ PALI
O COL-86-6
O 86-24
-200
-225
Figure 59. Available phosphorus depth distributions for RECI Tama soils

191
development. The maximum AP content in the sola of the
group No. I, II, and III Tama soils is significantly greater
than the AP content of the RECI Tama soils. The mean of the
maximum AP content in the sola of the group No. I, II, III,
and RECI Tama soils is 38.3 ppm, 35.0 ppm, 38.0 ppm, and 27.0
ppm, respectively (Table 12). There is a highly significant
difference (Fq 05 l 12 ~ 10.lO**) between the depth to the
maximum AP content in the group No. I and RECI Tama soils and
the group No. II and III Tama soils. The mean depth to the
maximum AP content in the sola of the group No. I and RECI
Tama soils is 85.6 cm and 82 cm, respectively. The mean depth
to the maximum AP content in the sola of the group No. II and
III Tama soils is 96.4 cm and 104.2 cm, respectively. Miller
(1974) has compared well-drained Tama soils from east-central
Iowa to well and moderately well-drained Tama soils from
eastern Iowa, which are underlain by aeolian sand. Miller
also reported a greater AP content in the subsoil and greater
depth to the AP maximum in the Tama soils which were under
lain by aeolian sand. Based on clay and AP depth distribu
tions, the group No. II and III Tama soils appear to be more
strongly developed than the group No. I and RECI Tama soils.
Total phosphorus The total phosphorus (TP) content of
PALI was determined by Fenton (1966) using a sodium carbonate
fusion method described by Jackson (1958). The sodium hypo-
bromite oxidation method of Dick and Tabatabai (1977) yields
TP values which average 4% less than the sodium carbonate

192
fusion method. PALI data were adjusted for this difference
in TP values so the data could be compared to data obtained
by the sodium hypobromite method.
The minimum TP content in the group No. II and III Tama
soils is significantly lower (Fq 05 1 12 " 4.81*) than the
minimum TP content in the group No. I and RECI Tama soils.
The mean TP in the zone of TP eluviation is 373.8 ppm and
389 ppm in the group No. II and III Tama soils, respectively
(Table 13). The mean TP content in the zone of TP eluviation
is 427.3 ppm and 427 ppm in the group No. I and RECI Tama
soils. Highly significant differences (Fq ^2 ~ 225.02**)
in the minimum TP content were found between the group No. I
Tama soils with surface horizon textures of heavy silt loam
(52B107 and 52B205) and light silty clay loam (52B109 and
52B217). Profiles 52B107, 52B205, 52B109, and 52B217 have a
minimum TP content of 366 ppm, 377 ppm, 47 8 ppm, and 488 ppm,
respectively, in the zone of TP eluviation. Although the
mean depth to minimum TP content ranged from 49.3 cm to 6l cm,
an analysis of variance (Snedecor and Cochran, 1967) indi
cated no significant difference in the depth to minimum TP
content for the group No. I, II, III, and RECI Tama soils.
The TP depth distributions of the RECI Tama soils are shown
in Figure 50. Within the group No. I Tama soils, the depth
to minimum TP content in the solum is at a significantly
shallower depth (Fq q^ ̂ g ~ 63.62*) in the Tama soils with
surface horizon textures of heavy silt loam than in the Tama

Table 13. Total phosphorus data for the group No. I, II, III, and RECI Tama soils^
Soil Profile MnTP DMnTP MxTPS DMxTPS MxTPP WtMTPCS I/E group number Soil type (ppm) (cm) (ppm) (cm) (ppm) (ppm) ratio
I 52B107 Tama hsil 366 33 607 105.5 685 449.4 1.74 52B205 hsil 377 39.5 629 127 695 439.6 1.84 52B109 Isicl 478 62.5 748 141 766 553.8 1.54 52B217 Isicl 488 62.0 673 135 701 535.3 1.44
Mean 427.3 49.3 664.3 127.1 711.8 494.5 1.64
II 52B204 Tama hsil 388 57 685 172.5 786 462 2.03 52B116 hsil 340 53 667 155 667 397.6 1.96 52B207 Isicl 377 54.5 703 181.5 709 464.8 1.88 52B211 Isicl 390 56 760 137 760 503 1.95
Mean 373.8 55.0 703.8 161.5 730.5 456.9 1.96
III 52B104 Tama hsil 355 60 695 161.5 695 436.3 1.96 52B108 hsil 52B101 Isicl 420 66 698 138.5 698 481.1 1.66 52B111 Isicl 392 57 699 135 699 458.3 1.81
Mean 389 61 697 145 697.3 458.6 1. 81
RECI PALI Tama Isicl 460 58.4 785 124.5 832 547.8 1.71 COL-86-6 Isicl 431 50.5 657.3 102.5 672.5 537.2 1.56 50-7 Isicl 390 52.0 661 113 695.0 473.0 1.78 S59-IA-86-1 Isicl 86-24 1 Isicl
Mean 427 53.6 701.1 113.3 733.2 519.3 1.68
^nTP = minimum total phosphorus; DMnTP = depth to minimum total phosphorus; MxTPS = maximum total phosphorus in solum; DMxTPS = depth to maximum total phosphorus in solum; MsTPP = total phosphorus maximum in profile; WtMTPCS = weighted mean total phosphorus in 25 cm to 102 cm control section.

194
TOTAL PHOSPHORUS (ppm)
200 300 400 500 600
-100
-125 g
I -150
~175 ^ PALI
n 50-7
-225
Figure 60. Total phosphorus depth distributions for RECI Tama soils
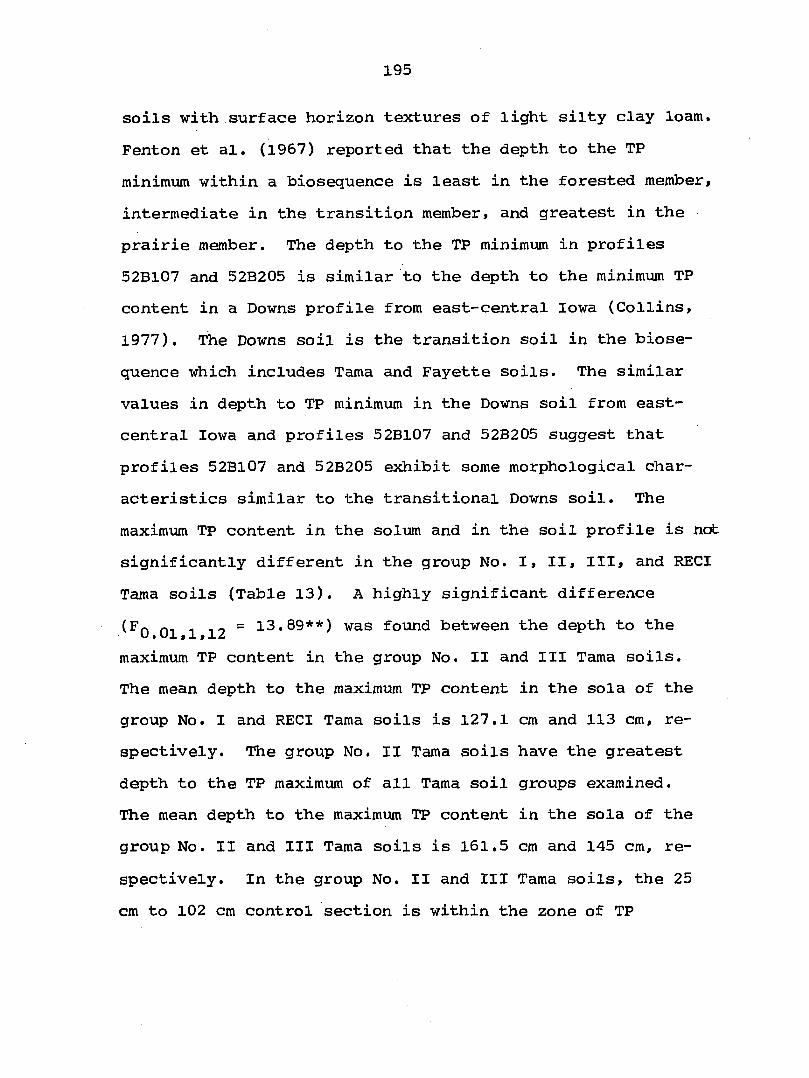
195
soils with surface horizon textures of light silty clay loam.
Fenton et al. (1967) reported that the depth to the TP
minimum within a biosequence is least in the forested member,
intermediate in the transition member, and greatest in the
prairie member. The depth to the TP minimum in profiles
52B107 and 52B205 is similar to the depth to the minimum TP
content in a Downs profile from east-central Iowa (Collins,
1977). The Downs soil is the transition soil in the biose
quence which includes Tama and Fayette soils. The similar
values in depth to TP minimum in the Downs soil from east-
central Iowa and profiles 52B107 and 52B205 suggest that
profiles 52B107 and 52B205 exhibit some morphological char
acteristics similar to the transitional Downs soil. The
maximum TP content in the solum and in the soil profile is not
significantly different in the group No. I, II, III, and RECI
Tama soils (Table 13). A highly significant difference
(FQ 01 1 12 ~ 13.89**) was found between the depth to the
maximum TP content in the group No. II and III Tama soils.
The mean depth to the maximum TP content in the sola of the
group No. I and RECI Tama soils is 127.1 cm and 113 cm, re
spectively. The group No. II Tama soils have the greatest
depth to the TP maximum of all Tama soil groups examined.
The mean depth to the maximum TP content in the sola of the
group No. II and III Tama soils is 161.5 cm and 145 cm, re
spectively. In the group No. II and III Tama soils, the 25
cm to 102 cm control section is within the zone of TP

196
eluviation and above the zone of maximum TP illuviation. As
a result, the group No. II and III Tama soils have a lower
average weighted TP content in the control section than the
group No. I and RECI Tama soils. The weighted average TP
content of the 25 cm to 102 cm control section in the group
No. II and III Tama soils is significantly lower (^Q ^ ^2
4.64*) than the weighted average TP content of the group No. I
and RECI Tama soils. The redistribution of phosphorus within
the soil profile has been used as an index for soil develop
ment (Collins, 1977; Smeck, 1973; Smeck and Runge, 1971;
Tembhare, 1973). With increasing profile development, there
is a greater differentiation between the quantity of phos
phorus gained by illuvial horizons and lost by eluvial hori
zons. Godfrey and Riecken (1954), Bauwin and Tyner (1957),
and Smeck (1973) reported that TP content tended to progres
sively decrease as soils became more weathered. Based on
this assumption, a calculation similar to a B/A clay ratio
was developed by Collins (1977) to indicate the relative
degree of profile development a soil has undergone. This
ratio, called an I/E (illuviated/eluviated) ratio, is cal
culated by dividing the maximum TP content in the profile
by the minimum TP content in the soil profile below the A
horizon. The soil with the lowest value is interpreted as
having the least amount of phosphorus movement in the profile
and hence the least amount of development. The l/E ratios
were calculated for the group No. I, II, III, and RECI Tama

197
soils and are listed in Table 13. Highly significant dif
ferences (F« ni 1 io = 10.44**) were found between the group U # UX $ 2. f
No. II and III Tama soils and the group No. I and RECI Tama
soils. The mean I/E ratio of the group No. II and III Tama
soils is 1.96 and 1.81, respectively. The mean l/E ratio of
the group No. I and RECI Tama soils is 1.64 and 1.68, re
spectively. Based on the l/E ratios, the group No. II and
III Tama soils have more redistributed TP than the group No.
I and RECI Tama soils and are considered more strongly devel
oped than the group No. I and RECI Tama soils. The l/E
ratio reaffirms previous conclusions that the group No. II
and III Tama soils are more strongly developed based on solum
thickness, clay distributions, AP depth distributions, and
TP depth distributions.
Comparison of group No. I, 1%, and III Clinton soils and group No. II Inton soil
Morphological characteristics Highly significant dif
ferences (Fq 01 1 4 " 26.48**) were found between the solum
thickness for the group No. II Clinton soils and the group
No. I and III Clinton soils. The mean solum thickness for
the group No. II Clinton and Inton soils is 263 cm and
the mean solum thickness for the group No. I and III Clinton
soils is 185 cm and 188 cm, respectively (Table 14). The
Tama soils also exhibit a similar trend of increasing solum
thickness from the group No. I soils through the group No.
II soils. An insufficient quantity of group No. Ill Clinton

Table 14. Characteristics of group No. I, II, and III Clinton and Inton soils^
Solum B/A WtMC Soil Profile thickness CMx DCMx clay 25-102 WtMCCE group number Soil type (cm) (%) (cm) ratio cm (%) (%)
I 58BE108 Clinton Isil 196 40.7 66 2.38 33.9 36.1 58BE109 Isii 185 37.6 62 2.16 34.3 36.4 92BE112 sil 175 39.0 59.5 1.80 35.4 35.8
Mean 185 39.1 62.5 2.11 34.5
II 92B111 Clinton sil 241 37.7 76 1.81 33.1 35.2 58BE107 sil 285 39.2 66 2.09 34.1 36.7
Mean 263 38.5 71 1.95 33.6
III 92BE104 Clinton sil 188 38.4 82 1.85 34.5 37.4
^CMx = clay maximum; DCMx = depth to clay maximum; WtMC = weighted mean clay content; WtMCCS = weighted mean clay content in control section.

199
soils were analyzed to accurately characterize their physical
and chemical properties. The group No. II Clinton and Inton
soils, in general, exhibit a stronger grade of structure in
the B2 horizon than the group No. I and III Clinton soils.
The structural units in the B2 horizon are predominantly
prismatic parting to strong medium angular blocky structure.
The structural units in the B2 horizon of the group No. I
and III Clinton soils are predominantly prismatic parting
to moderate medium angular blocky structure.
Clay The clay distribution in the sola of the
group No. I, II, and III Clinton and Inton soils is similar
in maximum clay content, B/A clay ratio, weighted mean clay
content in the control section, and weighted mean clay con
tent in the 25 cm to 102 cm zone. The lack of significant
differences for these parameters is similar to results ob
tained for the group No. I, II, and III Tama soils. No sig
nificant difference in the maximum clay content in the solum,
the B/A clay ratio, and the weighted mean clay content in the
25 cm to 102 cm zone were found between the group No. I, II,
and III Tama soils. The depth to clay maximum is at a shal
lower depth in the profiles in the group No. I Clinton soils
than in the group No. II and III Clinton and Inton soils.
The mean depth to clay maximum in the group No. I Clinton,
soils is 62.5 cm. The mean depth to the maximum clay con
tent in the group No. II Clinton and Inton soils is 71 cm and
the depth to maximum clay content in the group No. Ill
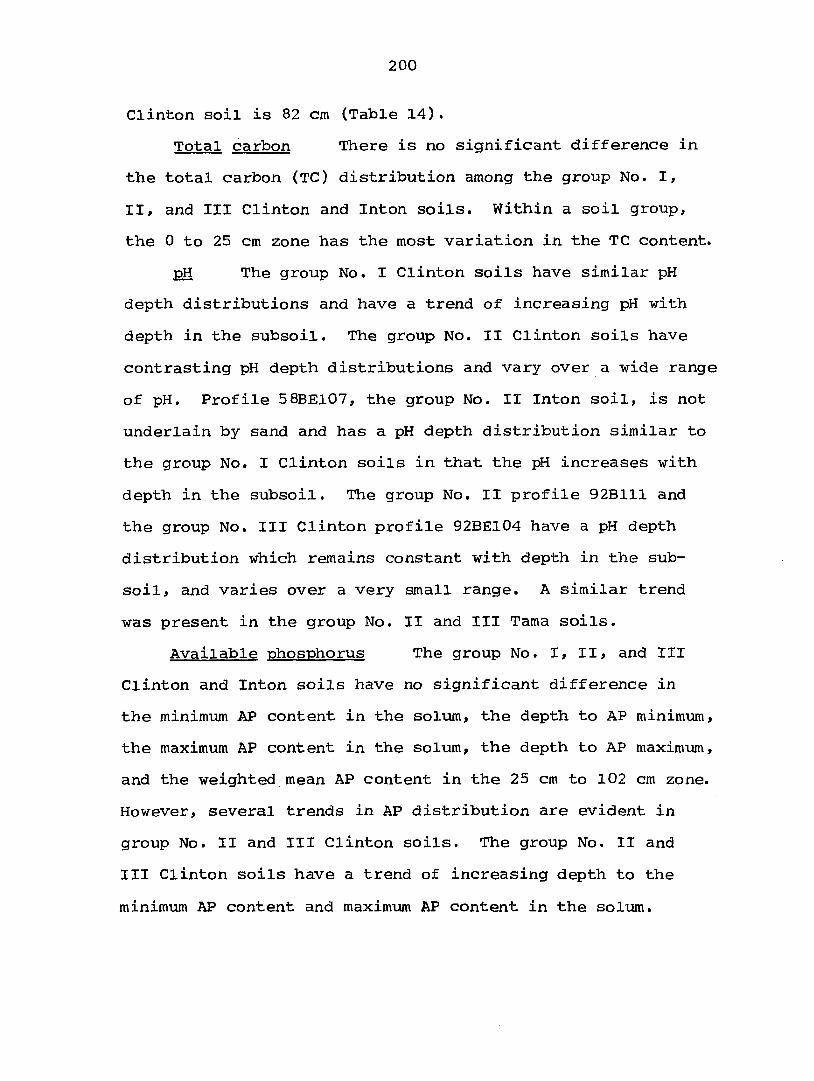
200
Clinton soil is 82 cm (Table 14).
Total carbon There is no significant difference in
the total carbon (TC) distribution among the group No. I,
II, and III Clinton and Inton soils. Within a soil group,
the 0 to 25 cm zone has the most variation in the TC content.
pH The group No. I Clinton soils have similar pH
depth distributions and have a trend of increasing pH with
depth in the subsoil. The group No. II Clinton soils have
contrasting pH depth distributions and vary over a wide range
of pH. Profile 5 8BE107, the group No. II Inton soil, is not
underlain by sand and has a pH depth distribution similar to
the group No. I Clinton soils in that the pH increases with
depth in the subsoil. The group No. II profile 92B111 and
the group No. Ill Clinton profile 92BE104 have a pH depth
distribution which remains constant with depth in the sub
soil, and varies over a very small range. A similar trend
was present in the group No. II and III Tama soils.
Available phosphorus The group No. I, II, and III
Clinton and Inton soils have no significant difference in
the minimum AP content in the solum, the depth to AP minimum,
the maximum AP content in the solum, the depth to AP maximum,
and the weighted mean AP content in the 25 cm to 102 cm zone.
However, several trends in AP distribution are evident in
group No. II and III Clinton soils. The group No. II and
III Clinton soils have a trend of increasing depth to the
minimum AP content and maximum AP content in the solum.

201
The mean depth to the minimum and maximum AP content in the
group No. I Clinton soils is 42 cm and 96.7 cm, respectively
(Table 15). The depth to the minimum and maximum AP content
in the group No. Ill Clinton soil is 56 cm and 155 cm, re
spectively. The group No. II and III Tama soils have a
similar trend in depth to minimum and maximum AP content in
the solum. A larger population of group No. II and III
Clinton soils should be sampled before the differences could
be considered statistically significant.
Total phosphorus The group No. I, II, and III Clinton
and Inton soils have no significant difference in the minimum
total phosphorus (TP) content, the depth to minimum TP con
tent, the maximum TP content in the solum, the depth to maxi
mum TP content, the weighted mean TP content in the 25 cm to
102 cm zone, and the I/E ratio. However, several trends in
TP distribution are evident in the group No. II and III
Clinton soils. The group II and III Clinton soils have a
trend of increasing depth to the maximum TP content in the
solum and a greater l/E ratio (Table 16). The mean depth to
the maximum TP content of the group No. I Clinton soils is
140.2 cm. The depth to maximum TP content in the group No.
II Clinton profile, 92B111, and in the group No. Ill Clinton
profile, 92BE104, is 177.5 cm and 171.5 cm, respectively.
The I/E ratio of the group No. I Clinton soils is 1.54. The
I/E ratio of the group No. II Clinton profile, 92B111, and of
the group No. Ill Clinton profile, 92BE104, is 1.8l and 2.34.
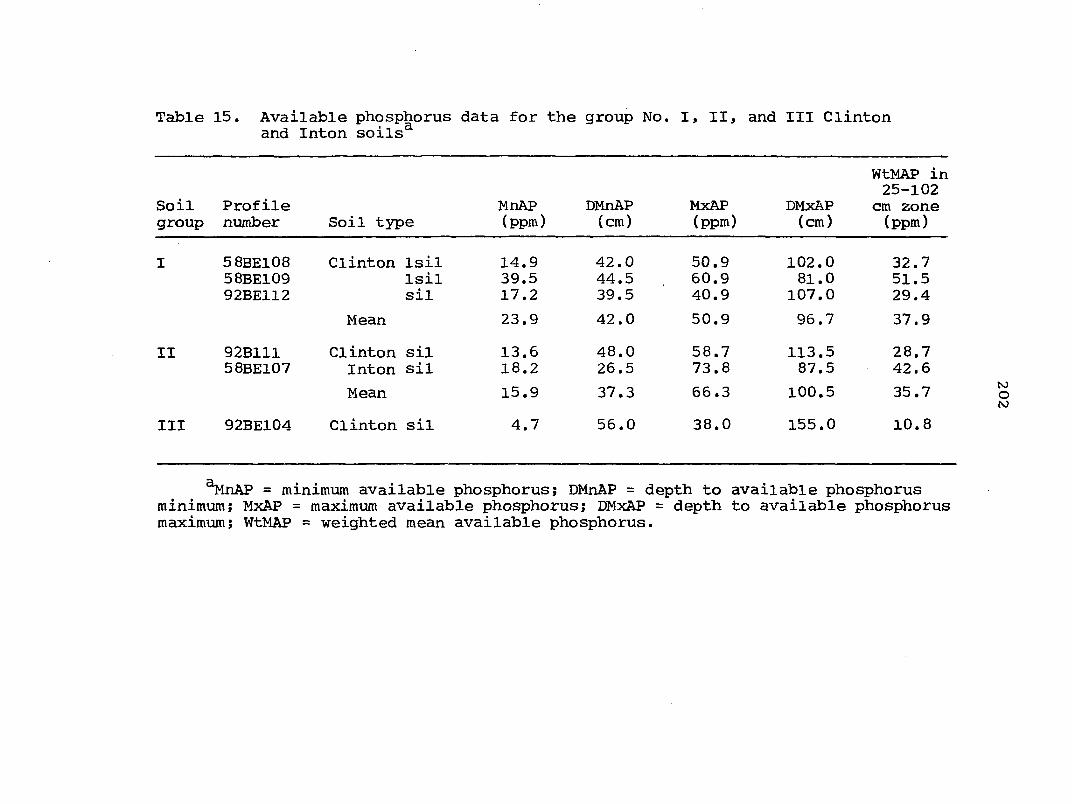
Table 15. Available phosphorus data for the group No. I, II, and III Clinton and Inton soils^
WtMAP in 25-102
Soil Profile MnAP DMnAP MxAP DMxAP cm zone group number Soil type (ppm) (cm) (ppm) (cm) (ppm)
I 5 8BE108 58BE109 92BE112
Clinton Isil Isil sil
14.9 39.5 17.2
42.0 44.5 39.5
50.9 60.9 40.9
102.0 81.0
107.0
32.7 51.5 29.4
Mean 23.9 42.0 50.9 96.7 37.9
II 92B111 58BE107
Clinton Inton
sil sil
13.6 18.2
48.0 26.5
58.7 73.8
113.5 87.5
28.7 42.6
Mean 15.9 37.3 66.3 100.5 35.7
III 92BE104 Clinton sil 4.7 56.0 38.0 155.0 10.8
^nAP = minimum available phosphorus; DMnAP = depth to available phosphorus minimum; MxAP = maximum available phosphorus; DMxAP = depth to available phosphorus maximum; WtMAP = weighted mean available phosphorus.

Table 16. Total phosphorus data for the group No. I, II, and III Clinton and Inton soils^
Soil group
Profile number Soil type
MnTP (ppm)
DMnTP (cm)
MxTPS (ppm)
DMxTPS (cm)
l-IxTPP (ppm)
WtMTP 25-102 cm (ppm)
I/E ratio
I 58BE108 58BE109 58BE112
Clinton Isil Isil sil
295 429 398
33.5 44.5 28.0
616 594 660
135 142 143.5
616 594 660
437.4 502.3 492.4
1.58 1.38 1.66
Mean 374 35.3 418 140.2 623.3 477.4 1.54
II 92B111 58BE107
Clinton sil Inton sil
355 373
39.5 39.5
643 603
177.5 137.0
643 603
440.5 496.6
1.81 1.67
Mean 364 39.5 623 157.3 623 468.6 1.74
III 92BE104 Clinton sil 297 47 695 171.5 695 370.3 2.34
^nTP = minimum total phosphorus; DMnTP = depth to total phosphorus minimum; MxTPS = total phosphorus maximum in solum; DMxTPS = depth to maximum total phosphorus in solum; MxTPP = maximum total phosphorus in profile; WtMTP = weighted mean total phosphorus in 25 to 102 cm zone.

204
An insufficient number of Clinton profiles were analyzed to
statistically evaluate whether the group No. II and III
Clinton soils were more strongly developed than the group
No. I Clinton soils. Excluding the Inton profile 52BE107
from consideration, the group No. II and III Clinton soils
exhibit a trend of increasing profile development over the
group No. I Clinton soils based on AP and TP distributions
and solum thickness. A similar conclusion was reached for
the group No. II and III Tama soils.
The minimum and maximum quantities of TP in the solum
are lower in the Clinton and Inton soils than in the Tama
soils. However, the maximum clay content and the mean clay
content in the 25 cm to 102 cm zone are higher in the Clinton
and Inton soils than in the Tama soils. The lower TP content
in the Clinton soils may be related to the stronger develop
ment of the Clinton and Inton soils. The Tama soil is the
prairie member of a biosequence which includes the Downs and
Fayette soils. The Tama-Downs-Fayette biosequence is con
sidered to be in a minimal stage of profile development
(Corliss, 1958; Richardson, 1974) relative to other soils in
Iowa. The Clinton soil is the forested member of a biose
quence which includes the Otley and Ladoga soils. The Otley-
Ladoga-Clinton biosequence is considered to be in a medial
stage of profile development (Corliss, 1958; Richardson,
1974) relative to other soils in Iowa. Godfrey and Riecken
(1954), Bauwin and Tyner (1957), and Smeck (1973) reported

205
that the TP content tended to decrease as soils became more
strongly developed. The Clinton soils are more strongly
developed than the Tama soils, exhibit more horizon differ
entiation, and contain lower quantities of TP.
Soils with restricted drainage from east-central Iowa
Representative Muscatine soils from east-central Iowa
(RECI Muscatine soils) which were selected for comparison
with the group No. II Muscatine soils are profiles PAL2
(Fenton, 1966), COL-86-7 (Collins, 1977), S60-IA-6-1 (Soil
Survey Staff, 1966), S60-IA-38-1 (Soil Survey Staff, 1966),
and 38-119^, a profile from Grundy County with unpublished
data. The total phosphorus depth distribution of PAL2 and
the available phosphorus depth distributions of PAL2 and
PALS were obtained from Dr. T. E. Fenton (Department of
Agronomy, Iowa State University, personal communication).
Representative Garwin soils from east-central Iowa
(RECI Garwin soils) which were selected for comparison with
the group No. II Garwin soil are profiles PALS (Fenton, 1966)
and COL-86-28 (Collins, 1977). Selected profile characteris
tics and laboratory data for group No. II Muscatine, Garwin,
and Sperry soils and RECI Muscatine and Garwin soils are
presented in Tables 17, 18, and 19.
\jnpublished data from Iowa State University Agronomy Department files. Soil Survey Laboratory sample numbers 453S through 4542.

206
Comparison of group No. II and RECI soils with restricted drainage
Morphological characteristics Significant differ
ences (^0 0 1 5 " 7.88*) were found between the solum thick
ness of the group No. II Muscatine soils and the RECI Musca
tine soils. The mean solum thickness of the group No. II
Muscatine soils is 157.3 cm and the mean solum thickness of
the RECI Muscatine soils is 122 cm (Table 17).
A sufficient number of Garwin soils were not sampled to
statistically evaluate differences in solum thickness of the
group No. II and RECI Garwin soils. The group No. II Garwin
soil follows the trend established by the group No. II Tama,
Clinton, and Muscatine soils. The solum thickness of the
group No. II Garwin soil is 15 8 cm and the solum thickness
of the RECI Garwin soils is 122 cm and 137 cm.
Clay The clay distribution in the sola of the group
No. II Muscatine soils and the RECI Muscatine soils is
similar in maximum clay content, B/A clay ratio, and weighted
mean clay content in the 25 cm to 102 cm control section and
60 cm to 120 cm zone. The clay and pH depth distributions
of the RECI Muscatine soils are shown in Figure 51. The group
No. II Muscatine soils have a significantly lower (Fq 05,1 5 =
8.40*) clay content in the surface horizon than the RECI
Muscatine soils. The mean clay content in the surface hori
zon of the group II and RECI Muscatine soils is 26,5% and
31%, respectively. The depth to clay maximum in the group

Table 17, Characteristics of the group No. II and RECI soils with restricted drainage^
Soil Profile group number Soil type
Solum thickness CSH (cm) (%)
WtMC WtMC B/A 25- 60-
CMx DCMx clay 102 cm 120 cm (%) (cm) ratio (%) (%)
II 52B212 Muscatine Isicl 137 27.5 33 .4 65 1 .14 30 .8 28.6 52B219 Isicl 183 28.6 33 .8 70 1 .18 31 .2 31.1 52BE14 Isicl 152 29.4 34 .2 76. 5 1 .24 32 .5 32.0
Mean 157.3 28.5 33 .8 70. 5 1 .19 31 .5 30.6
RECI PAL2 Muscatine Isicl 122 30.2 32 .9 58. 5 1 .09 32 .0 29.8 COL-86-7 Isicl 114 31.0 36 .8 47. 0 1 .15 32 .9 29.4 S60-IA-6-1 Isicl 117 30.1 35 .5 64. 8 1 .18 34 .3 32.5 S60-IA-38-1 Isicl 135 32.8 36 .2 52. 0 1 .10 34 .1 32.2
Mean 122 31.0 35 .4 55. 6 1 .13 33 .3 31.0
II 52B220 Garwin sicl 158 37 .5 36. 8 1 .05 33 .0 28.5
RECI PAL3 Garwin sicl 122 35 .6 38. 1 1 .07 33 .2 29.3 COL-86-•28 sicl 137 37 .0 58. 5 1 .13 33 .1 30.4
II 52B209 Sperry sil 137 43 .4 52. 0 1 .62 35 .4 34.8
^CSH = clay content of surface horizon; CMx = clay maximum; WtMC = weighted mean clay content.
clay maximum ; DCMx = depth to

208
CLAY (%) pH
-100
-125
•150
-175
-200 A PAL2
• COL-86-7
O 38-119 -225
Figure 61. Clay and pH depth distributions for RECI Muscatine soils

209
No. II Muscatine soils is at a significantly greater
(Fq q2 ^ 5 = 7.75*) depth in the solum than the depth to
clay maximum in the RECI Muscatine soils. The mean depth
to clay maximum in the group No. II and RECI Muscatine soils
is 70.5 cm and 55.6 cm, respectively.
The clay distribution in the sola of the group No. II
Garwin and RECI Garwin soils is similar in maximum clay con
tent, depth to maximum clay content, B/A clay ratio, and
weighted mean clay content in the 25 cm to 102 cm control
section and 60 cm to 120 cm zone. The clay and pH depth
distributions of the RECI Garwin soils are shown in Figure
62.
The Sperry soil has the greatest amount of clay in the
B horizon, the greatest B/A clay ratio, and the greatest
amount of clay in the 25 cm to 102 cm and 60 cm to 120 cm
zones of all the soils with restricted drainage.
Total carbon The depth distribution of total carbon
(TC) in the group No. II Muscatine soils is within the range
of the TC depth distribution of the RECI Muscatine soils.
The surface horizons of the RECI Muscatine soils range in
TC content from 2.11% in profile COL-86-7 to 3.46% in profile
S60-IA-38-1. The TC content in the surface of the group No.
II Muscatine soils are more uniform and range from 2.10% in
profile 52BE14 to 2.44% in profile 52B212. With depth, the
group No. II Muscatine soils vary in TC content over a much
narrower range than the RECI Muscatine soils. The TC depth

210
CLAY (%) pH
1
20 40 5D 1 1 1 1 i I
z ^ 9
-25 k : ol \ 9
-50 % T 6 \ 9
-75 fp I 4 7 Y ̂
-100 Â T f? \ ^ -125 X 6 T ?
-150 g V -175
•200 ^ PAL3 o COL-86-28
•225
70 M
Figure 62. Clay and pH depth distributions for ]pCI Garwin soils

211
distributions of the REGI Muscatine soils are shown in
Figure 63.
The surface horizon of the REGI Garwin soil (GOL-86-28)
contains 3.51% TC and the surface horizon of the group No. II
Garwin soil (52B220) contains 3.10% TG. The REGI Garwin soil
has a higher content of TG than the group No. II Garwin soil
to a depth of 31 cm. Below a depth of 31 cm, the group No.
II Garwin soil contains more TG with depth than the REGI
Garwin soil. The TC depth distributions of the REGI Garwin
soils are shown in Figure 54,
pH The pH depth distributions of the REGI Muscatine
soils (PAL2, GOL-86-7, and 38-119) vary over a wide pH range.
In contrast, the pH depth distributions of the group No. II
Muscatine soils vary over a narrow pH range (Figure 44). The
REGI Muscatine soils decrease in pH with depth to a minimum
in the lower A and the B1 horizons, then increase sharply
with depth. The group No. II Muscatine soils decrease in pH
with depth to a minimum in the upper B2 horizon. Below the
B2 horizon, profiles 52B212 and 52BE14 increase in pH with
depth to the lower B3 horizon, then decrease in pH with depth
in the CI and IIC2 horizons. Below the B2 horizon in profile
52B219, the pH increases with depth to the B3 horizon, then
remains at pH 5.7 in the I and IIB3 and IIG horizons. The
pH in the B3 horizon of the group No. II Muscatine soils is
significantly lower (Fq ^ ^ = 39.13**) than the pH of the
REGI Muscatine soils.

212
0.5 1.0 TOTAL CARBON (%)
1.5 2.0 Î.5 3.0
A PAL2
• .S60-IA-38-1
O COL-86-7
Figure 63. Total carbon depth distributions for RECI Muscatine soils

213
TOTAL CARBON (%)
g
e
I
A PAL3
O COL-86-28
Figure 64. Total carbon depth distributions for RECI Garwin soils

214
The minimum pH of the RECI Garwin soils (PAL3 and
COL-83-28) and the group No. II Garwin soil (52B220) is in
the surface horizon. The pH of the RECI Garwin soils in
creases with depth to the C horizon. The pH of the group
No. II Garwin soil increases with depth to the B33 horizon,
then decreases in pH in the B34 and IIC horizons.
Available phosphorus An F test (Snedecor and Cochran,
1967) revealed no significant difference in the minimum avail
able phosphorus (AP) content, the depth to AP minimum, the
maximum AP content in the subsoil, the depth to AP maximum,
and the weighted mean AP content in the 25 cm to 102 cm con
trol section and the 60 cm to 120 cm zone in the group No. II
and RECI Muscatine soils. Although the differences are not
statistically significant, there is a trend toward a higher
maximum AP content in the subsoil and greater depth to AP
maximum .in the group No. II Muscatine soils than in the RECI
Muscatine soils. The AP depth distributions of the RECI
Muscatine soils are shown in Figure 65. The AP depth distri
bution in most soils can be divided into two general patterns:
(l) a sigmoid (S-shaped) curve, in which the AP depth dis
tribution exhibits zones of AP eluviation and illuviation;
and (2) a decreasing curve, in which the AP content is high
est in the surface horizon and decreases with depth (Birchett,
1974). The group No. II Muscatine soils exhibit more strongly
expressed zones of AP eluviation and illuviation than the
RECI Muscatine soils (Figures 38 and 65). Collins (1977),

215
AVAILABLE PHOSPHORUS (ppm)
-50 K
-too d f t
/
-150/
"200 ^ PAL2
• COL-86-7
-225 ® 38-119
Figure 65. Available phosphorus depth distributions for RECI Muscatine soils

Table 18. Available phosphorus data for group No. II Muscatine, Garvin, and Sperry soils and RECI Muscatine and Garwin soils^
WtMAP WtMAP 25- 60-
Soil Profile MnAP DMnAP MxAP DMxAP 102 cm 120 cm group number Soil type (ppm) (cm) (ppm) (cm) (ppm) (ppm)
II 52B212 Muscatine Isicl 3.0 57 23.7 98.0 11.2 17.3 52B219 Isicl 3.0 61 29.5 132.0 6.5 9.0 52BE14 Isicl 19.0 56 39.5 84.0 22.7 39.3
Mean 8.3 58 30.9 104.7 13.5 21.9
RECI PAL2 Muscatine Isicl 16.0 70 20.0 77.5 23.1 16.0 COL-86-7 Isicl 7.0 47 11.0 80.0 22.5 9.1 38-119 Isicl 5.0 41 28.5 107.0 12.5 20.4
Mean 9.3 52.7 19.8 88.2 ' 19.5 15.2
II 52B220 Garwin s id 1.4 60 12.2 107.0 5.5
RECI PAL3 Garwin sicl 55.6 0 13.3 COL-86-28 sicl 34.0 0
II 52B209 Sperry sil 2.1 52 18.4 132 11.0
^MnAP = minimum available phosphorus; DMnAP = depth to minimum available phosphorus; MxAP = maximum available phosphorus; DMxAP = depth to available phosphorus maximum; WtMAP = weighted mean available phosphorus.

217-218
Miller (1974), Tembhare (1973), and Godfrey and Riecken
(1954) have suggested that the distribution of AP in the pro
file can be used as an indicator of weathering and profile
development. The group No. II Muscatine soils are con
sidered more strongly developed than the RECI Muscatine
soils on the basis of their AP distribution.
The group No. II Garwin soil has moderately expressed
zones of AP eluviation and illuviation. The RECI Garwin
soils do not have zones of AP eluviation or illuviation but
exhibit a decreasing AP depth distribution pattern. The AP
depth distributions of the RECI Garwin soils are shown in
Figure 56. The maximum AP content is highest in the surface
horizon of the RECI Garwin soils and decreases with depth.
The lower pH of the group No. II Muscatine soils and the
highly permeable nature of the subjacent loamy sand may ac
count for the more strongly expressed zones of AP eluviation
and illuviation in the group No. II Muscatine soils.
The group No. II Muscatine and Garwin soils contain
lesser quantities of AP than the well-drained group No. II
Tama soils. Collins (1977), Tembhare (1973), and Runge and
Riecken (1966) reported higher amounts of AP in well-drained
soils than in imperfectly and poorly drained soils.
Total phosphorus There is no significant difference
in the minimum total phosphorus (TP) content, the depth to
TP minimum, the weighted mean TP content in the 25 cm to
l02 cm control section, and the I/E ratio in the group No.

219
AVAILABLE PHOSPHORUS (ppra)
g
g
I
-175 A PAL 3
O COL-86-28
-200
-225
Figure 66. Available phosphorus depth distributions for RECI Garwin soils

220
II and RECI Muscatine soils. The maximum TP content in the
solum is significantly lower (Fq O5,1,3 ~ 20.44*) than the
maximum TP content in the RECI Muscatine soils. The mean
maximum TP in the solum is 656,7 ppm in the group No. II
Muscatine soils and 741 ppm in the RECI Muscatine soils (Table
19). The maximum TP content in the profile is significantly
lower (FQ 05 1 3 ~ 11.39*) than the maximum TP content in
the profile of the RECI Muscatine soils. The mean maximum
TP in the profile is 656.7 ppm in the group No. II Muscatine
soils and 759.5 ppm in the RECI Muscatine soils. There was
no statistically significant difference in the depth to TP
maximum in the group No. II and RECI Muscatine soils. The
TP depth distributions of the RECI Muscatine soils are shown
in Figure 67. However, the group No. II Muscatine soils
follow the trend of a greater depth to TP maximum found in
the other group No. II soils.
Below the zone of TP eluviation, the RECI Muscatine
soils increase in TP content with depth to the C horizon.
Below the zone of TP eluviation in the group No. II Muscatine
soils, the TP content increases with depth to the upper part
of the B3 horizon, then decreases in TP content to the lower
B3 horizon and in the IIC horizon. The decrease in TP con
tent in the lower part of the profile probably results from
eluviation of TP due to the highly permeable character of
the subjacent sand. The group No. II Muscatine soils are
considered more strongly developed than the RECI Muscatine

Table 19. Total phosphorus data for group No. II Muscatine, Garwin, and Sperry soils and RECI Muscatine and Garwin soils^
Soil group
Profile number Soil type
MnTP (ppm)
II 52B212 52B219 52BE14
Muscatine Isicl Isicl Isicl
308 256 456
Mean 340
RECI PAL2 COL-86-7
Muscatine Isicl Isicl
362 376.9
Mean 369.5
II
RECI
52B220
PAL3 , COL-86-28
Garwin sicl
Garwin sicl sicl
381
513 429
II 52B209 Sperry sicl 170
^nTP = minimum total phosphorus; DMnTP = depth to minimum total phosphorus; MxTPS = maximum total phosphorus in solum; DMxTPS = depth to maximum total phosphorus in solum; MxTPP = total phosphorus maximum in profile; WtMTP = weighted mean total phosphorus in 25 cm to 102 cm zone.

222
WtMTP DMnTP MxTPS DMxTPS MxTPP 25-120 cm I/E
(cm) (ppm) (cm) (ppm) (ppm) ratio
65.0 77.5 67.5
664 638 668
107 122 126
664 638 668
435.6 353.8 442.6
2.14 2.49 1.44
70.0 656.7 118.3 656.7 410.7 2 . 0 2
77.5 47
760 722
114.5 102.5
797 722
484.4 490
2 . 2 0 1.74
62.3 741 108.5 759.5 487.2 1.97
60 665 107 665 520.1 1.77
57.5 44.5
790 769
114.5 102.5
790 769
573.6 528.6
1.54 1.79
44.5 768 96.5 768 420.6 4.52

223
TOTAL PHOSPHORUS (ppm)
600
-100
-125
-150
^ PAL2
O COL-86-7
-200
-225
Figure 67. Total phosphorus depth distributions for RECI Muscatine soils

224
soils based on the lower maximum TP content in the solum and
profile and the trend toward a greater depth to TP maximum
in the solum.
An insufficient number of group No. II Garwin profiles
•were examined to determine if statistically significant dif
ferences existed between the group No. II and RECI Garwin
soils. The group No. II Garwin soil follows the trend of
the other group No. II soils. The group No. II Garwin soil
has a lower TP minimum content in the zone of eluviation, a
greater depth to TP minimum, a lower maximum TP content in
the solum, and a lower weighted mean TP content in the 25 cm
to 102 cm control section than the RECI Garwin soils. The
RECI Garwin soils increase in TP content with depth to the
C horizon. The TP depth distributions of the RECI Garwin
soils are shown in Figure 68. The group No. II Garwin soil
decreases in TP content in the lower B3 and C horizon. A
similar trend was found in the group No. II Muscatine soils.
The decrease in TP content below the zone of illuviation in
the group No. II soils with restricted drainage is more
strongly expressed than in the group No. II Tama and Clinton
soils and may be related to the location of the water table.

225
TOTAL PHOSPHORUS (ppm)
600 700
-25
-100
g
-125
-160
-175 A PAL 3
O COL-86-28
-200
-225
Figure 58. Total phosphorus depth distributions for RECI Garwin soils

226
SUMMARY AND CONCLUSIONS
Geomorphic and Stratigraphie Investigations in the Lake Calvin Region
The uplands surrounding the Lake Calvin region descend
to the high terrace in a series of stepped geomorphic sur
faces. Aeolian sand deposited by locally deflected winds is
found throughout the uplands in the Lake Calvin region.
Thick zones of sand on the high terrace previously inter
preted as alluvial sediments by other investigators are in
terpreted as aeolian and alluvial sand. The alluvial sand
above the paleosol on the high terrace is interpreted as over-
bank, slope-wash or alluvial fan deposits.
Paleosols were identified in the high terrace in the
Riverside, Hills, Gladwyn, and West Libert I transects below
a thick zone of sand or alluvium. The presence of a well-
developed buried paleosol on the loess-covered high terrace
indicates that the terrace sediments below the paleosol and
Wisconsin loess are not closely related in time.
The absence of loess on the intermediate terrace and
the prominent escarpment along the contact of the intermedi
ate and high terrace indicates that the intermediate and high
terraces are not closely related in time. The absence of
loess on the low and intermediate terraces dates these sur
faces as younger than 14,000 years before present and sug
gests that they are closely related in time. Based on

227
similar stratigraphie relationships and elevations,
the low, intermediate, and Iowa-Cedar terraces are con
sidered contemporaneous terraces which occupy separate
river valleys in the Lake Calvin basin. Renaming of the
terraces previously identified by Schoewe (1920) was neces
sary. The term low terrace was retained but redefined to
include the landforms previously identified as the low, in
termediate, and Iowa-Cedar terraces.
No evidence of fluvial sediments was found in a tran
sect which traversed the sag in the divide near Columbus
Junction, previously thought to be the outlet to Lake Calvin.
The stratigraphy of the transect consists of loess-covered
Late Sangamon paleosols developed in pedisediment and till
and loess-covered Yarmouth-Sangamon paleosols developed in
swale-fill sediments, till-derived sediments, and till. If
Lake Calvin existed, the sag in the divide south of Columbus
Junction was not its outlet.
The till deposits in the area around Columbus Junction
are correlated as Pre-Illinoian, undifferentiated till of the
Wolf Creek Formation based on the presence of Late Sangamon
and Yarmouth-Sangamon paleosols, clay mineralogy, and calcite/
dolomite ratios of the till.

228
Pédologie Investigations in the Lake Calvin Region
Selected soils in the uplands and high terrace were par
titioned into three groups on the basis of their stratigraphy
and parent material. Soil group No. I consists of well-
drained loess-derived soils on gently sloping convex upland
summits. The loess has a low sand content and is free of
intercalated sand. Soil group No. II consists of well-
drained loess-derived soils on gently sloping positions on
the high terrace and loess-derived soils with restricted
drainage on nearly level positions on the high terrace. The
group No. II soils have a stratigraphie sequence of loess
overlying aeolian sand, and/or alluvial sand, or alluvium,
and a paleosol developed in alluvium. Soil group No. Ill
consists of well-drained loess-derived soils on gently slop
ing, convex, upland summits. The loess has either bands of
intercalated aeolian sand or a zone of aeolian sand between
the loess and paleosol.
Significant differences in the chemical, physical, and
morphological properties of the group No. I, II, and III
soils from the Lake Calvin region and representative soils
from east-central Iowa (RECI) were found.
Morphological characteristics
The group No. II and III soils had thicker sola than the
group No. I and RECI soils. The grade and type of structural
units in the lower part of the B horizon of the group No. II

229
differ from that of the group No. I and RECI soils. The
differences in physical, chemical, and morphological proper
ties were related to the highly permeable nature of the sub
jacent sand in the group No. II and III soils.
Clay
The depth to clay maximum and the weighted mean clay
content in the 25 cm to 102 cm zone were greater in the
group No. II and III soils than in the group No. I and RECI
soils. The greater depth to clay maximum and the higher clay
content in the 60 cm to 120 cm zone suggests that clay is
formed and/or translocated to a greater depth in the group
No. II and III soils.
EH In general, the pH depth distribution of the group No.
II soils decreased to a minimum in the upper part of the B
horizon, increased slightly with depth, then remained fairly
constant with depth to the C horizon. The pH depth distribu
tion of the group No. I and RECI soils decreased to a minimum
in the lower part of the A horizon or the upper part of the
B horizon, then increased with depth to the C horizon.
Available phosphorus
The depth to minimum available phosphorus (AP) content
in the zone of AP eluviation in the group No. II and III
Tama soils is at a greater depth in the solum than in the

230
group No. I and RECI Tama soils. The group No. I, II, and
III Tama soils have a significantly higher maximum AP con
tent in the solum than the RECI Tama soils. The depth to
the AP maximum in the solum of the group No. II and III soils
is greater than in the group No. I and RECI Tama soils.
The depth to maximum AP content in the group No. II and
III Clinton and Inton soils is at a greater depth than in the
group No. I Clinton soils.
The group No. II Muscatine and Garwin soils also display
a trend of greater depth to AP maximum in the solum when com
pared to RECI Muscatine and Garwin soils. The group No. II
Muscatine and Garwin soils have more strongly expressed zones
of AP eluviation and illuviation than the RECI Muscatine and
Garwin soils. The greater depth to AP maximum is interpreted
as reflecting a greater degree of profile development in the
group No. II and III soils.
Total phosphorus
The group No. II and III Tama soils have a lower minimum
total phosphorus (TP) content in the zone of TP eluviation
and lower maximum TP content in the zone of TP illuviation
as compared to the group No. I and RECI Tama soils. The
depth to TP maximum in the sola of the group No. II and III
Tama soils is significantly greater than in the group No. I
and RECI Tama soils. The l/E ratio of the group No. II and
III Tama soils is significantly greater than in the group No.

231
I and RECI Tama soils.
The group No. II and III Clinton and Inton soils have
a trend of increasing depth to the maximum TP content in
the solum and a greater l/E ratio as compared to the group
No. I Clinton soils. The group No. II and III Tama and
Clinton soils display a trend of decreasing TP content in
the lower part of the B3 horizon and in the C horizon. The
group No. I and RECI soils increase in TP content with depth
in the C horizon.
The maximum TP content in the solum is significantly
lower in the group No. II Muscatine and Garwin soils. The
group No. II Muscatine and Garwin soils have a trend of a
greater depth to maximum TP in the solum than the RECI
Muscatine and Garwin soils. The decrease in TP content be
low the zone of TP illuviation in the group No. II Muscatine
and Garwin soils is more strongly expressed than in the
group No. II Tama and Clinton soils. Based on redistribu
tion of TP, the group No. II Muscatine and Garwin soils are
considered more strongly developed than the group No. I and
RECI Muscatine and Garwin soils.
On the basis of differences in solum thickness, clay,
pH, AP and TP depth distributions, and l/E ratios, the group
No. II and III soils are considered more strongly developed
than the group No. I and RECI soils.

232
LITERATURE CITED
Alden, W. C., and M. M. Leighton. 1917. The lowan drift, a review of the evidences of the lowan stage of glaciation. Iowa Geol. Survey Ann. Kept. 26: 49-212.
Arnold, R. W. 1965. Multiple working hypotheses in soil genesis. Soil Sci. Soc. Amer. Proc. 29; 717-725.
Arnold, R. W., and F. F. Riecken. 1964. Grainy gray ped coatings in Brunizem soils. Iowa Acad. Sci. Proc. 71: 350-360.
Bauwin, G. R., and E. H. Tyner. 1957. The distribution of non-extractable phosphorus in some Gray-Brown Podzolic, Brunizem, and Planosol soil profiles. Soil Sci. Soc. Amer. Proc. 21: 245-250.
Bicki, T. J. 1977. Relationship of physical and morphological properties to water movement and retention in selected Iowa soils. Unpublished M.S. thesis. Library, Iowa State University, Ames, Iowa.
Bicki, T. J. 1980. Available and total phosphorus distributions in modern sola and paleosols. In G. R. Hallberg, T. E. Fenton, T. J. Kemmis, and G. A. Miller (eds.) Yarmouth revisited. Guidebook 27th Field Conference. Midwest Friends of the Pleistocene, May 30-June 1, 1980. Iowa Geol. Survey, Iowa City, Iowa.
Birchett, J. R. 1974. Plant-available and chemically-extractable P in selected Iowa soil profiles developed in deep loess. Unpublished Ph.D. dissertation. Library, Iowa State University, Ames, Iowa.
Bray, R. H., and L. T. Kurtz. 1945. Determination of total, organic, and available forms of phosphorus in soils. Soil Sci. 59: 39-45.
Calvin, S. 1896. Geology of Johnson County, Iowa. Geol. Survey Ann. Rept. 7: 35-116.
Coleman, T. L. 1980. The influence of stratigraphy and landscape position in the genesis of upland loess-derived soils of southern Iowa. Unpublished Ph.D. dissertation. Library, Iowa State University, Ames, Iowa.
233
Collins, M. E. 1977. Comparison of soil survey techniques in Tama County, Iowa, 1905, 1950, 1977. Unpublished M.S. thesis. Library, Iowa State University, Ames, Iowa.
Corliss, J. F. 1958. Genesis of loess-derived soils in southeastern Iowa. Unpublished Ph.D. dissertation. Library, Iowa State University, Ames, Iowa.
Corliss, J. F., and R. V. Ruhe. 1955. The lowan terrace and terrace soils of the Nishnabotna valley in western Iowa. Iowa Acad. Sci. Proc. 62i 345-360.
Dick, W., and M. A. Tabatabai. 1977. An alkaline oxidation method for determination of total phosphorus in soils. Soil Sci. Soc, Amer. J. 41: 511-514.
Dreimanis, Aleksis. 1962. Quantitative determination of calcite and dolomite by using Chittick apparatus. J. Sediment. Petrol. 32: 520-529.
Fenton, T. E. 1966. Soils, weathering zones and landscapes in the upland loess of Tama and Grundy Counties, Iowa. Unpublished Ph.D. dissertation. Library, Iowa State University, Ames, Iowa.
Fenton, T. E., F. F. Riecken, and J. E. Seaholm. 1967. Effect of vegetation on total phosphorus distribution in some Iowa soils. Agron. Abstr. 1969: 117,
Frye, J. C., H. D. Glass, and H. B. Willman. 1962. Stratigraphy and mineralogy of the Wisconsinan loesses of Illinois. Illinois Geol. Survey Circ. 334.
Frye, J. C., H. D. Glass, and H. B. Willman. 1968. Mineral zonation of Woodfordian loesses in Illinois. Illinois Geol. Survey Circ. 427.
Godfrey, Curtis. 1951. Distribution and nature of phosphorus in a geo-chrono-sequence of loess-derived soils. Unpublished Ph.D. dissertation. Library, Iowa State University, Ames, Iowa.
Godfrey, C. L., and F. F. Riecken. 1954. Distribution of phosphorus in some genetically related loess-derived soils. Soil Sci. Soc. Amer. Proc. 18: 80-84.

234
Hallberg, G. R., T. E. Fenton, and G. A. Miller. 1978a. Standard weathering zone terminology for the description of quaternary sediments in Iowa. In G. R. Hallberg (ed.) Standard procedures for evaluation of quaternary materials in Iowa. Tech. Inf. Series 8; 75-109. Iowa Geol. Survey, Iowa City, Iowa.
Hallberg, G. R., J. R. Lucas, and C. M. Goodman. 1978b. Semi-quantitative analysis of clay mineralogy. In G. R. Hallberg (ed.) Standard procedures for evaluation of quaternary materials in Iowa. Tech. Inf. Series 8: 5-23. Iowa Geol. Survey, Iowa City, Iowa.
Hallberg, G. R., N. C. Wollenhaupt, and J. T. Wickham. 1980a. Pre-Wisconsin stratigraphy in southeast Iowa. In G. R. Hallberg (ed.) Illinoian and Pre-Illinoian stratigraphy o f s o u t h e a s t I o w a a n d a d j a c e n t I l l i n o i s . T e c h . I n f . Series 11: 1-111. Iowa Geol. Survey, Iowa City, Iowa.
Hallberg, G. R., T. E. Fenton, T. J. Kemmis, and G. A. Miller. 1980b. Yarmouth revisited. Guidebook 27th Field Conference. Midwest Friends of the Pleistocene, May 30-June 1, 1980. Iowa Geol. Survey, Iowa City, Iowa.
Illinois Agricultural Experiment Station. 1955. Loess-derived gray-brown podzolic soils in the upper Mississippi River valley. Bull. 5 87.
Iowa Agriculture and Home Economics Experiment Station. 1978, Soil association map of Iowa.
Jackson, M. L. 195 8. Soil chemical analysis. Prentice-Hall , Inc., Englewood Cliffs, New Jersey.
Kemmis, T. J., and G. R. Hallberg. 1980. Matrix carbonate data for tills in southeast Iowa. In G. R. Hallberg (ed.) Illinoian and Pre-Illinoian stratigraphy in s o u t h e a s t e r n I o w a a n d a d j a c e n t I l l i n o i s . T e c h . I n f . Series 11: 185-197. Iowa Geol. Survey, Iowa City, Iowa.
Kilmer, V. J., and L. T. Alexander. 1949. Methods of making mechanical analyses of soils. Soil Sdi. 68; 15-24.
Leighton, M. 1916. Pleistocene history of Iowa River valley, north and west of Iowa City in Johnson County. Iowa Geol. Survey Ann. Rept. 25: 169-181.
Leverett, F. 1899. Illinois glacial lobe. U.S. Geol. S u r v e y M o n o g r a p h 3 8 .

235
Leverett, F. 1941. Re-establishment of the Mississippi River after the Illinoian glaciation. Geol. Soc. Amer. Bull. 52: 1290.
Leverett, F. 1942. Shifting of the Mississippi River in relation to glaciation. Geol. Soc. Amer, Bull. 53: 1283-1298.
Lineback, J. A. 1979. The status of the Illinoian glacial stage. Midwest Friends of the Pleistocene 25th Field Conference. Illinois State Geol. Survey Guidebook 13: 69-78.
Luce, H. D. 1973. Soil factors influencing percolation test performance of some Iowa soils. Unpublished M.S. thesis. Library, Iowa State University, Ames, Iowa.
McGee, W. J. 1891. The Pleistocene history of northeastern Iowa. U.S. Geol. Survey 11th Ann. Rept. 11: 189-577.
McKim, H. 1972. Porosity and iron relationships in loessial prairie soils of southern Iowa. Unpublished Ph.D. dissertation. Library, Iowa State University, Ames, Iowa.
Miller, G. A. 1974. Soil parent material, stratigraphy and soil development. Cedar County, Iowa. Unpublished Ph.D. thesis. Library, Iowa State University, Ames, Iowa.
Norton, W. H. 1901. Geology of Cedar County. Iowa Geol. Survey Ann. Rept. 11: 281-396.
Oparaugo, S. 1979. Soil-landscape relationship in selected loess derived soils of Carroll and Jasper counties in Iowa. Unpublished M.S. thesis. Library, Iowa State University, Ames, Iowa.
Pearson, R. W., R. Spry, and W. H. Pierre. 1940. The vertical distribution of total and dilute acid soluble phosphorus in 12 Iowa soil profiles. J. Amer. Soc. Agron. 32: 683-693.
Richardson, J. L. 1974. Exchangeable aluminum and acidity in loess soils of south-central Iowa. Unpublished Ph.D. dissertation. Library, Iowa State University, Ames, Iowa.
Ruhe, R. V. 1956. Radiocarbon dates and Pleistocene chronological problems in the Mississippi Valley region: A discussion. J. Geol. 64: 191-193.

236
Ruhe, R. V. 1968. A review of Pleistocene Lake Calvin. Geol. Soc. Amer. North Central Sec. Field Trip Guidebook. Iowa Geol. Survey, Iowa City, Iowa.
Ruhe, R. V. 1969. Quaternary landscapes in Iowa. Iowa State University Press, Ames, Iowa.
Ruhe, R. v., and J. C. Prior. 1970. Pleistocene Lake Calvin, Eastern Iowa. Geol. Soc. Amer. Bull. 8ls 919-924.
Ruhe, R. v., R. B. Daniels, and J. G. Cady. 1967. Landscape e v o l u t i o n a n d s o i l f o r m a t i o n i n s o u t h w e s t e r n I o w a . U . S . Dept. Agric. Tech. Bull. 1349.
Ruhe, R. v., W. P. Dietz, T. E. Fenton, and G. F. Hall. 1968. lowan drift problem, northeastern Iowa. Iowa Geol. Survey Rept. Invest, 7: 1-40.
Runge, E.C.A., and F. F. Riecken. 1966. Influence of natural drainage on the distribution and forms of phosphorus in some Iowa prairie soils. Soil Sci. Soc. Amer. Proc. 30: 624-630.
Schermerhorn, E. J. 1979. Soil survey of Cedar County, Iowa. U . S . D . A . S o i l C o n s e r v a t i o n S e r v i c e , W a s h i n g t o n , D . C .
Schoewe, W. H. 1920. The origin and history of extinct Lake Calvin. Iowa Geol. Survey Ann. Rept. 29: 49-222.
Shaffer, P. R. 1954. Extension of Tazewell glacial sub-stage of western Illinois and eastern Iowa. Geol. Soc. Amer. Bull. 65: 443-456.
Smeck, N. E. 1973. Phosphorus: An indicator of pedogenetic weathering processes. Soil Sci. 15: 199-206.
Smeck, N. E., and E.C.A. Runge. 1971. Phosphorus availability and redistribution in relation to profile development in an Illinois landscape segment. Soil Sci. Soc. Amer. Proc. 35: 952-959.
Smith, G. D., W. H. Allaway, and F. F. Riecken. 1950. Prairie soils of the Upper Mississippi River Valley. Adv. in Agron. 2: 157-205.
Snedecor, G. W., and W. G. Cochran. 1967. Statistical methods. 6th edition. Iowa State University Press, Ames, Iowa.

237
Soil Survey Staff. 1951. Soil survey manual. U.S.D.A. H a n d b o o k N o . 1 8 .
Soil Survey Staff. 1966. Soil survey laboratory data and descriptions for some soils of Iowa. Soil Survey Investigations Report No. 3.
Soil Survey Staff. 1975. Soil taxonomy. U.S.D.A. Handbook No. 436.
Soil Survey Staff. 1979. Official series descriptions for the Tama and Clinton soil series. U.S.D.A. Soil Cons e r v a t i o n S e r v i c e , W a s h i n g t o n , D . C .
Tabatabai, M. A., and J. M. Bremner. 1970. Use of the Leco automatic 70-second carbon analyzer for total carbon analysis of soils. Soil Sci. Soc. Amer. Proc. 34; 608-610.
Tembhare, B. 1973. Available and inorganic forms of phosphorus in selected Alfisols and Mollisols. Unpublished Ph.D. dissertation. Library, Iowa State University, Ames, Iowa.
Trowbridge, A. C., A. J. Williams, J. C. Frye, and F. A. Swenson. 1941. Pleistocene history of Mississippi R i v e r . I o w a A c a d . S c i . P r o c . 4 8 : 2 9 6 .
Udden, J. A. 1899. Geology of Muscatine County. Iowa Geol. Survey Ann. Rept. 9: 249-388.
Udden, J. A. 1901. Geology of Louisa County. Iowa Geol. Survey Ann. Rept. 11: 57-126.
Walter, N. F., and G. R. Hallberg. 1980. Analysis of matrix calcite and dolomite by the Iowa State University soils lab. In George R. Hallberg (ed.) Illinoian and Pre-Illinoian stratigraphy of southeastern Iowa and adjacent Illinois. Tech. Info. Series 11: 199-206. Iowa Geol. Survey, Iowa City, Iowa.
Walter, N. P., G. R. Hallberg, and T. E. Fenton. 1978. Particle-size analysis by the Iowa State University Soil Survey Laboratory. In G. R. Hallberg (ed.) Standard procedures for evaluation of Quaternary materials in Iowa. Tech. Info. Series 8; 75-109. Iowa Geol. Survey, Iowa City, Iowa.

238
Wickham, J. T. 1980. Status of the Kellerville Till Member in western Illinois. In George R. Hallberg (ed.) Illinoian and Pre-Illinoian stratigraphy of southeastern Iowa and adjacent Illinois. Tech. Info. Series 11; 151-179. Iowa Geol. Survey, Iowa City, Iowa.
Willman, H. B., and J. C. Frye. 1970. Pleistocene stratigraphy of Illinois. Illinois Geol. Survey Bull. 94: 1-204.
Wollenhaupt, N. C. 1980. Substratum and slope influences on soil morphology of some loess-derived soils in Clayton Co., Iowa. Unpublished M.S. thesis. Library, Iowa State University, Ames, Iowa.
239
ACKNOWLEDGMENTS
The author expresses his deepest appreciation and grati
tude to Dr. Thomas E. Fenton for his recommendation to a re
search associate appointment and his advice and supervision
during the writing of the dissertation. I am deeply indebted
to Dr. George Hallberg of the Iowa Geological Survey. George
provided invaluable counsel, technical advice, and friendship
throughout the course of study.
The special effort and contributions provided by my
colleagues Steve Esling and Jerry Nott of the University of
Iowa are greatfully appreciated. The tremendous amount of
field work that was completed would not have been possible
without their assistance. Our work in the Lake Calvin region
promoted a stronger working relationship between the Univer
sity of Iowa Geology Department and the Iowa State University
Agronomy Department,
A special thanks is due my beautiful wife Nora. Her
perseverance in the field, precision in the laboratory, and
patience during the preparation of the dissertation is
greatly appreciated.
The advice and criticism given by the author's committee,
Drs. Wayne Scholtes, A. D. Scott, Richard Handy, and Robert
Cody, and by Dr. F. F. Riecken, is also greatly appreciated.

240
APPENDIX A. PROFILE DESCRIPTIONS
The following is a list of terms, symbols and abbrevia
tions used in the description of soil profiles and weathering
zones.
Horizon and/or weathering zone:
Standard horizon nomenclature (U.S. Soil Survey Staff, 1951) and standard weathering zone terminology (Hallberg e t a l . , 1 9 7 8 a ) .
Depth :
In centimeters (cm) measured from the top of the A horizon.
Color :
The mathematical notations are taken from the Munsell Color Charts. Colors are for moist conditions unless specified dry. When two colors exist, they will be separated by the word "and" or "+", with the most abundant color first, i.e., lOYR 2/l and 4/2.
Texture:
Standard nomenclature (U.S. Soil Survey Staff, 1951).
c - clay cl - clay loam f i s l - f i n e s a n d y l o a m h - heavy 1 - light 1 - loam
Structure (str):
Is - loamy sand si - silt sic - silty clay sicl - silty clay loam sil - silt loam
Standard nomenclature (U.S. Soil Survey Staff, 1951).
Grade mod - moderate St - strong vwk - very weak wk - weak
Size CO - coarse fi - fine med - medium th - thin tk - thick vfi - very
fine vth - very
thin
Type abk - angular blocky -* - breaking to clod - cloddy gran - granular mass - massive pi - platy prism - prismatic sbk - subangular
blocky

241
Mottling:
A description of colors and patterns are used. Colors are given in terms of Munsell nomenclature. Patterns are as follows s
Abundance
c - common f - few m - many
Size
CO - coarse fi - fine med - medium vfi - very fine
Contrast
d - distinct fa - faint p - prominent
Note: Patterns are noted as follows: abundance, size, contrast, i.e., c fi d
Consistence:
Standard nomenclature (Soil Survey Staff, 1951) for moist consistence.
f i r - f i r m fri - friable vfir - very firm vfri - very friable
Reaction:
Given in units of pH.
Boundary (bdy):
Standard nomenclature (U.S. Soil Survey Staff, 1951)
Distinctness
abr - abrupt clr - clear gr - gradual
Weathering zones:
D - deoxidized J - jointed L - leached M - mottled
Abbreviationsi
carb - carbonates chl - channels conc - concretion cont - continuous cts - coats deox- deoxidized
Topography
sm - smooth
0 - oxidized R - reduced U - unleached 2 - secondary carbonates
dev - developed disc - discontinuous ext - exterior Fe - iron fil - fillings frg - fragments

242
gry - grainy in - interior inter - intercalated krot - krotovina lar - large mix - mixed mn - manganese mot - mottles
ox - oxides pa - patchy pri - primary pris - prisms sec - secondary stk - streaks str - structure "w/ - with
ncont - nearly continuous + - and
Lithologie discontinuities;
Roman numerals are assigned to the horizon designation to indicate a lithologie discontinuity. Horizon designations without Roman numerals are understood to be Roman numeral I.

243
Guide to Location o f Profile Descriptions and Laboratory Data
Profile Laboratory Transect and core descriptions data
Page Page
Riverside transect 245 308 Core 92BE105 245 308 Core 92BE104 246 308
92BE103 247 309 92BE102 248 309 92BE26 249 310 92BE115 250 310 92BE28 250 310 92BE112 251 311 92B111 253 312
Hills transect 255 313 Core 52B115 255 313
52B116 256 313 52B207 2 5 8 314
Gladwyn transect 260 315 Core 58BE108 260 316
58BE109 261 317 52BE107 263 315
Lone Tree transect 267 318 Core 52BE111 267 318
52B101 2 6 8 319 52B103 269 318 52B102 270 320
West Liberty I transect 271 321 Core 52BE120 271 321
52B105 272a 322 52BE122 272b 322
West Liberty II transect 274 323 Core 52B211 274 323
52B108 278 325 52B107 277 324 52B205 279 323 52B109 280 326
West Liberty IV transect 281 327 Core 52B206 281 327
52B104 282 328

244
Profile Laboratory Transect and core descriotions data
Page Page
Iowa City East transect 284 329 Core 52B204 2 84 329
52B217 285 330
Nichols transect 287 331 Core 52BB101 287 331
70BB102 2 8 8 331 70BB103 289 332
Conesville transect 290 332 , Core 58BB104 290 332
58BB105 291 332 70BB106 291 332
Columbus Junction transect 293 333 Core 58BEN5 293 333
58BB107 295 333 58BEN2 296 334 58BEN4 298 335 58NE65 299
West Liberty III 301 336 Core 52BE14 301 336
52B220 320 337 52B219 303 337 52B212 304 337 52B209 305-306 338

245
Transect I Riverside Core: 92BE105 Location: 15 m N and 15 m W of fence row corner in SE^
NW^ Sec 29 T77N R5W Slope: 3% convex Elevation: 235 m Landscape position: summit of divide Solum: Clinton sil Sampled by; T. Bicki and S. Esling Described by: T. Bicki
0-112 cm; I and IIB32t, lOYR 5/6 sil, wk med prism str, vfri, th disc lOYR 4/4 clay films on pris faces, f fi IOYR 2/l mn ox, pH 5.0, gr sm bdy, mixture of loess and aeolian sand.
122-160 cm; IXC, lOYR 6/6 sandy loam, mass, pH 5.3-5.0, aeolian sand.
160-434 cm; IIOL, lOYR 5/6 sand, single grain, loose, p H 6 . 0 - 5 . 2 .
434-442 cm; MOL, lOYR 5/3 Isil, m med d 7.5YR 5/6 mot, mass f fi 7.5YR 5/6 and 4/8 Fe conc, pH 6.0, loess.
442-460 cm; MDL, 5Y 6/1 sil, c med p IOYR 5/6 mot, mass, f f i 7 . 5 Y R 5 / 6 a n d 4 / 8 F e c o n c , p H 6 . 0 .
460-472 cm; MDL, 5Y 6/1 sil, c med p IOYR 5/6 mot, mass, f f i 2 . 5 Y R 5 / 6 a n d 4 . 8 F e c o n c , p H 7 . 3 .
472-518 cm; MOL, lOYR 5/4 sil, c med fa IOYR 6/2 mot, m a s s , p H 7 . 4 - 7 . 3 .
518-579 cm; MOL, lOYR 5/3 sil, c med fa lOYR 5/6 and 6 / 2 m o t , m a s s , p H 7 . 3 - 7 . 2 .
579-620 cm; Ab, 2.5Y 4/2 h sil, f fi d 5Y 5/l mot, wk fi sbk, str, fri, f fi lOYR 4/4 Fe conc, m med N2/0 wood frg, pH 7.0-6,9, Basal Wisconsin paleosol.
620-655 cm; B22tb, 5Y 3/2 h clay, st fi abk str, vfir, tk cont lOYR 4/2 clay films on peds, pH 6.8, gr sm bdy, Yarmouth-Sangamon paleosol.
655-691 cm; B23tb, 5Y 3/2 clay, st fi abk str, vfir, tk c o n t I O YR 4 / 2 c l a y f i l m s o n p e d s , p H 6 . 6 , g r s m b d y .
691-716 cm; B24tb, 5Y 5/l Iclay, c med d lOYR 4/6 and 5 / 6 m o t , s t f i a b k s t r , v f i r , t k c o n t N 3 / 0 c l a y f i l m s , p H 6 . 6 .

246
Core: 92BE104 Location: 23 m W and 13 m N of farm water well in SE% NW^
Sec 29 T77N R5W Slope: 2% convex Elevation: 235 m Landscape position: summit of divide Solum: Clinton sil Sampled by: T. Bicki and S. Esling Described by: T. Bicki
O-lO cm; Ap, lOYR 3/2 sil, lOYR 5/3 dry, clod wk fi gran str, fri, pH 6.5, cl sm bdy, loess.
10-23 cm; A21, lOYR 3/2 sil, lOYR 5/3 dry, wk th pi -» wk fi sbk str, fri, pH 6.2, clr sm bdy.
23-36 cm; A22, lOYR 4/3 hsil, wk fi sbk str, fri, pH 5.6, th pa lOYR 6/3 silt cts on peds, pH 5.6, clr sm bdy.
36-51 cm; Bl, lOYR 4/4 Isicl, mod fi and vfi sbk str, fri, th disc lOYR 6/3 silt cts on peds, pH 5.2, clr sm bdy.
51-69 cm; B21t, lOYR 4/4 sicl, mod fi sbk str, fri, th cont lOYR 4/4 clay films on peds, med cont lOYR 6/3 silt cts on peds, pH 5.2-5.1, clr sm bdy.
69-86 cm; B22t, LOYR 5/3 sicl, c fi fa LOYR 5/3 mot, st med abk str, firm, med cont LOYR 4/3 clay films on peds, med c o n t I O Y R 6 / 3 s i l t c t s o n p e d s , c f i L O Y R 2 / 1 m n o x , p H 5 . 2 -5.1, clr sm bdy.
86-107 cm; B23t, lOYR 5/3 h sicl, c fi fa lOYR 5/3 mot, mod med prism st med and fi abk str, firm, med cont lOYR 4/3 clay films on ped, med cont lOYR 6/3 silt cts on peds, med lOYR 2/1 mn ox, pH 5.2-5.1, gr sm bdy.
107-127 cm; B31t, lOYR 5/3 sicl, f fi lOYR 5/6 and 2.5YR 6/2 mot, mod med prism mod med abk str, fri, med cont lOYR 4/3 clay films on peds and pris, th disc lOYR 6/3 silt cts on peds, c fi lOYR 2/1 mn ox, pH 5.1, gr sm bdy.
127-147 cm; B32t, LOYR 5/3 sicl, f f i LOYR 5/6 and 2.5 YR 6/2 mot, st med prism st med and fi abk str, fri, med cont IOYR 4/3 clay films on pris, th pa LOYR 6/3 silt cts on peds, c med LOYR 2/1 mn ox, pH 5.2, gr sm bdy.
147-180 cm; B33t, LOYR 5/4 Isicl, c f LOYR 5/6 and 2.5 Y 6/2 mot, st med prism -+ st med and fi abk str, fri, med cont IOYR 4/3 clay films on pris, th pa LOYR 6/3 silt coats on peds, c med LOYR 2/l mn ox, pH 5.2, clr sm bdy.

247
180-188 cm; I and IIB34, lOYR 5/4 sil, wk med prism str, fri, th lOYR 4/4 chl fil, pH 5.2, abr sm bdy.
188-396 cm; IIC, lOYR 5/6 loamy sand, mass, pH 5.6-5.5, aeolian sand.
Core: 92BE103 Location: 9 m N and 25 m E of barn in NW% NE% sec 29 T77N R6W Slope: 3% convex Elevation: 230 m Landscape position: summit of interfluve Solum: Clinton sil Sampled by: T, Bicki and S. Esling Described by: T. Bicki
0-178 cm; solum dev in loess.
178-193 cm; I and IIB33t, lOYR 5/4 sil, c med d 2.5Y 5/2 mot, mod med prism str, fri, th ncont lOYR 4/3 clay films on pris, f fi lOYR 2/1 mn ox, pH 5.3, abr sm bdy, loess and aeolian sand.
193-305 cm; IIOL, lOYR 6/6 loamy sand, single grain, loose, pH 5.7, cl sm bdy, aeolian sand.
305-366 cm; OL, lOYR 5/4 sil, f fi fa 7.5YR 4/6 and f fi d 2.5Y 6/2 mot, mass, pH 5.7, cl sm bdy, loess.
366-457 cm; IIOL, lOYR 6/6 and 5/4 sand, single grain, loose, pH 6.2, gr sm bdy, aeolian sand.
457-503 cm; I+ IIOL, lOYR 5/4 sil,mass, gr sm bdy, pH 7.1, gr sm bdy, loess and aeolian sand.
503-579 cm; MOL, lOYR 6/4 sil, c med fa lOYR 5/6 and 5/8 mot, c med d 2.5Y 5/2 mot, mass, f fi lOYR 2/1 mn ox, pH 6.9, gr sm bdy, loess.
579-610 cm; IIIA2b, lOYR 4/2 sil, f fi fa lOYR 4/6 mot, f fi lOYR 3/6 stk, wk fi sbk str, fri, f wood frg, gr sm bdy. Late Sangamon paleosol dev in pedisediment.
610-630 cm; IIIBltb, lOYR 5/4 sil, c fi fa lOYR 5/6 mot, wk fi abk str, fri, th disc lOYR 4/3 clay films on peds, pH 6.8, gr sm bdy.
630-645 cm; IVB21tb, 7.5YR 4/4 clay, m med p 2.5YR 4/6 mot, st fi abk str, vfir, th cont 7.5YR 4/2 clay films on
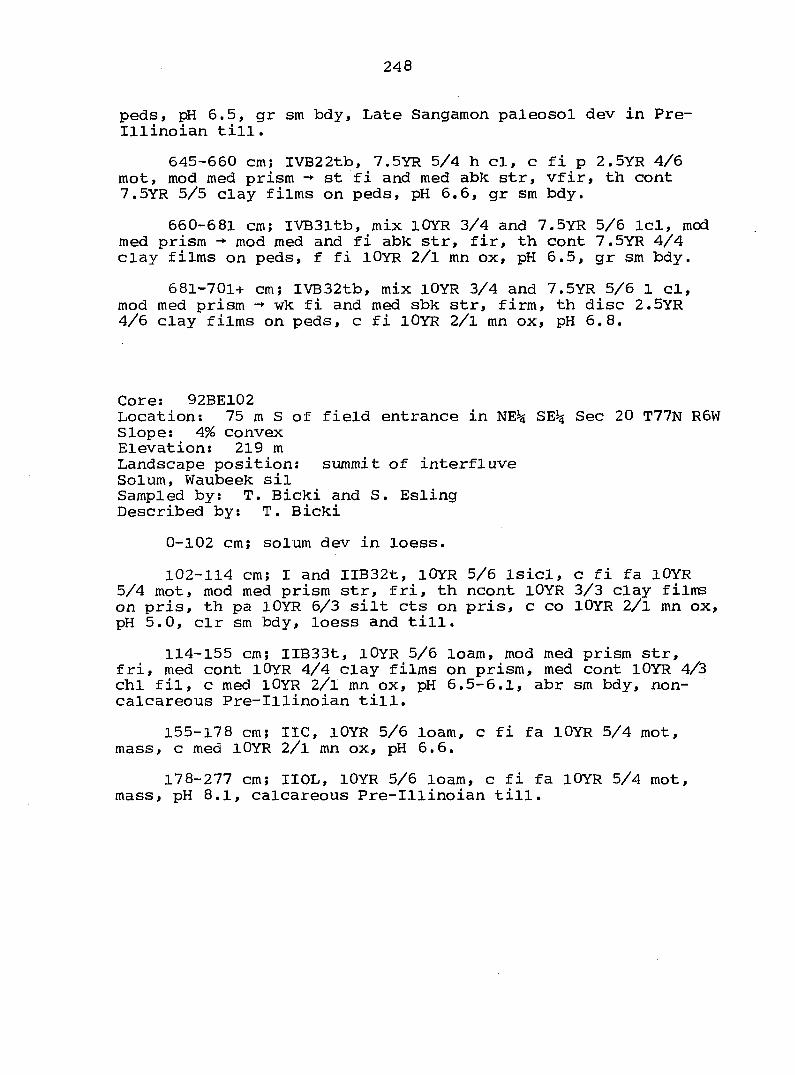
248
peds, pH 6.5, gr sm bdy. Late Sangamon paleosol dev in Pre-I l l i n o i a n t i l l .
645-660 cm; IVB22tb, 7.5YR 5/4 h cl, c fi p 2.SYR 4/6 mot, mod med prism st fi and med abk str, vfir, th cont 7.5YR 5/5 clay films on peds, pH 6.6, gr sm bdy.
660-681 cm; IVB31tb, mix LOYR 3/4 and 7.5YR 5/6 Icl, mod med prism -+ mod med and fi abk str, fir, th cont 7.5YR 4/4 clay films on peds, f fi IOYR 2/l mn ox, pH 6.5, gr sm bdy.
681-701+ cm; IVB32tb, mix lOYR 3/4 and 7.5YR 5/6 1 cl, mod med prism wk fi and med sbk str, firm, th disc 2.SYR 4 / 6 c l a y f i l m s o n p e d s , c f i l O Y R 2 / 1 m n o x , p H 6 . 8 .
Core; 92BE102 Location; 75 m S of field entrance in NE^ SE^ Sec 20 T77N R6W Slope; 4% convex Elevation: 219 m Landscape position: summit of interfluve S o l u m , W a u b e e k s i l Sampled by; T. Bicki and S. Esling Described by; T. Bicki
0-102 cm; solum dev in loess.
102-114 cm; I and IlB32t, lOYR S/6 Isicl, c fi fa lOYR 5/4 mot, mod med prism str, fri, th ncont lOYR 3/3 clay films on pris, th pa lOYR 6/3 silt cts on pris, c co lOYR 2/1 mn ox, p H 5 . 0 , c l r s m b d y , l o e s s a n d t i l l .
114-155 cm; IIB33t, LOYR S/6 loam, mod med prism str, fri, med cont IOYR 4/4 clay films on prism, med cont LOYR 4/3 chl fil, c med LOYR 2/l mn ox, pH 6.5-6.1, abr sm bdy, non-c a l c a r e o u s P r e - I l l i n o i a n t i l l .
155-178 cm; IIC, lOYR 5/6 loam, c fi fa lOYR 5/4 mot, m a s s , c m e d l O Y R 2 / l m n o x , p H 6 . 6 .
178-277 cm; IIOL, IOYR 5/6 loam, c fi fa lOYR 5/4 mot, m a s s , p H 8 . 1 , c a l c a r e o u s P r e - I l l i n o i a n t i l l .

249
Core: 92BE26 Location: 31 m N and 11 m W of NE corner of barn in SW%
sec 15 T77N R6W Slope: 3% convex Elevation: 195 m Lnadscape position: high terrace S o l u m : C l i n t o n s i l Sampled by: T. Bicki and S. Esling Described by: T. Bicki
0-188 cmJ solum dev in loess.
188-244 cm; OL, lOYR 5/4 h sil, f fi fa lOYR 6/2 and 5/8 mot, mass str, f fi lOYR 2/1 mn ox, pH 5.9, abr sm bdy, loess.
244-335 cm; IIOL, lOYR 6/8 sand, single grain, loose, pH 5.8, clr sm bdy, aeolian sand.
335-396 cm; DL, 2.5Y 6/2 sil, mass, pH 5.8, gr sm bdy, loess.
396-518 cm; IIIOL, lOYR 7/3 sand, single grain, loose, pH 5.8, gr sm bdy, sand.
518-732 cm; IIIOL, lOYR 6/3 sand, single grain, loose, pH 5.8, gr sm bdy, sand.
732-752 cm; IVMUL, 5Y 4/1 sil, c fi p 7.5YR 5/6 mot, mass, f fi lOYR 2/1 mn ox, pH 4.0, alluvial sediments.
752-767 cm; IVRL, 2.5Y 3/2 sil, mass, f wood frg, pH 3 . 5 , a l l u v i a l s e d i m e n t s .
767-782 cm; IVUL, 5Y 4/2 sil, mass, pH 3.2, alluvial sediments.
782-859 cm; IVUL, 5Y 5/1 sicl, mass, pH 3.9, alluvial sediments.
859-884 cm; IVUL, 5Y 5/l h sicl, mass, vfir, pH 3.9, alluvial sediments,
884-960 cm; VDL, lOYR 5/l sand, single grain, loose, pH 4 . 6 , c r o s s - b e d d e d a l l u v i a l s a n d s .
960-12 80; VDL, lOYR 5/1 sand, single grain, loose, pH 4.5, cross-bedded alluvial sands.

250
Core: 92BE115 Location: 41 m E of Highway 218 at field entrance in NW% SW%
Sec 15 T77N R6W Slope: 1% Elevation: 189 m Landscape position: low terrace Solum: Koszta sil Sampled by T. Bicki and S. Esling Described by: T. Bicki
0-119 cm; solum dev in alluvium.
119-191 cm; 2.5Y 6/2 sil, m med dist lOYR 4/4 and m med p 7.5YR 4/6 mot, mass, c fi and med 7.5YR 3/4 and 4.6 Fe conc, c m e d l O Y R 2 / l m n o x , f t h l O Y R 5 / 6 s a n d b a n d s , p H 5 . 6 - 5 , 5 , abr sm bdy, silty alluvium.
191-203 cm; lOYR 4/6 loam, mass, pH 5.6, abr sm bdy, sandy alluvium.
203-224 cm; 2.5Y 6/2 loam, mass, c th SYR 5/8 Fe bands, c th IOYR 5/6 sand bands, c th bands of 5YR 2/5/1 mn ox, pH 5.3, stratified alluvium.
224-305+ cm; II, lOYR 7.3 gravelly sand, with bands of lOYR 5/6 sand, single grain, pH 5.7, gravelly alluvial sand.
Core: 92BE28 Location: 32 m S and 93 m W of field entrance in SW^ Sec lO
T77N R6W Slope: 3% convex Elevation: 195 m Landscape position: high terrace Solum: Downs sil Sampled by: T. Bicki and S. Esling Described by: T. Bicki
0-239 cm; solum dev in loess.
239-262 cm; MOL, mix lOYR 6/4 and 6/6 sil, m fi fa lOYR 5/8 Fe ox, mass, c fi root chls, pH 5.6, loess.
262-305 cm; MOL, lOYR 6/3 sil, f fi p 5YR 5/8 Fe conc, m f i f a l O Y R 5 / 8 F e o x , m a s s f f i l O Y R 2 / 1 m n o x , p H 5 . 9 , clr sm bdy.
305-366 cm; IIOL, lOYR 5/4 sand, single grain, loose, pH 6.0, aeolian sand.

251
356-445 cm; IIOL, lOYR 5/4 sand, single grain, loose, f th bands of loess, pH 6.0.
445-549 cm; IIIOL, lOYR 5/4 sand, single grain, loose, pH 6.0, alluvial sand.
549-686 cm; IIIOL, lOYR 5/6 sand, single grain, loose, pH 6.3.
686-701 cm; IIIOL, lOYR 6/2 sand, single grain, loose, pH 6.4.
701-970 cm; IIIOL, lOYR 5/6 sand, single grain, loose, pH 6.6, alluvial sand.
970-1138 cm; IIIOL, lOYR 5/6 sand, single grain, loose, pH 6.8-6.7, alluvial sand and gravel.
1138-1158 cm; IVAlb, 5BG 4/1 sicl, w fi sbk str, fri, f sec car conc, pH 7.1, paleosol developed in alluvium.
1158-1252 cm; IVB2gb, 5BG 4/l sicl, wk fi and' fi sbk str, th disc IOYR 7/2 (dry) silt cts on peds, f sec car conc, pH 7.2.
1252-1267 cm; IVB3gb, 5BG 4/1 sicl, wk fi sbk str, pH 7.1,
1267-1280 cm; IVCg, 5BG 4/1 Id, mass, c pri car conc, f inter sand bands, pH 7.5, alluvium.
1280-1311 cm; IVUU, 5Y 4/1 sicl, mass, m pri car conc, pH 7.5.
Core: 92BE112 Location; 95 m W and 33 m S of field entrance on Highway 218
in NE^ NE?s Sec 9 T77N R6W Slope; 2% convex Elevation; 226 m Landscape position; interfluve summit Solum; Clinton sil Sampled by; T. Bicki and S. Esling Described by; T. Bicki and S. Esling
O-lO cm; Ap, lOYR 3/2 sil, wk fi gran str, fri, pH 6.4, abr sm bdy, loess.
10-23 cm; A2, IOYR 4/2 sil, wk th pi str, fri, pH 6.6, abr sm bdy.

252
23-46 cm; Bit, lOYR 4/3 sicl, mod vfi and fi sbk str, fri, th disc lOYR 3/3 clay films on peds, th disc lOYR 7/2 (dry) silt cts on peds, f fi lOYR 2/1 mn ox, pH 6.1, clr sm bdy.
46-66 cm; B21t, LOYR 4/4 h sicl, st fi and med abk str, fri, tk cont LOYR 4/3 clay films on peds, th pa IOYR 7/2 (dry) silt cts on peds, f fi LOYR 2/1 mn ox, pH 5.1-4.9, clr sm bdy.
66-89 cm; B22t, lOYR 4/4 h sicl, f fi fa lOYR 5/3 and 4/6 mot, wk med prism -» mod med abk str, fri, tk cont lOYR 4/3 clay films on peds, th pa lOYR 7/2 (dry) silt cts on peds, f med lOYR 2/1 mn ox, pH 5.2-5.1, gr sm bdy.
89-112 cm; B3lt, lOYR 5/6 sicl, c med d 2.5Y 6/2 mot, •wk med prism mod med and fi abk str, fir, tk cont lOYR 4/3 clay films on pris faces, f med lOYR 2/1 mn ox, pH 5.3, gr sm bdy.
112-137 cm; B32t, lOYR 5/6 sicl, f fi fa lOYR 5/8 mot, c fi d 2.5Y 6/2 mot, mod med prism -* mod med and fi abk str, fir, tk cont lOYR 4/3 clay films on pris faces, f fi lOYR 2A mn ox, pH 5.4, gr sm bdy.
137-163 cm; B33t, lOYR 5/6 1 sicl, f fi fa lOYR 5/8 mot, c fi d 2.5Y 6/2 mot, mod med prism -• wk fi and med abk str, fir, th cont lOYR 4/3 clay films on pris faces, pH 5.5, gr sm bdy.
163-175 cm; B34t, lOYR 5/4 1 sicl, f fi fa lOYR 5/6 mot, c fi d 2.5Y 6/2 mot, mod med prism -• wk fi and med abk, fir, th disc lOYR 4/3 clay films on pris faces, pH 5.7, gr sm bdy.
175-246 cm; OL, C, lOYR 5/4 and 5/6 sil, c fi d 2.5Y 6/2 mot, mass f fi lOYR 2/l mn ox, pH 5.8-5.7, loess.
246-305 cm; MOL, lOYR 5/4 and 5/6 sil, m fi and med 2.5Y 6/2 mot, mass, pH 5.9-6.3.
305-396 cm; MOL, lOYR 5/4 and 2.5Y 6/2, mass, f fi lOYR 2/1 mn ox, pH 6.3-6.8.
396-437 cm; Alb, lOYR 5/4 sil, wk fi sbk wk fi gran str, fri, th disc lOYR 3/2 chl fil, f fi lOYR 2/1 mn ox, pH 7.0, gr sm bdy. Basal Wisconsin paleosol.
437-462 cm; C, lOYR 5/4 sil, mass, f th disc lOYR 3/2 fil in chl, f fi lOYR 2/1 mn ox, pH 7.1, clr sm bdy.

253
462-483 cm; IIBlb, lOYR 4/3 h sil, wk fi sbk str, fri, f fi lOYR 2/1 mn ox, f fi and med wood frg, pH 7.2, Yarmouth-Sangamon paleosol.
483-490 cm; IIIB2ltb, 2.5Y 6/2 clay, c fi and med lOYR 5/8 mot, mod fi sbk str, fir, tk cont clay films on peds, th pa lOYR 7/2 (dry) cts, f fi lOYR 2/l mn ox, pH 7.2, gr sm bdy, Yarmouth-Sangamon paleosol.
490-508 cm; IIIB22tb, 2.5Y 5/2 1 clay, m med 2.5YR 3/6 Fe conc, str fi sbk str, fir, tk cont clay films on peds, th pa lOYR 7/2 (dry) cts, pH 7.3, gr sm bdy.
508-526 cm; IIIB23tb, 2.5Y 5/2 1 clay, c med d lOYR 5/8 Fe conc, str fi sbk str, fir, tk cont clay films on peds, th pa lOYR 7/2 (dry) cts, pH 7,3, gr sm bdy.
526-544 cm; IIIB3b, 2.5Y 5/2 and 4/2 1 clay, f fi and med 5GY 4/1 mot, c fi and med lOYR 5/8 mot, str fi sbk str, fir, pH 7.3, gr sm bdy.
544-579 cm; IIIC, 7.5YR 5/8 cl, c med d lOYR 6/3 mot, mass, pH 7.4, Pre-Illinoian till.
Core: 92B111 Location: 153 m N of field gate and 117 m E of farm lane
fence in SW% SEJ^ Sec 16 T77N R6W Slope: 2% Elevation: 198 m Landscape position: high terrace Solum: Clinton sil Sampled by T. Bicki Described by: T. Bicki
0-13 cm; Ap, lOYR 3/2 (lOYR 5/2 dry) sil, wk fi gran str, fri, pH 6.8, clr sm bdy, loess.
13-25 cm; A2l, lOYR 4/2 sil, mod th pi -+ mod fi + vfi sbk str, fri, f vth pa lOYR 7/2 (dry) silt cts, pH 6.8, clr sm bdy.
25-36 cm; A22, lOYR 4/2 sil, mod tk pi -» mod fi + vfi sbk str, fri, f vth pa lOYR 7/2 (dry) silt cts, pH 6.6, clr sm bdy.
36-43 cm; Bl, lOYR 4/3 Isicl, wk fi sbk str, fri, f vth pa lOYR 7/2 (dry) silt cts, pH 6.6, clr sm bdy.

254
43-61 cm; B21t, lOYR 4/3 sicl, st fi + vfi abk str -* mod vfi sbk str, fir, med cont lOYR 4/4 clay films, c th disc lOYR 7/2 (dry) silt cts, pH 6.5-6.4, gr sm tody.
61-81 cm; B22t, lOYR 5/4 hsicl, st med + fi abk str, fir, med cont lOYR 3/3 clay films, med cont lOYR 7/2 (dry) silt cts, f fi lOYR 2/1 mn ox, pH 6.2-6.1, gr sm bdy.
81-102 cm; B23t, lOYR 5/4 sicl, st med abk str, med cont lOYR 3/3 clay films, med cont lOYR 7/2 (dry) silt cts, c fi lOYR 2/1 mn ox, pH 5,9-5.5, gr sm bdy.
102-117 cm; B24t, lOYR 5/4 sicl, mod med prism str st med + fi sbk str, fir, med cont lOYR 3/3 clay films on pris, th pa IOYR 3/3 clay films on peds, th pa lOYR 7/2 (dry) silt cts, f fi lOYR 2/1 mn ox, c fi + vfi rt chl, pH 5.4, gr sm bdy.
117-137 cm; B25t, same as above except pH 5.4-5.3.
137-158 cm; B31t, same as above except Isicl, f fi fa lOYR 5/6 mot, mod med prism str -+ mod med abk str, and pH 5.3.
158-185 cm; B32t, lOYR 6/4 Isicl, m med d lOYR 5/6 + 5/8 mot, mod med prism str -• wk med abk str, fri, th cont lOYR 4/3 clay films on pris, c lOYR 4/4 rt chl fil, th pa lOYR 7/2 (dry) silt cts, c med lOYR 2/1 conc, pH 5.3, gr sm bdy.
185-213 cm; B33t, same as above except pH 5.4.
213-241 cm; B34, lOYR 5/4 sil, c fi fa lOYR 5/6 + 5/8 mot, mod med prism str, fri, c lOYR 4/4 rt chl fil, vth pa lOYR 7/2 (dry) silt cts, c med lOYR 2/1 mn conc, pH 5.5, gr sm bdy.
241-305 cm; CI, lOYR 5/4 sil, f fi fa lOYR 5/6 mot, mass, c IOYR 4/4 rt chl fillings, f fi lOYR 2/1 mn conc, pH 5.5-5.6, clr sm bdy.
305-488 cm; IIC2, lOYR 6/4 si, mass, pH 5.7, aeolian sand.

255
Transect: Hills Core: 52B115 Location: 53 m S and 3l m W of NE corner NW^ NE% Sec 9
T78N R6W Slope: 3% linear Elevation 207 m Landscape position: sideslope of interfluve divide Solxom: Tama Isicl Sampled by: T. Bicki Described by: T. Bicki
0-137 cm; solum dev in loess.
137-152 cm; OL, lOYR 5/4 h sil, f fi fa lOYR 5/6 and 6/2 mot, mass, c med 7.SYR 3/2 mn ox, pH 6.0, loess.
152-323 cm; OL, lOYR 5/4 sil, c fi fa lOYR 5/6 mot, f fi d 2.5Y 6/2 mot, mass, c med 7.5YR 3/2 mn ox, f fi root chl, pH 6.0, abr sm bdy.
323-333 cm; OL, lOYR 6/6 1 sil, mass, pH 6.5, clr sm bdy, sand band in loess.
333-381 cm; OL, lOYR 5/4 1 sil, c fi and med fa lOYR 6/2 mot, mass, m med 7.5YR 3/2 mn ox, pH 7,1, abr sm bdy, loess.
381-422 cm; OL, lOYR 6/6 1 sil, mass, pH 7.3 clr sm bdy, loess with inter sand bands.
422-488 cm; MOU, lOYR 5/4 1 sil, c med d 7.5YR 5/8, 5/6, and 6/2 mot, mass, m med and co 7.5YR 3/2 mn stks, pH 7.6, clr sm bdy, loess with inter sand bands.
488-559 cm; MDU, 2.5Y 5/2 1 sil, m med and cod 7.5YR 5/8 mot, m med lOYR 4/6 and 3/6 Fe conc (pipestems), mass, c fi IOYR 2/1 mn ox, pH 7.6, clr sm bdy, loess with high sand content.
559-577 cm; Ab, 7.5YR 5/2 sil, f fi fa 7.5YR 4/4, wk fi sbk str, fri, f N 2/0 wood frg, f fi lOYR 2/1 mn ox, pH 7.4, gr sm bdy. Basal Wisconsin paleosol.
577-617 cm; IIMOU, lOYR 5/3 1 sil, m med and fi d 7.5YR 4.6 mot, mass, f fi lOYR 2/l mn ox, pH 7.3-7.2, pedisediment.
617-640 cm; IIA2b, lOYR 5/3 sil, m med and fi d 7.5YR 4/6 mot, wk fi sbk, fri, f fi lOYR 2/1 mn ox, pH 7.1, Late Sangamon paleosol dev in pedisediment.
640-660 cm; IIBltb, lOYR 6/3 Icl, c med and fi d 7.5YR

256
4/6 mot, mod fi abk mod vfi abk str, fri, tk cont 7.SYR 3/2 clay films on peds, f fi lOYR 2/1 mn ox, pH 7.1, abr sm bdy.
660-671 cm; III, lOYR 5/6 Id, c fi fa 7.5YR 5/8 mot, pH 7.1, abr sm bdy, stone line.
671-701 cm; IIIB2tb, LOYR 5/4 and 5/3 1 clay, c med p 2.5YR 3/6 mot, mod fi abk mod vfi abk str, vfir, tk cont IOYR 5/6 clay films on peds, f fi LOYR 2/1 mn ox, pH 7.5, Late Sangamon paleosol dev in Pre-Illinoian till.
Core: 52B116 Location; 32 m N and 305 m E of SW corner NW% SW^ Sec 4
T78N R6W Slope: 2% convex Elevation: 201 m Landscape position: high terrace Solum: Tama 1 sicl Sampled by: T. Bicki Described by: T. Bicki
0-18 cm; Ap, lOYR 3/2 Isicl, wk fi and vfi gran str, fri, pH 6.8, gr sm bdy, loess.
18-28 cm; Al2, lOYR 3/2 1 sicl, wk fi and vfi gran str, fri, pH 6.8, gr sm bdy.
28-41 cm; A13, lOYR 3/3 sicl, wk, vfi sbk -» wk fi gran str, fri, ped ext lOYR 3/2, pH 6.6, gr sm bdy.
41-58 cm; Bl, lOYR 4/3 sicl, mod vfi sbk str, fri, ped ext lOYR 3/3, krot in upper part of horizon, pH 6.3-6.0, gr sm bdy.
58-74 cm; B21t, lOYR 5/4 sicl, mod fi sbk -• mod vfi sbk str, fri, th disc lOYR 4/3 clay films on peds, f fi lOYR 2/1 mn ox, pH 5.7-5.9, gr sm bdy.
74-89 cm; B22t, LOYR 5/4 Isicl, mod fi abk mod fi and vfi abk str, fri, th disc LOYR 4/3 clay films on peds, vth pa IOYR 7/2 (dry) silt cts, f fi LOYR 2/1 mn ox, pH 5.9, gr sm bdy.
89-102 cm; B23t, lOYR 5/4 Isicl, f fi fa IOYR 5/3 mot, wk med prism mod fi abk str, fri, th ncont IOYR 4/3 clay films on pris, th disc IOYR 7/2 (dry) silt cts on peds, f fi 7.5YR 3/2 mn ox, pH 6.0, gr sm bdy.

257
102-119 cm; B31t, lOYR 5/4 Isicl, f fi fa lOYR 5/3 mot, mod med prism wk med abk str, fri, pris extlOYR 5/3, th ncont, lOYR 4/3 clay films on pris, med cont lOYR 7/2 (dry) silt cts on pris, th disc lOYR 7/2 silt cts on peds,c fi root chl, f fi 7.5YR 3/2 mn ox, pH 6.0-6.1, gr sm bdy.
119-140 cm; B32t, LOYR 5/4 Isicl, f fi fa LOYR 6/3 mot, mod med prism wk med abk str, fri, th cont LOYR 4/3 clay films on pris, th disc LOYR 7/2 (dry) silt cts on pris and peds, c fi and vfi root chl, th disc LOYR 5/3 fil in chl, f fi IOYR 2/1 mn ox, pH 6.1, gr sm bdy.
140-160 cm; B33, LOYR 5/4 sil, f fi fa IOYR 6/3 and 5/6 mot, mod med prism -+ wk med abk str, fri, th pa LOYR 7/2 (dry) silt cts, th pa LOYR 4/3 root chl fil, c fi and vfi root chl, f fi IOYR 2/1 mn ox, pH 6.2, gr sm bdy.
160-173 cm; B34, lOYR 5/4 sil, c fi and med lOYR 6/3, 5/6 and 5/8 mot, wk med prism wk med abk str, fri, th pa lOYR 4/3 root chl fil, f fi lOYR 2/l mn ox, pH 6.2, gr sm bdy.
173-213 cm; CI, lOYR 5/4 sil, f fi d 2.5Y 6/2 mot, f fi fa lOYR 5/6 mot, mass, f fi lOYR 2/l mn ox, pH 6.2, clr sm bdy.
213-254 cm; OL, lOYR 5/4 Isil, f fi fa lOYR 5/6 and 5/8 mot, mass f fi lOYR 2/1 mn ox, pH 6.1, abr sm bdy, loess with high sand content.
254-335 cm; IIOL, lOYR 5/4 loamy sand, single grain, loose, fi th d 7.5YR 5/8 Fe bands, pH 5.9, aeolian sand.
335-376 cm; OL, lOYR 5/4 Isil, c med d 2.5Y 6/2 and c med fa lOYR 5/6 mot, mass, f fi lOYR 2/1 mn ox, pH 5.8, loess with high sand content.
376-391 cm; IIOL, lOYR 6/6 loamy sand, single grain, pH 6.0, aeolian sand.
391-455 cm; Alb, 2.5Y 6/2 Isil, c fi d lOYR 5/6 and c fi fa 2.5Y 5/4 mot, wk fi sbk str, f fi lOYR 2/1 mn ox, pH 6.8, Basal Wisconsin paleosol.
455-554 cm; IIIOL, lOYR 6/6 Isil, f fi fa lOYR 5/8 mot, mass, pH 6.9, abr sm bdy, laminated alluvium.
554-556 cm; IIIOU, 7.5YR 4/6 sandy loam, pH 7.6, abr sm bdy, Fe band.
556-587 cm; IIIRU, 5GY 4/1 Isil, c stk of 5BG4/1, f fi fa 5Y 5/3 mot, mass, f fi LOYR 2/1 mn ox, pH 7.7, gr sm bdy, alluvium.

258
587-510 cm; IIIUL, 5Y 3/1 Isil, c fi N 3/0 stk, mass, f fi lOYR 2/1 mn ox, pH 7.4, gr sm bdy, alluvium.
610-686 cm; IIIUL, 5GY 4/1 sil c med 5Y 4/1 stk, mass, pH 7.4-7.5, gr sm bdy, alluvium.
686-709 cm; IVAlb, 5GY 4/1 Isicl, c med d 5Y 4/3 mot, wk fi sbk str, fir, th pa lOYR 7/2 (dry) silt cts on peds, f fi N 2/0 wood frg, pH 7.5, gr sm bdy, paleosol dev in alluvium.
709-732 cm; IVA3b, 5GY 4/1 sicl, c med d 5Y 4/3 mot, mod med sbk str, fir, th pa lOYR 7/2 (dry) silt cts on peds, f fi N 2/0 wood frg, pH 7.5.
Core: 52B207 Location; .49 m S and 12 m W of NE corner NW^ Sec 5
T78N R6W Slope: 3% convex Elevation: 20i m Landscape position: high terrace Solum: Tama Isicl Sampled by: T. Bicki Described by: T. Bicki
0-20 cm; Ap, lOYR 3/2 and 2/2 Isicl, mod fi and med gran str, fri, pH 5.7-5.5, clr sm bdy, loess.
20-31 cm; A12, lOYR 3/2 Isicl, mod fi and med gran str, fri, pH 5.2, gr sm bdy.
31-46 cm; A3, lOYR 3/2 Isicl, mod fi and med gran str, fri, pH 5.2-5.3, gr sm bdy.
46-58 cm; Bl, lOYR 3/3 sicl, ped extlOYR 3/3, mod fi and Vfi sbk str, fri, pH 5.3-5.4, gr sm bdy.
58-74 cm; B21t, lOYR 4/3 sicl, mod fi abk mod fi and vfi sbk str, fri, th disc lOYR 3/3 clay films on peds, f lOYR 3/2 worm casts, f fi lOYR 2/1 mn ox, pH 5.5, gr sm bdy.
74-91 cm; B22t, lOYR 4/3 sicl, mod med prism mod fi and med abk str, fri, th disc lOYR 3/3 clay films on peds, f fi and vfi root chl, f fi lOYR 2/1 mn ox, pH 5.5-5.7, gr sm bdy.

259
91-112 cm; B23t, lOYR 4/3 Isicl, st med prism -• mod med abk str, fri, th disc lOYR 3/3 clay films on pris and peds, c fi IOYR 2/1 mn ox, c fi and vfi root chl, pH 5.7-5.8, gr sm bdy.
112-132 cm; B31t, lOYR 5/4 Isicl, st co prism mod med abk str, fri, th disc IOYR 3/3 clay films on pris and peds, th LOYR 3/3 chl fil, c fi and vfi root chl, c fi LOYR 2/1 mn ox, pH 5.8, gr sm bdy.
132-152 cm; B32t, lOYR 5/4 Isicl, mod co prism wk med abk str, fri, th disc lOYR 3/3 clay films on pris and peds, th lOYR 3/3 chl fil, c fi and vfi root chl, c fi lOYR 2/1 mn ox, pH 5.8, gr sm bdy.
152-175 cm; B33, lOYR 5/4 h sil, wk co prism str, fri, th lOYR 3/2 chl fil, c fi root chl, f fi lOYR 2/1 mn ox, pH 5.8-5.9, gr sm bdy.
175-188 cm; B34, h sil, wk co prism str, fri, th lOYR 3/2 chl fil, c fi root chl, f fi lOYR 2/1 mn ox, pH 5.8-5.7, gr sm bdy.
188-282 cm; C, lOYR 5/4 sil, mass, f fi fa lOYR 5/6 mot, f fi and med root chl, c fi and med lOYR 2/1 mn ox, pH 5.7, clr sm bdy, loess,
282-320 cm; OL, lOYR 6/6 sil, mass, pH 5.9, abr sm bdy, loess with high sand content.
320-396 cm; IIOl, lOYR 6/6 si, single grain, loose, pH 6.3, aeolian sand.

260
Transect: Gladwyn Core: 58BE108 Location: 61 m N and 61 m W of SE corner NW% NE^ Sec 17
T76N R5W Slope: 2% convex Elevation: 226 m Landscape position: summit of broad tabular divide Solum: Clinton sil Sampled by; T. Bicki and S. Esling Described by: T, Bicki
O-lO cm; Ap, lOYR 3/2 Isil, lOYR 5/2 (dry), wk vfi gran str, fri, pH 6.6, clr sm bdy, loess.
10-20 cm; A21, lOYR 4/3 Isil, lOYR 5/3 (dry), mod med pi -* wk fi sbk str, fri, vth pa lOYR 6/3 silt cts, pH 6.2, clr sm bdy.
20-31 cm; A22, lOYR 4/3 Isil, lOYR 6/3 (dry), mod med pi ̂ fi sbk str, fri, vth pa lOYR 6/3 silt cts, pH 5.7, clr sm bdy.
31-36 cm; A23, lOYR 4/3 sil, wk fi sbk -* wk vfi sbk str, fri, th pa lOYR 6/3 silt cts, pH 5.1, clr sm bdy.
36-48 cm; Bit, lOYR 4/4 Isicl, mod fi and vfi sbk str, fri, th ncont lOYR 4/3 clay films on peds, med cont lOYR 6/3 silt cts, pH 4.6, clr sm bdy.
48-61 cm; B21t, lOYR 4/4 sicl, st fi abk str, firm th cont lOYR 4/3 clay films on peds, tk cont lOYR 6/3 silt cts, pH 4.6, clr sm bdy.
61-84 cm; B22t, lOYR 4/4 clay, f fi fa lOYR 5/2 mot, mod med prism st fi and med abk str, fir, tk cont lOYR 4/3 clay films on peds and pris faces, med pa lOYR 6/3 silt cts on peds, c fi lOYR 2/l mn ox, pH 4.6-4.8, gr sm bdy.
84-104 cm; B23t, lOYR 5/4 hsicl, c fi d 2.5Y 6/3 mot, mod med prism -» st fi and med abk str, fir, tk cont lOYR 4/3 clay films on peds, med cont lOYR 4/3 clay films on prism vth pa lOYR 6/3 silt cts, c fi lOYR 2/1 mn ox, pH 4.9, gr sm bdy.
104-117 cm; lOYR 5/4 sicl, c fi d 2.5Y 6/2 mot, c fi fa lOYR 5/6 mot, mod med prism st fi abk str, fri, med cont lOYR 4/3 clay films on prism, th cont lOYR 4/3 clay films on peds, vth pa lOYR 6/3 silt cts, m med lOYR 2/l mn ox, pH 5.0, gr sm bdy.
117-140 cm; B31t, lOYR 5/4 Isicl, c fi fa lOYR 5/6 and c fi d 2.5Y 6/3 mot, mod med prism mod med abk str, fri.

261
med cont lOYR 4/3 clay films on prism vth pa lOYR 6/3 silt cts, tk cont lOYR 3/3 chl fil, c med lOYR 2/1 mn ox, pH 5.0-5.3, gr sm bdy.
140-173 cm; B32t, lOYR 5/4 Isicl, c fi fa lOYR 5/6 and c fi d 2.5Y 6/2 mot, mod med prism mod med abk str, fri, med cont lOYR 4/3 clay films on pris, c fi lOYR 2/1 mn ox, pH 5.2-5,3, gr sm bdy.
173-196 cm; B33t, same as above except pH 5.4-5.5.
196-305 cm; C, lOYR 5/4 sil, c fi fa lOYR 5/6 and c fid 2.5Y 6/2 mot, mass, c fi lOYR 2/1 mn ox, pH 5.7-6.0.
305-366 cm; OL, lOYR 5/4 sil, c fi fa lOYR 5/6 and c fi d 2.5Y 6/2 mot, f fi lOYR 2/1 mn ox, pH 6.1-7.0.
366-457 cm; OL, same as above except pH 7.5-7.4.
457-488 cm; Alb, lOYR 4/1 sil, wk fi sbk str, fri, f fi lOYR 2/1 mn ox, pH 7.3-7.1, Basal Wisconsin paleosol.
488-559 cm; IIBl, 5Y 5/1 sicl, mod fi sbk str, vfir, pH 7.1 gr sm bdy, Yarmouth-Sangamon paleosol dev in till derived sediments.
559-579 cm; IIB2tb, 5Y 5/1 clay, st fi abk str, f fir, tk cont clay films on peds, f fi lOYR 2/1 mn ox, pH 7.1.
Core: 58BE109 Location: 152 m N and 190 m E of SW corner of SE%
Sec 17 T76N R5W Slope: 3% convex Elevation: 216 m Landscape position: summit of interfluve divide Solum: Clinton sil Sampled by; T. Bicki and S. Esling Described by: T. Bicki
O-lO cm; Ap, lOYR 3/2 Isil, lOYR 5/2 (dry), wk fi gran str, fri, pH 6.9, clr sm bdy, loess.
10-18 cm; A21, lOYR 4/2 sil, lOYR 5/2 (dry), mod med pi -* wk fi gran str, fri, th pa lOYR 7/2 (dry) silt cts, pH 6.3, clr sm bdy,
18-25 cm; A22, lOYR 4/2 sil, lOYR 5/3 (dry), ped ext lOYR 4/4, wk med pi -*• wk fi gran str, fri, pH 6.3, clr sm bdy.

262
25-41 cm; Bl, lOYR 4/4 Isicl, mod fi abk -» mod vfi sbk str, fri, th disc lOYR 7/2 (dry) silt cts, pH 6.3, clr sm bdy.
41-56 cm; B21t, lOYR 5/4 sicl, ped ext lOYR 4/4, st fi abk str, fir, th cont lOYR 4/4 clay films on peds, th ncont lOYR 7/2 (dry) silt cts, f fi lOYR 2/1 mn ox, pH 6.0-5.7, gr sm bdy.
56-76 cm; B22t, same as above except h sicl, th cont lOYR 7/2 (dry) silt cts and pH 5.3-5.2, gr sm bdy.
76-97 cm; B23t, LOYR 5/4 sicl, f fi fa LOYR 5/3 and f fi d 7.5YR 4/4 mot, mod med prism st med abk str, fir, med cont IOYR 4/4 clay films on peds and pris, th pa LOYR 7/2 (dry) silt cts, c fi IOYR 2/1 mn conc, pH 5.1-510, gr sm bdy.
97-112 cm; B31t, lOYR 5/4 sicl, c med fa IOYR 5/3 and 5/1 mot, mod med prism mod med abk str, fir, th cont IOYR 4/4 clay films on peds and pris, th pa IOYR 7/2 (dry) silt cts, f CO IOYR 2/1 mn conc, pH 5.0, gr sm bdy.
112-137 cm; B32t, IOYR 5/3 Isicl, c med fa lOYR 5/6 mot, mod med prism -+ mod med abk str, fir, th cont IOYR 4/4 clay films on pris, th ncont IOYR 4/4 clay films on peds, th pa IOYR 7/2 (dry) silt cts, tk cont IOYR 3/3 chl fil, c fi IOYR 2/1 mn ox, pH 5,1-5.0, gr sm bdy.
137-158 cm; B33t, IOYR 5/3 Isicl, m fi fa IOYR 5/6 mot, mod med prism mod med abk str, fir, th cont IOYR 4/4 clay films on pris, tk cont IOYR 3/3 chl fil, c fi IOYR 2/1 mn ox, pH 5,3-5.5, gr sm bdy.
158-185 cm; B34t, mix lOYR 5/3, 5/8 and 5/4 sil, mod med prism str, fir, vth disc IOYR 4/2 clay films on pris, fri, f th cont IOYR 3/3 chl fil, c fi IOYR 2/1 mn ox, pH 5.7, gr sm bdy.
185-262 cm; OL, C, IOYR 5/3 sil, c med fa lOYR 5/6 mot, mass, c fi IOYR 2/1 mn ox, pH 5.9-7.0.
262-335 cm; Alb, IOYR 4/4 sil, f fi fa lOYR 5/6 mot, mod fi and vfi sbk str, fri, c fi lOYR 2/1 mn ox, pH 7.0-6.9, gr sm bdy. Basal Wisconsin paleosol.
335-361 cm; IIA21b, lOYR 5/4 sicl, wk th pi -• mod vfi sbk str, fri, vth pa IOYR 7/2 (dry) silt cts, c fi IOYR 2/1 mn ox, pH 6,8, clr sm bdy. Late Sangamon paleosol dev in pedisediment,

263
361-373 cm; IIA22b, lOYR 5/4 loam, f fi fa lOYR 5/6 mot, mod Vfi and fi sbk str, fri, th ncont clay films on peds, c med lOYR 2/1 mn conc, pH 6.7, gr sm bdy.
373-394 cm; IIB2ltb, lOYR 4/4 hcl, c fi fa lOYR 5/6 mot, mod med prism st vfi and fi sbk str, fri, tk cont lOYR 3/3 clay films on peds, m co lOYR 2/1 mn conc, pH 6.8, gr sm bdy.
394-414 cm; IIIB22tb, lOYR 4/6 clay, c fi d 7.5YR 5/8 mot, mod med prism st vfi and f sbk str, fir, med cont lOYR 4/4 clay fioms on pris and peds, c med lOYR 2/1 mn conc, pH 6.8, gr sm bdy. Late Sangamon paleosol dev in Pre-Illinoian till.
414-432 cm; IIIB23tb, lOYR 4/4 clay, m med fa lOYH 5/8 mot, st fi and med abk str, fir, tk cont lOYR 5/2 clay films on peds tk lOYR 3/2 chl fil, c fi lOYR 2/1 mn conc, pH 6.7, gr sm bdy.
432-488 cm; IIIB3ltb, lOYR 4/4 hcl, m med fa lOYR 5/8 mot, st fi and med abk str, fir, tk cont lOYR 5/2 clay films on peds, tk lOYR 3/2 chl fil, c fi lOYR 2/1 mn conc, pH 6.8, gr sm bdy.
488-508 cm; IIIB33tb, lOYR 4/4 cl, c fi fa lOYR 5/6 and 5/8 mot, st fi and med abk str, firm, tk cont lOYR 4/3 clay films on peds, c fi lOYR 2/1 mn conc, pH 6.9, gr sm bdy.
508-536 cm; IIIB34tb, lOYR 4/6 cl, c fi p 5GY 6/1 mot, mod med prism -* st med and fi abk str, fir, c mn ox stains on pris, m co lOYR 2/1 mn ox, pH 7.1.
Core: 58BE107 Location: 60 m S and 60 m E of field entrance in SEh NE^
Sec 17 T76N R5W Slope: 2% Elevation: 198 m Landscape position: high terrace Solm: Inton sil Sampled by: T. Bicki and S. Esling Described by: T. Bicki
0-10 cm; Ap, lOYR 4/2 sil, lOYR 6/2 (dry), wk fi gran str, fri, pH 6.9, clr sm bdy, loess.
10-20 cm; A21, lOYR 4/3 sil, mod th and vth pi wk fi and vfi sbk str, fri, pH 5.0, clr sm bdy.

264
20-33 cm ; A22, lOYR 5/4 sil, wk fi sbk str, fri, pH 4.7, clr sm bdy.
33-46 cm ; Bl, lOYR 5/4 sicl, mod fi sbk str, fri, pH 4.9, clr sm bdy.
46-61 cm; B21t, lOYR 5/4 hsicl, f fi d 7,5YR 4/6 mot, st fi and vfi abk str, fir, th cont lOYR 4/4 clay films on peds, th disc lOYR 6/3 silt cts, f fi lOYR 2/1 mn ox, pH 4.9, clr sm bdy.
61-81 cm; B22t, 2.5Y 6/2 hsicl, m med d 7.5YR 5/6 and 5/8 mot, st fi and med abk str, fir, tk cont lOYR 4/4 clay films on peds, th pa lOYR 6/3 silt cts, c fi lOYR 2/1 mn ox, pH 5.0, clr sm bdy.
81-107 cm; B23t, 2.5Y 6/2 sicl, c fi d lOYR 5/8 mot, st med abk -* st fi abk str, fir, med cont lOYR 5/3 clay films on peds, vth pa lOYR 6/3 silt cts, c fi lOYR 2/l mn ox, pH 5.2, gr sm bdy.
107-142 cm; B31t, 2.5Y 6/2 Isicl, m med d 7.5YR 4/6 Fe conc (pipestems), mod co prism -*• st med abk str, fir, med cont IOYR 4/3 clay films on pris, th disc LOYR 4/3 clay films on peds, tk LOYR 3/3 chl fil, f fi LOYR 2/1 mn ox, pH 5.5-5.8, gr sm bdy.
142-183 cm; B32t, 2.5Y 5/2 sil, c co p 7.5YR 4/6 Fe conc (pipestems), mod co prism mod med abk str, fri, med cont IOYR 4/3 clay films on pris, tk LOYR 4/4 chl fil, m co LOYR 2/1 mn ox, f mn ox stk on pris faces, pH 6.0-6.1, gr sm bdy.
183-211 cm; B33t, mix 2.5Y 5/2 to lOYR 5/8 sil, c med p 7.5YR 5/8 Fe conc (pipestems), mod med prism str, fri, th cont lOYR 4/4 clay films on pris, c fi rt chl, f fi lOYR 2/1 mn ox, pH 6.1-6.2, gr sm bdy.
211-231 cm; B34t,2.5Y 5/2 sil, m co d LOYR 5/8 mot, mod med prism str, fri, th cont IOYR 4/4 clay films on pris, tk IOYR 4/4 chl fil, c fi and vfi rt chl, f fi IOYR 2/1 mn ox, pH 6/2-6/3, gr sm bdy.
231-285 cm; B3t-C, 2.5Y 5/2 sil, m, co d lOYR 5/8 mot, wk med prism str, fri, th cont lOYR 4/4 clay films on pris, th IOYR 4/4 chl fil, pH 6.4-6.8, gr sm bdy.
285-300 cm; C, 2.5Y 5/2 sil, c med d lOYR 5/8 mot, mass, pH 7.1.
300-335 cm; DL, 2.5Y 5/2 sil, f med d lOYR 5/8 mot, mass, pH 7.1, gr sm bdy, loess.

265
335-427 cm; MDL, 2.5Y 5/2 sil, m co p 7.5YR 5/8 and 5YR 5/8 Fe conc (pipestems), m Fe conc (pipestems) and Fe bands, mass, pH 6.9, abr sm bdy.
427-429 cm5 IIOL, lOYR 2/2 sil, mass, abr sm bdy, organic-rich band in alluvial sediments.
429-437 cm; IIOL, 2.5YR 5/6 sicl, mass, pH 6.7, abr sm bdy, Fe-rich band in alluvial sediments.
437-452 cm; IIOL, lOYR 8/4 hsil, in cutbank color is 2.5YR 5/8, c fi fa lOYR 5/6 mot, mass, med cont lOYR 3/2 clay fil in chl, m fi and med rt chl, pH 6.6, abr sm bdy, alluvial sediments.
452-457 cm; IIUL, N 2/0 sil, mass, pH 6.5, abr sm bdy, organic-rich band in alluvial sediments.
457-465 cm; IIOL, lOYR 5/3 silt, mass, pH 6.7, abr sm bdy, alluvial silts.
465-475 cm; IIAlb, lOYR 3/2 h sicl, f fi d 5YR 3/4 Fe conc (pipestems), f fi lOYR 3/l stk, st fi abk str, fir, pH 6.7, gr sm bdy, paleosol dev in alluvium.
475-488 cm; IIB21b, lOYR 4/2 clay, st fi abk str, fir, vth pa lOYR 6/2 silt cts, f fi lOYR 2/1 mn ox, f fi rt chl, pH 6.6, clr sm bdy.
488-506 cm; IIB22b, same as above except pH 6.7, and gr sm bdy.
506-541 cm; IIB23tb, lOYR 4/2 hsicl, st med abk st fi abk str, fir, th disc lOYR 4/2 clay films, f fi rt chl, f fi lOYR 2/1 mn ox, pH 6.7, gr sm bdy.
541-577 cm; IIB3b, 2.5Y 5/2 cl, f med d 7.5YR 5/6 mot, wk med abk str, fir, pH 6.7-6.6, gr sm bdy.
577-592 cm; IIC, 2.5Y 6/2 h loam, m med p 7.5YR 5/6 mot, mass, 6.7, abr sm bdy.
592-653 cm; IIIOL, lOYR 5/4 sand, single grain, loose, pH 6.4-6.0, f th silt bands, alluvial sands.
653-704 cm; IIIOL, lOYR 5/4 and 6/3 sand, single grain, loose, pH 6.0, clr sm bdy, cross bedded sands and gravels.
704-734 cm; IIIOL, lOYR 5/4 and 6/3 sand, single grain, loose, pH 6.0, clr sm bdy, stratified sands and gravels.

266
734-826 cm; IIIOL, lOYR 5/4 and 6/3 sand, c 7.5YR 4/6 Fe bands, single grain, loose, pH 5.9, crossbedded sands and gravels.
826-836 cm; DL, 2.5Y 5/2 Id, mass, pH 6.0, abr sm bdy, alluvial sediments.
836-848 cm; IIIOL, lOYR 6/3 loamy sand, single grain, loose, pH 6.0, abr sm bdy, sands and gravels.
848-866 cm; OL, lOYR 4/2 Id, c lOYR 2/1 and N 2/0 stk of organic matter, mass, pH 6.0, alluvial sediments w/ 0.31% total carbon content.
866-881 cm; IV, 7.5YR 5/8 Fe stained gravels and cobbles.
881-897 cm; VJRL, 5Y 4/2 h loam, mass, pH 6.8, gr sm bdy, Pre-Illinoian till.
897-1110 cm; VJMUU, 5Y 3/1 loam, joints have 5YR 3/3 Fe stn, mass, pH 7.6, gr sm bdy.
1110-1171 cm; VUU, 5Y 5/l loam, c bands of 5BG 4/1, f sand bands of lOYR 5/8 and 5YR 4/8, mass, pH 7,7.

267
Transect : Lone Tree Core; 52BE111 Location: 82 m N of road and 57 m W of farm lane in SW%
NE% Sec 16 T77N R5W Slope: 3% convex Elevation: 213 m Landscape position: summit of interfluve divide Solium : Tama Isicl Sampled by: T. Bicki and S. Esling Described by: T. Bicki
0-18 cm; Ap, lOYR 2/2 Isicl, mod fi and med gran str, fri, pH 6.0, clr sm bdy, loess.
18-31 cm; A12, lOYR 3/2 sicl, mod vfi sbk mod fi and vfi gran str, fri, pH 5.7, clr sm bdy.
31-43 cm; A13, lOYR 3/2 sicl, mod vfi sbk str, fri, pH 5.5, clr sm bdy.
43-61 cm; Bl^ lOYR 4/3 sicl, ped ext lOYR 4/4, mod fi abk -• mod vfi sbk str, fri, pH 5.2-5.1, clr sm bdy.
61-74 cm; B21t, lOYR 4/3 sicl, th ncont lOYR 4/4 clay films, mod fi abk str, fri, pH 5.4, gr sm bdy.
74-94 cm; B22t, lOYR 5/4 sicl, mod med prism mod med and fi abk str, fri, med cont lOYR 4/3 clay films on peds, f fi lOYR 2/1 mn ox, pH 5.4-5.5, gr sm bdy.
94-119 cm; B31t, lOYR 5/4 sicl, c fi fa lOYR 5/8 and f fi d 2.5Y 6/2 mot, mod med prism -» mod med abk str, fri, th cont lOYR 4/3 clay films on pris, th disc clay films on peds, c fi lOYR 2/l mn ox, c fi and vfi rt chl, pH 5.5, gr sm bdy.
119-150 cm; B32t, same as above except th ncont lOYR 4/3 clay films on pris and pH 5.6-5.7.
150-183 cm; B33, LOYR 5/4 hsil, f fi fa lOYR 5/8 and f fi d 2.5Y 6/3 mot, mod med prism -+ mod med abk str, fri, f fi IOYR 2/1 mn ox, c fi rt chl, pH 5.8-5,7, gr sm bdy.
183-206 cm; CI, lOYR 5/4 sil, f fi fa lOYR 5/8 and f fi d 2.5Y 6/3 mot, mass, fri, pH 5.7, clr sm bdy.
206-224 cm; IIC2, lOYR 5/4 si, single grain, loose, pH 5.8, gr sm bdy, aeolian sand.
224-305 cm; IIC3, lOYR 5/4 sand, single grain, loose, pH 5.9-6.0.

268
Core; 52B101 Location: 107 m S and 31 m E of NW corner of SW% SEk
Sec 15 T77N R5W Slope; 2% Elevation: 216 m Landscape position: summit of interfluve divide Solum; Tama Isicl Sampled by: T. Bicki Described by: T. Bicki
0-15 cm; Ap, lOYR 2/1 Isicl, mod fi and med gran str, fri, pH 6.3-6.1, clr sm bdy, loess.
15-25 cm; A12, lOYR 2/1 Isicl, mod fi and med gran str, fri, pH 6.1, clr sm bdy.
25-38 cm; A13, lOYR 3/2 Isicl, mod fi and vfi sbk str, fri, vth pa lOYR 7/2 (dry) silt cts, pH 6.0, gr sm bdy.
38-53 cm; El, lOYR 4/3 sicl, ped ex lOYR 3/3 mod fi and vfi sbk str, fri, vth pa lOYR 7/2 (dry) silt cts, pH 5,8-5.6, gr sm bdy.
53-71 cm; B21t, lOYR 4/3 sicl, mod fi abk str, fri, th ncont lOYR 3/3 clay films, th pa lOYR 7/2 (dry) silt cts, pH 5.6, gr sm bdy.
71-86 cm; B22t, lOYR 5/4 sicl, mod med prism st med abk str, fri, th cont lOYR 4/3 clay films on pris, tk cont lOYR 7/2 (dry) silt cts on peds and pris, f fi lOYR 2/1 mn ox, pH 5,6, gr sm bdy.
86-104 cm; B23t, lOYR 5/4 Isicl, f fi fa lOYR 5/6 mot, mod med prism st med abk str, fri, th cont lOYR 4/3 clay films on prism, tk cont lOYR 7/2 (dry) silt cts, c fi lOYR 2/1 mn conc, pH 5.6, gr sm bdy.
104-132 cm; B31t, same as above with lOYR 3/3 chl fil.
132-155 cm; B32t, lOYR 5/4 hsil, c fi fa lOYR 5/6 and 5/8 mot, mod med prism -* wk med abk str, fri, th disc lOYR 4/3 clay films on pris, th pa lOYR 7/2 (dry) silt cts, c fi lOYR 2/1 mn conc, pH 5.6, gr sm bdy.
155-185 cm; B33t, lOYR 5/4 sil, c fi fa lOYR 5/6 and 5/8 mot, f fi d 2.5Y 6/2 mot, th disc lOYR 4/3 clay films on pris, mod med prism wk med abk str, f fi lOYR 2/l mn ox, c lOYR 3/3 chl fil, pH 5.6-5.7, clr sm bdy.
185-201 cm; I and IIB34, lOYR 5/3 loam, c med fa lOYR

269
5/6 mot, c med d 7.5YR 4/6 and 5.8 mot, f fi d 2.5Y 6/2 mot, ,wk med prism str, fri, c lOYR 2/1 mn ox, c rt chl, pH 5.8, abr sm bdy, mixture of loess and aeolian sand.
201-236 cm; IICl, lOYR 6/6 sandy loam, mass, fri, f th bands of 2.5Y 6/2 loess with lOYR 5/6 mot, pH 6,0-6.1, aeolian sand with thin bands of deox loess.
236-257 cm; I and IIC2, 2.5Y 6/2 si, m med d lOYR 5/6 mot, mass, th lOYR 7/4 inter sand bands, f fi lOYR 2/l mn ox, ̂ 5.8, clr sm bdy, stratified bands of aeolian sand and loess.
257-295 cm; MDL, C3, 2.5Y 6/2 Isil, m med d lOYR 5/6 and 5/8 Fe conc (pipestems), mass, c med 20YR 2/1 mn conc, pH 5.9, abr sm bdy, loess.
295-305 cm; IIOL, lOYR 5/8 si, m th 7.5YR 5/8 Fe-rich bands in upper part, pH 6.0, aeolian sand.
Core: 52B103 Location: 64 m S and 55 m E of NW corner of NE^ Sec 23
T77N R5W Slope: 3% convex Elevation: 218 m Landscape position: summit of interfluve divide Solum: Downs sil Sampled by: T. Bicki Described by* T. Bicki
0-165 cm; solum dev in loess.
165-178 cm; I and IIB34, LOYR 5/4 loam, f fi d 2.5Y 6/2 mot, mod med prism str, fri, th IOYR 4/3 chl fil, f fi LOYR 2/1 mn ox, c rt chl, pH 5.4, clr sm bdy, loess with high sand content,
178-193 cm; I and IICl, lOYR 5/6 loam, mass, fri, pH 5,9, gr sm bdy.
193-366 cm; OL, IIC2, lOYR 5/6 and 5/8 Is, single grain, loose, pH 6,0-6,1, th 5Y 6/2 bands of loess, aeolian sand,
366-518 cm; OL, lOYR 5/8 Is, single grain, loose, pH 6,6, gr sm bdy.
518-549 cm; Alb, 5Y 5/l Isil, c 5BG4/1 stks, wk fi sbk str, fri, c N 2/0 wood frg, pH 6,8, Basal Wisconsin paleosol.

270
Core: 52B102 Location: SW3g SWîg NW^ Sec 19 T77N R4W Slope: 3% Elevation: 213 m Landscape position: summit of interfluve Solum: Tama hsil Sampled by: T. Bicki Described by: T. Bicki
0-122 cm; solum dev in loess.
122-159 cm; CI, lOYR 5/4 and lOYR 5/3 sil, c fi fa lOYR 5/6 mot, mass, c fi lOYR 2/l mn ox, pH 6.1.
159-310 cm; OL, lOYR 5/3 sil, c fi fa lOYR 5/6 and 2.5Y 5/4 mot, mass, c fi and med lOYR 2/1 mn ox, pH 6,2-6,4.
310-549 cm; OL, lOYR 5/3 Isil, c fi f lOYR 5/6 and 2.5Y 5/2 mot, mass, c fi lOYR 2/1 mn ox, pH 6,6-7,1.
549-570 cm; Alb, lOYR 4/4 sil, c fi lOYR 5/6 and 5/8 mot, wk fi and vfi sbk str, fri, c fi lOYR 2/1 mn ox, pH 7.1, gr sm bdy. Basal Wisconsin paleosol,
570-580 cm; CI, lOYR 4/3 sil, c fi lOYR 5/6 mot, mass, c fi lOYR 2/l mn ox, pH 7,2, clr sm bdy,
580-602 cm; IIBltb, 7,5YR 5/4 hcl, m med p 2,5YR 4/6 mot, mod med prism st fi and med abk str, vfir, th cont 7.5YR 4/4 clay films, pH 7,2, gr sm bdy. Late Sangamon paleosol dev in Pre-Illinoian till,
602-631 cm; IIB21tb, 7,5YR 5/4 clay, m med p 2,5Y 4/6 mot, mod med prism st fi and med abk str, vfir, tk cont 7,5YR 4/4 clay films, f lOYR 2/1 mn ox, pH 7,1,

271
Transect: West Liberty I Core; 52BE120 LocationI NE^ Sec 36 T79N R6W Slope; 3% Elevation; 207 m Landscape position: high terrace Solum; Tama Isicl Sampled by; T. Bicki and S. Esling Described by: T. Bicki
0-147 cm; solum dev in loess.
147-168 cm
168-196 cm OL, lOYR 5/4 sil, c fi fa lOYR 5/6 mot, mass, f fi lOYR 2/1 mn ox, pH 6.0, gr sm bdy, loess with high sand content.
OL, 10YR 5/4 sil, f fi d 7.5YR 4/6 mot, 2/1 mn ox, pH 6,0, dif sm bdy, loess with th sand.
196-213 cm mass, f fi lOYR inter bands of
213-397 cm; IIOL, lOYR 6/6 si, single grain, loose, f fi lOYR 2/1 mn ox, pH 6.0, aeolian sand with th bands of loess.
397-427 cm; Ab, lOYR 3/2 sil, f fi fa lOYR 5/6 mot wk fi sbk str, f fi lOYR 2/1 mn ox, pH 6.1, Basal Wisconsin paleosol.
427-549 cm 4/6 mot, single sands.
549-671 cm 4/6 mot, single
671-706 cm of lOYR 5/6 sand, mass, pH 7.5.
706-737 cm
737-765 cm (pipestems), wk
765-787 cm
solum dev in loess with high sand content.
IIIOL, lOYR 5/4 Is, c med fa lOYR 5/2 and grain, loose, pH 6.2, stratified alluvial
IIIOL, lOYR 5/4 Is, f fi fa lOYR 5/2 and grain, loose, pH 7.1.
IIIOU, lOYH 6/2 1 loam, with th inter bands
IVUU, 5Y 5/1 Isil, mass, c 7.5YR 3/2 wood frg, f fi lOYR 2/l mn ox, pH 7.5-7.6, alluvial sediments.
IVRU, 5Y 4/1 sil, f fi p 7.5YR 4/6 Fe conc fi gran str, f 7.5YR 3/2 wood frg, pH 7.6.
IVRU, 2.5Y 3/2 Isil, f fi p 7.5YR 4/6 mot. wk fi gran str, c 7.5YR 3/2 wood frg, pH 7.5, gr sm bdy.
787-823 cm; IVRL, 2.5Y 3/2 Isil, f fi p 7.5YR 4/6 mot, wk vfi and fi gran str, m 7.5YR 3/2 wood frg, pH 7.2, gr

272a
sm bdy.
823-853 cm; VOeb, lOYR 2/2, mod vfi and fi gran str, m fi 7.5YR 3/2 wood frg, pH 6,9, clr sm bdy, mucky peat.
853-884 cm; VOeb, lOYR 2/2, mass, c fi 7.5YR 3/2 wood frg, pH 6.7, clr sm bdy.
884-899 cm; VIAlb, lOYR 3/l Isicl, ped int 5Y 4/1, wk fi and vfi sbk str, fri, pH 7.4, gr sm bdy, paleosol dev in alluvium.
899-914 cm; VIA12b, lOYR 3/l hsicl, wk fi and vfi sbk str, fri, pH 7.5, gr sm bdy.
914-930 cm; VIB21tb, 2.5Y 4/2 hsicl, mod fi and med sbk str, fir, tk cont lOYR 3/1 clay films on peds, med cont lOYR 7/2 (dry) silt cts, pH 7.8, gr sm bdy.
930-942 cm; VIB22tb, same as above except hcl texture and pH 7.9.
942-991 cm; VIB3tb, 5Y 5/2 cl, f fi 5GY 5/1 mot, wk fi and med sbk str, fir, th disc lOYR 3/1 clay films on peds, th cont lOYR 7/2 (dry) silt cts, pH 8.0.
Core: 52B105 Location: 91 m S and 168 m E of NW corner of SW% sec 32
T79N R5W Slope: 3% convex Elevation: 220 m Landscape position: summit of interfluve divide Solum: Downs sil Sampled by: T. Bicki Described by: T. Bicki
0-185 cm; solum dev in loess.
185-320 cm; MOL, lOYR 5/4 sil, c fi fa lOYR 5/6 and f fi fa lOYR 5/3 mot, mass, c fi 7.5YR 3/2 mn ox, pH 6.1-6.2, gr sm bdy, loess.
320-333 cm; OL, lOYR 6/6 Isil, f fi fa lOYR 5/6 mot, mass, pH 6.3, clr sm bdy, loess with th inter bands of sand.
333-345 cm; MOL, 2.5Y 5/4 Isil, c fi fa lOYR 5/6 and

272b
5/3 mot, mass, c fi 7,SYR 3/2 mn ox, iSH 6.9, clr sm bdy, loess with high sand content.
345-429 cm; MOU, 2.5Y 5/4 Isil, c fi fa lOYR 5/6 and 5/3 mot, f 7.5YR 3/4 Fe conc (pipestems), mass, c med and CO 7.5YR 3/2 mn conc, pH 7.6, abr sm bdy, loess with high sand content.
429-513 cm J MDU, 5Y 6/l Isil, c med and co 7.5YR 5/8 and 4/6 conc (pipestems), mass, f snail shells, pH 7.5,
513-526 cm; Alb, lOYR 5/2 sil, c fi f lOYR 5/6 and 5/8 mot, wk fi sbk str, fri, c fi 7.5YR 3/2 mn ox, f N 2/0 wood frg, pH 7.3, gr sm bdy. Basal Wisconsin paleosol.
526-546 cm; IIA2, lOYR 5/3 sil, m med 7.5YR 5/8 mot, wk fi sbk str, fri, c fi lOYR 2/1 mn ox, pH 7.1, gr sm bdy. Late Sangamon paleosol dev in pedisediment.
546-566 cm; IIBl, same as above except cl texture, pH 7.0, and abr sm bdy.
566-572 cm; 7,5YR 4/6 and 5.8 loam, pH 6,9, abr sm bdy, stone line.
572-599 cm; IIIB2lt, 7.5YR 4/4 clay, c fi and med 7.5YR 4/6 and 5/8 mot, f 2.5YR 3/6 Fe conc, mod med prism "" st fi abk str, vfir, tk cont 7.5YR 3/2 clay films on pris and peds, f fi lOYR 2/1 mn ox, pH 6.9, gr sm bdy. Late Sangamon paleosol dev in glacial till.
599-620 cm; IIIB22t, 7.5YR 4/4 clay, faces of peds 7.5YR 4/6 and 5.8, mod med prism -• st fi abk str, vfir, med cont 7.5YR 3/2 clay films on pris, c fi lOYR 2/1 mn ox, pH 7.0.
Core; 52BE122 Location: NW% SW% Sec 33 T79N R5W ElevationI 226 m Landscape position: summit of interfluve divide Solum: Downs sil Sampled by: T. Bicki and S. Esling Described by: T. Bicki
0-178 cm; solum dev in loess
178-244 cm; MOL, lOYR 5/4 hsil, c fi fa lOYR 6/6 and 6/2 mot, mass, f fi 7.5YR 3/2 mn ox, c fi and vfi rt chl, pH 5.9, gr sm bdy, loess.

273
244-348 cm; MOL, lOYR 6/4 sil, c fi fa lOYR 6/6 and 6/2 mot, mass, f fi 7.5YR 3/2 mn ox, pH 6.2, gr sm bdy.
348-384 cm; MOL, lOYR 5/4 Isil, c fi fa lOYR 6/6 and 6/2 mot, mass, c fi 7.5YR 3/2 mn ox, pH 7.3, gr sm bdy.
384-409 cm; MOL, 2.5Y 5/4 Isil, m med d lOYR 5/8 mot, mass, c fi 7.5YR 3/2 mn ox, pH 7.4, gr sm bdy.
409-467 cm; MDU, 2.5Y 6/2 Isil, c co d lOYR 6/6 mot, mass c fi 7.SYR 3/2 mn ox, pH 7.6, clr sm bdy.
467-472 cm; MOU, lOYR 5/4 Isil, with c Fe-rich bands of lOYR 4/6 and 5/8, pH 7.6.
472-516 cm; Alb, lOYR 4/2 sil, f fi lOYR 5/6 Fe conc, •wk med and co gran str, vfri, f fi 7.5YR 3/2 mn ox, f N 2/0 wood frag, pH 7.2, Basal Wisconsin paleosol.
516-536 cm; A3b, same as above except wk med and fi gran str, and pH 6.8.
536-549 cm; IIB21tb, 2.5Y 5/2 hsicl, f fi d lOYR 5/6 Fe ox, mod fi and vfi sbk str, fir, th disc clay films, pH 7.0, gr sm bdy, truncated Yarmouth-Sangamon paleosol dev in till-derived sediments.
549-564 cm; IIB22tb, 2.5Y 4/2 clay, f fi d lOYR 5/6 and f fi p 7.5YR 4/6 mot, mod fi and vfi sbk str, tk cont clay films, f med lOYR 2/1 mn ox, pH 7.1.
564-579 cm; IIB3tb, 2.5Y 4/2 sic, f fi d lOYR 5/6 and f fi p 7.5YR 4/6 mot, mod fi and vfi sbk str, vfir, tk cont clay films, f med lOYR 2/1 mn ox, pH 7.2.

274
Transect ; West Liberty II Core: 52B211 Location: 145 m N and 31 m E of SW corner of NW% NW% Sec 17
T78N R5W Slope: 3% convex Elevation: 207 m Landscape position: high terrace Solum: Tama Isicl Sampled by: T. Bicki Described by: T. Bicki
0-23 cm; Ap, lOYR 2/2 Isicl, mod med and fi gran str, fri, pH 7.2-7.1, clr sm bdy, loess.
23-31 cm; A12, lOYR 2/2 Isicl, mod med and fi gran str, fri, pH 7.0, gr sm bdy.
31-38 cm; A13, lOYR 3/2 Isicl, with f 3/3 mixings, mod med and fi gran str, fri, pH 6.8, gr sm bdy.
38-51 cm; Bl, lOYR 3/3 Isicl, mod fi sbk mod vfi sbk str, fri, vth pa lOYR 7/2 (dry) silt cts, pH 6.8, gr sm bdy.
51-61 cm; B2lt, lOYR 4/3 sicl, mod fi sbk str, fri, th disc lOYR 3/3 clay films on peds, vth pa lOYR 7/2 (dry) silt cts, c fi and vfi rt chl, pH 6.4, gr sm bdy.
61-76 cm; B22t, lOYR 4/3 sicl, mod fi sbk str, fri, th disc lOYR 3/3 clay films on peds, vth pa lOYR 7/2 (dry) silt cts, th lOYR 3/2 chl fil, c fi and vfi rt ch, pH 5.7-5.6, gr sm bdy.
76-86 cm; B23t, same as above except pH 5.7 and c fi lOYR 2/1 mn ox.
86-107 cm; B31t, lOYR 5/4 sicl, f fi fa lOYR 5/6 and 5/3 mot, mod med prism mod med and fi abk str, fri, vth pa lOYR 3/3 and 4/3 clay films on pris, vth pa 7/2 (dry) silt cts, c fi lOYR 2/1 mn ox, pH 5.7-5,9, gr sm bdy.
107-132 cm; B32, same as above except Isicl texture, th lOYR 4/3 chl fil, pH 5.9-6.0 and no lOYR 7/2 (dry) silt cts.
132-152 cm; B33, lOYR 5/4 Isicl, c fi fa lOYR 5/6 and f fi fa lOYR 5/3 mot, mod med prism -* wk med abk str, fri, th lOYR 4/3 chl fil, c fi lOYR 2/1 mn ox, pH 6.1-6.0, gr sm bdy.
152-175 cm; B34, same as above except hsil CO prism str, pH 5.9, gr sm bdy.
texture, wk

275
175-188 cm; B35, lOYR 5/4 sil, f fi d 2.5Y 6/2 and c fi fa lOYR 5/6 mot, wk co prism str, fri, c fi lOYR 2/1 mn ox, pH 5.9, clr sm bdy.
188-229 cm; IIC, lOYR 5/4 si, f fi fa lOYR 5/6 mot, mass, fri, pH 5.8, aeolian sand with th bands of loess.
Core: 52B108 Location: 61 m N and 119 m W of SE corner NE^ Sec 8 T78N R5W Slope; 3% convex Elevation: 229 m Landscape position: summit of interfluve divide Solum: Tama hsil Sampled by; T. Bicki Described by; T. Bicki
0-18 cm; Ap, lOYR 2/2 hsil, mod fi gran str, fri, pH 6.4-6.2, gr sm bdy, loess.
18-36 cm; A12, lOYR 2/2 Isicl, mod fi gran str, fri, pH 6.0-5.6, gr sm bdy.
36-46 cm; A3, lOYR 3/2 Isicl, with f lOYR 3/3 mixings, mod fi and vfi sbk str, fri, pH 5.2, gr sm bdy.
46-64 cm; Bit, lOYR 4/3 sicl, ped ext lOYR 3/2, mod fi and vfi sbk str, fri, th disc lOYR 3/3 clay films on peds, pH 5.2-5.3, gr sm bdy.
64-81 cm; B21t, lOYR 4/3 sicl, mod fi and med abk -* mod fi and vfi sbk str, fri, th ncont lOYR 3/3 clay films on peds, vth disc lOYR 7/2 (dry) silt cts, f fi lOYR 2/1 mn ox, pH 5.3-5.4, gr sm bdy.
81-99 cm; B22t, lOYR 5/4 sicl, f fi fa lOYR 5/6 mot, mod med prism st med abk str, fri, th ncont lOYR 4/3 clay films on peds and pris, th cont lOYR 7/2 (dry) silt cts, f fi lOYR 2/1 mn ox, c fi rt chl, pH 5.4-5.5, gr sm bdy.
99-117 cm; B23t, lOYR 5/4 Isicl, c fi fa lOYR 5/6 and 5/8 mot, mod med prism -+ st med abk str, fri, med cont lOYR 3/3 clay films on pris, th disc lOYR 4/3 clay films on peds, th cont lOYR 7/2 (dry) silt cts, c fi lOYR 2/l mn ox, c lOYR 4/3 chl fil, pH 5.5, gr sm bdy.
117-132 cm; B31t, same as above.

276
132-147 cm; B32t, mix LOYR 5/4 and 5/3 Isicl, c fi fa IOYR 5/6 mot, st med prism st med abk str, fri, med cont LOYR 3/3 clay films on pris, th disc LOYR 7/2 (dry) silt cts, tk LOYR 3/3 ch fil, c fi IOYR 2/1 mn ox, c fi rt chl, pH 5,5-5.4, gr sm bdy.
147-163 cm; B33, mix lOYR 5/4 and 5/3 Isicl, c fi fa lOYR 5/6 and f fi d 2,5Y 6/2 mot, mod med prism str, fri, c fi lOYR 2/1 mn ox, c fi and vfi rt chl, pH 5.4-5.3, gr sm bdy.
163-254 cm; CI, mix lOYR 5/4 and 5/3 sil, c f fa lOYR 5/6 and 5/8 and f fi d 2.5Y 6/2 and 7.5YR 4/6 mot, mass, c fi and med lOYR 2/1 mn ox and stk, pH 5.3, loess with high sand content.
254-290 cm; C2, 2.5Y 6/2 Isil, m med p 7.5YR 5/8 Fe conc (pipestems), mass, c med lOYR 2/1 mn conc and stks, pH 5.4, abr sm bdy.
290-305 cm; MDL, 2.5Y 6/2 loam, m med d lOYR 5/6 mot, mass, c th lOYR 5/6 sand bands, f fi lOYR 2/1 mn ox, pH 5.6, abr sm bdy, loess with th inter sand bands.
305-328 cm; IIOL, lOYR 6/6 si, single grain, loose, f _ th lOYR 6/2 loess bands, pH 5.7, gr sm bdy, aeolian sand with th bands of loess.
328-366 cm; IIOL, lOYR 5/6 and 6/2 loam, c fi fa lOYR 5/8 mot, mass, pH 6.8, gr sm bdy, aeolian sand with m th bands of loess.
366-401 cm; MOL, 2.5Y 5/4 Isil, c med d lOYR 6/2 mot, mass, m fi and med 7.5YR 3/2 mn ox, c snail shells, pH 7.3, abr sm bdy, loess.
401-404 cm; lOYR 4/2 Isil, c fi 7.5YR 3/2 mn ox, pH 7,4, abr sm bdy, Mn rich band,
404-406 cm; 7.5YR 5/8 silt, mass, f fi 7,5YR 3/2 mn ox, f snail shells, pH 7.2, abr sm bdy, Fe-rich band.
406-427 cm; MDU, 2.5Y 6/2 silt c Fe-rich bands of 7.5 YR 5/8, mass, f 7.5YR 3/2 mn ox, pH 7.6, c snail shells, abr sm bdy.
427-450 cm; MDU, 2.5Y 6/2 Isil, m med and f p lOYR 5/6 and 7,5YR 5/8 Fe conc (pipestems), mass, pH 7,6, gr sm bdy,
450-518 cm; Allb, 5Y 4/1 sil, wk vfi sbk str, fri, c fi

277
7.5YR 3/2 mn ox, c N2/0 charcoal flecks, pH 7.2, Basal Wisconsin paleosol.
518-549 cm; A12b, 5Y 5/1 sil, c fi fa 5Y 5/3 mot, wk fi sbk str, fri, pH 7.1, gr sm bdy.
549-574 cm J IIA2b, 5Y 5/2 Isicl, f fi and med lOYR 5/6 mot, wk fi and vfi sbk str, fir, vth pa 5Y 7/2 (dry) silt cts, f fi 7.5YR 3/2 mn ox, pH 7.0, gr sm bdy, Yarmouth-Sangamon paleosol dev in swale-fill sediments.
574-610 cm; IIB2b, 5Y 3/2 sic, f fi d lOYR 4/2 mot, mod med abk str, vfir, f med d lOYR 7/2 (dry) cts on peds, f fi lOYR 5/6 Fe ox, pH 7.0.
Core: 52B107 Location: 46 m N and 46 m E of SW corner of SE% Sec 3
T78N R5W Slope: 3% convex Elevation: 223 m Landscape position: summit of interfluve divide Solum: Tama sil Sampled by: T. Bicki Described by: T. Bicki
0-15 cm; Ap, lOYR 3/2 hsil, mod fi and med gran str, fri, pH 7,1-7.0, gr sm bdy, loess.
15-28 cm; A12, lOYR 3/2 Isicl, mod fi and vfi sbk str, fri, pH 6.8, gr sm bdy.
28-38 cm A13, lOYR 3/2 and 3/3 sicl, mod fi and vfi sbk str, fri, pH 6.7, clr sm bdy.
38-51 cm; Bl, lOYR 4/3 hsicl, ped ext lOYR 3/3, mod fi sbk str, fri, f fi lOYR 2/1 mn conc, pH 6.1, clr sm bdy.
51-64 cm; B21t, lOYR 4/3 sicl, mod fi abk mod fi and vfi sbk str, fri, vth disc lOYR 3/3 clay films, f th pa 10 YR 7/2 (dry) silt cts, f fi lOYR 2/1 mn conc, pH 5.6, gr sm bdy.
64-81 cm; B22t, same as above except mod med prism wk fi and med abk str, and pH 5.5

278
81-102 cm; B23t, lOYR 4/3 Isicl, f fi fa lOYR 5/6 and 5/3 mot, mod med prism mod fi and med abk str, fri, th disc lOYR 3/3 clay films on pris, th pa lOYR 7/2 (dry) silt cts, th lOYR 3/3 chl fil, c fi lOYR 2/1 mn ox, pH 5.5-5.4, gr sm bdy.
102-117 cm; B3lt, LOYR 5/4 and 5/3 Isicl, m fi fa LOYR 5/6 and 5/8 mot, mod med prism str, fri, th disc IOYR 3/3 clay films, th LOYR 3/3 chl fil, f fi LOYR 2/1 mn ox, pH 5.4, gr sm bdy.
117-163 cm; C, lOYR 5/4 and 5/3 hsil, m med f lOYR 5/6 and 5/8 mot, c med d 7.5YR 4/6 Fe conc (pipestems), mass, f fi lOYR 2/1 mn ox, f fi and med rt chl, pH 5,7.
163-290 cm; MOL, lOYR 5/4 and 5/3 sil, c med d 2.5Y 6/2 mot, mass, c fi and med lOYR 2/1 mn conc, f snail shells, pH 7.6, abr sm bdy.
290-389 cm; MOU, 2.5Y 5/4 Isil, m med d lOYR 5/6 and 5/8 mot, mass, c fi and med lOYR 2/1 mn conc, f snail shells, pH 7.6, abr sm bdy.
389-414 cm; DU, 2.5Y 5/2 Isil, mass, f snail shells, pH 7.6.
414-485 cm; MDU, 2.5Y 5/2 Isil, c co and vco lOYR 4/6 Fe conc (pipestems), mass, f snail shells, pH 7.6-7.5.
485-528 cm; Alb, 2.5Y 5/2 sil, c fi d lOYR 5/6 and 5/8 mot, wk fi and vfi sbk str, fri, c fi lOYR 2/1 mn ox, m N 2/0 wood frg, pH 7.4-7.3, clr sm bdy. Basal Wisconsin paleosol.
528-549 cm; IIA2b, lOYR 5/3 hsicl, m med d lOYR 4/6 mot, mod vfi and fi sbk str, fir, c fi lOYR 2/1 mn ox, f wood frg, pH 7.3, gr sm bdy. Late Sangamon paleosol dev in pedi-sediment.
549-561 cm; IIBlb, lOYR 4/2 clay, m med d lOYR 4/6 mot, med vfi and fi abk str, vfir, f fi lOYR 2/1 mn ox, pH 7.2, gr sm bdy.
561-589 cm; IIIB21tb, lOYR 4/2 clay, m med d lOYR 4/6 and 5/8 mot, c f d 2.5YR 3/6 mot, st vfi and fi abk str, vfir, tk cont clay films, pH 7.1, gr sm bdy. Late Sangamon paleosol dev in Pre-Illinoian glacial till.
589-620 cm; IIIB22tb, LOYR 4/6 clay, c med p 5Y 5/1 mot, st fi abk str, vfir, pH 6.7-6.8.

279
Core; 52B205 Location: 46 m S and 402 m W of NE corner Sec 10 T78N R5W Slope: 3% convex Elevation: 223 m Landscape position: summit of interfluve divide Solum: Tama sil Sampled by: T. Bicki Described by: T. Bicki
0-18 cm; Ap, IOYR 2/1 sil, mod fi and med gran str, fri, pH 6.8-6.4, gr sm bdy, loess.
18-28 cm; A12, lOYR 2/2 sil, mod fi and med gran str, fri, pH 6,1, gr sm bdy.
28-36 cm; Al3, lOYR 3/2 Isicl, ped ext lOYR 2/2, mod f and med gran str, fri, pH 5.9, gr sm bdy.
36-51 cm; Bl, lOYR 4/3 sicl, ped ext lOYR 3/3, mod fi and vfi sbk str, fri, pH 5.9-5.6, gr sm bdy.
51-61 cm; B21t, lOYR 4/3 sicl, mod fi and vfi sbk str, fri, vth disc lOYR 3/3 clay films, vth pa lOYR 7/2 (dry) silt cts, pH 5.4, f fi IOYR 2/1 mn ox, gr sm bdy.
61-76 cm; B22t, same as above except mod med prism mod fine sbk str, pH 5.6.
76-91 cm; B23t, IOYR 5/4 and 4/4 sicl, mod med prism wk fi abk str, fri, vth disc lOYR 3/3 clay films on pris, vth ncont IOYR 7/2 (dry) silt cts on pris, f fi lOYR 2/1 mn ox, pH 5.9-6.2, gr sm bdy.
91-112 cm; B31t, IOYR 5/4 sicl, f fi fa lOYR 5/6 and 4/4 mot, mod med prism -» wk med abk str, fri, vth pa lOYR 3/3 clay films on pris, th ncont IOYR 7/2 (dry) silt cts, c f 10 YR 2/1 mn ox, pH 6.4-6.5, gr sm bdy.
112-132 cm; B32t, IOYR 5/4 Isicl, c fi fa IOYR 5/6 and c fi d 2.5Y 6/2 mot, med co prism str, fri, vth disc lOYR 4/3 clay films on pris, th disc lOYR 7/2 (dry) silt cts, c fi 10 YR 2/1 mn ox, pH 6.9, gr sm bdy.
132-152 cm; B33, IOYR 5/4 Isicl, c fi d 2.5Y 6/2 and m fi fa lOYR 5/6 mot, wk co prism str, fri, vth pa lOYR 7/2 (dry) silt cts, c fi IOYR 2/1 mn ox, pH 6.8, clr sm bdy.
152-196 cm; CI, IOYR 5/4 hsil, m fi fa lOYR 5/6 and c fi d 2.5Y 6/2 mot, mass, pH 6.9-7.0, gr sm bdy.

280
196-229 cm; MDL, C2, 2.5Y 6/2 sil, m fi and med p lOYR 5/6 mot and c fi p 7.5YR 4/6 Fe conc (pipestems), c med lOYR 2/1 mn ox, pH 6.9.
Core: 52B109 Location: 10 m N and 10 m W of SE corner of NE% NW%
Sec 11, T78N R5W Slope: 2% Elevation: 226 m Landscape position: summit of interfluve divide Solum: Tama Isicl Sampled by: T. Bicki Described by: T. Bicki
0-18 cm; Ap, lOYR 2/1 Isicl, clod -* mod fi gran str, fri, pH 6,0-5.9, gr sm bdy, loess.
18-33 cm; A12, lOYR 3/2 Isicl, mod fi gran str, fri, pH 5.4-5.2, gr sm bdy.
33-46 cm; A13, lOYR 2/2 Isicl, mod fi gran str, fri, pH 5.0-5.2, gr sm bdy.
46-69 cm; Bl, lOYR 4/3 sicl, ped ext lOYR 3/3, mod fi and vfi sbk str, fri, pH 5.3, gr sm bdy.
69-86 cm; B21t, lOYR 4/3 sicl, mod fi and vfi abk -* mod vfi sbk str, fri, th disc lOYR 3/3 clay films, pH 5.3, gr sm bdy.
86-102 cm; B22t, lOYR 5/4 Isicl, ped ext lOYR 4/3, wk med prism ̂ St fi and med abk str, fri, th disc lOYR 3/3 clay films on pris, vth pa lOYR 7/2 (dry) silt cts, f fi lOYR 2/1 mn ox, f lOYR 4/3 chl fil, pH 5.3-5.4, gr sm bdy.
102-122 cm; B3lt, lOYR 5/4 Isicl, c fi fa lOYR 5/3 and 5/6 mot, mod med prism st med abk str, fri, th disc lOYR 4^3 clay films on pris, med ncont lOYR 7/2 (dry) silt cts on pris, f fi lOYR 2/1 mn ox, c fi rt chl, 5.4-5.5, gr sm bdy.
122-147 cm; B32t, lOYR 5/4 Isicl, c fi fa lOYR 5/3 mot, mod med prism str, fri, th disc lOYR 4/3 clay films, th ncont lOYR 7/2 (dry) silt cts, f lOYR 4/3 chl fil, f fi lOYR 2/1 mn ox, pH 5.5-5.6, gr sm bdy.
147-221 cm; CI, mixed lOYR 5/4 and 5/3 hsil, m med and fi fa lOYR 5/5 mot, mass, f fi lOYR 2/1 mn ox, pH 5.6-5.7,
221-259 cm; MDL, 2.5Y 6/2 sil, m med d lOYR 5/6 and 5/8 mot, f fi p 7.5YR 4/6 mot, mass, cfilOYR 2/1 mn ox, pH 5.9,
259-305 cm; MDL, same as above except pH 7,1.

281
Transect: West Liberty IV Corel 52B206 Location: 61 m S and 51 m E of NW corner SW% NW% Sec 19
T78N R5W Slope: 3% Elevation: 201 m Landscape positions high terrace Solum: Tama Isicl Sampled by: T. Bicki Described by: T. Bicki
0-20 cm; Ap, lOYR 3/2 Isicl, mod fi and med gran str, fri, pH 6.2-6,0, clr sm bdy, loess.
20-28 cm; A12, lOYR 3/2 sicl, mod fi and med gran str, fri, pH 5.8, gr sm bdy.
28-36 cm; A3, lOYR 3/2 sicl, ped ext lOYR 3/3, mod fi and med gran str, fri, pH 5.5, gr sm bdy.
36-48 cm; Bl, lOYR 4/3 sicl, ped ext lOYR 3/3 mod, fi and vfi sbk str, fri, pH 5.6, gr sm bdy.
48-64 cm; B21t, lOYR 4/3 sicl, mod fi and vfi sbk str, fri, th disc lOYR 4/3 clay films, f fi lOYR 2/1 mn ox, pH 5.6, gr sm bdy.
64-76 cm; B22t, lOYR 4/3 sicl, mod med sbk mod fi and vfi sbk str, fri, th disc lOYR 3/3 clay films, f fi lOYR 2/1 mn ox, pH 5.7, gr sm bdy.
76-91 cm; B23t, lOYR 4/3 sicl, mod med prism wk fi sbk str, fri, th disc lOYR 3/3 clay films on peds and pris, vth pa lOYR 7/2 (dry) silt cts on pris, f fi lOYR 2/1 mn ox, pH 5.7, gr sm bdy.
91-107 cm; B3lt, lOYR 4/3 Isicl, mod med prism ^ wk fi and med sbk str, fri, th disc lOYR 3/3 clay films on peds and pris, f fi lOYR 2/1 mn ox, pH 5.7-5.8, gr sm bdy.
107-122 cm; B32t, lOYR 5/4 Isicl, f fi fa lOYR 5/4 mot, mod med prism -• wk fi and med sbk str, fri, th disc lOYR 4/3 clay films on pris, f fi lOYR 2/1 and 7.5YR 3/2 mn ox, pH 5.8, gr sm bdy.
122-150 cm; B33, lOYR 5/4 hsil, f fi fa lOYR 5/4 mot, mod med prism str, fri, f fi lOYR 2/1 and 7.5YR 3/2 mn ox, clr sm bdy.
150-168 cm; IIOL, lOYR 5/4 si, mass, pH 5.9, aeolian sand with th bands of lOYR 4/4 loess.
168-229 cm; IIOL, lOYR 6/6 Is, single grain, loose, pH 6.1, sand.

282
229-396 cm; OL, lOYR 6/5 sand, single grain, loose, pH 6.1, sand.
Cores 52B104 Location: 9 m S and 83 m E of NW corner, SW^ SW^ Sec 25
T78N R5W Elevation: 223 m Landscape position: siammit of interfluve divide Solum: Tama sil Sampled by: T. Bicki Described by: T. Bicki
0-18 cm; Ap, lOYT? 2/1 hsil, clod -» mod vfi sbk str, fri, pH 5.7, clr sm bdy, loess.
18-33 cm; A12, lOYR 2/l Isicl, mod fi and vfi sbk -* mod med gran str, fri, pH 5.7-5.3, clr sm bdy.
33-46 cm; A3, lOYR 3/2 with mixings of lOYR 3/3, mod fi abk -» mod fi and vfi sbk str, fri, pH 5.3-5.2, clr sm bdy.
46-64 cm; Bl, lOYR 3/3 sicl, mod fi abk -» mod fi sbk str, fri, vth pa lOYR 7/2 (dry) silt cts, pH 5.3-5.2, gr sm bdy.
64-81 cm; B21t, lOYR 4/3 sicl, mod fi abk str, fri, vth cont lOYR 3/3 clay films on peds, vth pa lOYR 7/2 (dry) silt cts, f fi lOYR 2/1 mn ox, pH 5.3, gr sm bdy.
81-94 cm; B22t, lOYR 5/4 sicl, f fi fa lOYR 5/6 mot, mod med prism — st med and fi abk str, fri, tk cont lOYR 3/2 clay films on pris, th disc lOYR 3/2 clay films on peds, th cont lOYR 7/2 (dry) silt cts, c fi lOYR 2/1 mn ox, pH 5.5, gr sm bdy.
94-117 cm; B23t, lOYR 5/4 Isicl, c fi fa lOYR 5/3 and 5/6 mot, st med prism -• st med abk str, fri, med cont lOYR 3/3 clay films on pris, vth pa lOYR 4/3 clay films on peds, med cont lOYR 7/2 (dry) silt cts, c fi lOYR 2/1 mn ox, c med and fi rt chl, pH 5.8-5.7, gr sm bdy.
117-135 cm; B31t, mixed lOYR 5/4 and 5/6 Isicl, mod med prism -* mod med abk str, fri, med cont lOYR 3/3 clay films on pris, th cont lOYR 7/2 (dry)silt cts, c fi lOYR 2/1 mn ox, c med and f rt chl, pH 5.7, gr sm bdy.
135-155 cm; B32t, same as above except c fi d 2.5Y 6/2 mot, and pH 5.8.

283
155-180 cm; B33t, lOYR 5/4 hsil, m fi d 2.5Y 6/2 and m fi fa lOYR 5/6 mot, mod med prism mod co and med abk str, fri, th pa lOYR 3/3 clay films on pris, th cont lOYR 7/2 (dry) silt cts, c fi lOYR 2/1 mn ox, pH 5.8, gr sm bdy.
180-208 cm; C, lOYR 6/3 sil c fi fa lOYR 5/6 mot, mass, th lOYR 3/3 chl fil, m fi lOYR 2/1 mn ox, pH 5.8-6.0, clr sm bdy.
208-224 cm; DL, 2.5Y 6/2 sil, c med p 5YR 3/4 Fe conc (pipestems), mass, c fi lOYR 2/1 mn ox, pH 5.7, abr sm bdy.
224-269 cm; IIOL, lOYR 6/6 Isand, single grain, loose, pH 5.7, clr sm bdy, aeolian sand.
269-290 cm; IIOL, lOYR 5/6 Isand and s loam, single grain, th bands of 2.5Y 6/2 loess, pH 5.7-6,1 aeolian sand with th bands of deoxidized loess.
290-305 cm; DL, 2.5Y 5/2 Isil, c med d lOYR 5/8 mot, and conc (pipestems), mass, fri, th inter bands of lOYR 5/6 sand, pH 7.1, loess with th bands of sand.
305-427 cm; DL, 2.5Y 5/2 Isil, c med d lOYR 5/8 mot and Fe conc (pipestems), mass, pH 7.1, loess.
427-564 cm; DU, 2.5Y 5/1 Isil, m med d lOYR 5/8 mot, and Fe conc (pipestems), mass, pH 7.6.
564-594 cm; Alb, lOYR 4/2 sil, wk sbk str, fri, c fi lOYR 2/1 mn ox, pH 7.3, Basal Wisconsin paleosol.

284
Transect: Iowa City East Core: 52B204 Location: 32 m N and 192 m W of intersection of railroad
tracks and gravel road, in NE% SE% Sec 19 T79N R5W
Slopes 3% convex Elevation: 207 m Landscape position: high terrace Solum: Tama hsil Sampled by: T. Bicki Described by: T. Bicki
0-20 cm; Ap, lOYR 2/1 hsil, mod fi and med gran str, fri, pH 6.9-6.8, clr sm bdy, loess.
20-31 cm; A12, lOYR 2/1 Is id, mod fi and med gran str, fri, pH 6.2, gr sm bdy.
31-41 cm; A3, lOYR 3/2 Isicl, mod fi and med gran, fri, pH 5.6, gr sm bdy.
41-53 cm; Bl, lOYR 4/3 Isicl, ped ext lOYR 3/3, wk fi and vfi sbk str, fri, pH 5.5, gr sm bdy.
53-71 cm; B21t, lOYR 4/3 sicl, mod fi and vfi sbk str, fri, th disc lOYR 3/3 clay films, vth pa lOYR 7/2 (dry) silt cts, c vfi and fi rt chl, pH 5.3-5.4, gr sm bdy.
71-86 cm; B22t, same as above except pH 5.4.
86-107 cm; B23t, lOYR 5/4 sicl, f fi fa lOYR 5/6 mot, mod med prism mod med and fi sbk str, fri, th disc lOYR 4/3 clay films on peds, med disc lOYR 7/2 (dry) silt cts, f fi lOYR 2/1 mn ox, c vfi rt chl, pH 5.5-5.6, clr sm bdy.
107-127 cm; B31t, lOYR 5/4 Isicl, f fi fa lOYR 5/6 and 4/6 mot, St med prism mod med and fi abk str, fri, pris ext lOYR 5/2, th disc lOYR 4/3 clay films on pris, th lOYR 4/3 ch fil, c lOYR 2/1 mn ox, pH 5.5, gr sm bdy.
127-160 cm; B32, lOYR 5/4 Isicl, m med and fi fa lOYR 5/6 mot, mod med prism str, fri, pris ext lOYR 5/3, th lOYR 4/3 chl fil, c med lOYR 2/l mn ox, pH 5.8, gr sm bdy.
160-185 cm; B33, same as above except wk med prism str,
185-244 cm; CI, lOYR 5/4 hsil, c fi fa lOYR 5/6 and c fi d 2.5Y 6/2 mot, mass, c med lOYR 2/1 mn ox, pH 6.0, gr sm bdy.

285
244-279 cm; C2, lOYR 5/4 and 2.5Y 5/2 hsil, c fi fa lOYR 5/6 and f fi d 7.5YR 4/6 mot, mass, c med lOYR 2/1 mn ox, pH 6.1, gr sm bdy.
279-457 cm ; MOL, same as above except sil texture, pH 5.7-6.5, and clr sm bdy.
457-549 cm; MDL, 2.5Y 6/2 sil, m med and co d lOYR 4/6 and 5/6 mot, and Fe conc (pipestems), mass, m med and co 7.5YR 3/2 and lOYR 2/1 mn conc, pH 6.9, abr sm bdy.
549-582 cm; MDU, same as above except 1 sil texture and pH 7.6.
5 82-625 cm; MDU, same as above with f snail shells.
625-651 cm; I&IIOU, lOYR 5/4 Isil, mass, pH 7.6, mixture of loess and sand.
651-701 cm; I&IIAb, lOYR 4/4 Isil, mass, pH 7.7, Basal Wisconsin paleosol.
701-823 cm; IIOU, lOYR 5/4 loamy sand, single grain, loose, pH 7.8, sand.
Core; 52B217 Location; 10 m S and 10 m E of NW corner of SE^
Sec 28 T79N R5W Slope; 3% Elevation; 226 m Landscape position; interfluve summit Solum; Tama sicl Sampled by; T. Bicki Described by; T. Bicki
0-23 cm; Ap, lOYR 2/1 Isicl, clod - mod fi and med gran str, fri, pH 5.7-5.3, clr sm bdy, loess.
23-28 cm; A12, same as above except pH 5.3 and gr sm bc^ .
28-36 cm; A13, lOYR 3/2 Isicl and same as above.
36-46 cm; Bl, lOYR 3/2 sicl, f lOYR 4/3 mixings, mod fi and vfi sbk str, fri, pH 5.3, gr sm bdy.
46-58 cm; B21t, lOYR 4/3 sicl, ped ext lOYR 3/2, mod fi sbk str, fri, vth disc lOYR 3/3 clay films, pH 5.4, gr sm bdy.

286
5 8-74 cm; B22t, lOYR 4/3 sicl, mod fi sbk str, fri, th disc clay films, f fi rt chl, pH 5.5, gr sm bdy.
74-89 cm J B23t, lOYR 5/4 sicl, mod med prism mod fi and med sbk str, fri, vth disc lOYR 3/3 clay films on peds and pris, vth disc lOYR 7/2 (dry) silt cts, pH 5.5, gr sm bdy.
89-107 cm; B31, lOYR 5/4 sicl, f fi lOYR 5/6 mot, mod med prism wk med abk str, fri, th disc lOYR 7/2 (dry) silt cts, f fi lOYR 2/1 mn ox, f fi rt chl, pH 5.4-5.5, gr sm bdy.
107-130 cm; B32, lOYR 5/4 Isicl, f fi fa lOYR 5/6 mot, mod med prism -+ wk med abk str, fri, th disc lOYR 7/2 (dry) silt cts, c fi lOYR 2/1 and 7.5YR 3/2 mn ox, f fi rt chl, pH 5.6, gr sm bdy.
130-140 cm; B33, lOYR 5/4 Isicl, f fi fa lOYR 5/6 mot, wk CO prism str, fri, c fi lOYR 2/1 and 7.5YR 3/2 mn ox, f fi rt chl, pH 5.7, gr sm bdy.
140-193 cm; C, lOYR 5/4 hsil, c fi and med lOYR 5/6 and 5/3 mot, mass, pH 5.8.

2 87
Transect; Nichols Core; 52BB101 Location; 270 m S and 41 m E of NW corner of Sec 35 T77N R3V Slope: 1% concave Elevation; 189 m Landscape position; intermediate terrace Solum; Tuskeego sil Sampled by T. Bicki and N. Bicki Described by; T. Bicki
0-20 cm; Ap, lOYR 3/1 hsil, lOYR 5/l (dry), clod wk fi and vfi gran str, fri, pH 5.6, clr sm bdy, alluvium.
20-33 cm; A21, lOYR 4/1 Isicl, wk th pi -• wk fi gran str, fri, pH 5.5, sir sm bdy.
33-46 cm J A22, lOYR 4/l s id, wk th pi mod fi and vfi sbk str, fri, th cont lOYR 7/2 (dry) silt cts, pH 5.5, clr sm bdy.
45-51 cm; Bltg, lOYR 4/l sic, m fi and med fa lOYR 5/5 mot, mod vfi and fi abk str, fir, tk cont lOYR 3/1 clay films on peds, pH 5.6, gr sm bdy.
61-76 cm; B21tg, 2.5Y 5/2 sic m med d lOYR 5/6 mot, mod med prism -• st fi abk str, fir, tk cont lOYR 3/1 clay films on peds, c fi lOYR 2/l conc, pH 5.7, gr sm bdy.
76-91 cm; B22tg, 2.5Y 5/2 sic, c med d lOYR 5/6 mot, st med prism st med abk str, fir, vtk cont lOYR 3/1 clay films on pris, med cont lOYR 3/1 clay films on peds, f fi lOYR 2/1 and 7.5YR 3/2 mn conc, m rt chl, pH 5.9, gr sm bdy.
91-109 cm; B23tg, 2.5Y 5/2 hsicl, m co d 7.5YR 5/8 and c med d lOYR 5/5 mot, st med prism mod med abk str, fir, tk cont lOYR 3/1 clay films on pris, th cont lOYR 3/1 clay films on peds, tk lOYR 3/l chl fil, c fi lOYR 2/1 and 7.5R 3/2 mn conc, pH 6.4, gr sm bdy.
109-132 cm; B31tg, 2.5Y 5/2 hsicl, f fi fa 7.5YR 5/8 mot, mod med prism wk med abk str, fir, tk cont lOYR 3/1 clay films on pris, tk cont lOYR 3/1 chl fil, c fi lOYR 2/1 mn conc, pH 6.6-6.8, clr sm bdy.
132-152 cm; Clg, 2.5Y 5/2 Isicl, c med d 7.5YR 5/9 and lOYR 5/6 mot, mass, tk lOYR 3/1 chl fil, c fi lOYR 2/1 mn ox, pH 7.1, gr sm bdy.
152-234 cm; C2g, 2.5Y 6/2 sil, c med fa 2.5Y 5/4 mot, f fi d lOYR 5/6 mot, mass, pH 7.4, abr sm bdy.

288
234-244 cm; IIC3, lOYR 6/6 loamy sand, single grain, loose, pH 7.4.
Core: 70BB102 Location: 145 m W and 31 m N of SW corner SE% SW^ Sec 29
T77N R4W Slope: 1% concave Elevation: 189 m Landscape position: intermediate terrace Solum: Bremer variant sicl Sampled by; T, Bicki and N. Bicki Described by: T. Bicki
0-23 cm; Ap, lOYR 2/1 sicl, clod wk fi gran str, fir, pH 7.0-6.8, abr sm bdy, stratified alluvium.
23-41 cm; A12, lOYR 2/1 sic, mod vfi and fi gr str, fri, pH 6.8, gr sm bdy.
41-53 cm; A13, lOYR 2/l sic, mod fi and med gran str, fri, c fi and med 7.5YR 5/8 Fe conc (pipestems), pH 6.8, gr sm bdy.
53-66 cm; A3, lOYR 3/1 sic, mod vfi abk str, fir, m med and CO 7.5YR 5/8 Fe conc (pipestems), pH 6.7, gr sm bdy.
66-84 cm; B21, lOYR 3/1 sic, c fi and med fa lOYR 5/6 mot, mod fi abk str, fir, c fi and med 7.5YR 5/8 Fe conc (pipestems), pH 6.6, gr sm bdy.
84-107 cm; B22tg, 2.5Y 4/2 hsicl, c fi d lOYR 4/6 mot, mod med prism mod fi and med abk str, fir, med cont lOYR 3/1 clay films on pris, c fi and med 7.5YR 5/8 Fe conc (pipe-stems), c fi and med lOYR 2/1 mn conc, pH 6.5-6.6, gr sm bdy.
107-130 cm; B3tg, 2.5Y 5/2 hsicl, c fi d lOYR 4/6 mot, wk med prism wk fi abk str, fir, th lOYR 2/2 chl fil, f fi 7.5YR 3/2 mn ox, pH 6.5, gr sm bdy.
130-178 cm; Clg, 2.5Y 6/2 hsil, c fi d 7.5YR 5/8 and lOYR 5/6 mot, mass, f rt chl, pH 6.5, clr sm bdy.
178-203 cm; C2g, same as above except hsicl and pH 6.6.
203-244 cm; IIC3, lOYR 6/2 sand, c fi fa lOYR 4/6 mot, single grain, loose, pH 6.6, stratified sand.

289
Core: 70BB103 Location: 31 m N and 46 m W of SE corner SW% SE% Sec 28
T77N R4W Slope: 1% concave Elevation: 189 m Landscape position: intermediate terrace Solum: Flagler si Sampled by: T. Bicki and N. Bicki Described by: T. Bicki
0-25 cm; Ap, lOYR 2/1 si, wk med sbk str, vfri, pH 6.8, gr sm bdy.
25-48 cm; A12, lOYR 3/2 si, wk med sbk str, vfri, pH 6.7, gr sm bdy.
48-61 cm; A3, lOYR 3/2 Is, wk co sbk str, vfri, pH 6.6, gr sm bdy.
61-89 cm; B2, lOYR 4/3 si, wk co sbk str, vfri, pH 6.5-6.6, gr sm bdy.
89-112 cm; CI, lOYR 4/4 si, single grain, loose, pH 6.6, gr sm bdy.
112-183 cm; IIC2, lOYR 6/6 sand, single grain, f gravels, stratified in lower part, pH 6.3.

290
Transect: Conesville Core: 58BB104 Location: 229 m N and 15 m E of fencerow in NE^ SE^ Sec 22
T76N R5W Slope: 3% convex Elevation: 192 m Landscape position: summit of dune-like feature on inter
mediate terrace Solum: Sparta fi sand Sampled by: T. Bicki and N. Bicki Described by: T. Bicki
0-28 cm J Ap, lOYR 2/2 fi sand, wk med sbk str, vfri, pH 5.8-5.5, gr sm bdy, sandy alluvium.
28-43 cm; A12, lOYR 2/2 Is, wk med sbk str, vfri, pH 5.0, dif sm bdy.
43-58 cm; A3, lOYR 3/2 sand, wk med sbk str, vfri, pH 5.0, gr sm bdy.
58-97 cm; B2, lOYR 4/3 Is, wk co sbk str, vfri, pH 5.3-5.4, gr sm bdy.
97-137 cm; CI, lOYR 5/4 Is, single grain, loose, pH 5.5, abr sm bdy.
137-173 cm; IIC2, lOYR 4/4 si, wk th pi wk med sbk str, vfri, stratified sandy loam sediments, pH 5,6, abr sm bdy.
173-218 cm; 03, lOYR 6/6 sand, single grain, loose, pH 5.7, gr sm bdy.
218-231 cm; 7.5YR 4/6 sand, single grain, loose, pH 5.8.
231-254 cm; lOYR 6/4 sand, single grain, loose.
254-264 cm; 7.5YR 4/6 sand, single grain, loose.
264-290 cm; lOYR 6/4 sand, single grain, loose.
290-300 cm; 7.5YR 6/4 sand, single grain, loose.

291
Core: 58BB105 Location; 46 m N and 41 m E of junction of railroad tracks
and road in SW% SE% Sec 24 T76N R5W Slope: 1% concave Elevation: 188 m Landscape position; intermediate terrace Solum: Finchford Is Sampled by; T. Bicki and N. Bicki Described by: T. Bicki
0-25 cm; Ap, lOYR 2/1 Is, wk med sbk str, vfri, pH 6.6-6.5, gr sm bdy.
25-41 cm; A12, lOYR 2/2 Is, wk co sbk str, vfri, pH 6.4, gr sm bdy.
41-53 cm; A3, lOYR 3/2 Is, wk co sbk str, vfri, pH 6.1, gr sm bdy.
53-84 cm; B2, lOYR 4/4 Is, wk co sbk str, vfri, pH 6.3-6.4, gr sm bdy.
84-104 cm; CI, lOYR 5/4 Is, single grain, loose, pH 6.4, gr sm bdy.
104-137 cm; IIC2, 7.5YR 3/4, si, mass, f fi rt chl, th bands of stratified sediments.
137-305 cm; OL, lOYR 6/4 sand, single grain, loose, stratified sand w/ fi gravels, pH 5.̂ 9.
Core; 70BB106 Location: 20 m S of road and 114 m W of fencerow in NW%
NW% Sec 29 T76N R4W Slope: 1% Elevation: 186 m Landscape position: intermediate terrace Solum: Finchford Is Sampled by: T. Bicki and N. Bicki Described by: T. Bicki
0-28 cm; Ap, lOYR 2/2 sand, wk med sbk str, vfri, pH 6.6-6.3, clr sm bdy, 0.1% gravel, sandy alluvium.
28-53 cm; A3, lOYR 3/2 sand, wk med sbk str, vfri, pH 6.0-5.1, gr sm bdy, 0.5% gravel.

292
53-81 cm; B2, lOYR 4/3 sand, single grain, loose, pH 5.1-5.0, gr sm bdy, 0.4% gravel.
81-104 cm; C2, lOYR 4/4 sand, single grain, loose, pH 5.4, 0.5% gravel.
104-125 cm; OL, lOYR 4/4 sand, single grain, loose, pH 5.6, 0.7% gravel.
125-147 cm; OL, 7.5YR 4/6 sand, c med 7.5YR 3/2 mn stains, single grain, loose, pH 5.5, 0.5% gravel, stratified sand.
147-191 cm; OL, lOYR 6/4 and 4/6 sand, m med and co lOYR 2/2 and 7.5YR 3/2 mn stains, single grain, loose, pH 5.5, 0.8% gravel.
191-305 cm; OL, same as above except pH 6,0 and 2.0% gravel.
305-427 cm; OL, same as above except 1.0% gravel.

293
Transect: Columbus Junction Core: 58BEN5 Location: 152 m N and 91 m E of SW corner of SE% Sec 25
T75N R5W Slope: 1% concave Elevation; 219 m Landscape position: summit of primary divide Solum: Sperry-Keomah intergrade Collected by: T. Bicki Described by: T. Bicki and G. Hallberg
0-183 cm; solum dev in loess.
183-254 cm; MOL, lOYR 6/2 sil, m co fa lOYR 5/6 mot, mass, pH 7.0, gr sm bdy, loess.
254-285 cm; OL, lOYR 5/4 sil, c med fa lOYR 5/3 + 5/6 mot, mass, pH 7.0, gr sm bdy, loess.
285-333 cm; IIOL, lOYR 5/4 sil, mass, pH 7.0-6.9, gr sm bdy, pedisediment.
333-353 cm; IIBlb, lOYR 5/4 Id, wk fi sbk str, fri, pH 6.9, abr sm bdy, Late Sangamon paleosol dev in pedisediment.
353-381 cm; IIIB21tb, 7.5YR 4/4 clay, c med fa 7.5YR 4/6 mot, mod fi sbk str, vfir, med cont lOYR 4/4 clay films on peds, pH 6.8-6.7, clr sm bdy. Late Sangamon paleosol dev in undifferentiated glacial till of Wolf Creek Formation.
381-396 cm; IIIB22t, 7.5YR 4/4 clay, c med fa 7.5YR 4/6 + c med d lOYR 5/3 mot, mod fi sbk str, vfir, tk cont clay films on peds, pH 6.8, clr sm bdy.
396-409 cm; IIIB23tb, same as above with f med lOYR 2/1 mn conc.
409-424 cm; IIIB24tb, lOYR 5/6 hcl, f fi fa lOYR 6/8 mot, mod fine sbk str, vfir, th cont lOYR 4/4 clay films on peds, m CO lOYR 2/1 mn conc, pH 7.1, clr sm bdy.
424-445 cm; IIIB3tb, lOYR 5/6 hcl, f fi fa lOYR 6/8 mot, mod fi sbk str, vfir, th disc lOYR 4/4 clay films on peds, f med lOYR 2/1 mn conc, pH 7.1, abr sm bdy.
445-475 cm; IVBtb, 5Y 5/2 Isic, f med d IOYR 5/6 mot, st med + fi abk str, vfir, tk cont clay films on peds, f co LOYR 2/1 mn ox, pH 7.1, abr sm bdy, sheared inclusion of paleosol in till.

294
475-506 cm; VMOU, lOYR 6/6 loam, c med fa lOYR 5/6 mot, mass, f fi lOYR 2/1 mn ox, pH 7.5, abr sm bdy, undifferentiated till of Wolf Creek Formation.
506-526 cm; VRU, 5Y 6/2 cl, c fi fa 2.5Y 5/2 stn, f fi d lOYR 5/6 mot, mass, c med lOYR 2/1 mn ox, pH 7.6, clr sm bdy.
526-541 cm; VMOU, lOYR 5/4 hi, c fi fa lOYR 5/6, c fi d 7.5YR 5/6 + f fi d 2.5Y 6/2 mot, mass, f fi lOYR 2/1 mn ox, pH 7.7, abr sm bdy.
541-551 cm; VIRU, mix 5Y 6/2 + 2.5Y 6/2 sicl, mass, c fi lOYR 2/1 mn ox, pH 7.6, abr sm bdy, inclusion of till derived sediments in till.
551-559 cm; VIRL, 2.5Y 4/2 hsicl, f fi d lOYR 5/6 mot, •wk fi + med sbk str, f med lOYR 2/1 mn ox, pH 7.5, abr sm bdy.
559-594 cm; VIRU, 5Y+ 2.5Y 5/2 hsicl, c fi d lOYR 5/6 + c fi fa 2.5Y 4/2 mot, mass, f fi lOYR 2/1 mn ox, pH 7,6, abr sm bdy.
594-640 cm; VIIJ0U2, lOYR 5/4 hcl, c med fa lOYR 5/6 + 7.5YR 5/6 mot, c fi fa lOYR 5/2 mot, mass, f fi lOYR 2/1 mn ox, pH 7.7, abr sm bdy, undifferentiated till of the Wolf Creek Formation.
640-658 cm; VIIIB2tb, 7.5YR 4/4 clay, c fi fa 7.5YR 4/6 mot, mod fi sbk str, vfir, th ncont clay films on peds, pH 6.9, clr sm bdy, truncated Dysart paleosol dev in till derived sediments.
658-681 cm; VIIIB3tb, lOYR 5/6 clay, c fi d 7.5YR 4/6 + 2.5Y 5/2 mot, mod med prism mod fine sbk str, fir, th cont clay films on peds, pH 6,8-6.7, abr sm bdy.
681-754 cm; IXMOU, lOYR 5/4 loam, c fi fa lOYR 5/3 + 5.8 mot, mass, c fi + med 7.5YR 5/8 Fe conc (pipestems), f coal frg, pH 7.8-8.2, abr sm bdy, undifferentiated till of Wolf Creek Formation.
754-800 cm; IXMOU, lOYR 5/4 loam, c fi fa lOYR 5/8 mot, mass, c med lOYR 2/1 mn ox, pH 8.1, clr sm bdy,
800-914 cm; IXMOU, 2.5Y 5/2 1 loam, c fi d lOYR 5/8 mot, mass, c fi lOYR 2/1 mn ox, f fi + med coal frg, pH 8.2-8.1.

\
295
Core; 58BB107 Location: 82 m N + 2 m E of SW corner of SW% SE% Sec 26
T75N R5W Slope: 2% convex Elevation: 210 m Landscape position: saddle of primary divide Solum: Collected by: T. Bicki and N. Bicki Described by: T. Bicki and G. Hallberg
0-163 cm ; solum dev in loess.
163-193 cm; MDL, 5Y 5/2 sil, m med p 7.5YR 5/8 + 5/6 Fe conc (pipestems), mass, c fi lOYR 2/1 mn conc, f fi rt chl, pH 7.1, gr sm bdy, loess.
193-290 cm; MDU, 2.5Y 5/2 sil, f med p 7.5YR 5/8 Fe conc (pipestems), mass, f fi lOYR 2/1 mn conc, pH 7.3, gr sm bdy.
290-330 cm; MDU, 2.5Y 5/2 sil, m co p 7.5YR 5/8 Fe conc (pipestems), f fi lOYR 2/1 mn ox, pH 7.3, gr sm bdy.
330-361 cm; I + IIAb, 2.5Y 5/2 Isicl, m med d lOYR 5/6 mot, mass, c 2.5Y 4/2 stn, th lOYR 3/l chl fil, pH 7.1, abr sm bdy. Basal Wisconsin paleosol and sediments.
361-368 cm; I + IIC, lOYR 5/8 cl, mass, pH 7.0, abr sm bdy.
368-401 cm; IIIA21b, lOYR 3/2 + 3/3 cl, c fi fa lOYR 5/6 mot, wk fi gr str, fri, th pa lOYR 6/2 (dry) silt ct, pH 6.9-7.0, clr sm bdy. Late Sangamon paleosol dev in pedisediment.
401-422 cm; IIIA12tb, lOYR 3/2 + 3/3 cl, c fi fa lOYR 5/8 mot, wk fi gran str, fri, th pa clay films, th cont lOYR 6/2 (dry) silt cts, pH 7.0, clr sm bdy.
422-439 cm; IIIBltb, lOYR 4/2 hcl, c fi fa lOYR 5/8 mot, wk fi sbk wk vfi sbk str, fir, th cont lOYR 3/3 clay films, th pa lOYR 6/2 (dry)silt cts, c fi lOYR 2/l mn conc, pH 7.0, clr sm bdy.
439-457 cm; IIIB2ltb, lOYR 5/2 Ic, c fi fa lOYR 5/8 + 4/6 mot, c fi fa 2.5Y 5/2 mot, mod vfi + fi sbk str, firm, th cont lOYR 3/3 clay films, c fi lOYR 2/1 mn conc, pH 7.0,
457-493 cm; IVB22tgb, 2.5Y 5/2 Id, m co d lOYR 5/8 mot on pris faces, wk med prism str, firm, th patchy lOYR 4/1 clay films, pH 7.0-6,9, abr sm bdy. Late Sangamon paleosol dev in undifferentiated glacial till of Wolf Creek Formation,

296
493-508 cm; IVB3itgb, 2.5Y 5/2 Ici, m co d lOYR 5/8 mot, mod med + fi abk str, fri, th cont lOYR 4/1 clay films, c fi lOYR 2/1 mn ox, pH 7.1, clr sm bdy.
508-533 cm; rVB32tgb, 2.5Y 5/2 Icl, m co d lOYR 5/8 mot, mod med prism mod med + fi abk str, fri, th disc lOYR 4/1 clay films on peds, m med lOYR 2/1 mn conc, pH 7.1, abr sm bdy.
533-564 cm; IVMOL, 2.5Y 5/2 loam, m co d lOYR 5/8 mot, mass, pH 6.9, abr sm bdy.
564-584 cm; IVOL, lOYR 3/3 loam, c med d lOYR 5/8 mot, wk fi sbk str, fri, th disc lOYR 4/1 clay films, th pa lOYR 6/2 silt cts, f wood frg, pH 7.1, abr sm bdy, paleosol-like inclusion in till.
584-610 cm; IVJMOU, lOYR 5/6 loam, c fi d 2.5Y 5/2 mot, jointed, tk lOYR 2/1 mn stn on joints, c carb conc, pH 8.0, gr sm bdy, undifferentiated glacial till of Wolf Creek Formation.
610-640 cm; IVJMOU, same as above except pH 7.9-8.1.
Core: 58BEN2 LocationI 107 m N and 9 m W of NE corner of machine shed in
SE% SW% Sec 26 T75N R5W Slope: 2% concave Elevation: 210 m Landscape position: saddle of primary divide Solum: Collected by: S. Esling and J. Nott Described by: T. Bicki and G. Hallberg
0-127 cm; solum dev in loess.
127-147 cm; MDL, 5Y 6/2 sil, m med + co p 7.5YR 5/6 mot + Fe conc (pipestems), mass, f fi 7.5YR 3/2 mn ox, f fi + vfi root chl, pH 6.9, gr sm bdy, loess.
147-196 cm; MDL, 5Y 6/2 Isil, c fi + med 7.5YR 5/6 Fe conc (pipestems), mass, f fi 7.5YR 3/2 mn ox, f fi root chl, pH 7.6, gr sm bdy.
196-285 cm; MDL, 5Y 6/2 Isil, c med p 7.5YR 5/6 Fe conc (pipestems), mass, f fi 7.5YR 3/2 mn conc, pH 7.6, gr sm bdy.
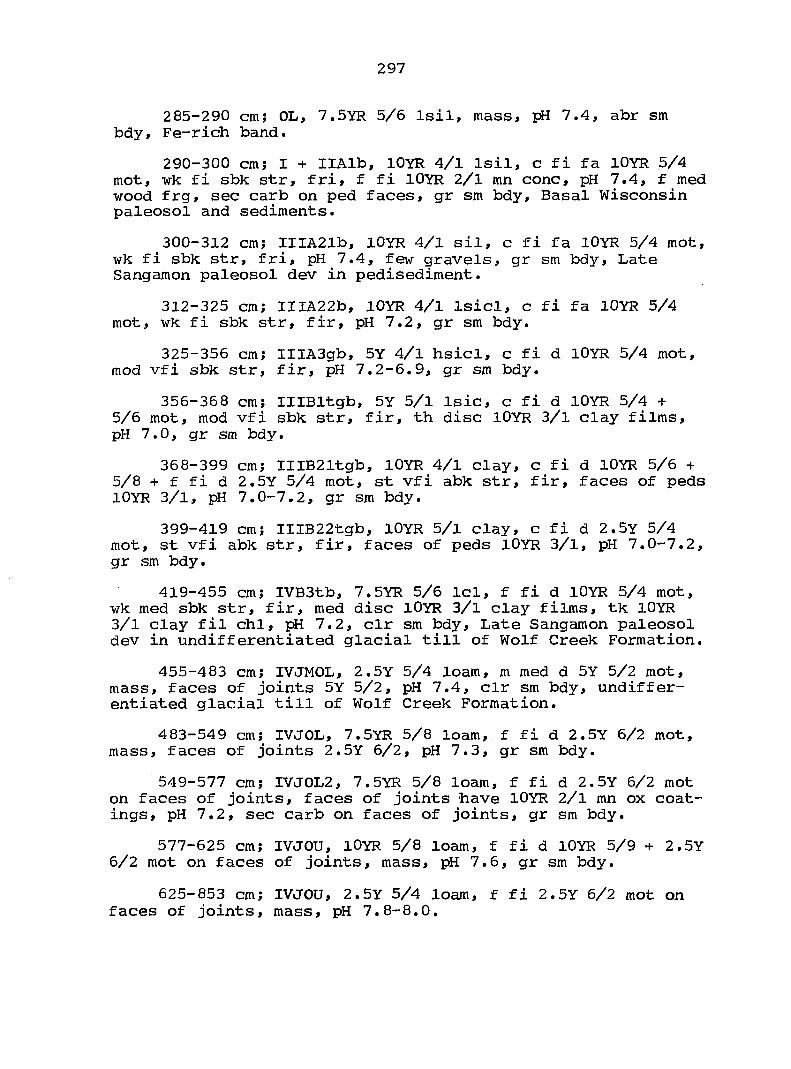
297
285-290 cm; OL, 7.5YR 5/6 Isil, mass, pH 7.4, abr sm bdy, Fe-rich band.
290-300 cm; I + IIAlb, lOYR 4/1 Isil, c fi fa lOYR 5/4 mot, wk fi sbk str, fri, f fi lOYR 2/1 mn conc, pH 7.4, f med wood frg, sec carb on ped faces, gr sm bdy. Basal Wisconsin paleosol and sediments.
300-312 cm; IIIA21b, lOYR 4/1 sil, c fi fa lOYR 5/4 mot, wk fi sbk str, fri, pH 7.4, few gravels, gr sm bdy. Late Sangamon paleosol dev in pedisediment.
312-325 cm; IIIA22b, lOYR 4/1 Isicl, c fi fa lOYR 5/4 mot, wk fi sbk str, fir, pH 7.2, gr sm bdy.
325-356 cm; IIIA3gb, 5Y 4/1 hsicl, c fi d lOYR 5/4 mot, mod Vfi sbk str, fir, pH 7.2-6.9, gr sm bdy.
356-368 cm; IIIBltgb, 5Y 5/1 Isic, c fi d lOYR 5/4 + 5/6 mot, mod vfi sbk str, fir, th disc lOYR 3/1 clay films, pH 7.0, gr sm bdy.
358-399 cm; IIIB21tgb, lOYR 4/1 clay, c fi d lOYR 5/6 + 5/8 + f fi d 2.5Y 5/4 mot, st vfi abk str, fir, faces of peds lOYR 3/1, pH 7.0-7.2, gr sm bdy.
399-419 cm; IIIB22tgb, lOYR 5/1 clay, c fi d 2.5Y 5/4 mot, st vfi abk str, fir, faces of peds lOYR 3/1, pH 7.0-7.2, gr sm bdy.
419-455 cm; IVB3tb, 7.5YR 5/6 Id, f fi d lOYR 5/4 mot, wk med sbk str, fir, med disc lOYR 3/1 clay films, tk lOYR 3/1 clay fil chl, pH 7.2, clr sm bdy. Late Sangamon paleosol dev in undifferentiated glacial till of Wolf Creek Formation.
455-483 cm; IVJMOL, 2.5Y 5/4 loam, m med d 5Y 5/2 mot, mass, faces of joints 5Y 5/2, pH 7.4, clr sm bdy, undifferentiated glacial till of Wolf Creek Formation.
483-549 cm; IVJOL, 7.5YR 5/8 loam, f fi d 2.5Y 6/2 mot, mass, faces of joints 2.5Y 6/2, pH 7.3, gr sm bdy.
549-577 cm; IVJ0L2, 7.5YR 5/8 loam, f fi d 2.5Y 6/2 mot on faces of joints, faces of joints have lOYR 2/1 mn ox coatings, pH 7.2, sec carb on faces of joints, gr sm bdy.
577-625 cm; IVJOU, lOYR 5/8 loam, f fi d lOYR 5/9 + 2.5Y 6/2 mot on faces of joints, mass, pH 7.6, gr sm bdy.
625-853 cm; IVJOU, 2.5Y 5/4 loam, f fi 2.5Y 6/2 mot on faces of joints, mass, pH 7.8-8.0.

298
Core: 58BEN4 Location: 3 m S and 12 m E of field land
intersection in NE% SE% Sec 27 Slope: 1% concave Elevation; 219 m Landscape position: summit of divide Solum: Collected by: S. Esling and J. Nott Described by: T. Bicki and G. Hallberg
0-125 cm; solum dev in loess.
125-152 cm; MDL, 5Y 6/2 Isicl, m med p lOYR 5/6 mot, mass, f 7.5YR 3/2 mn ox, f fi + vfi root chl, pH 7.1, gr sm bdy, loess.
152-323 cm; MDL, 2.5Y 6/2 sil, m med d lOYR 5/6 +5.8 mot, c med p 7.5YR 5/8 Fe conc (pipestems), mass, c med + co 7,5YR 3/2 mn conc, pH 7.1, abr sm bdy.
323-325 cm; Alb, lOYR 4/2 hsil, f fi d 2.5Y 4/4 mot, mass, f fi lOYR 2/1 mn conc, pH 6.9, f wood frg, abr sm bdy. Basal Wisconsin paleosol.
325-368 cm; IIA21gb, lOYR 5/1 hsicl, c med d 2.5Y 5/4 c med fa lOYR 5/6 and f fi fa 7.5YR 5/8 mot, wk vfi sbk str, fir, pH 6.9, gr sm bdy, Yarmouth-Sangamon paleosol dev in swale-fill sediments.
368-414 cm; IIA22gb, lOYR 5/1 Isic, c med f lOYR 4/4 mot, mod fi sbk mod vfi abk str, fir, th cont lOYR 7/1 (dry) cts on peds, f fi lOYR 2/1 mn conc, pH 6.9, gr sm bdy.
414-447 cm; IIBlgb, lOYR 5/1 Isic, f fi fa lOYR 4/4 mot, mod vfi abk str, vfir, th cont lOYR 7/1 (dry) cts on peds, pH 6.8, clr sm bdy.
447-467 cm; IIB2lgb, lOYR 5/1 Isic, c med d 7.5YR 5/8 and c med fa lOYR 4/4 mot, mod fi abk st vfi abk str, vfir, th cont lOYR 7/1 (dry) cts on peds, pH 6.8, gr sm bdy.
467-526 cm; IIB22gb, 5Y 5/1 Isic, mod fi abk st vfi abk str, vfir, f th pa lOYR 7/1 (dry) cts on peds, pH 6.8, gr sm bdy.
526-559 cm; IIB23gb, 5Y 5/1 Isic, c med p 7.5YR 5/8 mot, wk fi sbk str, vfir, tk cont lOYR 7/1 (dry) cts on peds, pH 6.9, gr sm bdy.
and gravel road T75N R5W

299
559-635 cm; IIB24gb, 5Y 4/1 Isic, f fi p 5YR 4/6 Fe seg (pipestems), wk fi sbk str, vfir, f 5Y 3/1 streaks, f fi lOYR 2/1 mn conc, pH 6.6-6.7, gr sm bdy.
635-709 cm; IIB31gb, 5Y 5/1 Isicl, c fi p 7.5YR 5/8 mot, mod fi abk st vfi abk str, vfir, pH 6.7-6.9, gr sm bdy.
709-780 cm; IIB32gb, 5Y 5/1 hsicl, f fi p 7.5YR 5/6 + lOYR 5/6 mot, wk vfi sbk str, vfir, c lOYR 2/1 + 7.5YR 3/2 mn conc, pH 7.0, gr sm bdy.
780-83 8 cm; IIB33gb, 2.5Y 5/2 hsicl, c med d lOYR 4/6 mot, wk fi sbk str, vfir, f fi lOYR 2/1 mn conc, pH 7.0, gr sm bdy.
838-853 cm; IlCg, 2.5Y 5/2 hsicl, m med d lOYR 5/6 mot, mass, pH 7.0.
Core; 58NE65 Location: First power pole west of pipeline on farm lane in
NE% SW% Sec 27 T75N R5W Slope: 2% concave Elevation: 223 m Landscape position; summit of primary divide Solum : Sampled by: J. Nott and S. Esling Described by: T. Bicki
0-163 cm; solum dev in loess
163-279 cm; MDL, 2.5Y 6/2 sil, c fi d lOYR 5/6 mot, c fi + vfi p 7.5YR 5/8 Fe conc (pipestems), mass, c 7.5YR 3/2 mn conc, f fi + vfi root chl, tk N 2/0 clay-filled krotovina at 188 to 196 cm, clr sm bdy.
279-292 cm; OL, lOYR 5/8 Isil, f fi d 2.5Y 6/2 mot, mass, clr sm bdy, Fe-rich band.
292-318 cm; I + IIAb, lOYR 5/4 sil, c fi lOYR 5/1 and f fi lOYR 5/6 mot, wk fi skb str, fri, th clay fil in pores, f 7.5YR 3/2 mn ox, c fi + vfi rt chl, c wood frg, gr sm bdy. Basal Wisconsin paleosol and sediments.
318-358 cm; I + IIC, lOYR 5/4 sil, c fi lOYR 5/1 and f fi lOYR 5/6 mot, mass, f fi 7.5YR 3/2 mn ox.

300
358-381 cm; IIIAlb, lOYR 4/2 Isicl, f fi 2.5Y 5/4 mot, wk fi sbk str, fir, gr sm bdy, Yarmouth-Sangamon paleosol dev in till-derived sediments.
381-394 cm; IIIBltb, 2.5Y 4/2 sicl, c fi fa 2.5YR 4/4 + f fi p 5YR 5/6 mot, st fi abk str, vfir, th cont clay films, gr sm bdy.
394-412 cm; IIIB21tb, same as above except Isic texture.
412-434 cm; IIIB22tgb, 5Y 4/1 Isic, c fi lOYR 4/4 mot, f fi d 2.5Y 4/2 and f fi p 5YR 4/4 mot, st med abk str, vfir, tk cont clay films, gr sm bdy.
434-460 cm; IIIB23tgb, 5Y 4/1 Isic, c fi p 5YR 4/6 and f fi lOYR 4/4 mot, st med prism mod med abk str, vfir, tk disc clay films on peds, clr sm bdy.
460-480 cm; IVB24tb, lOYR 4/3 hcl, c fi fa lOYR 5/6 and 5/1 mot, mod med prism -* mod med sbk, vfir, gr sm bdy, Yarmouth-Sangamon paleosol dev in undifferentiated till of Wolf Creek Formation.
480-508 cm; IVB25b, lOYR 4/6 cl, c fi d lOYR 5/1 + 5/2 mot, f fi p 5YR 4/6 mot, mod med prism -* mod med abk str, vfir, tk N 2/0 mn cts on pris faces, gr sm bdy.
508-539 cm; IVB31b, same as above except clr sm bdy.
539-572 cm; IVB32b, lOYR 5/4 hi, c fi fa lOYR 4/6 mot, f fi d 5YR 4/6 and f fi fa lOYR 5/8 mot, mod med prism mod fi and med sbk str, fir, f mn conc, clr sm bdy.
572-599 cm; IVB33b, 7.5YR 5/6 Id, f fi + med lOYR 5/2 mot, mod med prism mod med + fi abk str, fir, clr sm bdy.
599-660 cm; IVB34b, lOYR 5/3 Icl, c fi + med fa 5/6 + 5/8 mot, mod med prism -» mod med sbk str, vfir, mv tk N 2/0 mn cts on pris faces, gr sm bdy.
660-701+ cm; IVB35b, lOYR 5/4 Icl, m fi + med fa lOYR 5/6 + 5/8 mot, wk med prism str, vfir, m vtk N 2/0 mn cts on pris faces, gr sm bdy.
1006-1036 cm; IVOU, lOYR 5/4 loam, f fi fa lOYR 5/6 mot, undifferentiated till of Wolf Creek Formation.

301
Transectt West Liberty III Core: 52BE14 Location: 31 m N and 31 m W of corn crib in SW^ SW^ Sec 18
T78N R5W Slope: 1% Elevation: 204 m Landscape position: high terrace Solum: Muscatine Isicl Sampled by: T. Bicki and S. Esling Described by; T. Bicki
0-23 cm; Ap, lOYR 2/1 Isicl, mod fi gran str, fri, pH 6.7, clr sm bdy, loess.
23-31 cm; A12, same as above except pH 6.6.
31-51 cm; A3, lOYR 3/2 Isicl, wk med sbk -» mod fi sbk str, fri, pH 6.4, gr sm bdy.
51-61 cm; Bl, lOYR 4/3 Isicl, ped ext lOYR 4/2, wk med sbk -+ mod fi sbk str, fri, pH 5.7, gr sm bdy.
61-74 cm; B21, same as above except pH 5.4.
74-79 cm; B22t, lOYR 4/3 sicl, f fi fa lOYR 5/6 mot, mod fi and med sbk str, fri, th disc lOYR 3/3 clay films, pH 5.4, gr sm bdy.
79-89 cm; B23t, lOYR 4/2 sicl, f fi d 2.5Y 5/2 mot, wk co prism -* wk med and co sbk str, fri, th disc lOYR 3/3 clay films, pH 5.4, f fi lOYR 2/1 mn ox, gr sm bdy.
89-104 cm; B24t, mix lOYR 5/6 and 2.5Y 5/2 sicl, wk co prism -» wk co sbk str, fri, th disc lOYR 4/3 clay films, pH 5.6, f fi lOYR 2/1 mn ox, gr sm bdy.
104-117 cm; mix 2.5Y 5/2 and lOYR 5/4 Isicl, wk co prism wk CO sbk str, fri, th disc lOYR 4/3 clay films, pH 5.6,
f fi lOYR 2/1 mn ox, gr sm bdy.
117-135 cm; B32t, same as above except pH 5.7.
135-152 cm; B33, mix 2.5Y 5/2 and lOYR 5/4 hsil, wk co prism -+ wk co sbk str, fri, pH 5.7, gr sm bdy.
152-168 cm; CI, 2.5Y 5/2 sil, m fi and med d lOYR 5/4 mot, mass, pH 5.6, clr sm bdy.
168-183 cm; IIC2, lOYR 5/6 Is, single grain, loose, pH 5.6.

302
Core: 52B220 Location: 46 m N and 27 m W of SE corner of SW% SE% Sec 7
T78N R5W Slope: 1% concave Elevation: 205 m Landscape position: high terrace Solxom: Garwin sicl Sampled by: T. Bicki Described by: T. Bicki
0-20 cm; Ap, N 2/0 sicl, mod fi and med gran str, fri, c fi lOYR 2/1 mn conc, pH 6.7, clr sm bdy, loess.
20-31 cm; A12, lOYR 2/1 hsicl, med fi and med gran str, fri, c fi lOYR 2/1 mn conc, pH 6.7, gr sm bdy.
31-43 cm; A3, lOYR 3/1 hsicl, same as above.
43-56 cm; Big, lOYR 4/1 hsicl, med fi and vfi sbk str, fri, c fi lOYR 2/1 mn conc, pH 6.9, gr sm bdy.
56-71 cm; B21g, lOYR 4/1 sicl, f fi fa lOYR 5/6 and 5/4 mot, mod med sbk str, fri, c fi lOYR 2/1 mn conc, pH 6.9, gr sm bdy.
71-86 cm; B22g, 5Y 5/2 Isicl, c fi d lOYR 5/6 mot, ped ext lOYR 4/1 mod med prism -* mod med sbk str, fri, c fi lOYR 2/1 mn conc, c fi and vfi rt chl, pH 7.0, gr sm bdy.
86-102 cm; B31g, same as above except hsil texture and c fi and med d lOYR 5/6 mot.
102-122 cm; B32g, same as above.
122-142 cm; B33g, 5Y 5/2 hsil, m med and co d lOYR 5/6 mot, wk CO prism str, fri, f med 5Y 4/1 krot fil, c lOYR 2/1 mn ox stn on pris, c med lOYR 2/1 mn conc, c fi and vfi rt chl, pH 7.1, gr sm bdy.
142-158 cm; B34g, 5Y 5/2 sil, m med and co 7.5YR 5/8 mot, wk CO prism str, fri, c lOYR 2/1 mn ox stn on pris, c med lOYR 2/1 mn conc, f fi and vfi rt chl, pH 7.0, abr sm bdy.
158-183 cm; IIC, 2.5Y 6/2 Is, single grain, loose, pH 6.9, sand.

303
Core; 52B219 Location: 265 m N and 27 m W of SE corner SW% SE^ Sec 7
T78N R5W Slope: 2% Elevation: 207 m Landscape position: high terrace Solum: Muscatine Isicl Sampled by: T. Bicki Described by; T. Bicki
0-23 cm; Ap» lOYR 2/1 Isicl, clod mod fi and med gran str, fri, pH 6,7-6.6, clr sm bdy, loess.
23-31 cm; A12, lOYR 2/1 Isicl, mod fi and vfi gran str, fri, pH 6.5, gr sm bdy.
31-43 cm; A13, lOYR 2/1 Isicl, mod fi and vfi gran str, fri, pH 5.5, gr sm bdy.
43-56 cm; Bl, lOYR 3/2 Isicl, mod fi and vfi gran str, fri, pH 5.3, gr sm bdy.
56-66 cm; B21t, lOYR 4/2 Isicl, ped ext lOYR 3/2, mod fi and vfi sbk str, fri, vth disc lOYR 3/2 clay films, pH 5.3, gr sm bdy.
66-81 cm; B22t, lOYR 4/2 sicl, mod med and fi sbk str, fri, th disc lOYR 3/2 clay films, pH 5.3, gr sm bdy.
81-97; B23t, lOYR 4/2 sicl, f fi fa lOYR 5/6 mot, mod med prism -» mod med and fi sbk str, fri, vth disc lOYR 3/3 clay films on peds, f fi lOYR 2/1 mn ox, pH 5.4, gr sm bdy.
97-117 cm; B31t, 2.5Y 5/2 Isicl, c fi d lOYR 5/6 mot, pris ext 2.5Y 6/2, mod med prism mod med and fi abk str, fri, c fi and med lOYR 2/1 mn ox, pH 5.5, gr sm bdy.
117-137 cm; B32, 2.5Y 5/2 hsil, c fi d lOYR 5/6 mot, wk CO prism str, fri, f th lOYR 4/2 chl fil, c fi lOYR 2/1 and 7.5YR 3/2 mn ox, c fi and med rt chl, pH 5.6, gr sm bdy.
137-158 cm; B33, same as above except sil texture and pH 5.7.
158-183 cm; IIB34, 2.5Y 5/2 loam-lsil, c med d lOYR 5/6 mot, wk CO prism str, fri, m lOYR 4/2 chl fil, c med 7.5YR 3/2 mn ox, pH 5.7.
183-213 cm; IIC, lOYR 5/6 si, f fi fa lOYR 5/4 and 5/3 mot, single grain, loose, pH 5.7, sand.

304
Corel 52B212 Location: 159 m N and 31 m E of SW corner Sec 8 T78n R5W Slope: 1% concave Elevation: 207 m Landscape position: high terrace Solum: Muscatine sicl Sampled by: T. Bicki Described by: T. Bicki
0-23 cm; Ap, lOYR 2/1 hsil, clod -+ mod med and fi gran str, fri, pH 7.8-7.0, clr sm bdy, loess.
23-31 cm; A12, same as above except pH 6,8 and gr sm bdy.
31-41 cm; A3, same as above except pH 6.5,
41-53 cm; Bl, lOYR 3/2 sicl, ped ext lOYR 3/1, mod fi and vfi sbk -* mod fi and med gran str, fri, f fi and vfi rt chl, pH 5,8, gr sm bdy,
53-69 cm; B21t, lOYR 4/2 sicl, ped ext lOYR 3/1, mod fi and vfi sbk str, fri, th disc lOYR 3/2 clay films, f fi and vfi rt chl, pH 5,4, gr sm bdy,
69-84 cm; B22t, lOYR 4/2 sicl, f fi fa lOYR 5/6 mot, mod med and fi sbk str, fri, th disc lOYR 3/2 clay films, c lOYR 3/2 chl fil, f fi lOYR 2/1 mn ox, f fi rt chl, pH 5.4, gr sm bdy.
84-102 cm; B23t, 2.5Y 5/2 Isicl, c fi p lOYR 5/6 mot, mod prism -* mod med and fi sbk str, fri, vth pa lOYR 4/2 clay films on pris, f fi lOYR 2/1 mn ox, f fi rt chl, pH 5.4-5.6, gr sm bdy.
102-119 cm; B31, 2.5Y 5/2 sil, c fi p lOYR 5/6 and f fi fa 2.5Y 5/4 mot, mod med prism -» wk med and fi sbk str, fri, c fi lOYR 2/1 mn ox, f fi rt chl, pH 5.6-5.8, gr sm bdy.
119-137 cm; I and IIB32 same as above except wk med prism str, pH 5.9, clr sm bdy, loess with high sand content.
137-158 cm; IICl, lOYR 6/6 Is, f fi fa lOYR 5/6 and 5/3 mot, mass, fri, pH 5.8, clr sm bdy, sand.
158-183 cm; IIC2, lOYR 6/6, single grain, loose, pH 5.7.

305-306
Core: 52B209 Location; 21 m S of blacktop road and 90 m W of field lane
in NW% NEh Sec 19 T78N R5W Slope: 1% concave Elevation: 201 m Landscape position: high terrace Solum: Sperry Sampled by; T. Bicki Described by: T. Bicki
0-18 cm; Ap, lOYR 2/1 Isicl, mod fi and med gran str, fri, pH 7.2, clr sm bdy, loess.
18-31 cm; A21, lOYR 2/1 hsil, mod mi and med gran str, fri, pH 7.1, gr sm bdy.
31-41 cm; A22, lOYR 4/1 Isicl, mod fi and vfi sbk mod fi and mod gran str, fri, pH 7.0, gr sm bdy.
41-56 cm; B21tg, lOYR 4/1 Isic, f fi lOYR 5/4 mot, mod fi and vfi sbk str, fir, tk ncont clay films, f lOYR 2/1 mn conc, pH 6.7-6.5, gr sm bdy.
56-69 cm; B22tg, 5Y 4/1 Isic, ped ext 5Y 3/1, c fi d lOYR 5/4 and f fi d lOYR 5/6 mot, mod med prism -+ st med abk str, fir, tk cont clay films, c fi lOYR 4/6 Fe ox, c fi lOYR 4/6 Fe conc, f fi rt chl, pH 6.3-6.2, gr sm bdy.
69-81 cm; B23tg, 2.5Y 5/2 sicl, c fi d lOYR 5/4 and 5/6 mot, mod med prism -+ mod fi and med abk str, fir, tk cont 5Y 3/1 clay films on pris, c fi lOYR 4/6 Fe conc, c fi lOYR 2/1 mn conc, c fi rt chl, pH 6.2-6.3, gr sm bdy.
81-102 cm; B31tg, 2.5Y 5/2 sicl, m med and co d lOYR 5/6 mot, mod med prism -» wk med abk str, fir, th disc 5Y 3/1 clay films on pris, f fi lOYR 2/1 mn conc, c 5Y 3/1 chl fil, c fi and vfi rt chl, pH 6.3-6.4, gr sm bdy.
102-119 cm; B32g, 2.5Y 5/2 hsil, c med d lOYR 5/6 mot, wk med prism -* wk co abk str, fri, c fi lOYR 5/6 Fe conc and c fi lOYR 2/1 mn conc, c th 5Y 3/1 chl fil, c fi and vfi rt chl, pH 6.5-6.6, gr sm bdy.
119-137 cm; B33g, 2.5Y 5/2 sil, f fi lOYR 5/6 mot, wk co prism str, fri, tk lOYR 4/1 chl fil, c fi lOYR 5/6 Fe conc, f fi rt chl, pH 6.7, abr sm bdy.
137-173 cm; IICl, lOYR 6/4 sandy loam, c fi lOYR 4/6 mot. single grain, loose, pH 6.5, clr sm bdy, sand.
173-203 cm; IIC2, lOYR 6/4 sand, f fi lOYR 4/6 mot, single grain, loose, pH 6.5.

307
APPENDIX B. LABORATORY DATA
Appendix B consists of physical and chemical laboratory
data determined on sample horizons from stratigraphie cores
and selected soil profiles.
Abbreviations used in data headings are:
AP - available phosphorus. Bray 1
C-Silt - coarse silt
F-Silt - fine silt
TC - total carbon
TP - total phosphorus
cm - centimeters
ppm - parts per million

308
Riverside transect. Core 92BE105
Depth Sand C-Silt F-Silt Clay pH TC TP AP
(cm) % % % % % ppm ppm
99-112 3.1 31.9 33.5 31.5 5.0 112-122 20.6 31.9 25.4 22.1 5.0 122-140 - 67.6 11.1 7.2 14.1 5.0 140-160 84.2 6.7 2.2 6.9 5.3 160-175 87.8 3.7 1.6 6.9 5.3 193-208 90.2 2.0 1.5 6.3 5.2 224-239 92.3 1.4 1.8 4.5 5.3 254-269 91.9 2;0 2.4 3.7 5.4 285-300 91.9 2.9 1.0 4.2 5.4 320-335 91.4 3.6 0.8 4.1 5.4 434-442 32.8 38.6 14.2 14.4 6.0 442-460 11.7 38.1 31.9 18.3 6.9 460-472 9.8 41.7 30.8 17.7 7.3 472-488 6.1 42.8 34.2 16.9 7.3 488-503 4.1 41.8 34.5 19.6 7.3 503-518 4.0 40.2 36.2 19.6 7.4 518-533 3.8 29.9 46.5 19.8 7.3 533-549 1.2 27.8 52.0 19.0 7.3 549-564 1.6 22.4 56.1 19.9 7.2 564-579 2.6 25.3 50.4 21.7 7.2 579-594 5.5 20.0 49.1 25.4 7.0 594-620 7.2 22.6 41.5 28.7 6.9 620-655 2.9 10.1 17.9 69.1 6.8 655-691 5.3 13.1 26.0 55.6 6.6 691-716 9,6 15.9 31.8 42.7 6.6
Riverside transect. Core 92BE104
0- 10 4.3 31.6 43.3 20.8 6.5 1. 55 503 43.1 10- 23 3.6 31.9 43.2 21.3 6.2 1. 41 390 12.3 23- 36 3.5 23.8 45.8 26.9 5.6 0. 59 344 9.3 36- 43 1.9 24.2 45.3 28.6 5.2 0. 42 315 7.0 43- 51 2.3 18.3 46.0 33.4 5.2 0. 29 297 5.3 51- 61 1.8 13.6 48.7 35.9 5.2 0. 12 308 4.7 61- 69 1.9 16.4 44.7 37.0 5.1 332 7.2 69- 76 3.1 16.0 42.7 38.2 5.2 368 9.1 76- 86 2.8 21.4 37.4 38.4 5.1 433 13.2 86- 97 1.7 27.0 34.1 37.2 5.1 464 20.7 97-107 2.4 24.6 37.8 35.2 5.2 481 21.1 107-117 2.4 28.5 35.9 33.2 5.1 502 29.2 117-127 2.2 32.3 33.5 32.0 5.1 509 32.0 127-137 2.1 30.5 35.7 31.7 5.2 524 37.1 137-147 2.1 31.5 36.4 30.0 5.2 668 36.5

309
Riverside transect , Core 92BE104
Depth Sand C-Silt F-Silt Clay pH TC TP AP
(cm) % % % % % ppm ppm
147-163 3.1 34.4 36.6 28.9 5.2 669 38.0 163-180 6.1 33.8 32.5 27.6 5.2 695 35.2 180-188 28.8 26.1 22.2 22.9 5.2 667 33.2 188-203 84.4 4.3 3.7 7.6 5.5 633 32.6 203-213 86.5 5.0 2.5 6.0 5.5 522 30.1 274-305 88.2 2.9 2.9 6.0 5.6 195 32.6 335-396 88.0 2.6 3.1 6.3 5.6 112 27.0
Riverside transect , Core 92BE103
163-178 5.5 32.0 36.3 26.2 5.3 178-193 10.9 36.6 28.0 24.5 5.3 193-201 87.8 2.4 2.1 7.7 5.7 274-305 82.2 4.6 3.7 9.5 5.7 305-366 15.7 37.8 27.7 18.8 5.7 366-457 91.5 2.7 0.3 5.6 6.2 457-488 7.3 31.1 41.9 19.7 7.1 503-579 9.7 33.1 37.7 19.5 6.9 579-610 18.0 19.6 42.1 20.3 6.9 610-630 33.5 16.1 28.2 22.2 6.8 630-645 26.0 6.8 10.2 57.0 6.5 645-660 41.3 10.6 11.2 36.9 6.6 660-681 45.8 14.6 12.2 27.4 6.5 681-701 48.4 11.0 13.1 27.5 6.8
Riverside transect. Core 92BE102
89-102 4.3 32.3 30.6 32.8 5.0 102-114 9.3 31.5 29.4 29.3 5.4 114-135 47.6 13.3 16.9 22.2 6.1 135-155 51.2 11.6 16.3 20.9 6.5 155-178 51.5 12.4 14.3 21.8 6.6 178-216 52.3 11.8 15.4 20.5 8.1 216-277 50.8 14.6 14.4 20.2 8.1

310
Riverside transect, Core 92BE26
Depth Sand C-Silt F-Silt Clay pH
(era) % % % %
147-224 4.2 38.6 30.9 26.3 5.9
224-335 89.0 4.9 2.9 3.2 5.8
335-396 10.6 30.1 49.0 10.3 5.8
396-518 93.7 3.3 1.8 1.2 5.8
518-732 88.3 5.4 3.5 2.8 5.8
732-752 17.5 25.7 36.9 19.9 4.0
752-767 4.0 25.1 48.6 22.3 3.5
767-782 3.0 23.7 49.1 24.3 3.2
782-859 4.2 31.9 32.4 31.5 3.9
859-884 7.1 15.0 38.7 39.2 3.9
884-960 95.3 1.2 1.6 1.9 4.6
960-1280 95.4 0.5 1.7 2.4 4.5
Riverside transect, Core 92BE115
104-119 35.9 26.4 17.4 20.3 5.1
119-140 16.8 39.3 23.5 20.4 5.5
140-160 22.0 35.8 22.7 19.5 5.6
160-178 25.8 35.3 25.7 13.2 5.6
178-191 27.7 29.7 21.7 20.9 5.5
191-203 48.9 19.2 14.4 17.5 5.6
203-224 50.2 21.8 12.5 15.5 5.3
224-264 92.2 1.5 2.8 3.5 5.7
264-305 93.0 1.5 2.7 2.8 5.7
Riverside transect , Core 92BE28
239-262 3.4 47.3 28.2 21.1 5.6
262-305 5.4 46.2 28.8 19.6 5.9 366-445 91.3 4.6 2.0 2.1 6.0
445-549 92.1 5.0 1.1 1.8 6.1
549-686 93.3 3.7 1.1 1.9 6.3
686-701 71.4 9.4 10.0 9.2 6.4 701-732 94.2 3.0 1.4 1.4 6.6
732-853 94.2 3.3 1.2 1.3 6.6 853-970 94.8 3.8 1.0 1.2 6.6 970-1006 96.0 2.4 1.0 0.6 6.7 1057-1138 93.7 2.3 1.6 2.4 6.8 1138-1158 18.0 15.6 30.3 36.1 7.1 1158-1252 4.0 7.5 36.7 51.8 7.2 1252-1267 13.8 14.2 37.6 34.4 7.1 1267-1280 27.3 14.5 29.9 28.3 7.5 1280-1311 4.8 14.1 46.5 34.6 7.5

311
Riverside transect. Core 92BE112
Depth Sand C-Silt F-Silt Clay pH TC TP ÂP
(cm) % % % % % ppm ppm
0-10 2.8 33.2 42.3 21.7 6.4 1.23 442 35.8 10-23 3.7 32.2 42.0 22.1 6.6 1.03 407 29.9 23-33 2.0 27.0 42.1 28.9 6.1 0.47 398 23.1 33-46 2.6 24.4 37.1 35.9 5.0 0.34 419 17.2 46-53 2.2 25.0 34.2 38.6 4.9 0.25 441 24.2 53-66 1.3 21.8 37.9 39.0 5.1 0.11 471 29.3 66-76 1.5 25.1 36.6 36.8 5.1 518 30.8 76-89 1.5 24.8 37.5 36.2 5.2 565 38.9 89-102 1.5 28.3 36.0 34.2 5.3 624 40.6 102-112 3.2 29.5 34.7 32.6 5.3 630 40.9 112-124 2.1 31.1 34.8 32.0 5.4 644 35.6 124-137 2.1 24.0 41.9 32.0 5.4 647 30.8 137-150 2.0 25.5 42.7 29.8 5.5 - 660 26.4 150-163 2.4 44.4 24.7 28.5 5.5 640 23.2 163-175 1.9 40.2 29.2 28.7 5.7 634 21.1 175-185 2.3 38.3 32.7 26.7 5.7 629 23.1 185-246 5.5 30.2 42.1 22.2 5.8 246-269 3.8 33.0 42.2 21.0 5.9 274-305 5.1 48.1 34.1 20.7 6.3 305-330 2.9 47.5 29.1 20.5 6.3 330-396 2.8 37.2 39.1 20.9 6.8 396-437 4.9 24.5 49.5 21.1 7.0 437-462 4.9 24.7 49.6 20.8 7.1 462-483 21.3 17.1 35.9 25.7 7.2 483-490 16.3 11.2 11.7 60.8 7.2 490-508 16.0 8.7 12.2 63.1 7.3 508-526 33.1 7.7 11.3 47.9 7.3 526-544 30.7 10.2 10.9 48.2 7.3 544-579 47.0 8.9 12.7 31.4 7.4

312
Riverside transect. Core 92B111
Depth Sand C-Silt F-Silt Clay pH TC TP AP
(cm) % % % % % ppm ppm
0-13 3.6 33.6 42.2 20.6 6.8 2.21 651 79.1
13-25 3.2 37.5 38.1 21.2 6.8 1.03 614 68.8 25-36 2.0 34.7 37.9 25.4 6.6 0.59 402 16.2
36-43 2.0 37.9 32.8 27.3 6.6 0.38 355 15.1 43-53 1.5 25.9 41.5 31.1 6.5 0.23 380 13.6
53-61 2.4 24.4 39.4 33.8 6.4 0.15 405 17.7 61-71 2.1 24.4 36.2 37.3 6.2 427 21.9 71-81 2.1 24.1 36.1 37.7 6.1 446 34.0 81-91 2.3 28.0 34.1 35.6 5.9 519 48.6 91-102 1.2 28.0 35.4 35.4 5.5 550 55.1 102-110 2.5 27.4 35.7 34.4 5.4 560 58.7 110-117 1.7 28.4 36.4 33.5 5.4 561 58.7 117-127 2.1 29.2 36.0 32.7 5.4 580 50.2 127-137 1.7 30.0 36.0 32.3 5.3 591 47.8
137-147 1.5 31.4 36.5 30.6 5.3 599 39.8 147-158 2.1 33.1 34.1 30.7 5.3 614 34.4
158-170 2.7 32.7 35.5 29.1 5.3 630 27.7 170-185 3.1 32.5 36.0 28.4 5.3 643 24.7 185-198 2.3 31.6 38.7 27.4 5.4 629 25.9
198-213 2.8 36.1 35.8 25.3 5.4 623 23.4
213-229 2.3 39.2 34.9 23.6 5.5 605 19.5
229-241 2.8 36.6 36.0 24.6 5.5 595 241-267 3.0 37.6 35.4 24.0 5.5 551
267-305 5.6 305-330 71.6 11.6 6.1 10.7 5.7 330-488 85.4 4.1 3.0 7.5 5.7

313
Hills transect, Core 52B115
Depth
(cm)
Sand
%
C-Sllt
%
F-Sllt
%
Clay
%
PH TC
7o
TP
ppm
AP
ppm
137-152 4.0 36.3 34.1 25.6 6.0 152-323 4.1 36.2 35.5 24.2 6.3 323-333 34.0 32.6 17.9 15.5 6.5 333-356 8.9 45.7 30.3 15.1 7.1 381-401 32.0 39.2 15.4 13.4 7.3 422-452 22.0 39.1 24.3 14.6 7.6 488-508 13.8 42.9 27.2 16.1 7.6 559-577 13.9 19.8 46.7 19.6 7.4 577-597 30.7 18.1 34.1 17.1 7.3 597-617 35.8 18.4 28.6 17.2 7.2 617-640 32.4 20.2 26.5 20.9 7.1 640-660 33.3 16.2 19.8 30.7 7.1 660-671 44.5 12.Q 14.5 29.0 7.1 671-686 33.5 11.6 12.2 42.7 7.5 686-701 34.2 14.7 7.8 43.3 7.5
Hills transect. Core 52B116
0-10 5.0 33.4 33.5 28.1 6.8 2 .40 583 43.4 10-18 4.0 32.1 34.9 29.0 6.8 2 .32 578 42.7 18-28 3.7 32.3 34.5 29.5 6.8 2 .01 499 41.9 28-41 1.4 29.9 37.0 31.7 6.6 1 .93 413 10.0 41-48 2.2 30.1 35.8 31.9 6.3 1 .66 362 6.1 48-58 1.7 30.1 35.4 32.8 6.0 0 .84 340 7.2 58-66 1.2 30.8 34.4 33.6 5.7 0 .21 344 13.2 66-74 1.4 32.1 33.9 32.6 5.9 361 18.8 74-81 1.6 33.7 33.2 31.5 5.9 379 28.7 81-89 1.5 35.4 32.7 30.4 5.9 420 36.2 89-102 1.4 35.4 33.8 29.4 6.0 474 32.8 102-109 1.3 34.7 35.4 28.6 6.0 498 30.9 109-119 1.8 34.1 34.6 29.5 6.1 532 28.7 119-130 3.1 34.4 33.2 29.3 6.1 547 27.7 130-140 2.2 34.8 36.3 26.7 6.1 649 26.2 140-150 2.5 31.6 39.1 26.8 6.2 659 23.8 150-160 3.9 37.3 34.3 24.5 6.2 667 19.8 160-173 4.4 40.5 32.8 22.3 6.2 658 19.1 173-213 3.7 38.0 38.9 19.4 6.2 657 16.9 213-254 28.4 33.7 21.2 16.7 6.1 450 16.9 254-279 82.1 3.7 8.0 6.2 5.9 210 335-376 24.1 36.1 22.0 17.8 5.8 376-391 76.7 10.9 5.5 6.9 6.0 391-417 23.6 36.8 23.8 15.6 6.8 455-480 26.7 31.5 27.6 14.2 6.9

314
Hills transect. Core 52B116
Depth Sand C-Silt F-Silt Clay pH TC TP ÀP
(cm) % % % % % ppm ppm
554-556 73.9 13.3 5.6 7.2 7.6 556-572 3.8 37.6 40.9 17.7 7.7 572-587 5.5 29.9 49.2 15.4 7.6 587-610 5.4 32.9 45.2 16.5 7.4 610-635 6.1 35,7 40.1 18.1 7.4 635-660 5.8 36.6 38.9 18.7 7.5 660-686 4.7 36.2 40.2 18.9 7.5 686-709 7.4 20.9 43.5 28.2 7.5 709-732 8.2 11.4 45.8 34.6 7.5
Hills transect. Core 52B207
0-10 2.8 35.1 34.3 27.8 5.7 1.83 490 16.0 10-20 2.2 35.2 34.7 27.9 5.5 1.61 482 15.5 20-31 2.2 33.3 35.3 29.2 5.2 1.46 471 7.9 31-38 1.3 33.1 35.1 30.5 5.2 1.13 444 7.8 38-46 1.6 33.4 34.4 30.6 5.3 0.94 441 7.2 46-51 2.2 32.3 34.1 32.4 5.3 0.53 434 6.8 51-58 1.7 30.5 33.6 34.2 5.4 0.44 377 4.5 58-66 1.7 30.4 32.7 35.2 5.5 0.18 405 7.8 66-74 1.8 32.0 32,1 34.1 5.5 424 17.4 74-84 2.3 34.5 29.7 33.5 5.5 468 27.8 84-91 3.4 33.0 31.2 32.4 5.7 523 33.9 91-102 2.6 32.9 32.7 31.8 5.7 595 37.7 102-112 3.0 33.8 32.3 30.9 5.8 629 39.2 112-122 2.5 36.1 31.2 30.2 5.8 670 36.2 122-132 3.7 37.1 30.7 28.5 5.8 686 32.5 132-142 4.9 35.4 31.0 28.7 5.8 692 32.5 142-152 3.4 35.4 32.7 28.5 5.8 680 30.9 152-165 4.3 38.9 30.1 26.7 5.8 679 27.9 165-175 4.6 37.1 31.9 26.4 5.9 690 26.0 175-188 5.2 38.2 31.2 25.4 5.8 703 24.2 188-203 3.8 35.6 36.4 24.2 5.7 709 24.5 203-282 6.0 41.1 28.3 24.6 5.7 690 22.6 282-292 33.1 32.5 18.6 15.8 5.9 683 15.9 292-320 36.9 29.1 18.1 15.9 5.9 634 16.0 320-396 70.8 15.3 5.6 8.3 6.3 277 11.1

315
Gladwyn transect, Core 58BE107
Depth Sand C-Sllt F-Sllt Clay PH TC TP AP
(cm) % % % % % ppm ppm
0-10 4.5 41.2 35.5 18.8 6.9 2.34 521 44.5 10-20 4.6 31.0 46.0 18.4 5.0 0.70 403 24.5 20-33 2.8 30.4 43.1 23.7 4.7 0.63 393 18.2 33-46 2.1 27.4 39.2 31.3 4.9 0.46 373 37.9 46-53 1.2 23.2 38.0 37.6 4.9 0.24 458 39.6 53-61 3.6 23.7 34.2 38.5 4.9 0.24 475 40.0 61-71 2. 1 24.8 33.9 39.2 5.0 0.20 574 41.1 71-81 2.4 26.2 34.5 36.9 5.0 665 45.5 81-94 2.2 28.1 35.6 34.1 5.2 510 57.0 '94-107 1.3 34.5 32.4 31.8 5.2 527 54.4 107-119 3.4 30.3 38.0 28.3 5.5 585 43.8 119-132 3.1 31.6 37.2 28.1 5.6 595 27.0 132-142 4.7 31.4 37.0 26.9 5.8 603 19.0 142-152 3.5 35.5 35.7 25.3 6.0 582 14.8 152-168 4.5 36.3 33.9 25.2 6. 1 537 13.7 168-183 5.6 40. 7 30.3 23.4 6.1 560 16.0 183-196 5.9 41.1 29.7 23.3 6.1 571 18.0 196-211 6.3 40. 3 31.0 22.4 6.2 583 13.5 211-231 4.7 43.0 30. 1 22.2 6.3 580 12.9 231-257 5.4 44.1 29.3 21.2 6.4 595 20. 7 257-285 4.9 48.6 28.1 18.4 6.8 501 18. 1 285-300 6.8 48.0 27.0 18.2 7.1 478 13.9 300-335 2.7 48.8 29.4 19.1 7.1 530 15.9 335-427 2.9 35.9 40. 7 20.5 6.9 623 14.6 427-429 1.4 19.0 56.0 23.6 6.8 1.64 759 22.4 429-437 2.1 15.8 47.6 34.5 6.7 1762 41.4 437-452 2.6 17.5 54.4 25.5 6.6 0.34 715 42.7 452-457 7.5 16.2 53.9 22.4 6.5 1.95 1246 107.3 457-465 4.4 21.2 63.2 11.2 6.7 0.40 374 104.0 465-475 2.5 15.8 42.7 39.0 6.7 1.64 206 71.5 475-488 2.8 15.1 36.5 45.6 6.6 0.55 159 30.2 488-506 7.8 15.6 34.4 42.2 6.7 0.29 155 20.5 506-523 8.3 15.0 36.0 40. 7 6.7 0.28 144 15. 3 523-541 8.4 15.2 37. 7 38.7 6. 7 0.21 125 13.4 541-559 10. 7 17.5 38.1 33. 7 6.7 0. 10 149 13.4 559-577 8.4 20.1 40. 3 31.2 6.6 0.07 175 13.8 577-592 20.9 23.6 29.3 26.2 6.7 0.09 210 13.2 592-607 97.4 1.2 1.0 0.4 6.4 607-615 40.6 20.9 20.3 18.2 6.2 615-627 93.9 3.2 0.8 2.1 6.1 627-633 93.9 0.3 1.4 4.3 6.1 633-653 99.0 0.4 0.5 0.1 6.0 653-704 99.1 0.3 0.2 0.4 6.0 704-734 95.7 1.3 1.4 1.6 6.0 734-826 94.3 1.7 1.4 2.6 5.9

316
Gladwyn transect. Core 58BE107
Depth Sand C-Silt F-Silt Clay PH TC TP AP
(cm) % % % % % ppm ppm
826-836 33.9 16.3 22.0 27.8 6.0 836-848 86.8 3.3 1.8 8.1 6.0 848—866 33.9 17.1 21.9 27.1 6.0 866-881 881-897 38.7 15.2 20.3 25.8 6.8 897-1110 42.9 14.5 18.5 24.1 7.6 1110-1171 25.2 35.9 22.7 16.2 7.7
Gladwyn transect. Core 58BE108
0-10 4.9 43.5 34.5 17.1 6.6 2.24 676 64.7 10-20 4.7 35.0 45.1 15.2 6.2 1.60 402 31.3 20-31 4.1 34.6 44.2 17.1 5.7 0.53 380 28.7 31-36 2.9 35.5 40.8 20.8 5.1 0.41 295 17.7 36-48 2.8 26.7 43.3 27.2 4.6 0.37 390 14.9 48-53 1.6 29.6 36.6 32.2 4.6 0.20 476 17.4 53-61 1.9 21.8 37.1 39.2 4.5 0.14 504 21.1 61-71 1. 7 20.5 37.1 40.7 4.6 533 33.2 71-84 1.9 21.4 36.7 40.0 4.8 581 45.8 84-100 1.8 23.3 37.0 37.9 4.9 597 49.5 100-104 1.7 28.0 34.6 35.7 4.9 600 50.9 104-117 2.5 28.9 36.5 32.1 5.0 603 43.9 117-130 1.9 27.6 39.6 30.9 5.0 607 35.5 130-140 2.6 28.2 38.9 30.3 5.3 616 35.8 140-155 3.4 29.1 37.1 30.4 5.2 579 35.9 155-173 3.2 30.9 36.9 29.0 5.3 583 32.5 173-185 2.2 33.5 34.2 30.1 5.4 592 33.3 185-196 3.2 33.5 33.1 30.2 5.5 593 31.4 196-229 3.6 37.9 33.7 24.8 5.7 588 23.6 229-305 6.9 43.3 28.6 21.2 6.0 305-320 3.4 45.9 30.2 20.5 6.1 320-335 2.6 40.0 36.8 20.6 6.2 335-351 3.7 46.5 30.7 19.1 6.3 351-366 2.4 44.3 34.1 19.2 7.0 366-381 1.8 36.4 42.9 18.9 7.5 381-396 2.4 30.7 49.4 17.5 7.5 396-442 1.8 27.8 52.3 18.1 7.4 442-457 2.1 27.7 52.2 18.0 7.5 457-472 3.4 24.7 51.3 20.6 7.3 472-488 7.1 21.4 49.9 21.6 7.1 544-559 9.2 19.8 39.9 31.1 7.1 559-579 5.2 11.8 21.0 62.0 7.1

317
Gladwyn transect, Core 58BE109
Depth Sand C-Sllt F-Silt Clay PH TC TP AP
(cm) % % % % % ppm ppm
0-10 4.6 37.1 40.9 17.4 6.9 2.42 776 79.5 10-18 3.7 34.4 43.4 18.5 6.3 0.98 717 70.2 18-25 3.6 31.6 44.0 20.8 6.3 0.61 524 62.3 25-33 2.9 30.5 41.9 24.7 6.3 0.35 507 58. 7 33-41 2.5 26.7 40.0 30.7 6.3 0.28 430 48.8 41-48 1.8 26.2 37.2 34.8 6.0 0.26 429 39.5 48-56 1.6 24.4 36.8 37.2 5.7 0.26 464 39.6 56-66 2.9 23.7 35.8 37.6 5.3 0.19 472 43.0 66-76 3.3 24.0 36.0 36.7 5.2 530 56.3 76-86 3.4 23.7 36.7 36.2 5.1 551 60.9 86-97 2.3 25.0 37.7 35.0 5.0 554 58.9 97-104 2.4 28.3 35.8 33.5 5.0 569 53.1 104-112 3.4 30.6 34.6 31.4 5.0 589 45.4 112-125 2.9 27.6 38.0 31.5 5.1 591 39.6 125-137 2.5 28.6 38.0 30.9 5.0 590 30.5 137-147 2.9 32.4 35.7 29.0 5.3 594 25.3 147-158 2.9 36.4 35.5 25.2 5.5 556 19.0 158-173 2.6 38.9 34.1 24.4 5.7 572 15.2 173-185 3.5 38.5 33.9 24.1 5.7 562 14.7 185-201 3.6 40. 7 33.5 22.2 5.9 531 12.2 201-231 4.6 45.3 32.1 18.0 6. 7
12.2
231-262 3.1 45.3 33.6 18.0 7.0 262-292 2.6 39.9 37.1 20.4 7.0 292-335 2.8 32.0 43.0 22.2 6.9 335-361 12.1 19.4 37.2 31.3 6.8 361-373 39.3 10.9 26.8 23.0 6.7 373-394 39.2 7.5 14.0 39.3 6.8 394-414 26.5 5.2 7.2 61.1 6.8 414-432 29.4 5.0 8.5 57.1 6.7 432-460 44.3 7.2 11.1 37.4 6.8 460-488 43.1 7.0 13.1 36.8 6.8 488-508 47.1 7.5 11.7 33.7 6.9 508-536 42.4 12.7 12.0 32.9 7.1

318
Lone Tree transect , Core 52BE111
Depth Sand C-Silt F-Sllt Clay PH TC TP AP
(cm) % % % % % ppm ppm
0-10 9.1 32.6 30.5 27.8 6.0 2.12 580 34.2 10-18 8.4 33.4 30.1 28.1 6.0 1.99 551 30.4 18-31 6.8 28.7 33.9 30.6 5.7 1.90 485 22.7 31-43 5.9 28.3 33.9 31.9 5.5 1.50 411 18.3 43-53 2.3 28.1 37.1 32.5 5.2 1.40 398 13.7 53-61 1.2 27.0 37.9 33.9 5.1 0.89 392 11.4 61-74 1.1 26.9 37.4 34.6 5.4 0.30 410 16.7 74-84 1.9 26.9 36.0 35.2 5.4 465 19.2 84-94 2.2 27.3 36.0 34.5 5.5 539 24.5 94-107 1.4 29.7 34.9 34.0 5.5 620 37.2 107-119 1.5 30.0 34.6 33.9 5.5 641 41.1 119-130 2.5 34.2 33.8 29.5 5.6 660 39.4 130-140 2.7 32.0 36.7 28.6 5.7 699 36.2 140-150 2.4 33.8 35.6 28.2 5.7 693 32.1 150-163 4.4 36.7 32.1 26.9 5.8 642 29.0 163-175 6.0 36.6 31.7 25.7 5.7 590 24.7 175-183 4.5 38.1 31.6 25.8 5.7 595 18.6 183-206 7.9 35.9 32.1 24.1 5.7 568 12.4 206-224 71.7 11.1 6.6 10.6 5.8 219 2. 1 224-254 80.6 7.4 3.7 8.3 5.9 254-279 91.4 2.6 1.0 5.0 6.0 279-305 90.3 3.0 5.1 1.6 6.0
Lone Tree transect, Core 52B103
0-8 3.7 41.3 30.0 25.0 6.8 8-18 3.5 34.3 38.7 23.5 7.0 18-25 3.5 31.4 38.0 27.1 6.9 25-31 3.7 31.8 36.0 28.5 6.8 31-38 3.0 28.9 37.0 31.1 6.3 38-46 2.1 22.6 39.3 36.0 5.5 46-58 1.7 24.3 37.8 36.2 5.3 58-66 2.0 22.9 39.0 36.3 5.2 66-76 2.6 24.9 36.5 36.0 5.1 76-86 3.8 27.8 35.1 33.3 5.2 86-99 3.0 31.1 36.0 29.9 5.3 99-109 2.8 29.8 37.8 29.7 5.3 109-119 3.3 33.6 36.3 26.8 5.3 119-132 3.4 30.8 38.0 27.8 5.3 132-147 3.0 32.6 34.5 29.0 5.4 147-158 5.1 33.6 34.4 26.9 5.4 158-165 12.3 36.2 27.0 24.5 5.4 165-178 31.0 27.7 20.2 21.1 5.4

319
Lone Tree transect. Core 52B103
Depth
(cm)
Sand
%
C-Sllt
%
F-Silt
%
Clay
%
PH TC
%
178-193 50.5 20.8 12.4 16.3 5.9 193-213 78.8 9.0 1.9 10.3 6.0 244-259 88.4 5.4 1.1 5.1 6.0 259-274 89.0 6.1 0.9 4.0 6.1 274-290 87.5 5.9 1.8 4.8 6.1 290-305 86.7 5.6 2.3 5.4 6.1 305-320 51.2 25.6 10.9 12.3 6.1 320-335 40.1 30.4 14.8 14.7 6.1 335-351 69.8 15.2 5.6 9.4 6.1
TP
ppm
AP
ppm
Lone Tree
0-8
8-15 15-25 25-38 38-46 46-53 53-61 61-71 71-79 79-86 86-97 97-104 104-114 114-122 122-132 132-145 145-155 155-170 170-185 185-201 201-216 216-236 236-257 257-295 295-305
transect
3.8 2 . 6 3.1 3.7 2.5 2 . 1 2.4 2 . 1 2.3 2.5 3.0 3.6 3.2 3.1 4.5 5.6 4.6 4.0 8 . 6
39.3 61.0 3.5
61.7 16.0 68.0
, Core
40.9 33.0 36.4 32.6 29.5 29.1 25.4 28.9 2 6 . 6 30.2 32.8 32.4 31.8 30.2 34.1 31.7 36.9 35.7 36.4 27.5 17.5 85.7 19.0 40.4 14.5
52B101
28. 1 35.9 30.9 33,2 34.9 34.6 38.1 34.4 38.8 36.7 35.2 34.8 36.2 38.4 33.4 35.3 34.1 37.4 33.9 16.3 10.0 2.4 7.3
25.7 14.2
27.2 6.3 1.95 610 45.5 28.5 6.1 1.84 573 42.2 29.6 6.1 1.60 540 39.4 30.5 6.0 1.20 499 29.0 33.1 5.8 0.98 478 13.0 34.2 5.6 0.63 451 9.9 34.1 5.6 0.25 435 8.9 34.6 5.5 0.17 420 14.2 32.4 5.6 468 20.0 30.6 5.6 487 28.8 29.0 5.7 530 38.8 29.2 5.6 582 39.3 28.8 5.6 585 37.0 28.3 5.6 614 36.1 28.0 5.6 650 34.0 27.4 5.6 669 34.2 24.4 5.6 698 29.0 22.9 5.6 661 27.2 21.1 5.7 630 23. 1 16.9 5.8 579 15.0 11.5 6.0 420 7.2 8.4 6.1 12.0 5.8 17.9 5.9 3.3 6.0

320
Lone Tree transect , Core 52B102
Depth Sand C-Sllt F-Silt Clay PH
(cm) % % % %
122-159 A'.O 35.7 37.4 22.9 6.1 159-209 5.6 33.4 36.9 21.1 6.2 209-260 5.6 37.9 35.1 21.4 6.4 260-310 6.2 39.4 34.2 20.2 6.4 310-400 5.7 47.2 30.2 16.9 6.6 400-549 6.1 45.3 31.3 17.3 7.1 549-570 7.9 37.9 33.5 20.7 7.1 570-580 8.2 42.0 31.2 18.6 7.2 580-602 19.6 18.5 22.9 39.0 7.2 602-631 15.3 13.1 16.0 55.6 7.1

321
West Liberty I transect. Core 52BE120
Depth Sand C-Silt F-Silt Clay pH TC TP AP
(cm) % % % % % ppm ppm
0-8 2.4 40.7 27.6 29.3 6.0 1.76 8-15 3.8 34.0 32.0 30.2 5.3 1.81 15-25 2.9 32.7 32.9 31.5 5.0 1.51 25-33 2.8 35.7 28.4 33.1 5.1 0.97 33-41 4.4 31.2 30.5 33.9 5.0 0.80 41-48 4.6 33.9 28.7 32.8 5.2 0.38 48-56 5.1 34.2 29.3 31.4 5.4 0.31 56-66 5.6 38.1 27.6 28.7 5.6 0.24 66-79 4.5 34.7 32.1 28.7 5.7 79-91 3.8 36.1 31.9 28.2 5.8 91-99 4.7 34.2 33.5 27.6 5.8 99-109 2.8 36.7 30.5 27.6 5.8 109-119 3.3 37.0 31.6 28.1 5.8 119-130 2.6 32.1 37.9 27.4 6.0 130-137 4.0 32.0 35.6 28.4 6.0 137-147 5.7 36.3 32.5 25.5 6.0 147-158 8.9 38.4 29.3 23.4 6.0 158-168 18.2 42.1 25.2 22.5 6.0 168-196 11.8 47.8 18.9 21.5 6.0 196-213 25.4 27.7 28.8 18.1 6.0 213-229 70.1 13.4 6.9 9.6 6.0 397-427 8.4 41.1 28.2 22.3 6.1 427-459 76.8 14.9 1.3 7.0 6.2 549-671 75.3 12.8 7.0 4.9 7.1 671-706 45.6 31.6 10.5 12.3 7.5 706-721 20.3 42.3 20.7 16.7 7.5 721-737 20.5 38.7 23.9 16.9 7.6 737-765 17.0 38.8 28.1 16.1 7.6 765-787 12.3 37.8 38.7 11.2 7.5 787-823 5.9 36.9 47.2 10.0 7.2 823-853 4.5 30.9 46.5 18.1 6.9 40.9 853-884 5.6 42.2 34.8 17.4 6.7 884-899 12.9 22.8 37.1 27.2 7.4 1.81 295 44.5 899-914 9.3 19.8 34.7 36.2 7.5 1.01 265 21.7 914-930 15.1 19.8 27.3 37.8 7.8 0.65 195 9.3 930-942 22.7 17.7 21.8 37.8 7.9 0.20 209 6.3 942-965 30.8 16.3 18.1 34.8 8.0 0.12 246 4.0 965-991 36.5 15.7 14.7 33.1 8.0 289 2.0

322
West Liberty I transect. Core 52B105
Depth Sand C-Silt F-Sllt Clay pll
(cm) % % % %
185-211 5.2 44.0 30.4 20.4 5.4 211-267 9. 1 39.0 30.9 21.0 6.1 267-320 11.5 43.0 27.6 17.9 6.2 320-333 32.7 34.0 18.3 15.0 6.3 333-345 15.7 40.1 28.3 15.9 6.9 345-384 15.3 39.7 30.9 14.1 7.6 384-429 9.2 43.9 31.2 15.7 7.6 429-462 4.8 33.7 43.5 17.0 7.5 467-513 2.3 24.0 59.4 14.3 7.5 513-526 14.9 15.6 50.1 19.4 7.3 526-546 21.2 25.3 29.2 24.3 7.1 546-566 23.7 26.1 20.8 29.4 7.0 566-572 49.2 14.7 10.0 26.1 6.9 572-599 31.4 6.9 3.0 58.7 6.9 599-620 29.8 4.8 1.3 64.1 7.0
West Liberty I transect. Core 52BE122
178-244 5.1 41.7 20.2 25.0 5.9 244-348 4.5 45.3 30.8 19.4 6.2 348-384 5.9 45.0 32.1 17.0 7.3 384-409 4.6 45.5 32.6 17.3 7.4 409-467 1.3 33.4 48.5 16.8 7.6 467-472 1-7 27.8 57.3 13.2 7.6 472-516 7.7 25.8 46.9 19.6 7.2 516-536 7.5 23.9 48.1 20.5 6.8 536-549 6.3 12.3 43.9 37.5 7.0 549-564 4.4 10.3 21.7 63.6 7.1 564-579 4.5 16.0 32.3 47.2 7.2

323
West Liberty II transect. Core 52B211
Depth Sand C-Silt F-Sllt Clay pll TC TP AP
(cm) % % % % % ppm ppm
0-10 4.3 31.7 35.9 28.1 7.2 1.95 623 31.6 10-23 2.4 30.4 38.9 28.3 7.1 1.63 501 18.2 23-31 2.2 28.5 39.9 29.4 7.0 1.39 532 7.6 31-38 2.1 29.1 39.3 29.5 6.8 1.25 442 6.9 38-51 2.6 27.5 39.0 30.9 6.8 1.00 435 3.4 51-61 2,1 26.6 39.0 32.3 6.4 0.49 390 2.6 61-69 2.1 26.9 37.2 33.8 5.7 0.33 412 5.2 69-76 2.7 26.8 36.5 34.0 5.6 421 14.8 76-86 2.5 28.7 34.9 33.9 5.7 500 30.2 86-97 2.6 28.9 34.7 33.8 5.7 587 38.1 97-107 3.5 33.6 31.8 31.1 5.9 618 27.9 107-119 4.4 34.8 31.1 29.7 5.9 655 22.6 119-132 4.9 35.0 32.1 28.0 6.0 705 22.4 132-142 6.7 35.1 30.6 27.6 6.1 760 19.5 142-152 4.4 36.4 32.7 26.5 6.0 750 20.4 152-163 6.0 35.6 32.0 26.4 5.9 694 19.0 163-175 6.4 35.4 32.5 25.7 5.9 663 21.7 175-188 13.0 35.3 28.0 23.7 5.9 629 20.3 188-229 69.0 11.0 7.1 12.9 5.8 301 14.5
West Liberty II transect, Core 52B205
0-10 4.8 31.7 38.9 24.6 6.8 2.40 653 71.4 10-18 3.2 31.6 40.6 24.6 6.4 1.71 516 19.4 18-28 3.6 31.8 39.6 25.0 6.1 1.70 482 13.5 28-36 2.4 29.3 40.2 28.1 5.9 0.70 414 8.3 36-43 2.7 28.3 39.1 29.9 5.9 0.62 377 9.9 43-51 2.0 27.6 38.1 32.3 5.6 0.47 382 10.4 51-61 2.6 28.0 36.1 33.3 5.4 0.44 389 12.4 61-69 2.9 28.3 34.7 34.1 5.6 0.29 408 17.3 69-76 3.8 29.5 32.8 33.9 5.6 450 30.1 76-84 3.6 30.4 32.1 33.9 5.9 480 36.8 84-91 3.6 31.9 31.5 33.0 6.2 494 39.1 91-102 4.3 33.0 31.5 31.2 6.4 527 36.8 102-112 5.3 31.4 31.8 31.5 6.5 593 34.6 112-122 3.6 34.2 32.7 29.5 6.9 608 32.3 122-132 4.2 35.5 32.5 27.8 6.9 629 31.5 132-142 3.9 37.1 30.7 28.3 6.8 621 28.8 142-152 4.1 36.9 32.1 26.9 6.8 626 28.9 152-163 4.4 36.6 33.1 25.9 6.9 657 27.7 163-196 6.7 34.3 33.5 25.5 7.0 682 20.7 196-229 3.9 44.1 29.8 22.2 6.9 695 19.2

324
West Liberty II transect. Core 52B107
Depth Sand C-Silt F-Silt Clay pJI TC TP AP
(cm) % % % % % ppm ppm
0-8 4.8 32.4 37.7 25.1 7.1 2.20 645 76.1 8-15 5.2 31.5 37.2 26.1 7.0 1.97 598 59.4 15-28 3.0 29.7 38.3 29.0 6.8 1.30 461 21.2 28-38 2.0 28.3 37.7 32.0 6.7 0.70 366 7.1 38-51 1.7 25.0 36.9 36.4 6,1 0.65 392 6.2 51-64 1.9 27.1 35.1 35.9 5.6 0.52 405 10.4 64-71 2.7 27.9 34.3 35.1 5.5 435 18.4 71-81 3.0 28.8 33.5 34.7 5.5 459 30.0 81-91 5.1 31.7 32.5 30.7 5.5 514 45.1 91-102 3.8 34.6 32.0 29.6 5.4 584 49.6 102-109 4.3 35.6 31.3 28.8 5.4 607 47.4 109-117 4.2 34.3 32.0 29.5 5.4 605 32.3 117-163 3.9 37.8 32.3 26.0 5.7 672 31.5 163-201 4.1 39.8 31.7 24.4 5.7 655 20.4 201-244 5.0 40.3 32.1 22.6 5.7 676 20.0 244-290 685 10,8 290-340 5.4 46.3 32.6 15.7 7.6 3,5 389-414 5.1 45.1 32.3 17.5 7,6 414-452 2.3 44.2 36.9 16.6 7.6 452-485 1.6 30.7 52.2 15.5 7.5 485-508 5.4 23.3 53.2 18.1 7.3 508-528 5.6 23.2 49.9 21.3 7.3 528-549 10.0 15.4 35.6 39.0 7.3 549-561 6.4 9.5 22.0 62.1 7.2 561-574 7.2 9.2 14.9 68.7 7.1 574-589 11.7 8.4 18.2 61.7 7.1 589-605 19.7 9.9 18.3 52.1 6.9 605-620 29.1 9.8 14.3 46.8 6.8

325
West Liberty II transect, Core 52B108
Depth Sand C-Silt F-Silt Clay pH TC TP AP
(cm) % % % % % ppm ppm
0-8 4.1 29.2 40.1 26.6 6.4 8-18 3.8 29.5 40.0 26.7 6.2 18-25 3.1 28.5 38.7 29.7 6.0 25-36 2.4 26.6 41.3 29.7 5.6 36-46 3.3 27.7 38.6 30.4 5.2 46-53 2.5 27.5 38.3 31.7 5.2 53-64 2.6 26.3 37.0 34.1 5.3 64-74 2.8 26.9 36.0 34.3 5.3 74-81 2.6 25.7 36.2 35.5 5.4 81-89 4.0 28.7 33.4 33.9 5.4 89-99 2.8 31.1 33.1 33.0 5.5 99-109 4.1 34.9 30.3 30.7 5.5 109-117 5.8 34.2 29.7 30.3 5.5 117-125 4.6 34.1 32.3 29.0 5.5 125-132 4.2 33.8 33.7 28.3 5.5 132-140 5.5 32.2 33.8 28.5 5.4 140-147 4.5 33.9 32.8 28.8 5.4 147-155 4.5 35.9 31.9 27.7 5.4 155-163 6.1 37.3 29.9 26.7 5.3 163-190 6.9 38.7 27.8 26.6 5.3 190-221 18.9 37.8 22.8 20.5 5.3 221-254 18.8 37.6 23.5 20.1 5.3 254-290 18.1 38.9 25.5 17.5 5.4 290-305 51.6 22.5 12.6 13.3 5.6 305-318 59.9 19.4 10.2 10.5 5.7 318-328 81.5 8.4 3.3 6.8 5.7 328-366 48.9 26.6 12.3 12.2 6.8 366-401 29.0 34.8 21.2 15.0 7.3 401-404 8.9 40.8 36.4 14.2 7.4 404-406 8.1 43.5 37.4 11.0 7.2 406-427 5.1 42.8 39.2 12.9 7.6 427-450 3.7 37.6 44.3 14.4 7.6 450-483 2.0 23.3 55.2 19.5 7.2 483-518 3.0 23.6 53.8 19.6 7.2 518-533 2.9 23.0 54.4 19.7 7.1 533-549 2.3 22.4 53.3 22.0 7.0 549-574 1.8 21.8 48.7 27.7 7.0 574-592 2.0 13.5 33.7 50.8 7.0 592-610 3.1 12.0 32.3 52.6 7.1 610-630 7.6 14.9 41.6 35.9 7.1 630-650 6.9 16.9 39.0 37.2 7.0 650-671 7.6 18.6 38.2 35.6 7.1
2 .20 2 .20 1.91 1.63 1 . 2 6 0.92 0,58 0 . 2 1

326
West Liberty II transect. Core 52B109
Depth Sand C-Silt F-Silt Clay PH TO TP AP
(cm) % % % % % ppm ppm
0-10 3.7 32.5 36.6 27.2 6.0 2.15 710 24.1 10-18 3.5 30.7 38.2 27.6 5.9 1.98 685 21.0 18-25 2.9 29.9 37.5 29.7 5.4 1.34 610 13.3 25-33 3.5 29.6 36.5 30.4 5.2 0.93 582 9.0 33-41 2.6 29.0 37.5 30.9 5.0 0.79 574 8.6 41-46 2.4 30.9 35.3 31.4 5.2 0.66 530 7.5 46-56 2.6 30.3 35.4 31.7 5.3 0.58 496 4.3 56-69 2.8 28.6 35.8 32.8 5.3 0.42 478 18.1 69-76 1.8 29.7 34.8 33.7 5.3 482 30.8 76-86 2.6 29.1 34.7 33.6 5.3 563 33.3 86-94 2.4 32.6 32.9 32.1 5.3 620 32.5 94-102 3.8 33.7 32.0 30.5 5.4 701 31.2 102-112 4.4 34.9 31.1 29.6 5.4 710 27.4 112-122 3.1 35.9 32.7 28.3 5.5 729 23.3 122-135 3.7 36.3 31.7 28.3 5.5 736 22.0 135-147 2.6 36.4 33.8 27.2 5.6 748 22.2 147-185 4.6 36.4 32.9 26. 1 5.6 753 20.0 185-221 4.7 40.0 31.2 24.1 5.7 766 14.1 221-259 4.4 43.9 29.7 22.0 5.9 754 9.3 259-305 7.4 46.4 28.9 17.3 7.1 751 6.7

327
West Liberty IV transect. Core 52B206
Depth
(cm)
Sand
%
C-Silt
%
F-Silt
%
Clay
1
pH
0-10 15.3 28.6 27.6 28.5 6.2 10-20 12.9 29.8 28.5 28.8 6.0 20-28 7.5 29.6 30.5 32.4 5.8 28-36 5.2 29.5 31.7 33.6 5.5 36-48 3.5 27.5 34.6 34.4 5.6 48-56 3.4 28.8 31.9 35.9 5.6 56-64 4.4 28.2 32.1 35.3 5.6 64-71 2.7 30.7 31.7 34.9 5.7 71-76 4.4 30.6 31.4 33.6 5.7 76-84 5.2 32.7 30.7 31.4 5.7 84-91 5.9 32.6 30.3 31.2 5.7 91-99 4.8 36.5 28.6 30.1 5.7 99-107 3.9 37.3 29.4 29.4 5.8 107-114 4.8 35.3 31.9 28.0 5.8
114-122 6.2 36.3 30.5 27.0 5.8 122-135 6.3 35.2 33.3 25.2 5.8 135-150 8.3 30.6 35.8 25.3 5.8 150-168 68.3 13.1 7.9 10.7 5.9 168-229 83.5 9.4 2.6 4.5 6.1 229-396 92.2 4.3 2.1 1.4 6.1

328
West Liberty IV transect. Core 52B104
Depth
(cm)
Sand
%
C-Silt
%
F-Silt
%
Clay
%
pH TC
%
TP
ppm
AP
ppm
0—8 3.0 37.1 34.8 25.1 5.7 1.88 607 28.0 8-18 3.5 36.2 34.7 25.6 5.7 1.86 561 15.5 18-25 3.6 40.9 26.8 28.7 5.7 1.71 528 8.7 25-33 3.4 42.5 23.7 30.4 5.3 1.41 503 5.0 33-41 2.4 38.8 28.4 30.4 - 5.3 1.31 466 4.7 41-46 2.9 32.5 33.9 30.7 5.2 1.12 413 2.2 46-56 2.1 25.4 40.4 32.1 5.3 0.94 376 3.4 56-64 2.6 26.3 38.6 32.5 5.2 0.58 355 3.4 64-74 1.9 24.0 39.4 34.7 5.3 0.12 395 4.1 74-81 2.5 26.7 36.9 33.9 5.3 426 12.7 81-94 3.0 29.0 35.0 33.0 5.5 467 24.9 94-104 4.5 32.0 33.9 29.6 5.8 522 33.6 104-117 5.0 32.0 32.3 29.7 5.7 629 32.8 117-135 3.6 30.5 37.0 28.9 5.7 659 31.4 135-145 3.3 32.5 35.7 28.5 5.8 668 26.1 145-155 4.1 33.3 34.4 28.2 5.8 678 24.9 155-168 4.4 37.3 32.4 25.9 5.8 695 20.0 168-180 5.3 39.4 30.3 25.0 5.8 667 18.9 180-193 4.9 43.9 27.7 23.5 5.8 633 14.2 193-208 7.3 42.7 27.1 22.9 6.0 615 12.0 208-224 11.8 41.9 24.6 21.7 5.7 568 8.8 224-269 80.3 5.6 4.3 9.8 5.7 130 3.0 269-277 80.2 6.2 4.1 9.5 5.7 277-290 61.1 18.5 8.9 11.5 6.1 290-305 23.9 38.8 22.9 14.4 7.1 305-427 12.1 39.6 32.2 16.1 7.1 427-564 11.8 40.5 31.9 15.8 7.6 564-594 12.1 31.2 32.5 24.2 7.3

329
Iowa City East transect. Core 52B204
Depth Sand C-Silt F-Silt Clay pH TC TP AP
(cm) % % % % % ppm ppm
0-10 4.1 30.5 38.8 26.6 6.9 2.03 691 62.0 10-20 4.7 31.7 37.1 26.5 6.8 2.02 662 50.9 20-31 3.1 30.5 38.8 27.6 6.2 1.91 530 12.3 31-41 2.7 28.5 38.7 30.1 5.6 1.25 496 9.3 41-53 2.5 28.1 38.8 30.6 5.5 0.95 429 7.3 53-61 2.7 27.0 37.6 32.7 5.3 0.51 388 7.0 61-71 2.2 26.4 36.1 35.3 5.4 0.40 417 11.6 71-79 2.6 26.3 35.2 35.9 5.4 455 18.3 79-86 2.5 27.8 34.9 34.8 5.4 488 23.4 86-97 2.8 28.8 34.6 33.8 5.5 495 25.2 97-107 3.3 28.4 35.3 33.0 5.6 512 26.0 107-117 3.2 30.8 34.6 31.4 5.5 550 23.0 117-127 2.8 30.8 35.7 30.7 5.5 645 21.9 127-137 2.8 30.3 38.4 28.5 5.8 667 20.1 137-147 3.5 32.9 35.2 28.4 5.8 670 18.8 147-160 3.7 36.2 32.0 28.1 5.8 680 20.1 160-185 3.9 34.5 33.2 28.4 5.8 685 19.1 185-244 5.7 38.8 29.5 26.0 6.0 724 18.5 244-279 4.2 37.4 31.9 26.5 6.1 769 16.7 305-335 5.1 38.5 32.0 24.4 5.7 786 16.3 335-396 3.9 44.1 29.2 22.8 6.5 744 15.1 396-518 4.5 45.2 28.1 22.2 6.9 703 14.0 549-582 4.9 48.2 30.5 16.4 7.6 623 11.3 582-625 5.4 46.0 33.2 15.4 7.6 525 6.8 625-651 20.1 34.1 28.9 16.9 7.6 360 4.6 651-701 25.3 35.8 22.4 16.5 7.7 255 3.7 701-823 82.6 7.3 3.6 6.5 7.8 198 2.1

330
Iowa City East transect. Core 52B217
Depth Sand C-Silt F-Silt Clay pH TC TP AP
(cm) % % % % % ppm ppm
0-13 3,4 32.0 37.6 27.0 5.7 2.13 742 29.4 13-23 2.5 31.4 38.6 27.5 5.3 1.39 650 13.6 23-28 2.2 29.5 38.6 29.7 5.3 1.27 630 12.1 28-36 2.1 28.8 38.6 30.5 5.3 1.14 620 10.1 36-46 2.8 27.9 38.1 31.2 5.3 1.03 574 9.5 46-51 2.3 27.3 37.6 32.8 5.4 0.74 514 6.1 51-58 2.4 26.7 36.5 34.4 5.4 0.68 503 7.8 58-66 2.1 26.0 37.7 34.2 5.5 0.38 488 18.1 66-74 2.6 28.6 34.8 34.0 5.5 498 29.0 74-81 2.6 28.5 35.1 33.8 5.5 498 31.0 81-89 2.5 27.8 36.0 33.7 5.5 509 30.9 89-99 2.8 32.1 33.0 32.1 5.4 538 28.2 99-107 3.2 33.7 32.0 31.1 5.5 570 25.2 107-117 2.8 36.8 31.8 28.6 5.6 585 22.3 117-130 3.4 33.6 34.8 28.2 5.6 624 21.0 130-140 4.5 37.1 31.1 27.3 5.7 673 19.5 140-193 7.6 36.6 30.5 25.2 5.8 701 16.1

331
Nichols transect. Core 52BB101
Depth
(cm)
Sand
%
C-Silt
%
F-Silt
%
Clay
%
pH
0-10 3.4 31.2 39.9 25.5 5.6
10-20 3.4 27.6 43.0 26.0 5.4
20-33 2.6 29.1 40.3 28.0 5.5
33-46 2.3 26.4 37.8 33.5 5.5
46-61 3.1 20.8 31.2 44.9 5.6
61-76 1.6 21.3 29.7 47.4 5.7
76-91 1.4 27.3 29.6 41.7 5.9
91-109 4.1 26.8 31.9 37.2 6.4
109-122 2.1 26.9 34.0 37.0 6.6
122-132 1.7 30.5 34.1 33.7 6.8
132-152 1.4 33.5 34.6 30.5 7.1
152-178 2.2 38.5 36.5 22.8 7.4
178-234 9.5 45.9 26.2 18.4 7.4
234-244 78.9 8.7 3.4 9.0 7.4
Nichols transect. Core 70BB102
0-13 6.9 23.6 35.2 34.3 7.0
13-23 7.9 22.6 34.1 35.4 6.8
23-33 3.4 21.4 35.3 39.9 6.8
33-41 3.0 19.3 34.3 43.4 6.8
41-53 3.4 17.0 35.2 44.4 6.8
53-66 3.7 15.1 37.7 43.5 6.7
66—84 3.7 17.9 36.0 43.4 6.6
84-97 8.3 20.9 32.4 38.4 6.5
97-107 2.8 20.0 38.9 38.4 6.6
107-130 2.4 19.1 40.6 37.9 6.5
130-178 1.9 39.5 31.8 26.8 6.5
178-203 3.3 21.6 36.6 38.5 6.6
203-244 95.7 1.3 0.1 2.9 6.5
Nichols transect, Core 70BB103
0-13 66.9 12.9 8.3 11.9 6.8 13-25 62.9 16.8 9.1 11.2 6.8 25-38 65.7 15.3 8.2 10.8 6.7 38-48 67.1 14.0 8.3 10.6 6.7 48-61 81.0 1.0 8.3 9.7 6.6 61-74 62.4 19.5 8.5 9.6 6.6 74-89 67.5 16.3 7.5 8.7 6.5 89-112 70.5 15.2 6.5 7.8 6.6 112-183 90.0 3.9 1.8 4.3 6.3

332
Conesvllle transect, Core 58BB104
Depth Sand C-Sllt F-Silt
(cm) % 7o /o
Clay
%
pH
0-15 90.8 6.4 1.8 1.0 5.8
15-28 88.9 3.2 5.5 2.4 5.5
28-43 87.4 3.7 5.7 3.2 5.0
34-58 87.0 4.3 5.9 2.8 5.0
58-76 88.0 3.5 5.7 2.8 5.3
76-97 86.5 4.2 6.7 2.6 5.4
97-137 84.1 5.1 8.7 2.1 5.5
137-173 67.1 8.4 13.3 11.2 5.6
173-218 93.6 1.0 2.9 2.5 5.7
218-231 90.8 1.3 2.9 5.0 5.8
Conesvllle transect, Core 58BB105
0-13 81.3 7.7 4.8 6.2 6.6
13-25 81.4 6.7 5.0 6.9 6.5
25-41 80.2 7.1 5.3 7.4 6.4
41-53 80.6 7.0 5.5 6.9 6.1
53-69 81.2 7.1 5.3 6.4 6.3
69-84 82.4 6.0 5.9 5.7 6.4
84-104 85.1 6.1 4.1 4.7 6.4
104-137 77.4 6.8 3.9 11.9 5.9
137-191 92.4 3.2 1.3 3.1 5.9
191-305 95.4 1.5 1.0 2.1 5.9
Conesvllle transect, Core 70BB106
0-15 91.5 2.8 3.8 1.9 6.6
15-28 91.4 3.0 3.9 1.7 6.3
28-41 89.5 3.6 4.1 2.8 6.0
41-53 90.4 2.3 4.5 2.8 5.1
53-69 90.4 2.8 4.6 2.2 5.1
69-81 91.4 2.1 4.7 1.8 5.0
81-104 92.5 2.0 3.9 1.6 5.4
104-125 93.2 1.7 3.5 1.6 5.6
125-147 95.2 1.3 3.3 0.2 5.5
147-191 96.7 0.8 2.2 0.3 5.5
191-229 97.1 0.3 2.5 0.1 6.0

333
Columbus Junction transect, Core 58BEN5
Depth Sand C-Sllt F-Silt Clay pH
(cm) % % % %
183-254 1.5 36.3 43.3 18.9 7.0
254-285 4.8 22.7 52.8 19.7 7.0
285-305 16.5 18.1 44.9 20.5 7.0
305-333 29.4 16.0 35.0 19.6 6.9
333-353 25.1 14.6 29.8 30.5 6.9
353-366 19.5 8.3 15.4 56.8 6.8
366-381 19.5 7.6 15.6 57.3 6.7
381-396 22.9 10.8 17.9 48.4 6.8
396-409 24.3 12.2 21.5 42.0 6.8
409-424 25.5 16.7 18.5 39.3 7.1
424-445 23.6 11.6 25.3 39.5 7.1
445-457 13.1 15.6 28.8 42.5 7.1
457-475 11.4 15.0 30.2 43.4 7.1
475-506 37.5 14.0 25.4 23.1 7.6
506-526 25.2 15.7 27.7 31.4 7.6
526-541 34.2 16.9 23.4 25.5 7.7
541-551 15.1 19.9 29.1 35.9 7.5
551-559 12.1 19.4 29.9 38.6 7.6
559-594 17.7 17.2 28.8 36.3 7.6
594-640 37.5 14.8 25.2 22.5 7.7
640-658 22.9 10.0 19.3 47.8 6.9
658-671 21.7 12.8 24.6 40.9 6.8
671-681 22.9 10.6 21.7 44.8 6.7
681-719 37.1 15.9 26.1 20.9 7.8
719-754 34.8 15.4 29.9 19.9 8.2
754-800 38.2 14.7 27.5 19.6 8.1
800-851 37.3 32.7 11.2 18.8 8.2
851-914 35.5 16.7 30.0 17.8 8.1
Columbus Junction transect. Core 58BB107
163-193 4.3 34.1 39.8 21.8 7.1
193-290 1.4 33.9 44.4 20.3 7.3
290-330 1.2 30.1 47.7 21.0 7.3
330-361 17.8 19.7 33.8 28.7 7.1
361-368 22.8 16.6 29.1 31.5 7.0
368-384 24.1 15.3 26.7 33.9 6.9
384-401 22.5 16.9 25.6 35.0 7.0
401-422 21.7 16.0 27.2 35.1 7.0
422-439 24.0 12.2 26.4 37.4 7.0
439-457 23.1 12.5 21.9 42.5 7.0
457-475 41.9 10.3 16.9 30.9 7.0

334
Columbus Junction transect, Core 58BB107
Depth Sand C-Sllt F-Silt Clay PH
(cm) % % % %
475-493 43.5 10.1 17.7 28.7 6.9
493-508 37.5 11.6 20.0 30.9 7.1
508-521 46.9 9.1 16.3 27.7 7.1
521-533 48.7 9.4 14.9 27.0 7.1
533-564 46.2 15.0 14.7 24.1 6.9
564-584 47.4 12.7 15.9 24.0 7.1
584-610 54.1 9.2 17.2 19.5 8.0
610-625 49.0 12.0 18.6 20.4 7.9
625-640 52.1 10.9 16.7 20.3 8.1
Columbus Junction transect , Core 58BEN2
127-147 4.3 41.2 31.7 22.8 6.9
147-196 10.6 43.4 31.9 14.1 7.6
196-241 4.7 46.4 33.2 15.7 7.6
241-285 4.3 42.8 36.8 16.1 7.6
285-290 1.7 32.4 51.6 14.3 7.4
290-300 20.9 16.6 40.0 22.5 7.4
300-312 13.2 17.7 48.2 20.9 7.4
312-325 19.4 16.2 36.1 28.3 7.2
325-340 17.9 14.4 32.5 35.2 7.2
340-356 19.2 12.4 29.9 38.5 6.9
356-368 14.7 12.3 26.5 46.5 7.0
368-384 13.6 9.0 22.0 55.4 7.0
384-399 15.9 8.9 23.6 51.6 7.2
399-409 12.8 10.3 27.9 49.0 7.2
409-419 17.2 9.4 28.6 44.8 7.1
419-455 42.4 8.5 18.9 30.2 7.2
455-483 50.4 8.4 17.1 24.1 7.4
483-549 51.4 8.8 18.5 21.3 7.3
549-577 53.8 10.3 15.7 20.2 7.2
577-625 50.5 10.1 19.0 20.4 7.6
635-648 47.9 12.2 19.1 20.8 7.8
671-701 50.0 10.4 19.1 20.5 7.8
843-853 51.2 11.2 16.9 20.7 8.0

335
Columbus Junction transect, Core 58BEN4
Depth Sand C-Silt 1 t-'-Silt Clay pH
(cm) % % % %
125-152 1.8 32.0 37.1 29.1 7.1
152-323 1.9 32.4 40.7 25.0 7.1
323-325 1.9 28.4 44.1 25.6 6.9
325-348 6.2 15.1 40.8 38.0 6.9
348-368 19.5 4.7 34.9 40.9 6.9
368-391 6.7 17.3 35.1 40.9 6.9
391-414 6.3 17.3 31.3 45.1 6.9
414-447 5.2 16.6 33.1 45.1 6.8
447-467 7.4 13.1 34.6 44.9 6.8
467-495 6.9 16.2 32.6 44.3 6.8
495-526 7.6 14.0 34.1 44.3 6.8
526-559 6.2 15.1 37.2 41.5 6.9
559-584 7.8 10.7 31.7 49.8 6.6
584-610 14.1 11.7 30.5 43.7 6.6
610-635 6.3 14.7 37.7 41.3 6.7
635-660 15.5 12.0 30.8 41.7 6.7
660-709 14.8 12.7 32.7 39.8 6.9
709-744 16.3 12.6 31.2 39.9 7.0
744-780 22.1 12.7 28.3 36.9 7.0
780-805 21.8 14.1 26.6 37.5 7.0
805-838 23.2 13.9 26.0 36.9 7.0
838-853 23.7 14.7 24.6 37.0 7.0

336
West Liberty III transect. Core 52BE14
Depth Sand C-Silt F-Silt Clay pîï TC TP ÂP
(cm) % % % % % ppm ppm
0-23 3.3 33.1 36.1 27.5 6.7 2.10 659 45.0 23-31 2.3 31.3 36.4 30.0 6.6 1.81 610 32.4 31-51 2.3 31.8 33.9 32.0 6.4 1.36 584 26.0 51-61 1.8 29.9 36.0 32.3 5.7 0.87 491 19.9 61-74 1.7 28.7 35.8 33.8 5.4 0.53 456 23.1 74-79 3.5 28.8 33.5 34.2 5.4 0.37 521 33.5 79-89 2.9 27.8 36.8 32.5 5.4 0.20 538 39.5 89-104 3.8 32.6 32.0 31.6 5.6 583 36.5 104-117 7.1 30.8 32.5 30.0 5.6 620 36.5 117-135 4.5 34.9 31.4 29.2 5.7 668 28.7 135-152 6.2 41.4 27.0 25.4 5.7 655 21.6 152-168 25.2 32.2 20.0 22.6 5.6 488 21.9 168-188 67.6 12.3 6.4 13.7 5.5 254 14.9 188-305 83.8 7.1 1.1 8.0 5.5
Vest Liberty III transect. Core 52B220
0-10 3.8 28.0 32.5 35.7 6.7 3.10 687 27.5 10-20 3.4 28.4 32.5 35.7 6.7 2.80 671 11.3 20-31 4.2 27.7 31.1 37.0 6.7 1.82 551 4.3 31-43 2.8 27.6 32.1 37.5 6.7 1.30 460 3.2 43-56 2.8 26.7 34.3 36.2 6.9 1.15 391 2.0 56-64 2.7 27.2 35.7 34.4 6.9 0.59 381 1.4 64-71 3.1 27.0 35.6 34.3 6.9 0.24 417 4.3 71-79 5.2 30.3 33.5 31.0 7.0 623 6.4 79-86 4.5 34.2 32.0 29.3 7.0 654 9.4 68-94 5.8 35.3 29.9 27.8 7.0 674 10.8 94-102 6.2 37.4 30.7 25.7 7.0 652 11.3 102-112 7.9 37.0 30.1 25.0 7.0 665 12.2 112-122 5.2 40.1 29.5 25.2 7.0 654 10.0 122-132 7.0 38.0 29.7 25.3 7.1 620 8.6 132-142 8.7 39.9 25.8 25.6 7.1 580 7.5 142-158 11.1 39.8 25.9 23.2 7.0 495 5.8 158-183 80.7 9.8 3.1 6.4 6.9 277 3.0

337
West Liberty III transect. Core 52B212
Depth
(cm)
Sand
%
C-Silt
%
F-Sllt Clay
% %
PH TC
%
TP
ppm
AP
ppm
0-10 4.7 30.8 35.1 29.4 7.2 2.44 550 33.8 10-23 4.3 30.9 35.4 29.4 7.0 2.30 513 7.0 23-31 4.5 30.8 35.0 29.7 6.8 1.90 493 6.9 31-41 5.2 29.3 35.0 30.5 6.5 1.37 485 7.2 41-53 5.4 27.2 35.6 31.8 5.8 0.71 438 5.9 53-61 4.3 27.1 35.7 32.9 5.4 0.66 349 3.0 61-69 3.8 28.2 34.6 33.4 5.4 0.33 308 5.5 69-76 4.0 29.0 34.9 32.1 5.4 0.23 324 9.8 76-84 3.7 29.0 35.9 31.4 5.4 0.19 366 18.9 84-94 5.0 31.5 35.2 28.3 5.4 503 20.2 94-102 4.3 35.7 32.4 27.6 5.6 624 23.7 102-112 6.8 38.5 29.9 24.8 5.6 664 22.4 112-119 17.8 33.1 25.0 23.1 5.8 659 19.6 119-127 18.2 33.8 24.6 23.4 5.9 628 18.8 127-135 38.0 25.2 16.7 20.1 5.9 514 12.6 135-158 83.4 5.6 2.0 9.0 5.8 189 7.2 158-183 84.8 5.4 2.8 7.0 5.7 174 7.2
West Liberty III transect. Core 52B219
0-13 4.4 29.8 37.2 28.6 6,7 2.38 644 32.8 13-23 3.6 29.7 38.2 28.5 6.6 1.98 599 33.9 23-31 5.4 27.8 38.3 28.5 6.5 1.75 580 20.3 31-43 5.6 26.9 38.7 28.8 5.5 1.19 462 6.3 43-56 4.6 26.7 37.9 30.8 5.3 0.65 346 5.3 56-66 4.9 24.5 37.9 32.7 5.3 0.61 316 3.0 66-74 3.6 25.2 37.4 33.8 5.3 0.42 284 4.2 74-81 3.6 25.8 38.1 32.5 5.3 0.18 256 4.2 81-89 2.9 26.4 35.2 32.5 5.4 273 5.3 89-97 5.0 26.1 35.1 31.8 5.4 307 5.5 97-107 4.5 30.2 35.4 29.9 5.5 371 11.5 107-117 6.6 30.7 34.9 27.8 5.5 466 17.4 117-127 9.6 32.0 32.2 26.2 5.6 638 27.2 127-137 7.9 36.6 30.5 25.0 5.6 632 29.5 137-147 8.0 36.6 30.6 24.8 5.7 604 28.0 147-158 11.8 37.1 26.8 24.3 5.7 554 23.6 158-170 22.3 33.1 23.0 21.6 5.7 534 22.9 170-183 32.6 30.6 16.9 19.9 5.7 496 18.1 381-213 77.4 9.1 4.7 8.8 5.7 207 14.8

338
West Liberty III transect, Core 52B209
Depth Sand C-Silt F-Silt Clay pH TC TP AP
(cm) % % % % % ppm pptn
0-10 12.3 26.0 34.8 26.9 7.2 2.17 817 50.6 10-18 12.3 26.6 35.3 26.8 7.2 1.88 624 48.8 18-31 10.1 27.4 36.2 26.3 7.1 1.33 353 24.3 31-41 7.4 25.3 36.3 31.0 7.0 0.89 219 21.4 41-48 5.0 21.9 34.2 38.9 6.7 0.70 170 10.3 48-56 3.7 21.5 31.4 43.4 6.5 0.27 233 2.1 56-64 3.0 21.0 33.1 42.9 6.3 0.20 286 5.2 64-69 3.3 22.9 34.5 39.3 6.2 0.05 323 8.9 69-76 2.8 25.7 35.4 36.1 6.2 0.05 445 10.4 76-81 3.4 28.9 33.3 34.4 6.3 0.05 542 12.4 81-91 5.0 30.3 32.3 32.5 6.3 685 9.1 91-102 4.5 30.2 33.7 31.6 6.4 768 7.8 102-112 7.0 34.6 32.1 26.3 6.5 713 10.9 112-119 12.4 35.0 29.0 23.6 6.6 580 15.9 119-127 12.4 34.6 29.9 23.1 6.7 572 17.6 127-137 13.7 33.9 31.1 22.3 6.7 537 18.4 137-173 71.0 13.7 5.7 9.6 6.5 524 20.1 173-203 87.7 6.2 1.8 4.3 6.5 177 3.0