Embed Size (px)
Citation preview
GEOMORPHOLOGY OF DEPOSITS FROM THE 2004 INDIAN OCEAN TSUNAMI,
TAMIL NADU, SOUTHEASTERN INDIA
__________________________________
A Thesis
Presented to
The Graduate Faculty
Central Washington University
___________________________________
In Partial Fulfillment
of the Requirements for the Degree
Master of Science
Geology
___________________________________
by
Patrick Alan Johnston
April 2013

ii
CENTRAL WASHINGTON UNIVERSITY
Graduate Studies
We hereby approve the thesis of
Patrick Alan Johnston
Candidate for the degree of Master of Science
APPROVED FOR THE GRADUATE FACULTY
______________ _________________________________________
Dr. Lisa L. Ely, Committee Chair
______________ _________________________________________
Dr. Marie Ferland
______________ _________________________________________
Dr. Breanyn MacInnes
______________ _________________________________________
Dr. Carey Gazis, Geology Department Chair
______________ _________________________________________
Dean of Graduate Studies
iii
ABSTRACT
GEOMORPHOLOGY OF DEPOSITS FROM THE 2004 INDIAN OCEAN TSUNAMI,
TAMIL NADU, SOUTHEASTERN INDIA
by
Patrick Alan Johnston
April 2013
In low latitudes, geologically suitable repositories for tsunami deposits are not
well defined. This project characterizes the geomorphic environments on the
southeastern coast of India that preserved depositional evidence of the catastrophic
tsunami created by the Mw9.0-9.3 Sumatra-Andaman earthquake on December 26, 2004.
The Indian coast is particularly interesting because it is approximately 1300 km from the
subduction-zone source of tsunamis across the Indian Ocean, and therefore only the
largest events are capable of reaching it. The main objective of this study was to identify
the settings where recognizable tsunami deposits from the 2004 event have been
preferentially preserved in the stratigraphic record until 2008. These results will be useful
in future attempts to discover and identify paleotsunami deposits in the geological record
from India, and elsewhere.
iv
ACKNOWLEDGMENTS
Assistance was provided by numerous people and organizations during this
project. Funding was provided by the National Science Foundation grant EAR-0726291
and the CWU Office of Graduate Studies. Special thanks goes to Dr. Hema Achyuthan
and Dr. S. Srinivasalu from Anna University in Chennai, India for providing guidance to
field locations, generous hospitality and additional interpretations. I would like to thank
Utah State University and Dr. Tammy Rittenour for their sample processing and prompt
delivery of OSL dates. I would like to thank my fellow graduate students and the faculty
at CWU for support, interpretations, guidance and quality friendship. In addition,
graduate student P. Saravanan from Anna University also aided in field work and
interpretation. Special thanks goes to graduate Caitlin Orem for her assistance in looking
for forams and diatoms in my samples. Additional thanks goes out to my family,
especially my brother, mother and father, whose love and support allowed me the
opportunity to attend graduate school. I owe an unpayable debt of gratitude to my loving
wife, who I met during my research, for her many hours of lab assistance, interpretations,
editing and motivation. This project would not have been possible without the guidance
of my committee members. Dr. Breanyn MacInnes provided essential guidance in
coastal geomorphology and tsunami deposit characteristics. Dr. Marie Ferland was
instrumental in guiding the sedimentary analysis of this study. My final and most
pertinent thanks goes to my advisor, Dr. Lisa Ely, for accepting me as a student,
providing endless hours of guidance, tireless patience, understanding and wisdom
throughout the project.

v
TABLE OF CONTENTS
Chapter Page
I INTRODUCTION ........................................................................................ 1
Purpose .................................................................................................... 1
Hypotheses .............................................................................................. 3
Objectives ................................................................................................ 3
II LITERATURE REVIEW ............................................................................. 7
Geomorphology....................................................................................... 7
The 2004 Indian Ocean Tsunami-Interactions with Geomorphology ... 10
Earthquakes and Tsunamis in the Indian Ocean Basin ......................... 11
Tsunami Sedimentation ......................................................................... 13
December 26th
, 2004 Tsunami Deposits Around the Indian Ocean Basin
............................................................................................................... 18
December 26th
, 2004 Tsunami Deposits in India .................................. 19
III METHODS ................................................................................................. 22
Field Methods........................................................................................ 22
Study Sites ............................................................................................. 24
Sedimentary Analysis ............................................................................ 27
Optically-Stimulated Luminescence Dating ......................................... 31
IV RESULTS AND DISCUSSION ................................................................. 33
Geomorphology..................................................................................... 33
Geomorphic Descriptions of Northern Study Sites ............................... 39
Geomorphic Descriptions of Southern Study Sites ............................... 45
Stratigraphic Thickness ......................................................................... 49
Transect Profiles of Tsunami Sediment Thickness ............................... 49
Field Observations of Candidate Tsunami Deposits ............................. 57
Grain Size Statistics .............................................................................. 58
Discussion of Grain Size Characteristics .............................................. 64
Individual Site Grain Size Statistics ...................................................... 65
Discussion of Grain Size Patterns at Individual Sites ........................... 65
Transect Analysis .................................................................................. 75
Comparison with Srinivasalu et al. (2007) ............................................ 80
Summary Discussion of Grain Size Results .......................................... 82
Optically Stimulated Luminescence Data ............................................. 85
vi
TABLE OF CONTENTS (continued)
Chapter Page
V CONCLUSIONS ........................................................................................ 89
Summary ............................................................................................... 92
REFERENCES ........................................................................................... 93
APPENDIXES ............................................................................................ 99
Appendix A—Stratigraphic Descriptions ............................................. 95
Appendix B—Grain Size Data and Calculations ................................ 140
Appendix C—Pictures of Sites and Pits.............................................. 152
Appendix D—Sample Raw Data .................................... Rear Pocket CD

vii
LIST OF TABLES
Table Page
1 Geomorphic Summary ................................................................................ 25
2 General Grain Size Statistics ...................................................................... 59
3 Optically-Stimulated Luminescence Data .................................................. 85
B1 Grain Size Data ......................................................................................... 144
B2 Grain Size Calculations ............................................................................ 148
D1 Sample Location, Distance Inland and Depth ..................................... CD D1
viii
LIST OF FIGURES
Figure Page
1 Study area and regional context .................................................................... 5
2 Individual study sites .................................................................................... 6
3 Mamallapuram Shore Temple Complex ....................................................... 9
4 Geomorphic Category 1 at Mamallapuram................................................. 34
5 Geomorphic Category 2 at Thiruvadandhai ................................................ 34
6 Geomorphic Category 3 at Aalikuppam ..................................................... 35
7 Geomorphic Category 4 at Muttukaddu ..................................................... 35
8 Stratigraphic column and description of Kallar Pit 2 ................................. 37
9 Photograph of Kallar Pit 2 .......................................................................... 38
10 Stratigraphic column and description of Mamallapuram Pit 3 ................... 43
11 Photograph of Mamallapuram Pit 3 ............................................................ 44
12 Interpreted tsunami deposit thickness variation versus latitude ................. 51
13 Maximum thickness of interpreted tsunami deposit vs. distance inland .... 52
14 Interpreted tsunami thickness at Mamallapuram transect ........................... 55
15 Interpreted tsunami thickness at Thiruvadandhai transect .......................... 55
16 Interpreted tsunami thickness at Aalikuppam transect ............................... 56
17 Interpreted tsunami thickness at Karikattakuppam transect ....................... 56
18 Comparison of northern and southern sites interpreted tsunami sand ........ 60
19 Mean grain size vs. sorting ......................................................................... 62
ix
LIST OF FIGURES (continued)
Figure Page
20 Kovalam Pit 1 (northern site) grain size statistics ...................................... 66
21 Muttukaddu Pit 1 (northern site) grain size statistics ................................. 67
22 Thiruvadandhai Pit 3 (northern site) grain size statistics ............................ 68
23 Vadanemelli Pit 1 (northern site) grain size statistics ................................. 69
24 Mamallapuram Pit 1 (northern site) grain size statistics ............................. 70
25 Aalikuppam Pit 1 (northern site) grain size statistics ................................. 71
26 Vailanganni Pit 1 (southern site) grain size statistics ................................. 72
27 Thiruvadandhai transect grain size statistics............................................... 77
28 Mamallapuram transect grain size statistics ............................................... 78
29 Aalikuppam transect grain size statistics .................................................... 79
30 Comparison to Srinivasalu et al. (2007) along a transect ........................... 81
31 Comparison to Srinivasalu et al. (2007) in an individual pit ...................... 81
A1 Stratigraphic column and description of Karikattakuppam Pit 1 .............. 100
A2 Stratigraphic column and description of Karikattakuppam Pit 2 .............. 101
A3 Stratigraphic column and description of Karikattakuppam Pit 3 .............. 102
A4 Stratigraphic column and description of Karikattakuppam Pit 4 .............. 103
A5 Stratigraphic column and description of Muttukaddu Pit 1 ...................... 104
A6 Stratigraphic column and description of Kovalam Pit 1 ........................... 105
x
LIST OF FIGURES (continued)
Figure Page
A7 Stratigraphic column and description of Thiruvadandhai Pit 1 ................ 106
A8 Stratigraphic column and description of Thiruvadandhai Pit 2 ................ 107
A9 Stratigraphic column and description of Thiruvadandhai Pit 3 ................ 108
A10 Stratigraphic column and description of Thiruvadandhai Pit 4 ................ 109
A11 Stratigraphic column and description of Thiruvadandhai Pit 5 ................ 110
A12 Stratigraphic column and description of Thiruvadandhai Pit 6 ................ 111
A13 Stratigraphic column and description of Thiruvadandhai Pit 7 ................ 112
A14 Stratigraphic column and description of Vadanemelli Pit 1 ..................... 113
A15 Stratigraphic column and description of Mamallapuram Pit 1 ................. 114
A16 Stratigraphic column and description of Mamallapuram Pit 2 ................. 115
A17 Stratigraphic column and description of Mamallapuram Pit 3 ................. 116
A18 Stratigraphic column and description of Mamallapuram Pit 4 ................. 117
A19 Stratigraphic column and description of Mamallapuram Pit 5 ................. 118
A20 Stratigraphic column and description of Mamallapuram Pit 6 ................. 119
A21 Stratigraphic column and description of Aalikuppam Pit 1 ...................... 120
A22 Stratigraphic column and description of Aalikuppam Pit 2 ...................... 121
A23 Stratigraphic column and description of Aalikuppam Pit 3 ...................... 122
A24 Stratigraphic column and description of Aalikuppam Pit 4 ...................... 123
A25 Stratigraphic column and description of Cuddalore Pit 1 ......................... 124
A26 Stratigraphic column and description of Tranquebar Pit 1 ....................... 125

xi
LIST OF FIGURES (continued)
Figure Page
A27 Stratigraphic column and description of Karaikal Pit 1 ............................ 126
A28 Stratigraphic column and description of Karaikal Pit 2 ............................ 127
A29 Stratigraphic column and description of Kallar Pit 1 ............................... 128
A30 Stratigraphic column and description of Kallar Pit 2 ............................... 129
A31 Stratigraphic column and description of Vailanganni Pit 1 ...................... 130
A32 Stratigraphic column and description of Vailanganni Pit 2 ...................... 131
A33 Stratigraphic column and description of Vailanganni Pit 3 ...................... 132
A34 Stratigraphic column and description of Puthupalli Pit 1 ......................... 133
A35 Stratigraphic column and description of Vilundamavadi Pit 1 ................. 134
A36 Stratigraphic column and description of Vilundamavadi Pit 2 ................. 135
A37 Stratigraphic column and description of Pushpavanam Pit 1 ................... 136
A38 Stratigraphic column and description of Vedaranyam Pit 1 ..................... 137
A39 Stratigraphic column and description of Vedaranyam Pit 2 ..................... 138
A40 Stratigraphic column and description of Vedaranyam Pit 3 ..................... 139
B1 Sieve mean vs. Mastersizer mean Mamallapuram Pit 1 ........................... 141
B2 Sieve sorting vs. Mastersizer sorting Mamallapuram Pit 1 ...................... 142
B3 Sieve skewness vs. Mastersizer skewness Mamallapuram Pit 1 .............. 142
B4 Sieve kurtosis vs. Mastersizer kurtosis Mamallapuram Pit 1 ................... 143
C1 Satellite image of northern site 1 Pulicat Lagoon ..................................... 152
C2 Satellite image of northern sites 2-8 ......................................................... 153
xii
LIST OF FIGURES (continued)
Figure Page
C3 Satellite image of southern sites 9-17 ....................................................... 154
C4 Tsunami-damaged house at Karikattakuppam .......................................... 155
C5 Karikattakuppam Pit 2 .............................................................................. 156
C6 Muttukaddu Pit 1 ...................................................................................... 157
C7 Tsunami scour fan at Thiruvadandhai....................................................... 158
C8 Thiruvadandhai Pit 3 ................................................................................. 159
C9 Tsunami scour fan at Vadanemelli ........................................................... 160
C10 Mamallapuram Pit 2 .................................................................................. 161
C11 Tsunami flotsam line in swale at Aalikuppam .......................................... 162
C12 Aalikuppam Pit 4 ...................................................................................... 163
C13 Aalikuppam seaward beach ridge laminations ......................................... 164
C14 Karaikal Pit 1 ............................................................................................ 165
C15 Uncertain tsunami boundary at Vailanganni Pit 2 .................................... 166
C16 Vedaranyam Pit 1 ...................................................................................... 167
1
CHAPTER I
INTRODUCTION
Purpose
The impact of the 2004 Indian Ocean tsunami focused attention on the region and
scientists began investigating for evidence of past large events. Recent paleotsunami and
paleoseismic research around the Indian Ocean Basin (Monecke et al., 2008; Jankaew et
al., 2008; Rajendran et al., 2007: Bilham et al., 2005; Kowalik et al., 2005; Okal and
Synolakis, 2008) indicates that earthquake-generated tsunami have occurred in this
region in the past (Monecke et al., 2008; Jankaew et al., 2008). The largest of these could
have traversed the ocean and reached the southeastern coast of India, which highlights the
importance of identifying key preservation sites in this potential repository of
catastrophic basin-wide events. However, geologically enduring sites where tsunami
deposits dependably survive are not yet well defined in India and other tropical
environments. Despite paleotsunami substantiation in Sumatra, Thailand and The
Andaman Islands (Monecke et al., 2008; Jankaew et al., 2008: Rajendran et al., 2007),
and the possible existence of paleotsunami sediments at three different field sites in India
(Srinivasalu, 2010), no conclusive evidence of paleotsunami deposits has been discovered
in mainland India to date.
The December 26th
2004 Indian Ocean tsunami was generated by a Mw = 9.0-9.3
earthquake (Kanamori, 2006; Kowalik et al., 2005) associated with a rupture zone of
approximately 1300 km (Bilham et al., 2005) with an epicenter off the northern coast of
Sumatra at 3.307°N, 95.947°E (Merrifield et al., 2005). The event occurred as a result of

2
subduction-related stresses along the Indo-Andaman plate boundary. The rupture
occurred at 06:29 India Standard Time (IST) (Chadha et al., 2005). The first wave struck
the coast of India nearly three hours later at approximately 09:25 IST (Srinivasalu et al.,
2007) after traveling approximately 1300 km.
The purpose of this project is to provide baseline data for future investigations of
paleotsunami deposits by characterizing the geomorphic environments that have
preserved evidence of the 2004 tsunami on the southeastern coast of India in the state of
Tamil Nadu (Figure 1, Figure 2). The Holocene stratigraphy in northern Sumatra and
coastal Thailand includes sand sheets that may record multiple, great tsunamis within the
last 2800 years; the most recent of these occurred 550-700 years ago (Jankaew et al.,
2008; Monecke et al., 2008). If there is stratigraphic evidence of these paleotsunami
events in India, it may provide increased insight into the recurrence interval and extent of
inundation of large, basin-wide events within the Indian Ocean which could reduce future
loss of lives and property. There is sedimentological and paleontological evidence at
three different field sites in southeastern India that suggest possible tsunami events about
700 and 980 years ago (Srinivasalu, 2010). Extending the number of Indian field sites
with strong evidence of paleotsunami deposits could help to substantiate those initial
findings. Because prehistoric tsunami deposits in tropical latitudes are still elusive due to
relatively high weathering rates and typically sand-dominated grain size (Rhodes et al.,
2006), this project will provide additional data to better characterize the physical settings
conducive to the accumulation and preservation of tsunami deposits in southeastern India
and similar environments.

3
Hypotheses
The hypotheses for this study were 1) the aseismic, tropical southeastern coast of
India would contain stable geomorphic environments for the long-term accumulation and
preservation of tsunami deposits. 2) the 2004 tsunami deposits would be preserved best
on elevated, flat surfaces such as river terraces and behind coastal dunes; 3) there would
be a distinct sedimentological difference between tsunami deposits and preexisting
sediments; and 4) new descriptions in 2008 of tsunami deposits at the same sites where
they were described immediately after the 2004 Indian Ocean tsunami would reveal
similar sedimentological and stratigraphic characteristics.
Objectives
The following objectives were identified to test the above hypotheses:
1) Characterize the geomorphic environments where the 2004 deposits were best
preserved and identifiable. Compare and contrasted those environments with
geomorphic settings where the 2004 sediments were not deposited or
recognizably preserved.
2) Develop a conceptual model based on field descriptions and sedimentological
analysis to distinguish tsunami deposits from preexisting deposits derived from
other sources.
3) Compare data collected immediately following the 2004 event (Srinivasalu et
al., 2007) to data collected in this project to understand whether and how the
deposits have changed in each geomorphic setting.
4
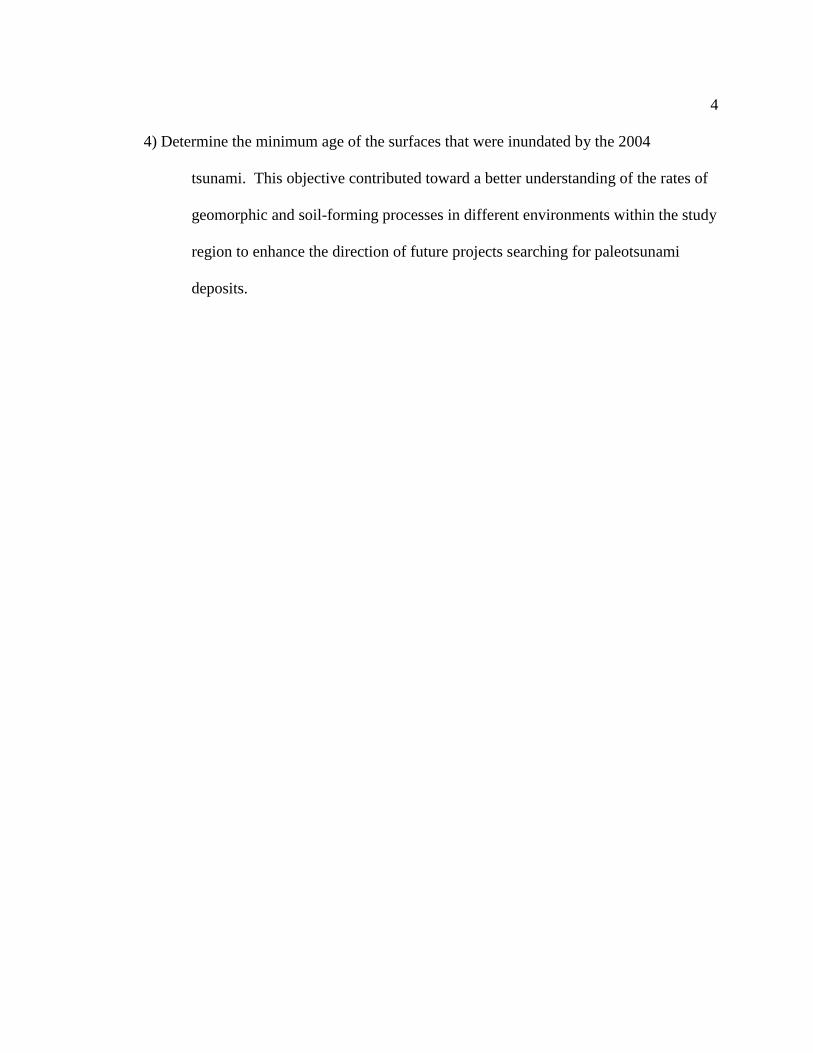
4) Determine the minimum age of the surfaces that were inundated by the 2004
tsunami. This objective contributed toward a better understanding of the rates of
geomorphic and soil-forming processes in different environments within the study
region to enhance the direction of future projects searching for paleotsunami
deposits.

5
Figure 1. Study area and regional context. This project focused on 10-13 N latitude
and 79-83 E longitude. The box around Chennai delineates the detailed map of the
study area in Figure 2.
Thailand
0
N
Sumatra
Myanmar
Bangladesh
India
350 km
Sri Lanka
Approximate Rupture Zone of the 2004 Indian Ocean Tsunami
Tamil Nadu
Chennai
Indian Ocean Nicobar
Islands
Pulicat Lagoonn
Andaman Islands Study
Area
80°
|
76° |
78° |
82° |
84°E |
—12°
—10°
—14°
—16°
—18°N

6
B
Figure 2. Individual study sites. The northern and southern sites were separated based on
a grain size shift at Cuddalore (triangle); A. Northern sites (Google Earth), B. Southern
sites (Google Earth); Inundation distance and run-up heights indicated by length and
height of shaded boxes not drawn to map scale (Peterson et al., 2005); Sites are numbered
as listed in Table 3.
Cauvery River Delta
Ancient beach ridge and swale complex
Indian Ocean
Palar River
India
Tamil Nadu State
N
S
Cauvery River
Ponnaiyar River
1
2
3, 4
12
5
6
7
8
9
10
11
80.0°E |
80.5°E |
79.5°E |
13
14
15
16
17
0 50km
N
Chennai
13.5°N—
13.0°N—
12.5°N—
12.0°N—
11.5°N—
11.0°N—
10.5°N—
A
A
B
Cuddalore
N
S
160 m
3.8 m
150 m
2.9 m
180 m
4.2 m
360 m
3.1 m
340 m
4.3 m
840 m
4.7 m
400 m
4.9 m
800 m
5.5 m

7
CHAPTER II
LITERATURE REVIEW
Geomorphology
An evaluation of the geomorphic setting and geological evolution of a coast is
fundamental to the process of identifying what and where to look for tsunami evidence
(Goff et al., 2009). Tsunami inundation and run-up can be highly variable over relatively
short distances, highlighting the effect of geomorphology on wave dynamics. Tsunami
run-up is the tsunami’s maximum vertical height above sea level at its furthest point
inland. Tsunami inundation is the maximum distance inland that a tsunami wave traveled
relative to the mean swash zone. The mean swash zone we used in this study is the sea
level at approximately high-tide. As documented at over 5300 locations in Japan,
tsunami run-up height tends to be exaggerated up river valleys and on steeper near-coast
topography and tsunami inundation tends to be greater on flat plains, but with less run-up
height as the tsunami energy is dispersed over a larger area (Mori et al., 2011).
Regionally, Tamil Nadu consists of fluvial systems that drain eastward across a
relatively low-relief coastal plain. Near the coast, where the 2004 tsunami inundation
occurred, the geomorphology consists primarily of beaches, seaward beach ridges, swales
and mud flats (Ramasamy et al., 2006a, Ramasamy et al., 2006b). The beaches are
narrow, with a length of 100-300 m, and accompanying swales in most cases do not
extend more than 200 m landward of the beach, except just south of the Cauvery River
delta near Vedaranyam (Fig. 2), where there are several inland beach ridges formed as the
delta prograded (Ramasamy et al., 2006b). The Cauvery River delta (~10.3-10.7°N)
8
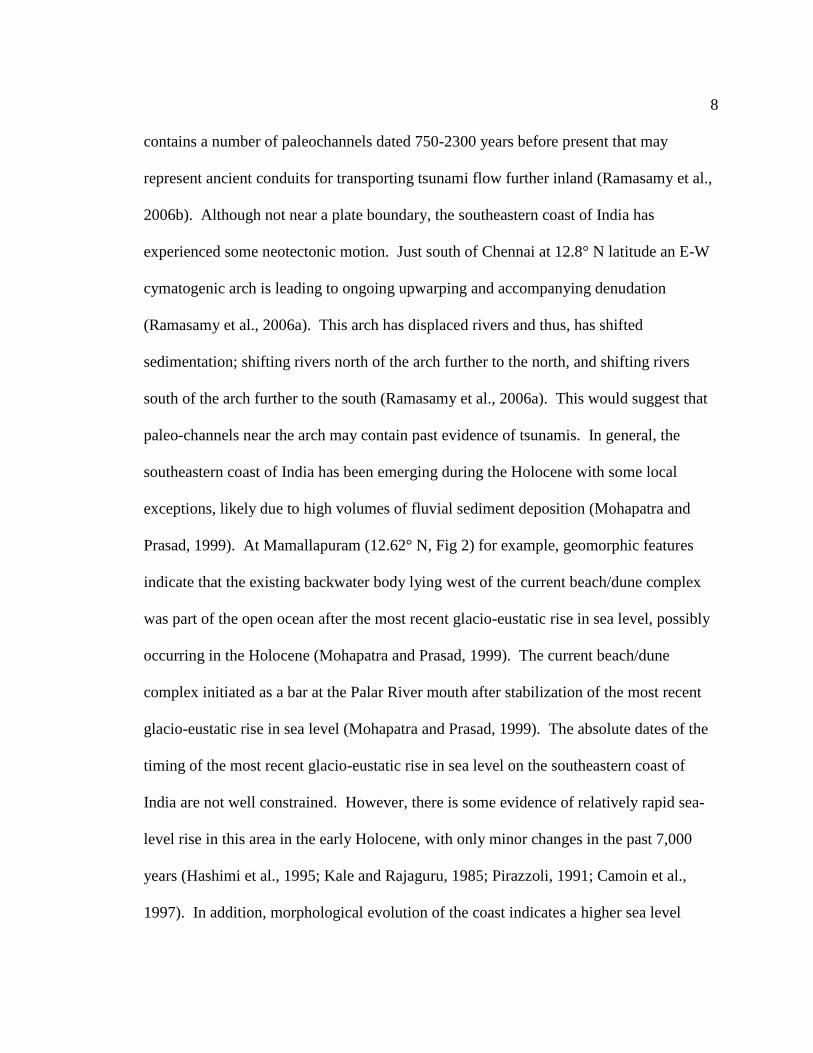
contains a number of paleochannels dated 750-2300 years before present that may
represent ancient conduits for transporting tsunami flow further inland (Ramasamy et al.,
2006b). Although not near a plate boundary, the southeastern coast of India has
experienced some neotectonic motion. Just south of Chennai at 12.8° N latitude an E-W
cymatogenic arch is leading to ongoing upwarping and accompanying denudation
(Ramasamy et al., 2006a). This arch has displaced rivers and thus, has shifted
sedimentation; shifting rivers north of the arch further to the north, and shifting rivers
south of the arch further to the south (Ramasamy et al., 2006a). This would suggest that
paleo-channels near the arch may contain past evidence of tsunamis. In general, the
southeastern coast of India has been emerging during the Holocene with some local
exceptions, likely due to high volumes of fluvial sediment deposition (Mohapatra and
Prasad, 1999). At Mamallapuram (12.62° N, Fig 2) for example, geomorphic features
indicate that the existing backwater body lying west of the current beach/dune complex
was part of the open ocean after the most recent glacio-eustatic rise in sea level, possibly
occurring in the Holocene (Mohapatra and Prasad, 1999). The current beach/dune
complex initiated as a bar at the Palar River mouth after stabilization of the most recent
glacio-eustatic rise in sea level (Mohapatra and Prasad, 1999). The absolute dates of the
timing of the most recent glacio-eustatic rise in sea level on the southeastern coast of
India are not well constrained. However, there is some evidence of relatively rapid sea-
level rise in this area in the early Holocene, with only minor changes in the past 7,000
years (Hashimi et al., 1995; Kale and Rajaguru, 1985; Pirazzoli, 1991; Camoin et al.,
1997). In addition, morphological evolution of the coast indicates a higher sea level

9
around 6,000 years ago (Bruckner, 1989). Archeological data suggests that from the
beginning of the Christian era until the 8th
century, Mamallapuram was a flourishing port
town (Ramaswami, 1989). Currently, the Shore Temple is at the coastline and represents
part of that flourishing port town and is referred to by archeologists as part of the Shore
Temple Complex (Fig. 3). The lack of archeological data for the location of the port
suggests it may be submerged, and offshore bathymetry indicates that the Shore Temple
Complex may extend eastward into the current Indian Ocean (Mohapatra and Prasad,
1999). These factors point toward a potential local relative sea-level rise during the past
1200 years. Although there is some debate about the archeological history, the coastal
geomorphology does not indicate any obvious change in the shoreline during the past
1200 years (Mohapatra and Prasad, 1999).
Figure 3. Mamallapuram Shore Temple Complex. Note lack of a beach berm; photo
taken at mid-tide.

10
The 2004 Indian Ocean Tsunami—Interactions with Geomorphology
While most of the beaches in the state of Tamil Nadu were at least partially
inundated by the 2004 tsunami, landward geomorphic features were affected less
significantly: Mudflats = 85%, swales = 61%, seaward beach ridges = 26% and landward
beach ridges = 3% (Ramasamy et al., 2006a). These numbers indicate that roughly 39%
of seaward beach ridges acted as maximum inundation barriers for the 2004 tsunami on
the southeastern coast of India and 74% of landward beach ridges acted as maximum
inundation barriers when present. Furthermore, the majority of mudflats and swales were
affected by the 2004 tsunami. This information directs paleotsunami researchers towards
areas of the coast where landward beach ridges are not present or where drainages allow
the tsunami to bypass the landward beach ridges. It also suggests that paleo-swales and
paleo-mudflats may be advantageous locations for preservation of paleotsunami deposits.
The mouths of multiple rivers were blocked or partially blocked with sand bars as a result
of the 2004 tsunami inundation. These rivers included the Kuvam River in Chennai, the
Adyar River in Chennai, the Pallar River south of Mamallapuram, the Ponnaiyar River at
Cuddalore, and the Gadilam river south of Cuddalore (Vaidyanadhan, 2005). These
barriers were removed by subsequent river erosion within months of the event. Likewise,
shoreline erosion was common in many countries but only acted as a short-term change
on many coasts which recovered within months of the event (Choowong et al., 2007;
Richmond et al., 2006). Waterways such as rivers and canals acted as propagating agents
for the 2004 tsunami waves, allowing them to bypass barriers and inundate further inland
than adjacent areas (Ramasamy et al., 2006a).

11
Earthquakes and Tsunamis in the Indian Ocean Basin
At many sites around the Indian Ocean basin, the initial 2004 tsunami wave was
not the highest amplitude (Merrifield et al., 2005). For the waves to reach the
southeastern coast of India in less than three hours they must have had an average
velocity greater than 450 km/h. The southeastern coast of India was inundated by three
waves arriving at five minute intervals (Srinivasalu et al., 2007), the second one being the
highest amplitude (Chadha et al., 2005). The second and third waves surged over the
southeastern Indian coast before the first wave completely retreated (Srinivasalu et al.,
2007). Tide gauges measured the tsunami wave amplitude as high as 2.17 m near the
rupture zone immediately following the earthquake, and open ocean heights were
measured by satellite as 0.60 m two hours after the event (Merrifield et al., 2005). The
tsunami waves reached heights of 1.5 m at the tide gauge near Chennai prior to striking
the southeastern Indian coast (Titov et al., 2005). The great magnitude of the event
reached tide gauge heights of 0.2 m in Australia and Antarctica and 0.1 m in Africa and
South America, though no direct tsunami damage was recorded outside the Indian Ocean
basin (Titov et al., 2005). Wave size, orientation and global propagation patterns of the
2004 tsunami, as measured by tide-gauges, satellite altimetry and model simulations,
were mainly resolved by direction and intensity of the seismic source (Titov et al., 2005).
Once outside of the Indian Ocean, mid-ocean ridges acted as topographic waveguides
focusing and trapping tsunami energy along their path (Titov et al., 2005).
The style of motion along the Indo-Andaman plate boundary during the
December 26th
, 2004 earthquake was both convergent and strike-slip, which in the
12
northern Andaman Islands is driven by back-arc spreading (Bilham et al., 2005). Prior to
the shallow 2004 megathrust, recent seismicity along this plate boundary has occurred at
deeper depths further to the east: 1847 (Mw = >7.5), 1881 (Mw = 7.9), 1941 (Mw = 7.7)
(Bilham et al., 2005). Subsidence during the 2004 event in the Nicobar Islands was
measured as 1-4 m with accompanying uplift in the Andaman Islands of 1-2 m (Bilham et
al., 2005). These measurements are concordant with a down-dip fault width of 150-180
km and a slip of 7-23 m (Bilham et al., 2005).
Before the 2004 event, GPS measurements in the Andaman Islands show a
convergence rate of 14 mm/year signifying that large earthquakes with comparable slip to
the 2004 earthquake are unlikely to occur more often than once every 1000 years (Bilham
et al., 2005). However, the convergence rate near the epicenter of the 2004 earthquake
was higher, which yields a recurrence interval as low as 400 years (Bilham et al., 2005).
The extent of damage caused by the 2004 Indian Ocean tsunami in far-field sites
such as India, Sri Lanka and Somalia is without equal in the historical record (Bilham et
al., 2005; Dominey-Howes, 2007; Kumar and Achyuthan, 2006), and as such,
unanticipated. The 1881 Mw = 7.9 Car-Nicobar earthquake generated a tsunami with a
maximum amplitude in Nagapattinam on the southeastern coast of India (10.76°N) of
only 0.90 m, with no recorded damage (Okal and Synolakis, 2008). In an analysis of
what types of Sumatra-Andaman ruptures can reproduce tsunamis, Okal and Synolakis
(2008) modeled worst-case scenario tsunami-generating megathrust earthquakes and their
potential impacts on far-field sites like India. Other than the 2004 rupture, only one
worst-case scenario would have a catastrophic effect on the southeastern coast of India.
13
Thus, a tsunami that is capable of deposition on the southeastern coast of India would
most likely result from the Sumatra-Andaman rupture zone of the 2004 event.
Thailand, Sumatra, the Andaman islands and Sri Lanka have records of
paleotsunamis in the Indian Ocean basin (Jankaew et al., 2008; Monecke et al., 2008;
Rajendran et al., 2007; Jackson et al., 2008; Rajendran et al., 2013). Thailand has a
radiocarbon-dated tsunami-laid sand sheet 550-700 years old and Sumatra has a well-
correlated radiocarbon dated tsunami-laid sand sheet that is 600 years old (Jankaew et al.,
2008; Monecke et al., 2008). Another potential tsunami occurred around 1000 years ago
based on radiocarbon evidence from a Sumatran sand sheet that exhibits tsunami-like
sedimentary features (1000-1200 years old), as well as dead mangrove vegetation and
peat layers radiocarbon dated 900-1000 years old in the Andaman Islands (Monecke et
al., 2008; Rajendran et al., 2007).
Tsunamis reaching the southeastern Indian coast are rare. Tide gauges have
measured four distinct tsunami events between 1881 and December 26th
, 2004: 1881,
1883, 1907 and 1941 (Srinivasalu et al., 2007). However, no geologic evidence has been
documented for these events in India, which are thus far only recorded in local history.
Tsunami Sedimentation
Recent tsunami research shows that tsunami sediments are difficult to characterize
and exhibit significant spatial variation regionally and between sites (Dawson and Shi,
2000; Gelfenbaum and Jaffe, 2003; Goff et al., 2004; Richmond et al., 2006; Srinivasalu
et al., 2007). In some cases, tsunami deposits have similar characteristics in different
regions. For example, paleotsunami deposits in swales between beach ridges in Sumatra
14
and Thailand both show normal grading (Monecke et al, 2008; Jankaew et al., 2008).
These local topographic lows, which produces normal grading due to decreased velocity
after initial tsunami inundation, create areas of ponded water that, in this case, were
relatively unaffected by subsequent tsunami backwash. This example agrees with
literature that suggests antecedent topography is a major factor affecting tsunami
sedimentation (Morton et al., 2007). Even in well studied areas such as Tohoku, Japan,
the expected limit of tsunami inundation was underestimated as a result of a poor
understanding of the extent of paleotsunami deposits (Mori et al., 2011; Sawai et al.,
2012). The 2011 Tohoku event led to over 15,000 deaths in an area where extensive
tsunami monitoring and countermeasures were in place to reduce inundation potential,
highlighting the importance of accurate mapping and characterization of tsunami
deposits.
Many sandy paleotsunami deposits around the world are relatively easy to
recognize because they are interbedded with finer-grained, muddy sediments (lagoons,
peat marshes), representing a sharp difference in depositional energy (Atwater, 1987;
Monecke et al., 2008; Jankaew et al., 2008). However, much of India’s southeastern
coastal plain is composed of fine to medium sand, so defining distinctive sedimentary
characteristics of tsunami deposits is integral to identifying a sandy paleotsunami deposit
that is interbedded with sands deposited by other processes.
In this project, I compared the stratigraphy from the 2004 tsunami to that of the
underlying layers at 24 sites along the southeastern coast of India (10.4-13° N. latitude).
Mechanisms for sand transport along this stretch of coast include wind, tidal currents,
15
average and storm waves, cyclones, and rivers. As hurricanes and tsunami are both
major events; there is potential for their sediment deposits to share similar physical
characteristics. Although the differentiation of storm and tsunami deposits has been
discussed generally (Dawson and Shi, 2000; Morton et al., 2007; Nanayama et al., 2003),
more investigation is necessary to further distinguish between these two types of coastal
deposits.
Tsunami and storm deposits are both generally characterized by sheets of sand
(Dawson and Shi, 2000; Morton et al., 2007). In vertical stratigraphic sections, criteria
that may be useful for differentiating tsunami and storm deposits include composition,
textures, grading, types of stratification and number of lamina (Dawson and Shi, 2000;
Goff et al., 2004; Morton et al., 2007; Nanayama et al., 2000). Mud rip-up clasts are
common in tsunami deposits but rare in storm deposits because storms are longer events
and the extended agitation disaggregates and diffuses the mud (Morton et al., 2007).
Mud laminations might be present within and at the top of tsunami deposits, as a result of
suspended-sediment transport followed by sufficient time between tsunami waves for silt
and clay to settle out of suspension. In contrast, storm deposits tend to lack the inner
mud laminations that result from the constant, fast, nearly unidirectional flow of tsunamis
(Morton et al., 2007). Although inverse grading is common in storm deposits, it is
atypical in tsunami deposits because inundation and backflow of tsunami waves tends to
involve decelerating flow (Gelfenbaum and Jaffe, 2003; Morton et al., 2007). Both
tsunami and storm deposits may be massive or have planar stratification. Sedimentary
structures other than planar stratification such as foresets, backsets and climbing ripples

16
are also common in storm deposits due to the low flow depths, varying flow velocities
and mainly bed-load transport characteristic of storms (Morton et al., 2007).
Regional-scale variation in tsunami sand characteristics can be extreme. There is
no single set of diagnostic characteristics that can be applied universally. Some traits that
do not consistently differentiate tsunami and storm deposits include sorting, occurrence
and distribution of heavy minerals and character of the basal contact. Both storm and
tsunami deposits can be well to poorly sorted, both may contain heavy-mineral lamina
because the heavy minerals are source dependent, and basal contacts for storm and
tsunami deposits are typically sharp and distinct (Morton et al., 2007). Conversely, some
studies show that storm deposits are better sorted and lack the erosional boundary found
in tsunami deposits (Goff et al., 2004; Nanayama et al., 2000).
Transect-scale characteristics of tsunami deposits that might be diagnostic include
geometry, landscape conformity, deposit elevation, extent of inundation and sediment
transport distances (Morton et al., 2007). These characteristics are dependent upon the
geomorphology of the site. The geomorphic characteristics of tsunami deposits are
strongly related to the sand availability, embayment type, nature of the coast,
accommodation space and landward environmental conditions such as vegetation and
topography (Goff et al., 2009). Interaction with local bathymetry and topography has a
significant impact on sedimentary characteristics of deposits generated by tsunami and
storm events and may account for some differences between regions. However, one
example of a signature landform made by tsunami waves is a tsunami scour fan (Goff et
al., 2009), which occurs when an oncoming tsunami wave cuts a breach into a dune ridge
17
and reworks the dune material to form a fan landward of the dune as a result of oncoming
flow, or seaward of the dune as a result of backwash. These fans have been documented
in Japan, Chile, Kamchatka, and New Zealand (Kitamura et al., 1961; Bourgeois and
Reinhard, 1989; MacInnes et al., 2005; Goff et al., 2009). In India these fans had
associated plunge pools just seaward of the tsunami scour fan. These plunge pools are an
erosional remnant of the cut that the tsunami made in the beach ridge and represent a
zone of no deposition by the inundation of the tsunami wave. Another consistent
geomorphic signature of tsunamis is decimeter-scale hummocky topography primarily
resulting from an erosional contact (Goff et al., 2004; Jaffe and Gelfenbaum, 2007; Goff
et al., 2009).
Sedimentologically, tsunami deposits tend to be < 25 cm in thickness (Atwater,
1987; Dawson and Shi, 2000; Gelfenbaum and Jaffe, 2003; Morton et al., 2007;
Richmond et al., 2006; Srinivasalu et al., 2007) and drape the preceeding topography
with broad sheets. In contrast, some storm surge deposits are > 30 cm thick and form
thick sand lenses in topographic low spots near the shoreline (Morton et al., 2007). The
1993 Hokkaido-nansei-oki tsunami and the 1959 Miyakojima typhoon, which both
affected northern Japan, show distinct differences (Nanayama et al., 2000). The storm
deposits displayed foreset bedding and better sorting than the tsunami deposits
(Nanayama et al., 2000). It seems that the only traits that consistently differentiates
tsunami deposits in different locales is their greater regional inundation distance which
allow them to transport sediment further inland than most storm deposits, and the
common presence of tsunami scour fans. This attribute allows deposition in some
18
unique, inland repositories that are removed from tidal influences and reworking from
subsequent storm events.
It has been demonstrated that skewness and kurtosis have the potential to aid in
identifying differences among beach, dune and eolian-flat deposits. In Texas, eolian flat
deposits provided uniform mean grain size and very good sorting which was only slightly
altered after deposition by dune or beach environments (Mason and Folk, 1958). The
beach samples had near-symmetrical skewness and were mesokurtic (normally peaked),
the dune samples were skewed toward fine particles and mesokurtic, the eolian-flat
samples were fine—skewed and leptokurtic (excessively peaked); the differences in these
sediments were recorded in only the tails of the grain size curves (Mason and Folk,
1958). It is plausible that the high-energy, low-energy contrast that occurs during
tsunami sediment deposition would lead to predictable kurtosis measurements, and
possibly aid in identifying tsunami deposits around the world.
December 26th
, 2004 Tsunami Deposits Around the Indian Ocean Basin
Sediments from the 2004 tsunami that were deposited along the Malaysia-
Thailand Peninsula commonly showed normal grading where topography allowed
waning flow or inhibited backwash (Hawkes et al., 2007). Coarser, massive sand units
and one inversely graded sequence represented high-energy uprush flow at other sites
(Hawkes et al., 2007). Likewise, two studies in northern Sumatra found normal grading,
inverse grading and massive units in the 2004 tsunami deposits (Monecke et al., 2008;
Richmond et al., 2006) and one study of the 2004 tsunami deposits in Thailand found
normal grading in beach swales (Jankaew et al., 2008). Depositional characteristics were
19
largely due to flow patterns that were directed by local topography and offshore
bathymetry (Richmond et al., 2006). When grain size data could not distinguish tsunami
sediment from the pre-tsunami sediment on the Malaysia-Thailand Peninsula,
foraminiferal grouping could—either the foraminifera were not present in the pre-tsunami
sand or the assemblage was markedly different in the tsunami sand (Hawkes et al., 2007).
Overall, tsunami deposits in Sri Lanka, the Maldives and Indonesia were widespread,
locally variable and thin with no significant geomorphological features being created
(Richmond et al., 2006). In Thailand and Sumatra, detection of the 2004 tsunami
deposits was good in the beach swales where soil is peaty or silty (Jankaew et al., 2008;
Monecke et al., 2008), as well as on the sandy soils of the beach ridge crests (Jankaew et
al., 2008).
Marine diatoms have been used as supportive evidence when identifying 2004
tsunami deposits (Jankaew et al., 2008; Monecke et al., 2008; Seralathan et al., 2006;
Srinivasalu et al., 2007). The 2004 tsunami deposits in Thailand and Sumatra contain
diatoms, but diatoms are rare in older tsunami-laid sand sheets because of the relatively
high rate of silica dissolution (Kamatani, 1982) in the hot, wet tropical environments
(Jankaew et al., 2008; Monecke et al., 2008).
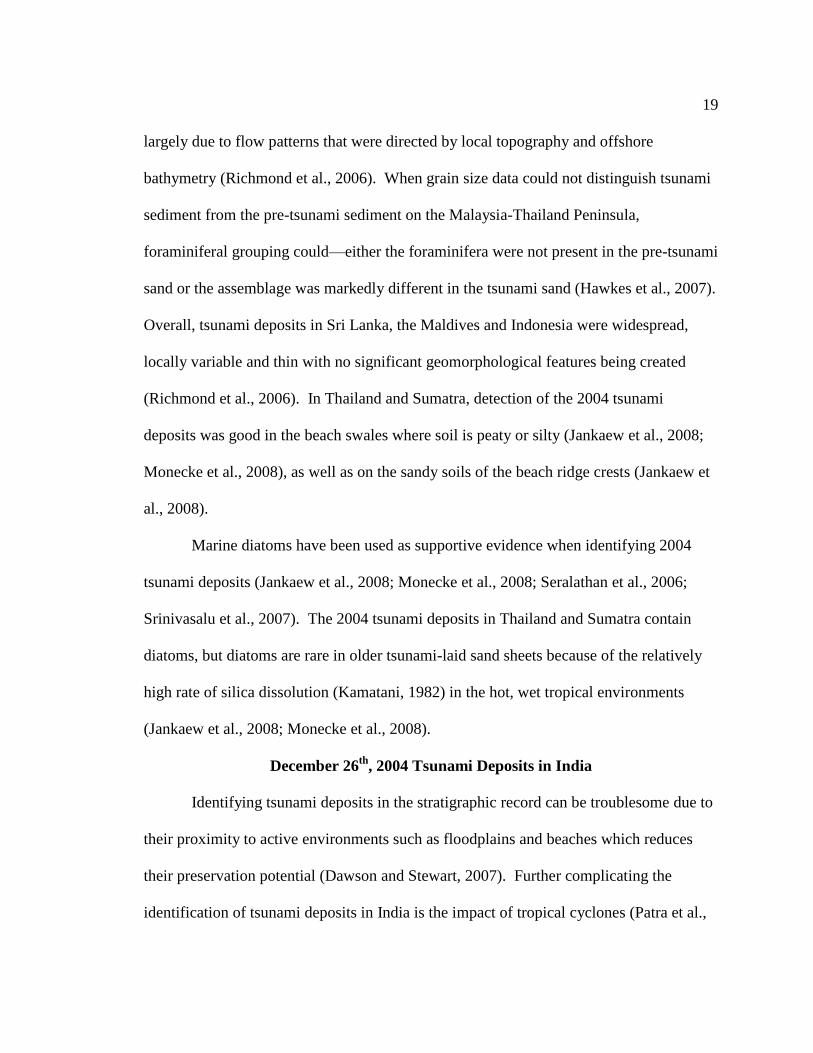
December 26th
, 2004 Tsunami Deposits in India
Identifying tsunami deposits in the stratigraphic record can be troublesome due to
their proximity to active environments such as floodplains and beaches which reduces
their preservation potential (Dawson and Stewart, 2007). Further complicating the
identification of tsunami deposits in India is the impact of tropical cyclones (Patra et al.,

20
2000). These cause overwash events which produce sandy deposits that share many
characteristics with tsunami deposits.
In addition to the damage caused by the 2004 Indian Ocean tsunami on the
southeastern coast of India, it also wrapped around the southern tip of India and struck
the southwestern coast with considerable force. Although this caused more than 200
deaths and about $1 million in damage (Prakash et al., 2005); tsunami sediments
deposited on the southwestern coast of India have not yet been identified. Near Chennai,
run-up ranged from 1-5 meters and inundation reached 300 meters (Prakash et al., 2005).
On the Cauvery River delta in the south (10.7° N), all of these parameters are
significantly greater: Inundation was as far as 840m, runup was as high as 8.89m, and
maximum sand transport distance was as far as 430m (Peterson et al., 2005; Yeh et al.,
2007).
The sediment on the southeastern coast of India is derived from 2.6 Ga exposed
basement granulite known as the Southern Granulite Terrain (SGT) (Balasubrahmanyan,
2006). The heavy tropical weathering of the SGT has left quartz-rich sands on the
southeastern coast of India ranging from ~9ºN to ~13.5ºN latitude (Balasubrahmanyan,
2006). The predominantly quartz sand consists of a number of colors including clear,
rose and purple (Seralathan et al., 2006). Other minerals present on the beaches of Tamil
Nadu include a colorless garnet, colorless kyanite and trace amounts of glaucophane,
actinolite, tremolite, zircon, chlorite, tourmaline, biotite, ilmenite and magnetite
(Seralathan et al., 2006). This quartz-rich sand represents the available sediment for
transport during the 2004 Indian Ocean tsunami. Overall, the sand is medium-grained in
21
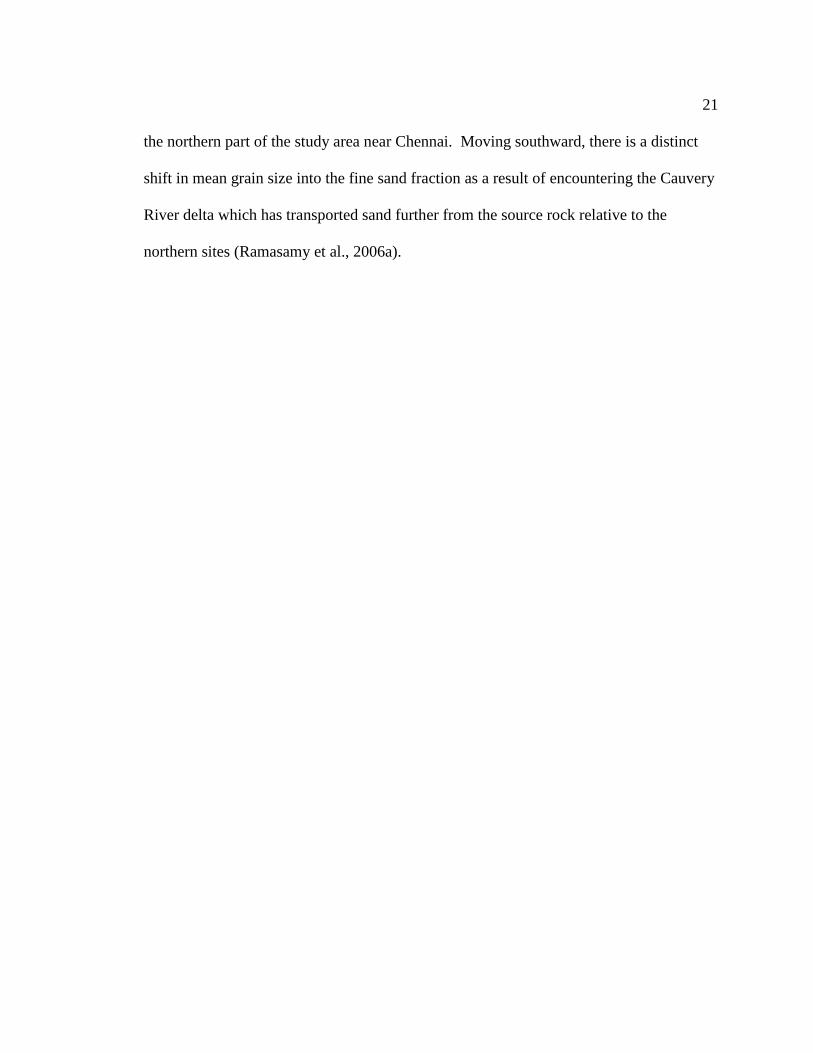
the northern part of the study area near Chennai. Moving southward, there is a distinct
shift in mean grain size into the fine sand fraction as a result of encountering the Cauvery
River delta which has transported sand further from the source rock relative to the
northern sites (Ramasamy et al., 2006a).

22
CHAPTER III
METHODS
Field Methods
In February 2008, the 2004 tsunami deposits were described and sampled at
previously documented sites (Srinivasalu et al., 2007; Srinivasalu, personal
communication, 2008), as well as undescribed sites, to determine the maximum inland
extent of recognizable stratigraphic layers at those locations (Fig. 2). Multiple sites that
had no recognizable 2004 tsunami deposits were visited and documented for location and
geomorphic context. Study sites were chosen based on geomorphic setting and
documentation of previous inundation by tsunami. A handheld GPS unit was used with
the WSG84 datum to measure latitude and longitude in decimal degrees at each sampling
location.
Cores, auger holes and test pits were excavated at several locations within each
site to determine the best sites to excavate trenches for more detailed stratigraphic
descriptions. The typical pit orientation was parallel to the coast. Stratigraphy and
sedimentary structures were described in the field for all deposits: color, density (loosely
or tightly packed), grain size, roundness, unit thickness, grading, sedimentary structures,
nature of the contacts between units, and relative moisture. The following characteristics
were documented for presence or absence: mafic laminations, roots, anthropogenic
artifacts, shells, clay rip-up clasts, tsunami debris such as tree limbs, depth to water table,
organic boundary material, oxidation/reduction, flame and load cast structures, and
bioturbation.

23
Sampling techniques were different for the northern and southern sites (Fig. 2).
One pit at each northern site was designated for a more detailed stratigraphic description;
this pit generally had the thickest recognizable tsunami deposit based on field
observations. At these detailed pits, multiple samples were taken within the identified
tsunami sediment at the smallest possible intervals (generally 2 cm), and along
stratigraphic boundaries such as changes in color and grain size. These samples were
retained for grain-size analysis in the laboratory to identify the mean, sorting, skewness
and kurtosis of the sediment size distributions throughout each deposit. Multiple samples
were also taken below the tsunami sediment units, when possible, to contrast the
sedimentological statistics at each site. Other pits dug at the same site were described in
equivalent detail but sampled more modestly, generally one sample within the tsunami
deposit and one below the tsunami deposit to contrast the tsunami sediment from
preexisting sediment units. At least 250 grams (estimated) of sediment was collected for
each sample to ensure adequate sedimentary analysis and archive enough for reanalysis if
necessary. In the southern sites, units were described in detail but sampled very
modestly: one sample was taken within the tsunami deposit and one sample was taken
below the tsunami deposit.
Landward beach ridges, which typically acted as maximum inundation barriers,
were sampled at some sites to determine whether they contributed sediment to the 2004
tsunami deposits.
The 2004 tsunami sand was identified in the field by: 1) abrupt, hummocky lower
boundary indicative of erosion, 2) mafic mineral laminations, 3) tan colored sand relative

24
to underlying oxidized sand, and 4) presence of organic material at lower boundary.
Many deposits lacked mafic mineral laminations and were massive. There were also
multiple deposits that lacked organic debris at the lower boundary. In order to be
classified as distinct, the tsunami deposits needed to meet 1 and 2 or 1, 3 and 4, or all four
criteria.
Study Sites
Srinivasalu et al.(2007) documented the sedimentary characteristics at multiple
sites a few days after the 2004 tsunami (Sites 5, 6, and 7, Fig. 2). As part of this study,
these sites were resampled and redescribed along similar transects in an effort to
understand if and how the deposits had changed more than three years after the event. In
general, these transects were described and sampled for stratigraphy in multiple pits at 50
m intervals, following the sampling pattern of Srinivasalu et al. (2007). In some cases,
the erosive inland extent of the tsunami was more than 50 m from mean tide level, as
determined from test pits, forcing the initial pit to be farther inland (for example:
Mamallapuram pit 1 = 120 m). When tsunami stratigraphy was unclear, it was also
necessary to increase the 50 m established interval (for example: Mamallapuram pit 1 =
120 m, Mamallapuram pit 2 = 200 m).
Additional sites in different geomorphic settings, for which there is no
sedimentary data published, were also described and sampled in detail to characterize a
greater breadth of geomorphic settings and gain better understanding of variation along
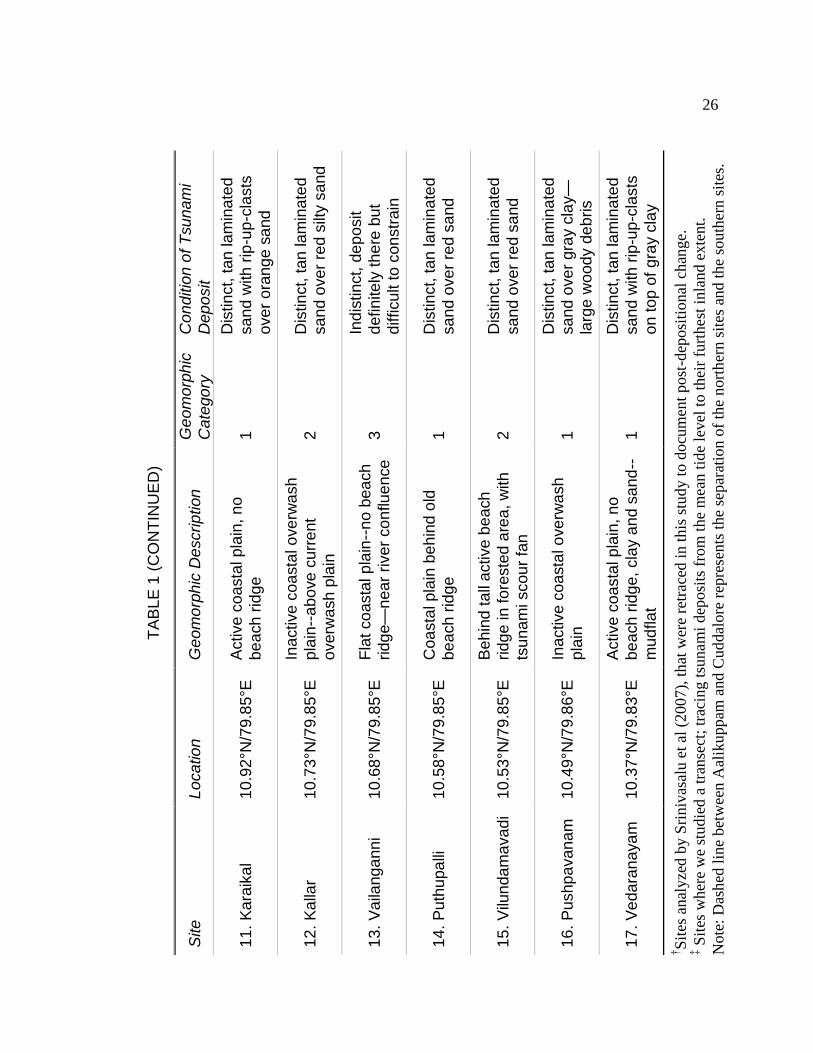
the southeastern coast of India (Table 1). Using high-resolution Quick Bird satellite

25
TA
BL
E 1
. G
EO
MO
RP
HIC
SU
MM
AR
Y
Con
ditio
n o
f T
su
na
mi
Dep
osit
Non
e
Dis
tin
ct,
tan
san
d o
ve
r
red
cla
y
Dis
tin
ct,
tan
la
min
ate
d
sa
nd
ove
r gre
y c
lay
Ind
istinct, s
om
e
lam
ina
tio
ns
Dis
tin
ct,
tan
la
min
ate
d
sa
nd
ove
r re
d s
and
Dis
tin
ct,
red
la
min
ate
d
sa
nd
ove
r gre
y s
and
Dis
tin
ct,
tan
la
min
ate
d
sa
nd
ove
r re
d s
and
Ind
istinct, p
resu
ma
bly
the
re
Ind
istinct, t
an
san
d o
ver
red
sa
nd
Dis
tin
ct,
tan
la
min
ate
d
sa
nd
ove
r ora
nge
san
d
Ge
om
orp
hic
Cate
go
ry
4
1
4
1
2
2
1
3
3
4
Ge
om
orp
hic
Description
La
go
on
Be
hin
d s
ho
rt b
ea
ch
ridg
e
La
go
on
Be
ach s
wa
le b
eh
ind
sh
ort
be
ach
rid
ge
--veg
eta
ted
Be
hin
d b
ea
ch r
idg
e, flat
co
asta
l p
lain
with t
suna
mi
tsu
na
mi scou
r fa
n
Be
hin
d b
ea
ch r
idg
e, flat
co
asta
l p
lain
with t
suna
mi
sco
ur
fan
Be
hin
d b
ea
ch r
idg
e, flat
co
asta
l p
lain
with t
suna
mi
sco
ur
fan
Be
ach s
wa
le n
ea
r river
co
nflue
nce
Ove
rwa
sh
pla
in,
ve
geta
ted
ne
ar
river
con
flu
en
ce
Active
coa
sta
l p
lain
, n
ea
r
lag
oon
Lo
ca
tio
n
13
.40
°N/8
0.3
1°E
12
.83
°N/8
0.2
5°E
12
.79
°N/8
0.2
3°E
12
.79
°N/8
0.2
5°E
12
.75
°N/8
0.2
5°E
12
.73
°N/8
0.2
4°E
12
.61
°N/8
0.2
0°E
12
.44
°N/8
0.1
4
11
.74
°N/7
9.7
8°E
11
.02
°N/7
9.8
5°E
Site
1.
Pu
licat
La
goo
n
2.
Ka
rikatt
aku
ppa
m
3.
Mu
ttu
ka
dd
u
4.
Ko
va
lam
5.
Thiruvad
and
ha
i†‡
6.
Vad
an
em
elli
†
7.
Ma
ma
llapu
ram
†‡
8.
Aa
likup
pa
m
9.
Cudd
alo
re†
10
. T
ran
que
ba
r
26
T
AB
LE
1 (
CO
NT
INU
ED
)
Con
ditio
n o
f T
su
na
mi
Dep
osit
Dis
tin
ct,
tan
la
min
ate
d
sa
nd
with
rip
-up
-cla
sts
ove
r ora
ng
e s
and
Dis
tin
ct,
tan
la
min
ate
d
sa
nd
ove
r re
d s
ilty s
and
Ind
istinct, d
ep
osit
de
fin
ite
ly th
ere
bu
t
difficu
lt to
con
str
ain
Dis
tin
ct,
tan
la
min
ate
d
sa
nd
ove
r re
d s
and
Dis
tin
ct,
tan
la
min
ate
d
sa
nd
ove
r re
d s
and
Dis
tin
ct,
tan
la
min
ate
d
sa
nd
ove
r gra
y c
lay—
larg
e w
ood
y d
eb
ris
Dis
tin
ct,
tan
la
min
ate
d
sa
nd
with
rip
-up
-cla
sts
on
to
p o
f g
ray c
lay
†S
ites
anal
yze
d b
y S
riniv
asal
u e
t al
(2007),
th
at w
ere
retr
aced
in t
his
stu
dy t
o d
ocu
men
t post
-dep
osi
tional
chan
ge.
‡ S
ites
wher
e w
e st
udie
d a
tra
nse
ct;
trac
ing t
sunam
i dep
osi
ts f
rom
the
mea
n t
ide
level
to t
hei
r fu
rthes
t in
land e
xte
nt.
Note
: D
ashed
lin
e bet
wee
n A
alik
uppam
and C
ud
dal
ore
rep
rese
nts
the
sep
arat
ion o
f th
e nort
her
n s
ites
and t
he
south
ern s
ites
.
Ge
om
orp
hic
Cate
go
ry
1
2
3
1
2
1
1
Ge
om
orp
hic
Description
Active
coa
sta
l p
lain
, n
o
be
ach
rid
ge
Ina
ctive c
oa
sta
l o
ve
rwa
sh
pla
in--
ab
ove
cu
rre
nt
ove
rwa
sh
pla
in
Fla
t co
asta
l p
lain
--n
o b
ea
ch
rid
ge—
nea
r river
co
nflu
en
ce
Coa
sta
l p
lain
be
hin
d o
ld
be
ach
rid
ge
Be
hin
d t
all
active
be
ach
rid
ge
in
fo
reste
d a
rea
, w
ith
tsu
na
mi scou
r fa
n
Ina
ctive c
oa
sta
l o
ve
rwa
sh
pla
in
Active
coa
sta
l p
lain
, n
o
be
ach
rid
ge,
cla
y a
nd s
an
d--
mu
dfla
t
Lo
ca
tio
n
10
.92
°N/7
9.8
5°E
10
.73
°N/7
9.8
5°E
10
.68
°N/7
9.8
5°E
10
.58
°N/7
9.8
5°E
10
.53
°N/7
9.8
5°E
10
.49
°N/7
9.8
6°E
10
.37
°N/7
9.8
3°E
Site
11
. K
ara
ika
l
12
. K
alla
r
13
. V
aila
ng
ann
i
14
. P
uth
upa
lli
15
. V
ilun
da
ma
va
di
16
. P
ushp
avan
am
17
. V
eda
ran
aya
m
27
imagery, provided by the USGS (post-tsunami imagery), as well as Google Earth satellite
imagery (pre-tsunami imagery), these sites were chosen based on proximity to the coast,
type of geomorphic environment, absence of anthropogenic influence, apparent tsunami
inundation (sand sheets, shoreline changes, lack of vegetation) and accessibility.
Sedimentary Analysis
A total of 160 samples were collected in the field for sedimentological analysis.
All samples were analyzed except for 1-4, and 67-70 (Mamallapuram samples that were
not part of the final transect analyzed in this study) and 103 (confiscated at customs for
containing roots). Grain-size analysis was conducted using a Malvern Mastersizer 2000
laser particle-size analyzer. This instrument is capable of producing results with total
uncertainty of less than 6%, compared to sieve and pipette methods which may record
error greater than 40% (Sperazza et al., 2004). The Mastersizer measures the average
size of each grain in three dimensional space using water as a medium. In addition,
conventional sieving was used at Mamallapuram to establish a comparison with the laser
particle-size analyzer results because Srinivasalu et al., (2007) used the wet sieve method.
Each sample was prepared by splitting and sonication. Splitting was done by
simple mixing and cutting into equal portions to reduce sample size without introducing
sampling bias. Mixing was done by hand and the sediment was cut into equal portions,
using a knife, into teaspoon-size portions adequate for Mastersizer analysis. In order to
disaggregate grains, sediment samples were sonificated while the sediment was in the
Mastersizer 2000. Without sonication, median grain size might be overestimated because
of aggregated particles and/or clay coatings (Sperazza et al., 2004). Excessive sonication
28
might result in fracturing of primary grains and yield an underestimation of mean grain
size (Sperazza et al., 2004). To reconcile these two end members, the duration used in
this project was 60 seconds, which has been demonstrated as the ideal sonication time for
the Mastersizer 2000 (Sperazza et al., 2004).
Every sediment sample has its own unique combination of optical laser properties
due to the relative abundance and types of minerals. To resolve unknown optical
properties of each sample it is necessary to test for the most reproducible results. In this
study, most samples consisted of >90% quartz which allowed the use of uniform optical
properties across all samples. The most reproducible index of refraction was 1.52, and
the most reproducible absorption was 0.1. These properties make sense because quartz
has been documented as having an index of refraction of 1.54 (Wenkh and Bulakh, 2004)
and a completely transparent substance would yield an absorption of 0.0.
Machine parameters affecting grain size results include pump speed, stirrer speed
and laser obscuration. The pump speed range of the Mastersizer 2000 is 0-2500 rpm to
account for differences in particle size, density and sample reservoir volume. Fine-
grained sediment has been documented to achieve the most stable results for pump speed
between 1800 and 2300 rpm (Sperazza et al., 2004). This project utilized the higher
range of this stability field (2100 rpm) to ensure particle entrainment, because the
dominant grain size of most samples was medium sand. The stirrer speed range for the
Mastersizer 2000 is 0-1000 rpm. The stirrer assists with particle entrainment in the
sample bath. Should the stirrer be set too low, not all of the particles will entrain and
circulate through the Mastersizer 2000; should the stirrer bet set too high, turbulence may

29
affect the outcome of grain size analysis. It was observed that all particles were entrained
and stable results were recorded when the stirrer speed was set to 750 rpm. Laser
obscuration is the percentage of light obscured by the suspended sample as it passes in
front of the laser. While low values of 5-10% obscuration returned variable results, very
high reproducibility was achieved with higher obscuration values of ~20%. Grain size
results reported in this study were the average of three successive laser diffraction runs.
The use of multiple runs allowed inspection for reliability of the results and reduction of
error associated with machine parameters. Potential sources of error include: the
introduction of air bubbles from the pump speed being too high, machine spikes or other
mechanical problems. The precision of the three runs was very high for all samples (~1%
variability) indicating the use of reproducible machine parameters.
The Malvern software calculates the percentage of grains at set micron intervals.
To use standard grain size statistics, it was necessary to convert microns into phi units.
To do this, the 95th
, 84th
, 75th
, 50th
, 25th
, 16th
and 5th
percentiles were transferred into a
Microsoft Excel spreadsheet and calculated into Krumbein phi units (φ) using –Log2.
The phi units are a logarithmic scale defined by: D= D02-φ
, where D is the diameter of a
given particle and D0 is a reference diameter equal to 1 mm. The finest sand is
represented by 4.00 φ and the coarsest sand equals -1.00 φ. In the below equations, φ16
is the 16th
percentile grain size—i.e. 16% of the sample grains are larger. The mean,
sorting, skewness and kurtosis of each sample were calculated after Prothero and Schwab
(2004) as seen in equations 1, 2, 3 and 4 below:

30
Mean (1)
Sorting (Std. Dev.) (2)
Skewness (3)
Kurtosis (4)
Representative samples from the most convincing tsunami deposits
(Thiruvadandhai, Mamallapuram, Kallar) and some potential tsunami deposits that were
difficult to identify in the field (Aalikuppam, Cuddalore) were observed using a binocular
microscope. Documented characteristics included roundness, shape, grain surface
textures, presence or absence of clay coatings, relative mineral content and presence or
absence of microfauna. A petrographic microscope was used to search for presence or
absence of diatoms. Samples were prepared for diatom analysis by splitting a teaspoon-
sized sample into a centrifuge tube and filling it with water 2cm above the sediment level.
The samples were put into the centrifuge at 3500rpm for 10 minutes and then decanted.
The centrifuge/decant process was repeated, and then a small portion of the sample was
smeared onto a thin-section slide for examination.
31
Optically Stimulated Luminescence Dating
Optically stimulated luminescence (OSL) dating is a method of measuring the
time elapsed since sediment was last exposed to daylight (Murray and Wintle, 2000).
Because tsunami deposits bury a large area in a very short period of time, OSL dating of
sediments immediately underlying or within the tsunami deposit can result in accurate
timing of tsunami events. To obtain an effective date with this method, the sediments
being dated need to have been adequately exposed to daylight in their last years before
burial. Exposure can be achieved through multiple processes including wind, tidal
currents, waves and bioturbation. OSL dating has been shown to effectively date
tsunami-laid sands when these conditions are met (Ely et al., 2010; Eipert, 2004; Huntley
and Clague, 1996).
OSL samples were collected at ten different locations. These samples were
chosen based on different observations at field sites such as relative soil development
(goal was to test older samples so we searched for well-developed soils), type of
geomorphic environment, least disturbed sediment, preservation of the 2004 tsunami
deposit and latitudinal location along the coast. All samples were taken from sediments
underlying the 2004 tsunami deposits. Sites and sampling depth were chosen based on:
high level of preservation of 2004 tsunami deposits, minimal bioturbation or oxidation,
and representation of a variety of geomorphic settings. Sampling was done as
recommended by the Utah State University OSL lab: 1) 1.5" x 8" metal tubes were gently
hammered into the pit, at the desired depth, until the tube was completely full and packed
tightly, 2) film canisters were filled with nearby sediments to test for moisture content, 3)

32
a 1-quart zip lock bag was filled halfway with sediments surrounding the metal tube for
environmental dose rate analysis, 4) the tube was carefully extracted and the ends were
packed with extra sediment before being capped and taped shut. Detailed descriptions
were sent in with the OSL samples which included: depth, latitude, longitude, elevation
and detailed sedimentary and stratigraphic characteristics.

33
CHAPTER IV
RESULTS AND DISCUSSION
Geomorphology
One of the objectives of this study was to categorize tsunami deposit
characteristics based on their general geomorphic setting. Based on field observations,
five major geomorphic settings that preserved the 2004 tsunami deposits on the
southeastern coast of India were described and sampled in this study (Table 1):
1. Coastal plain landward of a gradually sloping beach with little to no seaward
beach ridge (Figure 4).
2. Breached coastal beach ridges (Figure 5). These sites were breached in places by
the 2004 tsunami, which took the path of least resistance and cut channels into the
pre-existing topographic lows of the beach dunes. These breaches have been
referred to as tsunami scour fans (Kitamura et al., 1961; Bourgeois and Reinhart,
1989; MacInnes et al., 2005; Goff et al., 2009). In our study area, these fans were
built on the landward side of the scour as a result of inflow. In a 15 km north-
south coastal section located south of Chennai, the 2004 event created 20 of these
breaches. This study analyzed three of these in detail: Thiruvadandhai,
Vadanemelli and Mamallapuram (Fig. 2, Table 1).
3. River floodplains (Figure 6).
4. Tidal lagoons and associated barriers (Figure 7).
5. Miscellaneous anthropogenic sites such as archaeological locations and canals.

34
Figure 4. Geomorphic Category 1 at Mamallapuram. This type of beach setting
had well-preserved tsunami deposits.
Figure 5. Geomorphic Category 2 at Thiruvadandhai. Dune and accompanying
tsunami scour fan, with plunge pool (looking seaward).

35
Figure 7. Geomorphic Category 4 at Muttukaddu. A distinct sand layer in
the lagoon sediments where the photo was taken (view to north at star on
inset Google Earth satellite image) was probably deposited by the 2004
tsunami. The tsunami likely traveled through the inlet north of the
photograph location to deliver its sediment load.
Figure 6. Geomorphic Category 3 at Aalikuppam. The inset image
(Google Earth) delineates photo location (view to south at star) and
orientation of transect (arrow) taken at this study site. Indian Ocean is to
the east.
36
Further satellite imagery of the geomorphology of the study sites can be found in
Appendix C, Figures C1, C2 and C3.
Table 1 shows all the sample sites and their corresponding geomorphology and
describes the relative preservation potential of tsunami deposits at each geomorphic site.
The overlying tsunami deposits are most often differentiated by the presence of mafic
mineral laminations and a light tan color, while the underlying units were oxidized red
and usually massive (lacking stratification). In some cases the underlying units were also
laminated and there was a zone of red and gray mottling suggesting oxidation and
reduction, potentially from a fluctuating water table.
The following section contains descriptions of the geomorphic characteristics of
the sites listed in Table 1. The descriptions are ordered by latitude, from north to south
and separated into the northern group and southern group (Fig. 2). The differentiation in
the grouping is primarily attributed to a distinct grain size shift. In addition, the northern
sites generally had a more established seaward beach ridge, and the tsunami waves had
lower overall inundation distance inland and lower runup heights relative to the southern
sites (Peterson et al., 2005). An example stratigraphic column and accompanying
photograph are shown below (Figures 8, 9). Refer to the following appendices for
detailed data from each site: Appendix A = stratigraphic descriptions and stratigraphic
columns; Appendix B = grain size data; Appendix C = photographs of the study sites and
individual pits; and Appendix D = raw data from the laser particle-size analysis.

37
Kallar Pit 2—160 meters inland; February 24, 2008
Figure 8. Stratigraphic column and description of Kallar Pit 2.
0-10 cm = White; loose; massive, fine sand; subrounded; 85% quartz, 5% feldspar, 10% dark mafic minerals; distinct lower boundary, abundant roots. 10-24 cm = White; loose; laminated, fine sand; subrounded to subangular; 75% quartz, 5% feldspar, 20% laminated dark mafic minerals; distinct, undulating lower boundary. 24-43 cm = Red; moderately dense; mottled, fine sand; subrounded; 90% quartz, 5% feldspar, 5% dark mafic minerals; unit extends beyond base of pit.
0 cm
25 cm
50 cm
Undifferentiated Sand
horizontal axis
represents the mean
swash zone.Diffuse
Contact
Distinct Contact
Erosive Contact
Sampling Depth

38
Figure 9. Photograph of Kallar Pit 2.

39
Geomorphic Descriptions of Northern Study Sites
Pulicat Lagoon fits into geomorphic category 4 and is characterized by a large,
shallow lagoon that is separated by a barrier from the Bay of Bengal (Fig. 2). Pulicat
Lagoon is the northernmost site in this study, straddling the border of the state of Tamil
Nadu to the south and the state of Andhra Pradesh to the north. The lagoon is up
to 18.5 km by 60 km in area. The average depth of the lagoon is about 1 meter. The
coastal barrier dune ranges between 0.5 km and 2.5 km wide. The sandy islands Irkam
and Venad are aligned north to south in the northern part of the lagoon, effectively
dividing it into distinct east and west sections. These islands rise only a few meters
above the active lagoon, and are composed of tan, medium-sized sand. Witnesses
recount that the 2004 tsunami inundated the entire lagoon and formed a sandy barrier
over the inlet, which was quickly removed by tidal processes. Trenches were dug on the
sandy barrier islands and on the coastal dunes on the landward shore at Pulicat Lagoon,
however they revealed only homogenous, massive tan sand. Tsunami deposits were not
identified at this site.
Karikattakuppam is a small town located at 12.83º N. This town is on a beach
ridge within meters horizontally and vertically of the active beach and was abandoned
shortly after the tsunami inundated and destroyed most of the homes there. There is a
very narrow beach ridge that the tsunami overtopped, placing this site in geomorphic
category 1. The tsunami was funneled between two man-made walls and traveled at least
300 meters inland, tearing off the kitchen wall of a house as it passed (Fig. C4). A
distinct tan sand layer overlying preexisting hard red clay represents the likely 2004
40
tsunami deposit (Fig. C5). Local residents said that this clay was used for agricultural
purposes before the tsunami struck.
Muttukaddu is located at 12.79º N. This site is a lagoon separated from the coast
by a barrier and is about 1.5 km inland from the active beach zone, fitting into
geomorphic category 4. This lagoon is about 0.5 km wide and greater than 20 km in
length (north to south along the coastline). This site is unique in that the tsunami was
able to reach much
further inland, using the lower resistance of the lagoon as a means of propagation.
Digging pits on a mudflat adjacent to the lagoon water we sampled from a spot 1.5 km
inland from the Indian Ocean and encountered a distinct sand layer, probably deposited
by the 2004 tsunami (Fig. C6). The preservation potential in a lagoon setting such as
Muttukaddu is primarily dependent on sea-level fluctuation. The long distance inland to
this site also helps to remove this location from waves and tides that might affect sites in
geomorphic categories 1, 2 and 3.
Kovalam is a town located at 12.79ºN. This area has a small, indistinct beach
berm that the tsunami passed over on the way into the town. This site fits into
geomorphic category 1. The beach has a distinct rocky point and small cove just north of
it. Locals account that the cove and accompanying rocky point were not exposed prior to
the tsunami, but were a result of tsunami erosion of sand. Prior to the event this area had
a relatively straight section of beach. We sampled a small beach swale that local
residents said contained standing water after the tsunami struck. This swale has a distinct

41
sand deposit underlain by a organic-rich zone 15 cm down from the surface, which
represents the pre-tsunami surface vegetation (Figure A14).
The Thiruvadandhai site, located at 12.75º N has a high seaward beach ridge that
rises about 6 meters above the active tidal zone. The 2004 event left a distinct breach in
the seaward beach ridge, and just landward of the breach is a tsunami scour fan (Fig. C7)
created by the tsunami, placing this site in geomorphic category 2. Landward of the
coastal dune is a flat plain that extends 300 meters inland until it encounters the
paleobeach dune that rises about 10 meters above the flat plain. The thickness of the
presumed tsunami sand layer at the top of the sections at this site was highly variable
over a short lateral distance, and represented some of the thickest deposits identified at
our northern sites, reaching a thickness of 32 cm (Fig. C8). Because of the thickness and
distinctness of the candidate tsunami deposits at this location, Thiruvadandhai is a site
that we sampled in greater detail, completing a transect that extended from the tidal zone
to the distal extent of these deposits at 300 meters inland.
Vadanemelli is located at 12.73º N. The general geomorphology mirrors
Thiruvadandhai, having a high seaward beach ridge that rises about 6 meters above the
active tidal zone. This dune was breached and has an accompanying tsunami scour fan
(Figure C9), placing this site into geomorphic category 2. Landward of the coastal dune
is a flat plain that extends approximately 350 meters inland until it encounters the
paleobeach dune that rises about 10 meters above the flat plain. A distinct tan sand
overlies red sand at this location, indicative of the probably 2004 tsunami deposit. There
was also a clear organic layer delineating the lower boundary of the deposits and

42
representing the pre-existing surface vegetation. The scour fan at this location was
somewhat smaller compared to the plunge pool at Thiruvadandhai.
Mamallapuram is located at 12.61º N (Figures 10, 11). This site has a relatively
short seaward beach ridge (< 2 meters) that was breached by the tsunami and left an
accompanying tsunami scour fan and plunge pool (geomorphic category 1). The flat
plain landward of the seaward beach ridge extends 600 meters inland until it reaches a
second, landward beach ridge that rises about 6 meters above the flat plain. We were
able to trace a surface sand layer, interpreted as the 2004 tsunami deposit, 600 meters
inland at this location until it pinched out against the landward beach ridge (Fig. C10).
We completed a detailed transect at Mamallapuram in an attempt to statistically
differentiate the tsunami sand and determine whether and how the deposits vary with
distance inland.
Aalikuppam (12.44º N) is located along the Palar River floodplain, placing this
site into geomorphic category 3 (Figures 6, C11). The Palar River is up to 100 meters
wide within 100 meters of the Bay of Bengal, but narrows to just 10 meters across as it
encounters the Bay of Bengal. Local residents stated that the tsunami traveled 7 km
upstream, adjacent fields had standing water in them for 3 months after the 2004 tsunami
struck and that the mouth of the river was temporarily blocked by sand, which allowed
muddy water and sand to remain in the stream channel for weeks before the sand plug
was eroded away. Upon arrival at the site in February, 2008 the mouth of the river was
unblocked and the river flowed freely to the ocean. There is a series of three coastal
beach ridges with accompanying swales located on the north bank of the Palar River.

43
The swales between the ridges had still-water marks on them in the form of flotsam
(Figure C4). We took sediment samples from each swale. On the south side of the river,
we dug a trench into a well-formed terrace that was only a couple of meters above the
active river. This trench showed a distinct sand layer with a clear lower boundary
(Figures A24, C12). We noted abundant, thin mafic mineral laminations at the seaward
beach ridge at this location, but very few mafic minerals or laminations in the tsunami
deposits inland of that location (Fig. C13).
Figure 10. Stratigraphic column and description of Mamallapuram Pit 3
Mamallapuram Pit 3—250 meters inland; February 13, 2008
0-8 cm = Red-tan; loose; thin dark mineral laminations; medium tsunami sand; subrounded to subangular; 85% quartz, 5% feldspar, 10% dark mafic minerals; distinct, hummocky lower boundary. 8-21 cm = Black; moderately dense; massive; medium-coarse sand; subangular to subrounded; 90% quartz, 5% feldspar, 5% dark mafic minerals; contains abundant organic material; distinct lower bondary. 21-66 cm = Dark red; moderately dense; massive; medium-coarse sand; subangular to subrounded; 95% quartz, 5% scattered mafic minerals and feldspar; diffuse lower boundary.
0 cm
25 cm
50 cm
Clay or Silt
Interp. Tsunami Sand
Undifferentiated Sand
Diffuse Contact
Distinct Contact
Erosive Contact
Sampling Depth

44
Figure 11. Photograph of Mamallapuram Pit 3. Trowel is placed at the
contact between the interpreted tsunami sand and the preexisting sand.

45
Geomorphic Descriptions of Southern Study Sites
Cuddalore is located at 11.74º N and represents the approximate midpoint of all
sites analyzed in this study. This site is the northernmost representation of a distinct
grain size change observed at the southern sites in this study. All sites south of and
including Cuddalore had markedly finer grain sizes than the northern sites. Silver Beach
at Cuddalore is a popular tourist and recreational destination located just north of the
mouth of the Gadilam River, fitting this site into geomorphic category 3. There was a
distinct, heavily vegetated river terrace near the town of Cuddalore with a preserved sand
layer interpreted to be the 2004 tsunami deposit, in the form of dark tan sand with a
distinct lower contact overlying preexisting gray sand (Fig. A25). There were abundant
roots in the massive sand layer and minimal mafic minerals.
Tranquebar is located at 11.02º N. This area of beach has been eroding recently,
evidenced by a near vertical scarp in the seaward beach ridge, which is being actively
eroded by waves and tides. We dug a pit in a small lagoon that was about 100 meters
landward from the mean swash zone separated by a barrier (Geomorphic Category 4).
There was a distinct sand layer interpreted to be the 2004 tsunami deposit at Tranquebar,
but it was not possible to trace the deposit inland at this location. The massive sand layer
had abundant roots and was light tan with clay rip-up clasts and a diffuse lower contact
overlying a heavily oxidized sandy clay.
Karaikal is located at 10.91º N. This area has a wide, low lying beach with little
to no seaward beach ridge, placing it into geomorphic category 1. Pit 1 at this location
had a light tan sand at the surface with thin, abundant mafic mineral laminations.

46
Between 15 and 20 centimeters depth there was a distinct clay unit (Fig. C14). The clay
was likely ripped up and deposited by the 2004 tsunami as it overlies an organic-rich
layer interpreted to be the preexisting surface vegetation. The interpreted 2004 tsunami
deposit has a hummocky lower boundary, overlying a mottled gray and red laminated
sand. Though the interpreted tsunami deposits are distinct, the long-term preservation
potential in this area is questionable due to the close proximity to the water table
(oxidation and reduction) and swash zone (reworking).
Kallar is located at 10.73º N. This location is on a flat coastal plain with a mid
Holocene beach ridge located about 500 meters inland of the current active beach. This
site falls into geomorphic category 1, because of no discernible near-shore beach ridge.
At this location we focused on trenching behind the landward beach ridges that might
have offered protection from past storm or tsunami surges, thus increasing preservation
potential. This location preserved a very distinct tan, laminated sand, interpreted as the
2004 tsunami deposit. It overlies a red massive sand (Figures 8 and 9) with an abrupt
contact between them indicative of an erosional boundary. This area is actively farmed,
so even though some areas have remained unfarmed since the 2004 event, it is possible
that out sampling site will be farmed again, thus disturbing or destroying sedimentary
evidence of the 2004 tsunami.
Vailanganni is located at 10.68º N. The Vellayar River enters the Bay of Bengal
just south of the city (geomorphic category 3). The town is located on a small section of
what is a large coastal plain, extending multiple kilometers inland. One well-formed
river terrace above the current floodplain offers a potential to preserve the 2004 tsunami
47
deposits, because it is removed from waves, tides and active fluvial processes. We dug
three different pits at Vailanganni and each one was different. The tsunami deposits were
not easy to decipher, and the heavy mottling from the fluctuating water table potentially
masked the true tsunami boundary (Fig. C15). Each pit had a different stratigraphic
signature and there were no definitive tsunami boundaries. Pit 1 had an organic zone
between 71 and 79 centimeters, which was the most likely lower boundary of the tsunami
deposit in that location (Figure A24). Pit 2 had tan sand as deep as 84 centimeters,
indicating the most likely depth of the tsunami deposit (Figure A25). Pit 3 had
laminations between 50 and 58 centimeters and a diffuse hummocky lower boundary
indicating a possible lower boundary of the tsunami deposit at 58 cm (Figure A26). Sand
above the laminations was heavily mottled and dark red in most places. All of these pits
were within 100 meters of each other. The great variation in the thickness of the tsunami
deposit candidates adds to the uncertainty of the identification of tsunami deposits at this
location.
Puthupalli, located at 10.58º N, has a small seaward beach ridge and manmade
canal that runs within a couple hundred meters of the active tidal zone, placing this site
into geomorphic category 1. About 500 meters from the coast, the swale behind a
landward beach ridge provides a potential repository for the 2004 event. We dug a trench
in the swale about 20 meters west (landward) of this beach ridge and found a distinct
candidate for the 2004 tsunami deposit, consisting of tan, laminated sand over red,
slightly silty sand. If human influence has not altered this site, it could have good

48
potential to preserve the 2004 tsunami deposits, because it is removed from waves and
tides.
Vilundamavadi is located at 10.54º N. This site has a relatively large seaward
beach ridge that is about 10 meters high. The tsunami was able to erode this ridge and
deposit within an agricultural field. One pit we dug here was on a scour fan landward of
a plunge pool that was within a few meters of the seaward beach ridge. This scour fan is
reminiscent of the plunge pools we found in the northern study sites and represents the
only site in Geomorphic Category 2 that we documented in the southern sites. This is
also the only geomorphic environment that mirrors the tall coastal beach ridges at the
northern sites where these plunge pools were found. Just as in the northern sites, this
scour fan exists landward of the beach ridge, making it a result of inundation. This site
contained a distinct, tan, laminated sand with an abrupt lower boundary overlying red
sand, indicative of a tsunami deposit with an erosive base (Figure A39, A40).
We also sampled a Holocene coastal dune at this location. The ridge’s
preservation was aided by the stabilizing effect of palm tree roots. We took an OSL
sample at the base of the ridge to gain a better understanding of the relative stability of
the coastline in the southern part of the study area. An old OSL age might indicate an
eroding shoreline while a young one may indicate rapid deposition and progradation. A
prograding shoreline provides a better potential repository for paleotsunami deposits
because subsequent deposition would bury and preserve the tsunami deposit in a position
landward of active waves and tides.
49
Pushpavanam, located at 10.49º N, has a relatively topographically low seaward
beach ridge with a long, wide overwash plain, fitting this site into geomorphic category 1.
Local residents stated that the 2004 event traveled about 1 km inland over this broad,
low-lying coastal plain. Since then, farmers have planted casuarina trees that have
reworked and disturbed many of the deposits in this area. Outside of the casuarinas grove
there was a distinct tan, laminated sand over a reduced gray clay (Figure A22) that we
interpreted as the 2004 tsunami deposit.
Vedaranyam is located at 10.37º N. This active coastal plain had no
distinguishable seaward beach ridge (geomorphic category 1) and contained a mudflat
which was a few centimeters lower than the adjacent beach sands. We dug a pit within
the mudflat and found a distinct tan sand deposit overlying clay deposits. This mudflat
was the only site in the study that had obvious deposition after the presumed 2004
tsunami deposit in the form of gray clay overlying the tan sand layer (Figure C16). It is
expected that the clay deposition on top of the tsunami deposits could act as a buffer and
waves and tides and provide a better chance of preservation and future identification.
Stratigraphic Thickness
The measurements of the thickest interpreted tsunami deposits at the northern
sites were somewhat less on average than for the tsunami deposits at the southern sites
(Fig. 12, Fig. 13). The average thickness of the thickest deposits (n = 8) we trenched at
each site in the north was 15 cm and the average thickness of the thickest deposits (n = 9)
we trenched at each site in the south was 32 cm. Even with the 79-cm-thick outlier at
Vailanganni removed, the thickness of the deposits in the southern sites still averaged 24
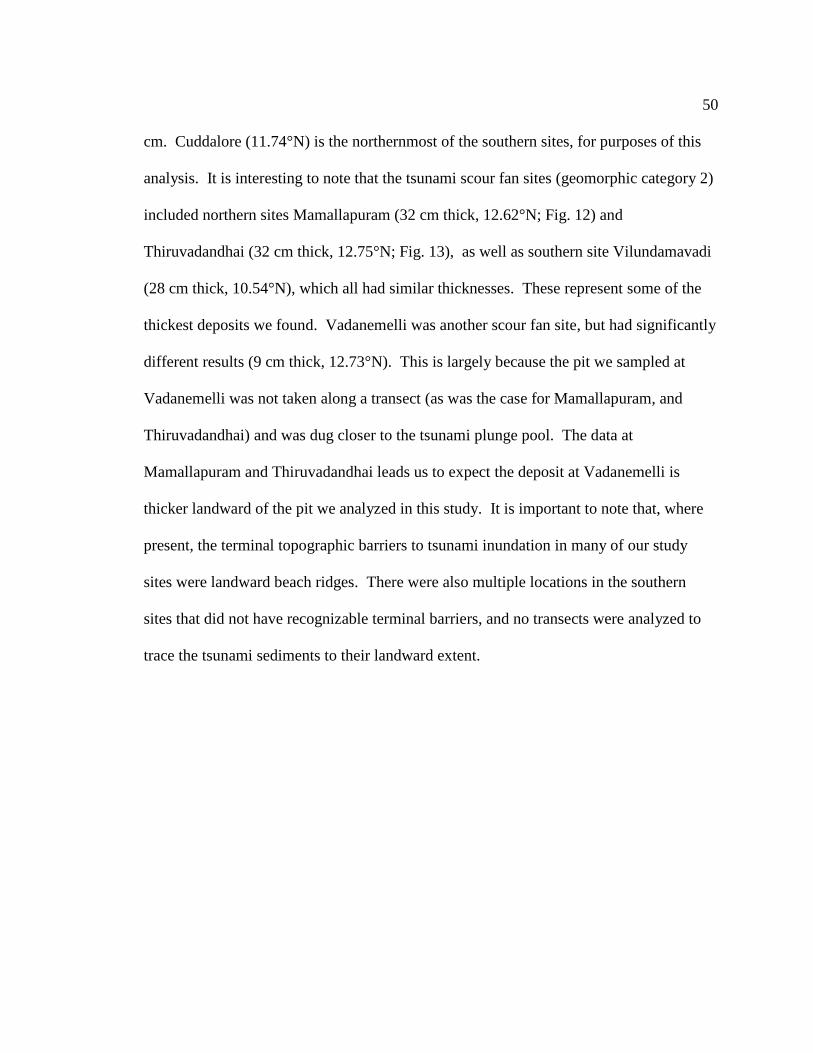
50
cm. Cuddalore (11.74°N) is the northernmost of the southern sites, for purposes of this
analysis. It is interesting to note that the tsunami scour fan sites (geomorphic category 2)
included northern sites Mamallapuram (32 cm thick, 12.62°N; Fig. 12) and
Thiruvadandhai (32 cm thick, 12.75°N; Fig. 13), as well as southern site Vilundamavadi
(28 cm thick, 10.54°N), which all had similar thicknesses. These represent some of the
thickest deposits we found. Vadanemelli was another scour fan site, but had significantly
different results (9 cm thick, 12.73°N). This is largely because the pit we sampled at
Vadanemelli was not taken along a transect (as was the case for Mamallapuram, and
Thiruvadandhai) and was dug closer to the tsunami plunge pool. The data at
Mamallapuram and Thiruvadandhai leads us to expect the deposit at Vadanemelli is
thicker landward of the pit we analyzed in this study. It is important to note that, where
present, the terminal topographic barriers to tsunami inundation in many of our study
sites were landward beach ridges. There were also multiple locations in the southern
sites that did not have recognizable terminal barriers, and no transects were analyzed to
trace the tsunami sediments to their landward extent.
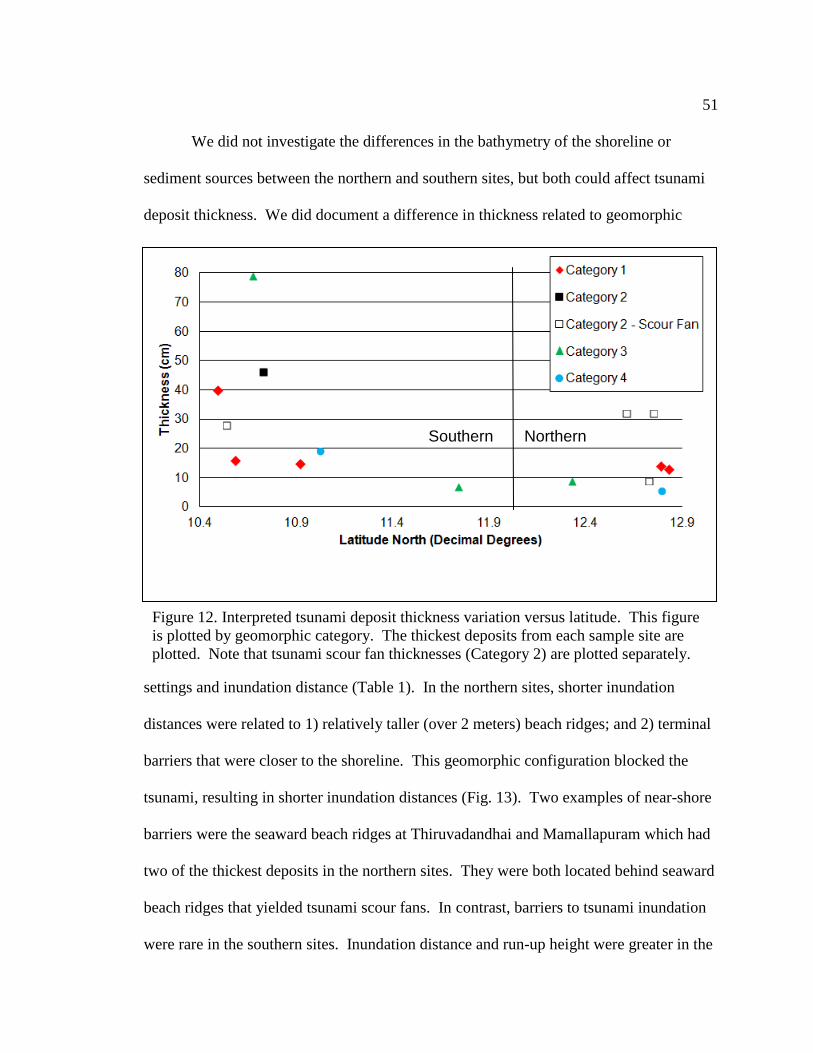
51
We did not investigate the differences in the bathymetry of the shoreline or
sediment sources between the northern and southern sites, but both could affect tsunami
deposit thickness. We did document a difference in thickness related to geomorphic
settings and inundation distance (Table 1). In the northern sites, shorter inundation
distances were related to 1) relatively taller (over 2 meters) beach ridges; and 2) terminal
barriers that were closer to the shoreline. This geomorphic configuration blocked the
tsunami, resulting in shorter inundation distances (Fig. 13). Two examples of near-shore
barriers were the seaward beach ridges at Thiruvadandhai and Mamallapuram which had
two of the thickest deposits in the northern sites. They were both located behind seaward
beach ridges that yielded tsunami scour fans. In contrast, barriers to tsunami inundation
were rare in the southern sites. Inundation distance and run-up height were greater in the
Figure 12. Interpreted tsunami deposit thickness variation versus latitude. This figure
is plotted by geomorphic category. The thickest deposits from each sample site are
plotted. Note that tsunami scour fan thicknesses (Category 2) are plotted separately.
h
Southern Northern

52
southern sites (Fig. 2) which allowed us to document tsunami deposits further inland, and
overall thicknesses were greater (Fig. 13).
Transect Profiles of Tsunami Sediment Thickness
We measured sediment thickness along transects at Mamallapuram,
Thiruvadandhai, Aalikuppam and Karikattakuppam, which were all in the northern
group. The tsunami deposits at Mamallapuram were recognizable based on their mafic
mineral laminations, erosive, hummocky lower boundary, relative lack of soil
development, light tan color relative to underlying structureless red sand and traceable
extent inland and laterally along the coastal plain. Mamallapuram had a short (less than 2
meter) beach ridge with a landward coastal plain and Thiruvadandhai had a relatively
taller (> 2 meters) beach ridge in front of a coastal plain (Table 1, Fig. 4, 5, 16, 17).
Aalikuppam was located at the confluence of the Palar River with the Bay of Bengal (Fig.
0
10
20
30
40
50
60
70
80
0 200 400 600 800 1000 1200 1400
Th
ick
nes
s (
cm
)
Distance Inland (m)
Northern Sites
Southern Sites
Figure 13. Maximum thickness of interpreted tsunami deposit vs. distance inland.

53
16, C11). Karikattakuppam was located behind a short beach berm on a well vegetated,
flat coastal plain (Fig. 17, C4). Although Mamallapuram had a tsunami scour fan, the
first pit in our transect was landward of the feature. Figure 14 shows the rapid decrease
in deposit thickness with distance inland at Mamallapuram. A similar pattern was
observed at Thiruvadandhai (Fig. 15) beginning with Pit #3. Pits #1 and #2 were seaward
of the tsunami scour fan so we would not expect to find thick deposits at these locations.
The tsunami deposits at Thiruvadandhai were recognizable based on their mafic
mineral laminations, erosive, hummocky lower boundary, relative lack of soil
development, light tan color relative to underlying structureless red sand and traceable
extent inland and laterally along the coastal plain. The change in thickness (thinner
deposits at 50 m and 100 m vs 150 m) at Thiruvadandhai (Fig. 15) indicates that the zone
of maximum erosion at this geomorphic setting is at the leading edge of the tsunami
scour fan. Likewise, the thickness change with inland distance at Mamallauram and
Thiruvadandhai indicate the zone of maximum deposition is landward of the tsunami
scour fan location. The tsunami was able to carry recognizable sand 200 meters further
inland at Mamallapuram. This difference was largely because of a lower elevation
seaward beach ridge coupled with a landward beach ridge located around 520 m inland,
which represented the terminal barrier to tsunami inundation. At Thiruvadandhai the
higher elevation seaward beach ridge coupled with a landward dune that was only 300
meters inland resulted in lesser overall inundation values.
There is no correlation between deposit thickness and inundation distance in the
northern study sites (Fig. 13). The thickness of tsunami deposits along the transect at
54
Aalikuppam was variable, indicating that there was also no correlation of tsunami
sediment thickness at this site. The Palar River produced a substantial variations in
tsunami wave dynamics, allowing it to inundate further inland than at other locations and
concentrate flow into dune troughs. The only mafic mineral laminations we noted at
Aalikuppam were in the pit 100 meters landward of the shore (Pit 4, Fig. A24). All other
tsunami deposits were identified based primarily on sand color, an erosional lower
boundary and lack of soil development. However, there were many mafic mineral
laminations documented at the beach berm (Fig. C13). Thus, it is presumed that the
tsunami inundation picked up additional river sediment that was deposited at the 150
meter and 200 meter locations.
The thickness profile at Karikattakuppam showed a direct, negative correlation
with inundation distance until 200 meters (Fig. 18). Although no distinct change in
topography was noted, the thickening at the most landward Pit #4 at 250 m could be due
to local flow variation or small-scale topographic changes. This location was heavily
vegetated, but tsunami wave energy was sufficient to remove the walls of nearby
buildings (Fig. C4). This location had a distinct tsunami deposit of tan laminated sand
erosively overlying a dark, organic-rich sand; the two units were separated by a sharp
irregular contact. There has been heavy vegetation growth on the tsunami sand deposits
where we sampled. We noted that roots had destroyed the near-surface sediment
structures and increased the rate of soil development, but they had not yet altered tsunami
laminations >8cm from the surface (Fig. C5).

55
0
5
10
15
20
25
30
35
0 100 200 300 400 Tsu
nam
i D
ep
osit
Th
ickn
ess
(cm
))
Distance Inland (m)
Pit #3
Figure 15. Interpreted tsunami thickness at Thiruvadandhai transect.
The candidate tsunami deposit was measured at locations along the
Thiruvadandhai transect. Zero distance inland represents the mean
swash zone. Tsunami scour fan deposition starts at 150 meters inland
at Pit #3. See Figure 22 for detailed Pit #3 grain size statistics.
0
5
10
15
20
25
30
35
0 200 400 600
Tsu
nam
i D
ep
osit
Th
ickn
ess
(cm
))
Distance Inland (m)
Figure 14. Interpreted tsunami thickness at Mamallapuram transect. The
candidate tsunami deposit was measured at locations along the
Mamallapuram transect. Zero distance inland represents the mean swash
zone. Transect taken landward of a plunge pool within a tsunami scour
fan.

56
0
5
10
15
20
25
0 50 100 150 200 250 300
Tsu
nam
i D
ep
osit
Th
ickn
ess (
cm
))
Distance Inland (m)
Figure 17. Interpreted tsunami thickness at Karikattakuppam. The
candidate tsunami deposit was measured at locations along the
Karikattakuppam transect. Zero distance inland represents the mean swash
zone.
0
2
4
6
8
10
12
14
0 100 200 300 400 500
Tsu
nam
i D
ep
osit
Th
ickn
ess (
cm
))
Distance Inland (m)
Figure 16. Interpreted tsunami thickness at Aalikuppam. The candidate
tsunami deposit was measured at locations along the Aalikuppam
transect. Zero distance inland represents the mean swash zone.

57
Field Observations of Candidate Tsunami Deposits
The deposits that we interpreted as derived from the 2004 tsunami were most
often delineated by numerous mafic mineral laminations proximal to the coastline and
were light tan in color, while the underlying units were oxidized red and usually
structureless. There were a few locations where the mafic laminations were concentrated
in specific intervals within the inferred tsunami deposits. At Mamallapuram, the
laminations were concentrated near the bottom of the unit (Fig. C10). At
Thiruvadandhai, the laminations were concentrated near the surface, with faint
laminations near the middle of the candidate tsunami sand (Fig. C8). At Vedaranyam, in
the south, the laminations were located throughout the deposit vertically (Fig. C16).
There were no shells noted at most of our pits, with the exception of the tidal lagoon at
Muttukaddu, which had trace shells within and below the tsunami deposit (Fig. C6).
Select samples from the candidate tsunami sediments at Mamallapuram were prepared in
the laboratory for diatom analysis, but a cursory examination under the microscope did
not indicate the presence of any diatoms.
The sedimentary units underlying the candidate 2004 tsunami deposits were
commonly mottled red and gray, suggesting both oxidation and reduction. Being close to
the water table, it is assumed this characteristic is a result of water table fluctuation. At
most sites, there was some degree of soil development on the surface buried by the
candidate tsunami deposits, evidenced by fine-grained organic material, vegetation and
occasional bioturbation. In some cases, when soil development was limited because of
being topographically above the water table, the underlying units were also laminated and

58
tan. The only key identifier of tsunami deposits in these locations was the presence of
erosional features such as a hummocky lower boundary or clay rip-up-clasts (Figures
C14, C16). There were multiple sites where no clear tsunami boundary could be
delineated. In most cases, these were southern sites and the candidate tsunami deposits
were very close to the water table.
Grain Size Statistics
In order to differentiate the candidate tsunami deposits at different sites in the
field we had to identify erosive features at the lower boundary, color variations, and
mafic mineral laminations within the tsunami deposits. Erosive features were more
easily identifiable in the southern sites where there were few barriers to inundation. In
some cases, it was not possible in the field to positively identify which sedimentary unit
had been deposited by the tsunami. This section is intended to better categorize the
candidate tsunami deposits based on their sedimentary statistics. Table 2 shows a
summary of relevant statistics for different groupings of samples.
In the laboratory we analyzed 151 samples for grain size and then calculated
sorting, skewness and kurtosis. The average grain size of the tsunami samples in the
south was substantially less than that in the north—2.25φ and 1.14φ, respectively
(Figures 18, 19; Table 2). The most likely influencing factor in the r grain size of the
southern sites is the general coastal geomorphology, which is intimately tied to the
Source of the sediment (Fig. 18). Regionally, the Cauvery River system present in the
southern study sites has brought sediment over a farther distance from the Precambrian
source rocks than the fluvial systems draining the northern study sites. All of the

59
southern study sites with the possible exception of Cuddalore lie within the ancestral
Cauvery River delta, as seen on satellite images (Fig. 2). Six out of eight northern sites
have distinct seaward beach ridges within a few meters of the current swash zone that
were able to act as barriers to the 2004 tsunami. In the south, the general geomorphology
TABLE 2. GENERAL GRAIN SIZE STATISTICS
Type Mean φ Sorting φ Skewness Kurtosis
All Tsunami North 1.14 0.69 0.04 0.95
All Non-tsunami North 1.23 0.73 0.06 1.02
All Tsunami South 2.25 0.74 0.09 1.03
All Non-tsunami South 2.38 0.87 0.16 1.28
Geomorphic Category 1
Tsunami North 1.19 0.68 0.04 0.86
Non-tsunami North 1.35 0.70 0.05 0.93
Tsunami South 2.26 0.64 0.02 0.75
Non-tsunami South 2.47 0.57 0.06 0.60
Geomorphic Category 2
Tsunami North 0.98 0.69 0.05 0.92
Non-tsunami North 1.01 0.74 0.07 1.04
Tsunami South 2.09 0.57 0.03 0.60
Non-tsunami South 2.21 0.68 0.01 0.87
Geomorphic Category 3
Tsunami North 1.17 0.66 0.03 0.80
Non-tsunami North 1.08 0.66 0.03 0.81
Tsunami South 2.23 0.73 0.08 1.01
Non-tsunami South 2.11 0.93 0.21 1.55
Geomorphic Category 4
Tsunami North 2.64 1.04 0.04 1.94
Non-tsunami North 2.51 1.12 0.17 2.31
Tsunami South 2.87 1.68 0.53 3.44
Non-tsunami South 3.24 1.92 0.63 3.31
Note: Larger phi values equal smaller grain size

60
is that of a low coastal plain, and relatively few barriers existed to impede the 2004
tsunami waves.
The difference in grain size between north and south (Table 2, Figures 18, 19)
necessitates separate discussion of the tsunami sediments relative to the non-tsunami
sediments. However, one of the common links between the northern and southern sites
was the grain size of the inferred tsunami sediments in Geomorphic Categories 1 and 2
was coarser than the underlying non-tsunami deposits. In contrast, the grain size of the
0.00
1.00
2.00
3.00
0 300 600 900 1200 1500
Inte
rpre
ted
Ts
un
am
i S
an
d M
ea
n G
rain
Siz
e (φ
)
Distance Inland (m)
Northern Sites Category 1
Southern Sites Category 1
Northern Sites Category 2
Southern Sites Category 2
Northern Sites Category 3
Southern Sites Category 3
Northern Sites Category 4
Southern Sites Category 4 --
----
-Coa
rse
----
---
--
----
-Me
diu
m--
----
-
----
----
-Fin
e--
----
---
Figure 18. Comparison of northern and southern sites interpreted tsunami sand.
Mean grain size is plotted relative to geomorphic category. Note: larger phi values
equal smaller grain sizes.

61
inferred tsunami sediments in Geomorphic Category 3 was finer than the underlying non-
tsunami deposits (Table 2). It is expected that the high velocity flow of the tsunami wave
would entrain the sediment available for transport. Although this logic is consistent with
findings in this study (Table 2, Fig. 18), perhaps the reason that the disparity is not
greater is that the available sediment for transport was already reworked by coastal
processes prior to the 2004 event removing the finer fraction of sediment.
The sorting for all of the inferred tsunami sediment samples in the north and south
(0.69φ, and 0.74φ, respectively) was slightly better than the sorting for the non-tsunami
deposits in the north and south (0.73φ, and 0.87φ, respectively; Table 2, Fig. 19). This
difference was most prominent for Geomorphic Categories 2, 3 and 4 in the southern
sites. In Geomorphic Categories 1, 2 and 3 in the northern and southern sites, tsunami
and non-tsunami sediments were moderate to moderately well sorted. This pattern is
most likely due to the dominant process being primarily waves, tides (categories 1 and 2)
and fluvial (category 3). In Geomorphic Category 4 in the northern and southern sites,
tsunami and non-tsunami sediments were poorly sorted. The source of the sediment in
this case is interbedded, lagoon sand and clay. The similarity in sorting of the tsunami
and non-tsunami sediments points towards a localized source of sediment as well as a
minimal influence from sediments outside of the lagoon.
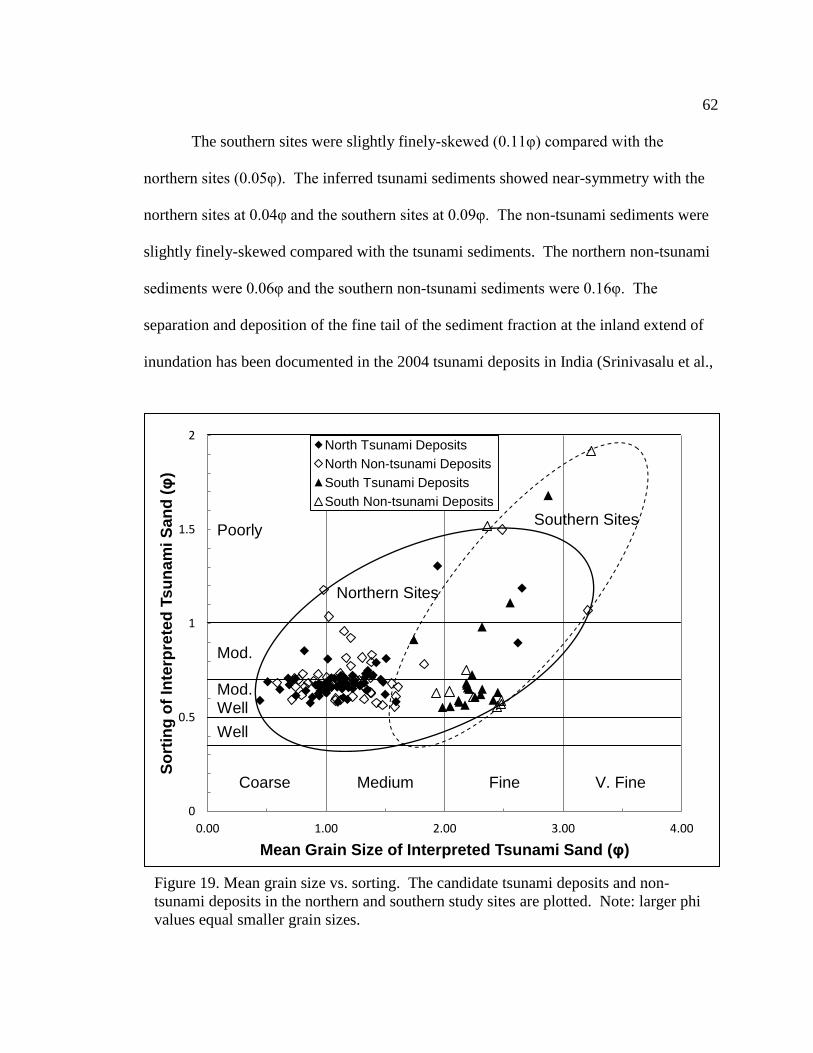
62
The southern sites were slightly finely-skewed (0.11φ) compared with the
northern sites (0.05φ). The inferred tsunami sediments showed near-symmetry with the
northern sites at 0.04φ and the southern sites at 0.09φ. The non-tsunami sediments were
slightly finely-skewed compared with the tsunami sediments. The northern non-tsunami
sediments were 0.06φ and the southern non-tsunami sediments were 0.16φ. The
separation and deposition of the fine tail of the sediment fraction at the inland extend of
inundation has been documented in the 2004 tsunami deposits in India (Srinivasalu et al.,
Figure 19. Mean grain size vs. sorting. The candidate tsunami deposits and non-
tsunami deposits in the northern and southern study sites are plotted. Note: larger phi
values equal smaller grain sizes.
0
0.5
1
1.5
2
0.00 1.00 2.00 3.00 4.00
So
rtin
g o
f In
terp
rete
d T
su
nam
i S
an
d (φ
)
Mean Grain Size of Interpreted Tsunami Sand (φ)
North Tsunami Deposits
North Non-tsunami Deposits
South Tsunami Deposits
South Non-tsunami Deposits
Coarse Medium Fine V. Fine
Well
Mod. Well
Mod.
Poorly
Northern Sites
Southern Sites
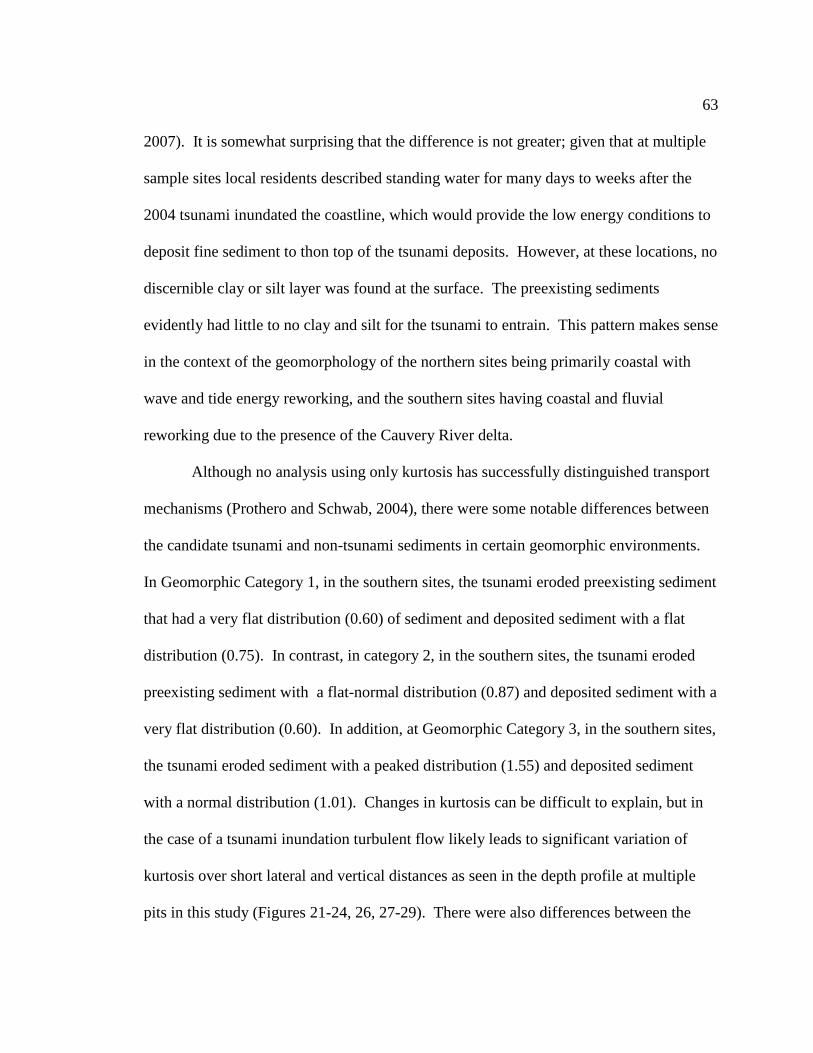
63
2007). It is somewhat surprising that the difference is not greater; given that at multiple
sample sites local residents described standing water for many days to weeks after the
2004 tsunami inundated the coastline, which would provide the low energy conditions to
deposit fine sediment to thon top of the tsunami deposits. However, at these locations, no
discernible clay or silt layer was found at the surface. The preexisting sediments
evidently had little to no clay and silt for the tsunami to entrain. This pattern makes sense
in the context of the geomorphology of the northern sites being primarily coastal with
wave and tide energy reworking, and the southern sites having coastal and fluvial
reworking due to the presence of the Cauvery River delta.
Although no analysis using only kurtosis has successfully distinguished transport
mechanisms (Prothero and Schwab, 2004), there were some notable differences between
the candidate tsunami and non-tsunami sediments in certain geomorphic environments.
In Geomorphic Category 1, in the southern sites, the tsunami eroded preexisting sediment
that had a very flat distribution (0.60) of sediment and deposited sediment with a flat
distribution (0.75). In contrast, in category 2, in the southern sites, the tsunami eroded
preexisting sediment with a flat-normal distribution (0.87) and deposited sediment with a
very flat distribution (0.60). In addition, at Geomorphic Category 3, in the southern sites,
the tsunami eroded sediment with a peaked distribution (1.55) and deposited sediment
with a normal distribution (1.01). Changes in kurtosis can be difficult to explain, but in
the case of a tsunami inundation turbulent flow likely leads to significant variation of
kurtosis over short lateral and vertical distances as seen in the depth profile at multiple
pits in this study (Figures 21-24, 26, 27-29). There were also differences between the

64
geomorphic environments prior to being inundated by the 2004 tsunami: Categories 1 and
2 showed a normal to slightly flat distribution, category 3 showed a flat distribution in the
northern sites but a peaked distribution in the southern sites, and category 4 was very
peaked to extremely peaked (Table 2). The peaked distribution of the lagoon sediments
of category 4 can be seen in the field in the form of interbedded sand and clay (Fig. C6).
Discussion of Grain Size Characteristics
The grain size differences detected in this study were small. When comparing the
differences in mean, sorting, skewness and kurtosis between the tsunami and non-tsunami
deposits, the southern sites showed greater variation than the northern sites. This could
be related to higher runup and inundation values in the southern portion of the study
section (Peterson et al., 2005), which might imply higher energy flow conditions.
The small statistical differences between tsunami sand and underlying sand might not be
detectable in a deposit many years after deposition, making statistical measures alone a
very uncertain means of identifying potential paleotsunami deposits.
It appears that the most important factor affecting the character of the 2004
tsunami deposits in India was the available sediment for transport (Figures 18, 19). The
grain size in Figure 18 shows distinct clustering of northern and southern deposits and
indicates that there is a lesser dependence on geomorphic category and little to no
correlation with distance from coast. This result highlights the importance of
understanding regional geormorphology and sediment source as well as accurately
classifying the sediments in different geomorphic environments and identifying them in
the stratigraphic record when searching for paleotsunami deposits. There is also a

65
substantial correlation between geomorphic setting and grain size (Figures 18, 19). It is
logical to conclude that geomorphic setting and available sediment for transport were
intimately related prior to the 2004 tsunami event and that both have significant impacts
on the grain size characteristics of tsunami sediments.
Individual Site Grain Size Statistics
The statistics for each detailed pit we sampled in the field is shown in Figures 20
through 26. At each detailed pit we sampled the candidate 2004 tsunami sand even if it
was at the surface and bioturbated, such as shown in Figures 22, 24 and 25. Detailed
transects are shown for Mamallapuram, Thiruvadandhai and Aalikuppam (Figures 27, 28,
29). Note that smaller phi values represent larger grain size.
Discussion of Grain Size Patterns at Individual Sites
Some of the detailed pits highlight that there has been some reworking of tsunami
sediment due to vegetation growth at the surface (for example Mamallapuram Pit 3,
Figures 11, 24, A17). Multiple detailed pits had varying grain size with depth, indicating
possible evidence of turbulent flow conditions or multiple wave profiles (Figures 20, 22-
24). At Thiruvadandhai (Fig. 22) and Mamallapuram (Fig. 24) in particular there is
significant variation and fine-scale grading, on the order of 3-5 cm with depth. This
pattern could be interpreted as being the signature of multiple waves (Srinivasalu et al.,
2007), or as a result of turbulent flow. Though the grain size variation was difficult to
discern in the field, grain size measurements indicate that Thiruvadandhai possibly shows
four graded beds but only three waves struck the study region.

66
Figure 20. Kovalam Pit 1 (northern site) grain size statistics. Vertical axis is the pit
depth (cm).

67
Figure 21. Muttukaddu Pit 1 (northern site) grain size statistics. Vertical axis is the pit
depth (cm).

68
Figure 22. Thiruvadandhai Pit 3 (northern site) grain size statistics. Vertical axis is
the pit depth (cm). Inverse grading occurs where sediment becomes coarser (smaller
phi values) upsection and normal grading occurs where sediment becomes finer
(larger phi values) upsection.

69
Figure 23. Vadanemelli Pit 1 (northern site) grain size statistics. Vertical axis is the
pit depth (cm).
70
Figure 24. Mamallapuram Pit 1 (northern site) grain size statistics. Vertical axis is the
pit depth (cm). Inverse grading occurs where sediment becomes coarser (smaller phi
values) upsection and normal grading occurs where sediment becomes finer (larger
phi values) upsection.

71
Figure 25. Aalikuppam Pit 1 (northern site) grain size statistics. Vertical axis is the pit
depth (cm).

72
Figure 26. Vailanganni Pit 1 (southern site) grain size statistics. Vertical axis is the pit
depth (cm). This was the only detailed pit analyzed in the southern sites.

73
The margins of the lagoon at Muttukaddu had a much wider variation in grain size
statistics than any other site (Fig. 21). This pattern is consistent with field observations
of fine sediments interbedded with medium sands underlying the tsunami deposits.
Though the candidate tsunami deposits were clearly recognized in the field by the abrupt,
hummocky lower boundary, dark mafic mineral laminations and lack of soil development
at the surface (Figures A5, C6), there was only a small measurable difference in grain
size between the candidate tsunami deposit and the underlying sediments at Muttukaddu.
It would be difficult to contrast this sand layer with a future storm deposit except that it is
significantly thicker than the preexisting interbedded sandy layers.
In contrast, in the sandy beach environments of Thiruvadandhai and
Mamallapuram there are no clear distinguishing traits when comparing the grain size
statistics to the underlying sediments (Figures 22, 24). The small-scale graded beds
within the tsunami deposit at Thiruvadandhai (Fig. 22) may represent the complexity
introduced by turbulent flow and/or multiple waves as suggested by a previous study at
this location (Srinivasalu et al., 2007). However, the underlying sediments also show
similar grain size variations to the tsunami deposits such that they are not distinguishable
from the tsunami sediments. The best sedimentological indicators of tsunami deposits in
these sandy environments is the abrupt, erosive, hummocky lower boundary and mafic
mineral laminations observed in the field.
The river sediment at Aalikuppam shows that the available sediment for transport
was well sorted, medium sand (Fig. 25). There was little to no variation in grain size
between the candidate tsunami sand and the non-tsunami sand indicating that the primary

74
source of sediment entrained by the tsunami was most likely fluvial sediments.. The
tsunami deposit was identifiable in the field by an abrupt, erosional lower boundary and
tan color but the deposit itself was structureless. It would be very difficult to identify the
paleotsunami deposits at Aalikuppam at the timescale of the long tsunami recurrence
intervals in the Indian Ocean basin.
The 2004 tsunami deposits were difficult to identify in the field at Vailanganni
(southern site). The potential tsunami sand was structureless with no clear erosional
boundary. The grain size shows grading from 0-20 cm depth and a structureless sand
from 20-78cm (Fig. 26). This pattern is most likely the result of misidentifying the
tsunami deposit in the field, with the total thickness being closer to 20 cm instead of 78
cm. A thinner deposit would be more consistent with the thicknesses we measured at our
other sites. It is likely that our sampling interval was not detailed enough to reflect the
real variations between samples. This environment made it very difficult to distinguish
the 2004 deposits after only 3 years, thus making it an unlikely site for preservation and
recognition of paleotsunami deposits.
There was consistent sorting in the tsunami deposit at Mamallapuram and
Kovalam despite variations in mean grain size (Figures 20, 24). This is likely due to the
effect of mafic mineral laminations on mean grain size. When the sampling depth
contained a higher proportion of mafic minerals, the measured grain size was finer. The
size contrast between the coarser quartz sand grains and the smaller fraction of mafic
minerals was minimized by the laser diffractometer relative to the wet sieve method
(Figures 32, 33). As a result, when the sample contained a larger proportion of mafic
75
minerals, the grain size showed about 0.25φ smaller shift (the sample measured coarser)
with laser diffractometer analysis. The resulting sorting calculations also indicate that the
variation in the grain size population displayed a much smaller shift with the laser
diffractometer analysis. See the section Comparing Mastersizer Data to Sieve Data for
further discussion.
Transect Analysis
The transects of Thiruvadandhai, Mamallapuram and Aalikuppam are
summarized in Figures 27, 28 and 29. The values at any given distance represent the
average value (of a given grain-size characteristic) of multiple samples within the
candidate tsunami deposit vs. the preexisting sediment. This approach allows an analysis
of what kind of effect the coastal geomorphology had on the sediment deposited by the
tsunami. Overall, the three sites showed little variation between the candidate tsunami
sediments and the underlying sand, indicating that the available sediment for transport is
the most significant factor in the statistical values. These graphs show that taking a
transect perpendicular to the coastline does not provide any distinguishing characteristics
of the 2004 tsunami deposit sand sheet as it was deposited inland that would aid a future
investigation in identifying paleotsunami deposits in sandy geomorphic environments.
It is worth noting that where the tsunami sediments were finer than the non-
tsunami sediments there was a significant increase in black mafic mineral laminations
relative to the underlying sediments (100 m and 250 m inland Thiruvadandhai Fig. 27;
200 m and 250 m inland at Mamallapuram Fig. 28). In hand sample, these mafic mineral
grains were finer overall, and much more elongate than the quartz-dominated sand. The
76
lack of mafic mineral laminations seen in the landward extents of the tsunami deposits in
Mamallapuram and Thiruvadandhai most likely represent a change in the source of the
sand with landward distance.
At Mamallapuram and Thiruvadandhai, where we sampled the coastal plain, the
absence of mafic mineral laminations in the tsunami sand samples resulted in a coarser
measurement of mean grain size (280 m, 300 m pits 6 and 7 at Thiruvadandhai Figures
22, 27 and 450 m, 500 m pits 5 and 6 at Mamallapuram, Figures 24, 28). At these
distances there were no mafic mineral noted in the field and the coarser interpreted
tsunami sand likely represents a beach or beach ridge (Fig. C13) source introduced to a
coastal plain environment.
The slight landward coarsening of tsunami sediments at Mamallapuram (Fig. 27)
and Aalikuppam (Fig. 29) is most likely due to the decreased presence of mafic mineral
laminations with distance inland. In the field we noted that there were no discernible
mafic mineral laminations in the tsunami deposits near their maximum landward extent.
We also noted that there was a strong presence of mafic mineral laminations on the beach
near the mean swash zone. This indicates that the ability for the 2004 tsunami to carry
mafic minerals from near-shore sediment was limited to 250 m at Thiruvadandhai and
Mamallapuram and 200 m at Aalikuppam (Fig. 27 Pit 5 and Fig. 28 Pit 3, Fig. 29 Pit 2).

77
Figure 27. Thiruvadandhai transect grain size statistics. Vertical axis represents the
grain size statistic referenced at the top of each graph. Zero distance inland on the
horizontal axis represents the mean swash zone.

78
Figure 28. Mamallapuram transect grain size statistics. Vertical axis represents the
grain size statistic referenced at the top of each graph. Zero distance inland on the
horizontal axis represents the mean swash zone.

79
Comparison with Srinivasalu et al. (2007)
Clay or Silt
Interp. Tsunami Sand
Figure 29. Aalikuppam transect grain size statistics. Vertical axis represents the grain
size statistic referenced at the top of each graph. Zero distance inland on the

80
Comparison with Srinivasalu et al. (2007)
This section compares results taken by Srinivasalu et al. (2007) to the some of the
same sites analyzed in this study in an effort to identify post-depositional change since
the 2004 tsunami, which will provide better insight into long-term preservation potential.
Srinivasalu et al., (2007) collected samples at Thiruvadandhai and Mamallapuram.
Personal communication with the author (2008) indicated that we sampled from the same
sites along similar transects near the tsunami scour fans. Figures 29 and 30 show grain
size statistics for tsunami deposits only. The raw data from Srinivasalu et al., (2007) was
not available so we plotted our data on his graphs. As such, this discussion analyzes only
general trends such as grading and relative grain size.
The comparison of sieve data from samples taken days after the 2004 tsunami
(Srinivasalu et al., 2007), to Mastersizer data from samples taken less than four years
after the event, enables two trends to be identified. The first is that the sieve data, as
shown in Figure 30 and 32, is about 0.1φ-0.25φ coarser than the Mastersizer data. This
expected difference can be accounted for because the Mastersizer takes the average
length of the long, middle and short axis on each particle whereas the sieve only
measures the short axis of each particle (see Appendix B Comparison of Mastersizer Data
to Sieve Data, Figures B1-B4). The second trend is the clear grading that exists at
Thiruvadandhai when comparing Figure 21 at 150m from the mean swash zone
(Mastersizer, 2008) to Figure 29 at 230 m from the mean swash zone (Srinivasalu et al.,
2007). The grading shows a similar pattern in both graphs from about 5 cm depth to
about 18 cm depth. Assuming there is some similarity between 150 m from the shoreline
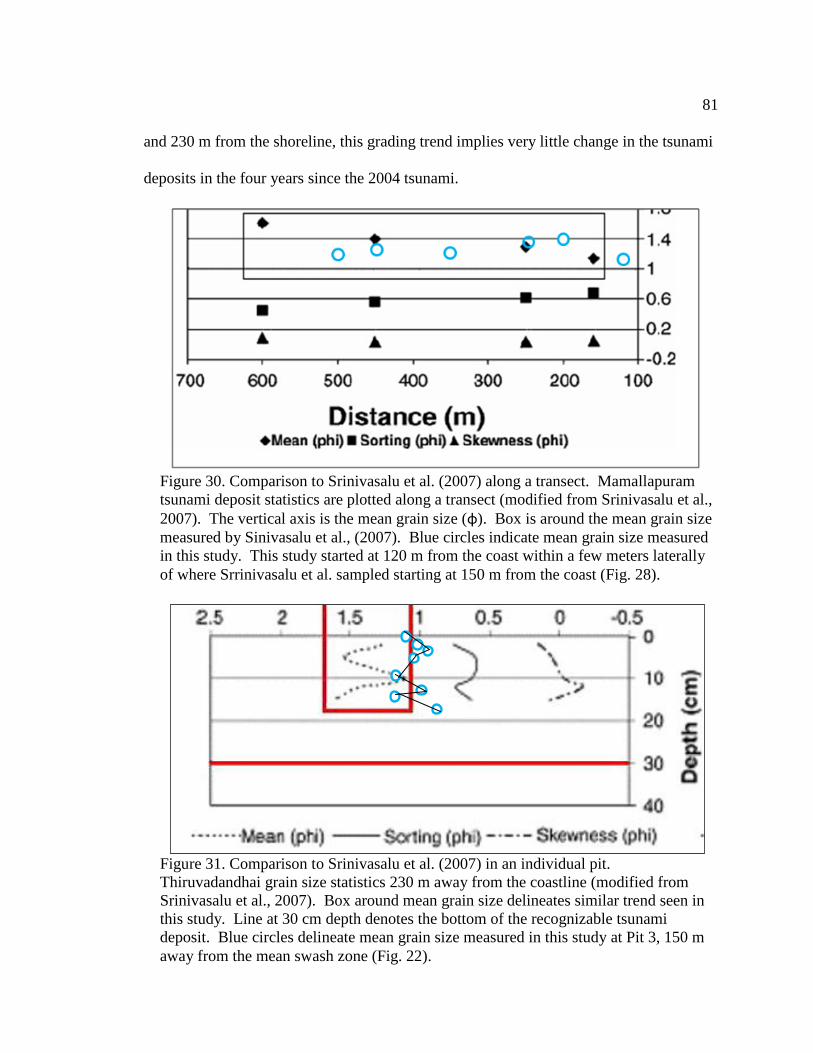
81
and 230 m from the shoreline, this grading trend implies very little change in the tsunami
deposits in the four years since the 2004 tsunami.
Figure 30. Comparison to Srinivasalu et al. (2007) along a transect. Mamallapuram
tsunami deposit statistics are plotted along a transect (modified from Srinivasalu et al.,
2007). The vertical axis is the mean grain size (φ). Box is around the mean grain size
measured by Sinivasalu et al., (2007). Blue circles indicate mean grain size measured
in this study. This study started at 120 m from the coast within a few meters laterally
of where Srrinivasalu et al. sampled starting at 150 m from the coast (Fig. 28).
Figure 31. Comparison to Srinivasalu et al. (2007) in an individual pit.
Thiruvadandhai grain size statistics 230 m away from the coastline (modified from
Srinivasalu et al., 2007). Box around mean grain size delineates similar trend seen in
this study. Line at 30 cm depth denotes the bottom of the recognizable tsunami
deposit. Blue circles delineate mean grain size measured in this study at Pit 3, 150 m
away from the mean swash zone (Fig. 22).
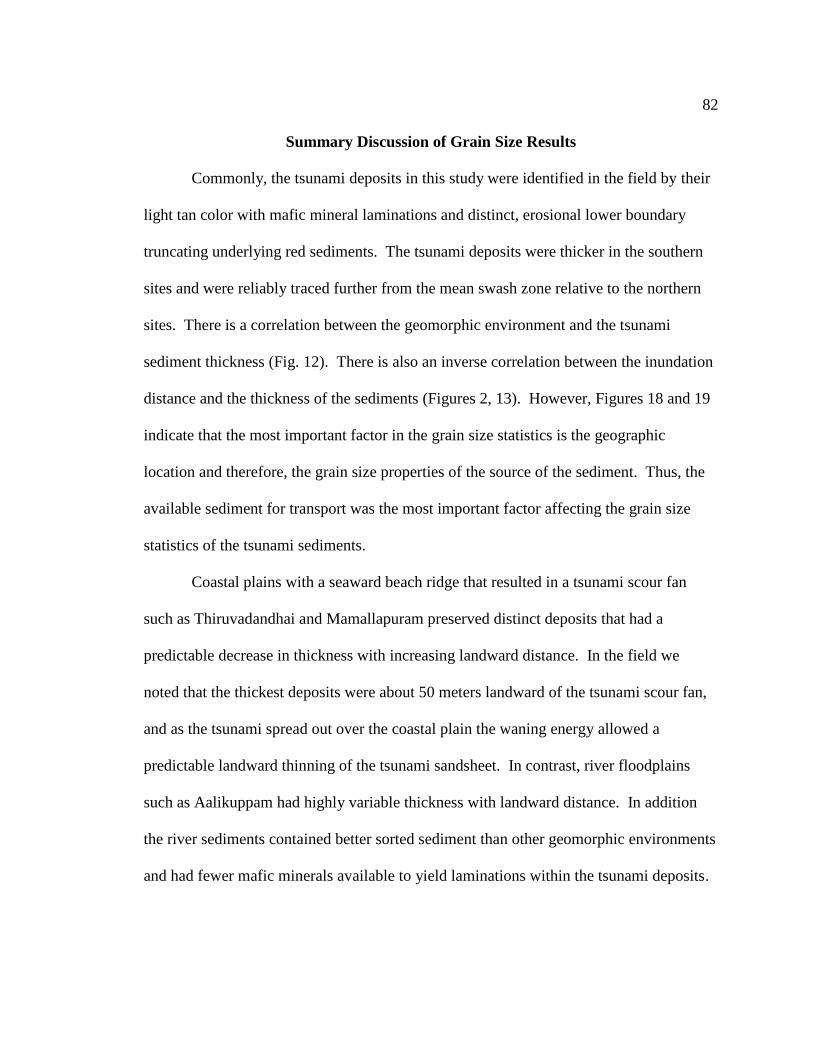
82
Summary Discussion of Grain Size Results
Commonly, the tsunami deposits in this study were identified in the field by their
light tan color with mafic mineral laminations and distinct, erosional lower boundary
truncating underlying red sediments. The tsunami deposits were thicker in the southern
sites and were reliably traced further from the mean swash zone relative to the northern
sites. There is a correlation between the geomorphic environment and the tsunami
sediment thickness (Fig. 12). There is also an inverse correlation between the inundation
distance and the thickness of the sediments (Figures 2, 13). However, Figures 18 and 19
indicate that the most important factor in the grain size statistics is the geographic
location and therefore, the grain size properties of the source of the sediment. Thus, the
available sediment for transport was the most important factor affecting the grain size
statistics of the tsunami sediments.
Coastal plains with a seaward beach ridge that resulted in a tsunami scour fan
such as Thiruvadandhai and Mamallapuram preserved distinct deposits that had a
predictable decrease in thickness with increasing landward distance. In the field we
noted that the thickest deposits were about 50 meters landward of the tsunami scour fan,
and as the tsunami spread out over the coastal plain the waning energy allowed a
predictable landward thinning of the tsunami sandsheet. In contrast, river floodplains
such as Aalikuppam had highly variable thickness with landward distance. In addition
the river sediments contained better sorted sediment than other geomorphic environments
and had fewer mafic minerals available to yield laminations within the tsunami deposits.

83
As a result the tsunami deposits were more difficult to correctly identify in the field at
Aalikuppam.
Mafic mineral laminations were concentrated at the proximal pits relative to the
mean swash zone, and in some individual samples skewed the grain size statistics toward
the finer grain size fraction. Overall, there were only small detectable statistical
differences between the tsunami deposits and the underlying sediments. The tsunami
deposits were slightly (0.1 φ) coarser, slightly (0.1 φ) better sorted, with no detectable
skewness difference and they were excessively peaked (0.1 difference in the northern
sites and 0.25 difference in the southern sites) relative to the preexisting sediments.
Different geomorphic environments produced distinct groupings of mean grain
size. The finest sediments were found in the lagoons and river sediments. The northern
and southern site groupings also produced distinct mean grain size differences with the
southern deposits being 1 phi finer which is likely due to the available sediment for
transport.
Plotting mean grain size versus sorting of candidate tsunami deposits shows that
there is greater differentiation in sorting amongst the southern sites but a greater
differentiation in mean grain size among the northern sites (Fig. 19). The smaller grain
size variation in the southern sites is likely due to most of the sediment initiating being
sourced from the Cauvery River delta and then being subsequently reworked in some
locations as the river avulsed to new channels. The larger range of sorting in the southern
sites is likely a function of geomorphic environment as there is a distinct clustering of
moderate sorting that represent the majority of sampling sites and the finest sand fraction

84
correlates with the poorest sorting (Fig. 19). The large variation in grain size in the
northern sites can be explained by the different geomorphic environments. The tidal
lagoon at Muttukaddu had fine-grained sand but the majority of coastal locations such as
Thiruvadandhai had medium grained sand sourced from the beach and reworked by
waves and tides.
Detailed sampling at some individual pits indicated distinct grading within the
tsunami deposits. One possibility is that the inundation by each of the three waves
produced normally graded beds as the tsunami energy waned (as suggested by
Srinivasalu et al., 2007) and turbulent flow introduced small-scale inverse grading into
the deposits. It could also be exclusively a function of turbulent flow.
Transect analysis and comparison of mean grain size with Srinivasalu (2007)
indicates that there has been very little or no change to many of the tsunami deposits
between 2004 and 2008, supporting the possibility of good preservation potential at sites
with distinct beach berms such as Mamallapuram and Thiruvadandhai. However,
differentiating these deposits from storm deposits without prior knowledge of the areas
affected by the 2004 tsunami would be very difficult. Observing the geomorphic context
of these sites, for example the breach in the beach ridge, is critical for interpreting the
tsunami source of these sediments. Recognition of tsunami deposits based on
sedimentology alone would be difficult.
The laser diffractometer analysis conducted in this study yielded very similar
trends in the grain size statistics to the wet sieving method in this study when analyzing
sediment collected in pits along the Mamallapuram transect. The grains were predictably

85
about 0.25 phi coarser when measured with the particle size analyzer as it measures the
mean of all three axes of a sand grain whereas the wet sieving method measures the
smallest axis.
Optically Stimulated Luminescence Data
Table 3 shows the results from selected OSL samples taken in the field. These
five sites should help provide insight into relative stability of the coastline and
information about the long-term rate of sediment accumulation.
TABLE 3. OPTICALLY STIMULATED LUMINESCENCE DATA
Sample Site Pit # Distance Est. Elevation
Depth (m)
In Situ Water % # Disks
Dose Rate (Gy/ka)
De, Gy (std dev)
OSL age (cal yr)
Geomorphic Setting
Thiruvadandhai Pit 4 200 m 3 m
0.18
0.1 29 3.37 ± 0.18
0.32 ± 0.13
100 ± 40 Coastal plain
Mamallapuram Pit 3 250 m 2 m
0.35 0.1 22 2.17 ± 0.10
4.94 ± 1.42
2,280 ± 190 Coastal plain
Aalikuppam Pit 2 200 m 3 m
0.15 0.1 21 2.10 ± 0.10
0.17 ± 0.15
80 ± 20 River Floodplain
Kallar Pit 2 160 m 2 m
0.19 0.2 28 3.07 ± 0.16
0.45 ± 0.23
150 ± 70 Coastal plain
Vilundamavadi Pit 1 450 m 2 m
2.45 0.2 34 3.22 ± 0.18
0.98 ± 0.15
300 ± 50 Forested coastal plain
In situ water % compensates for the attenuating effect of water on ambient radiation. # Disks is the number of subsamples measured on steel or aluminum disks. Dose rate is the luminescence from the sediment surrounding the sample. Dose equivalent (De) is the preserved luminescence of the sample. OSL age is the De divided by the dose rate.
86
The southeastern coast of India has a very dynamic shoreline. Mamallapuram and
Thiruvadandhai are only a few kilometers from each other, and yet with similar
geomorphic environments they have quite different sediment histories. The shoreline at
Thiruvadandhai is only about 100 years old at 18 cm depth below the pre-tsunami surface
where the 2004 tsunami inundated (200 m inland, Table 3, Figures C2, C7). In contrast,
the shoreline at Mamallapuram is about 2,280 years old at 35 cm depth underlying the
2004 tsunami deposits (250 m inland, Figures C2, C10). The age of Mamallapuram
implies a low rate of sediment accumulation or possibly suggests an eroding shoreline
such that the younger sediments were seaward and have been eroded away. If this is the
case, then it is unlikely that a paleotsunami deposit from the past 2.3 kya has been
preserved as they would have been deposited seaward of this location which is only 250
m inland. In contrast, the young age of Thiruvadandhai implies a relatively high
sedimentation rate, yet it is in a similar geomorphic environment and location along the
Indian coast. These vastly different ages and the emerging temple at Mamallapuram
imply that it is an erosional shoreline, while the young age of Thiruvadandhai could
imply a prograding shoreline. To confirm this hypothesis, an OSL date should be taken
at the landward dune at Thiruvadandhai that was 320 m from the mean swash zone and
acted as a terminal barrier to the 2004 tsunami. That landward dune might indicate the
relative position of the shoreline during the last possible large event (Sumatra, 780-990
AD, 1290-1400 AD, Monecke et al., 2008; Thailand, 1300-1450 AD, Jankaew et al.,
2008; The Andaman Islands, 1000 AD, Rajendran et al. 2007).

87
The sample taken at Aalikuppam yielded an age of just 80 years old (Figures 6,
C2, C11). This date combined with the difficulty in identifying the tsunami deposits in
the field might indicate that this river floodplain is too active to reliably preserve a record
of past large tsunami events. It also indicates a possible local progradation of river
sediment into the Bay of Bengal. However, further evaluation and dating of landward
geomorphology could prove useful in the search for paleotsunami deposits.
The geomorphic setting at Kallar is similar to Mamallapuram and Thiruvadandhai
but is in the southern portion of the study area (Figures 8, 9). The OSL age of 150 years
old is much closer to that at Thiruvadandhai, and the distinct tsunami deposits at this
location were well preserved. The young age at this location indicates that the swales
behind the landward beach ridges at this location might show potential to preserve a
deposit from past large tsunami. Furthermore, investigation and dating of the landward
beach ridges and swales at Kallar has potential for discovering paleotsunami evidence.
Vilundamavadi is also a location behind a distinct seaward beach ridge with well-
preserved tsunami deposits over red sand (Fig. C3). This location is forested, resulting in
the roots destroying many of the original laminations in the tsunami deposits. The OSL
date was taken from a landward dune at 2.45 meters depth which was still about two
meters above sea level. The returned age of 300 years implies a geomorphic setting that
is too young to capture the documented paleotsunami deposits around the Indian Ocean.
It also indicates a high sedimentation rate and recent eolian activity. We recommend
additional investigation of the landward beach ridges and swales at this location when
88
searching for paleotsunami deposits in southeastern India, as they might mark earlier
shoreline positions.
The young OSL dates from this study highlight the potential for paleotsunami
preservation in the swales behind landward beach ridges at Thiruvadandhai, Kallar,
Aalikuppam and Vilundamavadi, but distinguishing them from storm deposits might be
problematic. If these beach ridges yielded ages of at least 700 years old they could
contain the most recent documented large paleotsunami deposit from other sites around
the Indian Ocean (Monecke et al., 2008; Jankaew et al., 2008). Though there is no
geomorphic evidence of obvious shoreline changes over the past 1200 years at
Mamallapuram (Mohapatra and Prasad, 1999), if the shoreline is eroding, as implied by
the OSL age, it is highly unlikely that any tsunami from the past 2.3 kya could have been
deposited at this location.

89
CHAPTER V
CONCLUSIONS
1) The 2004 tsunami deposits were usually clearly identifiable in the field when
found on a coastal plain behind a seaward beach ridge or in a lagoon protected by
a seaward beach ridge. The best geomorphic environments to find thick, well-
preserved deposits of the 2004 Indian Ocean tsunami (and by proxy paleotsunami
deposits) on the southeastern coast of India are those that have a distinct seaward
beach ridge and consequent tsunami scour fan such as Mamallapuram,
Thiruvadandhai, Kallar and Vilundamavadi. Field identifiers included the
presence of mafic mineral laminations, an erosional, hummocky lower contact
and tan sediment overlying red preexisting sediments. This study was not able to
differentiate between the 2004 tsunami deposits and the known possible
characteristics of cyclone deposits. For example, a scour fan that matches to the
age of known paleotsunami deposits around the Indian Ocean basin might be
attributable to a past, large tsunami but the fan itself would be difficult to
distinguish from a storm overwash fan.
2) The tsunami deposits showed small, measurable differences in grain size from the
preexisting sediments. Overall, the tsunami-laid sediments were slightly coarser
(0.25 φ) and slightly better sorted than the preexisting sediment. While the
tsunami-laid sediments were slightly fine-skewed relative to the preexisting
sediments there were no consistent trends in kurtosis amongst the tsunami-laid
sediments relative to the preexisting sediments. The presence of mafic mineral

90
3) laminations within some of the tsunami deposits made the tsunami deposits finer
and more poorly sorted relative to the massive underlying quartz sand units.
When absent, the tsunami deposit was massive quartz sand. The small margin of
statistical difference and the possibility that the mafic mineral laminations could
be reworked by bioturbation or eolian processes dictates that future studies might
not be able to rely on sedimentary structures and statistics alone to identify
ancient tsunami-laid sands. The 2004 tsunami deposits in individual pits at some
sites showed multiple small-scale grading patterns possibly reflecting a
combination of multiple waves and turbulent flow.
4) Transect-scale analysis and a comparison of southern sites to northern sites in
different geomorphic settings indicate that the available sand for transport was the
greatest factor affecting grain size statistics (Figures 18, 27-29). As a result of
regional geomorphology and lithology, the northern sites in this study had coarser
overall grain size than the southern sites (Fig. 19). However, there was a strong
sorting similarity between the northern and southern sites. Distinct clustering of
moderate to moderately-well sorted sediments in northern and southern sites
implies that the majority of sites in both regions have been reworked by similar
processes; most likely normal beach processes (Fig. 19). This strongly suggests
that the 2004 tsunami entrained locally available sediment. The northern sites had
lower inundation values and tsunami deposit thicknesses than the southern sites
(Figures 2, 12). One of the main causes of these variations in the inundation and

91
deposit thickness was the prominent seaward beach ridge at many of the northern
sites that was only present at Vilundamavadi and Kallar in the southern region.
5) Sediment deposited by the December 26, 2004 tsunami was relatively unchanged
3 years after the event (February, 2008). However, bioturbation and the high
level of human activity near the coastline and the lack of clearly defined grain size
parameters may result in identification problems of the in situ field identifiers
such as mafic mineral laminations and an erosional, hummocky lower boundary,
if they are destroyed or altered.
6) The Mastersizer 2000 laser particle size analyzer produced similar results to the
wet sieve method. The main difference occurred in samples containing
substantial (20%) mafic minerals which were elongated and tended to measure
around 0.25φ finer in wet sieve analysis relative to the laser diffraction analysis.
7) The complex nature and relatively poor understanding of southeastern Indian
coastal processes necessitates further study that would focus on dating ancient
inland beach ridges to better constrain how the shoreline evolved in the Holocene.
This information could then better direct future studies toward potential
paleotsunami preservation sites, based on the modern examples of tsunami
deposits at Mamallapuram, Thiruvadandhai, Kallar and Vilundamavadi.
8) The Holocene sediment history of the southeastern coast of India is highly
variable, with Mamallapuram being nearly 2.3 kya old within 200 meters of the
current mean swash zone and nearby Thiruvadandhai being only 100 years old
within 200 meters of the current mean swash zone in similar geomorphic

92
environments. These differences in age could be related to zones of erosion,
stability or progradation. The younger OSL ages from Thiruvadandhai, Kallar,
Aalikuppam and Vilundamavadi indicate a relatively high rate of sedimentation
near the shoreline and points toward the possibility that the swales behind the
landward beach ridges at these sites might preserve evidence of the last large
tsunami event between 1000-1300 years ago (Rajendran et al., 2013). Dating
coastal and landward beach ridges along the coast could help determine the timing
and existence of depositional environments with the potential for the preservation
and identification of paleotsunami deposits.
Summary
The southeastern coast of India contains environments with preservation potential
and sufficient age to capture the documented paleotsunami deposits from around the
Indian Ocean basin. We recommend searching in the swales immediately behind the
landward beach ridges for evidence of ancient fans. While it would be difficult to
distinguish sedimentologically or geomorphologically whether a fan is from a
paleotsunami or a past cyclone, ages that correlate with paleotsunami deposits from
across the Indian Ocean basin would provide supporting evidence of the recurrence
interval of large tsunamis that affect the Indian coastline.

93
REFERENCES CITED
Angusamy, N., Rajamanickam, G., 2006, Depositional environment of sediments along
southern coast of Tamil Nadu, India: Oceanologia, v. 49, p. 41-57.
Atwater, B., 1987, Evidence for great Holocene earthquakes along the outer coast of
Washington State: Science, v. 236, No. 4804, p. 942-944
Balasubrahmanyan, M., 2006, Geology and tectonics of India: an overview: International
Association for Gondwana Research, Mem. No. 9, 205 pp.
Bilham, R., Engdahl, E.R., Feldl, N., and Satyabala, S.P., 2005, Partial and complete
rupture of the Indo-Andaman plate boundary 1847-2004: Seismol. Res. Letters, vol.
76, p. 299-311.
Bourgeois, J., Reinhart, M., 1989, Onshore erosion and deposition by the 1960 tsunami at
Rio Lingue estuary, south-central Chile: Eos 70, Meeting Supplement, 1331.
Bruckner, H., 1989, Late Quaternary shorelines in India: Late Quaternary sea-level
correlation and applications, Springer Netherlands, p. 169-194.
Camoin, G.F., Colonna, M., Montaggioni, L.F., Casanova, J., Faure, G., and Thomassin,
B.A., 1997, Holocene sea level changes and reef development in the southwestern
Indian Ocean: Coral Reefs, v. 16, p. 247-259.
Chadha, R.K., Latha, G., Yeh, H., Peterson, C., and Katada, T., 2005, The tsunami of the
great Sumatra earthquake of M 9.0 on 26 December 2004—impact on the east coast
of India: Current Science, v. 88, p. 1297-1301.
Choowong, M., Murakoshi, N., Hisada, K., Charusiri, P., Daorerk, V., Charoentitirat, T.,
Chutakositkanon, V.., Jankaew, K., Kanjanapayont, P., 2007, Erosion and Deposition
by the 2004 Indian Ocean Tsunami in Phuket and Phang-nga Provinces, Thailand:
Journal of Coastal Research, v. 23, Iss. 5, p. 1270-1276.
Dawson, A.G. and Shi, S., 2000, Tsunami deposits: Pure and Applied Geophysics, v.
157, p. 875-897.
Dawson, A., Stewart, I., 2007, Tsunami deposits in the geological record: Sedimentary
Geology, v. 200, Iss. 3-4, p. 166-183.
Dominey-Howes, D., 2007, Geological and historical records of tsunami in Australia:
Marine Geology, v. 239, Iss. 1-2, p. 99-123.
Eipert, A., 2004, Optically stimulated luminescence (OSL) dating of sand deposited by
the 1960 tsunami in south-central Chile: Geology Comps Papers, Carleton College,
36 pp.
94
Ely, L.; Cisternas, M., Lagos, M., Orem, C., Wesson, R., 2010, Geological evidence of
past tsunamis at the boundary between the 1960 and 1835 earthquake rupture areas,
South-central Chile: American Geophysical Union Chapman Conference on Giant
Earthquakes and Their Tsunamis, Chile, May 16-24 2010, abstract 16P-10, p. 22.
Gelfenbaum, G., Jaffe, B., 2003, Erosion and sedimentation from the 17 July, 1998 Papua
New Guinea Tsuami: Pure and Applied Geophysics, v. 160, No. 10-11, p. 1969-1999.
Goff, J, McFadgen, B.G. and Chagué-Goff, C., 2004, Sedimentary differences between
the 2002 Easter storm and the 15th
-century Okoropunga tsunami, southeastern North
Island, New Zealand: Marine Geology, v. 204, p. 235-250.
Goff, J., Lane E., Arnold, J., 2009, The tsunami geomorphology of coastal dunes: Natural
Hazards and Earth Science Systems, v. 9, p. 847-854.
Hashimi, N.H., Nigam, R., Nair, R.R. and Rajagopalan, G., 1995, Holocene sea level
fluctuations on western Indian continental margin: An update: Journal of the
Geological Society of India, v. 46, p. 157-162.
Hawkes, A., Bird, M., Cowie, S., Grundy-Warr, C., Horton, B., Tan Shau Hwai, A., Law,
L., Maccgregor, C., Nott, J., Eong Ong, J., Rigg, J., Robinson, R., Tan-Mullins, M.,
Tiong Sa, T., Yasin, Z., Wan Aik, L., 2007, Sediments deposited by the 2004 Indian
Ocean Tsunami along the Malaysia-Thailand Peninsula: Marine Geology, v. 242, Iss.
1-3, p. 169-190.
Huntley, D., Clague, J., 1996, Optical dating of tsunami-laid sands: Quaternary Research,
v. 46, p. 127-140.
Jackson, K., Eberli, G., Rankey, E., Amelung, F., Moore, A., 2008, High recurrence rate
of paleotsunamis in Southeastern Sri Lanka: Eos Trans. AGU, 89(53), Fall Meet.
Suppl., Abstract OS52A-06.
Jaffe, B., Gelfenbaum, G., 2007, A simple model for calculating tsunami flow speed from
tsunami deposits: Sedimentary Geology, Vol. 200, p. 347-361.
Jankaew, K., Atwater, B.F., Sawai, Y., Choowong, M., Charoentitirat, T., Martin, M.E.,
and Prendergast, A., 2008, Medieval forewarning of the 2004 Indian Ocean tsunami
in Thailand: Nature, v., 455, p. 1228-1231.
Kale, V.S. and Rajaguru, S.N., 1985, Neogene and Quaternary transgressional and
regressional history of the west coast of India: an overview: Bulletin of the Deccan
College Research Institute.
Kamatani, A., 1982, Dissolution rates of silica from diatoms decomposing at various
temperatures, v. 68, p. 91-96.

95
Kanamori, H., 2006, Lessons from the 2004 Sumatra-Andaman earthquake: Transactions
of Royal Society A. v. 364, P. 1927-1945.
Kitamura, N., Kotaka, T., Kataoka, J., 1961, Ofunato-Shizugawa chiku, in: Geological
Observations of the Sanriku coastal region damaged by tsunami due to the Chile
earthquake in 1960: Institute of Geology and Paleontology of Tohoku University 52,
Tohoku, Japan, p. 28-40.
Kowalik, Z., Knight, W., Logan, T., Whitmore, P., 2005, The Tsunami of 26 December,
2004: Numerical modeling and energy considerations: Pure and Applied Geophysics,
v. 164, Nos 2-3, p. 379-393.
Kumar, K., Achyuthan, H., 2006, A record of palaeo-tsunami in the Indian Ocean:
Marine Geodesy, v. 29, Iss. 4, p. 253-263.
MacInnes, B., Bourgeois, J., Pinegina, T., Martin, M., Kravchunovskaya, E., 2005,
Geomorphic effects of tsunamis in Asacha and Mutnaya Bays, southern Kamchatka
Peninsula, Russia: Eos 86, Abstract T11A-0360.
Mason, C., Folk, R., 1958, Differentiation of beach, dune and aeolian flat environments
by size analysis, Mustang Island, Texas: Journal of Sedimentary Research, v. 28, p.
211-226.
Merrifield, M., Firing, Y., Aarup, T., Agricole, W., Brundrit, G., Chang-seng, D., Farre,
R., Kilonsky, B., Knight, W., Kong, L., Magori, C., Manurung, P., McCreery, C.,
Mitchell, W., Pillay, S., Schindele, F., Shillington F., Testut, L., Wijeratne, E.,
Caldwell, P., Jardin, J., Nakahara, S., Porter F., Turetsky, N., 2005, Tide gauge
observations of the India Ocean tsunami, December 26, 2004: Geophysical Research
Letters, v. 32, 4 pp.
Mohapatra, S., Prasad, M., 1999, Shoreline changes and their impact on the
archaeological structures at Mahabalipuram: Gondwana Geology Magazine, v. 4, p.
225-233.
Monecke, K., Finger, W., Klarer, D., Kongko, W., McAdoo, B.G., and Moore, A.L.,
2008, A 1,000-year sediment record of tsunami recurrence in northern Sumatra:
Nature, v. 455, p. 1232-1234.
Mori, N., Takahashi, T., Yasuda, T., Yanagisawa, H., 2011, Survey of 2011 Tohoku
earthquake tsunami inundation and run-up: Geophysical Research Letters, v. 38, Iss.
7, 6 pp.

96
Morton, R.A., Gelfenbaum, G., and Jaffe, B.E., 2007, Physical criteria for distinguishing
sandy tsunami and storm deposits using modern examples: Sedimentary Geology, v.
200, p. 184-207.
Murray, A., Wintle, A., 2000, Luminescence dating of quartz using an improved single-
aliquot regenerative-dose protocol: Radiation Measurements, v. 32, p. 57-73.
Nanayama, F., Shigeno, K., Satake, K., Shimokawa, K., Koitabashi, S., Miyasaka, S.,
Ishii, M., 2000, Sedimentary differences between the 1993 Hokkaido-nansei-oki
tsunami and the 1959 Miyakojima typhoon at Taisei, southwestern Hokkaido,
northern Japan: Sedimentary Geology, v. 135, Iss. 1-4, p. 255-264.
Nanayama, F., Satake, K., Furukawa, R., Shimokawa, K., Atwater, B., Shigeno, K. and
Yamaki, S., 2003, Unusually large earthquakes inferred from tsunami deposits along
the Kuril Trench: Nature, v. 424, p. 660-663.
Okal, E.A. and Synolakis, C.E., 2008, Far-field tsunami hazard from mega-thrust
earthquakes in the Indian Ocean: Geophysical J. Int., v. 172, p. 995-1015.
Patra, P., Santhanam, M., Potty K., Teware, M., Rao, P., 2000, Simulation of tropical
cyclones using regional weather predictoin models: Current Science, v. 79, No. 1, p.
70-78.
Peterson, Curt, Yeh, Harry, Chadha, R.K., Latha, G., Katada, Toshitaka, 2005, Flood
elevation, inundation distance and flow competence of the 2004 Sumatra-Andaman
tsunami, as recorded by tsunami deposits in thirteen shore-normal profiles from the
Tamil Nadu coastline, India: ISET Journal of Earthquake Technology, Paper No. 458,
v. 42, No. 4, p. 95-110.
Pirazzoli, P.A., 1991, World atlas of Holocene sea-level changes: Elsevier Oceanography
Series, Amsterdam, Netherlands.
Prakash, T., Chattopadhyay, S., Nair, A., 2006, Impact of tsunami on the Kerala Coast
and Rehabilitation Plan for the worst affected stretch at Alappad. 26th December
2004 Tsunami: Causes, Effects, Remedial measures, Pre and Post tsunami Disaster
Management—A Geoscientific perspective: New Academic Publishers, New Delhi,
p. 150-174.
Prothero, D., Schwab, F., 2004, Sedimentary geology: an introduction to sedimentary
rocks and stratigraphy: W. H. Freeman and Co., New York, 557 pp.
Rajendran, C.P., Rajendran, K., Anu, R., Earnest, A., Machado, T., Mohan, P.M., and
Freymueller, J., 2007, Crustal deformation and seismic history associated with the
2004 Indian Ocean earthquake: A perspective from the Andaman-Nicobar Islands:
Bull. Seismol. Society of America, v. 97, p. No. 1A, p. S174-S191.

97
Rajendran, C.P., Rajendran, K., Andrade, V., Srinivasalu, S., 2013, Ages and relative
sizes of pre-2004 tsunamis in the Bay of Bengal inferred from geologic evidence in
the Andaman and Nicobar Islands: Journal of Geophysical Research: Solid Earth, v.
118, p. 1-18.
Ramaswami, N., 1989, 2000 Years of Mamallapuram: New Delhi Publication, p. 372.
Ramasamy, S., Kumanan, C., Saravanavel, J., Selvakumar, R., 2006a, Geosystem
responses to December 26, 2004 tsunami and mitigation strategies for Cuddalore—
Nagapattinam Coast, Tamil Nadu: Journal Geological Society of India, v. 68, p. 967-
983.
Ramasamy, S., Saravanavel, J., Selvakumar, R., 2006b, Late holocene geomorphic
evolution of Cauvery Delta, Tamil Nadu: Journal Geological Society of India, v. 67,
May 2006, p. 649-657.
Ramasamy, S., Ramesh, D., Paul, M., Kusumgar, S., Yadava, M., Nair, A., Sinha, U.,
Joseph, T., 1998, Rapid land buidling activity along Vedaranniyam coast and its
possible implications: Current Science, v. 75, No. 9, p. 884-886.
Rhodes B., Tuttle, M., Horton B., Doner L., Kelsey H., Nelson A., Cisternas M., 2006,
Paleotsunami Research, Eos, v. 87, No. 21, p. 205, 209.
Richmond, B., Jaffe, B., Gelfenbaum, G., Morton, R., 2006, Geologic impacts of the
2004 Indian Ocean tsunami on Indonesia, Sri Lanka, and the Maldives: Z. Geomorph,
v. 146, p. 235-251.
Sawai, Y., Namegaya, Y., Okamura, Y., Satake, K., Shishikura, M., 2012, Challenges of
anticipating the 2011 Tohoku earthquake and tsunami using coastal geology:
Geophysical Research Letters, v. 39, Iss. 21, 6 pp.
Seralathan, P., 2006, Post tsunami sediment characterization of Tamil Nadu coast, 26th
December 2004 tsunami: causes, effects, remedial measures, pre and post tsunami
disaster management—a geoscientific perspective: New Academic Publishers, New
Delhi, p. 59-82.
Sperazza, M., Moore, J., Hendrix, M., 2004, High-resolution particle size analysis of
naturally occurring very fine-grained sediment through laser diffractometry: Journal
of Sedimentary Research: v. 74, No. 5, p. 736-743.
Srinivasalu, S., Thangadurai, N., Switzer, A.D., Ram Mohan, V. And Ayyamperumal, T.,
2007, Erosion and sedimentation of Kalpakkam (N Tamil Nadu, India) from the 26th
December 2004 tsunami: Marine Geology, v. 240, p. 65-75.

98
Srinivasalu, S., Rajendran, C., Rajendran, K., Mponniah, J., Priyadarsi, R., Debajyoti, U.,
Maheswari, B., Judith D. Silva, P., Saravanan, P., 2010, Geologic clues for ancient
tsunamis in Southeast coast of India: American Geophysical Union Chapman
Conference on Giant Earthquakes and Their Tsunamis, Chile, May 16-24 2010,
abstract 19P-5, p. 49.
Switzer, A., Jones, B., 2008, Large-scale washover sedimentation in a freshwater lagoon
from the southeast Australian coast: sea-level change, tsunami of exceptionally large
storm?: The Holocene, v. 18, No. 5, p. 787-803.
Titov, V., Rabinovich, A., Mofjeld, H., Thomson, R., Gonzalez, F., 2005, The global
teach of the 26 December 2004 Sumatra Tsunami: Science, v. 309, No. 5743, p.
2045-2048.
Vaidyanadhan, R., 2005, The Eastern Ghats: Geological Society of India, v. 22, p. 121-
138.
Wenkh, H., Bulakh, A., 2004, Minerals: their constitution and origin: Cambridge
University Press, New York, 646 pp.
Yeh, H., Francis, M., Peterson, C., 2007, Effects of the 2004 Great Sumatra Tsunami:
Southeast Indian Coast: J. Wtrwy., Port, Cpast., and Oc. Engrg., v. 133, Iss. 6, p. 382-
400.

99
APPENDICES
Appendix A
Stratigraphic Descriptions
The stratigraphic columns in Appendix A are in order from north to south as
shown on Figure 2 and listed in Table 1.
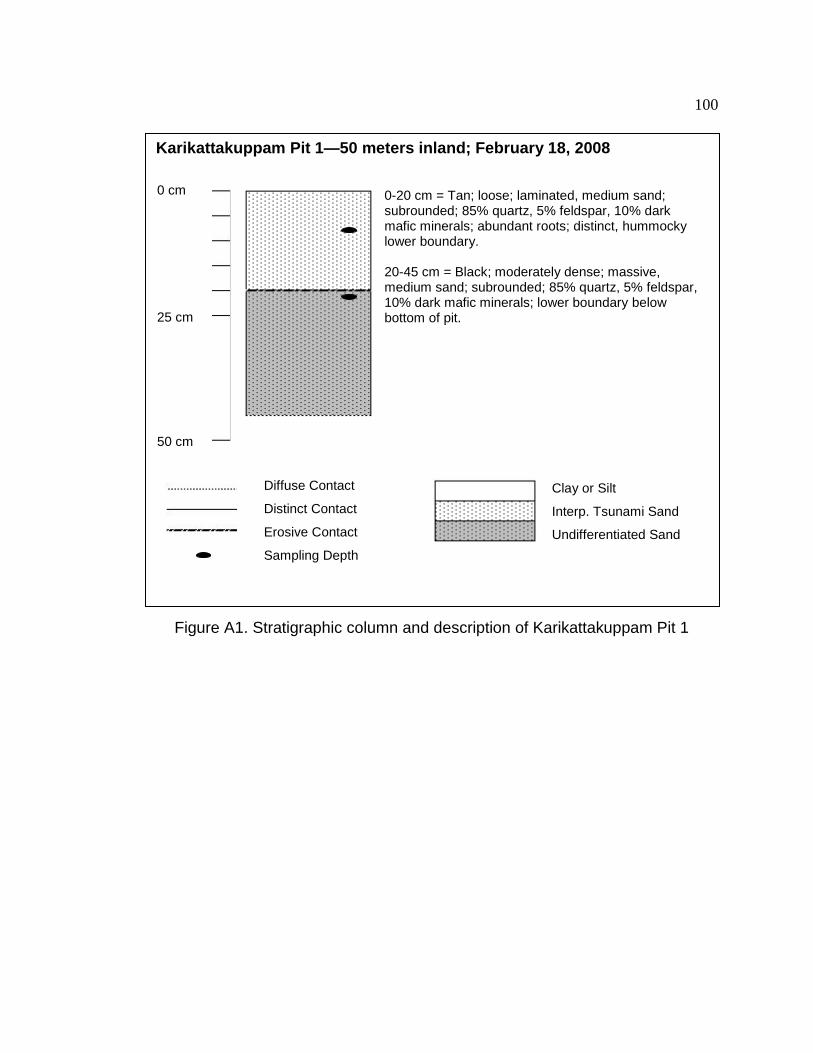
100
Karikattakuppam Pit 1—50 meters inland; February 18, 2008
0-20 cm = Tan; loose; laminated, medium sand; subrounded; 85% quartz, 5% feldspar, 10% dark mafic minerals; abundant roots; distinct, hummocky lower boundary. 20-45 cm = Black; moderately dense; massive, medium sand; subrounded; 85% quartz, 5% feldspar, 10% dark mafic minerals; lower boundary below bottom of pit.
Figure A1. Stratigraphic column and description of Karikattakuppam Pit 1
0 cm
25 cm
50 cm
Clay or Silt
Interp. Tsunami Sand
Undifferentiated Sand
Diffuse Contact
Distinct Contact
Erosive Contact
Sampling Depth
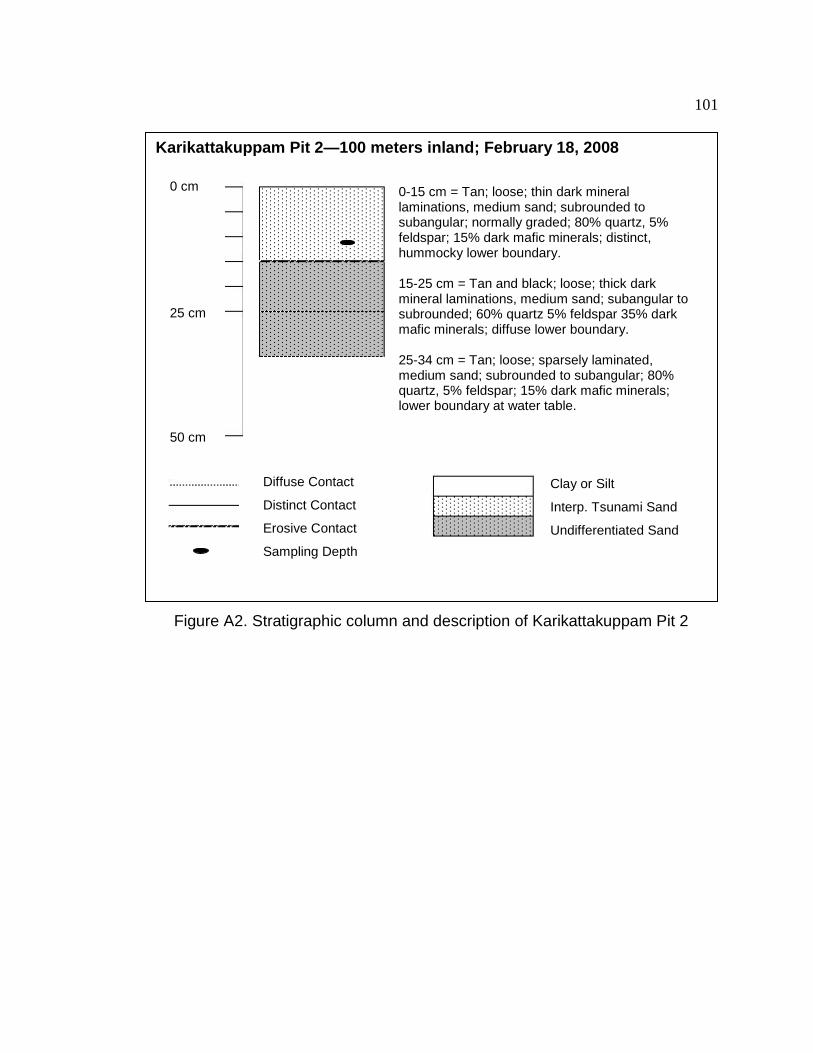
101
Figure A2. Stratigraphic column and description of Karikattakuppam Pit 2
Karikattakuppam Pit 2—100 meters inland; February 18, 2008
0-15 cm = Tan; loose; thin dark mineral laminations, medium sand; subrounded to subangular; normally graded; 80% quartz, 5% feldspar; 15% dark mafic minerals; distinct, hummocky lower boundary. 15-25 cm = Tan and black; loose; thick dark mineral laminations, medium sand; subangular to subrounded; 60% quartz 5% feldspar 35% dark mafic minerals; diffuse lower boundary. 25-34 cm = Tan; loose; sparsely laminated, medium sand; subrounded to subangular; 80% quartz, 5% feldspar; 15% dark mafic minerals; lower boundary at water table.
0 cm
25 cm
50 cm
Clay or Silt
Interp. Tsunami Sand
Undifferentiated Sand
Diffuse Contact
Distinct Contact
Erosive Contact
Sampling Depth

102
Karikattakuppam Pit 3—200 meters inland; February 18, 2008
0-2 cm = Tan; loose; massive, medium sand; subrounded to subangular; 70% quartz, 5% feldspar, 25% dark mafic minerals; distinct, hummocky lower boundary. 2-40+ cm = Red; moderately dense; massive, medium sand; subangular to subrounded; 80% quartz, 5% feldspar, 15% dark mafic minerals; lower boundary below base of pit.
Figure A3. Stratigraphic column and description of Karikattakuppam Pit 3
0 cm
25 cm
50 cm
Clay or Silt
Interp. tsunami Sand
Undifferentiated Sand
Diffuse Contact
Distinct Contact
Erosive Contact
Sampling Depth

103
Karikattakuppam Pit 4—250 meters inland; February 18, 2008
0-10 cm = Tan; loose; massive; fine-medium tsunami sand; subrounded to subangular; 90% quartz, 5% feldspar, 5% dark mafic minerals; distinct, hummocky lower boundary. 10-20 cm = Dark red; dense; massive sandy clay; agricultural unit for coconut plantation preexisting the 2004 tsunami; distinct lower boundary. 20-40 cm = Orange-tan; moderately dense; medium sand; subangular to subrounded; 90% quartz, 5% feldspar, 5% dark mafic minerals; lower boundary below bottom of pit.
Figure A4. Stratigraphic column and description of Karikattakuppam Pit 4
0 cm
25 cm
50 cm
Clay or Silt
Interp. Tsunami Sand
Undifferentiated Sand
Diffuse Contact
Distinct Contact
Erosive Contact
Sampling Depth

104
Muttukaddu Pit 1—1500 meters inland; February 18, 2008
0-0.5 cm = White-tan; moderately dense; massive; silt; distinct lower boundary. 0.5-2.5 = Brown; moderately dense; mottled silt; distinct lower boundary. 2.5-5.5 cm = Tan; moderately dense; faint dark mineral laminations; fine tsunami sand; subrounded; 90% quartz, 5% feldspar, 5% dark mafic minerals; distinct, hummocky lower boundary. 5.5-7.5 cm = Dark gray; moderately dense; massive; silt; distinct lower boundary. 7.5-11 cm = Tan; moderately dense; massive; medium sand; subrounded, occ subangular, 90% quartz, 5% feldspar, 5% dark mafic minerals; distinct lower boundary. 11-16 cm = Gray; moderately dense; massive; fine sand; subrounded, occ subangular, 90% quartz, 5% feldspar, 5% dark mafic minerals; distinct lower boundary. 16-25+ cm = Red-gray; moderately dense; heavily mottled, fine-medium sand; 90% quartz, 5% feldspar, 5% dark mafic minerals; lower boundary at water table.
Figure A5. Stratigraphic column and description of Muttukaddu Pit 1
0 cm
25 cm
50 cm
Clay or Silt
Interp. Tsunami Sand
Undifferentiated Sand
Diffuse Contact
Distinct Contact
Erosive Contact
Sampling Depth

105
Kovalam Pit 1—40 meters inland; February 12, 2008
0-2 cm = Tan; moderately dense; massive; medium tsunami sand; subrounded to subangular; 90% quartz, 5% feldspar, 5% dark mafic minerals; contains numerous grass roots; distinct lower boundary 2-10 cm = Tan; loose; thick dark mineral laminations; fine-medium tsunami sand; subrounded to subangular; 90% quartz, 5% feldspar, 5% dark mafic minerals; bioturbated; distinct hummocky lower boundary. 10-12 cm = Tan; loose; laminated; fine tsunami sand; subrounded, laminations are subangular; 60% quartz, 5% feldspar 35% dark mafic minerals; distinct lower boundary. 12-15 cm = Tan; loose; laminated; coarse tsunami sand; subangular, occasionally subrounded; 70% quartz, 5% feldspar, 25% dark mafic minerals; inversely graded; distinct lower boundary. 15-20 cm = Tan-brown; loose; massive; medium sand; subrounded to subangular; 90% quartz, 5% feldspar, 5% dark mafic minerals; normally graded; distinct lower boundary. 20-25 cm = Red-tan; loose; massive; medium-coarse sand; subangular to subrounded; 90% quartz, 5% feldspar, 5% dark mafic minerals; mottled; gradational lower boundary. 25-35 cm = Gray-brown; loose; massive; medium-coarse sand; subrounded to subangular; 90% quartz, 5% feldspar, 5% dark mafic minerals; distinct lower boundary at local water table.
Figure A6. Stratigraphic column and description of Kovalam Pit 1
0 cm
25 cm
50 cm
Clay or Silt
Interp. Tsunami Sand
Undifferentiated Sand
Diffuse Contact
Distinct Contact
Erosive Contact
Sampling Depth

106
Thiruvadandhai Pit 1—50 meters inland; February 11, 2008
0-2 cm = Red; loose; massive; medium tsunami sand; subrounded to subangular; 90% quartz, 5% feldspar, 5% dark mafic minerals; diffuse lower boundary. 2-12 cm = Red; loose; thin dark mineral laminations; medium tsunami sand; subrounded to subangular; 80% quartz, 5% feldspar, 15% dark mafic minerasl; distinct, hummocky lower boundary. 12-33 cm = Dark gray; moderately dense; massive; medium-coarse sand; subangular, occasionally subrounded; 90% quartz, 5% feldspar, 5% dark mafic minerals; distinct lower boundary at the local water table.
Figure A7. Stratigraphic column and description of Thiruvadandhai Pit 1
0 cm
25 cm
50 cm
Clay or Silt
Interp. Tsunami Sand
Undifferentiated Sand
Diffuse Contact
Distinct Contact
Erosive Contact
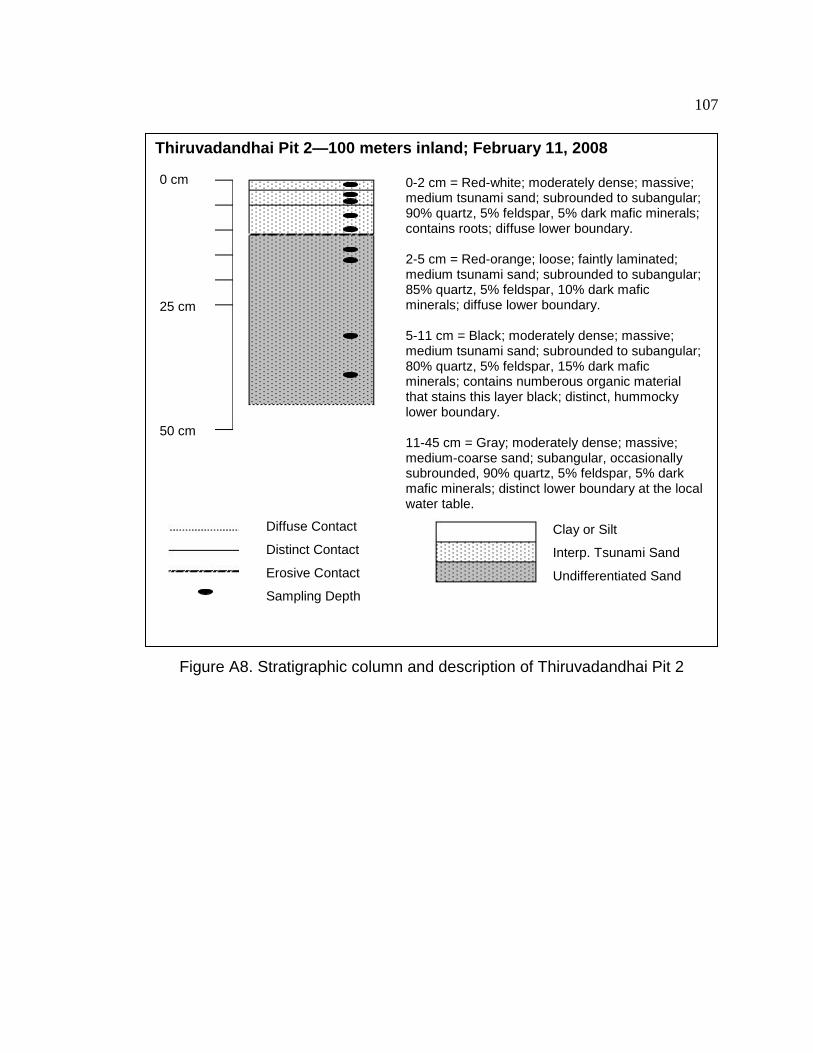
107
Thiruvadandhai Pit 2—100 meters inland; February 11, 2008
0-2 cm = Red-white; moderately dense; massive; medium tsunami sand; subrounded to subangular; 90% quartz, 5% feldspar, 5% dark mafic minerals; contains roots; diffuse lower boundary. 2-5 cm = Red-orange; loose; faintly laminated; medium tsunami sand; subrounded to subangular; 85% quartz, 5% feldspar, 10% dark mafic minerals; diffuse lower boundary. 5-11 cm = Black; moderately dense; massive; medium tsunami sand; subrounded to subangular; 80% quartz, 5% feldspar, 15% dark mafic minerals; contains numberous organic material that stains this layer black; distinct, hummocky lower boundary. 11-45 cm = Gray; moderately dense; massive; medium-coarse sand; subangular, occasionally subrounded, 90% quartz, 5% feldspar, 5% dark mafic minerals; distinct lower boundary at the local water table.
Figure A8. Stratigraphic column and description of Thiruvadandhai Pit 2
0 cm
25 cm
50 cm
Clay or Silt
Interp. Tsunami Sand
Undifferentiated Sand
Diffuse Contact
Distinct Contact
Erosive Contact
Sampling Depth

108
Thiruvadandhai Pit 3—150 meters inland; February 11, 2008
0-2 cm = Red-tan; moderately dense; massive; coarse tsunami sand; subangular, occasionally subrounded; 90% quartz, 5% feldspar, 5% dark mafic minerals; numerous roots; distinct lower boundary. 2-6 cm = Tan; loose; numerous thin dark mineral laminations; fine tsunami sand; subrounded, occasionally subangular; 65% quartz, 5% feldspar, 30% dark mafic minerals; djstinct lower boundary. 6-11 cm = Tan; loose; massive; thin dark mineral laminations; medium-coarse tsunami sand; subrounded to subangular; 80% quartz, 5% feldspar, 15% dark mafic minerals;distinct lower boundary. 11-26 cm = Tan; loose; massive; medium-coarse tsunami sand; subangular to subrounded; 90% quartz, 5% feldspar, 5% dark mafic minerals; distinct lower bondary. 26-32 cm = Red; loose; thin dark mineral laminations; medium tsunami sand; subrounded to subangular; 80% quartz, 5% feldspar, 15% dark mafic minerals; distinct, hummocky lower boundary. 32-35 cm = Black; moderately dense; massive medium sand; subangular to subrounded; 85% quartz, 5% feldspar, 15% dark mafic minerals; diffuse lower boundary. 35-45 cm = Red; moderately dense; massive; mottled; medium-coarse sand; subangular, occasionally subrounded; 90% quartz, 5% feldspar, 5% dark mafic minerals; undulatory diffuse lower boundary. 45-55 cm = Gray; moderately dense; massive; mottled; medium coarse sand; subangular, occasionally subrounded; 90% quartz, 5% feldspar, 5% dark mafic minerals; distinct lower boundary at local water table.
Figure A9. Stratigraphic column and description of Thiruvadandhai Pit 3
0 cm
25 cm
50 cm
Clay or Silt
Interp. Tsunami Sand
Undifferentiated Sand
Diffuse Contact
Distinct Contact
Erosive Contact
Sampling Depth

109
Thiruvadandhai Pit 4—200 meters inland; February 11, 2008
0-14 cm = Tan; loose; thin dark mineral laminations; medium tsunami sand; subrounded to subangular; 85% quartz, 5% feldspar, 10% dark mafic minerals; distinct, hummocky lower boundary 14-40 cm = Red; moderately dense; massive; medium-coarse sand; subangular to subrounded; 90% quartz, 5% feldspar, 5% dark mafic minerals; diffuse lower boundary.
Figure A10. Stratigraphic column and description of Thiruvadandhai Pit 4
0 cm
25 cm
50 cm
Clay or Silt
Interp. Tsunami Sand
Undifferentiated Sand
Diffuse Contact
Distinct Contact
Erosive Contact
Sampling Depth

110
Thiruvadandhai Pit 5—250 meters inland; February 11, 2008
0-5 cm = Tan; loose; massive; medium tsunami sand; subrounded to subangular; 90% quartz, 5% feldspar, 5% dark mafic minerals; diffuse lower boundary. 5-10 cm = Black; moderately dense; massive; medium tsunami sand; subrounded to subangular; 90% quartz, 5% feldspar, 5% dark mafic minerals; distinct, hummocky lower boundary. 10-40 cm = Red; moderately dense; massive; medium-coarse sand; subangular to subrounded; 90% quartz, 5% feldspar, 5% dark mafic minerals; diffuse lower boundary.
Figure A11. Stratigraphic column and description of Thiruvadandhai Pit 5
0 cm
25 cm
50 cm
Clay or Silt
Interp. Tsunami Sand
Undifferentiated Sand
Diffuse Contact
Distinct Contact
Erosive Contact
Sampling Depth
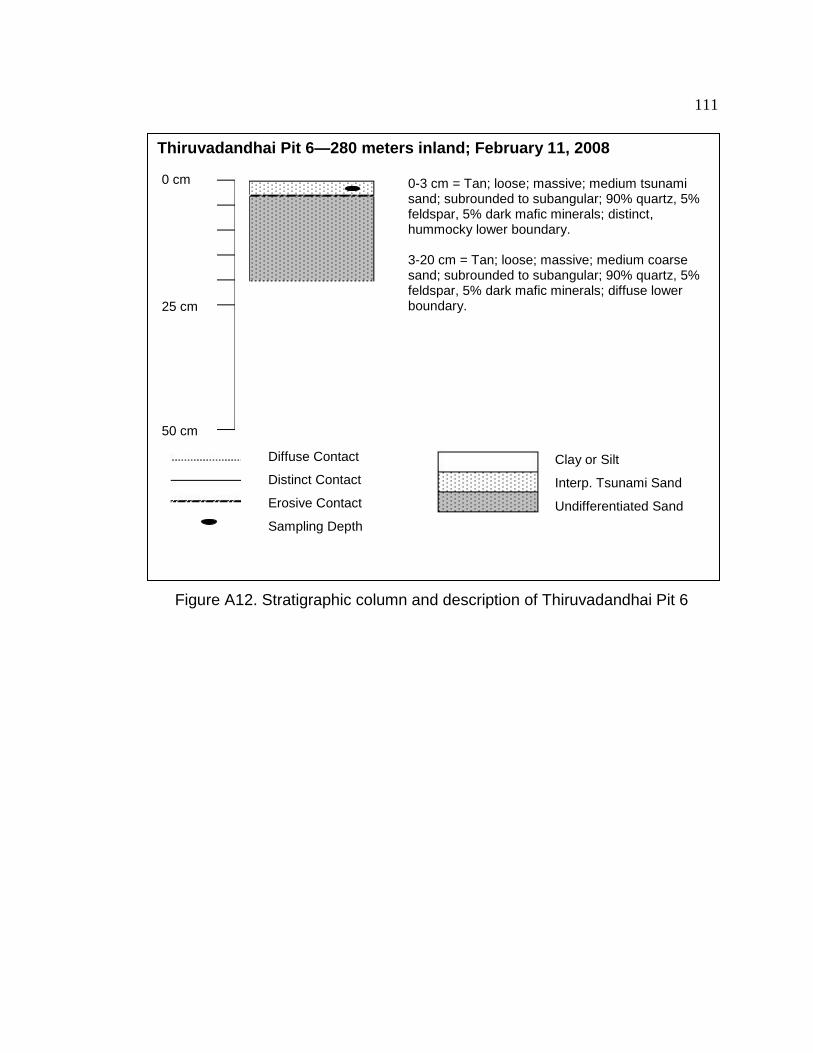
111
Thiruvadandhai Pit 6—280 meters inland; February 11, 2008
0-3 cm = Tan; loose; massive; medium tsunami sand; subrounded to subangular; 90% quartz, 5% feldspar, 5% dark mafic minerals; distinct, hummocky lower boundary. 3-20 cm = Tan; loose; massive; medium coarse sand; subrounded to subangular; 90% quartz, 5% feldspar, 5% dark mafic minerals; diffuse lower boundary.
Figure A12. Stratigraphic column and description of Thiruvadandhai Pit 6
0 cm
25 cm
50 cm
Clay or Silt
Interp. Tsunami Sand
Undifferentiated Sand
Diffuse Contact
Distinct Contact
Erosive Contact
Sampling Depth

112
Thiruvadandhai Pit 7—300 meters inland; February 11, 2008
0-2cm = Tan; loose; massive; medium tsunami sand; subrounded to subangular; 90% quartz, 5% feldspar, 5% dark mafic minerals; distinct, hummocky lower boundary. 3-20 cm = Tan; loose; massive; medium coarse sand; subrounded to subangular; 90% quartz, 5% feldspar, 5% dark mafic minerals; diffuse lower boundary.
Figure A13. Stratigraphic column and description of Thiruvadandhai Pit 7
0 cm
25 cm
50 cm
Clay or Silt
Interp. Tsunami Sand
Undifferentiated Sand
Diffuse Contact
Distinct Contact
Erosive Contact
Sampling Depth

113
Figure A14. Stratigraphic column and description of Vadanemelli Pit 1
Vadanemelli Pit 1—100 meters inland; February 16, 2008
0-3 cm = Black; moderately dense; massive; fine-medium tsunami sand; subrounded to subangular; 90% quartz, 5% feldspar, 5% dark mafic minerals; contains abundant organic material and roots; distinct, lower boundary. 3-9 cm = Tan; loose; thin dark mineral laminations; fine-medium tsunami sand; subrounded to subangular; 85% quartz, 5% felspar; 10% dark mafic minerals; distinct. hummocky lower boundary. 9-11 cm = Black; moderately dense; massive; medium sand; subrounded; 90% quartz, 5% feldspar, 5% dark mafic minerals; abundant organic debris; distinct lower boundary. 11-14 cm = Red-tan; loose; massive; medium-coarse; sand; subangular, occasionally subrounded, 90% quartz, 5% feldspar, 5% dark mafic minerals; distinct lower boundary. 14-15 cm = Black; moderately dense; massive; medium sand; subangular; 90% quartz, 5% feldspar, 5% dark mafic minerals; abundant organic material; distinct lower boundary. 15-22 cm = Gray; loose; massive; medium-coarse; sand; subangular, occasionally subrounded, 90% quartz, 5% feldspar, 5% dark mafic minerals; distinct lower boundary. 22-23 cm = Black; loose; massive; medium sand; subangular to subrounded; 90% quartz, 10% dark mafic minerals; abundant organic material; distinct lower boundary. 23-28 cm = Gray; loose; massive; medium-coarse; sand; subangular, occasionally subrounded, 90% quartz, 5% feldspar, 5% dark mafic minerals; distinct lower boundary. 28-29 cm = Black; moderately dense; massive; medium sand; subrounded; 90% quartz, 5% feldspar, 5% dark mafic minerals; abundant organic material; distinct lower boundary.
0 cm
25 cm
50 cm
Diffuse Contact
Distinct Contact
Erosive Contact
Sampling Depth
Clay or Silt
Interp. Tsunami Sand
Undifferentiated Sand
29-40 cm = Gray; loose; massive; medium-coarse; sand; subangular, occasionally subrounded, 90% quartz, 5% feldspar, 5% dark mafic minerals; distinct lower boundary encounters local water table.

114
Figure A15. Stratigraphic column and description of Mamallapuram Pit 1
Mamallapuram Pit 1—120 meters inland; February 15, 2008
0-32 cm =Red-tan; loose; numerous dark mineral laminations; medium-coarse tsunami sand; subrounded to subangular; 75% quartz, 5% feldspar, 20% dark mafic minerals; laminations concentrated between 5 and 18 cm deep; distinct, hummocky lower boundary. 32-35 cm = Black; moderately dense; massive; medium sand; subrounded to subangular; 80% quartz, 5% feldspar, 15% dark mafic minerals; contains abundant organic material; distinct, lower boundary. 35-60 cm = Dark red-gray; moderately dense; massive; medium-coarse sand; subangular to subrounded; 90% quartz, 5% feldspar, 5% dark mafic minerals; red and gray oxidation/reduction abundant; distinct lower boundary encounters the local water table.
0 cm
25 cm
50 cm
Diffuse Contact
Distinct Contact
Erosive Contact
Sampling Depth
Clay or Silt
Interp. Tsunami Sand
Undifferentiated Sand

115
Mamallapuram Pit 2—200 meters inland; February 13, 2008
0-18 cm = Red-tan; loose; numerous dark mineral laminations; medium-coarse tsunami sand; subrounded to subangular; 80% quartz, 5% feldspar, 15% dark mafic minerals; distinct, hummocky lower boundary. 18-40 cm = Dark red; moderately dense; massive; medium-coarse sand; subangular to subrounded; 95% quartz, 5% scattered mafic minerals and feldspar; diffuse lower boundary.
Figure A16. Stratigraphic column and description of Mamallapuram Pit 2
0 cm
25 cm
50 cm
Clay or Silt
Interp. Tsunami Sand
Undifferentiated Sand
Diffuse Contact
Distinct Contact
Erosive Contact
Sampling Depth

116
Mamallapuram Pit 3—250 meters inland; February 13, 2008
0-8 cm = Red-tan; loose; thin dark mineral laminations; medium tsunami sand; subrounded to subangular; 85% quartz, 5% feldspar, 10% dark mafic minerals; distinct, hummocky lower boundary. 8-21 cm = Black; moderately dense; massive; medium-coarse sand; subangular to subrounded; 90% quartz, 5% feldspar, 5% dark mafic minerals; contains abundant organic material; distinct lower bondary. 21-66 cm = Dark red; moderately dense; massive; medium-coarse sand; subangular to subrounded; 95% quartz, 5% scattered mafic minerals and feldspar; diffuse lower boundary.
Figure A17. Stratigraphic column and description of Mamallapuram Pit 3
0 cm
25 cm
50 cm
Clay or Silt
Interp. Tsunami Sand
Undifferentiated Sand
Diffuse Contact
Distinct Contact
Erosive Contact
Sampling Depth
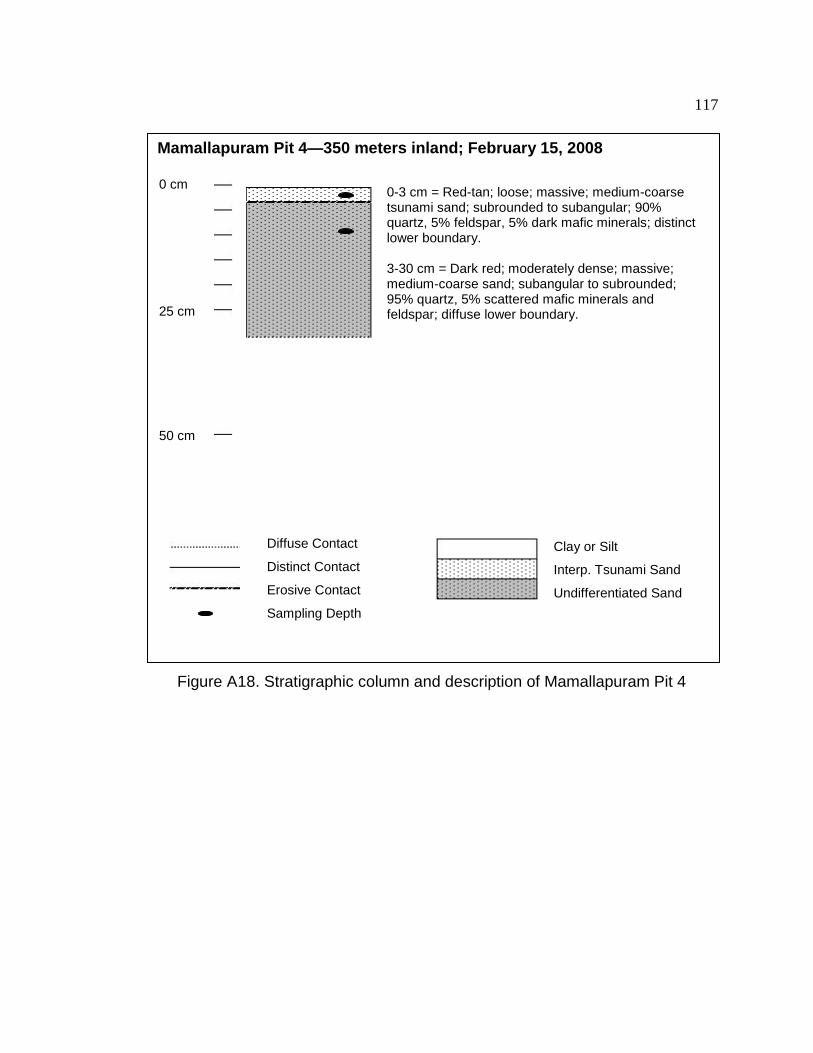
117
Mamallapuram Pit 4—350 meters inland; February 15, 2008
0-3 cm = Red-tan; loose; massive; medium-coarse tsunami sand; subrounded to subangular; 90% quartz, 5% feldspar, 5% dark mafic minerals; distinct lower boundary. 3-30 cm = Dark red; moderately dense; massive; medium-coarse sand; subangular to subrounded; 95% quartz, 5% scattered mafic minerals and feldspar; diffuse lower boundary.
Figure A18. Stratigraphic column and description of Mamallapuram Pit 4
0 cm
25 cm
50 cm
Clay or Silt
Interp. Tsunami Sand
Undifferentiated Sand
Diffuse Contact
Distinct Contact
Erosive Contact
Sampling Depth
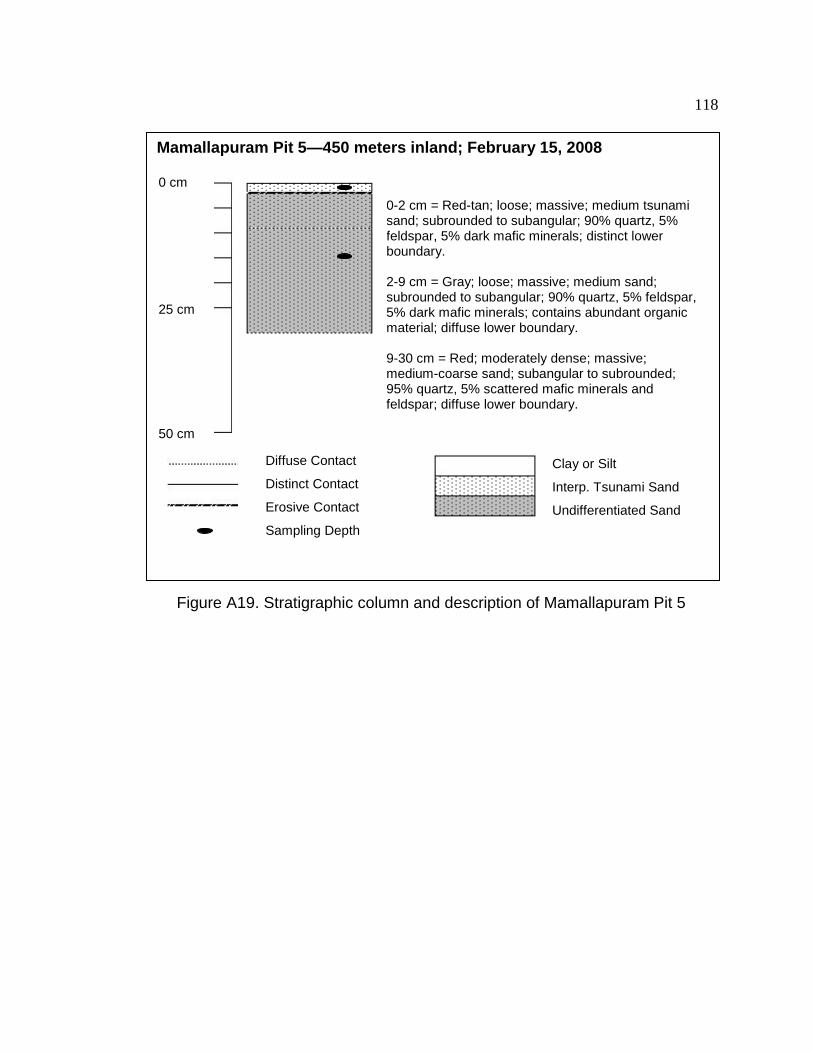
118
Mamallapuram Pit 5—450 meters inland; February 15, 2008
0-2 cm = Red-tan; loose; massive; medium tsunami sand; subrounded to subangular; 90% quartz, 5% feldspar, 5% dark mafic minerals; distinct lower boundary. 2-9 cm = Gray; loose; massive; medium sand; subrounded to subangular; 90% quartz, 5% feldspar, 5% dark mafic minerals; contains abundant organic material; diffuse lower boundary. 9-30 cm = Red; moderately dense; massive; medium-coarse sand; subangular to subrounded; 95% quartz, 5% scattered mafic minerals and feldspar; diffuse lower boundary.
Figure A19. Stratigraphic column and description of Mamallapuram Pit 5
0 cm
25 cm
50 cm
Clay or Silt
Interp. Tsunami Sand
Undifferentiated Sand
Diffuse Contact
Distinct Contact
Erosive Contact
Sampling Depth
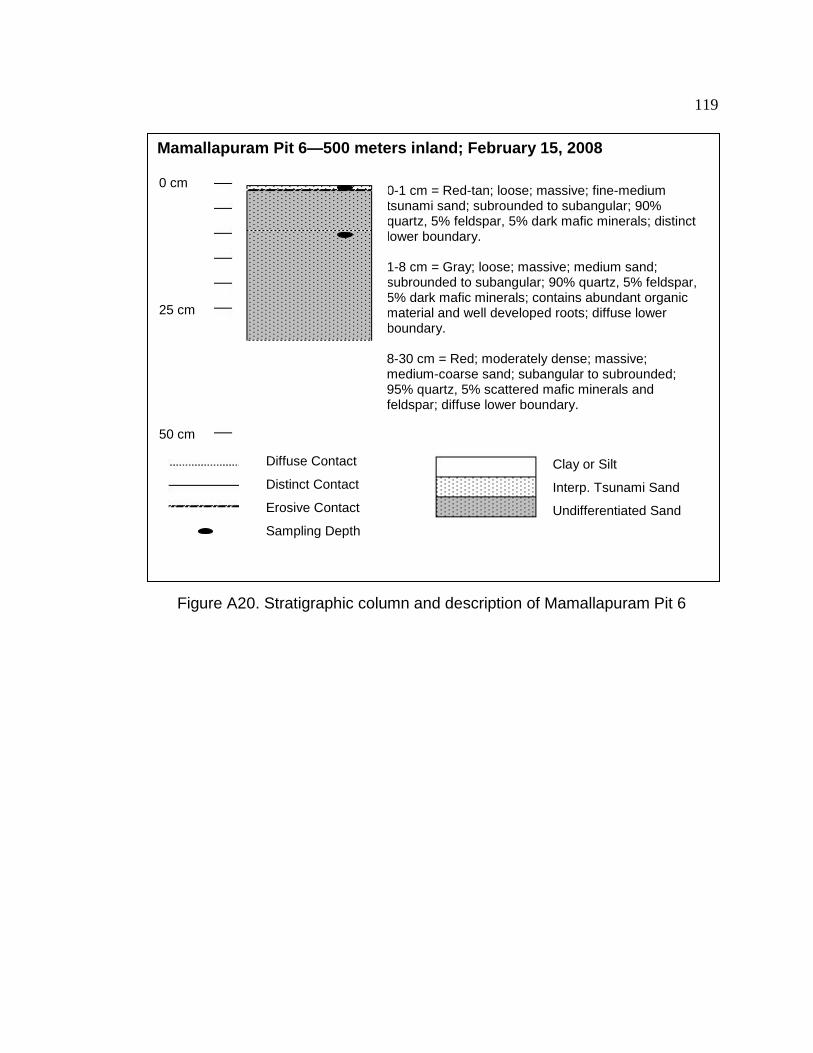
119
Mamallapuram Pit 6—500 meters inland; February 15, 2008
0-1 cm = Red-tan; loose; massive; fine-medium tsunami sand; subrounded to subangular; 90% quartz, 5% feldspar, 5% dark mafic minerals; distinct lower boundary. 1-8 cm = Gray; loose; massive; medium sand; subrounded to subangular; 90% quartz, 5% feldspar, 5% dark mafic minerals; contains abundant organic material and well developed roots; diffuse lower boundary. 8-30 cm = Red; moderately dense; massive; medium-coarse sand; subangular to subrounded; 95% quartz, 5% scattered mafic minerals and feldspar; diffuse lower boundary.
Figure A20. Stratigraphic column and description of Mamallapuram Pit 6
0 cm
25 cm
50 cm
Clay or Silt
Interp. Tsunami Sand
Undifferentiated Sand
Diffuse Contact
Distinct Contact
Erosive Contact
Sampling Depth

120
Figure A21. Stratigraphic column and description of Aalikuppam Pit 1
Aalikuppam Pit 1—150 meters inland; February 9, 2008
0-5 cm = Gray-tan; moderately dense; massive; medium-coarse tsunami sand; subrounded to subangular; 85% quartz, 10% feldspar, 5% dark mafic minerals; contains few roots; diffuse lower boundary. 5-9 cm = Gray; loose; massive; medium tsunami sand; subrounded to subangular; 85% quartz, 10% feldspar, 5% dark mafic minerals; contains minor amounts of silt; distinct, hummocky lower boundary. 9-23 cm = Red-tan; moderately dense; massive; medium sand; subangular; 90% quartz, 5% feldspar, 5% dark mafic minerals; diffuse lower boundary. 23-34 cm = Red-tan; moderately dense; massive; medium-fine sand; subangular; 90% quartz, 5% feldspar, 5% dark mafic minerals; diffuse lower boundary. 34- 63 cm = Red-tan; moderately dense; massive; medium-coarse sand; subangular to subrounded; 90% quartz 5% feldspar, 5% dark mafic minerals; diffuse lower boundary. 63-88 cm = Gray; dense; weakly bedded; coarse sand; subangular; 80% quartz, 10% feldspar, 10% dark mafic minerals; lower boundary is the top of the local water table.
Clay or Silt
Interp. Tsunami Sand
Undifferentiated Sand
0 cm
25 cm
50 cm
Diffuse Contact
Distinct Contact
Erosive Contact
Sampling Depth

121
Aalikuppam Pit 2—200 meters inland; February 17, 2008
0-2 cm = Tan-white; loose; massive, fine sand; subangular to subrounded; 90% quartz, 5% feldspar, 5% black mafic minerals; diffuse lower boundary. 2-4 cm = Tan; loose; massive, fine sand; 90% quartz, 5% feldspar, 5% dark mafic minerals; roots at top and bottom of unit; distinct lower boundary. 4-12 cm = Grayish-red; moderately dense; massive, medium-coarse sand; 90% quartz, 5% feldspar, 5% dark mafic minerals; diffuse lower boundary. 12-30+ cm = Gray; moderately dense; massive, coarse-medium sand; 90% quartz, 5% feldspar, 5% dark mafic minerals; lower boundary below bottom of pit.
Figure A22. Stratigraphic column and description of Aalikuppam Pit 2
0 cm
25 cm
50 cm
Clay or Silt
Interp. Tsunami Sand
Undifferentiated Sand
Diffuse Contact
Distinct Contact
Erosive Contact
Sampling Depth

122
Aalikuppam Pit 3—350 meters inland; February 17. 2008
0-3 cm = Tan; loose; massive, fine-medium sand; 80% quartz, 10% feldspar, 10% dark mafic minerals; distinct, hummocky lower boundary. 3-5 cm = Gray, loose; massive, organic sand; 80% quartz, 10% feldspar, 10% dark mafic minerals; distinct lower boundary. 5-30 cm = Red; moderately dense; mottled, medium-coarse sand; 85% quartz, 5% feldspar, 10% dark mafic minerals; diffuse lower boundary. 30-40+ cm = Red; moderately dense; semi-mottled, medium-coarse sand; 75% quartz, 5% feldspar, 20% dark mafic minerals; lower boundary below base of pit.
Figure A23. Stratigraphic column and description of Aalikuppam Pit 3
0 cm
25 cm
50 cm
Clay or Silt
Interp. Tsunami Sand
Undifferentiated Sand
Diffuse Contact
Distinct Contact
Erosive Contact
Sampling Depth

123
Aalikuppam Pit 4—100 meters inland, south of Pit 1; February 17, 2008
0-4 cm = Tan; moderately dense; organic, fine sand; 85% quartz, 5% feldspar, 10% dark mafic minerals; contains numerous roots; diffuse lower boundary. 4-12 cm = Tan; loose; laminated, fine sand; 75% quartz, 5% feldspar, 20% dark mafic minerals; laminations concentrated at bottom of unit; diffuse, hummocky lower boundary. 12-24 cm = Red-gray; moderately dense; mottled, fine-medium sand; 85% quartz, 5% feldspar, 10% dark mafic minerals; contains some organic material; distinct lower boundary. 24-31 cm = Gray; moderately dense; massive, medium sand; 85% quartz, 10% feldspar, 5% dark mafic minerals; distinct lower boundary. 31-40+ cm = Red; moderately dense; massive, fine sand; 90% quartz, 5% feldspar, 5% dark mafic minerals; lower boundary at base of pit.
Figure A24. Stratigraphic column and description of Aalikuppam Pit 4
0 cm
25 cm
50 cm
Clay or Silt
Interp. Tsunami Sand
Undifferentiated Sand
Diffuse Contact
Distinct Contact
Erosive Contact
Sampling Depth

124
Cuddalore Pit 1—100 meters inland; February 28, 2008
0-1 cm = Dark tan; moderately dense; silty, organic, fine sand; subrounded to subangular; 90% quartz, 5% feldspar, 5% dark mafic minerals; contains grass roots; distinct lower boundary. 1-7 cm = Light gray; loose; massive, fine sand; subrounded to subangular; 95% quartz, 5% dark mafic minerals; brick fragment at distinct lower boundary. 7-10 cm = Dark gray; moderately dense; organic, fine sand; subrounded to subangular; abundant organic material; diffuse, hummocky lower boundary. 10-23 cm = Red; moderately dense; mottled, fine sand; subrounded; 80% quartz, 5% feldspar, 15% dark mafic minerals; diffuse, undulatory lower boundary. 23-70+ cm = Gray; moderately dense; medium sand; subangular to subrounded; 80% quartz, 5% feldspar, 15% dark mafic minerals; lower boundary at base of pit.
Figure A25. Stratigraphic column and description of Cuddalore Pit 1
0 cm
25 cm
50 cm
Clay or Silt
Interp. Tsunami Sand
Undifferentiated Sand
Diffuse Contact
Distinct Contact
Erosive Contact
Sampling Depth
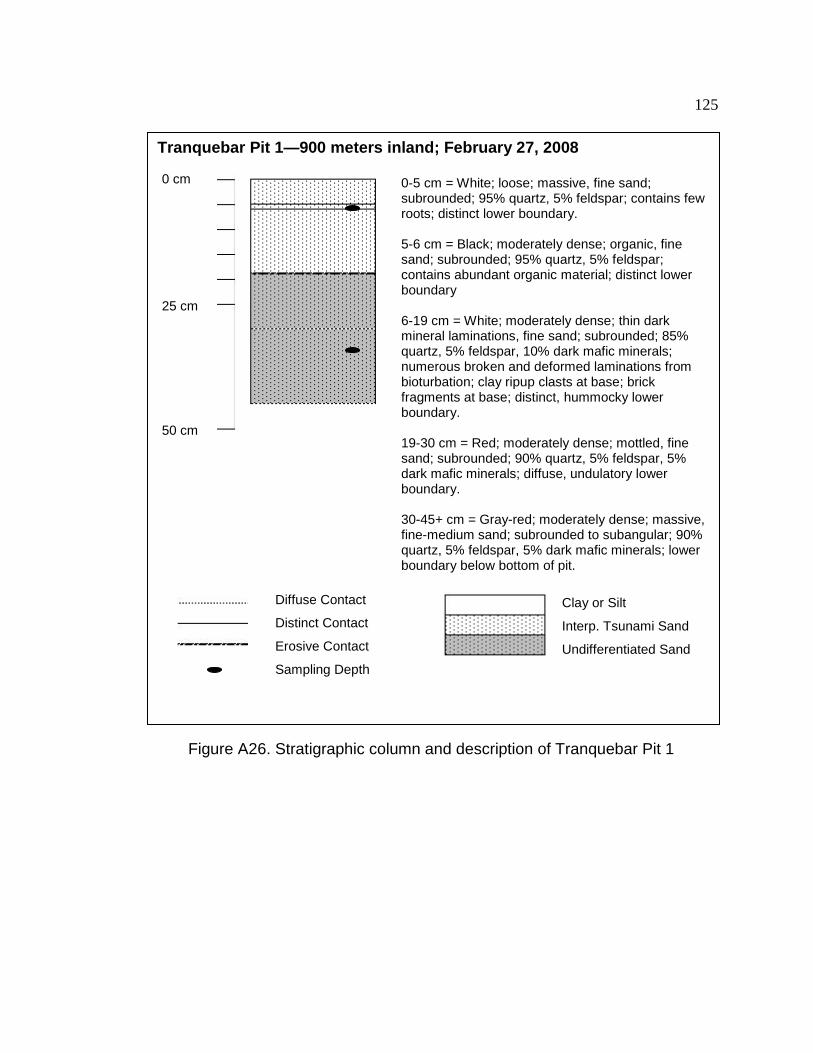
125
Tranquebar Pit 1—900 meters inland; February 27, 2008
0-5 cm = White; loose; massive, fine sand; subrounded; 95% quartz, 5% feldspar; contains few roots; distinct lower boundary. 5-6 cm = Black; moderately dense; organic, fine sand; subrounded; 95% quartz, 5% feldspar; contains abundant organic material; distinct lower boundary 6-19 cm = White; moderately dense; thin dark mineral laminations, fine sand; subrounded; 85% quartz, 5% feldspar, 10% dark mafic minerals; numerous broken and deformed laminations from bioturbation; clay ripup clasts at base; brick fragments at base; distinct, hummocky lower boundary. 19-30 cm = Red; moderately dense; mottled, fine sand; subrounded; 90% quartz, 5% feldspar, 5% dark mafic minerals; diffuse, undulatory lower boundary. 30-45+ cm = Gray-red; moderately dense; massive, fine-medium sand; subrounded to subangular; 90% quartz, 5% feldspar, 5% dark mafic minerals; lower boundary below bottom of pit.
Figure A26. Stratigraphic column and description of Tranquebar Pit 1
0 cm
25 cm
50 cm
Clay or Silt
Interp. Tsunami Sand
Undifferentiated Sand
Diffuse Contact
Distinct Contact
Erosive Contact
Sampling Depth

126
Figure A27. Stratigraphic column and description of Karaikal Pit 1
Karaikal Pit 1—200 meters inland; February 27, 2008
0-15 cm = White; loose; thin dark mineral laminations, fine sand; subrounded; 85% quartz, 15% dark mafic minerals; distinct, hummocky lower boundary. 15-20 cm = Brown; sticky; clay; distinct, hummocky lower boundary. 20-70 cm = White; moderately dense; laminated, fine sand; subrounded; 90% quartz, 10% dark mafic minerals; laminations concentrated at top and bottom of unit; flame and load casts at bottom of unit; lower boundary below bottom of pit.
Clay or Silt
Interp. Tsunami Sand
Undifferentiated Sand
Diffuse Contact
Distinct Contact
Erosive Contact
Sampling Depth
0 cm
25 cm
50 cm

127
Karaikal Pit 2—500 meters inland; February 27, 2008
0-1 cm = White; loose; fine sand; subrounded; 95% quartz, 5% feldspar; distinct, hummocky lower boundary. 1-5 cm = Gray; dense; clay; distinct lower boundary. 5-15 cm = Gray; dense; interbedded, sandy clay; distinct lower boundary. 15-30+ cm = Brown; sticky; mottled clay; lower boundary below bottom of pit.
Figure A28. Stratigraphic column and description of Karaikal Pit 2
0 cm
25 cm
50 cm
Clay or Silt
Interp. Tsunami Sand
Undifferentiated Sand
Diffuse Contact
Distinct Contact
Erosive Contact
Sampling Depth

128
Kallar Pit 1—200 meters inland; February 24, 2008
0-5 cm = White; loose; mixed, fine sand; subrounded; 90% quartz, 5% feldspar, 5% dark mafic minerals; bioturbated; distinct, hummocky lower boundary. 5-10 cm = White; loose; numerous dark mineral laminations, fine sand; subrounded; 75% quartz 5% feldspar 20% dark mafic minerals; distinct lower boundary. 10-46 cm = White; loose; numerous dark mineral laminations, fine sand; subrounded to subangular; 65% quartz, 5% feldspar, 30% dark mafic minerals; distinct lower boundary. 46-100 cm = Red; moderately dense; mottled, fine sand; subrounded to subangular; 90% quartz, 5% feldspar, 5% dark mafic minerals; lower boundary below bottom of pit.
Figure A29. Stratigraphic column and description of Kallar Pit 1
0 cm
25 cm
50 cm
Clay or Silt
Interp. Tsunami Sand
Undifferentiated Sand
Diffuse Contact
Distinct Contact
Erosive Contact
Sampling Depth

129
Kallar Pit 2—160 meters inland; February 24, 2008
Figure A30. Stratigraphic column and description of Kallar Pit 2
0-10 cm = White; loose; massive, fine sand; subrounded; 85% quartz, 5% feldspar, 10% dark mafic minerals; distinct lower boundary. 10-24 cm = White; loose; laminated, fine sand; subrounded to subangular; 75% quartz, 5% feldspar, 20% dark mafic minerals; distinct, undulatory lower boundary. 24-43 cm = Red; moderately dense; mottled, fine sand; subrounded; 90% quartz, 5% feldspar, 5% dark mafic minerals; lower boundary below bottom of pit.
0 cm
25 cm
50 cm
Clay or Silt
Interp. Tsunami Sand
Undifferentiated Sand
Diffuse Contact
Distinct Contact
Erosive Contact
Sampling Depth

130
Figure A31. Stratigraphic column and description of Vailanganni Pit 1
Vailanganni Pit 1—100 meters inland; February 24, 2008
0-5 cm = White; loose; thin dark mineral laminations, fine sand; subrounded; 95% quartz, 5% feldspar; distinct lower boundary. 5-13 cm = Moderate brown to dark brown; loose; mottled fine sand; subrounded; 95% quartz, 5% feldspar; distinct lower boundary. 13-40 cm = Red-tan; moderately dense; mottled fine sand; normally graded; subrounded to subangular; 90% quartz, 5% feldspar, 5% dark mafic minerals; diffuse lower boundary. 40-56 cm = Gray to dark gray; moderately dense; fine sand; subrounded to subangular; 90% quartz, 10% dark mafic minerals; distinct lower boundary. 56-72 cm = Yellowish-tan; loose; mottled fine sand; subrounded to subangular; 90% quartz, 10% feldspar; distinct lower boundary. 72-79 cm = Dark brown to black; dense; fine sand; subrounded; 90% quartz, 5% feldspar; 5% dark mafic minerals; abundant organics; distinct, hummocky lower boundary. 79-97+ cm = Gray; dense; silty-clayey fine sand; subrounded; sand is 80% quartz 10% feldspar; 10% dark mafic minerals; diffuse lower boundary at water table.
0 cm
25 cm
50 cm
Clay or Silt
Interp. Tsunami Sand
Undifferentiated Sand
Diffuse Contact
Distinct Contact
Erosive Contact
Sampling Depth
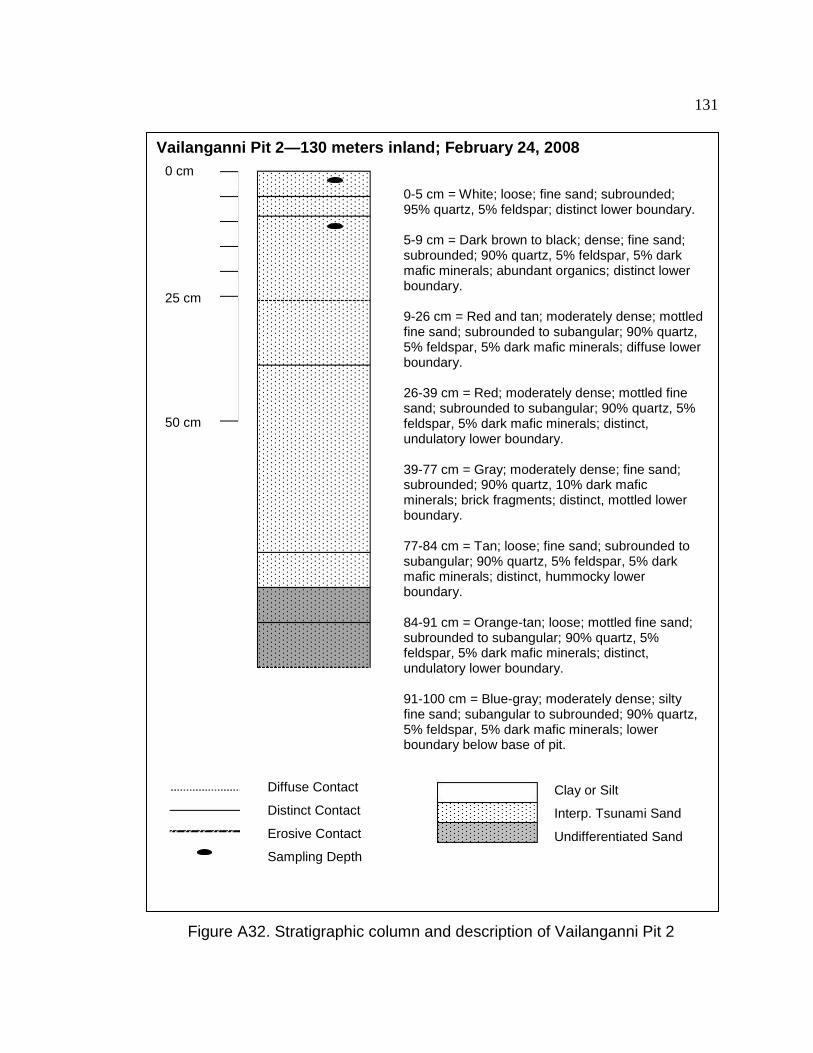
131
Figure A32. Stratigraphic column and description of Vailanganni Pit 2
Vailanganni Pit 2—130 meters inland; February 24, 2008
0-5 cm = White; loose; fine sand; subrounded; 95% quartz, 5% feldspar; distinct lower boundary. 5-9 cm = Dark brown to black; dense; fine sand; subrounded; 90% quartz, 5% feldspar, 5% dark mafic minerals; abundant organics; distinct lower boundary. 9-26 cm = Red and tan; moderately dense; mottled fine sand; subrounded to subangular; 90% quartz, 5% feldspar, 5% dark mafic minerals; diffuse lower boundary. 26-39 cm = Red; moderately dense; mottled fine sand; subrounded to subangular; 90% quartz, 5% feldspar, 5% dark mafic minerals; distinct, undulatory lower boundary. 39-77 cm = Gray; moderately dense; fine sand; subrounded; 90% quartz, 10% dark mafic minerals; brick fragments; distinct, mottled lower boundary. 77-84 cm = Tan; loose; fine sand; subrounded to subangular; 90% quartz, 5% feldspar, 5% dark mafic minerals; distinct, hummocky lower boundary. 84-91 cm = Orange-tan; loose; mottled fine sand; subrounded to subangular; 90% quartz, 5% feldspar, 5% dark mafic minerals; distinct, undulatory lower boundary. 91-100 cm = Blue-gray; moderately dense; silty fine sand; subangular to subrounded; 90% quartz, 5% feldspar, 5% dark mafic minerals; lower boundary below base of pit.
0 cm
25 cm
50 cm
Clay or Silt
Interp. Tsunami Sand
Undifferentiated Sand
Diffuse Contact
Distinct Contact
Erosive Contact
Sampling Depth
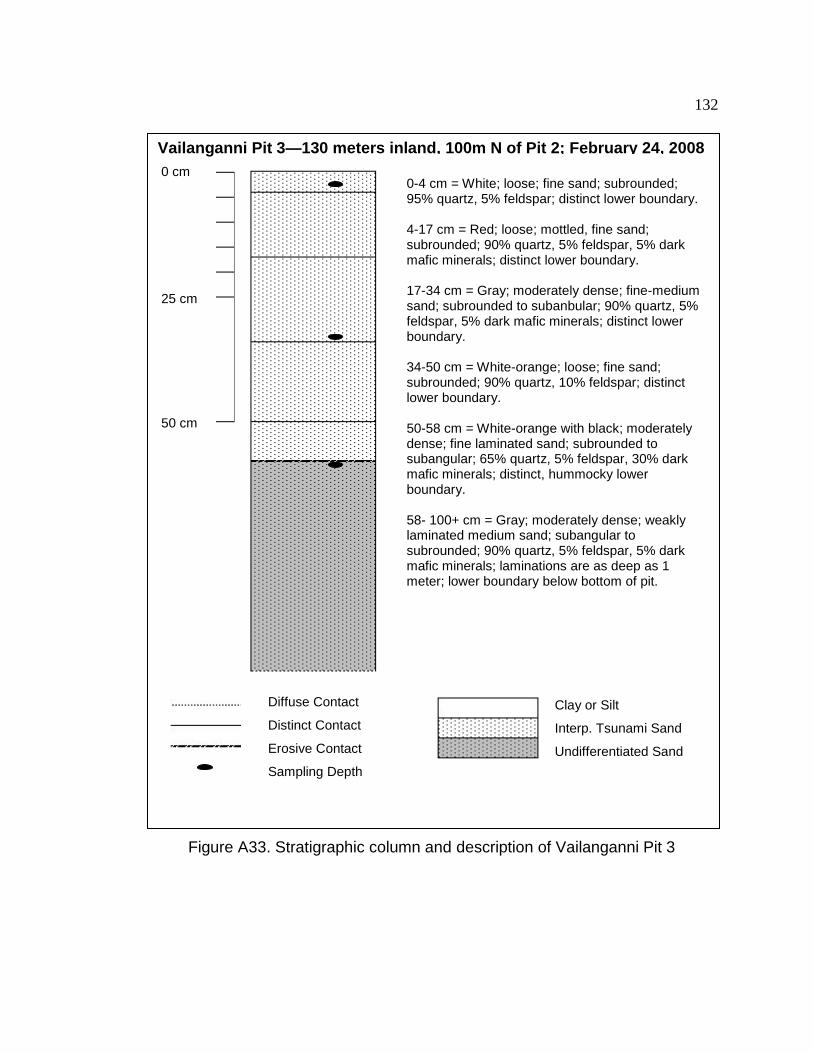
132
Vailanganni Pit 3—130 meters inland, 100m N of Pit 2; February 24, 2008
0-4 cm = White; loose; fine sand; subrounded; 95% quartz, 5% feldspar; distinct lower boundary. 4-17 cm = Red; loose; mottled, fine sand; subrounded; 90% quartz, 5% feldspar, 5% dark mafic minerals; distinct lower boundary. 17-34 cm = Gray; moderately dense; fine-medium sand; subrounded to subanbular; 90% quartz, 5% feldspar, 5% dark mafic minerals; distinct lower boundary. 34-50 cm = White-orange; loose; fine sand; subrounded; 90% quartz, 10% feldspar; distinct lower boundary. 50-58 cm = White-orange with black; moderately dense; fine laminated sand; subrounded to subangular; 65% quartz, 5% feldspar, 30% dark mafic minerals; distinct, hummocky lower boundary. 58- 100+ cm = Gray; moderately dense; weakly laminated medium sand; subangular to subrounded; 90% quartz, 5% feldspar, 5% dark mafic minerals; laminations are as deep as 1 meter; lower boundary below bottom of pit.
Figure A33. Stratigraphic column and description of Vailanganni Pit 3
0 cm
25 cm
50 cm
Clay or Silt
Interp. Tsunami Sand
Undifferentiated Sand
Diffuse Contact
Distinct Contact
Erosive Contact
Sampling Depth

133
Puthupalli Pit 1—500 meters inland; February 26, 2008
0-5 cm = Tan; moderately dense; thin dark mineral laminations; fine sand; subrounded to subangular; 75% quartz, 5% feldspar, 20% dark mafic minerals; bioturbated w/ evidence of soil formation; Distinct, hummocky lower boundary. 5-12 cm = White; loose; laminated, fine sand; subrounded to subangular; 85% quartz 5% feldspar, 10% dark mafic minerals; distinct, undulatory lower boundary. 12-16 cm = Gray-red; moderately dense; mottled, fine sand; subrounded to subangular; 90% quartz, 5% feldspar, 5% dark mafic minerals; abundant organic material; distinct, hummocky lower boundary. 16-23 cm = Red and gray; moderately dense; mottled, fine sand; subrounded to subangular; 90% quartz, 5% feldspar, 5% dark mafic minerals; diffuse lower boundary. 23-50 cm = Gray-tan; moderately dense; massive, fine sand; subrounded to subangular; 95% quartz, 5% feldspar; lower boundary below bottom of pit.
Figure A34. Stratigraphic column and description of Puthupalli Pit 1
0 cm
25 cm
50 cm
Clay or Silt
Interp. Tsunami Sand
Undifferentiated Sand
Diffuse Contact
Distinct Contact
Erosive Contact
Sampling Depth

134
Vilundamavadi Pit 1—450 meters inland; February 26, 2008
94-180 cm = Red and tan; moderately dense; heavily laminated, mottled fine sand; subrounded to subangular; 80% quartz, 5% feldspar, 15% dark mafic minerals; laminations broken and truncated in places; distinct lower boundary. 180-190 cm = Red; moderately dense; mottled fine sand; subrounded to subangular; 85% quartz, 5% feldspar, 10% dark mafic minerals; occasional laminations; some evidence of soil development and silt leaching; distinct lower boundary. 190-220 cm = Tan; moderately dense; massive fine sand; subrounded; 90% quartz, 5% feldspar, 5% dark mafic minerals; lower boundary below base of pit.
Figure A35. Stratigraphic column and description of Vilundamavadi Pit 1, from beneath a Holocene dune.
94 cm
119 cm
144 cm
Clay or Silt
Interp. Tsunami Sand
Undifferentiated Sand
Diffuse Contact
Distinct Contact
Erosive Contact
Sampling Depth

135
Vilundamavadi Pit 2—150 meters inland; February 26, 2008
0-10 cm = White; loose; fine sand; subrounded to subangular; 90% quartz, 5% feldspar, 5% dark mafic minerals; roots and grass as deep as 5 cm; distinct lower boundary. 10-28 cm = Tan; moderately dense; laminated, fine sand; subrounded to subangular; 85% quartz, 5% feldspar, 10% dark mafic minerals; distinct, hummocky lower boundary. 28-40+ cm = Gray and orange; moderately dense; mottled, fine sand; subrounded to subangular; 90% quartz, 5% feldspar, 5% dark mafic minerals; lower boundary below base of pit.
Figure A36. Stratigraphic column and description of Vilundamavadi Pit 2
0 cm
25 cm
50 cm
Clay or Silt
Interp. Tsunami Sand
Undifferentiated Sand
Diffuse Contact
Distinct Contact
Erosive Contact
Sampling Depth
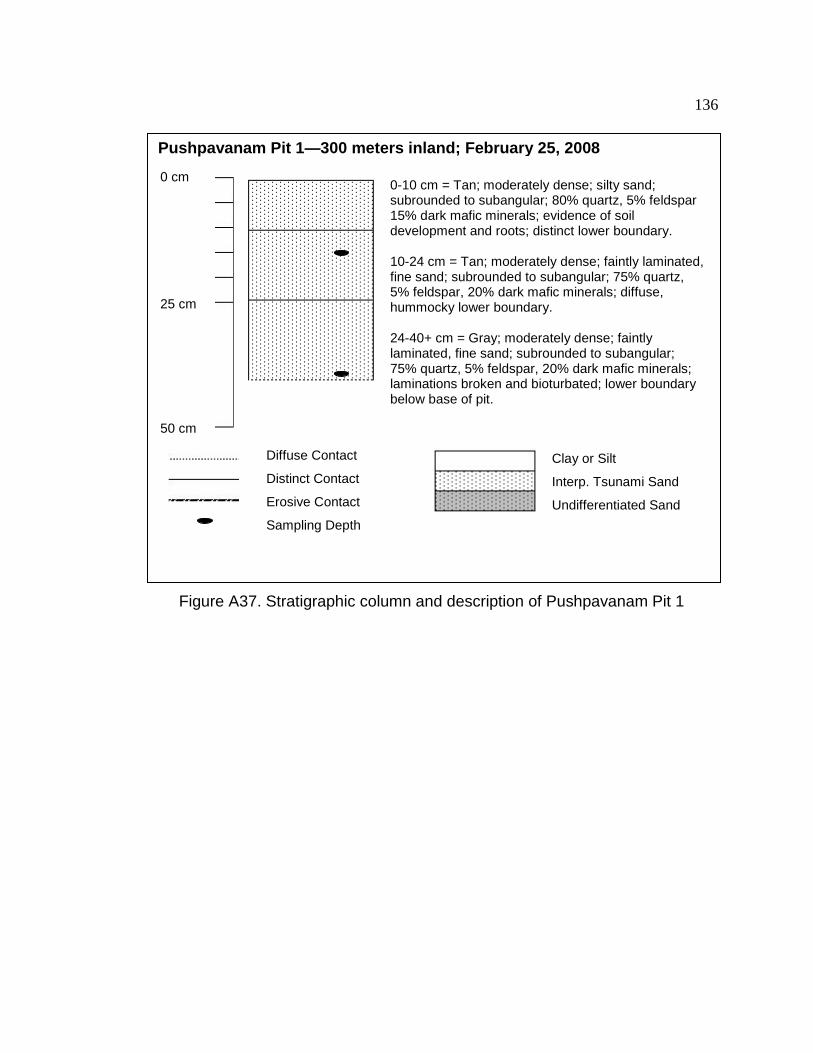
136
Pushpavanam Pit 1—300 meters inland; February 25, 2008
0-10 cm = Tan; moderately dense; silty sand; subrounded to subangular; 80% quartz, 5% feldspar 15% dark mafic minerals; evidence of soil development and roots; distinct lower boundary. 10-24 cm = Tan; moderately dense; faintly laminated, fine sand; subrounded to subangular; 75% quartz, 5% feldspar, 20% dark mafic minerals; diffuse, hummocky lower boundary. 24-40+ cm = Gray; moderately dense; faintly laminated, fine sand; subrounded to subangular; 75% quartz, 5% feldspar, 20% dark mafic minerals; laminations broken and bioturbated; lower boundary below base of pit.
Figure A37. Stratigraphic column and description of Pushpavanam Pit 1
0 cm
25 cm
50 cm
Clay or Silt
Interp. Tsunami Sand
Undifferentiated Sand
Diffuse Contact
Distinct Contact
Erosive Contact
Sampling Depth

137
Vedaranyam Pit 1—200 meters inland; February 25, 2008
0-3.5 cm = White; loose; very fine sand; subrounded; 95% quartz, 5% feldspar; distinct lower boundary. 3.5-5 cm = Gray; dense; hummocky, silty clay; distinct lower boundary. 5-10 cm = Tan; moderately dense; fine sand; subrounded; 90% quartz, 5% feldspar, 5% dark mafic minerals; contains roots; distinct lower boundary. 10-15 cm = Tan; moderately dense; interbedded fine sand and clay; sand is subrounded; 95% quartz 5% feldspar; clay ripup clasts; distinct, hummocky lower boundary. 15-16 cm = Black; moderately dense; organic sand; subrounded; 90% quartz, 5% feldspar, 5% dark mafic minerals; distinct lower boundary. 16-47 cm = Tan; moderately dense; heavily laminated, fine sand; subrounded; 65% quartz, 5% feldspar, 30% dark mafic minerals; distinct lower boundary. 47-84+ cm = Tan; moderately dense; faintly laminated, fine sand; subrounded; 85% quartz, 5% feldspar, 10% dark mafic minreals; lower boundary below base of pit.
Figure A38. Stratigraphic column and description of Vedaranyam Pit 1
0 cm
25 cm
50 cm
Clay or Silt
Interp. Tsunami Sand
Undifferentiated Sand
Diffuse Contact
Distinct Contact
Erosive Contact
Sampling Depth

138
Vedaranyam Pit 2—210 meters inland; February 25, 2008
0-5 cm = Gray-brown; thick, sticky clay; surficial mudcracks; distinct lower boundary. 5-13 cm = Tan; moderately dense; thin dark mineral laminations, fine sand; subrounded to subangular; 75% quartz, 5% feldspar, 20% dark mafic minerals; distinct lower boundary. 13-25 cm = Tan; moderately dense; thin dark mineral laminations; interbedded sand and clay; subrounded; 65% quartz, 5% feldspar, 30% dark mafic minerals; soft sediment deformation; distinct, hummocky lower boundary. 25-40 cm = Brown; moderately dense; massive, fine sand; subrounded to subangular; 90% quartz, 5% feldspar, 5% dark mafic minerals, trace clay leaching; distinct lower boundary. 40-70 cm = Gray; moderately dense; massive, fine sand; subrounded to subangular; 90% quarts, 5% feldspar, 5% dark mafic minerals; lower boundary below base of pit.
Figure A39. Stratigraphic column and description of Vedaranyam Pit 2
0 cm
25 cm
50 cm
Clay or Silt
Interp. Tsunami Sand
Undifferentiated Sand
Diffuse Contact
Distinct Contact
Erosive Contact
Sampling Depth

139
Vedaranyam Pit 3—300 meters inland; February 25, 2008
0-5 cm = White; loose; fine sand; 90% quartz, 10% feldspar; distinct lower boundary. 5-8 cm = Gray; dense clay; distinct lower boundary. 8-30 cm = White-tan; moderately dense; laminated, fine sand; 75% quartz, 5% feldspar, 20% dark mafic minerals; distinct, undulatory, erosional lower boundary. 30-70 cm = Tan; moderately dense; thin dark mineral laminations, fine sand; 85% quarts, 5% feldspar, 10% dark mafic minerals; lower boundary below base of pit.
Figure A40. Stratigraphic column and description of Vedaranyam Pit 3
0 cm
25 cm
50 cm
Clay or Silt
Interp. Tsunami Sand
Undifferentiated Sand
Diffuse Contact
Distinct Contact
Erosive Contact
Sampling Depth

140
Appendix B
Grain Size Data and Calculations
Mastersizer laser diffractometer data is compared to wet sieve data from
Mamallapuram Pit #1 in Figures B1-B4. Grain size data is summarized in Table B1.
Grain size calculations using the data in Table B1 are summarized in Table B2. The
order of the tables is based on what order we sampled in the field. For example,
Aalikuppam sample 02-09-08-S5 was sampled on February 9th
, 2008 and was sample
number 5. Refer to Table 1 for geomorphic environment and condition of tsunami
deposit.
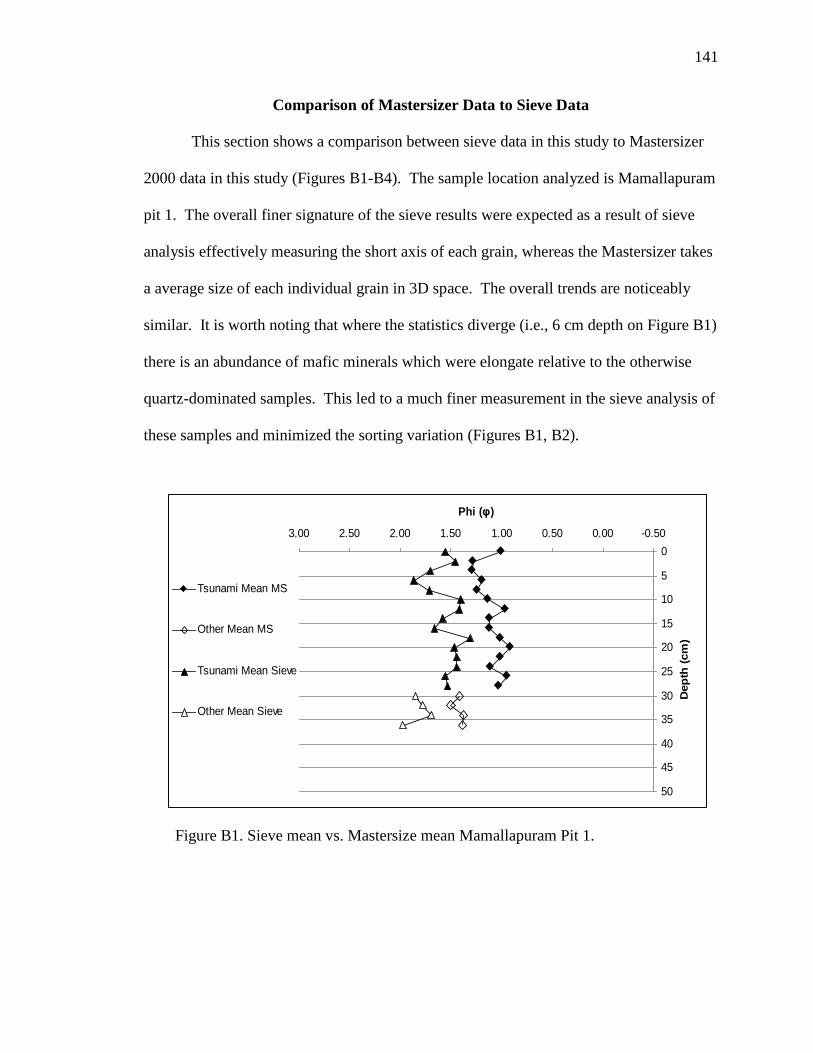
141
Comparison of Mastersizer Data to Sieve Data
This section shows a comparison between sieve data in this study to Mastersizer
2000 data in this study (Figures B1-B4). The sample location analyzed is Mamallapuram
pit 1. The overall finer signature of the sieve results were expected as a result of sieve
analysis effectively measuring the short axis of each grain, whereas the Mastersizer takes
a average size of each individual grain in 3D space. The overall trends are noticeably
similar. It is worth noting that where the statistics diverge (i.e., 6 cm depth on Figure B1)
there is an abundance of mafic minerals which were elongate relative to the otherwise
quartz-dominated samples. This led to a much finer measurement in the sieve analysis of
these samples and minimized the sorting variation (Figures B1, B2).
0
5
10
15
20
25
30
35
40
45
50
-0.500.000.501.001.502.002.503.00
Phi (φ)
Dep
th (
cm
)
Tsunami Mean MS
Other Mean MS
Tsunami Mean Sieve
Other Mean Sieve
Figure B1. Sieve mean vs. Mastersize mean Mamallapuram Pit 1.

142
0
5
10
15
20
25
30
35
40
45
50
-0.50-0.30-0.100.100.300.50
Phi (φ)
Dep
th (
cm
)
Tsunami Skewness
MS
Other Skewness MS
Tsunami Skewness
Sieve
Other Skewness
Sieve
Figure B3. Sieve skewness vs. Mastersizer skewness Mamallapuram Pit 1.
0
5
10
15
20
25
30
35
40
45
50
-0.500.000.501.001.502.002.503.00
Phi (φ)
Dep
th (
cm
)
Tsunami Sorting MS
Other Sorting MS
Tsunami Sorting
Sieve
Other Sorting Sieve
Figure B2. Sieve sorting vs. Mastersizer sorting Mamallapuram Pit 1.
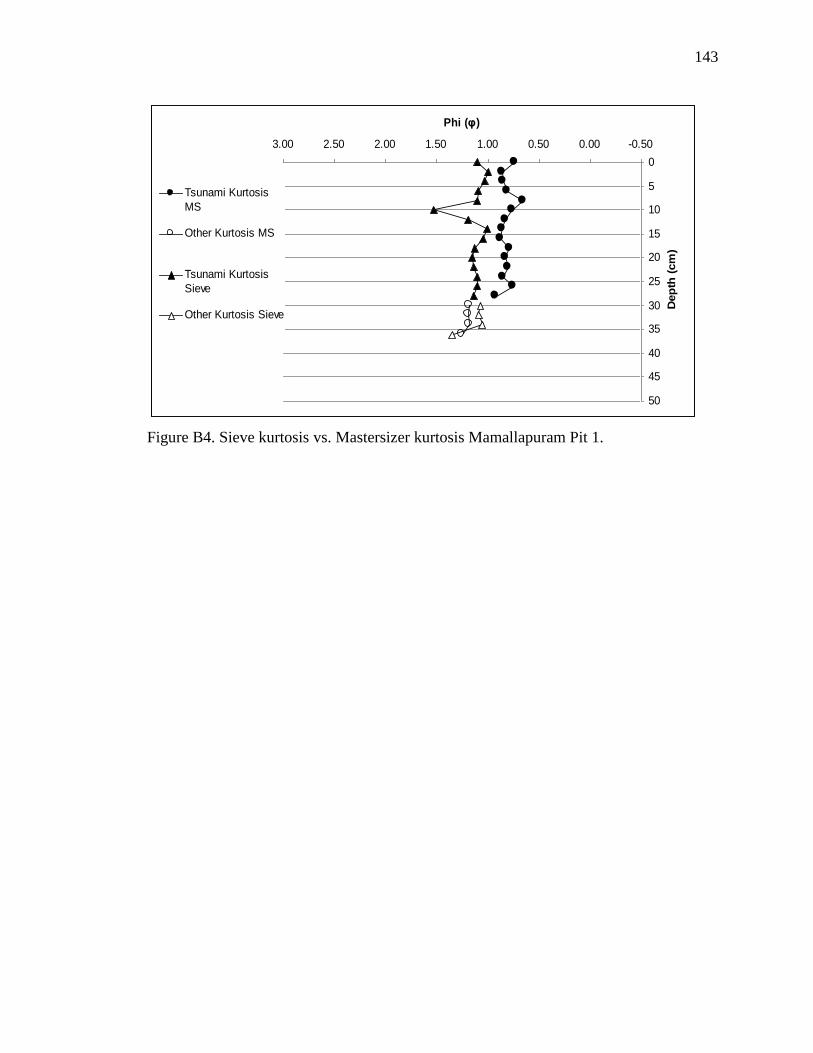
143
0
5
10
15
20
25
30
35
40
45
50
-0.500.000.501.001.502.002.503.00
Phi (φ)
Dep
th (
cm
)
Tsunami Kurtosis
MS
Other Kurtosis MS
Tsunami Kurtosis
Sieve
Other Kurtosis Sieve
Figure B4. Sieve kurtosis vs. Mastersizer kurtosis Mamallapuram Pit 1.

144
Table B1. GRAIN SIZE DATA: MEASURED BY MASTERSIZER 2000
Site Sample Pit Distance Inland φ 95 φ84 φ75 φ50 φ25 φ16 φ5
Aalikuppam 02-09-08-S5 1 150 2.36 1.89 1.62 1.14 0.66 0.45 0.06
Aalikuppam 02-09-08-S6 1 150 2.54 2.05 1.81 1.33 0.81 0.60 0.24
Aalikuppam 02-09-08-S7 1 150 2.38 1.97 1.76 1.23 0.73 0.51 0.12
Aalikuppam 02-09-08-S8 1 150 2.37 1.93 1.72 1.20 0.73 0.50 0.11
Aalikuppam 02-09-08-S9 1 150 2.21 1.83 1.58 1.09 0.58 0.40 0.02
Aalikuppam 02-09-08-S10 1 150 2.13 1.73 1.53 1.04 0.54 0.37 -0.01
Aalikuppam 02-09-08-S11 1 150 2.06 1.71 1.51 1.07 0.65 0.46 0.16
Aalikuppam 02-09-08-S12 1 150 2.02 1.54 1.36 0.85 0.38 0.16 -0.22
Aalikuppam 02-09-08-S13 1 150 1.92 1.49 1.25 0.76 0.27 0.06 -0.34
Aalikuppam 02-09-08-S14 1 150 2.24 1.83 1.60 1.13 0.68 0.46 0.09
Aalikuppam 02-09-08-S15 1 150 2.31 1.93 1.73 1.31 0.92 0.72 0.37
Aalikuppam 02-09-08-S16 1 150 2.40 2.03 1.81 1.37 0.93 0.74 0.37
Aalikuppam 02-09-08-S17 1 150 2.09 1.69 1.45 0.99 0.52 0.32 -0.03
Thiruvadandhai 02-11-08-S18 1 50 1.84 1.45 1.29 0.87 0.46 0.28 -0.03
Thiruvadandhai 02-11-08-S19 1 50 2.22 1.79 1.56 1.10 0.61 0.42 0.06
Thiruvadandhai 02-11-08-S20 1 50 2.03 1.69 1.51 1.07 0.66 0.47 0.14
Thiruvadandhai 02-11-08-S21 2 100 5.11 3.24 2.60 1.71 1.12 0.87 0.40
Thiruvadandhai 02-11-08-S22 2 100 2.60 2.13 1.94 1.49 1.06 0.88 0.56
Thiruvadandhai 02-11-08-S23 2 100 2.63 2.18 1.97 1.47 1.00 0.79 0.40
Thiruvadandhai 02-11-08-S24 2 100 2.44 1.97 1.71 1.19 0.74 0.50 0.09
Thiruvadandhai 02-11-08-S25 2 100 2.60 1.81 1.53 0.98 0.47 0.25 -0.18
Thiruvadandhai 02-11-08-S26 2 100 2.42 1.97 1.71 1.21 0.74 0.52 0.14
Thiruvadandhai 02-11-08-S27 2 100 2.25 1.85 1.63 1.21 0.81 0.61 0.27
Thiruvadandhai 02-11-08-S28 2 100 2.43 2.04 1.88 1.47 1.08 0.92 0.56
Thiruvadandhai 02-11-08-S29 2 100 2.40 2.01 1.81 1.42 1.03 0.84 0.51
Thiruvadandhai 02-11-08-S30 3 150 2.20 1.79 1.58 1.07 0.60 0.42 0.08
Thiruvadandhai 02-11-08-S31 3 150 2.05 1.65 1.42 0.98 0.52 0.35 0.01
Thiruvadandhai 02-11-08-S32 3 150 1.88 1.51 1.31 0.88 0.47 0.27 -0.09
Thiruvadandhai 02-11-08-S33 3 150 1.92 1.57 1.37 0.94 0.50 0.31 -0.06
Thiruvadandhai 02-11-08-S34 3 150 2.05 1.61 1.42 0.94 0.46 0.26 -0.11
Thiruvadandhai 02-11-08-S35 3 150 2.43 1.94 1.73 1.22 0.75 0.52 0.18
Thiruvadandhai 02-11-08-S36 3 150 2.41 1.94 1.71 1.23 0.75 0.56 0.19
Thiruvadandhai 02-11-08-S37 3 150 1.98 1.58 1.40 0.94 0.50 0.29 -0.04
Thiruvadandhai 02-11-08-S38 3 150 2.29 1.86 1.62 1.14 0.69 0.46 0.10
Thiruvadandhai 02-11-08-S39 3 150 1.78 1.38 1.19 0.74 0.33 0.12 -0.21
Thiruvadandhai 02-11-08-S40 3 150 1.89 1.47 1.23 0.74 0.26 0.02 -0.38
Thiruvadandhai 02-11-08-S41 3 150 1.64 1.21 1.00 0.51 0.03 -0.20 -0.58
Thiruvadandhai 02-11-08-S42 3 150 1.67 1.27 1.06 0.59 0.10 -0.03 -0.47
Thiruvadandhai 02-11-08-S43 3 150 1.40 1.05 0.85 0.44 0.03 -0.17 -0.48
Thiruvadandhai 02-11-08-S44 3 150 2.05 1.62 1.38 0.94 0.48 0.26 -0.10
Thiruvadandhai 02-11-08-S45 3 150 2.15 1.74 1.51 1.01 0.59 0.39 0.02
Thiruvadandhai 02-11-08-S46 3 150 1.81 1.38 1.14 0.68 0.20 0.01 -0.39

145
Thiruvadandhai 02-11-08-S47 3 150 2.22 1.74 1.48 1.00 0.49 0.28 -0.09
Thiruvadandhai 02-11-08-S48 3 150 1.70 1.29 1.09 0.58 0.10 -0.12 -0.49
Thiruvadandhai 02-11-08-S49 3 150 1.89 1.45 1.22 0.75 0.23 0.01 -0.40
Thiruvadandhai 02-11-08-S50 3 150 1.89 1.51 1.29 0.80 0.52 0.14 -0.22
Thiruvadandhai 02-11-08-S51 4 200 1.88 1.49 1.30 0.83 0.37 0.17 -0.17
Thiruvadandhai 02-11-08-S52 4 200 3.16 2.09 1.75 1.20 0.61 0.34 -0.05
Thiruvadandhai 02-11-08-S53 5 250 2.20 1.81 1.60 1.06 0.56 0.34 -0.04
Thiruvadandhai 02-11-08-S54 5 250 2.04 1.56 1.34 0.79 0.32 0.06 -0.33
Thiruvadandhai 02-11-08-S55 6 280 1.84 1.42 1.19 0.66 0.19 -0.04 -0.44
Thiruvadandhai 02-11-08-S56 7 300 1.89 1.43 1.22 0.72 0.23 0.01 -0.38
Thiruvadandhai 02-11-08-S57 8 320 2.40 1.87 1.62 1.12 0.63 0.42 0.06
Kovalam 02-12-08-S58 1 40 2.63 2.12 1.85 1.35 0.86 0.66 0.26
Kovalam 02-12-08-S59 1 40 2.33 1.88 1.61 1.10 0.59 0.40 0.01
Kovalam 02-12-08-S60 1 40 2.05 1.65 1.43 0.95 0.48 0.26 -0.09
Kovalam 02-12-08-S61 1 40 2.58 2.09 1.84 1.34 0.87 0.57 0.26
Kovalam 02-12-08-S62 1 40 2.64 2.14 1.90 1.38 0.90 0.67 0.29
Kovalam 02-12-08-S63 1 40 2.70 2.24 2.01 1.55 1.07 0.87 0.47
Kovalam 02-12-08-S64 1 40 2.43 1.94 1.73 1.23 0.76 0.54 0.16
Kovalam 02-12-08-S65 1 40 2.59 2.22 2.00 1.56 1.18 0.99 0.59
Kovalam 02-12-08-S66 1 40 2.69 2.29 2.08 1.59 1.14 0.94 0.55
Mamallapuram 02-13-08-S71 2 200 2.41 2.00 1.79 1.36 0.88 0.68 0.34
Mamallapuram 02-13-08-S72 2 200 2.60 2.11 1.88 1.36 0.88 0.66 0.29
Mamallapuram 02-13-08-S73 3 250 2.45 2.03 1.81 1.32 0.82 0.62 0.26
Mamallapuram 02-13-08-S74 3 250 2.44 1.85 1.62 1.14 0.66 0.44 0.09
Mamallapuram 02-15-08-S75 4 350 2.43 1.83 1.60 1.09 0.63 0.42 0.06
Mamallapuram 02-15-08-S76 4 350 2.31 1.82 1.58 1.10 0.61 0.42 0.08
Mamallapuram 02-15-08-S77 5 450 2.43 1.86 1.62 1.16 0.71 0.50 0.17
Mamallapuram 02-15-08-S78 5 450 2.48 2.00 1.76 1.26 0.80 0.58 0.22
Mamallapuram 02-15-08-S79 6 500 2.16 1.76 1.56 1.15 0.74 0.52 0.21
Mamallapuram 02-15-08-S80 6 500 2.43 2.00 1.78 1.34 0.86 0.66 0.33
Mamallapuram 02-15-08-S81 Dune 520 2.45 2.00 1.78 1.31 0.86 0.66 0.32
Mamallapuram 02-15-08-S82 1 120 2.06 1.66 1.47 1.01 0.56 0.34 0.07
Mamallapuram 02-15-08-S83 1 120 2.37 1.97 1.80 1.30 0.80 0.58 0.26
Mamallapuram 02-15-08-S84 1 120 2.44 2.00 1.76 1.26 0.81 0.62 0.25
Mamallapuram 02-15-08-S85 1 120 2.29 1.88 1.66 1.18 0.71 0.50 0.21
Mamallapuram 02-15-08-S86 1 120 2.40 1.94 1.71 1.23 0.97 0.54 0.25
Mamallapuram 02-15-08-S87 1 120 2.22 1.81 1.56 1.12 0.67 0.47 0.12
Mamallapuram 02-15-08-S88 1 120 2.06 1.64 1.43 0.97 0.48 0.29 -0.06
Mamallapuram 02-15-08-S89 1 120 2.24 1.83 1.60 1.10 0.63 0.42 0.09
Mamallapuram 02-15-08-S90 1 120 2.24 1.83 1.60 1.08 0.62 0.44 0.07
Mamallapuram 02-15-08-S91 1 120 2.11 1.68 1.46 1.01 0.55 0.35 0.01
Mamallapuram 02-15-08-S92 1 120 2.03 1.60 1.38 0.92 0.44 0.22 -0.13
Mamallapuram 02-15-08-S93 1 120 2.12 1.71 1.47 1.01 0.56 0.32 -0.01
Mamallapuram 02-15-08-S94 1 120 2.24 1.81 1.58 1.09 0.62 0.43 0.08
Mamallapuram 02-15-08-S95 1 120 2.00 1.62 1.38 0.94 0.47 0.29 -0.03

146
Mamallapuram 02-15-08-S96 1 120 2.22 1.76 1.54 1.01 0.54 0.31 -0.03
Mamallapuram 02-15-08-S97 1 120 2.89 2.22 1.97 1.40 0.89 0.66 0.24
Mamallapuram 02-15-08-S98 1 120 3.04 2.32 2.03 1.47 0.97 0.72 0.30
Mamallapuram 02-15-08-S99 1 120 2.83 2.18 1.92 1.36 0.82 0.60 0.20
Mamallapuram 02-15-08-S100 1 120 3.02 2.22 1.92 1.34 0.84 0.60 0.19
Mamallapuram 02-15-08-S101 1 120 2.51 2.00 1.74 1.22 0.66 0.41 0.02
Mamallapuram 02-15-08-S102 1 120 2.41 1.87 1.62 1.10 0.57 0.39 0.01
Vadanemelli 02-16-08-S104 1 100 2.46 1.69 1.43 0.78 0.21 -0.01 -0.38
Vadanemelli 02-16-08-S105 1 100 2.13 1.69 1.47 1.00 0.51 0.30 -0.07
Vadanemelli 02-16-08-S106 1 100 2.07 1.64 1.43 0.93 0.45 0.25 -0.11
Vadanemelli 02-16-08-S107 1 100 4.06 1.84 1.55 0.98 0.47 0.25 -0.16
Vadanemelli 02-16-08-S108 1 100 1.86 1.43 1.23 0.74 0.27 0.06 -0.27
Vadanemelli 02-16-08-S109 1 100 4.64 1.88 1.56 0.92 0.38 0.14 -0.27
Vadanemelli 02-16-08-S110 1 100 2.05 1.62 1.36 0.87 0.40 0.20 -0.18
Vadanemelli 02-16-08-S111 1 100 2.62 1.99 1.74 1.15 0.63 0.36 -0.07
Vadanemelli 02-16-08-S112 1 100 2.26 1.67 1.42 0.91 0.43 0.22 -0.17
Vadanemelli 02-16-08-S113 1 100 3.25 2.07 1.75 1.10 0.55 0.29 -0.13
Vadanemelli 02-16-08-S114 1 100 1.65 1.31 1.11 0.71 0.29 0.10 -0.26
Aalikuppam 02-17-08-S115 2 200 2.29 1.91 1.69 1.22 0.77 0.55 0.21
Aalikuppam 02-17-08-S116 2 200 2.22 1.83 1.60 1.10 0.60 0.42 0.02
Aalikuppam 02-17-08-S117 3 350 2.20 1.79 1.54 1.03 0.52 0.32 -0.06
Aalikuppam 02-17-08-S118 3 350 1.83 1.42 1.22 0.79 0.37 0.17 -0.20
Aalikuppam 02-17-08-S119 3 350 2.09 1.75 1.56 1.10 0.71 0.52 0.19
Aalikuppam 02-17-08-S120 4 400 2.05 1.69 1.51 1.09 0.71 0.51 0.17
Aalikuppam 02-17-08-S121 4 400 2.18 1.80 1.56 1.16 0.76 0.58 0.25
Karikattakuppam 02-18-08-S122 1 200 2.56 2.18 1.99 1.59 1.19 1.00 0.66
Karikattakuppam 02-18-08-S123 1 200 2.56 2.12 2.02 1.60 1.22 1.03 0.69
Karikattakuppam 02-18-08-S124 2 100 2.45 2.03 1.83 1.37 0.94 0.74 0.41
Karikattakuppam 02-18-08-S125 3 150 2.64 2.12 1.86 1.34 0.80 0.60 0.21
Karikattakuppam 02-18-08-S126 3 150 2.84 2.12 1.86 1.29 0.77 0.50 0.10
Karikattakuppam 02-18-08-S127 4 200 2.65 2.18 1.94 1.44 0.99 0.76 0.37
Muttukaddu 02-18-08-S128 1 500 5.64 3.63 3.32 2.65 2.04 1.68 1.01
Muttukaddu 02-18-08-S129 1 500 4.04 3.49 3.22 2.65 2.05 1.71 1.05
Muttukaddu 02-18-08-S130 1 500 6.38 3.99 3.74 3.20 2.70 2.44 1.88
Muttukaddu 02-18-08-S131 1 500 3.18 2.63 2.38 1.81 1.32 1.04 0.62
Muttukaddu 02-18-08-S132 1 500 6.80 3.64 3.21 2.43 1.66 1.38 0.64
Vailanganni 02-24-08-S133 1 100 3.57 3.08 2.89 2.44 2.01 1.82 1.48
Vailanganni 02-24-08-S134 1 100 3.24 2.65 2.38 1.76 1.09 0.81 0.24
Vailanganni 02-24-08-S135 1 100 3.37 2.88 2.67 2.24 1.83 1.65 1.37
Vailanganni 02-24-08-S136 1 100 5.51 3.01 2.76 2.31 1.83 1.62 1.32
Vailanganni 02-24-08-S137 1 100 3.44 2.84 2.59 2.20 1.79 1.59 1.22
Vailanganni 02-24-08-S138 1 100 3.52 2.85 2.63 2.18 1.74 1.53 1.19
Vailanganni 02-24-08-S139 1 100 7.97 3.40 2.83 2.18 1.71 1.49 1.08
Vailanganni 02-24-08-S140 2 130 3.41 2.98 2.76 2.22 1.74 1.49 1.06
Vailanganni 02-24-08-S141 2 130 3.43 2.94 2.72 2.27 1.84 1.70 1.38
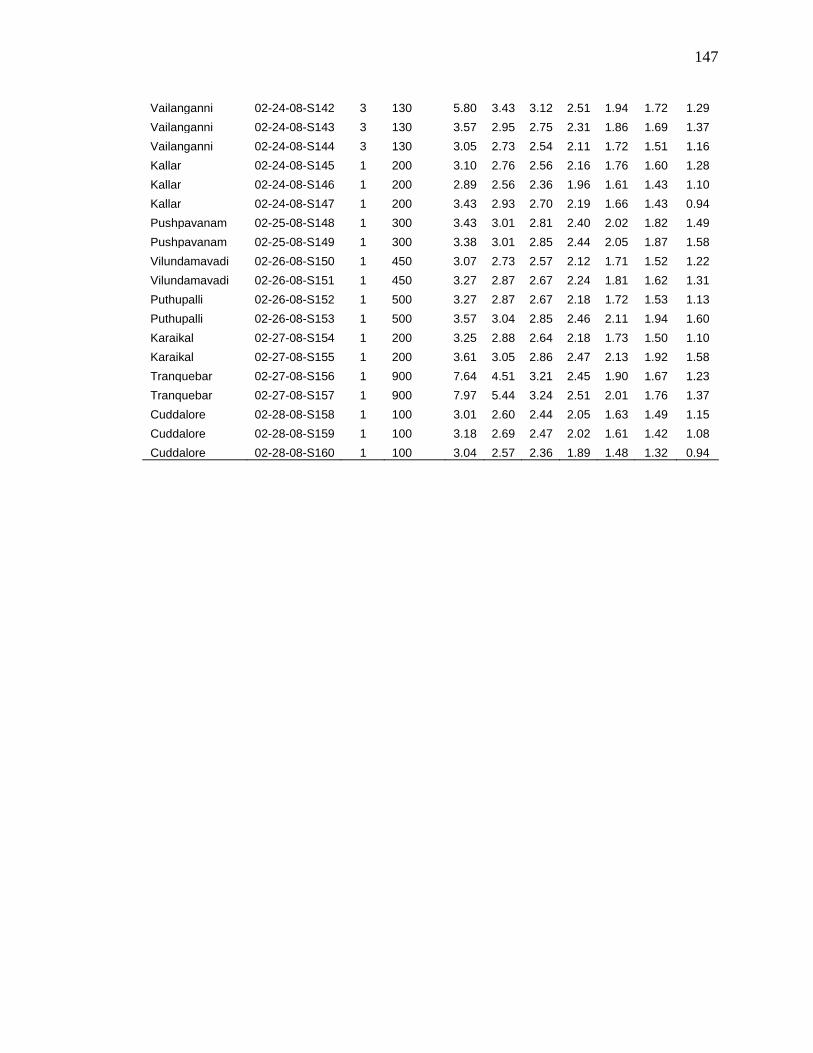
147
Vailanganni 02-24-08-S142 3 130 5.80 3.43 3.12 2.51 1.94 1.72 1.29
Vailanganni 02-24-08-S143 3 130 3.57 2.95 2.75 2.31 1.86 1.69 1.37
Vailanganni 02-24-08-S144 3 130 3.05 2.73 2.54 2.11 1.72 1.51 1.16
Kallar 02-24-08-S145 1 200 3.10 2.76 2.56 2.16 1.76 1.60 1.28
Kallar 02-24-08-S146 1 200 2.89 2.56 2.36 1.96 1.61 1.43 1.10
Kallar 02-24-08-S147 1 200 3.43 2.93 2.70 2.19 1.66 1.43 0.94
Pushpavanam 02-25-08-S148 1 300 3.43 3.01 2.81 2.40 2.02 1.82 1.49
Pushpavanam 02-25-08-S149 1 300 3.38 3.01 2.85 2.44 2.05 1.87 1.58
Vilundamavadi 02-26-08-S150 1 450 3.07 2.73 2.57 2.12 1.71 1.52 1.22
Vilundamavadi 02-26-08-S151 1 450 3.27 2.87 2.67 2.24 1.81 1.62 1.31
Puthupalli 02-26-08-S152 1 500 3.27 2.87 2.67 2.18 1.72 1.53 1.13
Puthupalli 02-26-08-S153 1 500 3.57 3.04 2.85 2.46 2.11 1.94 1.60
Karaikal 02-27-08-S154 1 200 3.25 2.88 2.64 2.18 1.73 1.50 1.10
Karaikal 02-27-08-S155 1 200 3.61 3.05 2.86 2.47 2.13 1.92 1.58
Tranquebar 02-27-08-S156 1 900 7.64 4.51 3.21 2.45 1.90 1.67 1.23
Tranquebar 02-27-08-S157 1 900 7.97 5.44 3.24 2.51 2.01 1.76 1.37
Cuddalore 02-28-08-S158 1 100 3.01 2.60 2.44 2.05 1.63 1.49 1.15
Cuddalore 02-28-08-S159 1 100 3.18 2.69 2.47 2.02 1.61 1.42 1.08
Cuddalore 02-28-08-S160 1 100 3.04 2.57 2.36 1.89 1.48 1.32 0.94

148
TABLE B2. GRAIN SIZE CALCULATIONS
Site Sample Pit Mean Sorting Skewness Kurtosis
Aalikuppam 02-09-08-S5 1 1.16 0.71 0.05 0.91
Aalikuppam 02-09-08-S6 1 1.33 0.71 0.02 0.94
Aalikuppam 02-09-08-S7 1 1.24 0.71 0.01 0.95
Aalikuppam 02-09-08-S8 1 1.21 0.70 0.03 0.92
Aalikuppam 02-09-08-S9 1 1.11 0.69 0.03 0.90
Aalikuppam 02-09-08-S10 1 1.04 0.66 0.02 0.87
Aalikuppam 02-09-08-S11 1 1.08 0.60 0.03 0.67
Aalikuppam 02-09-08-S12 1 0.85 0.68 0.02 0.90
Aalikuppam 02-09-08-S13 1 0.77 0.70 0.02 0.91
Aalikuppam 02-09-08-S14 1 1.14 0.67 0.03 0.81
Aalikuppam 02-09-08-S15 1 1.32 0.60 0.03 0.64
Aalikuppam 02-09-08-S16 1 1.38 0.63 0.02 0.73
Aalikuppam 02-09-08-S17 1 1.00 0.66 0.03 0.81
Thiruvadandhai 02-11-08-S18 1 0.87 0.58 0.02 0.64
Thiruvadandhai 02-11-08-S19 1 1.10 0.67 0.02 0.83
Thiruvadandhai 02-11-08-S20 1 1.08 0.59 0.01 0.66
Thiruvadandhai 02-11-08-S21 2 1.94 1.31 0.36 2.86
Thiruvadandhai 02-11-08-S22 2 1.50 0.62 0.05 0.74
Thiruvadandhai 02-11-08-S23 2 1.48 0.69 0.02 0.89
Thiruvadandhai 02-11-08-S24 2 1.22 0.72 0.06 0.94
Thiruvadandhai 02-11-08-S25 2 1.01 0.81 0.12 1.21
Thiruvadandhai 02-11-08-S26 2 1.23 0.71 0.05 0.91
Thiruvadandhai 02-11-08-S27 2 1.22 0.61 0.03 0.67
Thiruvadandhai 02-11-08-S28 2 1.48 0.56 0.02 0.61
Thiruvadandhai 02-11-08-S29 2 1.43 0.58 0.02 0.60
Thiruvadandhai 02-11-08-S30 3 1.09 0.66 0.06 0.85
Thiruvadandhai 02-11-08-S31 3 0.99 0.63 0.04 0.75
Thiruvadandhai 02-11-08-S32 3 0.88 0.61 0.02 0.68
Thiruvadandhai 02-11-08-S33 3 0.94 0.61 0.00 0.70
Thiruvadandhai 02-11-08-S34 3 0.93 0.66 0.02 0.84
Thiruvadandhai 02-11-08-S35 3 1.23 0.70 0.05 0.90
Thiruvadandhai 02-11-08-S36 3 1.25 0.68 0.04 0.88
Thiruvadandhai 02-11-08-S37 3 0.94 0.63 0.02 0.74
Thiruvadandhai 02-11-08-S38 3 1.15 0.68 0.04 0.84
Thiruvadandhai 02-11-08-S39 3 0.75 0.62 0.03 0.71
Thiruvadandhai 02-11-08-S40 3 0.74 0.71 0.01 0.90
Thiruvadandhai 02-11-08-S41 3 0.51 0.69 0.01 0.88
Thiruvadandhai 02-11-08-S42 3 0.61 0.65 0.03 0.84
Thiruvadandhai 02-11-08-S43 3 0.44 0.59 0.01 0.63
Thiruvadandhai 02-11-08-S44 3 0.94 0.67 0.02 0.79
Thiruvadandhai 02-11-08-S45 3 1.05 0.66 0.07 0.81
Thiruvadandhai 02-11-08-S46 3 0.69 0.67 0.03 0.84
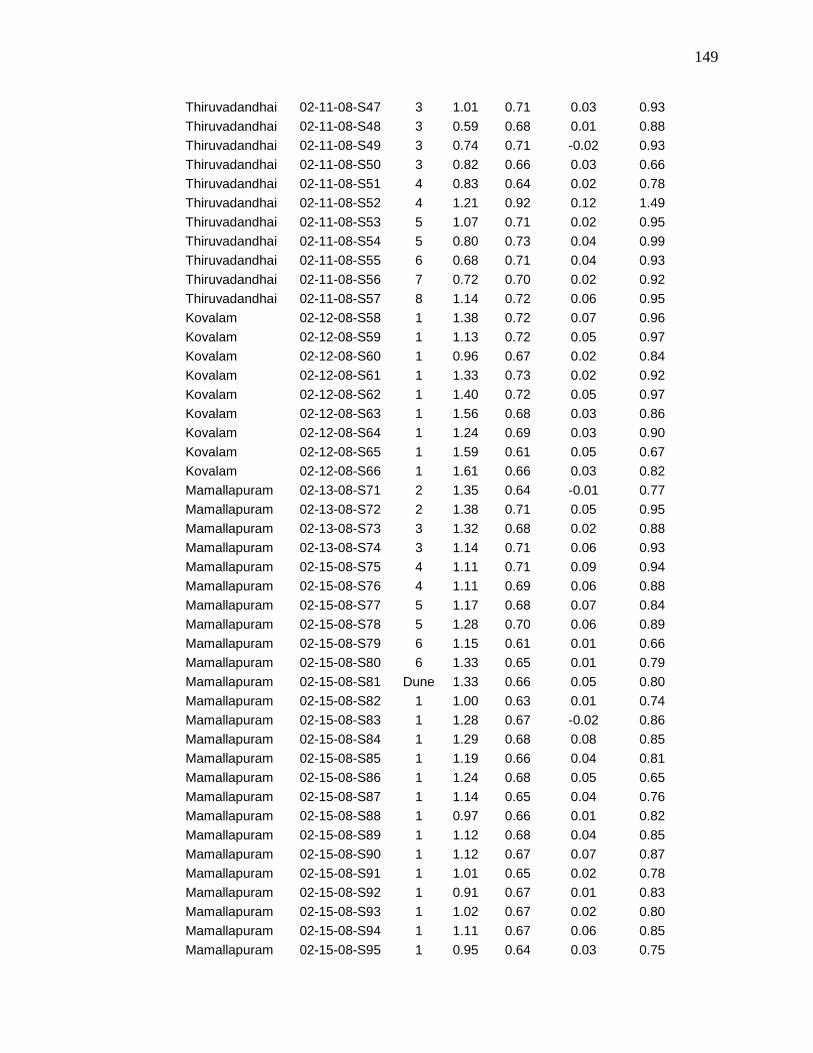
149
Thiruvadandhai 02-11-08-S47 3 1.01 0.71 0.03 0.93
Thiruvadandhai 02-11-08-S48 3 0.59 0.68 0.01 0.88
Thiruvadandhai 02-11-08-S49 3 0.74 0.71 -0.02 0.93
Thiruvadandhai 02-11-08-S50 3 0.82 0.66 0.03 0.66
Thiruvadandhai 02-11-08-S51 4 0.83 0.64 0.02 0.78
Thiruvadandhai 02-11-08-S52 4 1.21 0.92 0.12 1.49
Thiruvadandhai 02-11-08-S53 5 1.07 0.71 0.02 0.95
Thiruvadandhai 02-11-08-S54 5 0.80 0.73 0.04 0.99
Thiruvadandhai 02-11-08-S55 6 0.68 0.71 0.04 0.93
Thiruvadandhai 02-11-08-S56 7 0.72 0.70 0.02 0.92
Thiruvadandhai 02-11-08-S57 8 1.14 0.72 0.06 0.95
Kovalam 02-12-08-S58 1 1.38 0.72 0.07 0.96
Kovalam 02-12-08-S59 1 1.13 0.72 0.05 0.97
Kovalam 02-12-08-S60 1 0.96 0.67 0.02 0.84
Kovalam 02-12-08-S61 1 1.33 0.73 0.02 0.92
Kovalam 02-12-08-S62 1 1.40 0.72 0.05 0.97
Kovalam 02-12-08-S63 1 1.56 0.68 0.03 0.86
Kovalam 02-12-08-S64 1 1.24 0.69 0.03 0.90
Kovalam 02-12-08-S65 1 1.59 0.61 0.05 0.67
Kovalam 02-12-08-S66 1 1.61 0.66 0.03 0.82
Mamallapuram 02-13-08-S71 2 1.35 0.64 -0.01 0.77
Mamallapuram 02-13-08-S72 2 1.38 0.71 0.05 0.95
Mamallapuram 02-13-08-S73 3 1.32 0.68 0.02 0.88
Mamallapuram 02-13-08-S74 3 1.14 0.71 0.06 0.93
Mamallapuram 02-15-08-S75 4 1.11 0.71 0.09 0.94
Mamallapuram 02-15-08-S76 4 1.11 0.69 0.06 0.88
Mamallapuram 02-15-08-S77 5 1.17 0.68 0.07 0.84
Mamallapuram 02-15-08-S78 5 1.28 0.70 0.06 0.89
Mamallapuram 02-15-08-S79 6 1.15 0.61 0.01 0.66
Mamallapuram 02-15-08-S80 6 1.33 0.65 0.01 0.79
Mamallapuram 02-15-08-S81 Dune 1.33 0.66 0.05 0.80
Mamallapuram 02-15-08-S82 1 1.00 0.63 0.01 0.74
Mamallapuram 02-15-08-S83 1 1.28 0.67 -0.02 0.86
Mamallapuram 02-15-08-S84 1 1.29 0.68 0.08 0.85
Mamallapuram 02-15-08-S85 1 1.19 0.66 0.04 0.81
Mamallapuram 02-15-08-S86 1 1.24 0.68 0.05 0.65
Mamallapuram 02-15-08-S87 1 1.14 0.65 0.04 0.76
Mamallapuram 02-15-08-S88 1 0.97 0.66 0.01 0.82
Mamallapuram 02-15-08-S89 1 1.12 0.68 0.04 0.85
Mamallapuram 02-15-08-S90 1 1.12 0.67 0.07 0.87
Mamallapuram 02-15-08-S91 1 1.01 0.65 0.02 0.78
Mamallapuram 02-15-08-S92 1 0.91 0.67 0.01 0.83
Mamallapuram 02-15-08-S93 1 1.02 0.67 0.02 0.80
Mamallapuram 02-15-08-S94 1 1.11 0.67 0.06 0.85
Mamallapuram 02-15-08-S95 1 0.95 0.64 0.03 0.75

150
Mamallapuram 02-15-08-S96 1 1.03 0.70 0.05 0.92
Mamallapuram 02-15-08-S97 1 1.42 0.79 0.09 1.17
Mamallapuram 02-15-08-S98 1 1.51 0.81 0.10 1.18
Mamallapuram 02-15-08-S99 1 1.38 0.79 0.08 1.18
Mamallapuram 02-15-08-S100 1 1.39 0.83 0.14 1.25
Mamallapuram 02-15-08-S101 1 1.21 0.78 0.01 1.10
Mamallapuram 02-15-08-S102 1 1.12 0.73 0.06 1.04
Vadanemelli 02-16-08-S104 1 0.82 0.85 0.13 1.42
Vadanemelli 02-16-08-S105 1 0.99 0.68 0.01 0.87
Vadanemelli 02-16-08-S106 1 0.94 0.68 0.04 0.88
Vadanemelli 02-16-08-S107 1 1.02 1.04 0.27 1.88
Vadanemelli 02-16-08-S108 1 0.74 0.66 0.03 0.84
Vadanemelli 02-16-08-S109 1 0.98 1.18 0.31 2.37
Vadanemelli 02-16-08-S110 1 0.90 0.69 0.05 0.88
Vadanemelli 02-16-08-S111 1 1.17 0.82 0.06 1.22
Vadanemelli 02-16-08-S112 1 0.93 0.73 0.08 0.98
Vadanemelli 02-16-08-S113 1 1.15 0.96 0.18 1.67
Vadanemelli 02-16-08-S114 1 0.71 0.59 -0.01 0.65
Aalikuppam 02-17-08-S115 2 1.23 0.65 0.02 0.78
Aalikuppam 02-17-08-S116 2 1.12 0.69 0.03 0.91
Aalikuppam 02-17-08-S117 3 1.04 0.71 0.03 0.94
Aalikuppam 02-17-08-S118 3 0.79 0.62 0.02 0.71
Aalikuppam 02-17-08-S119 3 1.13 0.59 0.04 0.66
Aalikuppam 02-17-08-S120 4 1.10 0.58 0.02 0.62
Aalikuppam 02-17-08-S121 4 1.18 0.60 0.05 0.63
Karikattakuppam 02-18-08-S122 1 1.59 0.58 0.02 0.62
Karikattakuppam 02-18-08-S123 1 1.58 0.56 0.00 0.61
Karikattakuppam 02-18-08-S124 2 1.38 0.63 0.04 0.74
Karikattakuppam 02-18-08-S125 3 1.35 0.75 0.05 1.06
Karikattakuppam 02-18-08-S126 3 1.30 0.82 0.08 1.22
Karikattakuppam 02-18-08-S127 4 1.46 0.70 0.06 0.90
Muttukaddu 02-18-08-S128 1 2.65 1.19 0.15 2.44
Muttukaddu 02-18-08-S129 1 2.62 0.90 -0.07 1.43
Muttukaddu 02-18-08-S130 1 3.21 1.07 0.22 1.91
Muttukaddu 02-18-08-S131 1 1.83 0.78 0.05 1.11
Muttukaddu 02-18-08-S132 1 2.49 1.50 0.24 3.92
Vailanganni 02-24-08-S133 1 2.45 0.63 0.05 0.75
Vailanganni 02-24-08-S134 1 1.74 0.91 -0.02 1.59
Vailanganni 02-24-08-S135 1 2.26 0.61 0.09 0.69
Vailanganni 02-24-08-S136 1 2.32 0.98 0.26 1.59
Vailanganni 02-24-08-S137 1 2.21 0.65 0.07 0.73
Vailanganni 02-24-08-S138 1 2.18 0.68 0.08 0.85
Vailanganni 02-24-08-S139 1 2.36 1.52 0.48 3.14
Vailanganni 02-24-08-S140 2 2.23 0.73 0.01 0.98
Vailanganni 02-24-08-S141 2 2.30 0.62 0.10 0.74

151
Seruthur/Vai 02-24-08-S142 3 2.55 1.11 0.26 2.17
Seruthur/Vai 02-24-08-S143 3 2.32 0.65 0.09 0.80
Seruthur/Vai 02-24-08-S144 3 2.12 0.59 0.00 0.64
Kallar 02-24-08-S145 1 2.17 0.57 0.02 0.60
Kallar 02-24-08-S146 1 1.98 0.55 0.05 0.55
Kallar 02-24-08-S147 1 2.18 0.75 -0.01 1.06
Pushpavanam 02-25-08-S148 1 2.41 0.59 0.04 0.62
Pushpavanam 02-25-08-S149 1 2.44 0.56 0.02 0.59
Vilundamavadi 02-26-08-S150 1 2.12 0.58 0.02 0.65
Vilundamavadi 02-26-08-S151 1 2.24 0.61 0.02 0.69
Puthupalli 02-26-08-S152 1 2.19 0.66 0.02 0.83
Puthupalli 02-26-08-S153 1 2.48 0.57 0.09 0.60
Karaikal 02-27-08-S154 1 2.19 0.67 0.00 0.81
Karaikal 02-27-08-S155 1 2.48 0.59 0.08 0.60
Tranquebar 02-27-08-S156 1 2.87 1.68 0.53 3.44
Tranquebar 02-27-08-S157 1 3.24 1.92 0.63 3.31
Cuddalore 02-28-08-S158 1 2.05 0.56 0.02 0.62
Cuddalore 02-28-08-S159 1 2.04 0.64 0.07 0.74
Cuddalore 02-28-08-S160 1 1.93 0.63 0.09 0.75
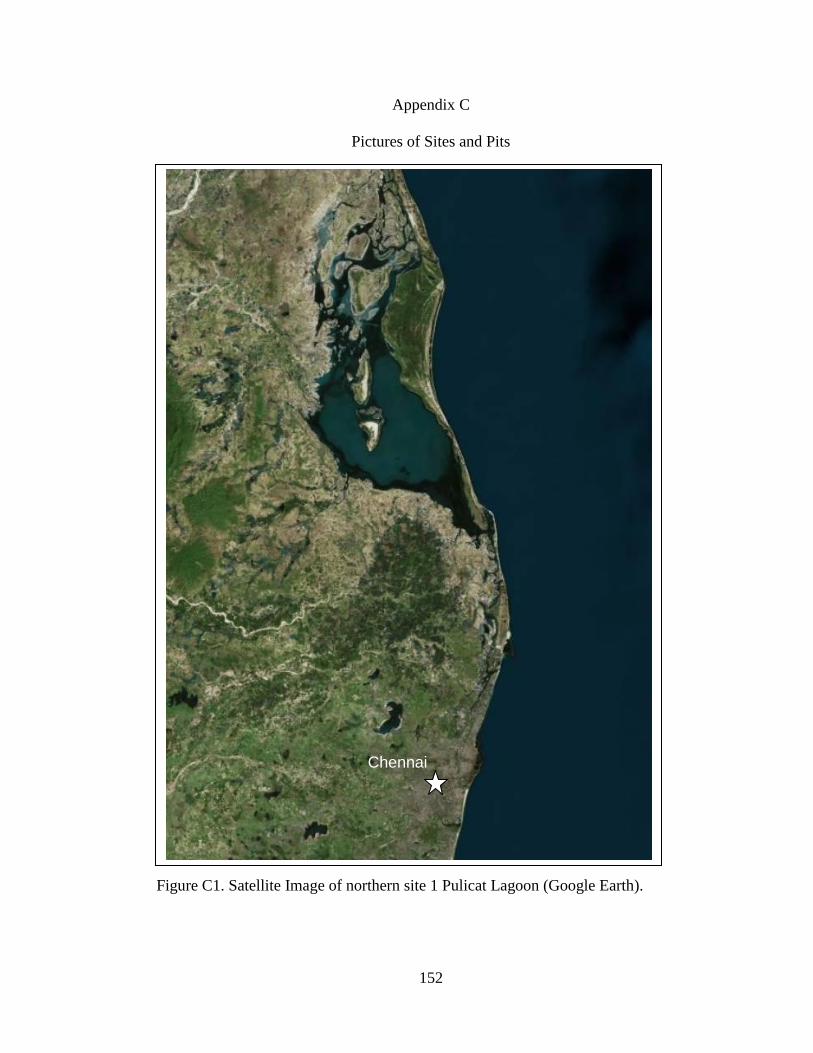
152
Appendix C
Pictures of Sites and Pits
1
Figure C1. Satellite Image of northern site 1 Pulicat Lagoon (Google Earth).
Chennai

153
Figure C2. Satellite Image of northern sites 2-8: 2) Karikattakuppam, 3)
Muttukaddu, 4) Kovalam, 5) Thiruvadandhai, 6) Vadanemelli, 7)
Mamallapuram, 8) Aalikuppam (Google Earth).
2
3 4
5
7
8
6

154
Figure C3. Satellite Image of southern sites 9-17: 9) Cuddalore, 10)
Tranquebar, 11) Karaikal, 12) Kallar, 13) Vailanganni, 14) Puthupalli, 15)
Vilundamavadi, 16) Pushpavanam, 17) Vedaranyam (Google Earth).
15
5
10
0
14
4
13
3
11
1
16
6
12
2
17
7
9

155
Figure C4. Tsunami-damaged house at Karikattakuppam

156
Figure C5. Karikattakuppam Pit 2. Note the mafic mineral laminations concentrated
below the roots and near surface soil development and destruction of sediment
structures despite not being present in tsunami deposits.

157
Figure C6. Muttukaddu Pit 1. Note the trace shells fragments within and underlying the
tsunami sand.

158
Figure C7. Tsunami scour fan at Thiruvadandhai. Note: Anna University graduate
student for scale.

159
Figure C8. Thiruvadandhai Pit 3. Note the mafic mineral laminations concentrated
near the surface.

160
Figure C9. Tsunami scour fan at Vadanemelli.

161
Figure C10. Mamallapuram Pit 2. This pit was 200 meters from the swash zone.
Note mafic mineral laminations concentrated at the bottom of the tsunami deposit.

162
Figure C11. Tsunami flotsam line in swale at Aalikuppam. Looking west, note the
third and final landward beach ridge gently slopes up in the background of the
picture.
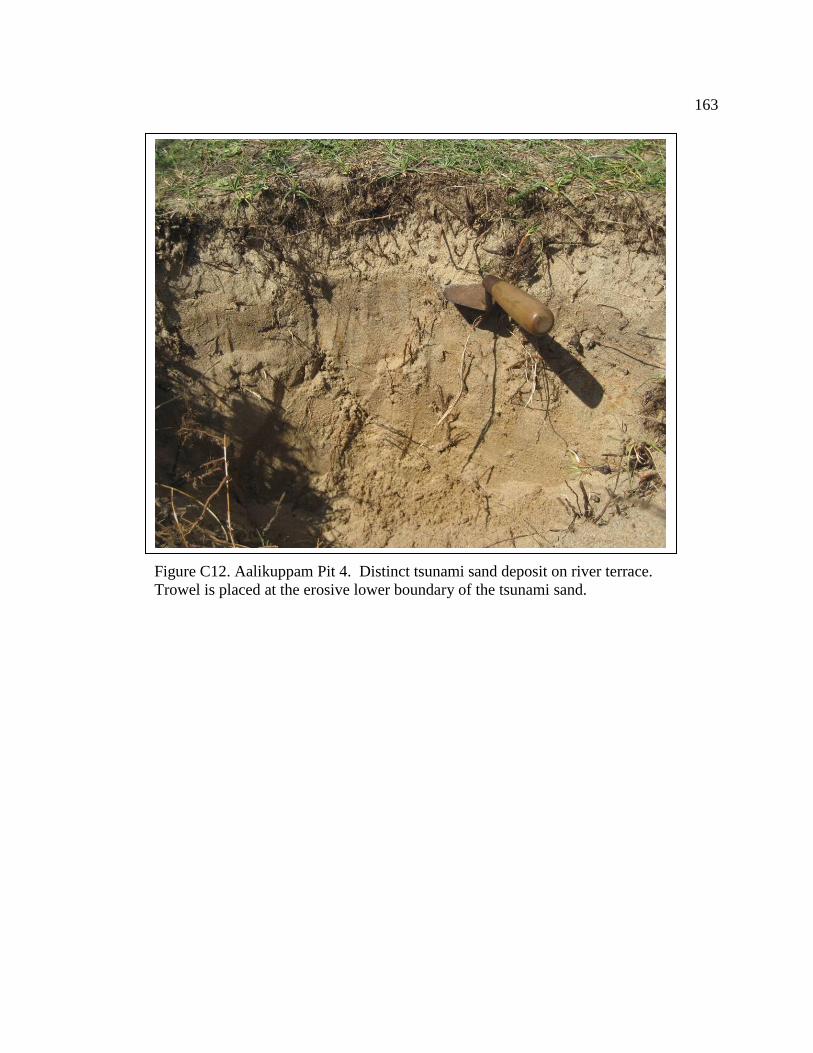
163
Figure C12. Aalikuppam Pit 4. Distinct tsunami sand deposit on river terrace.
Trowel is placed at the erosive lower boundary of the tsunami sand.
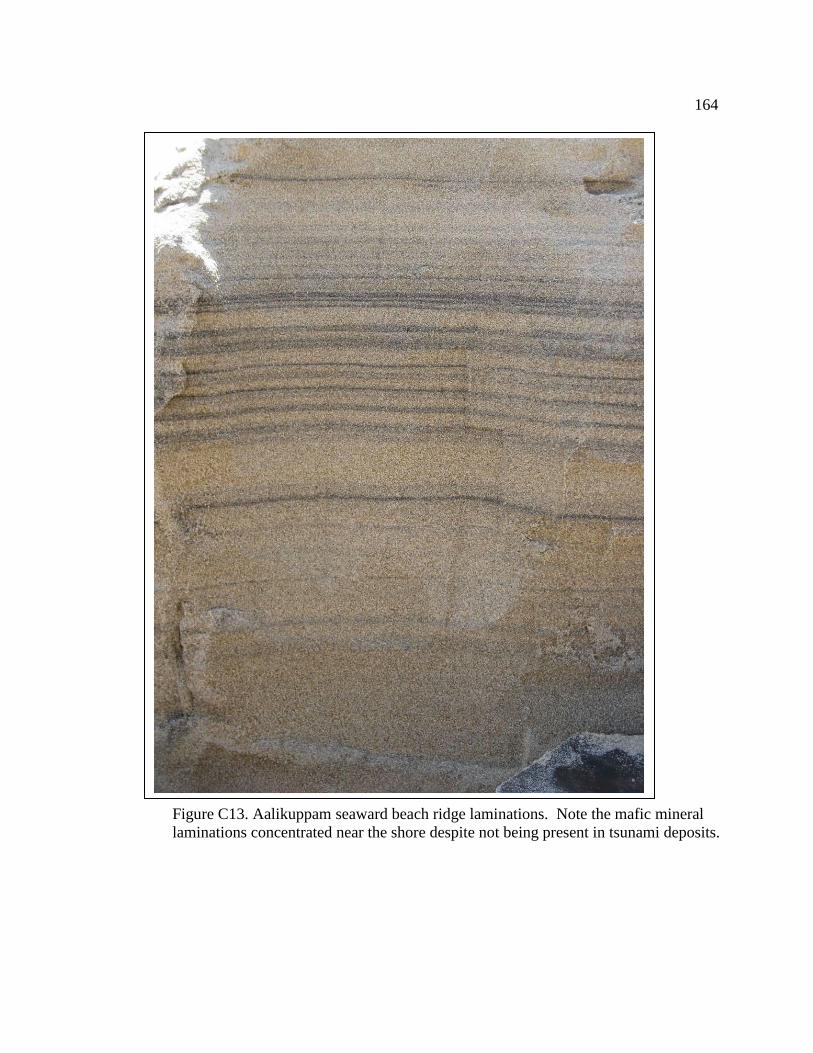
164
Figure C13. Aalikuppam seaward beach ridge laminations. Note the mafic mineral
laminations concentrated near the shore despite not being present in tsunami deposits.

165
Figure C14. Karaikal Pit 1. Note distinct clay unit at lower boundary of tsunami
deposit.
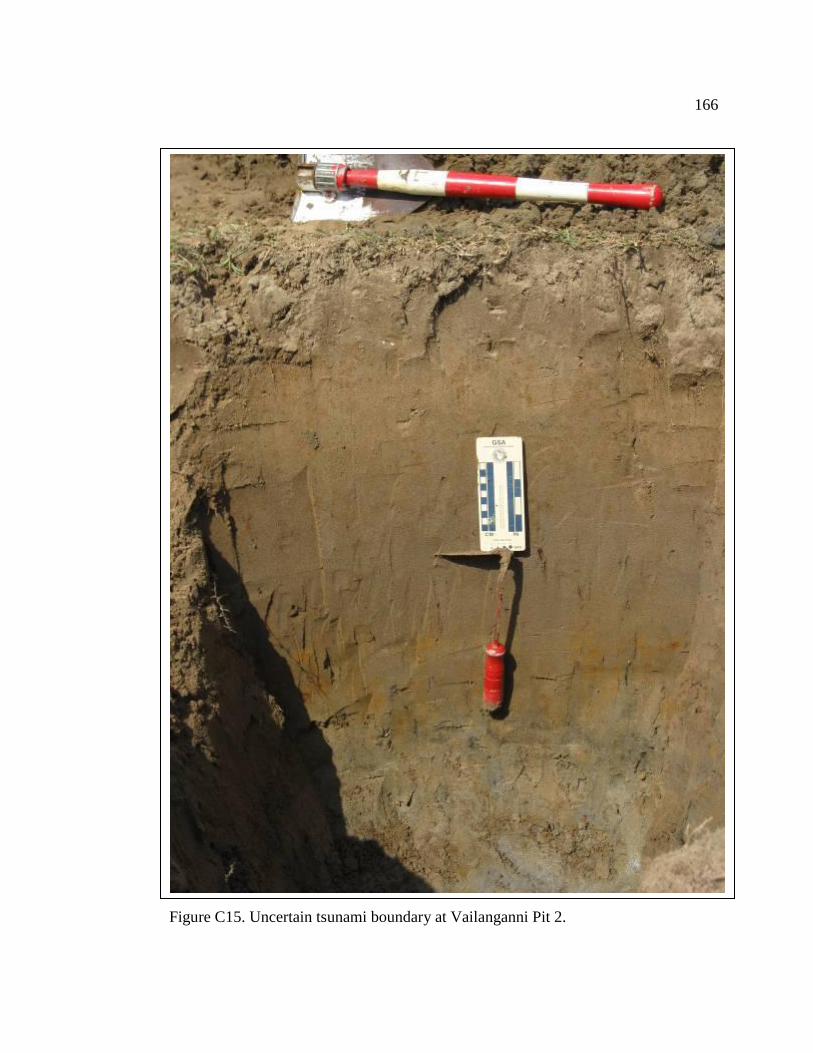
166
Figure C15. Uncertain tsunami boundary at Vailanganni Pit 2.

167
Figure C16. Vedaranyam Pit 1. Note, distinct clay deposition over 2004 tsunami
deposits.
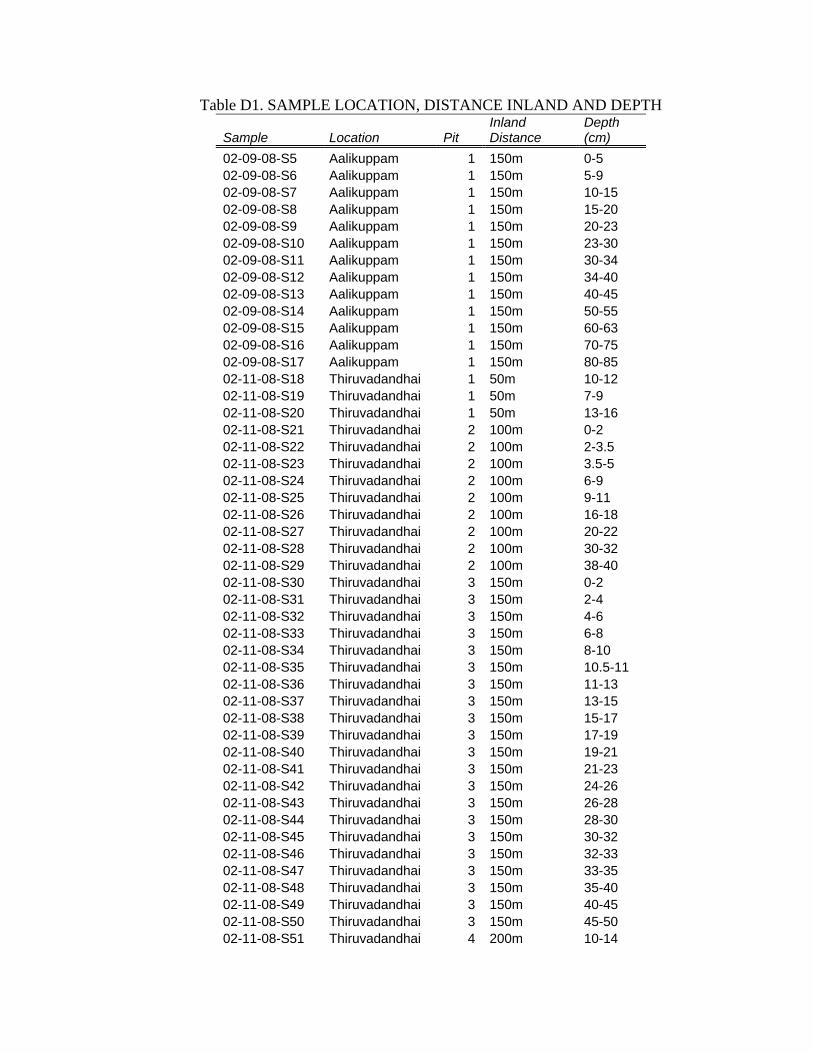
Table D1. SAMPLE LOCATION, DISTANCE INLAND AND DEPTH
Sample Location Pit Inland Distance
Depth (cm)
02-09-08-S5 Aalikuppam 1 150m 0-5 02-09-08-S6 Aalikuppam 1 150m 5-9 02-09-08-S7 Aalikuppam 1 150m 10-15 02-09-08-S8 Aalikuppam 1 150m 15-20 02-09-08-S9 Aalikuppam 1 150m 20-23 02-09-08-S10 Aalikuppam 1 150m 23-30 02-09-08-S11 Aalikuppam 1 150m 30-34 02-09-08-S12 Aalikuppam 1 150m 34-40 02-09-08-S13 Aalikuppam 1 150m 40-45 02-09-08-S14 Aalikuppam 1 150m 50-55 02-09-08-S15 Aalikuppam 1 150m 60-63 02-09-08-S16 Aalikuppam 1 150m 70-75 02-09-08-S17 Aalikuppam 1 150m 80-85 02-11-08-S18 Thiruvadandhai 1 50m 10-12 02-11-08-S19 Thiruvadandhai 1 50m 7-9 02-11-08-S20 Thiruvadandhai 1 50m 13-16 02-11-08-S21 Thiruvadandhai 2 100m 0-2 02-11-08-S22 Thiruvadandhai 2 100m 2-3.5 02-11-08-S23 Thiruvadandhai 2 100m 3.5-5 02-11-08-S24 Thiruvadandhai 2 100m 6-9 02-11-08-S25 Thiruvadandhai 2 100m 9-11 02-11-08-S26 Thiruvadandhai 2 100m 16-18 02-11-08-S27 Thiruvadandhai 2 100m 20-22 02-11-08-S28 Thiruvadandhai 2 100m 30-32 02-11-08-S29 Thiruvadandhai 2 100m 38-40 02-11-08-S30 Thiruvadandhai 3 150m 0-2 02-11-08-S31 Thiruvadandhai 3 150m 2-4 02-11-08-S32 Thiruvadandhai 3 150m 4-6 02-11-08-S33 Thiruvadandhai 3 150m 6-8 02-11-08-S34 Thiruvadandhai 3 150m 8-10 02-11-08-S35 Thiruvadandhai 3 150m 10.5-11 02-11-08-S36 Thiruvadandhai 3 150m 11-13 02-11-08-S37 Thiruvadandhai 3 150m 13-15 02-11-08-S38 Thiruvadandhai 3 150m 15-17 02-11-08-S39 Thiruvadandhai 3 150m 17-19 02-11-08-S40 Thiruvadandhai 3 150m 19-21 02-11-08-S41 Thiruvadandhai 3 150m 21-23 02-11-08-S42 Thiruvadandhai 3 150m 24-26 02-11-08-S43 Thiruvadandhai 3 150m 26-28 02-11-08-S44 Thiruvadandhai 3 150m 28-30 02-11-08-S45 Thiruvadandhai 3 150m 30-32 02-11-08-S46 Thiruvadandhai 3 150m 32-33 02-11-08-S47 Thiruvadandhai 3 150m 33-35 02-11-08-S48 Thiruvadandhai 3 150m 35-40 02-11-08-S49 Thiruvadandhai 3 150m 40-45 02-11-08-S50 Thiruvadandhai 3 150m 45-50 02-11-08-S51 Thiruvadandhai 4 200m 10-14

02-11-08-S52 Thiruvadandhai 4 200m 20-25 02-11-08-S53 Thiruvadandhai 5 250m 0-5 02-11-08-S54 Thiruvadandhai 5 250m 15-20 02-11-08-S55 Thiruvadandhai 6 280m 0-3 02-11-08-S56 Thiruvadandhai 7 300m 0-2 02-11-08-S57 Thiruvadandhai 8 300+m 0-5 02-12-08-S58 Kovalam 1 40m 2-4 02-12-08-S59 Kovalam 1 40m 4-7 02-12-08-S60 Kovalam 1 40m 7-10 02-12-08-S61 Kovalam 1 40m 10-12 02-12-08-S62 Kovalam 1 40m 12-14 02-12-08-S63 Kovalam 1 40m 15-18 02-12-08-S64 Kovalam 1 40m 18-20 02-12-08-S65 Kovalam 1 40m 20-22 02-12-08-S66 Kovalam 1 40m 22-25 02-13-08-S71 Mamallapuram 2 200m 16-18 02-13-08-S72 Mamallapuram 2 200m 28-30 02-13-08-S73 Mamallapuram 3 250m 6-8 02-13-08-S74 Mamallapuram 3 250m 36-39 02-15-08-S75 Mamallapuram 4 350m 0-3 02-15-08-S76 Mamallapuram 4 350m 8-11 02-15-08-S77 Mamallapuram 5 450m 0-1 02-15-08-S78 Mamallapuram 5 450m 14-17 02-15-08-S79 Mamallapuram 6 500m 0-0.5 02-15-08-S80 Mamallapuram 6 500m 10-13 02-15-08-S81 Mamallapuram Dune 570m 0-2 02-15-08-S82 Mamallapuram 1 120m 0-2 02-15-08-S83 Mamallapuram 1 120m 2-4 02-15-08-S84 Mamallapuram 1 120m 4-6 02-15-08-S85 Mamallapuram 1 120m 6-8 02-15-08-S86 Mamallapuram 1 120m 8-10 02-15-08-S87 Mamallapuram 1 120m 10-12 02-15-08-S88 Mamallapuram 1 120m 12-14 02-15-08-S89 Mamallapuram 1 120m 14-16 02-15-08-S90 Mamallapuram 1 120m 16-18 02-15-08-S91 Mamallapuram 1 120m 18-20 02-15-08-S92 Mamallapuram 1 120m 20-22 02-15-08-S93 Mamallapuram 1 120m 22-24 02-15-08-S94 Mamallapuram 1 120m 24-26 02-15-08-S95 Mamallapuram 1 120m 26-28 02-15-08-S96 Mamallapuram 1 120m 28-30 02-15-08-S97 Mamallapuram 1 120m 30-32 02-15-08-S98 Mamallapuram 1 120m 32-34 02-15-08-S99 Mamallapuram 1 120m 34-36 02-15-08-S100 Mamallapuram 1 120m 36-38 02-15-08-S101 Mamallapuram 1 120m 38-40 02-15-08-S102 Mamallapuram 1 120m 40-42 02-16-08-S104 Vadanemelli 1 100m 3-5 02-16-08-S105 Vadanemelli 1 100m 5-7 02-16-08-S106 Vadanemelli 1 100m 7-9

02-16-08-S107 Vadanemelli 1 100m 9-11 02-16-08-S108 Vadanemelli 1 100m 11-13 02-16-08-S109 Vadanemelli 1 100m 14-15 02-16-08-S110 Vadanemelli 1 100m 18-20 02-16-08-S111 Vadanemelli 1 100m 22-23 02-16-08-S112 Vadanemelli 1 100m 24-26 02-16-08-S113 Vadanemelli 1 100m 28-29 02-16-08-S114 Vadanemelli 1 100m 31-34 02-17-08-S115 Aalikuppam 2 200m 0-2 02-17-08-S116 Aalikuppam 2 200m 20-23 02-17-08-S117 Aalikuppam 3 350m 0-3 02-17-08-S118 Aalikuppam 3 350m 17-19 02-17-08-S119 Aalikuppam 3 350m 35-40 02-17-08-S120 Aalikuppam 4 100m 10-12 02-17-08-S121 Aalikuppam 4 100m 4-6 02-18-08-S122 Karikattakuppam 1 50m 6-9 02-18-08-S123 Karikattakuppam 1 50m 20-23 02-18-08-S124 Karikattakuppam 2 100m 11-13 02-18-08-S125 Karikattakuppam 3 150m 0-2 02-18-08-S126 Karikattakuppam 3 150m 9-11 02-18-08-S127 Karikattakuppam 4 200m 5-10 02-18-08-S128 Muttukaddu 1 0.5-2.5 02-18-08-S129 Muttukaddu 1 4.5-5.5 02-18-08-S130 Muttukaddu 1 5.5-7.5 02-18-08-S131 Muttukaddu 1 7.5-8.5 02-18-08-S132 Muttukaddu 1 19-22 02-24-08-S133 Vailanganni 1 350m 1-4 02-24-08-S134 Vailanganni 1 350m 6-10 02-24-08-S135 Vailanganni 1 350m 19-22 02-24-08-S136 Vailanganni 1 350m 41-44 02-24-08-S137 Vailanganni 1 350m 58-61 02-24-08-S138 Vailanganni 1 350m 74-77 02-24-08-S139 Vailanganni 1 350m 84-87 02-24-08-S140 Vailanganni 2 380m 1-4 02-24-08-S141 Vailanganni 2 380m 10-13 02-24-08-S142 Vailanganni 3 380m 1-4 02-24-08-S143 Vailanganni 3 380m 31-34 02-24-08-S144 Vailanganni 3 380m 57-60 02-24-08-S145 Kallar 1 0-4 02-24-08-S146 Kallar 1 29-32 02-24-08-S147 Kallar 1 100-103 02-25-08-S148 Pushpavanam 1 300m 19-22 02-25-08-S149 Pushpavanam 1 300m 37-40 02-26-08-S150 Vilundamavadi 1 150m 14-17 02-26-08-S151 Vilundamavadi 1 150m 32-35 02-26-08-S152 Puthupalli 1 500m 8-11 02-26-08-S153 Puthupalli 1 500m 25-28 02-27-08-S154 Karaikal 1 200m 5-8 02-27-08-S155 Karaikal 1 200m 29-32 02-27-08-S156 Tranquebar 1 900m 6-9

02-27-08-S157 Tranquebar 1 900m 34-37 02-28-08-S158 Cuddalore 1 400m 3-5 02-28-08-S159 Cuddalore 1 400m 15-18 02-28-08-S160 Cuddalore 1 400m 34-37

Result Analysis Report
Vol. Weighted Mean D[4,3]:
%
m²/g
um
Surface Weighted Mean D[3,2]:0.0159 498.651
d(0.9):
Accessory Name:
Span :1.317
umSpecific Surface Area:
21.22
Operator notes:
Uniformity:%Vol
Obscuration:
453.097 835.966d(0.1): um
0.407
377.919
um239.145 d(0.5):
Volume
Particle Size Distribution
0.01 0.1 1 10 100 1000 3000
Particle Size (µm)
0
2
4
6
8
10
12
Vol
ume
(%)
S5 - Average, Tuesday, October 21, 2008 10:47:32 AM
Hydro 2000G (A)
Result units:
um
Concentration:1.2784
Weighted Residual:1.058 %
Size (µm)0.010
0.011
0.013
0.015
0.017
0.020
0.023
0.026
0.030
0.035
0.040
0.046
0.052
0.060
0.069
0.079
0.091
0.105
Volume In %
0.00
0.00
0.00
0.00
0.00
0.00
0.00
0.00
0.00
0.00
0.00
0.00
0.00
0.00
0.00
0.00
0.00
Size (µm)0.105
0.120
0.138
0.158
0.182
0.209
0.240
0.275
0.316
0.363
0.417
0.479
0.550
0.631
0.724
0.832
0.955
1.096
Volume In %
0.00
0.00
0.00
0.00
0.00
0.00
0.00
0.00
0.00
0.00
0.00
0.00
0.00
0.00
0.00
0.00
0.00
Size (µm)1.096
1.259
1.445
1.660
1.905
2.188
2.512
2.884
3.311
3.802
4.365
5.012
5.754
6.607
7.586
8.710
10.000
11.482
Volume In %
0.00
0.00
0.00
0.00
0.00
0.00
0.00
0.00
0.00
0.00
0.00
0.00
0.00
0.00
0.00
0.00
0.00
Size (µm)11.482
13.183
15.136
17.378
19.953
22.909
26.303
30.200
34.674
39.811
45.709
52.481
60.256
69.183
79.433
91.201
104.713
120.226
Volume In %
0.00
0.00
0.00
0.00
0.00
0.00
0.02
0.08
0.13
0.17
0.21
0.21
0.17
0.05
-0.00
0.00
0.00
Size (µm)120.226
138.038
158.489
181.970
208.930
239.883
275.423
316.228
363.078
416.869
478.630
549.541
630.957
724.436
831.764
954.993
1096.478
1258.925
Volume In %
0.08
0.60
1.45
2.69
4.24
6.01
7.75
9.28
10.34
10.80
10.58
9.74
8.40
6.77
5.04
3.39
1.71
Size (µm)1258.925
1445.440
1659.587
1905.461
2187.762
2511.886
2884.032
3311.311
3801.894
4365.158
5011.872
5754.399
6606.934
7585.776
8709.636
10000.000
Volume In %
0.07
0.00
0.00
0.00
0.00
0.00
0.00
0.00
0.00
0.00
0.00
0.00
0.00
0.00
0.00
Tuesday, October 21, 2008 10:47:32 AM
AveragedPit1
Measured by:student
Sample bulk lot ref:
Aalikuppam
Sample Name:
Analysed:
Measured:
Sample Source & type:Tuesday, October 21, 2008 10:47:34 AM
S5 - AverageSOP Name:
Result Source:
Sensitivity:
Dispersant Name:Water Off
Size range:
Default
Particle RI:
1.330Result Emulation:
Absorption:0.020 to0.1
NormalAnalysis model:
2000.000
Dispersant RI:
1.520
General purposeParticle Name:
um
Tel := +[44] (0) 1684-892456 Fax +[44] (0) 1684-892789Malvern, UKMalvern Instruments Ltd.
Serial Number : MAL1022570Mastersizer 2000 Ver. 5.54
30 May 2011 8:34:50 AMRecord Number: 6File name: Aalikuppam Pit1

Result Analysis Report
Vol. Weighted Mean D[4,3]:
%
m²/g
um
Surface Weighted Mean D[3,2]:0.0181 437.885
d(0.9):
Accessory Name:
Span :1.320
umSpecific Surface Area:
21.98
Operator notes:
Uniformity:%Vol
Obscuration:
398.284 734.117d(0.1): um
0.407
332.132
um208.481 d(0.5):
Volume
Particle Size Distribution
0.01 0.1 1 10 100 1000 3000
Particle Size (µm)
0
2
4
6
8
10
12
Vol
ume
(%)
S6 - Average, Tuesday, October 21, 2008 4:55:13 PM
Hydro 2000G (A)
Result units:
um
Concentration:1.1688
Weighted Residual:0.893 %
Size (µm)0.010
0.011
0.013
0.015
0.017
0.020
0.023
0.026
0.030
0.035
0.040
0.046
0.052
0.060
0.069
0.079
0.091
0.105
Volume In %
0.00
0.00
0.00
0.00
0.00
0.00
0.00
0.00
0.00
0.00
0.00
0.00
0.00
0.00
0.00
0.00
0.00
Size (µm)0.105
0.120
0.138
0.158
0.182
0.209
0.240
0.275
0.316
0.363
0.417
0.479
0.550
0.631
0.724
0.832
0.955
1.096
Volume In %
0.00
0.00
0.00
0.00
0.00
0.00
0.00
0.00
0.00
0.00
0.00
0.00
0.00
0.00
0.00
0.00
0.00
Size (µm)1.096
1.259
1.445
1.660
1.905
2.188
2.512
2.884
3.311
3.802
4.365
5.012
5.754
6.607
7.586
8.710
10.000
11.482
Volume In %
0.00
0.00
0.00
0.00
0.00
0.00
0.00
0.00
0.00
0.00
0.00
0.00
0.00
0.00
0.00
0.00
0.00
Size (µm)11.482
13.183
15.136
17.378
19.953
22.909
26.303
30.200
34.674
39.811
45.709
52.481
60.256
69.183
79.433
91.201
104.713
120.226
Volume In %
0.00
0.00
0.00
0.00
0.00
0.01
0.06
0.11
0.16
0.20
0.21
0.17
0.10
0.01
0.00
0.00
0.11
Size (µm)120.226
138.038
158.489
181.970
208.930
239.883
275.423
316.228
363.078
416.869
478.630
549.541
630.957
724.436
831.764
954.993
1096.478
1258.925
Volume In %
0.65
1.47
2.65
4.16
5.86
7.59
9.10
10.21
10.73
10.59
9.82
8.54
6.92
5.16
3.50
1.73
0.19
Size (µm)1258.925
1445.440
1659.587
1905.461
2187.762
2511.886
2884.032
3311.311
3801.894
4365.158
5011.872
5754.399
6606.934
7585.776
8709.636
10000.000
Volume In %
0.00
0.00
0.00
0.00
0.00
0.00
0.00
0.00
0.00
0.00
0.00
0.00
0.00
0.00
0.00
Tuesday, October 21, 2008 4:55:13 PM
AveragedPit1
Measured by:student
Sample bulk lot ref:
Aalikuppam
Sample Name:
Analysed:
Measured:
Sample Source & type:Tuesday, October 21, 2008 4:55:14 PM
S6 - AverageSOP Name:
Result Source:
Sensitivity:
Dispersant Name:Water Off
Size range:
Default
Particle RI:
1.330Result Emulation:
Absorption:0.020 to0.1
NormalAnalysis model:
2000.000
Dispersant RI:
1.520
General purposeParticle Name:
um
Tel := +[44] (0) 1684-892456 Fax +[44] (0) 1684-892789Malvern, UKMalvern Instruments Ltd.
Serial Number : MAL1022570Mastersizer 2000 Ver. 5.54
30 May 2011 8:35:02 AMRecord Number: 12File name: Aalikuppam Pit1

Result Analysis Report
Vol. Weighted Mean D[4,3]:
%
m²/g
um
Surface Weighted Mean D[3,2]:0.0159 473.071
d(0.9):
Accessory Name:
Span :1.358
umSpecific Surface Area:
19.80
Operator notes:
Uniformity:%Vol
Obscuration:
424.663 800.062d(0.1): um
0.417
377.191
um223.499 d(0.5):
Volume
Particle Size Distribution
0.01 0.1 1 10 100 1000 3000
Particle Size (µm)
0
2
4
6
8
10
12
Vol
ume
(%)
S7 - Average, Tuesday, October 21, 2008 5:04:33 PM
Hydro 2000G (A)
Result units:
um
Concentration:1.1821
Weighted Residual:1.013 %
Size (µm)0.010
0.011
0.013
0.015
0.017
0.020
0.023
0.026
0.030
0.035
0.040
0.046
0.052
0.060
0.069
0.079
0.091
0.105
Volume In %
0.00
0.00
0.00
0.00
0.00
0.00
0.00
0.00
0.00
0.00
0.00
0.00
0.00
0.00
0.00
0.00
0.00
Size (µm)0.105
0.120
0.138
0.158
0.182
0.209
0.240
0.275
0.316
0.363
0.417
0.479
0.550
0.631
0.724
0.832
0.955
1.096
Volume In %
0.00
0.00
0.00
0.00
0.00
0.00
0.00
0.00
0.00
0.00
0.00
0.00
0.00
0.00
0.00
0.00
0.00
Size (µm)1.096
1.259
1.445
1.660
1.905
2.188
2.512
2.884
3.311
3.802
4.365
5.012
5.754
6.607
7.586
8.710
10.000
11.482
Volume In %
0.00
0.00
0.00
0.00
0.00
0.00
0.00
0.00
0.00
0.00
0.00
0.00
0.00
0.00
0.00
0.00
0.00
Size (µm)11.482
13.183
15.136
17.378
19.953
22.909
26.303
30.200
34.674
39.811
45.709
52.481
60.256
69.183
79.433
91.201
104.713
120.226
Volume In %
0.00
0.00
0.00
0.00
0.00
0.00
0.00
0.00
0.00
0.00
0.00
0.00
0.00
0.00
0.00
0.00
0.04
Size (µm)120.226
138.038
158.489
181.970
208.930
239.883
275.423
316.228
363.078
416.869
478.630
549.541
630.957
724.436
831.764
954.993
1096.478
1258.925
Volume In %
0.44
1.18
2.27
3.69
5.31
7.00
8.53
9.72
10.40
10.49
9.98
8.95
7.55
5.96
4.35
2.83
1.29
Size (µm)1258.925
1445.440
1659.587
1905.461
2187.762
2511.886
2884.032
3311.311
3801.894
4365.158
5011.872
5754.399
6606.934
7585.776
8709.636
10000.000
Volume In %
0.02
0.00
0.00
0.00
0.00
0.00
0.00
0.00
0.00
0.00
0.00
0.00
0.00
0.00
0.00
Tuesday, October 21, 2008 5:04:33 PM
AveragedPit1
Measured by:student
Sample bulk lot ref:
Aalikuppam
Sample Name:
Analysed:
Measured:
Sample Source & type:Tuesday, October 21, 2008 5:04:34 PM
S7 - AverageSOP Name:
Result Source:
Sensitivity:
Dispersant Name:Water Off
Size range:
Default
Particle RI:
1.330Result Emulation:
Absorption:0.020 to0.1
NormalAnalysis model:
2000.000
Dispersant RI:
1.520
General purposeParticle Name:
um
Tel := +[44] (0) 1684-892456 Fax +[44] (0) 1684-892789Malvern, UKMalvern Instruments Ltd.
Serial Number : MAL1022570Mastersizer 2000 Ver. 5.54
30 May 2011 8:35:15 AMRecord Number: 18File name: Aalikuppam Pit1

Result Analysis Report
Vol. Weighted Mean D[4,3]:
%
m²/g
um
Surface Weighted Mean D[3,2]:0.0154 480.555
d(0.9):
Accessory Name:
Span :1.311
umSpecific Surface Area:
20.52
Operator notes:
Uniformity:%Vol
Obscuration:
433.749 802.388d(0.1): um
0.404
389.102
um233.735 d(0.5):
Volume
Particle Size Distribution
0.01 0.1 1 10 100 1000 3000
Particle Size (µm)
0
2
4
6
8
10
12
Vol
ume
(%)
S8 - Average, Tuesday, October 21, 2008 5:15:41 PM
Hydro 2000G (A)
Result units:
um
Concentration:1.2687
Weighted Residual:1.067 %
Size (µm)0.010
0.011
0.013
0.015
0.017
0.020
0.023
0.026
0.030
0.035
0.040
0.046
0.052
0.060
0.069
0.079
0.091
0.105
Volume In %
0.00
0.00
0.00
0.00
0.00
0.00
0.00
0.00
0.00
0.00
0.00
0.00
0.00
0.00
0.00
0.00
0.00
Size (µm)0.105
0.120
0.138
0.158
0.182
0.209
0.240
0.275
0.316
0.363
0.417
0.479
0.550
0.631
0.724
0.832
0.955
1.096
Volume In %
0.00
0.00
0.00
0.00
0.00
0.00
0.00
0.00
0.00
0.00
0.00
0.00
0.00
0.00
0.00
0.00
0.00
Size (µm)1.096
1.259
1.445
1.660
1.905
2.188
2.512
2.884
3.311
3.802
4.365
5.012
5.754
6.607
7.586
8.710
10.000
11.482
Volume In %
0.00
0.00
0.00
0.00
0.00
0.00
0.00
0.00
0.00
0.00
0.00
0.00
0.00
0.00
0.00
0.00
0.00
Size (µm)11.482
13.183
15.136
17.378
19.953
22.909
26.303
30.200
34.674
39.811
45.709
52.481
60.256
69.183
79.433
91.201
104.713
120.226
Volume In %
0.00
0.00
0.00
0.00
0.00
0.00
0.00
0.00
0.00
0.00
0.00
0.00
0.00
0.00
0.00
0.00
0.00
Size (µm)120.226
138.038
158.489
181.970
208.930
239.883
275.423
316.228
363.078
416.869
478.630
549.541
630.957
724.436
831.764
954.993
1096.478
1258.925
Volume In %
0.08
0.85
1.85
3.30
4.99
6.80
8.49
9.85
10.66
10.84
10.36
9.31
7.86
6.21
4.52
2.85
1.16
Size (µm)1258.925
1445.440
1659.587
1905.461
2187.762
2511.886
2884.032
3311.311
3801.894
4365.158
5011.872
5754.399
6606.934
7585.776
8709.636
10000.000
Volume In %
0.02
0.00
0.00
0.00
0.00
0.00
0.00
0.00
0.00
0.00
0.00
0.00
0.00
0.00
0.00
Tuesday, October 21, 2008 5:15:41 PM
AveragedPit1
Measured by:student
Sample bulk lot ref:
Aalikuppam
Sample Name:
Analysed:
Measured:
Sample Source & type:Tuesday, October 21, 2008 5:15:42 PM
S8 - AverageSOP Name:
Result Source:
Sensitivity:
Dispersant Name:Water Off
Size range:
Default
Particle RI:
1.330Result Emulation:
Absorption:0.020 to0.1
NormalAnalysis model:
2000.000
Dispersant RI:
1.520
General purposeParticle Name:
um
Tel := +[44] (0) 1684-892456 Fax +[44] (0) 1684-892789Malvern, UKMalvern Instruments Ltd.
Serial Number : MAL1022570Mastersizer 2000 Ver. 5.54
30 May 2011 8:35:29 AMRecord Number: 24File name: Aalikuppam Pit1
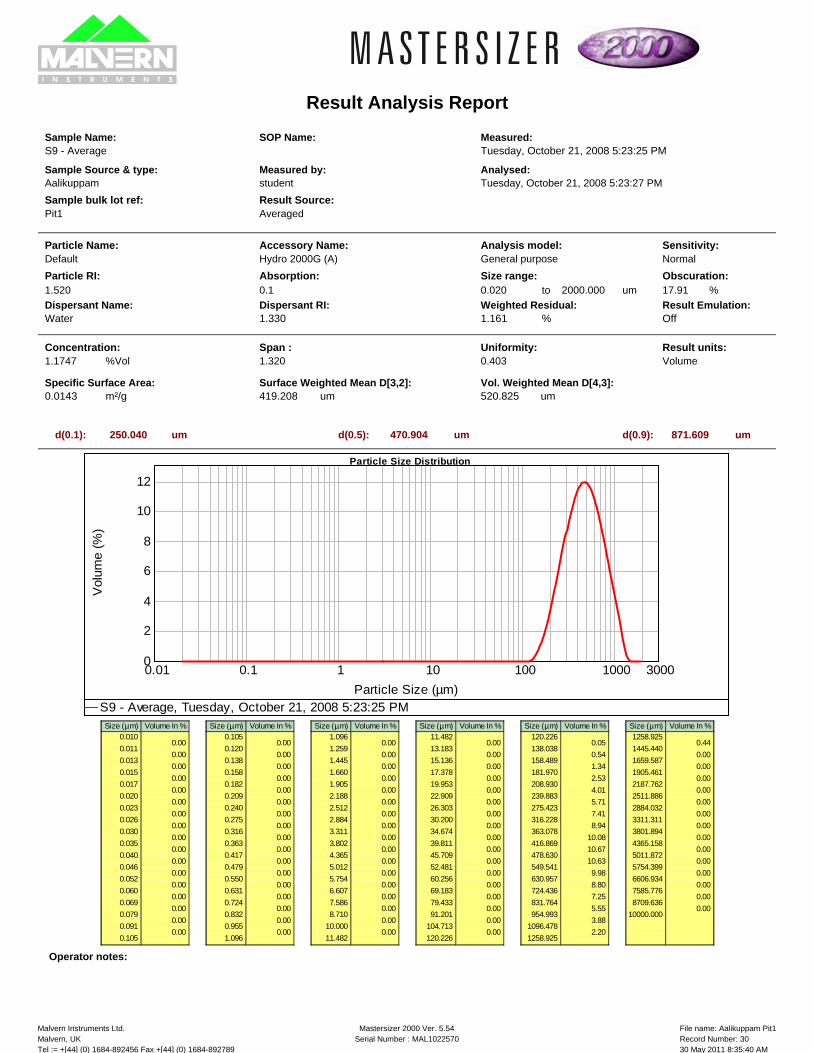
Result Analysis Report
Vol. Weighted Mean D[4,3]:
%
m²/g
um
Surface Weighted Mean D[3,2]:0.0143 520.825
d(0.9):
Accessory Name:
Span :1.320
umSpecific Surface Area:
17.91
Operator notes:
Uniformity:%Vol
Obscuration:
470.904 871.609d(0.1): um
0.403
419.208
um250.040 d(0.5):
Volume
Particle Size Distribution
0.01 0.1 1 10 100 1000 3000
Particle Size (µm)
0
2
4
6
8
10
12
Vol
ume
(%)
S9 - Average, Tuesday, October 21, 2008 5:23:25 PM
Hydro 2000G (A)
Result units:
um
Concentration:1.1747
Weighted Residual:1.161 %
Size (µm)0.010
0.011
0.013
0.015
0.017
0.020
0.023
0.026
0.030
0.035
0.040
0.046
0.052
0.060
0.069
0.079
0.091
0.105
Volume In %
0.00
0.00
0.00
0.00
0.00
0.00
0.00
0.00
0.00
0.00
0.00
0.00
0.00
0.00
0.00
0.00
0.00
Size (µm)0.105
0.120
0.138
0.158
0.182
0.209
0.240
0.275
0.316
0.363
0.417
0.479
0.550
0.631
0.724
0.832
0.955
1.096
Volume In %
0.00
0.00
0.00
0.00
0.00
0.00
0.00
0.00
0.00
0.00
0.00
0.00
0.00
0.00
0.00
0.00
0.00
Size (µm)1.096
1.259
1.445
1.660
1.905
2.188
2.512
2.884
3.311
3.802
4.365
5.012
5.754
6.607
7.586
8.710
10.000
11.482
Volume In %
0.00
0.00
0.00
0.00
0.00
0.00
0.00
0.00
0.00
0.00
0.00
0.00
0.00
0.00
0.00
0.00
0.00
Size (µm)11.482
13.183
15.136
17.378
19.953
22.909
26.303
30.200
34.674
39.811
45.709
52.481
60.256
69.183
79.433
91.201
104.713
120.226
Volume In %
0.00
0.00
0.00
0.00
0.00
0.00
0.00
0.00
0.00
0.00
0.00
0.00
0.00
0.00
0.00
0.00
0.00
Size (µm)120.226
138.038
158.489
181.970
208.930
239.883
275.423
316.228
363.078
416.869
478.630
549.541
630.957
724.436
831.764
954.993
1096.478
1258.925
Volume In %
0.05
0.54
1.34
2.53
4.01
5.71
7.41
8.94
10.08
10.67
10.63
9.98
8.80
7.25
5.55
3.88
2.20
Size (µm)1258.925
1445.440
1659.587
1905.461
2187.762
2511.886
2884.032
3311.311
3801.894
4365.158
5011.872
5754.399
6606.934
7585.776
8709.636
10000.000
Volume In %
0.44
0.00
0.00
0.00
0.00
0.00
0.00
0.00
0.00
0.00
0.00
0.00
0.00
0.00
0.00
Tuesday, October 21, 2008 5:23:25 PM
AveragedPit1
Measured by:student
Sample bulk lot ref:
Aalikuppam
Sample Name:
Analysed:
Measured:
Sample Source & type:Tuesday, October 21, 2008 5:23:27 PM
S9 - AverageSOP Name:
Result Source:
Sensitivity:
Dispersant Name:Water Off
Size range:
Default
Particle RI:
1.330Result Emulation:
Absorption:0.020 to0.1
NormalAnalysis model:
2000.000
Dispersant RI:
1.520
General purposeParticle Name:
um
Tel := +[44] (0) 1684-892456 Fax +[44] (0) 1684-892789Malvern, UKMalvern Instruments Ltd.
Serial Number : MAL1022570Mastersizer 2000 Ver. 5.54
30 May 2011 8:35:40 AMRecord Number: 30File name: Aalikuppam Pit1

Result Analysis Report
Vol. Weighted Mean D[4,3]:
%
m²/g
um
Surface Weighted Mean D[3,2]:0.0137 536.581
d(0.9):
Accessory Name:
Span :1.272
umSpecific Surface Area:
16.83
Operator notes:
Uniformity:%Vol
Obscuration:
487.670 885.904d(0.1): um
0.39
438.694
um265.655 d(0.5):
Volume
Particle Size Distribution
0.01 0.1 1 10 100 1000 3000
Particle Size (µm)
0
2
4
6
8
10
12
Vol
ume
(%)
S10 - Average, Tuesday, October 21, 2008 5:31:27 PM
Hydro 2000G (A)
Result units:
um
Concentration:1.1477
Weighted Residual:1.240 %
Size (µm)0.010
0.011
0.013
0.015
0.017
0.020
0.023
0.026
0.030
0.035
0.040
0.046
0.052
0.060
0.069
0.079
0.091
0.105
Volume In %
0.00
0.00
0.00
0.00
0.00
0.00
0.00
0.00
0.00
0.00
0.00
0.00
0.00
0.00
0.00
0.00
0.00
Size (µm)0.105
0.120
0.138
0.158
0.182
0.209
0.240
0.275
0.316
0.363
0.417
0.479
0.550
0.631
0.724
0.832
0.955
1.096
Volume In %
0.00
0.00
0.00
0.00
0.00
0.00
0.00
0.00
0.00
0.00
0.00
0.00
0.00
0.00
0.00
0.00
0.00
Size (µm)1.096
1.259
1.445
1.660
1.905
2.188
2.512
2.884
3.311
3.802
4.365
5.012
5.754
6.607
7.586
8.710
10.000
11.482
Volume In %
0.00
0.00
0.00
0.00
0.00
0.00
0.00
0.00
0.00
0.00
0.00
0.00
0.00
0.00
0.00
0.00
0.00
Size (µm)11.482
13.183
15.136
17.378
19.953
22.909
26.303
30.200
34.674
39.811
45.709
52.481
60.256
69.183
79.433
91.201
104.713
120.226
Volume In %
0.00
0.00
0.00
0.00
0.00
0.00
0.00
0.00
0.00
0.00
0.00
0.00
0.00
0.00
0.00
0.00
0.00
Size (µm)120.226
138.038
158.489
181.970
208.930
239.883
275.423
316.228
363.078
416.869
478.630
549.541
630.957
724.436
831.764
954.993
1096.478
1258.925
Volume In %
0.00
0.07
0.91
1.95
3.43
5.19
7.04
8.79
10.16
10.96
11.08
10.50
9.31
7.70
5.90
4.14
2.36
Size (µm)1258.925
1445.440
1659.587
1905.461
2187.762
2511.886
2884.032
3311.311
3801.894
4365.158
5011.872
5754.399
6606.934
7585.776
8709.636
10000.000
Volume In %
0.51
0.00
0.00
0.00
0.00
0.00
0.00
0.00
0.00
0.00
0.00
0.00
0.00
0.00
0.00
Tuesday, October 21, 2008 5:31:27 PM
AveragedPit1
Measured by:student
Sample bulk lot ref:
Aalikuppam
Sample Name:
Analysed:
Measured:
Sample Source & type:Tuesday, October 21, 2008 5:31:29 PM
S10 - AverageSOP Name:
Result Source:
Sensitivity:
Dispersant Name:Water Off
Size range:
Default
Particle RI:
1.330Result Emulation:
Absorption:0.020 to0.1
NormalAnalysis model:
2000.000
Dispersant RI:
1.520
General purposeParticle Name:
um
Tel := +[44] (0) 1684-892456 Fax +[44] (0) 1684-892789Malvern, UKMalvern Instruments Ltd.
Serial Number : MAL1022570Mastersizer 2000 Ver. 5.54
30 May 2011 8:36:00 AMRecord Number: 36File name: Aalikuppam Pit1

Result Analysis Report
Vol. Weighted Mean D[4,3]:
%
m²/g
um
Surface Weighted Mean D[3,2]:0.0138 513.126
d(0.9):
Accessory Name:
Span :1.127
umSpecific Surface Area:
18.66
Operator notes:
Uniformity:%Vol
Obscuration:
474.654 810.323d(0.1): um
0.344
435.099
um275.237 d(0.5):
Volume
Particle Size Distribution
0.01 0.1 1 10 100 1000 3000
Particle Size (µm)
0
2
4
6
8
10
12
14
Vol
ume
(%)
S11 - Average, Tuesday, October 21, 2008 5:43:13 PM
Hydro 2000G (A)
Result units:
um
Concentration:1.2759
Weighted Residual:1.209 %
Size (µm)0.010
0.011
0.013
0.015
0.017
0.020
0.023
0.026
0.030
0.035
0.040
0.046
0.052
0.060
0.069
0.079
0.091
0.105
Volume In %
0.00
0.00
0.00
0.00
0.00
0.00
0.00
0.00
0.00
0.00
0.00
0.00
0.00
0.00
0.00
0.00
0.00
Size (µm)0.105
0.120
0.138
0.158
0.182
0.209
0.240
0.275
0.316
0.363
0.417
0.479
0.550
0.631
0.724
0.832
0.955
1.096
Volume In %
0.00
0.00
0.00
0.00
0.00
0.00
0.00
0.00
0.00
0.00
0.00
0.00
0.00
0.00
0.00
0.00
0.00
Size (µm)1.096
1.259
1.445
1.660
1.905
2.188
2.512
2.884
3.311
3.802
4.365
5.012
5.754
6.607
7.586
8.710
10.000
11.482
Volume In %
0.00
0.00
0.00
0.00
0.00
0.00
0.00
0.00
0.00
0.00
0.00
0.00
0.00
0.00
0.00
0.00
0.00
Size (µm)11.482
13.183
15.136
17.378
19.953
22.909
26.303
30.200
34.674
39.811
45.709
52.481
60.256
69.183
79.433
91.201
104.713
120.226
Volume In %
0.00
0.00
0.00
0.00
0.00
0.00
0.00
0.00
0.00
0.00
0.00
0.00
0.00
0.00
0.00
0.00
0.00
Size (µm)120.226
138.038
158.489
181.970
208.930
239.883
275.423
316.228
363.078
416.869
478.630
549.541
630.957
724.436
831.764
954.993
1096.478
1258.925
Volume In %
0.00
0.03
0.50
1.47
2.99
5.03
7.34
9.60
11.40
12.39
12.36
11.33
9.50
7.23
4.92
2.86
1.02
Size (µm)1258.925
1445.440
1659.587
1905.461
2187.762
2511.886
2884.032
3311.311
3801.894
4365.158
5011.872
5754.399
6606.934
7585.776
8709.636
10000.000
Volume In %
0.01
0.00
0.00
0.00
0.00
0.00
0.00
0.00
0.00
0.00
0.00
0.00
0.00
0.00
0.00
Tuesday, October 21, 2008 5:43:13 PM
AveragedPit1
Measured by:student
Sample bulk lot ref:
Aalikuppam
Sample Name:
Analysed:
Measured:
Sample Source & type:Tuesday, October 21, 2008 5:43:14 PM
S11 - AverageSOP Name:
Result Source:
Sensitivity:
Dispersant Name:Water Off
Size range:
Default
Particle RI:
1.330Result Emulation:
Absorption:0.020 to0.1
NormalAnalysis model:
2000.000
Dispersant RI:
1.520
General purposeParticle Name:
um
Tel := +[44] (0) 1684-892456 Fax +[44] (0) 1684-892789Malvern, UKMalvern Instruments Ltd.
Serial Number : MAL1022570Mastersizer 2000 Ver. 5.54
30 May 2011 7:52:40 AMRecord Number: 42File name: Aalikuppam Pit1

Result Analysis Report
Vol. Weighted Mean D[4,3]:
%
m²/g
um
Surface Weighted Mean D[3,2]:0.0121 614.508
d(0.9):
Accessory Name:
Span :1.318
umSpecific Surface Area:
15.69
Operator notes:
Uniformity:%Vol
Obscuration:
555.240 1027.727d(0.1): um
0.402
495.284
um296.110 d(0.5):
Volume
Particle Size Distribution
0.01 0.1 1 10 100 1000 3000
Particle Size (µm)
0
2
4
6
8
10
12
Vol
ume
(%)
S12 - Average, Tuesday, October 21, 2008 5:53:45 PM
Hydro 2000G (A)
Result units:
um
Concentration:1.2008
Weighted Residual:1.517 %
Size (µm)0.010
0.011
0.013
0.015
0.017
0.020
0.023
0.026
0.030
0.035
0.040
0.046
0.052
0.060
0.069
0.079
0.091
0.105
Volume In %
0.00
0.00
0.00
0.00
0.00
0.00
0.00
0.00
0.00
0.00
0.00
0.00
0.00
0.00
0.00
0.00
0.00
Size (µm)0.105
0.120
0.138
0.158
0.182
0.209
0.240
0.275
0.316
0.363
0.417
0.479
0.550
0.631
0.724
0.832
0.955
1.096
Volume In %
0.00
0.00
0.00
0.00
0.00
0.00
0.00
0.00
0.00
0.00
0.00
0.00
0.00
0.00
0.00
0.00
0.00
Size (µm)1.096
1.259
1.445
1.660
1.905
2.188
2.512
2.884
3.311
3.802
4.365
5.012
5.754
6.607
7.586
8.710
10.000
11.482
Volume In %
0.00
0.00
0.00
0.00
0.00
0.00
0.00
0.00
0.00
0.00
0.00
0.00
0.00
0.00
0.00
0.00
0.00
Size (µm)11.482
13.183
15.136
17.378
19.953
22.909
26.303
30.200
34.674
39.811
45.709
52.481
60.256
69.183
79.433
91.201
104.713
120.226
Volume In %
0.00
0.00
0.00
0.00
0.00
0.00
0.00
0.00
0.00
0.00
0.00
0.00
0.00
0.00
0.00
0.00
0.00
Size (µm)120.226
138.038
158.489
181.970
208.930
239.883
275.423
316.228
363.078
416.869
478.630
549.541
630.957
724.436
831.764
954.993
1096.478
1258.925
Volume In %
0.00
0.02
0.37
1.12
2.22
3.68
5.35
7.10
8.70
9.96
10.67
10.74
10.17
9.04
7.53
5.85
4.17
Size (µm)1258.925
1445.440
1659.587
1905.461
2187.762
2511.886
2884.032
3311.311
3801.894
4365.158
5011.872
5754.399
6606.934
7585.776
8709.636
10000.000
Volume In %
2.52
0.75
0.02
0.00
0.00
0.00
0.00
0.00
0.00
0.00
0.00
0.00
0.00
0.00
0.00
Tuesday, October 21, 2008 5:53:45 PM
EditedPit1
Measured by:student
Sample bulk lot ref:
Aalikuppam
Sample Name:
Analysed:
Measured:
Sample Source & type:Tuesday, October 21, 2008 5:53:47 PM
S12 - AverageSOP Name:
Result Source:
Sensitivity:
Dispersant Name:Water Off
Size range:
Default
Particle RI:
1.330Result Emulation:
Absorption:0.020 to0.1
NormalAnalysis model:
2000.000
Dispersant RI:
1.520
General purposeParticle Name:
um
Tel := +[44] (0) 1684-892456 Fax +[44] (0) 1684-892789Malvern, UKMalvern Instruments Ltd.
Serial Number : MAL1022570Mastersizer 2000 Ver. 5.54
30 May 2011 7:53:01 AMRecord Number: 54File name: Aalikuppam Pit1

Result Analysis Report
Vol. Weighted Mean D[4,3]:
%
m²/g
um
Surface Weighted Mean D[3,2]:0.0114 654.415
d(0.9):
Accessory Name:
Span :1.330
umSpecific Surface Area:
15.28
Operator notes:
Uniformity:%Vol
Obscuration:
590.649 1098.642d(0.1): um
0.409
525.368
um313.081 d(0.5):
Volume
Particle Size Distribution
0.01 0.1 1 10 100 1000 3000
Particle Size (µm)
0
2
4
6
8
10
12
Vol
ume
(%)
S13 - Average, Tuesday, October 21, 2008 6:03:25 PM
Hydro 2000G (A)
Result units:
um
Concentration:1.2369
Weighted Residual:1.745 %
Size (µm)0.010
0.011
0.013
0.015
0.017
0.020
0.023
0.026
0.030
0.035
0.040
0.046
0.052
0.060
0.069
0.079
0.091
0.105
Volume In %
0.00
0.00
0.00
0.00
0.00
0.00
0.00
0.00
0.00
0.00
0.00
0.00
0.00
0.00
0.00
0.00
0.00
Size (µm)0.105
0.120
0.138
0.158
0.182
0.209
0.240
0.275
0.316
0.363
0.417
0.479
0.550
0.631
0.724
0.832
0.955
1.096
Volume In %
0.00
0.00
0.00
0.00
0.00
0.00
0.00
0.00
0.00
0.00
0.00
0.00
0.00
0.00
0.00
0.00
0.00
Size (µm)1.096
1.259
1.445
1.660
1.905
2.188
2.512
2.884
3.311
3.802
4.365
5.012
5.754
6.607
7.586
8.710
10.000
11.482
Volume In %
0.00
0.00
0.00
0.00
0.00
0.00
0.00
0.00
0.00
0.00
0.00
0.00
0.00
0.00
0.00
0.00
0.00
Size (µm)11.482
13.183
15.136
17.378
19.953
22.909
26.303
30.200
34.674
39.811
45.709
52.481
60.256
69.183
79.433
91.201
104.713
120.226
Volume In %
0.00
0.00
0.00
0.00
0.00
0.00
0.00
0.00
0.00
0.00
0.00
0.00
0.00
0.00
0.00
0.00
0.00
Size (µm)120.226
138.038
158.489
181.970
208.930
239.883
275.423
316.228
363.078
416.869
478.630
549.541
630.957
724.436
831.764
954.993
1096.478
1258.925
Volume In %
0.00
0.02
0.19
0.84
1.74
3.02
4.57
6.29
7.96
9.39
10.36
10.74
10.46
9.56
8.19
6.57
4.93
Size (µm)1258.925
1445.440
1659.587
1905.461
2187.762
2511.886
2884.032
3311.311
3801.894
4365.158
5011.872
5754.399
6606.934
7585.776
8709.636
10000.000
Volume In %
3.30
1.73
0.12
0.00
0.00
0.00
0.00
0.00
0.00
0.00
0.00
0.00
0.00
0.00
0.00
Tuesday, October 21, 2008 6:03:25 PM
AveragedPit1
Measured by:student
Sample bulk lot ref:
Aalikuppam
Sample Name:
Analysed:
Measured:
Sample Source & type:Tuesday, October 21, 2008 6:03:27 PM
S13 - AverageSOP Name:
Result Source:
Sensitivity:
Dispersant Name:Water Off
Size range:
Default
Particle RI:
1.330Result Emulation:
Absorption:0.020 to0.1
NormalAnalysis model:
2000.000
Dispersant RI:
1.520
General purposeParticle Name:
um
Tel := +[44] (0) 1684-892456 Fax +[44] (0) 1684-892789Malvern, UKMalvern Instruments Ltd.
Serial Number : MAL1022570Mastersizer 2000 Ver. 5.54
30 May 2011 7:53:18 AMRecord Number: 60File name: Aalikuppam Pit1

Result Analysis Report
Vol. Weighted Mean D[4,3]:
%
m²/g
um
Surface Weighted Mean D[3,2]:0.0145 500.740
d(0.9):
Accessory Name:
Span :1.236
umSpecific Surface Area:
17.03
Operator notes:
Uniformity:%Vol
Obscuration:
457.482 817.920d(0.1): um
0.38
413.040
um252.465 d(0.5):
Volume
Particle Size Distribution
0.01 0.1 1 10 100 1000 3000
Particle Size (µm)
0
2
4
6
8
10
12
Vol
ume
(%)
S14 - Average, Tuesday, October 21, 2008 6:12:52 PM
Hydro 2000G (A)
Result units:
um
Concentration:1.0946
Weighted Residual:1.243 %
Size (µm)0.010
0.011
0.013
0.015
0.017
0.020
0.023
0.026
0.030
0.035
0.040
0.046
0.052
0.060
0.069
0.079
0.091
0.105
Volume In %
0.00
0.00
0.00
0.00
0.00
0.00
0.00
0.00
0.00
0.00
0.00
0.00
0.00
0.00
0.00
0.00
0.00
Size (µm)0.105
0.120
0.138
0.158
0.182
0.209
0.240
0.275
0.316
0.363
0.417
0.479
0.550
0.631
0.724
0.832
0.955
1.096
Volume In %
0.00
0.00
0.00
0.00
0.00
0.00
0.00
0.00
0.00
0.00
0.00
0.00
0.00
0.00
0.00
0.00
0.00
Size (µm)1.096
1.259
1.445
1.660
1.905
2.188
2.512
2.884
3.311
3.802
4.365
5.012
5.754
6.607
7.586
8.710
10.000
11.482
Volume In %
0.00
0.00
0.00
0.00
0.00
0.00
0.00
0.00
0.00
0.00
0.00
0.00
0.00
0.00
0.00
0.00
0.00
Size (µm)11.482
13.183
15.136
17.378
19.953
22.909
26.303
30.200
34.674
39.811
45.709
52.481
60.256
69.183
79.433
91.201
104.713
120.226
Volume In %
0.00
0.00
0.00
0.00
0.00
0.00
0.00
0.00
0.00
0.00
0.00
0.00
0.00
0.00
0.00
0.00
0.00
Size (µm)120.226
138.038
158.489
181.970
208.930
239.883
275.423
316.228
363.078
416.869
478.630
549.541
630.957
724.436
831.764
954.993
1096.478
1258.925
Volume In %
0.03
0.24
1.20
2.44
4.10
6.00
7.92
9.62
10.82
11.37
11.15
10.23
8.73
6.89
4.96
3.09
1.20
Size (µm)1258.925
1445.440
1659.587
1905.461
2187.762
2511.886
2884.032
3311.311
3801.894
4365.158
5011.872
5754.399
6606.934
7585.776
8709.636
10000.000
Volume In %
0.02
0.00
0.00
0.00
0.00
0.00
0.00
0.00
0.00
0.00
0.00
0.00
0.00
0.00
0.00
Tuesday, October 21, 2008 6:12:52 PM
AveragedPit1
Measured by:student
Sample bulk lot ref:
Aalikuppam
Sample Name:
Analysed:
Measured:
Sample Source & type:Tuesday, October 21, 2008 6:12:53 PM
S14 - AverageSOP Name:
Result Source:
Sensitivity:
Dispersant Name:Water Off
Size range:
Default
Particle RI:
1.330Result Emulation:
Absorption:0.020 to0.1
NormalAnalysis model:
2000.000
Dispersant RI:
1.520
General purposeParticle Name:
um
Tel := +[44] (0) 1684-892456 Fax +[44] (0) 1684-892789Malvern, UKMalvern Instruments Ltd.
Serial Number : MAL1022570Mastersizer 2000 Ver. 5.54
30 May 2011 7:53:39 AMRecord Number: 66File name: Aalikuppam Pit1

Result Analysis Report
Vol. Weighted Mean D[4,3]:
%
m²/g
um
Surface Weighted Mean D[3,2]:0.0162 436.083
d(0.9):
Accessory Name:
Span :1.123
umSpecific Surface Area:
16.39
Operator notes:
Uniformity:%Vol
Obscuration:
404.170 687.683d(0.1): um
0.344
369.904
um233.803 d(0.5):
Volume
Particle Size Distribution
0.01 0.1 1 10 100 1000 3000
Particle Size (µm)
0
2
4
6
8
10
12
14
Vol
ume
(%)
S15 - Average, Tuesday, October 21, 2008 6:27:30 PM
Hydro 2000G (A)
Result units:
um
Concentration:0.9403
Weighted Residual:1.044 %
Size (µm)0.010
0.011
0.013
0.015
0.017
0.020
0.023
0.026
0.030
0.035
0.040
0.046
0.052
0.060
0.069
0.079
0.091
0.105
Volume In %
0.00
0.00
0.00
0.00
0.00
0.00
0.00
0.00
0.00
0.00
0.00
0.00
0.00
0.00
0.00
0.00
0.00
Size (µm)0.105
0.120
0.138
0.158
0.182
0.209
0.240
0.275
0.316
0.363
0.417
0.479
0.550
0.631
0.724
0.832
0.955
1.096
Volume In %
0.00
0.00
0.00
0.00
0.00
0.00
0.00
0.00
0.00
0.00
0.00
0.00
0.00
0.00
0.00
0.00
0.00
Size (µm)1.096
1.259
1.445
1.660
1.905
2.188
2.512
2.884
3.311
3.802
4.365
5.012
5.754
6.607
7.586
8.710
10.000
11.482
Volume In %
0.00
0.00
0.00
0.00
0.00
0.00
0.00
0.00
0.00
0.00
0.00
0.00
0.00
0.00
0.00
0.00
0.00
Size (µm)11.482
13.183
15.136
17.378
19.953
22.909
26.303
30.200
34.674
39.811
45.709
52.481
60.256
69.183
79.433
91.201
104.713
120.226
Volume In %
0.00
0.00
0.00
0.00
0.00
0.00
0.00
0.00
0.00
0.00
0.00
0.00
0.00
0.00
0.00
0.00
0.00
Size (µm)120.226
138.038
158.489
181.970
208.930
239.883
275.423
316.228
363.078
416.869
478.630
549.541
630.957
724.436
831.764
954.993
1096.478
1258.925
Volume In %
0.06
0.68
1.71
3.34
5.40
7.72
9.89
11.59
12.43
12.27
11.12
9.21
6.91
4.58
2.45
0.64
0.00
Size (µm)1258.925
1445.440
1659.587
1905.461
2187.762
2511.886
2884.032
3311.311
3801.894
4365.158
5011.872
5754.399
6606.934
7585.776
8709.636
10000.000
Volume In %
0.00
0.00
0.00
0.00
0.00
0.00
0.00
0.00
0.00
0.00
0.00
0.00
0.00
0.00
0.00
Tuesday, October 21, 2008 6:27:30 PM
AveragedPit1
Measured by:student
Sample bulk lot ref:
Aalikuppam
Sample Name:
Analysed:
Measured:
Sample Source & type:Tuesday, October 21, 2008 6:27:31 PM
S15 - AverageSOP Name:
Result Source:
Sensitivity:
Dispersant Name:Water Off
Size range:
Default
Particle RI:
1.330Result Emulation:
Absorption:0.020 to0.1
NormalAnalysis model:
2000.000
Dispersant RI:
1.520
General purposeParticle Name:
um
Tel := +[44] (0) 1684-892456 Fax +[44] (0) 1684-892789Malvern, UKMalvern Instruments Ltd.
Serial Number : MAL1022570Mastersizer 2000 Ver. 5.54
30 May 2011 7:53:56 AMRecord Number: 72File name: Aalikuppam Pit1

Result Analysis Report
Vol. Weighted Mean D[4,3]:
%
m²/g
um
Surface Weighted Mean D[3,2]:0.0169 422.398
d(0.9):
Accessory Name:
Span :1.179
umSpecific Surface Area:
17.20
Operator notes:
Uniformity:%Vol
Obscuration:
387.218 677.704d(0.1): um
0.365
353.986
um221.255 d(0.5):
Volume
Particle Size Distribution
0.01 0.1 1 10 100 1000 3000
Particle Size (µm)
0
2
4
6
8
10
12
14
Vol
ume
(%)
S16 - Average, Tuesday, October 21, 2008 6:37:56 PM
Hydro 2000G (A)
Result units:
um
Concentration:0.9484
Weighted Residual:0.963 %
Size (µm)0.010
0.011
0.013
0.015
0.017
0.020
0.023
0.026
0.030
0.035
0.040
0.046
0.052
0.060
0.069
0.079
0.091
0.105
Volume In %
0.00
0.00
0.00
0.00
0.00
0.00
0.00
0.00
0.00
0.00
0.00
0.00
0.00
0.00
0.00
0.00
0.00
Size (µm)0.105
0.120
0.138
0.158
0.182
0.209
0.240
0.275
0.316
0.363
0.417
0.479
0.550
0.631
0.724
0.832
0.955
1.096
Volume In %
0.00
0.00
0.00
0.00
0.00
0.00
0.00
0.00
0.00
0.00
0.00
0.00
0.00
0.00
0.00
0.00
0.00
Size (µm)1.096
1.259
1.445
1.660
1.905
2.188
2.512
2.884
3.311
3.802
4.365
5.012
5.754
6.607
7.586
8.710
10.000
11.482
Volume In %
0.00
0.00
0.00
0.00
0.00
0.00
0.00
0.00
0.00
0.00
0.00
0.00
0.00
0.00
0.00
0.00
0.00
Size (µm)11.482
13.183
15.136
17.378
19.953
22.909
26.303
30.200
34.674
39.811
45.709
52.481
60.256
69.183
79.433
91.201
104.713
120.226
Volume In %
0.00
0.00
0.00
0.00
0.00
0.00
0.00
0.00
0.00
0.00
0.00
0.00
0.00
0.00
0.00
0.00
0.02
Size (µm)120.226
138.038
158.489
181.970
208.930
239.883
275.423
316.228
363.078
416.869
478.630
549.541
630.957
724.436
831.764
954.993
1096.478
1258.925
Volume In %
0.19
1.04
2.30
4.12
6.25
8.47
10.36
11.63
12.04
11.53
10.22
8.34
6.23
4.17
2.35
0.74
0.00
Size (µm)1258.925
1445.440
1659.587
1905.461
2187.762
2511.886
2884.032
3311.311
3801.894
4365.158
5011.872
5754.399
6606.934
7585.776
8709.636
10000.000
Volume In %
0.00
0.00
0.00
0.00
0.00
0.00
0.00
0.00
0.00
0.00
0.00
0.00
0.00
0.00
0.00
Tuesday, October 21, 2008 6:37:56 PM
AveragedPit1
Measured by:student
Sample bulk lot ref:
Aalikuppam
Sample Name:
Analysed:
Measured:
Sample Source & type:Tuesday, October 21, 2008 6:37:58 PM
S16 - AverageSOP Name:
Result Source:
Sensitivity:
Dispersant Name:Water Off
Size range:
Default
Particle RI:
1.330Result Emulation:
Absorption:0.020 to0.1
NormalAnalysis model:
2000.000
Dispersant RI:
1.520
General purposeParticle Name:
um
Tel := +[44] (0) 1684-892456 Fax +[44] (0) 1684-892789Malvern, UKMalvern Instruments Ltd.
Serial Number : MAL1022570Mastersizer 2000 Ver. 5.54
30 May 2011 7:54:18 AMRecord Number: 78File name: Aalikuppam Pit1

Result Analysis Report
Vol. Weighted Mean D[4,3]:
%
m²/g
um
Surface Weighted Mean D[3,2]:0.0133 550.278
d(0.9):
Accessory Name:
Span :1.232
umSpecific Surface Area:
17.81
Operator notes:
Uniformity:%Vol
Obscuration:
505.252 897.357d(0.1): um
0.38
452.605
um274.928 d(0.5):
Volume
Particle Size Distribution
0.01 0.1 1 10 100 1000 3000
Particle Size (µm)
0
2
4
6
8
10
12
Vol
ume
(%)
S17 - Average, Tuesday, October 21, 2008 6:49:06 PM
Hydro 2000G (A)
Result units:
um
Concentration:1.2606
Weighted Residual:1.420 %
Size (µm)0.010
0.011
0.013
0.015
0.017
0.020
0.023
0.026
0.030
0.035
0.040
0.046
0.052
0.060
0.069
0.079
0.091
0.105
Volume In %
0.00
0.00
0.00
0.00
0.00
0.00
0.00
0.00
0.00
0.00
0.00
0.00
0.00
0.00
0.00
0.00
0.00
Size (µm)0.105
0.120
0.138
0.158
0.182
0.209
0.240
0.275
0.316
0.363
0.417
0.479
0.550
0.631
0.724
0.832
0.955
1.096
Volume In %
0.00
0.00
0.00
0.00
0.00
0.00
0.00
0.00
0.00
0.00
0.00
0.00
0.00
0.00
0.00
0.00
0.00
Size (µm)1.096
1.259
1.445
1.660
1.905
2.188
2.512
2.884
3.311
3.802
4.365
5.012
5.754
6.607
7.586
8.710
10.000
11.482
Volume In %
0.00
0.00
0.00
0.00
0.00
0.00
0.00
0.00
0.00
0.00
0.00
0.00
0.00
0.00
0.00
0.00
0.00
Size (µm)11.482
13.183
15.136
17.378
19.953
22.909
26.303
30.200
34.674
39.811
45.709
52.481
60.256
69.183
79.433
91.201
104.713
120.226
Volume In %
0.00
0.00
0.00
0.00
0.00
0.00
0.00
0.00
0.00
0.00
0.00
0.00
0.00
0.00
0.00
0.00
0.00
Size (µm)120.226
138.038
158.489
181.970
208.930
239.883
275.423
316.228
363.078
416.869
478.630
549.541
630.957
724.436
831.764
954.993
1096.478
1258.925
Volume In %
0.00
0.05
0.75
1.66
2.98
4.63
6.44
8.27
9.84
10.93
11.36
11.03
9.97
8.33
6.37
4.41
2.48
Size (µm)1258.925
1445.440
1659.587
1905.461
2187.762
2511.886
2884.032
3311.311
3801.894
4365.158
5011.872
5754.399
6606.934
7585.776
8709.636
10000.000
Volume In %
0.49
0.00
0.00
0.00
0.00
0.00
0.00
0.00
0.00
0.00
0.00
0.00
0.00
0.00
0.00
Tuesday, October 21, 2008 6:49:06 PM
AveragedPit1
Measured by:student
Sample bulk lot ref:
Aalikuppam
Sample Name:
Analysed:
Measured:
Sample Source & type:Tuesday, October 21, 2008 6:49:07 PM
S17 - AverageSOP Name:
Result Source:
Sensitivity:
Dispersant Name:Water Off
Size range:
Default
Particle RI:
1.330Result Emulation:
Absorption:0.020 to0.1
NormalAnalysis model:
2000.000
Dispersant RI:
1.520
General purposeParticle Name:
um
Tel := +[44] (0) 1684-892456 Fax +[44] (0) 1684-892789Malvern, UKMalvern Instruments Ltd.
Serial Number : MAL1022570Mastersizer 2000 Ver. 5.54
30 May 2011 7:54:33 AMRecord Number: 84File name: Aalikuppam Pit1

Result Analysis Report
Vol. Weighted Mean D[4,3]:
%
m²/g
um
Surface Weighted Mean D[3,2]:0.0118 591.695
d(0.9):
Accessory Name:
Span :1.090
umSpecific Surface Area:
17.33
Operator notes:
Uniformity:%Vol
Obscuration:
548.879 923.373
We did not sample from top down in this one: S18= 10-12cmS19= 7-9
d(0.1): um
0.334
506.877
um325.176 d(0.5):
Volume
Particle Size Distribution
0.01 0.1 1 10 100 1000 3000
Particle Size (µm)
0
2
4
6
8
10
12
14
Vol
ume
(%)
S18 - Average, Sunday, October 19, 2008 4:20:14 PM
Hydro 2000G (A)
Result units:
um
Concentration:1.3695
Weighted Residual:1.191 %
Size (µm)0.010
0.011
0.013
0.015
0.017
0.020
0.023
0.026
0.030
0.035
0.040
0.046
0.052
0.060
0.069
0.079
0.091
0.105
Volume In %
0.00
0.00
0.00
0.00
0.00
0.00
0.00
0.00
0.00
0.00
0.00
0.00
0.00
0.00
0.00
0.00
0.00
Size (µm)0.105
0.120
0.138
0.158
0.182
0.209
0.240
0.275
0.316
0.363
0.417
0.479
0.550
0.631
0.724
0.832
0.955
1.096
Volume In %
0.00
0.00
0.00
0.00
0.00
0.00
0.00
0.00
0.00
0.00
0.00
0.00
0.00
0.00
0.00
0.00
0.00
Size (µm)1.096
1.259
1.445
1.660
1.905
2.188
2.512
2.884
3.311
3.802
4.365
5.012
5.754
6.607
7.586
8.710
10.000
11.482
Volume In %
0.00
0.00
0.00
0.00
0.00
0.00
0.00
0.00
0.00
0.00
0.00
0.00
0.00
0.00
0.00
0.00
0.00
Size (µm)11.482
13.183
15.136
17.378
19.953
22.909
26.303
30.200
34.674
39.811
45.709
52.481
60.256
69.183
79.433
91.201
104.713
120.226
Volume In %
0.00
0.00
0.00
0.00
0.00
0.00
0.00
0.00
0.00
0.00
0.00
0.00
0.00
0.00
0.00
0.00
0.00
Size (µm)120.226
138.038
158.489
181.970
208.930
239.883
275.423
316.228
363.078
416.869
478.630
549.541
630.957
724.436
831.764
954.993
1096.478
1258.925
Volume In %
0.00
0.00
0.00
0.27
1.14
2.64
4.71
7.18
9.65
11.69
12.83
12.83
11.69
9.67
7.21
4.79
2.74
Size (µm)1258.925
1445.440
1659.587
1905.461
2187.762
2511.886
2884.032
3311.311
3801.894
4365.158
5011.872
5754.399
6606.934
7585.776
8709.636
10000.000
Volume In %
0.92
0.02
0.00
0.00
0.00
0.00
0.00
0.00
0.00
0.00
0.00
0.00
0.00
0.00
0.00
Sunday, October 19, 2008 4:20:14 PM
AveragedPit1
Measured by:student
Sample bulk lot ref:
Thiruvadandhai
Sample Name:
Analysed:
Measured:
Sample Source & type:Sunday, October 19, 2008 4:20:16 PM
S18 - AverageSOP Name:
Result Source:
Sensitivity:
Dispersant Name:Water Off
Size range:
Default
Particle RI:
1.330Result Emulation:
Absorption:0.020 to0.1
NormalAnalysis model:
2000.000
Dispersant RI:
1.520
General purposeParticle Name:
um
Tel := +[44] (0) 1684-892456 Fax +[44] (0) 1684-892789Malvern, UKMalvern Instruments Ltd.
Serial Number : MAL1022570Mastersizer 2000 Ver. 5.54
30 May 2011 8:21:11 AMRecord Number: 6File name: Thir Pit1

Result Analysis Report
Vol. Weighted Mean D[4,3]:
%
m²/g
um
Surface Weighted Mean D[3,2]:0.0142 514.211
d(0.9):
Accessory Name:
Span :1.231
umSpecific Surface Area:
16.15
Operator notes:
Uniformity:%Vol
Obscuration:
471.693 838.627
We did not sample from top down in this one: S18= 10-12cmS19= 7-9S20 13 16
d(0.1): um
0.376
423.181
um257.872 d(0.5):
Volume
Particle Size Distribution
0.01 0.1 1 10 100 1000 3000
Particle Size (µm)
0
2
4
6
8
10
12
Vol
ume
(%)
S19 - Average, Sunday, October 19, 2008 4:28:52 PM
Hydro 2000G (A)
Result units:
um
Concentration:1.0580
Weighted Residual:0.937 %
Size (µm)0.010
0.011
0.013
0.015
0.017
0.020
0.023
0.026
0.030
0.035
0.040
0.046
0.052
0.060
0.069
0.079
0.091
0.105
Volume In %
0.00
0.00
0.00
0.00
0.00
0.00
0.00
0.00
0.00
0.00
0.00
0.00
0.00
0.00
0.00
0.00
0.00
Size (µm)0.105
0.120
0.138
0.158
0.182
0.209
0.240
0.275
0.316
0.363
0.417
0.479
0.550
0.631
0.724
0.832
0.955
1.096
Volume In %
0.00
0.00
0.00
0.00
0.00
0.00
0.00
0.00
0.00
0.00
0.00
0.00
0.00
0.00
0.00
0.00
0.00
Size (µm)1.096
1.259
1.445
1.660
1.905
2.188
2.512
2.884
3.311
3.802
4.365
5.012
5.754
6.607
7.586
8.710
10.000
11.482
Volume In %
0.00
0.00
0.00
0.00
0.00
0.00
0.00
0.00
0.00
0.00
0.00
0.00
0.00
0.00
0.00
0.00
0.00
Size (µm)11.482
13.183
15.136
17.378
19.953
22.909
26.303
30.200
34.674
39.811
45.709
52.481
60.256
69.183
79.433
91.201
104.713
120.226
Volume In %
0.00
0.00
0.00
0.00
0.00
0.00
0.00
0.00
0.00
0.00
0.00
0.00
0.00
0.00
0.00
0.00
0.00
Size (µm)120.226
138.038
158.489
181.970
208.930
239.883
275.423
316.228
363.078
416.869
478.630
549.541
630.957
724.436
831.764
954.993
1096.478
1258.925
Volume In %
0.02
0.36
1.08
2.21
3.69
5.49
7.38
9.15
10.53
11.30
11.32
10.57
9.18
7.35
5.36
3.46
1.53
Size (µm)1258.925
1445.440
1659.587
1905.461
2187.762
2511.886
2884.032
3311.311
3801.894
4365.158
5011.872
5754.399
6606.934
7585.776
8709.636
10000.000
Volume In %
0.02
0.00
0.00
0.00
0.00
0.00
0.00
0.00
0.00
0.00
0.00
0.00
0.00
0.00
0.00
Sunday, October 19, 2008 4:28:52 PM
EditedPit1
Measured by:student
Sample bulk lot ref:
Thiruvadandhai
Sample Name:
Analysed:
Measured:
Sample Source & type:Sunday, October 19, 2008 4:28:54 PM
S19 - AverageSOP Name:
Result Source:
Sensitivity:
Dispersant Name:Water Off
Size range:
Default
Particle RI:
1.330Result Emulation:
Absorption:0.020 to0.1
NormalAnalysis model:
2000.000
Dispersant RI:
1.520
General purposeParticle Name:
um
Tel := +[44] (0) 1684-892456 Fax +[44] (0) 1684-892789Malvern, UKMalvern Instruments Ltd.
Serial Number : MAL1022570Mastersizer 2000 Ver. 5.54
30 May 2011 8:21:24 AMRecord Number: 24File name: Thir Pit1
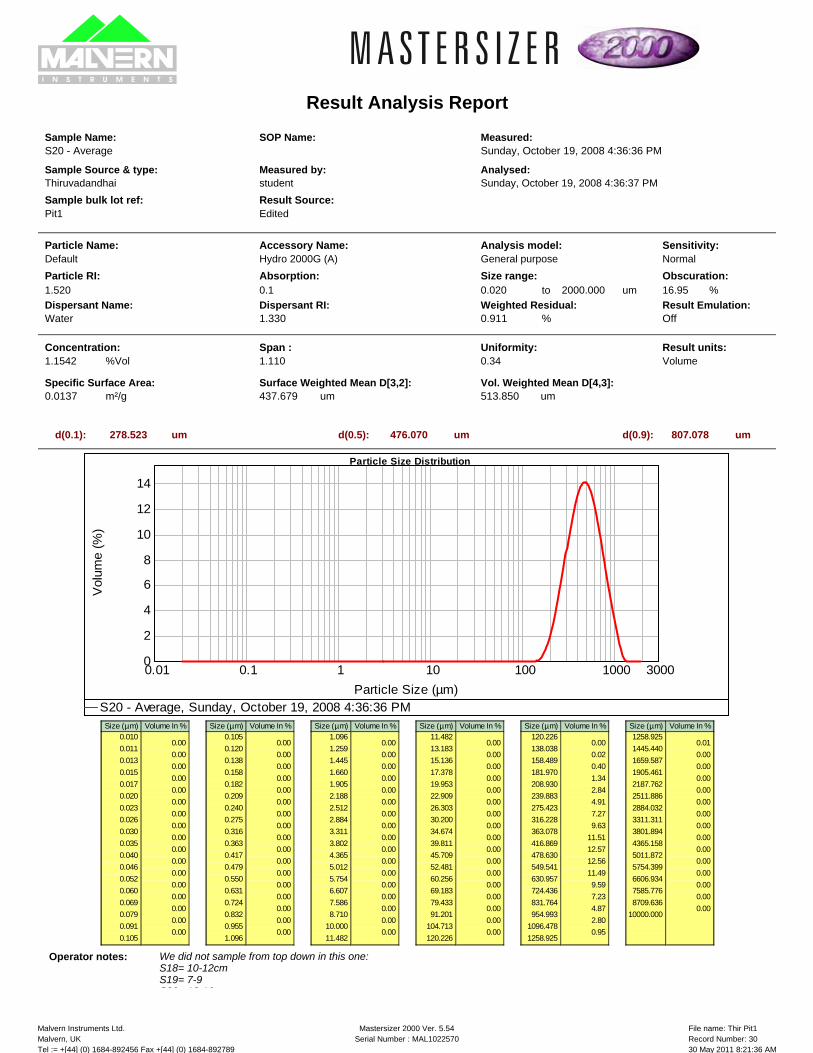
Result Analysis Report
Vol. Weighted Mean D[4,3]:
%
m²/g
um
Surface Weighted Mean D[3,2]:0.0137 513.850
d(0.9):
Accessory Name:
Span :1.110
umSpecific Surface Area:
16.95
Operator notes:
Uniformity:%Vol
Obscuration:
476.070 807.078
We did not sample from top down in this one: S18= 10-12cmS19= 7-9S20 13 16
d(0.1): um
0.34
437.679
um278.523 d(0.5):
Volume
Particle Size Distribution
0.01 0.1 1 10 100 1000 3000
Particle Size (µm)
0
2
4
6
8
10
12
14
Vol
ume
(%)
S20 - Average, Sunday, October 19, 2008 4:36:36 PM
Hydro 2000G (A)
Result units:
um
Concentration:1.1542
Weighted Residual:0.911 %
Size (µm)0.010
0.011
0.013
0.015
0.017
0.020
0.023
0.026
0.030
0.035
0.040
0.046
0.052
0.060
0.069
0.079
0.091
0.105
Volume In %
0.00
0.00
0.00
0.00
0.00
0.00
0.00
0.00
0.00
0.00
0.00
0.00
0.00
0.00
0.00
0.00
0.00
Size (µm)0.105
0.120
0.138
0.158
0.182
0.209
0.240
0.275
0.316
0.363
0.417
0.479
0.550
0.631
0.724
0.832
0.955
1.096
Volume In %
0.00
0.00
0.00
0.00
0.00
0.00
0.00
0.00
0.00
0.00
0.00
0.00
0.00
0.00
0.00
0.00
0.00
Size (µm)1.096
1.259
1.445
1.660
1.905
2.188
2.512
2.884
3.311
3.802
4.365
5.012
5.754
6.607
7.586
8.710
10.000
11.482
Volume In %
0.00
0.00
0.00
0.00
0.00
0.00
0.00
0.00
0.00
0.00
0.00
0.00
0.00
0.00
0.00
0.00
0.00
Size (µm)11.482
13.183
15.136
17.378
19.953
22.909
26.303
30.200
34.674
39.811
45.709
52.481
60.256
69.183
79.433
91.201
104.713
120.226
Volume In %
0.00
0.00
0.00
0.00
0.00
0.00
0.00
0.00
0.00
0.00
0.00
0.00
0.00
0.00
0.00
0.00
0.00
Size (µm)120.226
138.038
158.489
181.970
208.930
239.883
275.423
316.228
363.078
416.869
478.630
549.541
630.957
724.436
831.764
954.993
1096.478
1258.925
Volume In %
0.00
0.02
0.40
1.34
2.84
4.91
7.27
9.63
11.51
12.57
12.56
11.49
9.59
7.23
4.87
2.80
0.95
Size (µm)1258.925
1445.440
1659.587
1905.461
2187.762
2511.886
2884.032
3311.311
3801.894
4365.158
5011.872
5754.399
6606.934
7585.776
8709.636
10000.000
Volume In %
0.01
0.00
0.00
0.00
0.00
0.00
0.00
0.00
0.00
0.00
0.00
0.00
0.00
0.00
0.00
Sunday, October 19, 2008 4:36:36 PM
EditedPit1
Measured by:student
Sample bulk lot ref:
Thiruvadandhai
Sample Name:
Analysed:
Measured:
Sample Source & type:Sunday, October 19, 2008 4:36:37 PM
S20 - AverageSOP Name:
Result Source:
Sensitivity:
Dispersant Name:Water Off
Size range:
Default
Particle RI:
1.330Result Emulation:
Absorption:0.020 to0.1
NormalAnalysis model:
2000.000
Dispersant RI:
1.520
General purposeParticle Name:
um
Tel := +[44] (0) 1684-892456 Fax +[44] (0) 1684-892789Malvern, UKMalvern Instruments Ltd.
Serial Number : MAL1022570Mastersizer 2000 Ver. 5.54
30 May 2011 8:21:36 AMRecord Number: 30File name: Thir Pit1

Result Analysis Report
Vol. Weighted Mean D[4,3]:
%
m²/g
um
Surface Weighted Mean D[3,2]:0.0591 334.142
d(0.9):
Accessory Name:
Span :1.922
umSpecific Surface Area:
20.77
Operator notes:
Uniformity:%Vol
Obscuration:
301.324 638.111d(0.1): um
0.571
101.558
um58.831 d(0.5):
Volume
Particle Size Distribution
0.01 0.1 1 10 100 1000 3000
Particle Size (µm)
0
1
2
3
4
5
6
7
8
9
10
Vol
ume
(%)
S21 - Average, Sunday, October 19, 2008 4:50:46 PM
Hydro 2000G (A)
Result units:
um
Concentration:0.3221
Weighted Residual:0.587 %
Size (µm)0.010
0.011
0.013
0.015
0.017
0.020
0.023
0.026
0.030
0.035
0.040
0.046
0.052
0.060
0.069
0.079
0.091
0.105
Volume In %
0.00
0.00
0.00
0.00
0.00
0.00
0.00
0.00
0.00
0.00
0.00
0.00
0.00
0.00
0.00
0.00
0.00
Size (µm)0.105
0.120
0.138
0.158
0.182
0.209
0.240
0.275
0.316
0.363
0.417
0.479
0.550
0.631
0.724
0.832
0.955
1.096
Volume In %
0.00
0.00
0.00
0.00
0.00
0.00
0.00
0.00
0.00
0.00
0.00
0.00
0.00
0.00
0.00
0.00
0.00
Size (µm)1.096
1.259
1.445
1.660
1.905
2.188
2.512
2.884
3.311
3.802
4.365
5.012
5.754
6.607
7.586
8.710
10.000
11.482
Volume In %
0.00
0.00
0.00
0.00
0.00
0.06
0.08
0.09
0.10
0.12
0.14
0.16
0.19
0.22
0.24
0.27
0.29
Size (µm)11.482
13.183
15.136
17.378
19.953
22.909
26.303
30.200
34.674
39.811
45.709
52.481
60.256
69.183
79.433
91.201
104.713
120.226
Volume In %
0.32
0.35
0.38
0.42
0.48
0.57
0.67
0.79
0.91
1.03
1.13
1.19
1.22
1.25
1.30
1.43
1.72
Size (µm)120.226
138.038
158.489
181.970
208.930
239.883
275.423
316.228
363.078
416.869
478.630
549.541
630.957
724.436
831.764
954.993
1096.478
1258.925
Volume In %
2.22
2.97
3.93
5.07
6.23
7.29
8.05
8.41
8.29
7.71
6.76
5.56
4.28
3.04
1.87
0.87
0.32
Size (µm)1258.925
1445.440
1659.587
1905.461
2187.762
2511.886
2884.032
3311.311
3801.894
4365.158
5011.872
5754.399
6606.934
7585.776
8709.636
10000.000
Volume In %
0.02
0.00
0.00
0.00
0.00
0.00
0.00
0.00
0.00
0.00
0.00
0.00
0.00
0.00
0.00
Sunday, October 19, 2008 4:50:46 PM
AveragedPit2
Measured by:student
Sample bulk lot ref:
Thiruvadandhai
Sample Name:
Analysed:
Measured:
Sample Source & type:Sunday, October 19, 2008 4:50:48 PM
S21 - AverageSOP Name:
Result Source:
Sensitivity:
Dispersant Name:Water Off
Size range:
Default
Particle RI:
1.330Result Emulation:
Absorption:0.020 to0.1
NormalAnalysis model:
2000.000
Dispersant RI:
1.520
General purposeParticle Name:
um
Tel := +[44] (0) 1684-892456 Fax +[44] (0) 1684-892789Malvern, UKMalvern Instruments Ltd.
Serial Number : MAL1022570Mastersizer 2000 Ver. 5.54
30 May 2011 8:22:03 AMRecord Number: 6File name: Thir Pit2

Result Analysis Report
Vol. Weighted Mean D[4,3]:
%
m²/g
um
Surface Weighted Mean D[3,2]:0.0202 383.921
d(0.9):
Accessory Name:
Span :1.137
umSpecific Surface Area:
21.06
Operator notes:
Uniformity:%Vol
Obscuration:
357.512 610.595d(0.1): um
0.354
296.326
um203.978 d(0.5):
Volume
Particle Size Distribution
0.01 0.1 1 10 100 1000 3000
Particle Size (µm)
0
2
4
6
8
10
12
14
Vol
ume
(%)
S22 - Average, Sunday, October 19, 2008 4:59:54 PM
Hydro 2000G (A)
Result units:
um
Concentration:0.9925
Weighted Residual:0.896 %
Size (µm)0.010
0.011
0.013
0.015
0.017
0.020
0.023
0.026
0.030
0.035
0.040
0.046
0.052
0.060
0.069
0.079
0.091
0.105
Volume In %
0.00
0.00
0.00
0.00
0.00
0.00
0.00
0.00
0.00
0.00
0.00
0.00
0.00
0.00
0.00
0.00
0.00
Size (µm)0.105
0.120
0.138
0.158
0.182
0.209
0.240
0.275
0.316
0.363
0.417
0.479
0.550
0.631
0.724
0.832
0.955
1.096
Volume In %
0.00
0.00
0.00
0.00
0.00
0.00
0.00
0.00
0.00
0.00
0.00
0.00
0.00
0.00
0.00
0.00
0.00
Size (µm)1.096
1.259
1.445
1.660
1.905
2.188
2.512
2.884
3.311
3.802
4.365
5.012
5.754
6.607
7.586
8.710
10.000
11.482
Volume In %
0.00
0.00
0.00
0.00
0.00
0.00
0.00
0.00
0.00
0.00
0.00
0.00
0.00
0.00
0.00
0.00
0.00
Size (µm)11.482
13.183
15.136
17.378
19.953
22.909
26.303
30.200
34.674
39.811
45.709
52.481
60.256
69.183
79.433
91.201
104.713
120.226
Volume In %
0.00
0.00
0.00
0.00
0.00
0.08
0.15
0.22
0.28
0.31
0.29
0.21
0.07
0.00
0.00
0.00
0.03
Size (µm)120.226
138.038
158.489
181.970
208.930
239.883
275.423
316.228
363.078
416.869
478.630
549.541
630.957
724.436
831.764
954.993
1096.478
1258.925
Volume In %
0.40
1.32
2.79
4.84
7.17
9.51
11.35
12.37
12.33
11.25
9.39
7.10
4.81
2.81
0.91
0.00
0.00
Size (µm)1258.925
1445.440
1659.587
1905.461
2187.762
2511.886
2884.032
3311.311
3801.894
4365.158
5011.872
5754.399
6606.934
7585.776
8709.636
10000.000
Volume In %
0.00
0.00
0.00
0.00
0.00
0.00
0.00
0.00
0.00
0.00
0.00
0.00
0.00
0.00
0.00
Sunday, October 19, 2008 4:59:54 PM
AveragedPit2
Measured by:student
Sample bulk lot ref:
Thiruvadandhai
Sample Name:
Analysed:
Measured:
Sample Source & type:Sunday, October 19, 2008 4:59:55 PM
S22 - AverageSOP Name:
Result Source:
Sensitivity:
Dispersant Name:Water Off
Size range:
Default
Particle RI:
1.330Result Emulation:
Absorption:0.020 to0.1
NormalAnalysis model:
2000.000
Dispersant RI:
1.520
General purposeParticle Name:
um
Tel := +[44] (0) 1684-892456 Fax +[44] (0) 1684-892789Malvern, UKMalvern Instruments Ltd.
Serial Number : MAL1022570Mastersizer 2000 Ver. 5.54
30 May 2011 8:22:16 AMRecord Number: 12File name: Thir Pit2

Result Analysis Report
Vol. Weighted Mean D[4,3]:
%
m²/g
um
Surface Weighted Mean D[3,2]:0.0199 395.080
d(0.9):
Accessory Name:
Span :1.275
umSpecific Surface Area:
19.94
Operator notes:
Uniformity:%Vol
Obscuration:
360.955 654.384d(0.1): um
0.394
301.179
um194.299 d(0.5):
Volume
Particle Size Distribution
0.01 0.1 1 10 100 1000 3000
Particle Size (µm)
0
2
4
6
8
10
12
Vol
ume
(%)
S23 - Average, Sunday, October 19, 2008 5:08:11 PM
Hydro 2000G (A)
Result units:
um
Concentration:0.9492
Weighted Residual:0.890 %
Size (µm)0.010
0.011
0.013
0.015
0.017
0.020
0.023
0.026
0.030
0.035
0.040
0.046
0.052
0.060
0.069
0.079
0.091
0.105
Volume In %
0.00
0.00
0.00
0.00
0.00
0.00
0.00
0.00
0.00
0.00
0.00
0.00
0.00
0.00
0.00
0.00
0.00
Size (µm)0.105
0.120
0.138
0.158
0.182
0.209
0.240
0.275
0.316
0.363
0.417
0.479
0.550
0.631
0.724
0.832
0.955
1.096
Volume In %
0.00
0.00
0.00
0.00
0.00
0.00
0.00
0.00
0.00
0.00
0.00
0.00
0.00
0.00
0.00
0.00
0.00
Size (µm)1.096
1.259
1.445
1.660
1.905
2.188
2.512
2.884
3.311
3.802
4.365
5.012
5.754
6.607
7.586
8.710
10.000
11.482
Volume In %
0.00
0.00
0.00
0.00
0.00
0.00
0.00
0.00
0.00
0.00
0.00
0.00
0.00
0.00
0.00
0.00
0.00
Size (µm)11.482
13.183
15.136
17.378
19.953
22.909
26.303
30.200
34.674
39.811
45.709
52.481
60.256
69.183
79.433
91.201
104.713
120.226
Volume In %
0.00
0.00
0.00
0.00
0.00
0.03
0.10
0.17
0.23
0.26
0.25
0.19
0.02
0.00
0.00
0.00
0.16
Size (µm)120.226
138.038
158.489
181.970
208.930
239.883
275.423
316.228
363.078
416.869
478.630
549.541
630.957
724.436
831.764
954.993
1096.478
1258.925
Volume In %
0.89
1.97
3.46
5.27
7.16
8.95
10.31
11.06
11.08
10.37
9.07
7.37
5.54
3.79
1.99
0.32
0.00
Size (µm)1258.925
1445.440
1659.587
1905.461
2187.762
2511.886
2884.032
3311.311
3801.894
4365.158
5011.872
5754.399
6606.934
7585.776
8709.636
10000.000
Volume In %
0.00
0.00
0.00
0.00
0.00
0.00
0.00
0.00
0.00
0.00
0.00
0.00
0.00
0.00
0.00
Sunday, October 19, 2008 5:08:11 PM
AveragedPit2
Measured by:student
Sample bulk lot ref:
Thiruvadandhai
Sample Name:
Analysed:
Measured:
Sample Source & type:Sunday, October 19, 2008 5:08:13 PM
S23 - AverageSOP Name:
Result Source:
Sensitivity:
Dispersant Name:Water Off
Size range:
Default
Particle RI:
1.330Result Emulation:
Absorption:0.020 to0.1
NormalAnalysis model:
2000.000
Dispersant RI:
1.520
General purposeParticle Name:
um
Tel := +[44] (0) 1684-892456 Fax +[44] (0) 1684-892789Malvern, UKMalvern Instruments Ltd.
Serial Number : MAL1022570Mastersizer 2000 Ver. 5.54
30 May 2011 8:22:27 AMRecord Number: 18File name: Thir Pit2

Result Analysis Report
Vol. Weighted Mean D[4,3]:
%
m²/g
um
Surface Weighted Mean D[3,2]:0.0172 480.661
d(0.9):
Accessory Name:
Span :1.335
umSpecific Surface Area:
18.72
Operator notes:
Uniformity:%Vol
Obscuration:
437.316 810.229d(0.1): um
0.415
348.856
um226.384 d(0.5):
Volume
Particle Size Distribution
0.01 0.1 1 10 100 1000 3000
Particle Size (µm)
0
2
4
6
8
10
12
Vol
ume
(%)
S24 - Average, Sunday, October 19, 2008 5:19:04 PM
Hydro 2000G (A)
Result units:
um
Concentration:1.0240
Weighted Residual:1.129 %
Size (µm)0.010
0.011
0.013
0.015
0.017
0.020
0.023
0.026
0.030
0.035
0.040
0.046
0.052
0.060
0.069
0.079
0.091
0.105
Volume In %
0.00
0.00
0.00
0.00
0.00
0.00
0.00
0.00
0.00
0.00
0.00
0.00
0.00
0.00
0.00
0.00
0.00
Size (µm)0.105
0.120
0.138
0.158
0.182
0.209
0.240
0.275
0.316
0.363
0.417
0.479
0.550
0.631
0.724
0.832
0.955
1.096
Volume In %
0.00
0.00
0.00
0.00
0.00
0.00
0.00
0.00
0.00
0.00
0.00
0.00
0.00
0.00
0.00
0.00
0.00
Size (µm)1.096
1.259
1.445
1.660
1.905
2.188
2.512
2.884
3.311
3.802
4.365
5.012
5.754
6.607
7.586
8.710
10.000
11.482
Volume In %
0.00
0.00
0.00
0.00
0.00
0.00
0.00
0.00
0.00
0.00
0.00
0.00
0.00
0.00
0.00
0.00
0.00
Size (µm)11.482
13.183
15.136
17.378
19.953
22.909
26.303
30.200
34.674
39.811
45.709
52.481
60.256
69.183
79.433
91.201
104.713
120.226
Volume In %
0.00
0.00
0.00
0.00
0.00
0.03
0.09
0.14
0.19
0.25
0.29
0.29
0.25
0.16
0.03
0.00
0.03
Size (µm)120.226
138.038
158.489
181.970
208.930
239.883
275.423
316.228
363.078
416.869
478.630
549.541
630.957
724.436
831.764
954.993
1096.478
1258.925
Volume In %
0.26
0.81
1.72
3.01
4.58
6.33
8.02
9.44
10.38
10.70
10.36
9.40
7.99
6.32
4.59
2.98
1.35
Size (µm)1258.925
1445.440
1659.587
1905.461
2187.762
2511.886
2884.032
3311.311
3801.894
4365.158
5011.872
5754.399
6606.934
7585.776
8709.636
10000.000
Volume In %
0.02
0.00
0.00
0.00
0.00
0.00
0.00
0.00
0.00
0.00
0.00
0.00
0.00
0.00
0.00
Sunday, October 19, 2008 5:19:04 PM
AveragedPit2
Measured by:student
Sample bulk lot ref:
Thiruvadandhai
Sample Name:
Analysed:
Measured:
Sample Source & type:Sunday, October 19, 2008 5:19:06 PM
S24 - AverageSOP Name:
Result Source:
Sensitivity:
Dispersant Name:Water Off
Size range:
Default
Particle RI:
1.330Result Emulation:
Absorption:0.020 to0.1
NormalAnalysis model:
2000.000
Dispersant RI:
1.520
General purposeParticle Name:
um
Tel := +[44] (0) 1684-892456 Fax +[44] (0) 1684-892789Malvern, UKMalvern Instruments Ltd.
Serial Number : MAL1022570Mastersizer 2000 Ver. 5.54
30 May 2011 8:22:43 AMRecord Number: 24File name: Thir Pit2

Result Analysis Report
Vol. Weighted Mean D[4,3]:
%
m²/g
um
Surface Weighted Mean D[3,2]:0.0173 557.500
d(0.9):
Accessory Name:
Span :1.427
umSpecific Surface Area:
20.59
Operator notes:
Uniformity:%Vol
Obscuration:
507.273 965.029d(0.1): um
0.444
347.246
um241.253 d(0.5):
Volume
Particle Size Distribution
0.01 0.1 1 10 100 1000 3000
Particle Size (µm)
0
2
4
6
8
10
12
Vol
ume
(%)
S25 - Average, Sunday, October 19, 2008 5:32:12 PM
Hydro 2000G (A)
Result units:
um
Concentration:1.1317
Weighted Residual:1.165 %
Size (µm)0.010
0.011
0.013
0.015
0.017
0.020
0.023
0.026
0.030
0.035
0.040
0.046
0.052
0.060
0.069
0.079
0.091
0.105
Volume In %
0.00
0.00
0.00
0.00
0.00
0.00
0.00
0.00
0.00
0.00
0.00
0.00
0.00
0.00
0.00
0.00
0.00
Size (µm)0.105
0.120
0.138
0.158
0.182
0.209
0.240
0.275
0.316
0.363
0.417
0.479
0.550
0.631
0.724
0.832
0.955
1.096
Volume In %
0.00
0.00
0.00
0.00
0.00
0.00
0.00
0.00
0.00
0.00
0.00
0.00
0.00
0.00
0.00
0.00
0.00
Size (µm)1.096
1.259
1.445
1.660
1.905
2.188
2.512
2.884
3.311
3.802
4.365
5.012
5.754
6.607
7.586
8.710
10.000
11.482
Volume In %
0.00
0.00
0.00
0.00
0.00
0.00
0.00
0.00
0.00
0.00
0.00
0.00
0.00
0.00
0.00
0.00
0.01
Size (µm)11.482
13.183
15.136
17.378
19.953
22.909
26.303
30.200
34.674
39.811
45.709
52.481
60.256
69.183
79.433
91.201
104.713
120.226
Volume In %
0.04
0.06
0.07
0.07
0.07
0.08
0.10
0.14
0.19
0.25
0.31
0.37
0.39
0.38
0.34
0.28
0.24
Size (µm)120.226
138.038
158.489
181.970
208.930
239.883
275.423
316.228
363.078
416.869
478.630
549.541
630.957
724.436
831.764
954.993
1096.478
1258.925
Volume In %
0.30
0.52
0.99
1.78
2.88
4.27
5.82
7.38
8.73
9.70
10.13
9.95
9.21
8.00
6.52
4.95
3.39
Size (µm)1258.925
1445.440
1659.587
1905.461
2187.762
2511.886
2884.032
3311.311
3801.894
4365.158
5011.872
5754.399
6606.934
7585.776
8709.636
10000.000
Volume In %
1.89
0.21
0.00
0.00
0.00
0.00
0.00
0.00
0.00
0.00
0.00
0.00
0.00
0.00
0.00
Sunday, October 19, 2008 5:32:12 PM
AveragedPit2
Measured by:student
Sample bulk lot ref:
Thiruvadandhai
Sample Name:
Analysed:
Measured:
Sample Source & type:Sunday, October 19, 2008 5:32:13 PM
S25 - AverageSOP Name:
Result Source:
Sensitivity:
Dispersant Name:Water Off
Size range:
Default
Particle RI:
1.330Result Emulation:
Absorption:0.020 to0.1
NormalAnalysis model:
2000.000
Dispersant RI:
1.520
General purposeParticle Name:
um
Tel := +[44] (0) 1684-892456 Fax +[44] (0) 1684-892789Malvern, UKMalvern Instruments Ltd.
Serial Number : MAL1022570Mastersizer 2000 Ver. 5.54
30 May 2011 8:22:56 AMRecord Number: 30File name: Thir Pit2

Result Analysis Report
Vol. Weighted Mean D[4,3]:
%
m²/g
um
Surface Weighted Mean D[3,2]:0.0174 473.988
d(0.9):
Accessory Name:
Span :1.317
umSpecific Surface Area:
21.79
Operator notes:
Uniformity:%Vol
Obscuration:
431.556 795.337d(0.1): um
0.41
345.189
um226.877 d(0.5):
Volume
Particle Size Distribution
0.01 0.1 1 10 100 1000 3000
Particle Size (µm)
0
2
4
6
8
10
12
Vol
ume
(%)
S26 - Average, Tuesday, October 21, 2008 10:03:29 AM
Hydro 2000G (A)
Result units:
um
Concentration:1.2015
Weighted Residual:0.961 %
Size (µm)0.010
0.011
0.013
0.015
0.017
0.020
0.023
0.026
0.030
0.035
0.040
0.046
0.052
0.060
0.069
0.079
0.091
0.105
Volume In %
0.00
0.00
0.00
0.00
0.00
0.00
0.00
0.00
0.00
0.00
0.00
0.00
0.00
0.00
0.00
0.00
0.00
Size (µm)0.105
0.120
0.138
0.158
0.182
0.209
0.240
0.275
0.316
0.363
0.417
0.479
0.550
0.631
0.724
0.832
0.955
1.096
Volume In %
0.00
0.00
0.00
0.00
0.00
0.00
0.00
0.00
0.00
0.00
0.00
0.00
0.00
0.00
0.00
0.00
0.00
Size (µm)1.096
1.259
1.445
1.660
1.905
2.188
2.512
2.884
3.311
3.802
4.365
5.012
5.754
6.607
7.586
8.710
10.000
11.482
Volume In %
0.00
0.00
0.00
0.00
0.00
0.00
0.00
0.00
0.00
0.00
0.00
0.00
0.00
0.00
0.00
0.00
0.00
Size (µm)11.482
13.183
15.136
17.378
19.953
22.909
26.303
30.200
34.674
39.811
45.709
52.481
60.256
69.183
79.433
91.201
104.713
120.226
Volume In %
0.00
0.00
0.00
0.00
0.00
0.03
0.09
0.15
0.21
0.27
0.31
0.32
0.26
0.16
0.02
0.00
0.00
Size (µm)120.226
138.038
158.489
181.970
208.930
239.883
275.423
316.228
363.078
416.869
478.630
549.541
630.957
724.436
831.764
954.993
1096.478
1258.925
Volume In %
0.12
0.75
1.68
3.04
4.70
6.53
8.28
9.72
10.63
10.86
10.40
9.33
7.82
6.10
4.39
2.74
1.07
Size (µm)1258.925
1445.440
1659.587
1905.461
2187.762
2511.886
2884.032
3311.311
3801.894
4365.158
5011.872
5754.399
6606.934
7585.776
8709.636
10000.000
Volume In %
0.02
0.00
0.00
0.00
0.00
0.00
0.00
0.00
0.00
0.00
0.00
0.00
0.00
0.00
0.00
Tuesday, October 21, 2008 10:03:29 AM
AveragedPit2
Measured by:student
Sample bulk lot ref:
Thiruvadandhai
Sample Name:
Analysed:
Measured:
Sample Source & type:Tuesday, October 21, 2008 10:03:30 AM
S26 - AverageSOP Name:
Result Source:
Sensitivity:
Dispersant Name:Water Off
Size range:
Default
Particle RI:
1.330Result Emulation:
Absorption:0.020 to0.1
NormalAnalysis model:
2000.000
Dispersant RI:
1.520
General purposeParticle Name:
um
Tel := +[44] (0) 1684-892456 Fax +[44] (0) 1684-892789Malvern, UKMalvern Instruments Ltd.
Serial Number : MAL1022570Mastersizer 2000 Ver. 5.54
30 May 2011 8:23:10 AMRecord Number: 36File name: Thir Pit2

Result Analysis Report
Vol. Weighted Mean D[4,3]:
%
m²/g
um
Surface Weighted Mean D[3,2]:0.0166 462.968
d(0.9):
Accessory Name:
Span :1.131
umSpecific Surface Area:
22.72
Operator notes:
Uniformity:%Vol
Obscuration:
431.418 734.527d(0.1): um
0.354
362.425
um246.733 d(0.5):
Volume
Particle Size Distribution
0.01 0.1 1 10 100 1000 3000
Particle Size (µm)
0
2
4
6
8
10
12
14
Vol
ume
(%)
S27 - Average, Tuesday, October 21, 2008 10:12:12 AM
Hydro 2000G (A)
Result units:
um
Concentration:1.3233
Weighted Residual:0.969 %
Size (µm)0.010
0.011
0.013
0.015
0.017
0.020
0.023
0.026
0.030
0.035
0.040
0.046
0.052
0.060
0.069
0.079
0.091
0.105
Volume In %
0.00
0.00
0.00
0.00
0.00
0.00
0.00
0.00
0.00
0.00
0.00
0.00
0.00
0.00
0.00
0.00
0.00
Size (µm)0.105
0.120
0.138
0.158
0.182
0.209
0.240
0.275
0.316
0.363
0.417
0.479
0.550
0.631
0.724
0.832
0.955
1.096
Volume In %
0.00
0.00
0.00
0.00
0.00
0.00
0.00
0.00
0.00
0.00
0.00
0.00
0.00
0.00
0.00
0.00
0.00
Size (µm)1.096
1.259
1.445
1.660
1.905
2.188
2.512
2.884
3.311
3.802
4.365
5.012
5.754
6.607
7.586
8.710
10.000
11.482
Volume In %
0.00
0.00
0.00
0.00
0.00
0.00
0.00
0.00
0.00
0.00
0.00
0.00
0.00
0.00
0.00
0.00
0.00
Size (µm)11.482
13.183
15.136
17.378
19.953
22.909
26.303
30.200
34.674
39.811
45.709
52.481
60.256
69.183
79.433
91.201
104.713
120.226
Volume In %
0.00
0.00
0.00
0.00
0.00
0.00
0.03
0.13
0.19
0.24
0.27
0.24
0.18
0.02
0.00
0.00
0.00
Size (µm)120.226
138.038
158.489
181.970
208.930
239.883
275.423
316.228
363.078
416.869
478.630
549.541
630.957
724.436
831.764
954.993
1096.478
1258.925
Volume In %
0.00
0.23
0.97
2.28
4.12
6.39
8.73
10.78
12.11
12.47
11.78
10.18
8.01
5.65
3.50
1.48
0.04
Size (µm)1258.925
1445.440
1659.587
1905.461
2187.762
2511.886
2884.032
3311.311
3801.894
4365.158
5011.872
5754.399
6606.934
7585.776
8709.636
10000.000
Volume In %
0.00
0.00
0.00
0.00
0.00
0.00
0.00
0.00
0.00
0.00
0.00
0.00
0.00
0.00
0.00
Tuesday, October 21, 2008 10:12:12 AM
AveragedPit2
Measured by:student
Sample bulk lot ref:
Thiruvadandhai
Sample Name:
Analysed:
Measured:
Sample Source & type:Tuesday, October 21, 2008 10:12:13 AM
S27 - AverageSOP Name:
Result Source:
Sensitivity:
Dispersant Name:Water Off
Size range:
Default
Particle RI:
1.330Result Emulation:
Absorption:0.020 to0.1
NormalAnalysis model:
2000.000
Dispersant RI:
1.520
General purposeParticle Name:
um
Tel := +[44] (0) 1684-892456 Fax +[44] (0) 1684-892789Malvern, UKMalvern Instruments Ltd.
Serial Number : MAL1022570Mastersizer 2000 Ver. 5.54
30 May 2011 8:23:23 AMRecord Number: 42File name: Thir Pit2

Result Analysis Report
Vol. Weighted Mean D[4,3]:
%
m²/g
um
Surface Weighted Mean D[3,2]:0.0179 386.968
d(0.9):
Accessory Name:
Span :1.054
umSpecific Surface Area:
21.15
Operator notes:
Uniformity:%Vol
Obscuration:
361.352 597.176d(0.1): um
0.325
334.412
um216.236 d(0.5):
Volume
Particle Size Distribution
0.01 0.1 1 10 100 1000 3000
Particle Size (µm)
0
2
4
6
8
10
12
14
16
Vol
ume
(%)
S28 - Average, Tuesday, October 21, 2008 10:21:12 AM
Hydro 2000G (A)
Result units:
um
Concentration:1.1280
Weighted Residual:0.895 %
Size (µm)0.010
0.011
0.013
0.015
0.017
0.020
0.023
0.026
0.030
0.035
0.040
0.046
0.052
0.060
0.069
0.079
0.091
0.105
Volume In %
0.00
0.00
0.00
0.00
0.00
0.00
0.00
0.00
0.00
0.00
0.00
0.00
0.00
0.00
0.00
0.00
0.00
Size (µm)0.105
0.120
0.138
0.158
0.182
0.209
0.240
0.275
0.316
0.363
0.417
0.479
0.550
0.631
0.724
0.832
0.955
1.096
Volume In %
0.00
0.00
0.00
0.00
0.00
0.00
0.00
0.00
0.00
0.00
0.00
0.00
0.00
0.00
0.00
0.00
0.00
Size (µm)1.096
1.259
1.445
1.660
1.905
2.188
2.512
2.884
3.311
3.802
4.365
5.012
5.754
6.607
7.586
8.710
10.000
11.482
Volume In %
0.00
0.00
0.00
0.00
0.00
0.00
0.00
0.00
0.00
0.00
0.00
0.00
0.00
0.00
0.00
0.00
0.00
Size (µm)11.482
13.183
15.136
17.378
19.953
22.909
26.303
30.200
34.674
39.811
45.709
52.481
60.256
69.183
79.433
91.201
104.713
120.226
Volume In %
0.00
0.00
0.00
0.00
0.00
0.00
0.00
0.00
0.00
0.00
0.00
0.00
0.00
0.00
0.00
0.00
0.00
Size (µm)120.226
138.038
158.489
181.970
208.930
239.883
275.423
316.228
363.078
416.869
478.630
549.541
630.957
724.436
831.764
954.993
1096.478
1258.925
Volume In %
0.15
1.08
2.54
4.69
7.21
9.80
11.90
13.10
13.11
11.92
9.83
7.24
4.68
2.32
0.44
0.00
0.00
Size (µm)1258.925
1445.440
1659.587
1905.461
2187.762
2511.886
2884.032
3311.311
3801.894
4365.158
5011.872
5754.399
6606.934
7585.776
8709.636
10000.000
Volume In %
0.00
0.00
0.00
0.00
0.00
0.00
0.00
0.00
0.00
0.00
0.00
0.00
0.00
0.00
0.00
Tuesday, October 21, 2008 10:21:12 AM
AveragedPit2
Measured by:student
Sample bulk lot ref:
Thiruvadandhai
Sample Name:
Analysed:
Measured:
Sample Source & type:Tuesday, October 21, 2008 10:21:14 AM
S28 - AverageSOP Name:
Result Source:
Sensitivity:
Dispersant Name:Water Off
Size range:
Default
Particle RI:
1.330Result Emulation:
Absorption:0.020 to0.1
NormalAnalysis model:
2000.000
Dispersant RI:
1.520
General purposeParticle Name:
um
Tel := +[44] (0) 1684-892456 Fax +[44] (0) 1684-892789Malvern, UKMalvern Instruments Ltd.
Serial Number : MAL1022570Mastersizer 2000 Ver. 5.54
30 May 2011 8:23:34 AMRecord Number: 48File name: Thir Pit2

Result Analysis Report
Vol. Weighted Mean D[4,3]:
%
m²/g
um
Surface Weighted Mean D[3,2]:0.0174 399.513
d(0.9):
Accessory Name:
Span :1.057
umSpecific Surface Area:
22.63
Operator notes:
Uniformity:%Vol
Obscuration:
372.899 617.211d(0.1): um
0.328
345.021
um222.986 d(0.5):
Volume
Particle Size Distribution
0.01 0.1 1 10 100 1000 3000
Particle Size (µm)
0
2
4
6
8
10
12
14
16
Vol
ume
(%)
S29 - Average, Tuesday, October 21, 2008 10:33:11 AM
Hydro 2000G (A)
Result units:
um
Concentration:1.2566
Weighted Residual:0.921 %
Size (µm)0.010
0.011
0.013
0.015
0.017
0.020
0.023
0.026
0.030
0.035
0.040
0.046
0.052
0.060
0.069
0.079
0.091
0.105
Volume In %
0.00
0.00
0.00
0.00
0.00
0.00
0.00
0.00
0.00
0.00
0.00
0.00
0.00
0.00
0.00
0.00
0.00
Size (µm)0.105
0.120
0.138
0.158
0.182
0.209
0.240
0.275
0.316
0.363
0.417
0.479
0.550
0.631
0.724
0.832
0.955
1.096
Volume In %
0.00
0.00
0.00
0.00
0.00
0.00
0.00
0.00
0.00
0.00
0.00
0.00
0.00
0.00
0.00
0.00
0.00
Size (µm)1.096
1.259
1.445
1.660
1.905
2.188
2.512
2.884
3.311
3.802
4.365
5.012
5.754
6.607
7.586
8.710
10.000
11.482
Volume In %
0.00
0.00
0.00
0.00
0.00
0.00
0.00
0.00
0.00
0.00
0.00
0.00
0.00
0.00
0.00
0.00
0.00
Size (µm)11.482
13.183
15.136
17.378
19.953
22.909
26.303
30.200
34.674
39.811
45.709
52.481
60.256
69.183
79.433
91.201
104.713
120.226
Volume In %
0.00
0.00
0.00
0.00
0.00
0.00
0.00
0.00
0.00
0.00
0.00
0.00
0.00
0.00
0.00
0.00
0.00
Size (µm)120.226
138.038
158.489
181.970
208.930
239.883
275.423
316.228
363.078
416.869
478.630
549.541
630.957
724.436
831.764
954.993
1096.478
1258.925
Volume In %
0.07
0.84
2.14
4.16
6.61
9.23
11.47
12.91
13.20
12.27
10.35
7.82
5.23
2.89
0.81
0.00
0.00
Size (µm)1258.925
1445.440
1659.587
1905.461
2187.762
2511.886
2884.032
3311.311
3801.894
4365.158
5011.872
5754.399
6606.934
7585.776
8709.636
10000.000
Volume In %
0.00
0.00
0.00
0.00
0.00
0.00
0.00
0.00
0.00
0.00
0.00
0.00
0.00
0.00
0.00
Tuesday, October 21, 2008 10:33:11 AM
AveragedPit2
Measured by:student
Sample bulk lot ref:
Thiruvadandhai
Sample Name:
Analysed:
Measured:
Sample Source & type:Tuesday, October 21, 2008 10:33:13 AM
S29 - AverageSOP Name:
Result Source:
Sensitivity:
Dispersant Name:Water Off
Size range:
Default
Particle RI:
1.330Result Emulation:
Absorption:0.020 to0.1
NormalAnalysis model:
2000.000
Dispersant RI:
1.520
General purposeParticle Name:
um
Tel := +[44] (0) 1684-892456 Fax +[44] (0) 1684-892789Malvern, UKMalvern Instruments Ltd.
Serial Number : MAL1022570Mastersizer 2000 Ver. 5.54
30 May 2011 8:23:46 AMRecord Number: 54File name: Thir Pit2

Result Analysis Report
Vol. Weighted Mean D[4,3]:
%
m²/g
um
Surface Weighted Mean D[3,2]:0.014 516.505
d(0.9):
Accessory Name:
Span :1.202
umSpecific Surface Area:
17.57
Operator notes:
Uniformity:%Vol
Obscuration:
476.250 834.751d(0.1): um
0.367
427.928
um262.365 d(0.5):
Volume
Particle Size Distribution
0.01 0.1 1 10 100 1000 3000
Particle Size (µm)
0
2
4
6
8
10
12
14
Vol
ume
(%)
S30 - Average, Wednesday, October 08, 2008 5:07:38 PM
Hydro 2000G (A)
Result units:
um
Concentration:1.1746
Weighted Residual:2.261 %
Size (µm)0.010
0.011
0.013
0.015
0.017
0.020
0.023
0.026
0.030
0.035
0.040
0.046
0.052
0.060
0.069
0.079
0.091
0.105
Volume In %
0.00
0.00
0.00
0.00
0.00
0.00
0.00
0.00
0.00
0.00
0.00
0.00
0.00
0.00
0.00
0.00
0.00
Size (µm)0.105
0.120
0.138
0.158
0.182
0.209
0.240
0.275
0.316
0.363
0.417
0.479
0.550
0.631
0.724
0.832
0.955
1.096
Volume In %
0.00
0.00
0.00
0.00
0.00
0.00
0.00
0.00
0.00
0.00
0.00
0.00
0.00
0.00
0.00
0.00
0.00
Size (µm)1.096
1.259
1.445
1.660
1.905
2.188
2.512
2.884
3.311
3.802
4.365
5.012
5.754
6.607
7.586
8.710
10.000
11.482
Volume In %
0.00
0.00
0.00
0.00
0.00
0.00
0.00
0.00
0.00
0.00
0.00
0.00
0.00
0.00
0.00
0.00
0.00
Size (µm)11.482
13.183
15.136
17.378
19.953
22.909
26.303
30.200
34.674
39.811
45.709
52.481
60.256
69.183
79.433
91.201
104.713
120.226
Volume In %
0.00
0.00
0.00
0.00
0.00
0.00
0.00
0.00
0.00
0.00
0.00
0.00
0.00
0.00
0.00
0.00
0.00
Size (µm)120.226
138.038
158.489
181.970
208.930
239.883
275.423
316.228
363.078
416.869
478.630
549.541
630.957
724.436
831.764
954.993
1096.478
1258.925
Volume In %
0.04
0.24
0.98
2.03
3.49
5.30
7.23
9.09
10.57
11.45
11.56
10.85
9.45
7.56
5.45
3.39
1.31
Size (µm)1258.925
1445.440
1659.587
1905.461
2187.762
2511.886
2884.032
3311.311
3801.894
4365.158
5011.872
5754.399
6606.934
7585.776
8709.636
10000.000
Volume In %
0.02
0.00
0.00
0.00
0.00
0.00
0.00
0.00
0.00
0.00
0.00
0.00
0.00
0.00
0.00
Wednesday, October 08, 2008 5:07:38 PM
AveragedPit 3 150m
Measured by:student
Sample bulk lot ref:
Thiruvadandhai
Sample Name:
Analysed:
Measured:
Sample Source & type:Wednesday, October 08, 2008 5:07:39 PM
S30 - AverageSOP Name:
Result Source:
Sensitivity:
Dispersant Name:Water Off
Size range:
Default
Particle RI:
1.330Result Emulation:
Absorption:0.020 to0.1
NormalAnalysis model:
2000.000
Dispersant RI:
1.520
General purposeParticle Name:
um
Tel := +[44] (0) 1684-892456 Fax +[44] (0) 1684-892789Malvern, UKMalvern Instruments Ltd.
Serial Number : MAL1022570Mastersizer 2000 Ver. 5.54
30 May 2011 8:24:17 AMRecord Number: 6File name: Thir Pit3

Result Analysis Report
Vol. Weighted Mean D[4,3]:
%
m²/g
um
Surface Weighted Mean D[3,2]:0.0132 547.197
d(0.9):
Accessory Name:
Span :1.186
umSpecific Surface Area:
15.86
Operator notes:
Uniformity:%Vol
Obscuration:
506.291 880.569d(0.1): um
0.366
455.373
um280.157 d(0.5):
Volume
Particle Size Distribution
0.01 0.1 1 10 100 1000 3000
Particle Size (µm)
0
2
4
6
8
10
12
14
Vol
ume
(%)
S31 - Average, Wednesday, October 08, 2008 5:20:34 PM
Hydro 2000G (A)
Result units:
um
Concentration:1.1168
Weighted Residual:2.524 %
Size (µm)0.010
0.011
0.013
0.015
0.017
0.020
0.023
0.026
0.030
0.035
0.040
0.046
0.052
0.060
0.069
0.079
0.091
0.105
Volume In %
0.00
0.00
0.00
0.00
0.00
0.00
0.00
0.00
0.00
0.00
0.00
0.00
0.00
0.00
0.00
0.00
0.00
Size (µm)0.105
0.120
0.138
0.158
0.182
0.209
0.240
0.275
0.316
0.363
0.417
0.479
0.550
0.631
0.724
0.832
0.955
1.096
Volume In %
0.00
0.00
0.00
0.00
0.00
0.00
0.00
0.00
0.00
0.00
0.00
0.00
0.00
0.00
0.00
0.00
0.00
Size (µm)1.096
1.259
1.445
1.660
1.905
2.188
2.512
2.884
3.311
3.802
4.365
5.012
5.754
6.607
7.586
8.710
10.000
11.482
Volume In %
0.00
0.00
0.00
0.00
0.00
0.00
0.00
0.00
0.00
0.00
0.00
0.00
0.00
0.00
0.00
0.00
0.00
Size (µm)11.482
13.183
15.136
17.378
19.953
22.909
26.303
30.200
34.674
39.811
45.709
52.481
60.256
69.183
79.433
91.201
104.713
120.226
Volume In %
0.00
0.00
0.00
0.00
0.00
0.00
0.00
0.00
0.00
0.00
0.00
0.00
0.00
0.00
0.00
0.00
0.00
Size (µm)120.226
138.038
158.489
181.970
208.930
239.883
275.423
316.228
363.078
416.869
478.630
549.541
630.957
724.436
831.764
954.993
1096.478
1258.925
Volume In %
0.00
0.04
0.63
1.47
2.75
4.43
6.34
8.30
10.02
11.25
11.74
11.39
10.25
8.49
6.37
4.28
2.16
Size (µm)1258.925
1445.440
1659.587
1905.461
2187.762
2511.886
2884.032
3311.311
3801.894
4365.158
5011.872
5754.399
6606.934
7585.776
8709.636
10000.000
Volume In %
0.08
0.00
0.00
0.00
0.00
0.00
0.00
0.00
0.00
0.00
0.00
0.00
0.00
0.00
0.00
Wednesday, October 08, 2008 5:20:34 PM
AveragedPit 3 150m
Measured by:student
Sample bulk lot ref:
Thiruvadandhai
Sample Name:
Analysed:
Measured:
Sample Source & type:Wednesday, October 08, 2008 5:20:36 PM
S31 - AverageSOP Name:
Result Source:
Sensitivity:
Dispersant Name:Water Off
Size range:
Default
Particle RI:
1.330Result Emulation:
Absorption:0.020 to0.1
NormalAnalysis model:
2000.000
Dispersant RI:
1.520
General purposeParticle Name:
um
Tel := +[44] (0) 1684-892456 Fax +[44] (0) 1684-892789Malvern, UKMalvern Instruments Ltd.
Serial Number : MAL1022570Mastersizer 2000 Ver. 5.54
30 May 2011 8:24:30 AMRecord Number: 12File name: Thir Pit3

Result Analysis Report
Vol. Weighted Mean D[4,3]:
%
m²/g
um
Surface Weighted Mean D[3,2]:0.012 588.803
d(0.9):
Accessory Name:
Span :1.132
umSpecific Surface Area:
16.02
Operator notes:
Uniformity:%Vol
Obscuration:
543.572 930.869d(0.1): um
0.348
498.813
um315.677 d(0.5):
Volume
Particle Size Distribution
0.01 0.1 1 10 100 1000 3000
Particle Size (µm)
0
2
4
6
8
10
12
14
Vol
ume
(%)
S32 - Average, Tuesday, October 14, 2008 1:35:46 PM
Hydro 2000G (A)
Result units:
um
Concentration:1.2366
Weighted Residual:1.800 %
Size (µm)0.010
0.011
0.013
0.015
0.017
0.020
0.023
0.026
0.030
0.035
0.040
0.046
0.052
0.060
0.069
0.079
0.091
0.105
Volume In %
0.00
0.00
0.00
0.00
0.00
0.00
0.00
0.00
0.00
0.00
0.00
0.00
0.00
0.00
0.00
0.00
0.00
Size (µm)0.105
0.120
0.138
0.158
0.182
0.209
0.240
0.275
0.316
0.363
0.417
0.479
0.550
0.631
0.724
0.832
0.955
1.096
Volume In %
0.00
0.00
0.00
0.00
0.00
0.00
0.00
0.00
0.00
0.00
0.00
0.00
0.00
0.00
0.00
0.00
0.00
Size (µm)1.096
1.259
1.445
1.660
1.905
2.188
2.512
2.884
3.311
3.802
4.365
5.012
5.754
6.607
7.586
8.710
10.000
11.482
Volume In %
0.00
0.00
0.00
0.00
0.00
0.00
0.00
0.00
0.00
0.00
0.00
0.00
0.00
0.00
0.00
0.00
0.00
Size (µm)11.482
13.183
15.136
17.378
19.953
22.909
26.303
30.200
34.674
39.811
45.709
52.481
60.256
69.183
79.433
91.201
104.713
120.226
Volume In %
0.00
0.00
0.00
0.00
0.00
0.00
0.00
0.00
0.00
0.00
0.00
0.00
0.00
0.00
0.00
0.00
0.00
Size (µm)120.226
138.038
158.489
181.970
208.930
239.883
275.423
316.228
363.078
416.869
478.630
549.541
630.957
724.436
831.764
954.993
1096.478
1258.925
Volume In %
0.00
0.00
0.02
0.53
1.48
3.02
5.04
7.38
9.65
11.46
12.44
12.37
11.28
9.39
7.09
4.81
2.87
Size (µm)1258.925
1445.440
1659.587
1905.461
2187.762
2511.886
2884.032
3311.311
3801.894
4365.158
5011.872
5754.399
6606.934
7585.776
8709.636
10000.000
Volume In %
1.15
0.03
0.00
0.00
0.00
0.00
0.00
0.00
0.00
0.00
0.00
0.00
0.00
0.00
0.00
Tuesday, October 14, 2008 1:35:46 PM
AveragedPit 3 150m
Measured by:Unknown
Sample bulk lot ref:
Thiruvadandhai
Sample Name:
Analysed:
Measured:
Sample Source & type:Tuesday, October 14, 2008 1:35:48 PM
S32 - AverageSOP Name:
Result Source:
Sensitivity:
Dispersant Name:Water Off
Size range:
Default
Particle RI:
1.330Result Emulation:
Absorption:0.020 to0.1
NormalAnalysis model:
2000.000
Dispersant RI:
1.520
General purposeParticle Name:
um
Tel := +[44] (0) 1684-892456 Fax +[44] (0) 1684-892789Malvern, UKMalvern Instruments Ltd.
Serial Number : MAL1022570Mastersizer 2000 Ver. 5.54
30 May 2011 8:24:42 AMRecord Number: 18File name: Thir Pit3

Result Analysis Report
Vol. Weighted Mean D[4,3]:
%
m²/g
um
Surface Weighted Mean D[3,2]:0.0123 574.630
d(0.9):
Accessory Name:
Span :1.139
umSpecific Surface Area:
17.06
Operator notes:
Uniformity:%Vol
Obscuration:
530.213 910.732d(0.1): um
0.352
485.891
um306.713 d(0.5):
Volume
Particle Size Distribution
0.01 0.1 1 10 100 1000 3000
Particle Size (µm)
0
2
4
6
8
10
12
14
Vol
ume
(%)
S33 - Average, Tuesday, October 14, 2008 1:48:48 PM
Hydro 2000G (A)
Result units:
um
Concentration:1.2901
Weighted Residual:1.798 %
Size (µm)0.010
0.011
0.013
0.015
0.017
0.020
0.023
0.026
0.030
0.035
0.040
0.046
0.052
0.060
0.069
0.079
0.091
0.105
Volume In %
0.00
0.00
0.00
0.00
0.00
0.00
0.00
0.00
0.00
0.00
0.00
0.00
0.00
0.00
0.00
0.00
0.00
Size (µm)0.105
0.120
0.138
0.158
0.182
0.209
0.240
0.275
0.316
0.363
0.417
0.479
0.550
0.631
0.724
0.832
0.955
1.096
Volume In %
0.00
0.00
0.00
0.00
0.00
0.00
0.00
0.00
0.00
0.00
0.00
0.00
0.00
0.00
0.00
0.00
0.00
Size (µm)1.096
1.259
1.445
1.660
1.905
2.188
2.512
2.884
3.311
3.802
4.365
5.012
5.754
6.607
7.586
8.710
10.000
11.482
Volume In %
0.00
0.00
0.00
0.00
0.00
0.00
0.00
0.00
0.00
0.00
0.00
0.00
0.00
0.00
0.00
0.00
0.00
Size (µm)11.482
13.183
15.136
17.378
19.953
22.909
26.303
30.200
34.674
39.811
45.709
52.481
60.256
69.183
79.433
91.201
104.713
120.226
Volume In %
0.00
0.00
0.00
0.00
0.00
0.00
0.00
0.00
0.00
0.00
0.00
0.00
0.00
0.00
0.00
0.00
0.00
Size (µm)120.226
138.038
158.489
181.970
208.930
239.883
275.423
316.228
363.078
416.869
478.630
549.541
630.957
724.436
831.764
954.993
1096.478
1258.925
Volume In %
0.00
0.00
0.08
0.69
1.75
3.40
5.48
7.81
9.98
11.63
12.42
12.17
10.95
8.99
6.69
4.52
2.57
Size (µm)1258.925
1445.440
1659.587
1905.461
2187.762
2511.886
2884.032
3311.311
3801.894
4365.158
5011.872
5754.399
6606.934
7585.776
8709.636
10000.000
Volume In %
0.85
0.02
0.00
0.00
0.00
0.00
0.00
0.00
0.00
0.00
0.00
0.00
0.00
0.00
0.00
Tuesday, October 14, 2008 1:48:48 PM
AveragedPit 3 150m
Measured by:Unknown
Sample bulk lot ref:
Thiruvadandhai
Sample Name:
Analysed:
Measured:
Sample Source & type:Tuesday, October 14, 2008 1:48:49 PM
S33 - AverageSOP Name:
Result Source:
Sensitivity:
Dispersant Name:Water Off
Size range:
Default
Particle RI:
1.330Result Emulation:
Absorption:0.020 to0.1
NormalAnalysis model:
2000.000
Dispersant RI:
1.520
General purposeParticle Name:
um
Tel := +[44] (0) 1684-892456 Fax +[44] (0) 1684-892789Malvern, UKMalvern Instruments Ltd.
Serial Number : MAL1022570Mastersizer 2000 Ver. 5.54
30 May 2011 8:25:09 AMRecord Number: 24File name: Thir Pit3

Result Analysis Report
Vol. Weighted Mean D[4,3]:
%
m²/g
um
Surface Weighted Mean D[3,2]:0.0128 574.111
d(0.9):
Accessory Name:
Span :1.267
umSpecific Surface Area:
17.16
Operator notes:
Uniformity:%Vol
Obscuration:
523.375 945.556d(0.1): um
0.391
468.033
um282.677 d(0.5):
Volume
Particle Size Distribution
0.01 0.1 1 10 100 1000 3000
Particle Size (µm)
0
2
4
6
8
10
12
Vol
ume
(%)
S34 - Average, Tuesday, October 14, 2008 2:00:10 PM
Hydro 2000G (A)
Result units:
um
Concentration:1.2511
Weighted Residual:1.816 %
Size (µm)0.010
0.011
0.013
0.015
0.017
0.020
0.023
0.026
0.030
0.035
0.040
0.046
0.052
0.060
0.069
0.079
0.091
0.105
Volume In %
0.00
0.00
0.00
0.00
0.00
0.00
0.00
0.00
0.00
0.00
0.00
0.00
0.00
0.00
0.00
0.00
0.00
Size (µm)0.105
0.120
0.138
0.158
0.182
0.209
0.240
0.275
0.316
0.363
0.417
0.479
0.550
0.631
0.724
0.832
0.955
1.096
Volume In %
0.00
0.00
0.00
0.00
0.00
0.00
0.00
0.00
0.00
0.00
0.00
0.00
0.00
0.00
0.00
0.00
0.00
Size (µm)1.096
1.259
1.445
1.660
1.905
2.188
2.512
2.884
3.311
3.802
4.365
5.012
5.754
6.607
7.586
8.710
10.000
11.482
Volume In %
0.00
0.00
0.00
0.00
0.00
0.00
0.00
0.00
0.00
0.00
0.00
0.00
0.00
0.00
0.00
0.00
0.00
Size (µm)11.482
13.183
15.136
17.378
19.953
22.909
26.303
30.200
34.674
39.811
45.709
52.481
60.256
69.183
79.433
91.201
104.713
120.226
Volume In %
0.00
0.00
0.00
0.00
0.00
0.00
0.00
0.00
0.00
0.00
0.00
0.00
0.00
0.00
0.00
0.00
0.00
Size (µm)120.226
138.038
158.489
181.970
208.930
239.883
275.423
316.228
363.078
416.869
478.630
549.541
630.957
724.436
831.764
954.993
1096.478
1258.925
Volume In %
0.00
0.05
0.65
1.45
2.66
4.21
5.98
7.80
9.41
10.60
11.15
10.97
10.08
8.62
6.80
4.90
3.17
Size (µm)1258.925
1445.440
1659.587
1905.461
2187.762
2511.886
2884.032
3311.311
3801.894
4365.158
5011.872
5754.399
6606.934
7585.776
8709.636
10000.000
Volume In %
1.46
0.05
0.00
0.00
0.00
0.00
0.00
0.00
0.00
0.00
0.00
0.00
0.00
0.00
0.00
Tuesday, October 14, 2008 2:00:10 PM
AveragedPit 3 150m
Measured by:Unknown
Sample bulk lot ref:
Thiruvadandhai
Sample Name:
Analysed:
Measured:
Sample Source & type:Tuesday, October 14, 2008 2:00:11 PM
S34 - AverageSOP Name:
Result Source:
Sensitivity:
Dispersant Name:Water Off
Size range:
Default
Particle RI:
1.330Result Emulation:
Absorption:0.020 to0.1
NormalAnalysis model:
2000.000
Dispersant RI:
1.520
General purposeParticle Name:
um
Tel := +[44] (0) 1684-892456 Fax +[44] (0) 1684-892789Malvern, UKMalvern Instruments Ltd.
Serial Number : MAL1022570Mastersizer 2000 Ver. 5.54
30 May 2011 8:25:18 AMRecord Number: 30File name: Thir Pit3

Result Analysis Report
Vol. Weighted Mean D[4,3]:
%
m²/g
um
Surface Weighted Mean D[3,2]:0.0158 471.353
d(0.9):
Accessory Name:
Span :1.297
umSpecific Surface Area:
23.03
Operator notes:
Uniformity:%Vol
Obscuration:
428.692 783.268d(0.1): um
0.4
380.468
um227.200 d(0.5):
Volume
Particle Size Distribution
0.01 0.1 1 10 100 1000 3000
Particle Size (µm)
0
2
4
6
8
10
12
Vol
ume
(%)
S35 - Average, Tuesday, October 14, 2008 2:13:09 PM
Hydro 2000G (A)
Result units:
um
Concentration:1.4151
Weighted Residual:1.329 %
Size (µm)0.010
0.011
0.013
0.015
0.017
0.020
0.023
0.026
0.030
0.035
0.040
0.046
0.052
0.060
0.069
0.079
0.091
0.105
Volume In %
0.00
0.00
0.00
0.00
0.00
0.00
0.00
0.00
0.00
0.00
0.00
0.00
0.00
0.00
0.00
0.00
0.00
Size (µm)0.105
0.120
0.138
0.158
0.182
0.209
0.240
0.275
0.316
0.363
0.417
0.479
0.550
0.631
0.724
0.832
0.955
1.096
Volume In %
0.00
0.00
0.00
0.00
0.00
0.00
0.00
0.00
0.00
0.00
0.00
0.00
0.00
0.00
0.00
0.00
0.00
Size (µm)1.096
1.259
1.445
1.660
1.905
2.188
2.512
2.884
3.311
3.802
4.365
5.012
5.754
6.607
7.586
8.710
10.000
11.482
Volume In %
0.00
0.00
0.00
0.00
0.00
0.00
0.00
0.00
0.00
0.00
0.00
0.00
0.00
0.00
0.00
0.00
0.00
Size (µm)11.482
13.183
15.136
17.378
19.953
22.909
26.303
30.200
34.674
39.811
45.709
52.481
60.256
69.183
79.433
91.201
104.713
120.226
Volume In %
0.00
0.00
0.00
0.00
0.00
0.00
0.00
0.00
0.00
0.00
0.00
0.00
0.00
0.00
0.00
0.00
0.03
Size (µm)120.226
138.038
158.489
181.970
208.930
239.883
275.423
316.228
363.078
416.869
478.630
549.541
630.957
724.436
831.764
954.993
1096.478
1258.925
Volume In %
0.38
1.09
2.12
3.49
5.09
6.81
8.42
9.76
10.61
10.84
10.41
9.38
7.88
6.12
4.31
2.52
0.72
Size (µm)1258.925
1445.440
1659.587
1905.461
2187.762
2511.886
2884.032
3311.311
3801.894
4365.158
5011.872
5754.399
6606.934
7585.776
8709.636
10000.000
Volume In %
0.01
0.00
0.00
0.00
0.00
0.00
0.00
0.00
0.00
0.00
0.00
0.00
0.00
0.00
0.00
Tuesday, October 14, 2008 2:13:09 PM
AveragedPit 3 150m
Measured by:Unknown
Sample bulk lot ref:
Thiruvadandhai
Sample Name:
Analysed:
Measured:
Sample Source & type:Tuesday, October 14, 2008 2:13:11 PM
S35 - AverageSOP Name:
Result Source:
Sensitivity:
Dispersant Name:Water Off
Size range:
Default
Particle RI:
1.330Result Emulation:
Absorption:0.020 to0.1
NormalAnalysis model:
2000.000
Dispersant RI:
1.520
General purposeParticle Name:
um
Tel := +[44] (0) 1684-892456 Fax +[44] (0) 1684-892789Malvern, UKMalvern Instruments Ltd.
Serial Number : MAL1022570Mastersizer 2000 Ver. 5.54
30 May 2011 8:25:30 AMRecord Number: 36File name: Thir Pit3

Result Analysis Report
Vol. Weighted Mean D[4,3]:
%
m²/g
um
Surface Weighted Mean D[3,2]:0.0158 464.507
d(0.9):
Accessory Name:
Span :1.255
umSpecific Surface Area:
19.31
Operator notes:
Uniformity:%Vol
Obscuration:
424.861 762.957d(0.1): um
0.386
380.001
um229.910 d(0.5):
Volume
Particle Size Distribution
0.01 0.1 1 10 100 1000 3000
Particle Size (µm)
0
2
4
6
8
10
12
Vol
ume
(%)
S36 - Average, Tuesday, October 14, 2008 3:18:54 PM
Hydro 2000G (A)
Result units:
um
Concentration:1.1579
Weighted Residual:1.394 %
Size (µm)0.010
0.011
0.013
0.015
0.017
0.020
0.023
0.026
0.030
0.035
0.040
0.046
0.052
0.060
0.069
0.079
0.091
0.105
Volume In %
0.00
0.00
0.00
0.00
0.00
0.00
0.00
0.00
0.00
0.00
0.00
0.00
0.00
0.00
0.00
0.00
0.00
Size (µm)0.105
0.120
0.138
0.158
0.182
0.209
0.240
0.275
0.316
0.363
0.417
0.479
0.550
0.631
0.724
0.832
0.955
1.096
Volume In %
0.00
0.00
0.00
0.00
0.00
0.00
0.00
0.00
0.00
0.00
0.00
0.00
0.00
0.00
0.00
0.00
0.00
Size (µm)1.096
1.259
1.445
1.660
1.905
2.188
2.512
2.884
3.311
3.802
4.365
5.012
5.754
6.607
7.586
8.710
10.000
11.482
Volume In %
0.00
0.00
0.00
0.00
0.00
0.00
0.00
0.00
0.00
0.00
0.00
0.00
0.00
0.00
0.00
0.00
0.00
Size (µm)11.482
13.183
15.136
17.378
19.953
22.909
26.303
30.200
34.674
39.811
45.709
52.481
60.256
69.183
79.433
91.201
104.713
120.226
Volume In %
0.00
0.00
0.00
0.00
0.00
0.00
0.00
0.00
0.00
0.00
0.00
0.00
0.00
0.00
0.00
0.00
0.03
Size (µm)120.226
138.038
158.489
181.970
208.930
239.883
275.423
316.228
363.078
416.869
478.630
549.541
630.957
724.436
831.764
954.993
1096.478
1258.925
Volume In %
0.22
0.98
1.99
3.43
5.11
6.95
8.68
10.10
10.96
11.15
10.63
9.46
7.83
5.96
4.08
2.16
0.27
Size (µm)1258.925
1445.440
1659.587
1905.461
2187.762
2511.886
2884.032
3311.311
3801.894
4365.158
5011.872
5754.399
6606.934
7585.776
8709.636
10000.000
Volume In %
0.00
0.00
0.00
0.00
0.00
0.00
0.00
0.00
0.00
0.00
0.00
0.00
0.00
0.00
0.00
Tuesday, October 14, 2008 3:18:54 PM
AveragedPit 3 150m
Measured by:Unknown
Sample bulk lot ref:
Thiruvadandhai
Sample Name:
Analysed:
Measured:
Sample Source & type:Tuesday, October 14, 2008 3:18:55 PM
S36 - AverageSOP Name:
Result Source:
Sensitivity:
Dispersant Name:Water Off
Size range:
Default
Particle RI:
1.330Result Emulation:
Absorption:0.020 to0.1
NormalAnalysis model:
2000.000
Dispersant RI:
1.520
General purposeParticle Name:
um
Tel := +[44] (0) 1684-892456 Fax +[44] (0) 1684-892789Malvern, UKMalvern Instruments Ltd.
Serial Number : MAL1022570Mastersizer 2000 Ver. 5.54
30 May 2011 8:25:40 AMRecord Number: 42File name: Thir Pit3

Result Analysis Report
Vol. Weighted Mean D[4,3]:
%
m²/g
um
Surface Weighted Mean D[3,2]:0.0125 568.951
d(0.9):
Accessory Name:
Span :1.160
umSpecific Surface Area:
18.42
Operator notes:
Uniformity:%Vol
Obscuration:
522.592 907.944d(0.1): um
0.359
479.227
um301.664 d(0.5):
Volume
Particle Size Distribution
0.01 0.1 1 10 100 1000 3000
Particle Size (µm)
0
2
4
6
8
10
12
14
Vol
ume
(%)
S37 - Average, Sunday, October 19, 2008 4:02:40 PM
Hydro 2000G (A)
Result units:
um
Concentration:1.3857
Weighted Residual:0.959 %
Size (µm)0.010
0.011
0.013
0.015
0.017
0.020
0.023
0.026
0.030
0.035
0.040
0.046
0.052
0.060
0.069
0.079
0.091
0.105
Volume In %
0.00
0.00
0.00
0.00
0.00
0.00
0.00
0.00
0.00
0.00
0.00
0.00
0.00
0.00
0.00
0.00
0.00
Size (µm)0.105
0.120
0.138
0.158
0.182
0.209
0.240
0.275
0.316
0.363
0.417
0.479
0.550
0.631
0.724
0.832
0.955
1.096
Volume In %
0.00
0.00
0.00
0.00
0.00
0.00
0.00
0.00
0.00
0.00
0.00
0.00
0.00
0.00
0.00
0.00
0.00
Size (µm)1.096
1.259
1.445
1.660
1.905
2.188
2.512
2.884
3.311
3.802
4.365
5.012
5.754
6.607
7.586
8.710
10.000
11.482
Volume In %
0.00
0.00
0.00
0.00
0.00
0.00
0.00
0.00
0.00
0.00
0.00
0.00
0.00
0.00
0.00
0.00
0.00
Size (µm)11.482
13.183
15.136
17.378
19.953
22.909
26.303
30.200
34.674
39.811
45.709
52.481
60.256
69.183
79.433
91.201
104.713
120.226
Volume In %
0.00
0.00
0.00
0.00
0.00
0.00
0.00
0.00
0.00
0.00
0.00
0.00
0.00
0.00
0.00
0.00
0.00
Size (µm)120.226
138.038
158.489
181.970
208.930
239.883
275.423
316.228
363.078
416.869
478.630
549.541
630.957
724.436
831.764
954.993
1096.478
1258.925
Volume In %
0.00
0.00
0.11
0.79
1.92
3.64
5.77
8.08
10.18
11.69
12.30
11.91
10.60
8.66
6.46
4.42
2.55
Size (µm)1258.925
1445.440
1659.587
1905.461
2187.762
2511.886
2884.032
3311.311
3801.894
4365.158
5011.872
5754.399
6606.934
7585.776
8709.636
10000.000
Volume In %
0.90
0.02
0.00
0.00
0.00
0.00
0.00
0.00
0.00
0.00
0.00
0.00
0.00
0.00
0.00
Sunday, October 19, 2008 4:02:40 PM
AveragedPit 1
Measured by:student
Sample bulk lot ref:
Thiruvadandhai
Sample Name:
Analysed:
Measured:
Sample Source & type:Sunday, October 19, 2008 4:02:42 PM
S37 - AverageSOP Name:
Result Source:
Sensitivity:
Dispersant Name:Water Off
Size range:
Default
Particle RI:
1.330Result Emulation:
Absorption:0.020 to0.1
NormalAnalysis model:
2000.000
Dispersant RI:
1.520
General purposeParticle Name:
um
Tel := +[44] (0) 1684-892456 Fax +[44] (0) 1684-892789Malvern, UKMalvern Instruments Ltd.
Serial Number : MAL1022570Mastersizer 2000 Ver. 5.54
30 May 2011 8:28:59 AMRecord Number: 141File name: Thir Pit3

Result Analysis Report
Vol. Weighted Mean D[4,3]:
%
m²/g
um
Surface Weighted Mean D[3,2]:0.0149 495.658
d(0.9):
Accessory Name:
Span :1.272
umSpecific Surface Area:
22.17
Operator notes:
Uniformity:%Vol
Obscuration:
452.813 817.859d(0.1): um
0.392
402.126
um241.685 d(0.5):
Volume
Particle Size Distribution
0.01 0.1 1 10 100 1000 3000
Particle Size (µm)
0
2
4
6
8
10
12
Vol
ume
(%)
S38 - Average, Tuesday, October 14, 2008 3:31:51 PM
Hydro 2000G (A)
Result units:
um
Concentration:1.4315
Weighted Residual:1.493 %
Size (µm)0.010
0.011
0.013
0.015
0.017
0.020
0.023
0.026
0.030
0.035
0.040
0.046
0.052
0.060
0.069
0.079
0.091
0.105
Volume In %
0.00
0.00
0.00
0.00
0.00
0.00
0.00
0.00
0.00
0.00
0.00
0.00
0.00
0.00
0.00
0.00
0.00
Size (µm)0.105
0.120
0.138
0.158
0.182
0.209
0.240
0.275
0.316
0.363
0.417
0.479
0.550
0.631
0.724
0.832
0.955
1.096
Volume In %
0.00
0.00
0.00
0.00
0.00
0.00
0.00
0.00
0.00
0.00
0.00
0.00
0.00
0.00
0.00
0.00
0.00
Size (µm)1.096
1.259
1.445
1.660
1.905
2.188
2.512
2.884
3.311
3.802
4.365
5.012
5.754
6.607
7.586
8.710
10.000
11.482
Volume In %
0.00
0.00
0.00
0.00
0.00
0.00
0.00
0.00
0.00
0.00
0.00
0.00
0.00
0.00
0.00
0.00
0.00
Size (µm)11.482
13.183
15.136
17.378
19.953
22.909
26.303
30.200
34.674
39.811
45.709
52.481
60.256
69.183
79.433
91.201
104.713
120.226
Volume In %
0.00
0.00
0.00
0.00
0.00
0.00
0.00
0.00
0.00
0.00
0.00
0.00
0.00
0.00
0.00
0.00
0.04
Size (µm)120.226
138.038
158.489
181.970
208.930
239.883
275.423
316.228
363.078
416.869
478.630
549.541
630.957
724.436
831.764
954.993
1096.478
1258.925
Volume In %
0.21
0.78
1.59
2.80
4.31
6.05
7.79
9.36
10.50
11.03
10.87
10.01
8.59
6.81
4.91
3.09
1.25
Size (µm)1258.925
1445.440
1659.587
1905.461
2187.762
2511.886
2884.032
3311.311
3801.894
4365.158
5011.872
5754.399
6606.934
7585.776
8709.636
10000.000
Volume In %
0.02
0.00
0.00
0.00
0.00
0.00
0.00
0.00
0.00
0.00
0.00
0.00
0.00
0.00
0.00
Tuesday, October 14, 2008 3:31:51 PM
AveragedPit 3 150m
Measured by:Unknown
Sample bulk lot ref:
Thiruvadandhai
Sample Name:
Analysed:
Measured:
Sample Source & type:Tuesday, October 14, 2008 3:31:53 PM
S38 - AverageSOP Name:
Result Source:
Sensitivity:
Dispersant Name:Water Off
Size range:
Default
Particle RI:
1.330Result Emulation:
Absorption:0.020 to0.1
NormalAnalysis model:
2000.000
Dispersant RI:
1.520
General purposeParticle Name:
um
Tel := +[44] (0) 1684-892456 Fax +[44] (0) 1684-892789Malvern, UKMalvern Instruments Ltd.
Serial Number : MAL1022570Mastersizer 2000 Ver. 5.54
30 May 2011 8:26:02 AMRecord Number: 48File name: Thir Pit3

Result Analysis Report
Vol. Weighted Mean D[4,3]:
%
m²/g
um
Surface Weighted Mean D[3,2]:0.0109 652.727
d(0.9):
Accessory Name:
Span :1.167
umSpecific Surface Area:
22.84
Operator notes:
Uniformity:%Vol
Obscuration:
599.292 1043.755d(0.1): um
0.361
548.752
um344.578 d(0.5):
Volume
Particle Size Distribution
0.01 0.1 1 10 100 1000 3000
Particle Size (µm)
0
2
4
6
8
10
12
14
Vol
ume
(%)
S39 - Average, Tuesday, October 14, 2008 3:42:56 PM
Hydro 2000G (A)
Result units:
um
Concentration:2.0208
Weighted Residual:2.143 %
Size (µm)0.010
0.011
0.013
0.015
0.017
0.020
0.023
0.026
0.030
0.035
0.040
0.046
0.052
0.060
0.069
0.079
0.091
0.105
Volume In %
0.00
0.00
0.00
0.00
0.00
0.00
0.00
0.00
0.00
0.00
0.00
0.00
0.00
0.00
0.00
0.00
0.00
Size (µm)0.105
0.120
0.138
0.158
0.182
0.209
0.240
0.275
0.316
0.363
0.417
0.479
0.550
0.631
0.724
0.832
0.955
1.096
Volume In %
0.00
0.00
0.00
0.00
0.00
0.00
0.00
0.00
0.00
0.00
0.00
0.00
0.00
0.00
0.00
0.00
0.00
Size (µm)1.096
1.259
1.445
1.660
1.905
2.188
2.512
2.884
3.311
3.802
4.365
5.012
5.754
6.607
7.586
8.710
10.000
11.482
Volume In %
0.00
0.00
0.00
0.00
0.00
0.00
0.00
0.00
0.00
0.00
0.00
0.00
0.00
0.00
0.00
0.00
0.00
Size (µm)11.482
13.183
15.136
17.378
19.953
22.909
26.303
30.200
34.674
39.811
45.709
52.481
60.256
69.183
79.433
91.201
104.713
120.226
Volume In %
0.00
0.00
0.00
0.00
0.00
0.00
0.00
0.00
0.00
0.00
0.00
0.00
0.00
0.00
0.00
0.00
0.00
Size (µm)120.226
138.038
158.489
181.970
208.930
239.883
275.423
316.228
363.078
416.869
478.630
549.541
630.957
724.436
831.764
954.993
1096.478
1258.925
Volume In %
0.00
0.00
0.01
0.14
0.82
1.99
3.69
5.82
8.09
10.16
11.63
12.23
11.84
10.55
8.64
6.47
4.45
Size (µm)1258.925
1445.440
1659.587
1905.461
2187.762
2511.886
2884.032
3311.311
3801.894
4365.158
5011.872
5754.399
6606.934
7585.776
8709.636
10000.000
Volume In %
2.58
0.87
0.04
0.00
0.00
0.00
0.00
0.00
0.00
0.00
0.00
0.00
0.00
0.00
0.00
Tuesday, October 14, 2008 3:42:56 PM
AveragedPit 3 150m
Measured by:Unknown
Sample bulk lot ref:
Thiruvadandhai
Sample Name:
Analysed:
Measured:
Sample Source & type:Tuesday, October 14, 2008 3:42:58 PM
S39 - AverageSOP Name:
Result Source:
Sensitivity:
Dispersant Name:Water Off
Size range:
Default
Particle RI:
1.330Result Emulation:
Absorption:0.020 to0.1
NormalAnalysis model:
2000.000
Dispersant RI:
1.520
General purposeParticle Name:
um
Tel := +[44] (0) 1684-892456 Fax +[44] (0) 1684-892789Malvern, UKMalvern Instruments Ltd.
Serial Number : MAL1022570Mastersizer 2000 Ver. 5.54
30 May 2011 8:26:14 AMRecord Number: 54File name: Thir Pit3

Result Analysis Report
Vol. Weighted Mean D[4,3]:
%
m²/g
um
Surface Weighted Mean D[3,2]:0.0113 664.345
d(0.9):
Accessory Name:
Span :1.332
umSpecific Surface Area:
22.94
Operator notes:
Uniformity:%Vol
Obscuration:
599.997 1115.878d(0.1): um
0.41
532.366
um316.644 d(0.5):
Volume
Particle Size Distribution
0.01 0.1 1 10 100 1000 3000
Particle Size (µm)
0
2
4
6
8
10
12
Vol
ume
(%)
S40 - Average, Tuesday, October 14, 2008 3:52:57 PM
Hydro 2000G (A)
Result units:
um
Concentration:1.9696
Weighted Residual:2.083 %
Size (µm)0.010
0.011
0.013
0.015
0.017
0.020
0.023
0.026
0.030
0.035
0.040
0.046
0.052
0.060
0.069
0.079
0.091
0.105
Volume In %
0.00
0.00
0.00
0.00
0.00
0.00
0.00
0.00
0.00
0.00
0.00
0.00
0.00
0.00
0.00
0.00
0.00
Size (µm)0.105
0.120
0.138
0.158
0.182
0.209
0.240
0.275
0.316
0.363
0.417
0.479
0.550
0.631
0.724
0.832
0.955
1.096
Volume In %
0.00
0.00
0.00
0.00
0.00
0.00
0.00
0.00
0.00
0.00
0.00
0.00
0.00
0.00
0.00
0.00
0.00
Size (µm)1.096
1.259
1.445
1.660
1.905
2.188
2.512
2.884
3.311
3.802
4.365
5.012
5.754
6.607
7.586
8.710
10.000
11.482
Volume In %
0.00
0.00
0.00
0.00
0.00
0.00
0.00
0.00
0.00
0.00
0.00
0.00
0.00
0.00
0.00
0.00
0.00
Size (µm)11.482
13.183
15.136
17.378
19.953
22.909
26.303
30.200
34.674
39.811
45.709
52.481
60.256
69.183
79.433
91.201
104.713
120.226
Volume In %
0.00
0.00
0.00
0.00
0.00
0.00
0.00
0.00
0.00
0.00
0.00
0.00
0.00
0.00
0.00
0.00
0.00
Size (µm)120.226
138.038
158.489
181.970
208.930
239.883
275.423
316.228
363.078
416.869
478.630
549.541
630.957
724.436
831.764
954.993
1096.478
1258.925
Volume In %
0.00
0.02
0.19
0.80
1.66
2.89
4.39
6.08
7.75
9.20
10.23
10.69
10.50
9.69
8.38
6.78
5.11
Size (µm)1258.925
1445.440
1659.587
1905.461
2187.762
2511.886
2884.032
3311.311
3801.894
4365.158
5011.872
5754.399
6606.934
7585.776
8709.636
10000.000
Volume In %
3.49
1.96
0.18
0.00
0.00
0.00
0.00
0.00
0.00
0.00
0.00
0.00
0.00
0.00
0.00
Tuesday, October 14, 2008 3:52:57 PM
AveragedPit 3 150m
Measured by:Unknown
Sample bulk lot ref:
Thiruvadandhai
Sample Name:
Analysed:
Measured:
Sample Source & type:Tuesday, October 14, 2008 3:52:58 PM
S40 - AverageSOP Name:
Result Source:
Sensitivity:
Dispersant Name:Water Off
Size range:
Default
Particle RI:
1.330Result Emulation:
Absorption:0.020 to0.1
NormalAnalysis model:
2000.000
Dispersant RI:
1.520
General purposeParticle Name:
um
Tel := +[44] (0) 1684-892456 Fax +[44] (0) 1684-892789Malvern, UKMalvern Instruments Ltd.
Serial Number : MAL1022570Mastersizer 2000 Ver. 5.54
30 May 2011 8:26:40 AMRecord Number: 60File name: Thir Pit3

Result Analysis Report
Vol. Weighted Mean D[4,3]:
%
m²/g
um
Surface Weighted Mean D[3,2]:0.00952 777.372
d(0.9):
Accessory Name:
Span :1.284
umSpecific Surface Area:
22.78
Operator notes:
Uniformity:%Vol
Obscuration:
708.049 1287.451d(0.1): um
0.395
629.949
um378.668 d(0.5):
Volume
Particle Size Distribution
0.01 0.1 1 10 100 1000 3000
Particle Size (µm)
0
2
4
6
8
10
12
Vol
ume
(%)
S41 - Average, Tuesday, October 14, 2008 4:03:15 PM
Hydro 2000G (A)
Result units:
um
Concentration:2.3139
Weighted Residual:2.782 %
Size (µm)0.010
0.011
0.013
0.015
0.017
0.020
0.023
0.026
0.030
0.035
0.040
0.046
0.052
0.060
0.069
0.079
0.091
0.105
Volume In %
0.00
0.00
0.00
0.00
0.00
0.00
0.00
0.00
0.00
0.00
0.00
0.00
0.00
0.00
0.00
0.00
0.00
Size (µm)0.105
0.120
0.138
0.158
0.182
0.209
0.240
0.275
0.316
0.363
0.417
0.479
0.550
0.631
0.724
0.832
0.955
1.096
Volume In %
0.00
0.00
0.00
0.00
0.00
0.00
0.00
0.00
0.00
0.00
0.00
0.00
0.00
0.00
0.00
0.00
0.00
Size (µm)1.096
1.259
1.445
1.660
1.905
2.188
2.512
2.884
3.311
3.802
4.365
5.012
5.754
6.607
7.586
8.710
10.000
11.482
Volume In %
0.00
0.00
0.00
0.00
0.00
0.00
0.00
0.00
0.00
0.00
0.00
0.00
0.00
0.00
0.00
0.00
0.00
Size (µm)11.482
13.183
15.136
17.378
19.953
22.909
26.303
30.200
34.674
39.811
45.709
52.481
60.256
69.183
79.433
91.201
104.713
120.226
Volume In %
0.00
0.00
0.00
0.00
0.00
0.00
0.00
0.00
0.00
0.00
0.00
0.00
0.00
0.00
0.00
0.00
0.00
Size (µm)120.226
138.038
158.489
181.970
208.930
239.883
275.423
316.228
363.078
416.869
478.630
549.541
630.957
724.436
831.764
954.993
1096.478
1258.925
Volume In %
0.00
0.00
0.01
0.13
0.59
1.35
2.46
3.94
5.64
7.42
9.05
10.29
10.95
10.91
10.18
8.88
7.20
Size (µm)1258.925
1445.440
1659.587
1905.461
2187.762
2511.886
2884.032
3311.311
3801.894
4365.158
5011.872
5754.399
6606.934
7585.776
8709.636
10000.000
Volume In %
5.40
3.62
1.67
0.31
0.00
0.00
0.00
0.00
0.00
0.00
0.00
0.00
0.00
0.00
0.00
Tuesday, October 14, 2008 4:03:15 PM
AveragedPit 3 150m
Measured by:Unknown
Sample bulk lot ref:
Thiruvadandhai
Sample Name:
Analysed:
Measured:
Sample Source & type:Tuesday, October 14, 2008 4:03:17 PM
S41 - AverageSOP Name:
Result Source:
Sensitivity:
Dispersant Name:Water Off
Size range:
Default
Particle RI:
1.330Result Emulation:
Absorption:0.020 to0.1
NormalAnalysis model:
2000.000
Dispersant RI:
1.520
General purposeParticle Name:
um
Tel := +[44] (0) 1684-892456 Fax +[44] (0) 1684-892789Malvern, UKMalvern Instruments Ltd.
Serial Number : MAL1022570Mastersizer 2000 Ver. 5.54
30 May 2011 8:26:52 AMRecord Number: 66File name: Thir Pit3

Result Analysis Report
Vol. Weighted Mean D[4,3]:
%
m²/g
um
Surface Weighted Mean D[3,2]:0.00992 739.938
d(0.9):
Accessory Name:
Span :1.271
umSpecific Surface Area:
21.25
Operator notes:
Uniformity:%Vol
Obscuration:
672.532 1221.321d(0.1): um
0.391
604.577
um366.324 d(0.5):
Volume
Particle Size Distribution
0.01 0.1 1 10 100 1000 3000
Particle Size (µm)
0
2
4
6
8
10
12
Vol
ume
(%)
S42 - Average, Tuesday, October 14, 2008 4:12:50 PM
Hydro 2000G (A)
Result units:
um
Concentration:2.0509
Weighted Residual:2.674 %
Size (µm)0.010
0.011
0.013
0.015
0.017
0.020
0.023
0.026
0.030
0.035
0.040
0.046
0.052
0.060
0.069
0.079
0.091
0.105
Volume In %
0.00
0.00
0.00
0.00
0.00
0.00
0.00
0.00
0.00
0.00
0.00
0.00
0.00
0.00
0.00
0.00
0.00
Size (µm)0.105
0.120
0.138
0.158
0.182
0.209
0.240
0.275
0.316
0.363
0.417
0.479
0.550
0.631
0.724
0.832
0.955
1.096
Volume In %
0.00
0.00
0.00
0.00
0.00
0.00
0.00
0.00
0.00
0.00
0.00
0.00
0.00
0.00
0.00
0.00
0.00
Size (µm)1.096
1.259
1.445
1.660
1.905
2.188
2.512
2.884
3.311
3.802
4.365
5.012
5.754
6.607
7.586
8.710
10.000
11.482
Volume In %
0.00
0.00
0.00
0.00
0.00
0.00
0.00
0.00
0.00
0.00
0.00
0.00
0.00
0.00
0.00
0.00
0.00
Size (µm)11.482
13.183
15.136
17.378
19.953
22.909
26.303
30.200
34.674
39.811
45.709
52.481
60.256
69.183
79.433
91.201
104.713
120.226
Volume In %
0.00
0.00
0.00
0.00
0.00
0.00
0.00
0.00
0.00
0.00
0.00
0.00
0.00
0.00
0.00
0.00
0.00
Size (µm)120.226
138.038
158.489
181.970
208.930
239.883
275.423
316.228
363.078
416.869
478.630
549.541
630.957
724.436
831.764
954.993
1096.478
1258.925
Volume In %
0.00
0.00
0.00
0.03
0.64
1.56
2.87
4.54
6.39
8.22
9.77
10.81
11.17
10.80
9.76
8.23
6.46
Size (µm)1258.925
1445.440
1659.587
1905.461
2187.762
2511.886
2884.032
3311.311
3801.894
4365.158
5011.872
5754.399
6606.934
7585.776
8709.636
10000.000
Volume In %
4.69
2.94
1.02
0.08
0.00
0.00
0.00
0.00
0.00
0.00
0.00
0.00
0.00
0.00
0.00
Tuesday, October 14, 2008 4:12:50 PM
AveragedPit 3 150m
Measured by:Unknown
Sample bulk lot ref:
Thiruvadandhai
Sample Name:
Analysed:
Measured:
Sample Source & type:Tuesday, October 14, 2008 4:12:51 PM
S42 - AverageSOP Name:
Result Source:
Sensitivity:
Dispersant Name:Water Off
Size range:
Default
Particle RI:
1.330Result Emulation:
Absorption:0.020 to0.1
NormalAnalysis model:
2000.000
Dispersant RI:
1.520
General purposeParticle Name:
um
Tel := +[44] (0) 1684-892456 Fax +[44] (0) 1684-892789Malvern, UKMalvern Instruments Ltd.
Serial Number : MAL1022570Mastersizer 2000 Ver. 5.54
30 May 2011 8:27:02 AMRecord Number: 72File name: Thir Pit3

Result Analysis Report
Vol. Weighted Mean D[4,3]:
%
m²/g
um
Surface Weighted Mean D[3,2]:0.00885 794.711
d(0.9):
Accessory Name:
Span :1.112
umSpecific Surface Area:
22.25
Operator notes:
Uniformity:%Vol
Obscuration:
734.541 1250.069d(0.1): um
0.342
678.055
um432.897 d(0.5):
Volume
Particle Size Distribution
0.01 0.1 1 10 100 1000 3000
Particle Size (µm)
0
2
4
6
8
10
12
14
Vol
ume
(%)
S43 - Average, Tuesday, October 14, 2008 4:22:25 PM
Hydro 2000G (A)
Result units:
um
Concentration:2.4238
Weighted Residual:3.209 %
Size (µm)0.010
0.011
0.013
0.015
0.017
0.020
0.023
0.026
0.030
0.035
0.040
0.046
0.052
0.060
0.069
0.079
0.091
0.105
Volume In %
0.00
0.00
0.00
0.00
0.00
0.00
0.00
0.00
0.00
0.00
0.00
0.00
0.00
0.00
0.00
0.00
0.00
Size (µm)0.105
0.120
0.138
0.158
0.182
0.209
0.240
0.275
0.316
0.363
0.417
0.479
0.550
0.631
0.724
0.832
0.955
1.096
Volume In %
0.00
0.00
0.00
0.00
0.00
0.00
0.00
0.00
0.00
0.00
0.00
0.00
0.00
0.00
0.00
0.00
0.00
Size (µm)1.096
1.259
1.445
1.660
1.905
2.188
2.512
2.884
3.311
3.802
4.365
5.012
5.754
6.607
7.586
8.710
10.000
11.482
Volume In %
0.00
0.00
0.00
0.00
0.00
0.00
0.00
0.00
0.00
0.00
0.00
0.00
0.00
0.00
0.00
0.00
0.00
Size (µm)11.482
13.183
15.136
17.378
19.953
22.909
26.303
30.200
34.674
39.811
45.709
52.481
60.256
69.183
79.433
91.201
104.713
120.226
Volume In %
0.00
0.00
0.00
0.00
0.00
0.00
0.00
0.00
0.00
0.00
0.00
0.00
0.00
0.00
0.00
0.00
0.00
Size (µm)120.226
138.038
158.489
181.970
208.930
239.883
275.423
316.228
363.078
416.869
478.630
549.541
630.957
724.436
831.764
954.993
1096.478
1258.925
Volume In %
0.00
0.00
0.00
0.00
0.00
0.22
1.05
2.52
4.55
6.98
9.41
11.41
12.57
12.64
11.63
9.80
7.53
Size (µm)1258.925
1445.440
1659.587
1905.461
2187.762
2511.886
2884.032
3311.311
3801.894
4365.158
5011.872
5754.399
6606.934
7585.776
8709.636
10000.000
Volume In %
5.26
3.14
1.14
0.13
0.00
0.00
0.00
0.00
0.00
0.00
0.00
0.00
0.00
0.00
0.00
Tuesday, October 14, 2008 4:22:25 PM
AveragedPit 3 150m
Measured by:Unknown
Sample bulk lot ref:
Thiruvadandhai
Sample Name:
Analysed:
Measured:
Sample Source & type:Tuesday, October 14, 2008 4:22:26 PM
S43 - AverageSOP Name:
Result Source:
Sensitivity:
Dispersant Name:Water Off
Size range:
Default
Particle RI:
1.330Result Emulation:
Absorption:0.020 to0.1
NormalAnalysis model:
2000.000
Dispersant RI:
1.520
General purposeParticle Name:
um
Tel := +[44] (0) 1684-892456 Fax +[44] (0) 1684-892789Malvern, UKMalvern Instruments Ltd.
Serial Number : MAL1022570Mastersizer 2000 Ver. 5.54
30 May 2011 8:27:14 AMRecord Number: 78File name: Thir Pit3

Result Analysis Report
Vol. Weighted Mean D[4,3]:
%
m²/g
um
Surface Weighted Mean D[3,2]:0.0128 573.029
d(0.9):
Accessory Name:
Span :1.261
umSpecific Surface Area:
24.38
Operator notes:
Uniformity:%Vol
Obscuration:
522.139 942.525d(0.1): um
0.389
468.723
um284.331 d(0.5):
Volume
Particle Size Distribution
0.01 0.1 1 10 100 1000 3000
Particle Size (µm)
0
2
4
6
8
10
12
Vol
ume
(%)
S44 - Average, Tuesday, October 14, 2008 4:30:58 PM
Hydro 2000G (A)
Result units:
um
Concentration:1.8612
Weighted Residual:1.844 %
Size (µm)0.010
0.011
0.013
0.015
0.017
0.020
0.023
0.026
0.030
0.035
0.040
0.046
0.052
0.060
0.069
0.079
0.091
0.105
Volume In %
0.00
0.00
0.00
0.00
0.00
0.00
0.00
0.00
0.00
0.00
0.00
0.00
0.00
0.00
0.00
0.00
0.00
Size (µm)0.105
0.120
0.138
0.158
0.182
0.209
0.240
0.275
0.316
0.363
0.417
0.479
0.550
0.631
0.724
0.832
0.955
1.096
Volume In %
0.00
0.00
0.00
0.00
0.00
0.00
0.00
0.00
0.00
0.00
0.00
0.00
0.00
0.00
0.00
0.00
0.00
Size (µm)1.096
1.259
1.445
1.660
1.905
2.188
2.512
2.884
3.311
3.802
4.365
5.012
5.754
6.607
7.586
8.710
10.000
11.482
Volume In %
0.00
0.00
0.00
0.00
0.00
0.00
0.00
0.00
0.00
0.00
0.00
0.00
0.00
0.00
0.00
0.00
0.00
Size (µm)11.482
13.183
15.136
17.378
19.953
22.909
26.303
30.200
34.674
39.811
45.709
52.481
60.256
69.183
79.433
91.201
104.713
120.226
Volume In %
0.00
0.00
0.00
0.00
0.00
0.00
0.00
0.00
0.00
0.00
0.00
0.00
0.00
0.00
0.00
0.00
0.00
Size (µm)120.226
138.038
158.489
181.970
208.930
239.883
275.423
316.228
363.078
416.869
478.630
549.541
630.957
724.436
831.764
954.993
1096.478
1258.925
Volume In %
0.00
0.03
0.54
1.37
2.61
4.21
6.03
7.90
9.53
10.71
11.23
11.01
10.07
8.57
6.74
4.89
3.12
Size (µm)1258.925
1445.440
1659.587
1905.461
2187.762
2511.886
2884.032
3311.311
3801.894
4365.158
5011.872
5754.399
6606.934
7585.776
8709.636
10000.000
Volume In %
1.38
0.04
0.00
0.00
0.00
0.00
0.00
0.00
0.00
0.00
0.00
0.00
0.00
0.00
0.00
Tuesday, October 14, 2008 4:30:58 PM
AveragedPit 3 150m
Measured by:Unknown
Sample bulk lot ref:
Thiruvadandhai
Sample Name:
Analysed:
Measured:
Sample Source & type:Tuesday, October 14, 2008 4:31:00 PM
S44 - AverageSOP Name:
Result Source:
Sensitivity:
Dispersant Name:Water Off
Size range:
Default
Particle RI:
1.330Result Emulation:
Absorption:0.020 to0.1
NormalAnalysis model:
2000.000
Dispersant RI:
1.520
General purposeParticle Name:
um
Tel := +[44] (0) 1684-892456 Fax +[44] (0) 1684-892789Malvern, UKMalvern Instruments Ltd.
Serial Number : MAL1022570Mastersizer 2000 Ver. 5.54
30 May 2011 8:27:28 AMRecord Number: 84File name: Thir Pit3

Result Analysis Report
Vol. Weighted Mean D[4,3]:
%
m²/g
um
Surface Weighted Mean D[3,2]:0.0137 529.469
d(0.9):
Accessory Name:
Span :1.210
umSpecific Surface Area:
21.91
Operator notes:
Uniformity:%Vol
Obscuration:
486.559 858.585d(0.1): um
0.371
439.253
um269.610 d(0.5):
Volume
Particle Size Distribution
0.01 0.1 1 10 100 1000 3000
Particle Size (µm)
0
2
4
6
8
10
12
14
Vol
ume
(%)
S45 - Average, Tuesday, October 14, 2008 4:40:31 PM
Hydro 2000G (A)
Result units:
um
Concentration:1.5429
Weighted Residual:1.645 %
Size (µm)0.010
0.011
0.013
0.015
0.017
0.020
0.023
0.026
0.030
0.035
0.040
0.046
0.052
0.060
0.069
0.079
0.091
0.105
Volume In %
0.00
0.00
0.00
0.00
0.00
0.00
0.00
0.00
0.00
0.00
0.00
0.00
0.00
0.00
0.00
0.00
0.00
Size (µm)0.105
0.120
0.138
0.158
0.182
0.209
0.240
0.275
0.316
0.363
0.417
0.479
0.550
0.631
0.724
0.832
0.955
1.096
Volume In %
0.00
0.00
0.00
0.00
0.00
0.00
0.00
0.00
0.00
0.00
0.00
0.00
0.00
0.00
0.00
0.00
0.00
Size (µm)1.096
1.259
1.445
1.660
1.905
2.188
2.512
2.884
3.311
3.802
4.365
5.012
5.754
6.607
7.586
8.710
10.000
11.482
Volume In %
0.00
0.00
0.00
0.00
0.00
0.00
0.00
0.00
0.00
0.00
0.00
0.00
0.00
0.00
0.00
0.00
0.00
Size (µm)11.482
13.183
15.136
17.378
19.953
22.909
26.303
30.200
34.674
39.811
45.709
52.481
60.256
69.183
79.433
91.201
104.713
120.226
Volume In %
0.00
0.00
0.00
0.00
0.00
0.00
0.00
0.00
0.00
0.00
0.00
0.00
0.00
0.00
0.00
0.00
0.00
Size (µm)120.226
138.038
158.489
181.970
208.930
239.883
275.423
316.228
363.078
416.869
478.630
549.541
630.957
724.436
831.764
954.993
1096.478
1258.925
Volume In %
0.00
0.05
0.76
1.78
3.25
5.06
7.02
8.91
10.43
11.36
11.54
10.92
9.61
7.81
5.78
3.84
1.86
Size (µm)1258.925
1445.440
1659.587
1905.461
2187.762
2511.886
2884.032
3311.311
3801.894
4365.158
5011.872
5754.399
6606.934
7585.776
8709.636
10000.000
Volume In %
0.03
0.00
0.00
0.00
0.00
0.00
0.00
0.00
0.00
0.00
0.00
0.00
0.00
0.00
0.00
Tuesday, October 14, 2008 4:40:31 PM
AveragedPit 3 150m
Measured by:Unknown
Sample bulk lot ref:
Thiruvadandhai
Sample Name:
Analysed:
Measured:
Sample Source & type:Tuesday, October 14, 2008 4:40:32 PM
S45 - AverageSOP Name:
Result Source:
Sensitivity:
Dispersant Name:Water Off
Size range:
Default
Particle RI:
1.330Result Emulation:
Absorption:0.020 to0.1
NormalAnalysis model:
2000.000
Dispersant RI:
1.520
General purposeParticle Name:
um
Tel := +[44] (0) 1684-892456 Fax +[44] (0) 1684-892789Malvern, UKMalvern Instruments Ltd.
Serial Number : MAL1022570Mastersizer 2000 Ver. 5.54
30 May 2011 8:27:39 AMRecord Number: 90File name: Thir Pit3

Result Analysis Report
Vol. Weighted Mean D[4,3]:
%
m²/g
um
Surface Weighted Mean D[3,2]:0.0106 691.480
d(0.9):
Accessory Name:
Span :1.267
umSpecific Surface Area:
20.36
Operator notes:
Uniformity:%Vol
Obscuration:
629.301 1140.352d(0.1): um
0.387
565.590
um343.337 d(0.5):
Volume
Particle Size Distribution
0.01 0.1 1 10 100 1000 3000
Particle Size (µm)
0
2
4
6
8
10
12
Vol
ume
(%)
S46 - Average, Tuesday, October 14, 2008 4:50:12 PM
Hydro 2000G (A)
Result units:
um
Concentration:1.8296
Weighted Residual:2.402 %
Size (µm)0.010
0.011
0.013
0.015
0.017
0.020
0.023
0.026
0.030
0.035
0.040
0.046
0.052
0.060
0.069
0.079
0.091
0.105
Volume In %
0.00
0.00
0.00
0.00
0.00
0.00
0.00
0.00
0.00
0.00
0.00
0.00
0.00
0.00
0.00
0.00
0.00
Size (µm)0.105
0.120
0.138
0.158
0.182
0.209
0.240
0.275
0.316
0.363
0.417
0.479
0.550
0.631
0.724
0.832
0.955
1.096
Volume In %
0.00
0.00
0.00
0.00
0.00
0.00
0.00
0.00
0.00
0.00
0.00
0.00
0.00
0.00
0.00
0.00
0.00
Size (µm)1.096
1.259
1.445
1.660
1.905
2.188
2.512
2.884
3.311
3.802
4.365
5.012
5.754
6.607
7.586
8.710
10.000
11.482
Volume In %
0.00
0.00
0.00
0.00
0.00
0.00
0.00
0.00
0.00
0.00
0.00
0.00
0.00
0.00
0.00
0.00
0.00
Size (µm)11.482
13.183
15.136
17.378
19.953
22.909
26.303
30.200
34.674
39.811
45.709
52.481
60.256
69.183
79.433
91.201
104.713
120.226
Volume In %
0.00
0.00
0.00
0.00
0.00
0.00
0.00
0.00
0.00
0.00
0.00
0.00
0.00
0.00
0.00
0.00
0.00
Size (µm)120.226
138.038
158.489
181.970
208.930
239.883
275.423
316.228
363.078
416.869
478.630
549.541
630.957
724.436
831.764
954.993
1096.478
1258.925
Volume In %
0.00
0.00
0.01
0.30
1.00
2.11
3.60
5.39
7.27
9.03
10.38
11.13
11.14
10.42
9.09
7.38
5.54
Size (µm)1258.925
1445.440
1659.587
1905.461
2187.762
2511.886
2884.032
3311.311
3801.894
4365.158
5011.872
5754.399
6606.934
7585.776
8709.636
10000.000
Volume In %
3.81
2.24
0.17
0.00
0.00
0.00
0.00
0.00
0.00
0.00
0.00
0.00
0.00
0.00
0.00
Tuesday, October 14, 2008 4:50:12 PM
AveragedPit 3 150m
Measured by:Unknown
Sample bulk lot ref:
Thiruvadandhai
Sample Name:
Analysed:
Measured:
Sample Source & type:Tuesday, October 14, 2008 4:50:13 PM
S46 - AverageSOP Name:
Result Source:
Sensitivity:
Dispersant Name:Water Off
Size range:
Default
Particle RI:
1.330Result Emulation:
Absorption:0.020 to0.1
NormalAnalysis model:
2000.000
Dispersant RI:
1.520
General purposeParticle Name:
um
Tel := +[44] (0) 1684-892456 Fax +[44] (0) 1684-892789Malvern, UKMalvern Instruments Ltd.
Serial Number : MAL1022570Mastersizer 2000 Ver. 5.54
30 May 2011 8:27:50 AMRecord Number: 96File name: Thir Pit3

Result Analysis Report
Vol. Weighted Mean D[4,3]:
%
m²/g
um
Surface Weighted Mean D[3,2]:0.0143 558.156
d(0.9):
Accessory Name:
Span :1.318
umSpecific Surface Area:
23.12
Operator notes:
Uniformity:%Vol
Obscuration:
508.657 935.060d(0.1): um
0.409
419.648
um264.462 d(0.5):
Volume
Particle Size Distribution
0.01 0.1 1 10 100 1000 3000
Particle Size (µm)
0
2
4
6
8
10
12
Vol
ume
(%)
S47 - Average, Tuesday, October 14, 2008 4:58:45 PM
Hydro 2000G (A)
Result units:
um
Concentration:1.5649
Weighted Residual:1.709 %
Size (µm)0.010
0.011
0.013
0.015
0.017
0.020
0.023
0.026
0.030
0.035
0.040
0.046
0.052
0.060
0.069
0.079
0.091
0.105
Volume In %
0.00
0.00
0.00
0.00
0.00
0.00
0.00
0.00
0.00
0.00
0.00
0.00
0.00
0.00
0.00
0.00
0.00
Size (µm)0.105
0.120
0.138
0.158
0.182
0.209
0.240
0.275
0.316
0.363
0.417
0.479
0.550
0.631
0.724
0.832
0.955
1.096
Volume In %
0.00
0.00
0.00
0.00
0.00
0.00
0.00
0.00
0.00
0.00
0.00
0.00
0.00
0.00
0.00
0.00
0.00
Size (µm)1.096
1.259
1.445
1.660
1.905
2.188
2.512
2.884
3.311
3.802
4.365
5.012
5.754
6.607
7.586
8.710
10.000
11.482
Volume In %
0.00
0.00
0.00
0.00
0.00
0.00
0.00
0.00
0.00
0.00
0.00
0.00
0.00
0.00
0.00
0.00
0.00
Size (µm)11.482
13.183
15.136
17.378
19.953
22.909
26.303
30.200
34.674
39.811
45.709
52.481
60.256
69.183
79.433
91.201
104.713
120.226
Volume In %
0.00
0.00
0.00
0.00
0.00
0.00
0.00
0.01
0.09
0.13
0.17
0.20
0.21
0.19
0.14
0.05
-0.00
Size (µm)120.226
138.038
158.489
181.970
208.930
239.883
275.423
316.228
363.078
416.869
478.630
549.541
630.957
724.436
831.764
954.993
1096.478
1258.925
Volume In %
0.08
0.33
0.84
1.70
2.90
4.43
6.14
7.87
9.36
10.41
10.83
10.56
9.63
8.18
6.43
4.66
3.02
Size (µm)1258.925
1445.440
1659.587
1905.461
2187.762
2511.886
2884.032
3311.311
3801.894
4365.158
5011.872
5754.399
6606.934
7585.776
8709.636
10000.000
Volume In %
1.41
0.05
0.00
0.00
0.00
0.00
0.00
0.00
0.00
0.00
0.00
0.00
0.00
0.00
0.00
Tuesday, October 14, 2008 4:58:45 PM
AveragedPit 3 150m
Measured by:Unknown
Sample bulk lot ref:
Thiruvadandhai
Sample Name:
Analysed:
Measured:
Sample Source & type:Tuesday, October 14, 2008 4:58:47 PM
S47 - AverageSOP Name:
Result Source:
Sensitivity:
Dispersant Name:Water Off
Size range:
Default
Particle RI:
1.330Result Emulation:
Absorption:0.020 to0.1
NormalAnalysis model:
2000.000
Dispersant RI:
1.520
General purposeParticle Name:
um
Tel := +[44] (0) 1684-892456 Fax +[44] (0) 1684-892789Malvern, UKMalvern Instruments Ltd.
Serial Number : MAL1022570Mastersizer 2000 Ver. 5.54
30 May 2011 8:28:02 AMRecord Number: 102File name: Thir Pit3
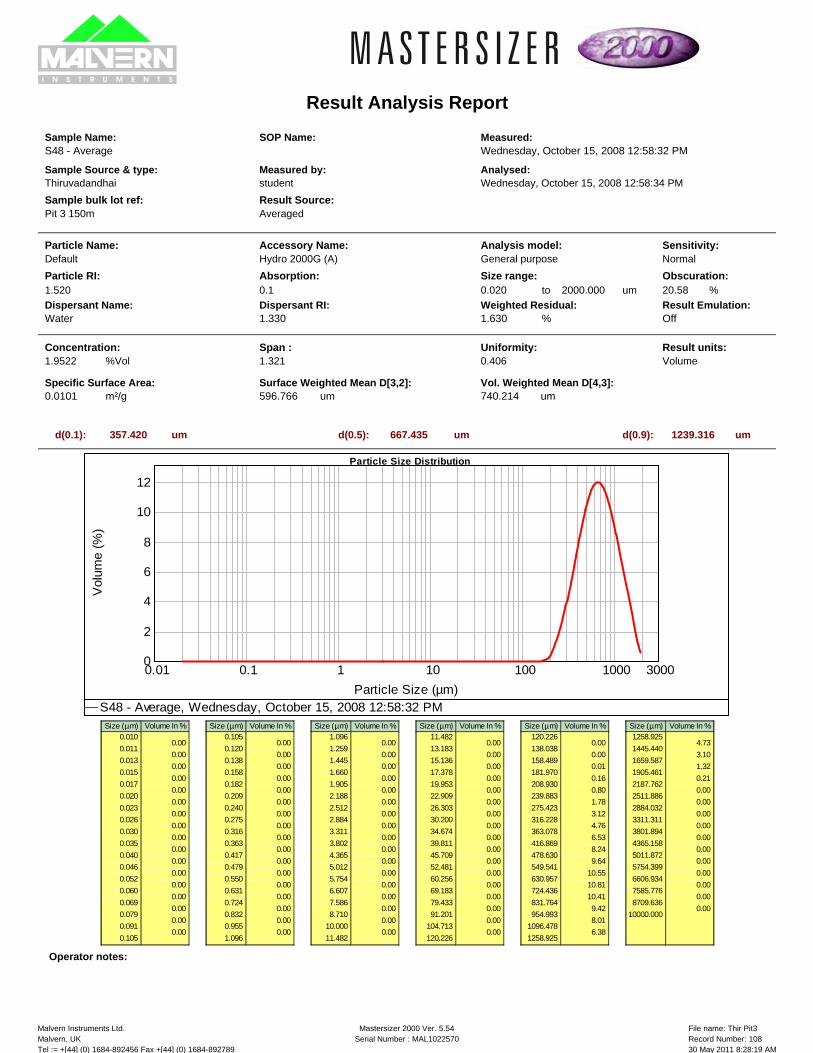
Result Analysis Report
Vol. Weighted Mean D[4,3]:
%
m²/g
um
Surface Weighted Mean D[3,2]:0.0101 740.214
d(0.9):
Accessory Name:
Span :1.321
umSpecific Surface Area:
20.58
Operator notes:
Uniformity:%Vol
Obscuration:
667.435 1239.316d(0.1): um
0.406
596.766
um357.420 d(0.5):
Volume
Particle Size Distribution
0.01 0.1 1 10 100 1000 3000
Particle Size (µm)
0
2
4
6
8
10
12
Vol
ume
(%)
S48 - Average, Wednesday, October 15, 2008 12:58:32 PM
Hydro 2000G (A)
Result units:
um
Concentration:1.9522
Weighted Residual:1.630 %
Size (µm)0.010
0.011
0.013
0.015
0.017
0.020
0.023
0.026
0.030
0.035
0.040
0.046
0.052
0.060
0.069
0.079
0.091
0.105
Volume In %
0.00
0.00
0.00
0.00
0.00
0.00
0.00
0.00
0.00
0.00
0.00
0.00
0.00
0.00
0.00
0.00
0.00
Size (µm)0.105
0.120
0.138
0.158
0.182
0.209
0.240
0.275
0.316
0.363
0.417
0.479
0.550
0.631
0.724
0.832
0.955
1.096
Volume In %
0.00
0.00
0.00
0.00
0.00
0.00
0.00
0.00
0.00
0.00
0.00
0.00
0.00
0.00
0.00
0.00
0.00
Size (µm)1.096
1.259
1.445
1.660
1.905
2.188
2.512
2.884
3.311
3.802
4.365
5.012
5.754
6.607
7.586
8.710
10.000
11.482
Volume In %
0.00
0.00
0.00
0.00
0.00
0.00
0.00
0.00
0.00
0.00
0.00
0.00
0.00
0.00
0.00
0.00
0.00
Size (µm)11.482
13.183
15.136
17.378
19.953
22.909
26.303
30.200
34.674
39.811
45.709
52.481
60.256
69.183
79.433
91.201
104.713
120.226
Volume In %
0.00
0.00
0.00
0.00
0.00
0.00
0.00
0.00
0.00
0.00
0.00
0.00
0.00
0.00
0.00
0.00
0.00
Size (µm)120.226
138.038
158.489
181.970
208.930
239.883
275.423
316.228
363.078
416.869
478.630
549.541
630.957
724.436
831.764
954.993
1096.478
1258.925
Volume In %
0.00
0.00
0.01
0.16
0.80
1.78
3.12
4.76
6.53
8.24
9.64
10.55
10.81
10.41
9.42
8.01
6.38
Size (µm)1258.925
1445.440
1659.587
1905.461
2187.762
2511.886
2884.032
3311.311
3801.894
4365.158
5011.872
5754.399
6606.934
7585.776
8709.636
10000.000
Volume In %
4.73
3.10
1.32
0.21
0.00
0.00
0.00
0.00
0.00
0.00
0.00
0.00
0.00
0.00
0.00
Wednesday, October 15, 2008 12:58:32 PM
AveragedPit 3 150m
Measured by:student
Sample bulk lot ref:
Thiruvadandhai
Sample Name:
Analysed:
Measured:
Sample Source & type:Wednesday, October 15, 2008 12:58:34 PM
S48 - AverageSOP Name:
Result Source:
Sensitivity:
Dispersant Name:Water Off
Size range:
Default
Particle RI:
1.330Result Emulation:
Absorption:0.020 to0.1
NormalAnalysis model:
2000.000
Dispersant RI:
1.520
General purposeParticle Name:
um
Tel := +[44] (0) 1684-892456 Fax +[44] (0) 1684-892789Malvern, UKMalvern Instruments Ltd.
Serial Number : MAL1022570Mastersizer 2000 Ver. 5.54
30 May 2011 8:28:19 AMRecord Number: 108File name: Thir Pit3

Result Analysis Report
Vol. Weighted Mean D[4,3]:
%
m²/g
um
Surface Weighted Mean D[3,2]:0.0114 673.027
d(0.9):
Accessory Name:
Span :1.338
umSpecific Surface Area:
20.86
Operator notes:
Uniformity:%Vol
Obscuration:
608.250 1133.712d(0.1): um
0.412
524.297
um320.071 d(0.5):
Volume
Particle Size Distribution
0.01 0.1 1 10 100 1000 3000
Particle Size (µm)
0
2
4
6
8
10
12
Vol
ume
(%)
S49 - Average, Wednesday, October 15, 2008 1:09:29 PM
Hydro 2000G (A)
Result units:
um
Concentration:1.7413
Weighted Residual:1.342 %
Size (µm)0.010
0.011
0.013
0.015
0.017
0.020
0.023
0.026
0.030
0.035
0.040
0.046
0.052
0.060
0.069
0.079
0.091
0.105
Volume In %
0.00
0.00
0.00
0.00
0.00
0.00
0.00
0.00
0.00
0.00
0.00
0.00
0.00
0.00
0.00
0.00
0.00
Size (µm)0.105
0.120
0.138
0.158
0.182
0.209
0.240
0.275
0.316
0.363
0.417
0.479
0.550
0.631
0.724
0.832
0.955
1.096
Volume In %
0.00
0.00
0.00
0.00
0.00
0.00
0.00
0.00
0.00
0.00
0.00
0.00
0.00
0.00
0.00
0.00
0.00
Size (µm)1.096
1.259
1.445
1.660
1.905
2.188
2.512
2.884
3.311
3.802
4.365
5.012
5.754
6.607
7.586
8.710
10.000
11.482
Volume In %
0.00
0.00
0.00
0.00
0.00
0.00
0.00
0.00
0.00
0.00
0.00
0.00
0.00
0.00
0.00
0.00
0.00
Size (µm)11.482
13.183
15.136
17.378
19.953
22.909
26.303
30.200
34.674
39.811
45.709
52.481
60.256
69.183
79.433
91.201
104.713
120.226
Volume In %
0.00
0.00
0.00
0.00
0.00
0.00
0.00
0.00
0.00
0.01
0.07
0.09
0.11
0.10
0.06
0.01
0.00
Size (µm)120.226
138.038
158.489
181.970
208.930
239.883
275.423
316.228
363.078
416.869
478.630
549.541
630.957
724.436
831.764
954.993
1096.478
1258.925
Volume In %
0.00
-0.00
0.13
0.65
1.48
2.67
4.16
5.86
7.56
9.06
10.15
10.65
10.51
9.75
8.50
6.96
5.33
Size (µm)1258.925
1445.440
1659.587
1905.461
2187.762
2511.886
2884.032
3311.311
3801.894
4365.158
5011.872
5754.399
6606.934
7585.776
8709.636
10000.000
Volume In %
3.69
2.16
0.26
0.00
0.00
0.00
0.00
0.00
0.00
0.00
0.00
0.00
0.00
0.00
0.00
Wednesday, October 15, 2008 1:09:29 PM
AveragedPit 3 150m
Measured by:student
Sample bulk lot ref:
Thiruvadandhai
Sample Name:
Analysed:
Measured:
Sample Source & type:Wednesday, October 15, 2008 1:09:30 PM
S49 - AverageSOP Name:
Result Source:
Sensitivity:
Dispersant Name:Water Off
Size range:
Default
Particle RI:
1.330Result Emulation:
Absorption:0.020 to0.1
NormalAnalysis model:
2000.000
Dispersant RI:
1.520
General purposeParticle Name:
um
Tel := +[44] (0) 1684-892456 Fax +[44] (0) 1684-892789Malvern, UKMalvern Instruments Ltd.
Serial Number : MAL1022570Mastersizer 2000 Ver. 5.54
30 May 2011 8:28:31 AMRecord Number: 114File name: Thir Pit3

Result Analysis Report
Vol. Weighted Mean D[4,3]:
%
m²/g
um
Surface Weighted Mean D[3,2]:0.0116 630.063
d(0.9):
Accessory Name:
Span :1.266
umSpecific Surface Area:
22.96
Operator notes:
Uniformity:%Vol
Obscuration:
572.793 1038.479d(0.1): um
0.389
515.921
um313.233 d(0.5):
Volume
Particle Size Distribution
0.01 0.1 1 10 100 1000 3000
Particle Size (µm)
0
2
4
6
8
10
12
Vol
ume
(%)
S50 - Average, Wednesday, October 15, 2008 1:23:14 PM
Hydro 2000G (A)
Result units:
um
Concentration:1.9104
Weighted Residual:1.375 %
Size (µm)0.010
0.011
0.013
0.015
0.017
0.020
0.023
0.026
0.030
0.035
0.040
0.046
0.052
0.060
0.069
0.079
0.091
0.105
Volume In %
0.00
0.00
0.00
0.00
0.00
0.00
0.00
0.00
0.00
0.00
0.00
0.00
0.00
0.00
0.00
0.00
0.00
Size (µm)0.105
0.120
0.138
0.158
0.182
0.209
0.240
0.275
0.316
0.363
0.417
0.479
0.550
0.631
0.724
0.832
0.955
1.096
Volume In %
0.00
0.00
0.00
0.00
0.00
0.00
0.00
0.00
0.00
0.00
0.00
0.00
0.00
0.00
0.00
0.00
0.00
Size (µm)1.096
1.259
1.445
1.660
1.905
2.188
2.512
2.884
3.311
3.802
4.365
5.012
5.754
6.607
7.586
8.710
10.000
11.482
Volume In %
0.00
0.00
0.00
0.00
0.00
0.00
0.00
0.00
0.00
0.00
0.00
0.00
0.00
0.00
0.00
0.00
0.00
Size (µm)11.482
13.183
15.136
17.378
19.953
22.909
26.303
30.200
34.674
39.811
45.709
52.481
60.256
69.183
79.433
91.201
104.713
120.226
Volume In %
0.00
0.00
0.00
0.00
0.00
0.00
0.00
0.00
0.00
0.00
0.00
0.00
0.00
0.00
0.00
0.00
0.00
Size (µm)120.226
138.038
158.489
181.970
208.930
239.883
275.423
316.228
363.078
416.869
478.630
549.541
630.957
724.436
831.764
954.993
1096.478
1258.925
Volume In %
0.00
0.00
0.03
0.73
1.70
3.11
4.83
6.72
8.53
10.03
10.96
11.20
10.70
9.55
7.96
6.17
4.39
Size (µm)1258.925
1445.440
1659.587
1905.461
2187.762
2511.886
2884.032
3311.311
3801.894
4365.158
5011.872
5754.399
6606.934
7585.776
8709.636
10000.000
Volume In %
2.64
0.75
0.02
0.00
0.00
0.00
0.00
0.00
0.00
0.00
0.00
0.00
0.00
0.00
0.00
Wednesday, October 15, 2008 1:23:14 PM
AveragedPit 3 150m
Measured by:student
Sample bulk lot ref:
Thiruvadandhai
Sample Name:
Analysed:
Measured:
Sample Source & type:Wednesday, October 15, 2008 1:23:16 PM
S50 - AverageSOP Name:
Result Source:
Sensitivity:
Dispersant Name:Water Off
Size range:
Default
Particle RI:
1.330Result Emulation:
Absorption:0.020 to0.1
NormalAnalysis model:
2000.000
Dispersant RI:
1.520
General purposeParticle Name:
um
Tel := +[44] (0) 1684-892456 Fax +[44] (0) 1684-892789Malvern, UKMalvern Instruments Ltd.
Serial Number : MAL1022570Mastersizer 2000 Ver. 5.54
30 May 2011 8:28:43 AMRecord Number: 120File name: Thir Pit3

Result Analysis Report
Vol. Weighted Mean D[4,3]:
%
m²/g
um
Surface Weighted Mean D[3,2]:0.0117 619.101
d(0.9):
Accessory Name:
Span :1.232
umSpecific Surface Area:
22.38
Operator notes:
Uniformity:%Vol
Obscuration:
563.792 1009.845d(0.1): um
0.378
512.024
um315.369 d(0.5):
Volume
Particle Size Distribution
0.01 0.1 1 10 100 1000 3000
Particle Size (µm)
0
2
4
6
8
10
12
14
Vol
ume
(%)
S51 - Average, Wednesday, October 15, 2008 1:34:55 PM
Hydro 2000G (A)
Result units:
um
Concentration:1.8432
Weighted Residual:1.223 %
Size (µm)0.010
0.011
0.013
0.015
0.017
0.020
0.023
0.026
0.030
0.035
0.040
0.046
0.052
0.060
0.069
0.079
0.091
0.105
Volume In %
0.00
0.00
0.00
0.00
0.00
0.00
0.00
0.00
0.00
0.00
0.00
0.00
0.00
0.00
0.00
0.00
0.00
Size (µm)0.105
0.120
0.138
0.158
0.182
0.209
0.240
0.275
0.316
0.363
0.417
0.479
0.550
0.631
0.724
0.832
0.955
1.096
Volume In %
0.00
0.00
0.00
0.00
0.00
0.00
0.00
0.00
0.00
0.00
0.00
0.00
0.00
0.00
0.00
0.00
0.00
Size (µm)1.096
1.259
1.445
1.660
1.905
2.188
2.512
2.884
3.311
3.802
4.365
5.012
5.754
6.607
7.586
8.710
10.000
11.482
Volume In %
0.00
0.00
0.00
0.00
0.00
0.00
0.00
0.00
0.00
0.00
0.00
0.00
0.00
0.00
0.00
0.00
0.00
Size (µm)11.482
13.183
15.136
17.378
19.953
22.909
26.303
30.200
34.674
39.811
45.709
52.481
60.256
69.183
79.433
91.201
104.713
120.226
Volume In %
0.00
0.00
0.00
0.00
0.00
0.00
0.00
0.00
0.00
0.00
0.00
0.00
0.00
0.00
0.00
0.00
0.00
Size (µm)120.226
138.038
158.489
181.970
208.930
239.883
275.423
316.228
363.078
416.869
478.630
549.541
630.957
724.436
831.764
954.993
1096.478
1258.925
Volume In %
0.00
0.00
0.02
0.64
1.58
3.02
4.85
6.91
8.89
10.50
11.44
11.56
10.86
9.48
7.69
5.79
3.96
Size (µm)1258.925
1445.440
1659.587
1905.461
2187.762
2511.886
2884.032
3311.311
3801.894
4365.158
5011.872
5754.399
6606.934
7585.776
8709.636
10000.000
Volume In %
2.25
0.57
0.01
0.00
0.00
0.00
0.00
0.00
0.00
0.00
0.00
0.00
0.00
0.00
0.00
Wednesday, October 15, 2008 1:34:55 PM
AveragedPit 4
Measured by:student
Sample bulk lot ref:
Thiruvadandhai
Sample Name:
Analysed:
Measured:
Sample Source & type:Wednesday, October 15, 2008 1:34:56 PM
S51 - AverageSOP Name:
Result Source:
Sensitivity:
Dispersant Name:Water Off
Size range:
Default
Particle RI:
1.330Result Emulation:
Absorption:0.020 to0.1
NormalAnalysis model:
2000.000
Dispersant RI:
1.520
General purposeParticle Name:
um
Tel := +[44] (0) 1684-892456 Fax +[44] (0) 1684-892789Malvern, UKMalvern Instruments Ltd.
Serial Number : MAL1022570Mastersizer 2000 Ver. 5.54
30 May 2011 8:29:14 AMRecord Number: 6File name: Thir Pit4

Result Analysis Report
Vol. Weighted Mean D[4,3]:
%
m²/g
um
Surface Weighted Mean D[3,2]:0.0381 494.933
d(0.9):
Accessory Name:
Span :1.574
umSpecific Surface Area:
23.72
Operator notes:
Uniformity:%Vol
Obscuration:
444.016 891.282d(0.1): um
0.491
157.382
um192.277 d(0.5):
Volume
Particle Size Distribution
0.01 0.1 1 10 100 1000 3000
Particle Size (µm)
0 1 2 3 4 5 6 7 8 9
10 11
Vol
ume
(%)
S52 - Average, Wednesday, October 15, 2008 1:45:59 PM
Hydro 2000G (A)
Result units:
um
Concentration:0.5757
Weighted Residual:0.777 %
Size (µm)0.010
0.011
0.013
0.015
0.017
0.020
0.023
0.026
0.030
0.035
0.040
0.046
0.052
0.060
0.069
0.079
0.091
0.105
Volume In %
0.00
0.00
0.00
0.00
0.00
0.00
0.00
0.00
0.00
0.00
0.00
0.00
0.00
0.00
0.00
0.00
0.00
Size (µm)0.105
0.120
0.138
0.158
0.182
0.209
0.240
0.275
0.316
0.363
0.417
0.479
0.550
0.631
0.724
0.832
0.955
1.096
Volume In %
0.00
0.00
0.00
0.00
0.00
0.00
0.00
0.00
0.00
0.00
0.00
0.00
0.00
0.00
0.00
0.00
0.00
Size (µm)1.096
1.259
1.445
1.660
1.905
2.188
2.512
2.884
3.311
3.802
4.365
5.012
5.754
6.607
7.586
8.710
10.000
11.482
Volume In %
0.00
0.00
0.00
0.00
0.04
0.06
0.07
0.08
0.09
0.10
0.11
0.12
0.13
0.14
0.15
0.15
0.15
Size (µm)11.482
13.183
15.136
17.378
19.953
22.909
26.303
30.200
34.674
39.811
45.709
52.481
60.256
69.183
79.433
91.201
104.713
120.226
Volume In %
0.15
0.15
0.15
0.15
0.16
0.17
0.20
0.23
0.27
0.30
0.31
0.30
0.26
0.22
0.18
0.20
0.34
Size (µm)120.226
138.038
158.489
181.970
208.930
239.883
275.423
316.228
363.078
416.869
478.630
549.541
630.957
724.436
831.764
954.993
1096.478
1258.925
Volume In %
0.64
1.17
1.96
3.01
4.25
5.61
6.94
8.09
8.92
9.32
9.23
8.68
7.73
6.51
5.17
3.84
2.50
Size (µm)1258.925
1445.440
1659.587
1905.461
2187.762
2511.886
2884.032
3311.311
3801.894
4365.158
5011.872
5754.399
6606.934
7585.776
8709.636
10000.000
Volume In %
1.20
0.04
0.00
0.00
0.00
0.00
0.00
0.00
0.00
0.00
0.00
0.00
0.00
0.00
0.00
Wednesday, October 15, 2008 1:45:59 PM
AveragedPit 4
Measured by:student
Sample bulk lot ref:
Thiruvadandhai
Sample Name:
Analysed:
Measured:
Sample Source & type:Wednesday, October 15, 2008 1:46:01 PM
S52 - AverageSOP Name:
Result Source:
Sensitivity:
Dispersant Name:Water Off
Size range:
Default
Particle RI:
1.330Result Emulation:
Absorption:0.020 to0.1
NormalAnalysis model:
2000.000
Dispersant RI:
1.520
General purposeParticle Name:
um
Tel := +[44] (0) 1684-892456 Fax +[44] (0) 1684-892789Malvern, UKMalvern Instruments Ltd.
Serial Number : MAL1022570Mastersizer 2000 Ver. 5.54
30 May 2011 8:29:29 AMRecord Number: 12File name: Thir Pit4

Result Analysis Report
Vol. Weighted Mean D[4,3]:
%
m²/g
um
Surface Weighted Mean D[3,2]:0.014 534.014
d(0.9):
Accessory Name:
Span :1.330
umSpecific Surface Area:
22.01
Operator notes:
Uniformity:%Vol
Obscuration:
480.998 896.299d(0.1): um
0.407
429.306
um256.337 d(0.5):
Volume
Particle Size Distribution
0.01 0.1 1 10 100 1000 3000
Particle Size (µm)
0
2
4
6
8
10
12
Vol
ume
(%)
S53 - Average, Wednesday, October 15, 2008 1:55:23 PM
Hydro 2000G (A)
Result units:
um
Concentration:1.5154
Weighted Residual:1.035 %
Size (µm)0.010
0.011
0.013
0.015
0.017
0.020
0.023
0.026
0.030
0.035
0.040
0.046
0.052
0.060
0.069
0.079
0.091
0.105
Volume In %
0.00
0.00
0.00
0.00
0.00
0.00
0.00
0.00
0.00
0.00
0.00
0.00
0.00
0.00
0.00
0.00
0.00
Size (µm)0.105
0.120
0.138
0.158
0.182
0.209
0.240
0.275
0.316
0.363
0.417
0.479
0.550
0.631
0.724
0.832
0.955
1.096
Volume In %
0.00
0.00
0.00
0.00
0.00
0.00
0.00
0.00
0.00
0.00
0.00
0.00
0.00
0.00
0.00
0.00
0.00
Size (µm)1.096
1.259
1.445
1.660
1.905
2.188
2.512
2.884
3.311
3.802
4.365
5.012
5.754
6.607
7.586
8.710
10.000
11.482
Volume In %
0.00
0.00
0.00
0.00
0.00
0.00
0.00
0.00
0.00
0.00
0.00
0.00
0.00
0.00
0.00
0.00
0.00
Size (µm)11.482
13.183
15.136
17.378
19.953
22.909
26.303
30.200
34.674
39.811
45.709
52.481
60.256
69.183
79.433
91.201
104.713
120.226
Volume In %
0.00
0.00
0.00
0.00
0.00
0.00
0.00
0.00
0.00
0.00
0.00
0.00
0.00
0.00
0.00
0.00
0.00
Size (µm)120.226
138.038
158.489
181.970
208.930
239.883
275.423
316.228
363.078
416.869
478.630
549.541
630.957
724.436
831.764
954.993
1096.478
1258.925
Volume In %
0.03
0.39
1.15
2.29
3.74
5.45
7.18
8.77
9.97
10.63
10.66
10.05
8.92
7.43
5.78
4.15
2.52
Size (µm)1258.925
1445.440
1659.587
1905.461
2187.762
2511.886
2884.032
3311.311
3801.894
4365.158
5011.872
5754.399
6606.934
7585.776
8709.636
10000.000
Volume In %
0.86
0.02
0.00
0.00
0.00
0.00
0.00
0.00
0.00
0.00
0.00
0.00
0.00
0.00
0.00
Wednesday, October 15, 2008 1:55:23 PM
AveragedPit 4
Measured by:student
Sample bulk lot ref:
Thiruvadandhai
Sample Name:
Analysed:
Measured:
Sample Source & type:Wednesday, October 15, 2008 1:55:24 PM
S53 - AverageSOP Name:
Result Source:
Sensitivity:
Dispersant Name:Water Off
Size range:
Default
Particle RI:
1.330Result Emulation:
Absorption:0.020 to0.1
NormalAnalysis model:
2000.000
Dispersant RI:
1.520
General purposeParticle Name:
um
Tel := +[44] (0) 1684-892456 Fax +[44] (0) 1684-892789Malvern, UKMalvern Instruments Ltd.
Serial Number : MAL1022570Mastersizer 2000 Ver. 5.54
30 May 2011 8:29:44 AMRecord Number: 6File name: Thir Pit5

Result Analysis Report
Vol. Weighted Mean D[4,3]:
%
m²/g
um
Surface Weighted Mean D[3,2]:0.0128 639.487
d(0.9):
Accessory Name:
Span :1.381
umSpecific Surface Area:
25.52
Operator notes:
Uniformity:%Vol
Obscuration:
576.546 1090.376d(0.1): um
0.426
467.221
um294.252 d(0.5):
Volume
Particle Size Distribution
0.01 0.1 1 10 100 1000 3000
Particle Size (µm)
0
2
4
6
8
10
12
Vol
ume
(%)
S54 - Average, Wednesday, October 15, 2008 2:03:25 PM
Hydro 2000G (A)
Result units:
um
Concentration:1.9560
Weighted Residual:1.400 %
Size (µm)0.010
0.011
0.013
0.015
0.017
0.020
0.023
0.026
0.030
0.035
0.040
0.046
0.052
0.060
0.069
0.079
0.091
0.105
Volume In %
0.00
0.00
0.00
0.00
0.00
0.00
0.00
0.00
0.00
0.00
0.00
0.00
0.00
0.00
0.00
0.00
0.00
Size (µm)0.105
0.120
0.138
0.158
0.182
0.209
0.240
0.275
0.316
0.363
0.417
0.479
0.550
0.631
0.724
0.832
0.955
1.096
Volume In %
0.00
0.00
0.00
0.00
0.00
0.00
0.00
0.00
0.00
0.00
0.00
0.00
0.00
0.00
0.00
0.00
0.00
Size (µm)1.096
1.259
1.445
1.660
1.905
2.188
2.512
2.884
3.311
3.802
4.365
5.012
5.754
6.607
7.586
8.710
10.000
11.482
Volume In %
0.00
0.00
0.00
0.00
0.00
0.00
0.00
0.00
0.00
0.00
0.00
0.00
0.00
0.00
0.00
0.01
0.01
Size (µm)11.482
13.183
15.136
17.378
19.953
22.909
26.303
30.200
34.674
39.811
45.709
52.481
60.256
69.183
79.433
91.201
104.713
120.226
Volume In %
0.01
0.01
0.01
0.00
0.00
0.00
0.00
0.01
0.07
0.09
0.12
0.14
0.15
0.13
0.06
0.00
0.00
Size (µm)120.226
138.038
158.489
181.970
208.930
239.883
275.423
316.228
363.078
416.869
478.630
549.541
630.957
724.436
831.764
954.993
1096.478
1258.925
Volume In %
0.00
0.12
0.48
1.11
2.05
3.30
4.79
6.40
7.95
9.25
10.10
10.39
10.06
9.18
7.87
6.33
4.77
Size (µm)1258.925
1445.440
1659.587
1905.461
2187.762
2511.886
2884.032
3311.311
3801.894
4365.158
5011.872
5754.399
6606.934
7585.776
8709.636
10000.000
Volume In %
3.19
1.70
0.12
0.00
0.00
0.00
0.00
0.00
0.00
0.00
0.00
0.00
0.00
0.00
0.00
Wednesday, October 15, 2008 2:03:25 PM
AveragedPit 4
Measured by:student
Sample bulk lot ref:
Thiruvadandhai
Sample Name:
Analysed:
Measured:
Sample Source & type:Wednesday, October 15, 2008 2:03:26 PM
S54 - AverageSOP Name:
Result Source:
Sensitivity:
Dispersant Name:Water Off
Size range:
Default
Particle RI:
1.330Result Emulation:
Absorption:0.020 to0.1
NormalAnalysis model:
2000.000
Dispersant RI:
1.520
General purposeParticle Name:
um
Tel := +[44] (0) 1684-892456 Fax +[44] (0) 1684-892789Malvern, UKMalvern Instruments Ltd.
Serial Number : MAL1022570Mastersizer 2000 Ver. 5.54
30 May 2011 8:29:54 AMRecord Number: 12File name: Thir Pit5

Result Analysis Report
Vol. Weighted Mean D[4,3]:
%
m²/g
um
Surface Weighted Mean D[3,2]:0.0107 701.929
d(0.9):
Accessory Name:
Span :1.343
umSpecific Surface Area:
19.48
Operator notes:
Uniformity:%Vol
Obscuration:
632.657 1182.238d(0.1): um
0.411
560.610
um332.563 d(0.5):
Volume
Particle Size Distribution
0.01 0.1 1 10 100 1000 3000
Particle Size (µm)
0
2
4
6
8
10
12
Vol
ume
(%)
S55 - Average, Wednesday, October 15, 2008 2:12:29 PM
Hydro 2000G (A)
Result units:
um
Concentration:1.7253
Weighted Residual:1.512 %
Size (µm)0.010
0.011
0.013
0.015
0.017
0.020
0.023
0.026
0.030
0.035
0.040
0.046
0.052
0.060
0.069
0.079
0.091
0.105
Volume In %
0.00
0.00
0.00
0.00
0.00
0.00
0.00
0.00
0.00
0.00
0.00
0.00
0.00
0.00
0.00
0.00
0.00
Size (µm)0.105
0.120
0.138
0.158
0.182
0.209
0.240
0.275
0.316
0.363
0.417
0.479
0.550
0.631
0.724
0.832
0.955
1.096
Volume In %
0.00
0.00
0.00
0.00
0.00
0.00
0.00
0.00
0.00
0.00
0.00
0.00
0.00
0.00
0.00
0.00
0.00
Size (µm)1.096
1.259
1.445
1.660
1.905
2.188
2.512
2.884
3.311
3.802
4.365
5.012
5.754
6.607
7.586
8.710
10.000
11.482
Volume In %
0.00
0.00
0.00
0.00
0.00
0.00
0.00
0.00
0.00
0.00
0.00
0.00
0.00
0.00
0.00
0.00
0.00
Size (µm)11.482
13.183
15.136
17.378
19.953
22.909
26.303
30.200
34.674
39.811
45.709
52.481
60.256
69.183
79.433
91.201
104.713
120.226
Volume In %
0.00
0.00
0.00
0.00
0.00
0.00
0.00
0.00
0.00
0.00
0.00
0.00
0.00
0.00
0.00
0.00
0.00
Size (µm)120.226
138.038
158.489
181.970
208.930
239.883
275.423
316.228
363.078
416.869
478.630
549.541
630.957
724.436
831.764
954.993
1096.478
1258.925
Volume In %
0.00
0.01
0.09
0.58
1.31
2.41
3.81
5.44
7.11
8.66
9.85
10.52
10.57
9.99
8.88
7.41
5.78
Size (µm)1258.925
1445.440
1659.587
1905.461
2187.762
2511.886
2884.032
3311.311
3801.894
4365.158
5011.872
5754.399
6606.934
7585.776
8709.636
10000.000
Volume In %
4.16
2.57
0.81
0.03
0.00
0.00
0.00
0.00
0.00
0.00
0.00
0.00
0.00
0.00
0.00
Wednesday, October 15, 2008 2:12:29 PM
AveragedPit 4
Measured by:student
Sample bulk lot ref:
Thiruvadandhai
Sample Name:
Analysed:
Measured:
Sample Source & type:Wednesday, October 15, 2008 2:12:31 PM
S55 - AverageSOP Name:
Result Source:
Sensitivity:
Dispersant Name:Water Off
Size range:
Default
Particle RI:
1.330Result Emulation:
Absorption:0.020 to0.1
NormalAnalysis model:
2000.000
Dispersant RI:
1.520
General purposeParticle Name:
um
Tel := +[44] (0) 1684-892456 Fax +[44] (0) 1684-892789Malvern, UKMalvern Instruments Ltd.
Serial Number : MAL1022570Mastersizer 2000 Ver. 5.54
30 May 2011 8:30:09 AMRecord Number: 6File name: Thir Pit6

Result Analysis Report
Vol. Weighted Mean D[4,3]:
%
m²/g
um
Surface Weighted Mean D[3,2]:0.0111 673.798
d(0.9):
Accessory Name:
Span :1.335
umSpecific Surface Area:
19.01
Operator notes:
Uniformity:%Vol
Obscuration:
607.725 1133.183d(0.1): um
0.41
539.880
um321.722 d(0.5):
Volume
Particle Size Distribution
0.01 0.1 1 10 100 1000 3000
Particle Size (µm)
0
2
4
6
8
10
12
Vol
ume
(%)
S56 - Average, Wednesday, October 15, 2008 2:22:32 PM
Hydro 2000G (A)
Result units:
um
Concentration:1.6164
Weighted Residual:1.564 %
Size (µm)0.010
0.011
0.013
0.015
0.017
0.020
0.023
0.026
0.030
0.035
0.040
0.046
0.052
0.060
0.069
0.079
0.091
0.105
Volume In %
0.00
0.00
0.00
0.00
0.00
0.00
0.00
0.00
0.00
0.00
0.00
0.00
0.00
0.00
0.00
0.00
0.00
Size (µm)0.105
0.120
0.138
0.158
0.182
0.209
0.240
0.275
0.316
0.363
0.417
0.479
0.550
0.631
0.724
0.832
0.955
1.096
Volume In %
0.00
0.00
0.00
0.00
0.00
0.00
0.00
0.00
0.00
0.00
0.00
0.00
0.00
0.00
0.00
0.00
0.00
Size (µm)1.096
1.259
1.445
1.660
1.905
2.188
2.512
2.884
3.311
3.802
4.365
5.012
5.754
6.607
7.586
8.710
10.000
11.482
Volume In %
0.00
0.00
0.00
0.00
0.00
0.00
0.00
0.00
0.00
0.00
0.00
0.00
0.00
0.00
0.00
0.00
0.00
Size (µm)11.482
13.183
15.136
17.378
19.953
22.909
26.303
30.200
34.674
39.811
45.709
52.481
60.256
69.183
79.433
91.201
104.713
120.226
Volume In %
0.00
0.00
0.00
0.00
0.00
0.00
0.00
0.00
0.00
0.00
0.00
0.00
0.00
0.00
0.00
0.00
0.00
Size (µm)120.226
138.038
158.489
181.970
208.930
239.883
275.423
316.228
363.078
416.869
478.630
549.541
630.957
724.436
831.764
954.993
1096.478
1258.925
Volume In %
0.00
0.02
0.19
0.72
1.52
2.71
4.20
5.90
7.61
9.13
10.21
10.71
10.55
9.76
8.47
6.90
5.27
Size (µm)1258.925
1445.440
1659.587
1905.461
2187.762
2511.886
2884.032
3311.311
3801.894
4365.158
5011.872
5754.399
6606.934
7585.776
8709.636
10000.000
Volume In %
3.66
2.18
0.29
0.00
0.00
0.00
0.00
0.00
0.00
0.00
0.00
0.00
0.00
0.00
0.00
Wednesday, October 15, 2008 2:22:32 PM
AveragedPit 7
Measured by:student
Sample bulk lot ref:
Thiruvadandhai
Sample Name:
Analysed:
Measured:
Sample Source & type:Wednesday, October 15, 2008 2:22:34 PM
S56 - AverageSOP Name:
Result Source:
Sensitivity:
Dispersant Name:Water Off
Size range:
Default
Particle RI:
1.330Result Emulation:
Absorption:0.020 to0.1
NormalAnalysis model:
2000.000
Dispersant RI:
1.520
General purposeParticle Name:
um
Tel := +[44] (0) 1684-892456 Fax +[44] (0) 1684-892789Malvern, UKMalvern Instruments Ltd.
Serial Number : MAL1022570Mastersizer 2000 Ver. 5.54
30 May 2011 8:30:27 AMRecord Number: 6File name: Thir Pit7

Result Analysis Report
Vol. Weighted Mean D[4,3]:
%
m²/g
um
Surface Weighted Mean D[3,2]:0.0156 503.518
d(0.9):
Accessory Name:
Span :1.299
umSpecific Surface Area:
22.22
Operator notes:
Uniformity:%Vol
Obscuration:
462.479 838.847d(0.1): um
0.401
383.446
um238.210 d(0.5):
Volume
Particle Size Distribution
0.01 0.1 1 10 100 1000 3000
Particle Size (µm)
0
2
4
6
8
10
12
Vol
ume
(%)
S57 - Average, Wednesday, October 15, 2008 2:31:01 PM
Hydro 2000G (A)
Result units:
um
Concentration:1.3662
Weighted Residual:1.012 %
Size (µm)0.010
0.011
0.013
0.015
0.017
0.020
0.023
0.026
0.030
0.035
0.040
0.046
0.052
0.060
0.069
0.079
0.091
0.105
Volume In %
0.00
0.00
0.00
0.00
0.00
0.00
0.00
0.00
0.00
0.00
0.00
0.00
0.00
0.00
0.00
0.00
0.00
Size (µm)0.105
0.120
0.138
0.158
0.182
0.209
0.240
0.275
0.316
0.363
0.417
0.479
0.550
0.631
0.724
0.832
0.955
1.096
Volume In %
0.00
0.00
0.00
0.00
0.00
0.00
0.00
0.00
0.00
0.00
0.00
0.00
0.00
0.00
0.00
0.00
0.00
Size (µm)1.096
1.259
1.445
1.660
1.905
2.188
2.512
2.884
3.311
3.802
4.365
5.012
5.754
6.607
7.586
8.710
10.000
11.482
Volume In %
0.00
0.00
0.00
0.00
0.00
0.00
0.00
0.00
0.00
0.00
0.00
0.00
0.00
0.00
0.00
0.00
0.00
Size (µm)11.482
13.183
15.136
17.378
19.953
22.909
26.303
30.200
34.674
39.811
45.709
52.481
60.256
69.183
79.433
91.201
104.713
120.226
Volume In %
0.00
0.00
0.00
0.00
0.00
0.00
0.00
0.01
0.07
0.11
0.15
0.18
0.20
0.18
0.15
0.14
0.18
Size (µm)120.226
138.038
158.489
181.970
208.930
239.883
275.423
316.228
363.078
416.869
478.630
549.541
630.957
724.436
831.764
954.993
1096.478
1258.925
Volume In %
0.35
0.75
1.44
2.48
3.84
5.49
7.21
8.85
10.12
10.83
10.84
10.14
8.82
7.10
5.23
3.46
1.66
Size (µm)1258.925
1445.440
1659.587
1905.461
2187.762
2511.886
2884.032
3311.311
3801.894
4365.158
5011.872
5754.399
6606.934
7585.776
8709.636
10000.000
Volume In %
0.03
0.00
0.00
0.00
0.00
0.00
0.00
0.00
0.00
0.00
0.00
0.00
0.00
0.00
0.00
Wednesday, October 15, 2008 2:31:01 PM
AveragedOld Dune
Measured by:student
Sample bulk lot ref:
Thiruvadandhai
Sample Name:
Analysed:
Measured:
Sample Source & type:Wednesday, October 15, 2008 2:31:03 PM
S57 - AverageSOP Name:
Result Source:
Sensitivity:
Dispersant Name:Water Off
Size range:
Default
Particle RI:
1.330Result Emulation:
Absorption:0.020 to0.1
NormalAnalysis model:
2000.000
Dispersant RI:
1.520
General purposeParticle Name:
um
Tel := +[44] (0) 1684-892456 Fax +[44] (0) 1684-892789Malvern, UKMalvern Instruments Ltd.
Serial Number : MAL1022570Mastersizer 2000 Ver. 5.54
30 May 2011 8:20:52 AMRecord Number: 6File name: Thir OldDune

Result Analysis Report
Vol. Weighted Mean D[4,3]:
%
m²/g
um
Surface Weighted Mean D[3,2]:0.0189 430.984
d(0.9):
Accessory Name:
Span :1.339
umSpecific Surface Area:
26.80
Operator notes:
Uniformity:%Vol
Obscuration:
391.754 727.107d(0.1): um
0.415
317.527
um202.404 d(0.5):
Volume
Particle Size Distribution
0.01 0.1 1 10 100 1000 3000
Particle Size (µm)
0
2
4
6
8
10
12
Vol
ume
(%)
S58 - Average, Wednesday, October 15, 2008 2:44:32 PM
Hydro 2000G (A)
Result units:
um
Concentration:1.4033
Weighted Residual:0.815 %
Size (µm)0.010
0.011
0.013
0.015
0.017
0.020
0.023
0.026
0.030
0.035
0.040
0.046
0.052
0.060
0.069
0.079
0.091
0.105
Volume In %
0.00
0.00
0.00
0.00
0.00
0.00
0.00
0.00
0.00
0.00
0.00
0.00
0.00
0.00
0.00
0.00
0.00
Size (µm)0.105
0.120
0.138
0.158
0.182
0.209
0.240
0.275
0.316
0.363
0.417
0.479
0.550
0.631
0.724
0.832
0.955
1.096
Volume In %
0.00
0.00
0.00
0.00
0.00
0.00
0.00
0.00
0.00
0.00
0.00
0.00
0.00
0.00
0.00
0.00
0.00
Size (µm)1.096
1.259
1.445
1.660
1.905
2.188
2.512
2.884
3.311
3.802
4.365
5.012
5.754
6.607
7.586
8.710
10.000
11.482
Volume In %
0.00
0.00
0.00
0.00
0.00
0.00
0.00
0.00
0.00
0.00
0.00
0.00
0.00
0.00
0.00
0.00
0.00
Size (µm)11.482
13.183
15.136
17.378
19.953
22.909
26.303
30.200
34.674
39.811
45.709
52.481
60.256
69.183
79.433
91.201
104.713
120.226
Volume In %
0.00
0.00
0.00
0.00
0.02
0.08
0.10
0.15
0.19
0.23
0.23
0.20
0.14
0.02
0.00
0.03
0.26
Size (µm)120.226
138.038
158.489
181.970
208.930
239.883
275.423
316.228
363.078
416.869
478.630
549.541
630.957
724.436
831.764
954.993
1096.478
1258.925
Volume In %
0.76
1.61
2.80
4.32
6.00
7.69
9.15
10.19
10.63
10.43
9.61
8.30
6.70
4.98
3.39
1.67
0.12
Size (µm)1258.925
1445.440
1659.587
1905.461
2187.762
2511.886
2884.032
3311.311
3801.894
4365.158
5011.872
5754.399
6606.934
7585.776
8709.636
10000.000
Volume In %
0.00
0.00
0.00
0.00
0.00
0.00
0.00
0.00
0.00
0.00
0.00
0.00
0.00
0.00
0.00
Wednesday, October 15, 2008 2:44:32 PM
EditedPit 1
Measured by:student
Sample bulk lot ref:
Kovalam
Sample Name:
Analysed:
Measured:
Sample Source & type:Wednesday, October 15, 2008 2:44:34 PM
S58 - AverageSOP Name:
Result Source:
Sensitivity:
Dispersant Name:Water Off
Size range:
Default
Particle RI:
1.330Result Emulation:
Absorption:0.020 to0.1
NormalAnalysis model:
2000.000
Dispersant RI:
1.520
General purposeParticle Name:
um
Tel := +[44] (0) 1684-892456 Fax +[44] (0) 1684-892789Malvern, UKMalvern Instruments Ltd.
Serial Number : MAL1022570Mastersizer 2000 Ver. 5.54
30 May 2011 8:00:21 AMRecord Number: 12File name: Kov Pit1

Result Analysis Report
Vol. Weighted Mean D[4,3]:
%
m²/g
um
Surface Weighted Mean D[3,2]:0.0154 514.028
d(0.9):
Accessory Name:
Span :1.343
umSpecific Surface Area:
22.64
Operator notes:
Uniformity:%Vol
Obscuration:
465.599 866.928d(0.1): um
0.413
390.733
um241.727 d(0.5):
Volume
Particle Size Distribution
0.01 0.1 1 10 100 1000 3000
Particle Size (µm)
0
2
4
6
8
10
12
Vol
ume
(%)
S59 - Average, Wednesday, October 15, 2008 2:54:19 PM
Hydro 2000G (A)
Result units:
um
Concentration:1.4225
Weighted Residual:1.015 %
Size (µm)0.010
0.011
0.013
0.015
0.017
0.020
0.023
0.026
0.030
0.035
0.040
0.046
0.052
0.060
0.069
0.079
0.091
0.105
Volume In %
0.00
0.00
0.00
0.00
0.00
0.00
0.00
0.00
0.00
0.00
0.00
0.00
0.00
0.00
0.00
0.00
0.00
Size (µm)0.105
0.120
0.138
0.158
0.182
0.209
0.240
0.275
0.316
0.363
0.417
0.479
0.550
0.631
0.724
0.832
0.955
1.096
Volume In %
0.00
0.00
0.00
0.00
0.00
0.00
0.00
0.00
0.00
0.00
0.00
0.00
0.00
0.00
0.00
0.00
0.00
Size (µm)1.096
1.259
1.445
1.660
1.905
2.188
2.512
2.884
3.311
3.802
4.365
5.012
5.754
6.607
7.586
8.710
10.000
11.482
Volume In %
0.00
0.00
0.00
0.00
0.00
0.00
0.00
0.00
0.00
0.00
0.00
0.00
0.00
0.00
0.00
0.00
0.00
Size (µm)11.482
13.183
15.136
17.378
19.953
22.909
26.303
30.200
34.674
39.811
45.709
52.481
60.256
69.183
79.433
91.201
104.713
120.226
Volume In %
0.00
0.00
0.00
0.00
0.00
0.00
0.01
0.06
0.10
0.14
0.16
0.16
0.14
0.02
0.00
0.00
0.01
Size (µm)120.226
138.038
158.489
181.970
208.930
239.883
275.423
316.228
363.078
416.869
478.630
549.541
630.957
724.436
831.764
954.993
1096.478
1258.925
Volume In %
0.18
0.67
1.45
2.60
4.03
5.68
7.34
8.85
9.97
10.55
10.50
9.83
8.64
7.10
5.43
3.79
2.14
Size (µm)1258.925
1445.440
1659.587
1905.461
2187.762
2511.886
2884.032
3311.311
3801.894
4365.158
5011.872
5754.399
6606.934
7585.776
8709.636
10000.000
Volume In %
0.45
0.00
0.00
0.00
0.00
0.00
0.00
0.00
0.00
0.00
0.00
0.00
0.00
0.00
0.00
Wednesday, October 15, 2008 2:54:19 PM
EditedPit 1
Measured by:student
Sample bulk lot ref:
Kovalam
Sample Name:
Analysed:
Measured:
Sample Source & type:Wednesday, October 15, 2008 2:54:20 PM
S59 - AverageSOP Name:
Result Source:
Sensitivity:
Dispersant Name:Water Off
Size range:
Default
Particle RI:
1.330Result Emulation:
Absorption:0.020 to0.1
NormalAnalysis model:
2000.000
Dispersant RI:
1.520
General purposeParticle Name:
um
Tel := +[44] (0) 1684-892456 Fax +[44] (0) 1684-892789Malvern, UKMalvern Instruments Ltd.
Serial Number : MAL1022570Mastersizer 2000 Ver. 5.54
30 May 2011 8:00:35 AMRecord Number: 24File name: Kov Pit1

Result Analysis Report
Vol. Weighted Mean D[4,3]:
%
m²/g
um
Surface Weighted Mean D[3,2]:0.013 569.243
d(0.9):
Accessory Name:
Span :1.289
umSpecific Surface Area:
21.70
Operator notes:
Uniformity:%Vol
Obscuration:
515.912 944.585d(0.1): um
0.397
463.227
um279.798 d(0.5):
Volume
Particle Size Distribution
0.01 0.1 1 10 100 1000 3000
Particle Size (µm)
0
2
4
6
8
10
12
Vol
ume
(%)
S60 - Average, Wednesday, October 15, 2008 3:04:45 PM
Hydro 2000G (A)
Result units:
um
Concentration:1.6091
Weighted Residual:1.289 %
Size (µm)0.010
0.011
0.013
0.015
0.017
0.020
0.023
0.026
0.030
0.035
0.040
0.046
0.052
0.060
0.069
0.079
0.091
0.105
Volume In %
0.00
0.00
0.00
0.00
0.00
0.00
0.00
0.00
0.00
0.00
0.00
0.00
0.00
0.00
0.00
0.00
0.00
Size (µm)0.105
0.120
0.138
0.158
0.182
0.209
0.240
0.275
0.316
0.363
0.417
0.479
0.550
0.631
0.724
0.832
0.955
1.096
Volume In %
0.00
0.00
0.00
0.00
0.00
0.00
0.00
0.00
0.00
0.00
0.00
0.00
0.00
0.00
0.00
0.00
0.00
Size (µm)1.096
1.259
1.445
1.660
1.905
2.188
2.512
2.884
3.311
3.802
4.365
5.012
5.754
6.607
7.586
8.710
10.000
11.482
Volume In %
0.00
0.00
0.00
0.00
0.00
0.00
0.00
0.00
0.00
0.00
0.00
0.00
0.00
0.00
0.00
0.00
0.00
Size (µm)11.482
13.183
15.136
17.378
19.953
22.909
26.303
30.200
34.674
39.811
45.709
52.481
60.256
69.183
79.433
91.201
104.713
120.226
Volume In %
0.00
0.00
0.00
0.00
0.00
0.00
0.00
0.00
0.00
0.00
0.00
0.00
0.00
0.00
0.00
0.00
0.00
Size (µm)120.226
138.038
158.489
181.970
208.930
239.883
275.423
316.228
363.078
416.869
478.630
549.541
630.957
724.436
831.764
954.993
1096.478
1258.925
Volume In %
0.00
0.04
0.61
1.50
2.80
4.44
6.25
8.07
9.61
10.67
11.07
10.75
9.78
8.30
6.56
4.86
3.15
Size (µm)1258.925
1445.440
1659.587
1905.461
2187.762
2511.886
2884.032
3311.311
3801.894
4365.158
5011.872
5754.399
6606.934
7585.776
8709.636
10000.000
Volume In %
1.48
0.05
0.00
0.00
0.00
0.00
0.00
0.00
0.00
0.00
0.00
0.00
0.00
0.00
0.00
Wednesday, October 15, 2008 3:04:45 PM
AveragedPit 1
Measured by:student
Sample bulk lot ref:
Kovalam
Sample Name:
Analysed:
Measured:
Sample Source & type:Wednesday, October 15, 2008 3:04:46 PM
S60 - AverageSOP Name:
Result Source:
Sensitivity:
Dispersant Name:Water Off
Size range:
Default
Particle RI:
1.330Result Emulation:
Absorption:0.020 to0.1
NormalAnalysis model:
2000.000
Dispersant RI:
1.520
General purposeParticle Name:
um
Tel := +[44] (0) 1684-892456 Fax +[44] (0) 1684-892789Malvern, UKMalvern Instruments Ltd.
Serial Number : MAL1022570Mastersizer 2000 Ver. 5.54
30 May 2011 8:00:50 AMRecord Number: 30File name: Kov Pit1

Result Analysis Report
Vol. Weighted Mean D[4,3]:
%
m²/g
um
Surface Weighted Mean D[3,2]:0.018 434.807
d(0.9):
Accessory Name:
Span :1.327
umSpecific Surface Area:
23.92
Operator notes:
Uniformity:%Vol
Obscuration:
394.371 730.429
Average of 4 measurements from Kov Pit1
d(0.1): um
0.409
334.232
um206.963 d(0.5):
Volume
Particle Size Distribution
0.01 0.1 1 10 100 1000 3000
Particle Size (µm)
0
2
4
6
8
10
12
Vol
ume
(%)
S61 - Average, Wednesday, October 15, 2008 3:12:40 PM
Hydro 2000G (A)
Result units:
um
Concentration:1.2955
Weighted Residual:0.793 %
Size (µm)0.010
0.011
0.013
0.015
0.017
0.020
0.023
0.026
0.030
0.035
0.040
0.046
0.052
0.060
0.069
0.079
0.091
0.105
Volume In %
0.00
0.00
0.00
0.00
0.00
0.00
0.00
0.00
0.00
0.00
0.00
0.00
0.00
0.00
0.00
0.00
0.00
Size (µm)0.105
0.120
0.138
0.158
0.182
0.209
0.240
0.275
0.316
0.363
0.417
0.479
0.550
0.631
0.724
0.832
0.955
1.096
Volume In %
0.00
0.00
0.00
0.00
0.00
0.00
0.00
0.00
0.00
0.00
0.00
0.00
0.00
0.00
0.00
0.00
0.00
Size (µm)1.096
1.259
1.445
1.660
1.905
2.188
2.512
2.884
3.311
3.802
4.365
5.012
5.754
6.607
7.586
8.710
10.000
11.482
Volume In %
0.00
0.00
0.00
0.00
0.00
0.00
0.00
0.00
0.00
0.00
0.00
0.00
0.00
0.00
0.00
0.00
0.00
Size (µm)11.482
13.183
15.136
17.378
19.953
22.909
26.303
30.200
34.674
39.811
45.709
52.481
60.256
69.183
79.433
91.201
104.713
120.226
Volume In %
0.00
0.00
0.00
0.00
0.00
0.00
0.04
0.10
0.14
0.16
0.16
0.12
0.01
0.00
0.00
0.00
0.15
Size (µm)120.226
138.038
158.489
181.970
208.930
239.883
275.423
316.228
363.078
416.869
478.630
549.541
630.957
724.436
831.764
954.993
1096.478
1258.925
Volume In %
0.73
1.59
2.80
4.34
6.04
7.75
9.21
10.26
10.71
10.51
9.69
8.37
6.77
5.05
3.46
1.74
0.11
Size (µm)1258.925
1445.440
1659.587
1905.461
2187.762
2511.886
2884.032
3311.311
3801.894
4365.158
5011.872
5754.399
6606.934
7585.776
8709.636
10000.000
Volume In %
0.00
0.00
0.00
0.00
0.00
0.00
0.00
0.00
0.00
0.00
0.00
0.00
0.00
0.00
0.00
Wednesday, October 15, 2008 3:12:40 PM
AveragedPit 1
Measured by:student
Sample bulk lot ref:
Kovalam
Sample Name:
Analysed:
Measured:
Sample Source & type:Wednesday, October 15, 2008 3:12:42 PM
S61 - AverageSOP Name:
Result Source:
Sensitivity:
Dispersant Name:Water Off
Size range:
Default
Particle RI:
1.330Result Emulation:
Absorption:0.020 to0.1
NormalAnalysis model:
2000.000
Dispersant RI:
1.520
General purposeParticle Name:
um
Tel := +[44] (0) 1684-892456 Fax +[44] (0) 1684-892789Malvern, UKMalvern Instruments Ltd.
Serial Number : MAL1022570Mastersizer 2000 Ver. 5.54
30 May 2011 8:01:01 AMRecord Number: 35File name: Kov Pit1

Result Analysis Report
Vol. Weighted Mean D[4,3]:
%
m²/g
um
Surface Weighted Mean D[3,2]:0.0185 423.374
d(0.9):
Accessory Name:
Span :1.352
umSpecific Surface Area:
22.31
Operator notes:
Uniformity:%Vol
Obscuration:
383.828 715.816d(0.1): um
0.418
323.756
um196.785 d(0.5):
Volume
Particle Size Distribution
0.01 0.1 1 10 100 1000 3000
Particle Size (µm)
0
2
4
6
8
10
12
Vol
ume
(%)
S62 - Average, Wednesday, October 15, 2008 3:22:54 PM
Hydro 2000G (A)
Result units:
um
Concentration:1.1594
Weighted Residual:0.617 %
Size (µm)0.010
0.011
0.013
0.015
0.017
0.020
0.023
0.026
0.030
0.035
0.040
0.046
0.052
0.060
0.069
0.079
0.091
0.105
Volume In %
0.00
0.00
0.00
0.00
0.00
0.00
0.00
0.00
0.00
0.00
0.00
0.00
0.00
0.00
0.00
0.00
0.00
Size (µm)0.105
0.120
0.138
0.158
0.182
0.209
0.240
0.275
0.316
0.363
0.417
0.479
0.550
0.631
0.724
0.832
0.955
1.096
Volume In %
0.00
0.00
0.00
0.00
0.00
0.00
0.00
0.00
0.00
0.00
0.00
0.00
0.00
0.00
0.00
0.00
0.00
Size (µm)1.096
1.259
1.445
1.660
1.905
2.188
2.512
2.884
3.311
3.802
4.365
5.012
5.754
6.607
7.586
8.710
10.000
11.482
Volume In %
0.00
0.00
0.00
0.00
0.00
0.00
0.00
0.00
0.00
0.00
0.00
0.00
0.00
0.00
0.00
0.00
0.00
Size (µm)11.482
13.183
15.136
17.378
19.953
22.909
26.303
30.200
34.674
39.811
45.709
52.481
60.256
69.183
79.433
91.201
104.713
120.226
Volume In %
0.00
0.00
0.00
0.00
0.00
0.00
0.02
0.08
0.11
0.13
0.14
0.12
0.08
0.01
0.04
0.18
0.48
Size (µm)120.226
138.038
158.489
181.970
208.930
239.883
275.423
316.228
363.078
416.869
478.630
549.541
630.957
724.436
831.764
954.993
1096.478
1258.925
Volume In %
1.06
1.95
3.16
4.65
6.27
7.88
9.24
10.17
10.53
10.26
9.40
8.07
6.46
4.77
3.19
1.51
0.04
Size (µm)1258.925
1445.440
1659.587
1905.461
2187.762
2511.886
2884.032
3311.311
3801.894
4365.158
5011.872
5754.399
6606.934
7585.776
8709.636
10000.000
Volume In %
0.00
0.00
0.00
0.00
0.00
0.00
0.00
0.00
0.00
0.00
0.00
0.00
0.00
0.00
0.00
Wednesday, October 15, 2008 3:22:54 PM
AveragedPit 1
Measured by:student
Sample bulk lot ref:
Kovalam
Sample Name:
Analysed:
Measured:
Sample Source & type:Wednesday, October 15, 2008 3:22:56 PM
S62 - AverageSOP Name:
Result Source:
Sensitivity:
Dispersant Name:Water Off
Size range:
Default
Particle RI:
1.330Result Emulation:
Absorption:0.020 to0.1
NormalAnalysis model:
2000.000
Dispersant RI:
1.520
General purposeParticle Name:
um
Tel := +[44] (0) 1684-892456 Fax +[44] (0) 1684-892789Malvern, UKMalvern Instruments Ltd.
Serial Number : MAL1022570Mastersizer 2000 Ver. 5.54
30 May 2011 8:01:20 AMRecord Number: 41File name: Kov Pit1

Result Analysis Report
Vol. Weighted Mean D[4,3]:
%
m²/g
um
Surface Weighted Mean D[3,2]:0.0201 378.309
d(0.9):
Accessory Name:
Span :1.282
umSpecific Surface Area:
19.90
Operator notes:
Uniformity:%Vol
Obscuration:
345.184 627.269d(0.1): um
0.394
297.959
um184.644 d(0.5):
Volume
Particle Size Distribution
0.01 0.1 1 10 100 1000 3000
Particle Size (µm)
0
2
4
6
8
10
12
Vol
ume
(%)
S63 - Average, Wednesday, October 15, 2008 3:31:37 PM
Hydro 2000G (A)
Result units:
um
Concentration:0.9377
Weighted Residual:0.547 %
Size (µm)0.010
0.011
0.013
0.015
0.017
0.020
0.023
0.026
0.030
0.035
0.040
0.046
0.052
0.060
0.069
0.079
0.091
0.105
Volume In %
0.00
0.00
0.00
0.00
0.00
0.00
0.00
0.00
0.00
0.00
0.00
0.00
0.00
0.00
0.00
0.00
0.00
Size (µm)0.105
0.120
0.138
0.158
0.182
0.209
0.240
0.275
0.316
0.363
0.417
0.479
0.550
0.631
0.724
0.832
0.955
1.096
Volume In %
0.00
0.00
0.00
0.00
0.00
0.00
0.00
0.00
0.00
0.00
0.00
0.00
0.00
0.00
0.00
0.00
0.00
Size (µm)1.096
1.259
1.445
1.660
1.905
2.188
2.512
2.884
3.311
3.802
4.365
5.012
5.754
6.607
7.586
8.710
10.000
11.482
Volume In %
0.00
0.00
0.00
0.00
0.00
0.00
0.00
0.00
0.00
0.00
0.00
0.00
0.00
0.00
0.00
0.00
0.00
Size (µm)11.482
13.183
15.136
17.378
19.953
22.909
26.303
30.200
34.674
39.811
45.709
52.481
60.256
69.183
79.433
91.201
104.713
120.226
Volume In %
0.00
0.00
0.00
0.00
0.00
0.00
0.04
0.11
0.14
0.15
0.12
0.00
0.00
0.00
0.00
0.09
0.57
Size (µm)120.226
138.038
158.489
181.970
208.930
239.883
275.423
316.228
363.078
416.869
478.630
549.541
630.957
724.436
831.764
954.993
1096.478
1258.925
Volume In %
1.40
2.63
4.18
5.97
7.76
9.36
10.49
11.01
10.82
9.96
8.57
6.85
5.02
3.33
1.40
0.01
0.00
Size (µm)1258.925
1445.440
1659.587
1905.461
2187.762
2511.886
2884.032
3311.311
3801.894
4365.158
5011.872
5754.399
6606.934
7585.776
8709.636
10000.000
Volume In %
0.00
0.00
0.00
0.00
0.00
0.00
0.00
0.00
0.00
0.00
0.00
0.00
0.00
0.00
0.00
Wednesday, October 15, 2008 3:31:37 PM
AveragedPit 1
Measured by:student
Sample bulk lot ref:
Kovalam
Sample Name:
Analysed:
Measured:
Sample Source & type:Wednesday, October 15, 2008 3:31:39 PM
S63 - AverageSOP Name:
Result Source:
Sensitivity:
Dispersant Name:Water Off
Size range:
Default
Particle RI:
1.330Result Emulation:
Absorption:0.020 to0.1
NormalAnalysis model:
2000.000
Dispersant RI:
1.520
General purposeParticle Name:
um
Tel := +[44] (0) 1684-892456 Fax +[44] (0) 1684-892789Malvern, UKMalvern Instruments Ltd.
Serial Number : MAL1022570Mastersizer 2000 Ver. 5.54
30 May 2011 8:01:33 AMRecord Number: 47File name: Kov Pit1

Result Analysis Report
Vol. Weighted Mean D[4,3]:
%
m²/g
um
Surface Weighted Mean D[3,2]:0.0158 467.260
d(0.9):
Accessory Name:
Span :1.278
umSpecific Surface Area:
18.94
Operator notes:
Uniformity:%Vol
Obscuration:
424.833 772.636d(0.1): um
0.393
380.650
um229.716 d(0.5):
Volume
Particle Size Distribution
0.01 0.1 1 10 100 1000 3000
Particle Size (µm)
0
2
4
6
8
10
12
Vol
ume
(%)
S64 - Average, Wednesday, October 15, 2008 3:39:44 PM
Hydro 2000G (A)
Result units:
um
Concentration:1.1346
Weighted Residual:0.646 %
Size (µm)0.010
0.011
0.013
0.015
0.017
0.020
0.023
0.026
0.030
0.035
0.040
0.046
0.052
0.060
0.069
0.079
0.091
0.105
Volume In %
0.00
0.00
0.00
0.00
0.00
0.00
0.00
0.00
0.00
0.00
0.00
0.00
0.00
0.00
0.00
0.00
0.00
Size (µm)0.105
0.120
0.138
0.158
0.182
0.209
0.240
0.275
0.316
0.363
0.417
0.479
0.550
0.631
0.724
0.832
0.955
1.096
Volume In %
0.00
0.00
0.00
0.00
0.00
0.00
0.00
0.00
0.00
0.00
0.00
0.00
0.00
0.00
0.00
0.00
0.00
Size (µm)1.096
1.259
1.445
1.660
1.905
2.188
2.512
2.884
3.311
3.802
4.365
5.012
5.754
6.607
7.586
8.710
10.000
11.482
Volume In %
0.00
0.00
0.00
0.00
0.00
0.00
0.00
0.00
0.00
0.00
0.00
0.00
0.00
0.00
0.00
0.00
0.00
Size (µm)11.482
13.183
15.136
17.378
19.953
22.909
26.303
30.200
34.674
39.811
45.709
52.481
60.256
69.183
79.433
91.201
104.713
120.226
Volume In %
0.00
0.00
0.00
0.00
0.00
0.00
0.00
0.00
0.00
0.00
0.00
0.00
0.00
0.00
0.00
0.00
0.02
Size (µm)120.226
138.038
158.489
181.970
208.930
239.883
275.423
316.228
363.078
416.869
478.630
549.541
630.957
724.436
831.764
954.993
1096.478
1258.925
Volume In %
0.18
0.97
2.00
3.47
5.17
7.01
8.71
10.07
10.88
11.01
10.47
9.31
7.73
5.94
4.16
2.35
0.55
Size (µm)1258.925
1445.440
1659.587
1905.461
2187.762
2511.886
2884.032
3311.311
3801.894
4365.158
5011.872
5754.399
6606.934
7585.776
8709.636
10000.000
Volume In %
0.00
0.00
0.00
0.00
0.00
0.00
0.00
0.00
0.00
0.00
0.00
0.00
0.00
0.00
0.00
Wednesday, October 15, 2008 3:39:44 PM
AveragedPit 1
Measured by:student
Sample bulk lot ref:
Kovalam
Sample Name:
Analysed:
Measured:
Sample Source & type:Wednesday, October 15, 2008 3:39:46 PM
S64 - AverageSOP Name:
Result Source:
Sensitivity:
Dispersant Name:Water Off
Size range:
Default
Particle RI:
1.330Result Emulation:
Absorption:0.020 to0.1
NormalAnalysis model:
2000.000
Dispersant RI:
1.520
General purposeParticle Name:
um
Tel := +[44] (0) 1684-892456 Fax +[44] (0) 1684-892789Malvern, UKMalvern Instruments Ltd.
Serial Number : MAL1022570Mastersizer 2000 Ver. 5.54
30 May 2011 8:01:50 AMRecord Number: 53File name: Kov Pit1

Result Analysis Report
Vol. Weighted Mean D[4,3]:
%
m²/g
um
Surface Weighted Mean D[3,2]:0.0204 365.405
d(0.9):
Accessory Name:
Span :1.135
umSpecific Surface Area:
21.02
Operator notes:
Uniformity:%Vol
Obscuration:
339.354 579.561d(0.1): um
0.353
294.781
um194.270 d(0.5):
Volume
Particle Size Distribution
0.01 0.1 1 10 100 1000 3000
Particle Size (µm)
0
2
4
6
8
10
12
14
Vol
ume
(%)
S65 - Average, Wednesday, October 15, 2008 3:47:50 PM
Hydro 2000G (A)
Result units:
um
Concentration:0.9863
Weighted Residual:0.503 %
Size (µm)0.010
0.011
0.013
0.015
0.017
0.020
0.023
0.026
0.030
0.035
0.040
0.046
0.052
0.060
0.069
0.079
0.091
0.105
Volume In %
0.00
0.00
0.00
0.00
0.00
0.00
0.00
0.00
0.00
0.00
0.00
0.00
0.00
0.00
0.00
0.00
0.00
Size (µm)0.105
0.120
0.138
0.158
0.182
0.209
0.240
0.275
0.316
0.363
0.417
0.479
0.550
0.631
0.724
0.832
0.955
1.096
Volume In %
0.00
0.00
0.00
0.00
0.00
0.00
0.00
0.00
0.00
0.00
0.00
0.00
0.00
0.00
0.00
0.00
0.00
Size (µm)1.096
1.259
1.445
1.660
1.905
2.188
2.512
2.884
3.311
3.802
4.365
5.012
5.754
6.607
7.586
8.710
10.000
11.482
Volume In %
0.00
0.00
0.00
0.00
0.00
0.00
0.00
0.00
0.00
0.00
0.00
0.00
0.00
0.00
0.00
0.00
0.00
Size (µm)11.482
13.183
15.136
17.378
19.953
22.909
26.303
30.200
34.674
39.811
45.709
52.481
60.256
69.183
79.433
91.201
104.713
120.226
Volume In %
0.00
0.00
0.00
0.00
0.00
0.03
0.10
0.16
0.18
0.18
0.12
0.00
0.00
0.00
0.00
0.00
0.17
Size (µm)120.226
138.038
158.489
181.970
208.930
239.883
275.423
316.228
363.078
416.869
478.630
549.541
630.957
724.436
831.764
954.993
1096.478
1258.925
Volume In %
0.83
2.01
3.71
5.88
8.18
10.31
11.81
12.41
11.99
10.62
8.60
6.29
4.06
1.99
0.36
0.00
0.00
Size (µm)1258.925
1445.440
1659.587
1905.461
2187.762
2511.886
2884.032
3311.311
3801.894
4365.158
5011.872
5754.399
6606.934
7585.776
8709.636
10000.000
Volume In %
0.00
0.00
0.00
0.00
0.00
0.00
0.00
0.00
0.00
0.00
0.00
0.00
0.00
0.00
0.00
Wednesday, October 15, 2008 3:47:50 PM
AveragedPit 1
Measured by:student
Sample bulk lot ref:
Kovalam
Sample Name:
Analysed:
Measured:
Sample Source & type:Wednesday, October 15, 2008 3:47:51 PM
S65 - AverageSOP Name:
Result Source:
Sensitivity:
Dispersant Name:Water Off
Size range:
Default
Particle RI:
1.330Result Emulation:
Absorption:0.020 to0.1
NormalAnalysis model:
2000.000
Dispersant RI:
1.520
General purposeParticle Name:
um
Tel := +[44] (0) 1684-892456 Fax +[44] (0) 1684-892789Malvern, UKMalvern Instruments Ltd.
Serial Number : MAL1022570Mastersizer 2000 Ver. 5.54
30 May 2011 8:02:06 AMRecord Number: 59File name: Kov Pit1
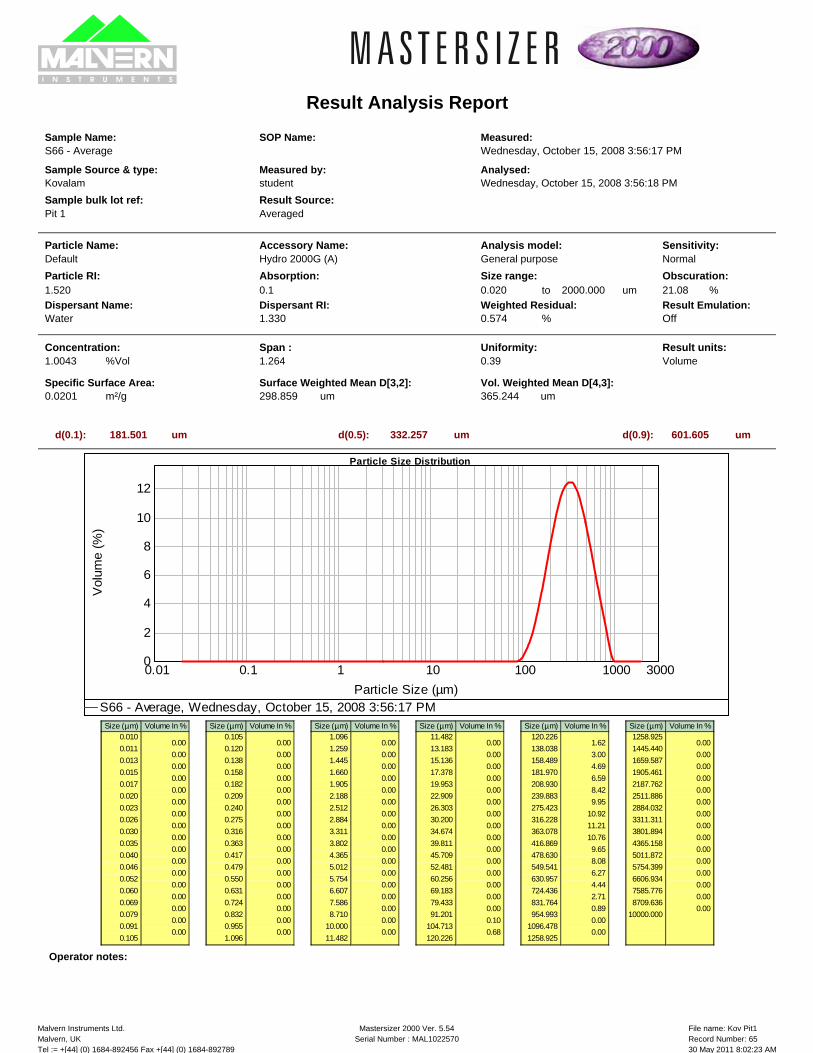
Result Analysis Report
Vol. Weighted Mean D[4,3]:
%
m²/g
um
Surface Weighted Mean D[3,2]:0.0201 365.244
d(0.9):
Accessory Name:
Span :1.264
umSpecific Surface Area:
21.08
Operator notes:
Uniformity:%Vol
Obscuration:
332.257 601.605d(0.1): um
0.39
298.859
um181.501 d(0.5):
Volume
Particle Size Distribution
0.01 0.1 1 10 100 1000 3000
Particle Size (µm)
0
2
4
6
8
10
12
Vol
ume
(%)
S66 - Average, Wednesday, October 15, 2008 3:56:17 PM
Hydro 2000G (A)
Result units:
um
Concentration:1.0043
Weighted Residual:0.574 %
Size (µm)0.010
0.011
0.013
0.015
0.017
0.020
0.023
0.026
0.030
0.035
0.040
0.046
0.052
0.060
0.069
0.079
0.091
0.105
Volume In %
0.00
0.00
0.00
0.00
0.00
0.00
0.00
0.00
0.00
0.00
0.00
0.00
0.00
0.00
0.00
0.00
0.00
Size (µm)0.105
0.120
0.138
0.158
0.182
0.209
0.240
0.275
0.316
0.363
0.417
0.479
0.550
0.631
0.724
0.832
0.955
1.096
Volume In %
0.00
0.00
0.00
0.00
0.00
0.00
0.00
0.00
0.00
0.00
0.00
0.00
0.00
0.00
0.00
0.00
0.00
Size (µm)1.096
1.259
1.445
1.660
1.905
2.188
2.512
2.884
3.311
3.802
4.365
5.012
5.754
6.607
7.586
8.710
10.000
11.482
Volume In %
0.00
0.00
0.00
0.00
0.00
0.00
0.00
0.00
0.00
0.00
0.00
0.00
0.00
0.00
0.00
0.00
0.00
Size (µm)11.482
13.183
15.136
17.378
19.953
22.909
26.303
30.200
34.674
39.811
45.709
52.481
60.256
69.183
79.433
91.201
104.713
120.226
Volume In %
0.00
0.00
0.00
0.00
0.00
0.00
0.00
0.00
0.00
0.00
0.00
0.00
0.00
0.00
0.00
0.10
0.68
Size (µm)120.226
138.038
158.489
181.970
208.930
239.883
275.423
316.228
363.078
416.869
478.630
549.541
630.957
724.436
831.764
954.993
1096.478
1258.925
Volume In %
1.62
3.00
4.69
6.59
8.42
9.95
10.92
11.21
10.76
9.65
8.08
6.27
4.44
2.71
0.89
0.00
0.00
Size (µm)1258.925
1445.440
1659.587
1905.461
2187.762
2511.886
2884.032
3311.311
3801.894
4365.158
5011.872
5754.399
6606.934
7585.776
8709.636
10000.000
Volume In %
0.00
0.00
0.00
0.00
0.00
0.00
0.00
0.00
0.00
0.00
0.00
0.00
0.00
0.00
0.00
Wednesday, October 15, 2008 3:56:17 PM
AveragedPit 1
Measured by:student
Sample bulk lot ref:
Kovalam
Sample Name:
Analysed:
Measured:
Sample Source & type:Wednesday, October 15, 2008 3:56:18 PM
S66 - AverageSOP Name:
Result Source:
Sensitivity:
Dispersant Name:Water Off
Size range:
Default
Particle RI:
1.330Result Emulation:
Absorption:0.020 to0.1
NormalAnalysis model:
2000.000
Dispersant RI:
1.520
General purposeParticle Name:
um
Tel := +[44] (0) 1684-892456 Fax +[44] (0) 1684-892789Malvern, UKMalvern Instruments Ltd.
Serial Number : MAL1022570Mastersizer 2000 Ver. 5.54
30 May 2011 8:02:23 AMRecord Number: 65File name: Kov Pit1

Result Analysis Report
Vol. Weighted Mean D[4,3]:
%
m²/g
um
Surface Weighted Mean D[3,2]:0.0166 434.345
d(0.9):
Accessory Name:
Span :1.201
umSpecific Surface Area:
21.13
Operator notes:
Uniformity:%Vol
Obscuration:
399.777 701.926d(0.1): um
0.369
360.700
um221.771 d(0.5):
Volume
Particle Size Distribution
0.01 0.1 1 10 100 1000 3000
Particle Size (µm)
0
2
4
6
8
10
12
14
Vol
ume
(%)
S71 - Average, Wednesday, November 19, 2008 2:49:23 PM
Hydro 2000G (A)
Result units:
um
Concentration:1.2156
Weighted Residual:1.457 %
Size (µm)0.010
0.011
0.013
0.015
0.017
0.020
0.023
0.026
0.030
0.035
0.040
0.046
0.052
0.060
0.069
0.079
0.091
0.105
Volume In %
0.00
0.00
0.00
0.00
0.00
0.00
0.00
0.00
0.00
0.00
0.00
0.00
0.00
0.00
0.00
0.00
0.00
Size (µm)0.105
0.120
0.138
0.158
0.182
0.209
0.240
0.275
0.316
0.363
0.417
0.479
0.550
0.631
0.724
0.832
0.955
1.096
Volume In %
0.00
0.00
0.00
0.00
0.00
0.00
0.00
0.00
0.00
0.00
0.00
0.00
0.00
0.00
0.00
0.00
0.00
Size (µm)1.096
1.259
1.445
1.660
1.905
2.188
2.512
2.884
3.311
3.802
4.365
5.012
5.754
6.607
7.586
8.710
10.000
11.482
Volume In %
0.00
0.00
0.00
0.00
0.00
0.00
0.00
0.00
0.00
0.00
0.00
0.00
0.00
0.00
0.00
0.00
0.00
Size (µm)11.482
13.183
15.136
17.378
19.953
22.909
26.303
30.200
34.674
39.811
45.709
52.481
60.256
69.183
79.433
91.201
104.713
120.226
Volume In %
0.00
0.00
0.00
0.00
0.00
0.00
0.00
0.00
0.00
0.00
0.00
0.00
0.00
0.00
0.00
0.00
0.04
Size (µm)120.226
138.038
158.489
181.970
208.930
239.883
275.423
316.228
363.078
416.869
478.630
549.541
630.957
724.436
831.764
954.993
1096.478
1258.925
Volume In %
0.26
1.15
2.32
3.96
5.84
7.83
9.61
10.94
11.58
11.43
10.51
8.95
7.00
4.92
2.84
0.82
0.00
Size (µm)1258.925
1445.440
1659.587
1905.461
2187.762
2511.886
2884.032
3311.311
3801.894
4365.158
5011.872
5754.399
6606.934
7585.776
8709.636
10000.000
Volume In %
0.00
0.00
0.00
0.00
0.00
0.00
0.00
0.00
0.00
0.00
0.00
0.00
0.00
0.00
0.00
Wednesday, November 19, 2008 2:49:23 PM
AveragedPit2
Measured by:student
Sample bulk lot ref:
Mamallapuram
Sample Name:
Analysed:
Measured:
Sample Source & type:Wednesday, November 19, 2008 2:49:25 PM
S71 - AverageSOP Name:
Result Source:
Sensitivity:
Dispersant Name:Water Off
Size range:
Default
Particle RI:
1.330Result Emulation:
Absorption:0.020 to0.1
NormalAnalysis model:
2000.000
Dispersant RI:
1.520
General purposeParticle Name:
um
Tel := +[44] (0) 1684-892456 Fax +[44] (0) 1684-892789Malvern, UKMalvern Instruments Ltd.
Serial Number : MAL1022570Mastersizer 2000 Ver. 5.54
30 May 2011 8:08:57 AMRecord Number: 4File name: Mam Pit2

Result Analysis Report
Vol. Weighted Mean D[4,3]:
%
m²/g
um
Surface Weighted Mean D[3,2]:0.0186 426.759
d(0.9):
Accessory Name:
Span :1.324
umSpecific Surface Area:
19.52
Operator notes:
Uniformity:%Vol
Obscuration:
387.875 716.698d(0.1): um
0.409
322.605
um203.219 d(0.5):
Volume
Particle Size Distribution
0.01 0.1 1 10 100 1000 3000
Particle Size (µm)
0
2
4
6
8
10
12
Vol
ume
(%)
S72 - Average, Wednesday, November 19, 2008 2:55:23 PM
Hydro 2000G (A)
Result units:
um
Concentration:0.9929
Weighted Residual:1.366 %
Size (µm)0.010
0.011
0.013
0.015
0.017
0.020
0.023
0.026
0.030
0.035
0.040
0.046
0.052
0.060
0.069
0.079
0.091
0.105
Volume In %
0.00
0.00
0.00
0.00
0.00
0.00
0.00
0.00
0.00
0.00
0.00
0.00
0.00
0.00
0.00
0.00
0.00
Size (µm)0.105
0.120
0.138
0.158
0.182
0.209
0.240
0.275
0.316
0.363
0.417
0.479
0.550
0.631
0.724
0.832
0.955
1.096
Volume In %
0.00
0.00
0.00
0.00
0.00
0.00
0.00
0.00
0.00
0.00
0.00
0.00
0.00
0.00
0.00
0.00
0.00
Size (µm)1.096
1.259
1.445
1.660
1.905
2.188
2.512
2.884
3.311
3.802
4.365
5.012
5.754
6.607
7.586
8.710
10.000
11.482
Volume In %
0.00
0.00
0.00
0.00
0.00
0.00
0.00
0.00
0.00
0.00
0.00
0.00
0.00
0.00
0.00
0.00
0.00
Size (µm)11.482
13.183
15.136
17.378
19.953
22.909
26.303
30.200
34.674
39.811
45.709
52.481
60.256
69.183
79.433
91.201
104.713
120.226
Volume In %
0.00
0.00
0.00
0.00
0.00
0.02
0.09
0.13
0.17
0.20
0.20
0.16
0.08
0.01
0.00
0.00
0.17
Size (µm)120.226
138.038
158.489
181.970
208.930
239.883
275.423
316.228
363.078
416.869
478.630
549.541
630.957
724.436
831.764
954.993
1096.478
1258.925
Volume In %
0.76
1.65
2.91
4.49
6.21
7.92
9.36
10.35
10.73
10.46
9.58
8.22
6.58
4.84
3.23
1.48
0.00
Size (µm)1258.925
1445.440
1659.587
1905.461
2187.762
2511.886
2884.032
3311.311
3801.894
4365.158
5011.872
5754.399
6606.934
7585.776
8709.636
10000.000
Volume In %
0.00
0.00
0.00
0.00
0.00
0.00
0.00
0.00
0.00
0.00
0.00
0.00
0.00
0.00
0.00
Wednesday, November 19, 2008 2:55:23 PM
AveragedPit2
Measured by:student
Sample bulk lot ref:
Mamallapuram
Sample Name:
Analysed:
Measured:
Sample Source & type:Wednesday, November 19, 2008 2:55:25 PM
S72 - AverageSOP Name:
Result Source:
Sensitivity:
Dispersant Name:Water Off
Size range:
Default
Particle RI:
1.330Result Emulation:
Absorption:0.020 to0.1
NormalAnalysis model:
2000.000
Dispersant RI:
1.520
General purposeParticle Name:
um
Tel := +[44] (0) 1684-892456 Fax +[44] (0) 1684-892789Malvern, UKMalvern Instruments Ltd.
Serial Number : MAL1022570Mastersizer 2000 Ver. 5.54
30 May 2011 8:09:09 AMRecord Number: 8File name: Mam Pit2

Result Analysis Report
Vol. Weighted Mean D[4,3]:
%
m²/g
um
Surface Weighted Mean D[3,2]:0.0167 442.253
d(0.9):
Accessory Name:
Span :1.276
umSpecific Surface Area:
20.07
Operator notes:
Uniformity:%Vol
Obscuration:
403.155 731.075d(0.1): um
0.39
359.670
um216.767 d(0.5):
Volume
Particle Size Distribution
0.01 0.1 1 10 100 1000 3000
Particle Size (µm)
0
2
4
6
8
10
12
Vol
ume
(%)
S73 - Average, Wednesday, November 19, 2008 3:02:32 PM
Hydro 2000G (A)
Result units:
um
Concentration:1.1438
Weighted Residual:1.589 %
Size (µm)0.010
0.011
0.013
0.015
0.017
0.020
0.023
0.026
0.030
0.035
0.040
0.046
0.052
0.060
0.069
0.079
0.091
0.105
Volume In %
0.00
0.00
0.00
0.00
0.00
0.00
0.00
0.00
0.00
0.00
0.00
0.00
0.00
0.00
0.00
0.00
0.00
Size (µm)0.105
0.120
0.138
0.158
0.182
0.209
0.240
0.275
0.316
0.363
0.417
0.479
0.550
0.631
0.724
0.832
0.955
1.096
Volume In %
0.00
0.00
0.00
0.00
0.00
0.00
0.00
0.00
0.00
0.00
0.00
0.00
0.00
0.00
0.00
0.00
0.00
Size (µm)1.096
1.259
1.445
1.660
1.905
2.188
2.512
2.884
3.311
3.802
4.365
5.012
5.754
6.607
7.586
8.710
10.000
11.482
Volume In %
0.00
0.00
0.00
0.00
0.00
0.00
0.00
0.00
0.00
0.00
0.00
0.00
0.00
0.00
0.00
0.00
0.00
Size (µm)11.482
13.183
15.136
17.378
19.953
22.909
26.303
30.200
34.674
39.811
45.709
52.481
60.256
69.183
79.433
91.201
104.713
120.226
Volume In %
0.00
0.00
0.00
0.00
0.00
0.00
0.00
0.00
0.00
0.00
0.00
0.00
0.00
0.00
0.00
0.00
0.09
Size (µm)120.226
138.038
158.489
181.970
208.930
239.883
275.423
316.228
363.078
416.869
478.630
549.541
630.957
724.436
831.764
954.993
1096.478
1258.925
Volume In %
0.61
1.36
2.53
4.05
5.79
7.61
9.22
10.42
11.01
10.90
10.12
8.79
7.10
5.25
3.50
1.63
0.02
Size (µm)1258.925
1445.440
1659.587
1905.461
2187.762
2511.886
2884.032
3311.311
3801.894
4365.158
5011.872
5754.399
6606.934
7585.776
8709.636
10000.000
Volume In %
0.00
0.00
0.00
0.00
0.00
0.00
0.00
0.00
0.00
0.00
0.00
0.00
0.00
0.00
0.00
Wednesday, November 19, 2008 3:02:32 PM
AveragedPit3
Measured by:student
Sample bulk lot ref:
Mamallapuram
Sample Name:
Analysed:
Measured:
Sample Source & type:Wednesday, November 19, 2008 3:02:33 PM
S73 - AverageSOP Name:
Result Source:
Sensitivity:
Dispersant Name:Water Off
Size range:
Default
Particle RI:
1.330Result Emulation:
Absorption:0.020 to0.1
NormalAnalysis model:
2000.000
Dispersant RI:
1.520
General purposeParticle Name:
um
Tel := +[44] (0) 1684-892456 Fax +[44] (0) 1684-892789Malvern, UKMalvern Instruments Ltd.
Serial Number : MAL1022570Mastersizer 2000 Ver. 5.54
30 May 2011 8:09:27 AMRecord Number: 4File name: Mam Pit3

Result Analysis Report
Vol. Weighted Mean D[4,3]:
%
m²/g
um
Surface Weighted Mean D[3,2]:0.0161 496.671
d(0.9):
Accessory Name:
Span :1.273
umSpecific Surface Area:
19.07
Operator notes:
Uniformity:%Vol
Obscuration:
459.511 821.500d(0.1): um
0.395
372.594
um236.556 d(0.5):
Volume
Particle Size Distribution
0.01 0.1 1 10 100 1000 3000
Particle Size (µm)
0
2
4
6
8
10
12
Vol
ume
(%)
S74 - Average, Wednesday, November 19, 2008 3:16:51 PM
Hydro 2000G (A)
Result units:
um
Concentration:1.1174
Weighted Residual:1.805 %
Size (µm)0.010
0.011
0.013
0.015
0.017
0.020
0.023
0.026
0.030
0.035
0.040
0.046
0.052
0.060
0.069
0.079
0.091
0.105
Volume In %
0.00
0.00
0.00
0.00
0.00
0.00
0.00
0.00
0.00
0.00
0.00
0.00
0.00
0.00
0.00
0.00
0.00
Size (µm)0.105
0.120
0.138
0.158
0.182
0.209
0.240
0.275
0.316
0.363
0.417
0.479
0.550
0.631
0.724
0.832
0.955
1.096
Volume In %
0.00
0.00
0.00
0.00
0.00
0.00
0.00
0.00
0.00
0.00
0.00
0.00
0.00
0.00
0.00
0.00
0.00
Size (µm)1.096
1.259
1.445
1.660
1.905
2.188
2.512
2.884
3.311
3.802
4.365
5.012
5.754
6.607
7.586
8.710
10.000
11.482
Volume In %
0.00
0.00
0.00
0.00
0.00
0.00
0.00
0.00
0.00
0.00
0.00
0.00
0.00
0.00
0.00
0.00
0.00
Size (µm)11.482
13.183
15.136
17.378
19.953
22.909
26.303
30.200
34.674
39.811
45.709
52.481
60.256
69.183
79.433
91.201
104.713
120.226
Volume In %
0.00
0.00
0.00
0.00
0.00
0.00
0.00
0.01
0.10
0.15
0.21
0.25
0.28
0.27
0.23
0.19
0.20
Size (µm)120.226
138.038
158.489
181.970
208.930
239.883
275.423
316.228
363.078
416.869
478.630
549.541
630.957
724.436
831.764
954.993
1096.478
1258.925
Volume In %
0.34
0.70
1.35
2.39
3.77
5.45
7.23
8.92
10.24
10.98
11.00
10.27
8.91
7.10
5.11
3.15
1.17
Size (µm)1258.925
1445.440
1659.587
1905.461
2187.762
2511.886
2884.032
3311.311
3801.894
4365.158
5011.872
5754.399
6606.934
7585.776
8709.636
10000.000
Volume In %
0.02
0.00
0.00
0.00
0.00
0.00
0.00
0.00
0.00
0.00
0.00
0.00
0.00
0.00
0.00
Wednesday, November 19, 2008 3:16:51 PM
AveragedPit3
Measured by:student
Sample bulk lot ref:
Mamallapuram
Sample Name:
Analysed:
Measured:
Sample Source & type:Wednesday, November 19, 2008 3:16:52 PM
S74 - AverageSOP Name:
Result Source:
Sensitivity:
Dispersant Name:Water Off
Size range:
Default
Particle RI:
1.330Result Emulation:
Absorption:0.020 to0.1
NormalAnalysis model:
2000.000
Dispersant RI:
1.520
General purposeParticle Name:
um
Tel := +[44] (0) 1684-892456 Fax +[44] (0) 1684-892789Malvern, UKMalvern Instruments Ltd.
Serial Number : MAL1022570Mastersizer 2000 Ver. 5.54
30 May 2011 8:09:36 AMRecord Number: 8File name: Mam Pit3

Result Analysis Report
Vol. Weighted Mean D[4,3]:
%
m²/g
um
Surface Weighted Mean D[3,2]:0.0189 509.951
d(0.9):
Accessory Name:
Span :1.275
umSpecific Surface Area:
21.40
Operator notes:
Uniformity:%Vol
Obscuration:
473.156 845.927d(0.1): um
0.395
317.122
um242.605 d(0.5):
Volume
Particle Size Distribution
0.01 0.1 1 10 100 1000 3000
Particle Size (µm)
0
2
4
6
8
10
12
Vol
ume
(%)
S75 - Average, Wednesday, November 19, 2008 3:23:43 PM
Hydro 2000G (A)
Result units:
um
Concentration:1.0746
Weighted Residual:1.809 %
Size (µm)0.010
0.011
0.013
0.015
0.017
0.020
0.023
0.026
0.030
0.035
0.040
0.046
0.052
0.060
0.069
0.079
0.091
0.105
Volume In %
0.00
0.00
0.00
0.00
0.00
0.00
0.00
0.00
0.00
0.00
0.00
0.00
0.00
0.00
0.00
0.00
0.00
Size (µm)0.105
0.120
0.138
0.158
0.182
0.209
0.240
0.275
0.316
0.363
0.417
0.479
0.550
0.631
0.724
0.832
0.955
1.096
Volume In %
0.00
0.00
0.00
0.00
0.00
0.00
0.00
0.00
0.00
0.00
0.00
0.00
0.00
0.00
0.00
0.00
0.00
Size (µm)1.096
1.259
1.445
1.660
1.905
2.188
2.512
2.884
3.311
3.802
4.365
5.012
5.754
6.607
7.586
8.710
10.000
11.482
Volume In %
0.00
0.00
0.00
0.00
0.00
0.00
0.00
0.00
0.00
0.00
0.00
0.00
0.00
0.03
0.07
0.07
0.08
Size (µm)11.482
13.183
15.136
17.378
19.953
22.909
26.303
30.200
34.674
39.811
45.709
52.481
60.256
69.183
79.433
91.201
104.713
120.226
Volume In %
0.08
0.09
0.08
0.08
0.07
0.06
0.07
0.08
0.11
0.16
0.21
0.25
0.26
0.24
0.19
0.13
0.10
Size (µm)120.226
138.038
158.489
181.970
208.930
239.883
275.423
316.228
363.078
416.869
478.630
549.541
630.957
724.436
831.764
954.993
1096.478
1258.925
Volume In %
0.19
0.49
1.08
2.04
3.37
5.02
6.81
8.56
9.99
10.89
11.07
10.49
9.24
7.49
5.51
3.59
1.65
Size (µm)1258.925
1445.440
1659.587
1905.461
2187.762
2511.886
2884.032
3311.311
3801.894
4365.158
5011.872
5754.399
6606.934
7585.776
8709.636
10000.000
Volume In %
0.03
0.00
0.00
0.00
0.00
0.00
0.00
0.00
0.00
0.00
0.00
0.00
0.00
0.00
0.00
Wednesday, November 19, 2008 3:23:43 PM
AveragedPit4
Measured by:student
Sample bulk lot ref:
Mamallapuram
Sample Name:
Analysed:
Measured:
Sample Source & type:Wednesday, November 19, 2008 3:23:44 PM
S75 - AverageSOP Name:
Result Source:
Sensitivity:
Dispersant Name:Water Off
Size range:
Default
Particle RI:
1.330Result Emulation:
Absorption:0.020 to0.1
NormalAnalysis model:
2000.000
Dispersant RI:
1.520
General purposeParticle Name:
um
Tel := +[44] (0) 1684-892456 Fax +[44] (0) 1684-892789Malvern, UKMalvern Instruments Ltd.
Serial Number : MAL1022570Mastersizer 2000 Ver. 5.54
30 May 2011 8:09:55 AMRecord Number: 4File name: Mam Pit4

Result Analysis Report
Vol. Weighted Mean D[4,3]:
%
m²/g
um
Surface Weighted Mean D[3,2]:0.0197 505.422
d(0.9):
Accessory Name:
Span :1.251
umSpecific Surface Area:
22.76
Operator notes:
Uniformity:%Vol
Obscuration:
468.410 833.040d(0.1): um
0.389
304.819
um246.898 d(0.5):
Volume
Particle Size Distribution
0.01 0.1 1 10 100 1000 3000
Particle Size (µm)
0
2
4
6
8
10
12
Vol
ume
(%)
S76 - Average, Wednesday, November 19, 2008 3:30:08 PM
Hydro 2000G (A)
Result units:
um
Concentration:1.1053
Weighted Residual:1.775 %
Size (µm)0.010
0.011
0.013
0.015
0.017
0.020
0.023
0.026
0.030
0.035
0.040
0.046
0.052
0.060
0.069
0.079
0.091
0.105
Volume In %
0.00
0.00
0.00
0.00
0.00
0.00
0.00
0.00
0.00
0.00
0.00
0.00
0.00
0.00
0.00
0.00
0.00
Size (µm)0.105
0.120
0.138
0.158
0.182
0.209
0.240
0.275
0.316
0.363
0.417
0.479
0.550
0.631
0.724
0.832
0.955
1.096
Volume In %
0.00
0.00
0.00
0.00
0.00
0.00
0.00
0.00
0.00
0.00
0.00
0.00
0.00
0.00
0.00
0.00
0.00
Size (µm)1.096
1.259
1.445
1.660
1.905
2.188
2.512
2.884
3.311
3.802
4.365
5.012
5.754
6.607
7.586
8.710
10.000
11.482
Volume In %
0.00
0.00
0.00
0.00
0.00
0.00
0.00
0.00
0.00
0.00
0.00
0.00
0.04
0.07
0.07
0.08
0.09
Size (µm)11.482
13.183
15.136
17.378
19.953
22.909
26.303
30.200
34.674
39.811
45.709
52.481
60.256
69.183
79.433
91.201
104.713
120.226
Volume In %
0.09
0.09
0.09
0.08
0.07
0.06
0.07
0.09
0.13
0.17
0.22
0.24
0.23
0.19
0.06
-0.00
0.00
Size (µm)120.226
138.038
158.489
181.970
208.930
239.883
275.423
316.228
363.078
416.869
478.630
549.541
630.957
724.436
831.764
954.993
1096.478
1258.925
Volume In %
0.03
0.32
0.98
2.03
3.47
5.23
7.11
8.91
10.32
11.14
11.21
10.50
9.14
7.32
5.31
3.36
1.38
Size (µm)1258.925
1445.440
1659.587
1905.461
2187.762
2511.886
2884.032
3311.311
3801.894
4365.158
5011.872
5754.399
6606.934
7585.776
8709.636
10000.000
Volume In %
0.02
0.00
0.00
0.00
0.00
0.00
0.00
0.00
0.00
0.00
0.00
0.00
0.00
0.00
0.00
Wednesday, November 19, 2008 3:30:08 PM
AveragedPit4
Measured by:student
Sample bulk lot ref:
Mamallapuram
Sample Name:
Analysed:
Measured:
Sample Source & type:Wednesday, November 19, 2008 3:30:10 PM
S76 - AverageSOP Name:
Result Source:
Sensitivity:
Dispersant Name:Water Off
Size range:
Default
Particle RI:
1.330Result Emulation:
Absorption:0.020 to0.1
NormalAnalysis model:
2000.000
Dispersant RI:
1.520
General purposeParticle Name:
um
Tel := +[44] (0) 1684-892456 Fax +[44] (0) 1684-892789Malvern, UKMalvern Instruments Ltd.
Serial Number : MAL1022570Mastersizer 2000 Ver. 5.54
30 May 2011 8:10:06 AMRecord Number: 8File name: Mam Pit4

Result Analysis Report
Vol. Weighted Mean D[4,3]:
%
m²/g
um
Surface Weighted Mean D[3,2]:0.0244 480.133
d(0.9):
Accessory Name:
Span :1.219
umSpecific Surface Area:
24.02
Operator notes:
Uniformity:%Vol
Obscuration:
447.671 784.650d(0.1): um
0.384
245.594
um238.991 d(0.5):
Volume
Particle Size Distribution
0.01 0.1 1 10 100 1000 3000
Particle Size (µm)
0
2
4
6
8
10
12
14
Vol
ume
(%)
S77 - Average, Wednesday, November 19, 2008 3:38:14 PM
Hydro 2000G (A)
Result units:
um
Concentration:0.9392
Weighted Residual:1.610 %
Size (µm)0.010
0.011
0.013
0.015
0.017
0.020
0.023
0.026
0.030
0.035
0.040
0.046
0.052
0.060
0.069
0.079
0.091
0.105
Volume In %
0.00
0.00
0.00
0.00
0.00
0.00
0.00
0.00
0.00
0.00
0.00
0.00
0.00
0.00
0.00
0.00
0.00
Size (µm)0.105
0.120
0.138
0.158
0.182
0.209
0.240
0.275
0.316
0.363
0.417
0.479
0.550
0.631
0.724
0.832
0.955
1.096
Volume In %
0.00
0.00
0.00
0.00
0.00
0.00
0.00
0.00
0.00
0.00
0.00
0.00
0.00
0.00
0.00
0.00
0.00
Size (µm)1.096
1.259
1.445
1.660
1.905
2.188
2.512
2.884
3.311
3.802
4.365
5.012
5.754
6.607
7.586
8.710
10.000
11.482
Volume In %
0.00
0.00
0.00
0.00
0.00
0.00
0.00
0.00
0.01
0.05
0.07
0.08
0.08
0.09
0.10
0.11
0.11
Size (µm)11.482
13.183
15.136
17.378
19.953
22.909
26.303
30.200
34.674
39.811
45.709
52.481
60.256
69.183
79.433
91.201
104.713
120.226
Volume In %
0.11
0.11
0.10
0.09
0.08
0.08
0.09
0.11
0.15
0.20
0.23
0.24
0.20
0.12
0.02
0.00
0.00
Size (µm)120.226
138.038
158.489
181.970
208.930
239.883
275.423
316.228
363.078
416.869
478.630
549.541
630.957
724.436
831.764
954.993
1096.478
1258.925
Volume In %
0.03
0.34
1.07
2.24
3.81
5.73
7.73
9.57
10.92
11.56
11.35
10.31
8.64
6.60
4.50
2.46
0.52
Size (µm)1258.925
1445.440
1659.587
1905.461
2187.762
2511.886
2884.032
3311.311
3801.894
4365.158
5011.872
5754.399
6606.934
7585.776
8709.636
10000.000
Volume In %
0.00
0.00
0.00
0.00
0.00
0.00
0.00
0.00
0.00
0.00
0.00
0.00
0.00
0.00
0.00
Wednesday, November 19, 2008 3:38:14 PM
AveragedPit5
Measured by:student
Sample bulk lot ref:
Mamallapuram
Sample Name:
Analysed:
Measured:
Sample Source & type:Wednesday, November 19, 2008 3:38:15 PM
S77 - AverageSOP Name:
Result Source:
Sensitivity:
Dispersant Name:Water Off
Size range:
Default
Particle RI:
1.330Result Emulation:
Absorption:0.020 to0.1
NormalAnalysis model:
2000.000
Dispersant RI:
1.520
General purposeParticle Name:
um
Tel := +[44] (0) 1684-892456 Fax +[44] (0) 1684-892789Malvern, UKMalvern Instruments Ltd.
Serial Number : MAL1022570Mastersizer 2000 Ver. 5.54
30 May 2011 8:10:22 AMRecord Number: 4File name: Mam Pit5

Result Analysis Report
Vol. Weighted Mean D[4,3]:
%
m²/g
um
Surface Weighted Mean D[3,2]:0.0177 452.463
d(0.9):
Accessory Name:
Span :1.245
umSpecific Surface Area:
21.39
Operator notes:
Uniformity:%Vol
Obscuration:
420.006 743.213d(0.1): um
0.386
338.236
um220.248 d(0.5):
Volume
Particle Size Distribution
0.01 0.1 1 10 100 1000 3000
Particle Size (µm)
0
2
4
6
8
10
12
Vol
ume
(%)
S78 - Average, Wednesday, November 19, 2008 3:44:58 PM
Hydro 2000G (A)
Result units:
um
Concentration:1.1531
Weighted Residual:1.530 %
Size (µm)0.010
0.011
0.013
0.015
0.017
0.020
0.023
0.026
0.030
0.035
0.040
0.046
0.052
0.060
0.069
0.079
0.091
0.105
Volume In %
0.00
0.00
0.00
0.00
0.00
0.00
0.00
0.00
0.00
0.00
0.00
0.00
0.00
0.00
0.00
0.00
0.00
Size (µm)0.105
0.120
0.138
0.158
0.182
0.209
0.240
0.275
0.316
0.363
0.417
0.479
0.550
0.631
0.724
0.832
0.955
1.096
Volume In %
0.00
0.00
0.00
0.00
0.00
0.00
0.00
0.00
0.00
0.00
0.00
0.00
0.00
0.00
0.00
0.00
0.00
Size (µm)1.096
1.259
1.445
1.660
1.905
2.188
2.512
2.884
3.311
3.802
4.365
5.012
5.754
6.607
7.586
8.710
10.000
11.482
Volume In %
0.00
0.00
0.00
0.00
0.00
0.00
0.00
0.00
0.00
0.00
0.00
0.00
0.00
0.00
0.00
0.00
0.00
Size (µm)11.482
13.183
15.136
17.378
19.953
22.909
26.303
30.200
34.674
39.811
45.709
52.481
60.256
69.183
79.433
91.201
104.713
120.226
Volume In %
0.00
0.00
0.00
0.00
0.00
0.02
0.08
0.11
0.16
0.21
0.26
0.29
0.27
0.21
0.14
0.09
0.15
Size (µm)120.226
138.038
158.489
181.970
208.930
239.883
275.423
316.228
363.078
416.869
478.630
549.541
630.957
724.436
831.764
954.993
1096.478
1258.925
Volume In %
0.40
0.95
1.86
3.18
4.82
6.67
8.48
10.03
11.02
11.29
10.78
9.54
7.78
5.74
3.79
1.69
0.00
Size (µm)1258.925
1445.440
1659.587
1905.461
2187.762
2511.886
2884.032
3311.311
3801.894
4365.158
5011.872
5754.399
6606.934
7585.776
8709.636
10000.000
Volume In %
0.00
0.00
0.00
0.00
0.00
0.00
0.00
0.00
0.00
0.00
0.00
0.00
0.00
0.00
0.00
Wednesday, November 19, 2008 3:44:58 PM
EditedPit5
Measured by:student
Sample bulk lot ref:
Mamallapuram
Sample Name:
Analysed:
Measured:
Sample Source & type:Wednesday, November 19, 2008 3:45:00 PM
S78 - AverageSOP Name:
Result Source:
Sensitivity:
Dispersant Name:Water Off
Size range:
Default
Particle RI:
1.330Result Emulation:
Absorption:0.020 to0.1
NormalAnalysis model:
2000.000
Dispersant RI:
1.520
General purposeParticle Name:
um
Tel := +[44] (0) 1684-892456 Fax +[44] (0) 1684-892789Malvern, UKMalvern Instruments Ltd.
Serial Number : MAL1022570Mastersizer 2000 Ver. 5.54
30 May 2011 8:10:33 AMRecord Number: 12File name: Mam Pit5

Result Analysis Report
Vol. Weighted Mean D[4,3]:
%
m²/g
um
Surface Weighted Mean D[3,2]:0.0145 486.568
d(0.9):
Accessory Name:
Span :1.117
umSpecific Surface Area:
21.94
Operator notes:
Uniformity:%Vol
Obscuration:
451.998 766.664d(0.1): um
0.345
414.184
um261.830 d(0.5):
Volume
Particle Size Distribution
0.01 0.1 1 10 100 1000 3000
Particle Size (µm)
0
2
4
6
8
10
12
14
Vol
ume
(%)
S79 - Average, Wednesday, November 19, 2008 3:53:31 PM
Hydro 2000G (A)
Result units:
um
Concentration:1.4567
Weighted Residual:1.819 %
Size (µm)0.010
0.011
0.013
0.015
0.017
0.020
0.023
0.026
0.030
0.035
0.040
0.046
0.052
0.060
0.069
0.079
0.091
0.105
Volume In %
0.00
0.00
0.00
0.00
0.00
0.00
0.00
0.00
0.00
0.00
0.00
0.00
0.00
0.00
0.00
0.00
0.00
Size (µm)0.105
0.120
0.138
0.158
0.182
0.209
0.240
0.275
0.316
0.363
0.417
0.479
0.550
0.631
0.724
0.832
0.955
1.096
Volume In %
0.00
0.00
0.00
0.00
0.00
0.00
0.00
0.00
0.00
0.00
0.00
0.00
0.00
0.00
0.00
0.00
0.00
Size (µm)1.096
1.259
1.445
1.660
1.905
2.188
2.512
2.884
3.311
3.802
4.365
5.012
5.754
6.607
7.586
8.710
10.000
11.482
Volume In %
0.00
0.00
0.00
0.00
0.00
0.00
0.00
0.00
0.00
0.00
0.00
0.00
0.00
0.00
0.00
0.00
0.00
Size (µm)11.482
13.183
15.136
17.378
19.953
22.909
26.303
30.200
34.674
39.811
45.709
52.481
60.256
69.183
79.433
91.201
104.713
120.226
Volume In %
0.00
0.00
0.00
0.00
0.00
0.00
0.00
0.00
0.00
0.00
0.00
0.00
0.00
0.00
0.00
0.00
0.00
Size (µm)120.226
138.038
158.489
181.970
208.930
239.883
275.423
316.228
363.078
416.869
478.630
549.541
630.957
724.436
831.764
954.993
1096.478
1258.925
Volume In %
0.00
0.04
0.70
1.98
3.77
5.95
8.23
10.30
11.78
12.42
12.09
10.84
8.91
6.58
4.31
2.07
0.05
Size (µm)1258.925
1445.440
1659.587
1905.461
2187.762
2511.886
2884.032
3311.311
3801.894
4365.158
5011.872
5754.399
6606.934
7585.776
8709.636
10000.000
Volume In %
0.00
0.00
0.00
0.00
0.00
0.00
0.00
0.00
0.00
0.00
0.00
0.00
0.00
0.00
0.00
Wednesday, November 19, 2008 3:53:31 PM
AveragedPit6
Measured by:student
Sample bulk lot ref:
Mamallapuram
Sample Name:
Analysed:
Measured:
Sample Source & type:Wednesday, November 19, 2008 3:53:33 PM
S79 - AverageSOP Name:
Result Source:
Sensitivity:
Dispersant Name:Water Off
Size range:
Default
Particle RI:
1.330Result Emulation:
Absorption:0.020 to0.1
NormalAnalysis model:
2000.000
Dispersant RI:
1.520
General purposeParticle Name:
um
Tel := +[44] (0) 1684-892456 Fax +[44] (0) 1684-892789Malvern, UKMalvern Instruments Ltd.
Serial Number : MAL1022570Mastersizer 2000 Ver. 5.54
30 May 2011 8:10:51 AMRecord Number: 4File name: Mam Pit 6

Result Analysis Report
Vol. Weighted Mean D[4,3]:
%
m²/g
um
Surface Weighted Mean D[3,2]:0.0164 438.276
d(0.9):
Accessory Name:
Span :1.196
umSpecific Surface Area:
20.06
Operator notes:
Uniformity:%Vol
Obscuration:
403.375 707.168d(0.1): um
0.366
364.794
um224.911 d(0.5):
Volume
Particle Size Distribution
0.01 0.1 1 10 100 1000 3000
Particle Size (µm)
0
2
4
6
8
10
12
14
Vol
ume
(%)
S80 - Average, Wednesday, November 19, 2008 3:59:28 PM
Hydro 2000G (A)
Result units:
um
Concentration:1.1597
Weighted Residual:1.567 %
Size (µm)0.010
0.011
0.013
0.015
0.017
0.020
0.023
0.026
0.030
0.035
0.040
0.046
0.052
0.060
0.069
0.079
0.091
0.105
Volume In %
0.00
0.00
0.00
0.00
0.00
0.00
0.00
0.00
0.00
0.00
0.00
0.00
0.00
0.00
0.00
0.00
0.00
Size (µm)0.105
0.120
0.138
0.158
0.182
0.209
0.240
0.275
0.316
0.363
0.417
0.479
0.550
0.631
0.724
0.832
0.955
1.096
Volume In %
0.00
0.00
0.00
0.00
0.00
0.00
0.00
0.00
0.00
0.00
0.00
0.00
0.00
0.00
0.00
0.00
0.00
Size (µm)1.096
1.259
1.445
1.660
1.905
2.188
2.512
2.884
3.311
3.802
4.365
5.012
5.754
6.607
7.586
8.710
10.000
11.482
Volume In %
0.00
0.00
0.00
0.00
0.00
0.00
0.00
0.00
0.00
0.00
0.00
0.00
0.00
0.00
0.00
0.00
0.00
Size (µm)11.482
13.183
15.136
17.378
19.953
22.909
26.303
30.200
34.674
39.811
45.709
52.481
60.256
69.183
79.433
91.201
104.713
120.226
Volume In %
0.00
0.00
0.00
0.00
0.00
0.00
0.00
0.00
0.00
0.00
0.00
0.00
0.00
0.00
0.00
0.00
0.01
Size (µm)120.226
138.038
158.489
181.970
208.930
239.883
275.423
316.228
363.078
416.869
478.630
549.541
630.957
724.436
831.764
954.993
1096.478
1258.925
Volume In %
0.19
1.03
2.17
3.80
5.70
7.73
9.56
10.95
11.64
11.52
10.61
9.06
7.10
5.03
2.96
0.92
0.00
Size (µm)1258.925
1445.440
1659.587
1905.461
2187.762
2511.886
2884.032
3311.311
3801.894
4365.158
5011.872
5754.399
6606.934
7585.776
8709.636
10000.000
Volume In %
0.00
0.00
0.00
0.00
0.00
0.00
0.00
0.00
0.00
0.00
0.00
0.00
0.00
0.00
0.00
Wednesday, November 19, 2008 3:59:28 PM
AveragedPit6
Measured by:student
Sample bulk lot ref:
Mamallapuram
Sample Name:
Analysed:
Measured:
Sample Source & type:Wednesday, November 19, 2008 3:59:30 PM
S80 - AverageSOP Name:
Result Source:
Sensitivity:
Dispersant Name:Water Off
Size range:
Default
Particle RI:
1.330Result Emulation:
Absorption:0.020 to0.1
NormalAnalysis model:
2000.000
Dispersant RI:
1.520
General purposeParticle Name:
um
Tel := +[44] (0) 1684-892456 Fax +[44] (0) 1684-892789Malvern, UKMalvern Instruments Ltd.
Serial Number : MAL1022570Mastersizer 2000 Ver. 5.54
30 May 2011 8:11:02 AMRecord Number: 8File name: Mam Pit 6

Result Analysis Report
Vol. Weighted Mean D[4,3]:
%
m²/g
um
Surface Weighted Mean D[3,2]:0.0174 437.400
d(0.9):
Accessory Name:
Span :1.188
umSpecific Surface Area:
19.19
Operator notes:
Uniformity:%Vol
Obscuration:
408.056 704.859d(0.1): um
0.365
345.123
um220.202 d(0.5):
Volume
Particle Size Distribution
0.01 0.1 1 10 100 1000 3000
Particle Size (µm)
0
2
4
6
8
10
12
14
Vol
ume
(%)
S81 - Average, Wednesday, November 19, 2008 4:06:19 PM
Hydro 2000G (A)
Result units:
um
Concentration:1.0427
Weighted Residual:1.481 %
Size (µm)0.010
0.011
0.013
0.015
0.017
0.020
0.023
0.026
0.030
0.035
0.040
0.046
0.052
0.060
0.069
0.079
0.091
0.105
Volume In %
0.00
0.00
0.00
0.00
0.00
0.00
0.00
0.00
0.00
0.00
0.00
0.00
0.00
0.00
0.00
0.00
0.00
Size (µm)0.105
0.120
0.138
0.158
0.182
0.209
0.240
0.275
0.316
0.363
0.417
0.479
0.550
0.631
0.724
0.832
0.955
1.096
Volume In %
0.00
0.00
0.00
0.00
0.00
0.00
0.00
0.00
0.00
0.00
0.00
0.00
0.00
0.00
0.00
0.00
0.00
Size (µm)1.096
1.259
1.445
1.660
1.905
2.188
2.512
2.884
3.311
3.802
4.365
5.012
5.754
6.607
7.586
8.710
10.000
11.482
Volume In %
0.00
0.00
0.00
0.00
0.00
0.00
0.00
0.00
0.00
0.00
0.00
0.00
0.00
0.00
0.00
0.00
0.00
Size (µm)11.482
13.183
15.136
17.378
19.953
22.909
26.303
30.200
34.674
39.811
45.709
52.481
60.256
69.183
79.433
91.201
104.713
120.226
Volume In %
0.00
0.00
0.00
0.00
0.00
0.00
0.00
0.01
0.08
0.14
0.19
0.22
0.21
0.16
0.10
0.06
0.14
Size (µm)120.226
138.038
158.489
181.970
208.930
239.883
275.423
316.228
363.078
416.869
478.630
549.541
630.957
724.436
831.764
954.993
1096.478
1258.925
Volume In %
0.43
1.04
2.02
3.44
5.19
7.16
9.05
10.62
11.56
11.69
10.95
9.44
7.39
5.14
2.87
0.70
0.00
Size (µm)1258.925
1445.440
1659.587
1905.461
2187.762
2511.886
2884.032
3311.311
3801.894
4365.158
5011.872
5754.399
6606.934
7585.776
8709.636
10000.000
Volume In %
0.00
0.00
0.00
0.00
0.00
0.00
0.00
0.00
0.00
0.00
0.00
0.00
0.00
0.00
0.00
Wednesday, November 19, 2008 4:06:19 PM
AveragedOldDune
Measured by:student
Sample bulk lot ref:
Mamallapuram
Sample Name:
Analysed:
Measured:
Sample Source & type:Wednesday, November 19, 2008 4:06:20 PM
S81 - AverageSOP Name:
Result Source:
Sensitivity:
Dispersant Name:Water Off
Size range:
Default
Particle RI:
1.330Result Emulation:
Absorption:0.020 to0.1
NormalAnalysis model:
2000.000
Dispersant RI:
1.520
General purposeParticle Name:
um
Tel := +[44] (0) 1684-892456 Fax +[44] (0) 1684-892789Malvern, UKMalvern Instruments Ltd.
Serial Number : MAL1022570Mastersizer 2000 Ver. 5.54
30 May 2011 8:11:21 AMRecord Number: 4File name: OldDune

Result Analysis Report
Vol. Weighted Mean D[4,3]:
%
m²/g
um
Surface Weighted Mean D[3,2]:0.0133 537.554
d(0.9):
Accessory Name:
Span :1.168
umSpecific Surface Area:
20.33
Operator notes:
Uniformity:%Vol
Obscuration:
497.298 860.254d(0.1): um
0.36
450.378
um279.511 d(0.5):
Volume
Particle Size Distribution
0.01 0.1 1 10 100 1000 3000
Particle Size (µm)
0
2
4
6
8
10
12
14
Vol
ume
(%)
S82 - Average, Wednesday, November 19, 2008 4:12:48 PM
Hydro 2000G (A)
Result units:
um
Concentration:1.4534
Weighted Residual:1.957 %
Size (µm)0.010
0.011
0.013
0.015
0.017
0.020
0.023
0.026
0.030
0.035
0.040
0.046
0.052
0.060
0.069
0.079
0.091
0.105
Volume In %
0.00
0.00
0.00
0.00
0.00
0.00
0.00
0.00
0.00
0.00
0.00
0.00
0.00
0.00
0.00
0.00
0.00
Size (µm)0.105
0.120
0.138
0.158
0.182
0.209
0.240
0.275
0.316
0.363
0.417
0.479
0.550
0.631
0.724
0.832
0.955
1.096
Volume In %
0.00
0.00
0.00
0.00
0.00
0.00
0.00
0.00
0.00
0.00
0.00
0.00
0.00
0.00
0.00
0.00
0.00
Size (µm)1.096
1.259
1.445
1.660
1.905
2.188
2.512
2.884
3.311
3.802
4.365
5.012
5.754
6.607
7.586
8.710
10.000
11.482
Volume In %
0.00
0.00
0.00
0.00
0.00
0.00
0.00
0.00
0.00
0.00
0.00
0.00
0.00
0.00
0.00
0.00
0.00
Size (µm)11.482
13.183
15.136
17.378
19.953
22.909
26.303
30.200
34.674
39.811
45.709
52.481
60.256
69.183
79.433
91.201
104.713
120.226
Volume In %
0.00
0.00
0.00
0.00
0.00
0.00
0.00
0.00
0.00
0.00
0.00
0.00
0.00
0.00
0.00
0.00
0.00
Size (µm)120.226
138.038
158.489
181.970
208.930
239.883
275.423
316.228
363.078
416.869
478.630
549.541
630.957
724.436
831.764
954.993
1096.478
1258.925
Volume In %
0.00
0.03
0.51
1.44
2.81
4.61
6.63
8.68
10.41
11.58
11.94
11.42
10.10
8.19
6.01
3.89
1.74
Size (µm)1258.925
1445.440
1659.587
1905.461
2187.762
2511.886
2884.032
3311.311
3801.894
4365.158
5011.872
5754.399
6606.934
7585.776
8709.636
10000.000
Volume In %
0.03
0.00
0.00
0.00
0.00
0.00
0.00
0.00
0.00
0.00
0.00
0.00
0.00
0.00
0.00
Wednesday, November 19, 2008 4:12:48 PM
AveragedPit1
Measured by:student
Sample bulk lot ref:
Mamallapuram
Sample Name:
Analysed:
Measured:
Sample Source & type:Wednesday, November 19, 2008 4:12:49 PM
S82 - AverageSOP Name:
Result Source:
Sensitivity:
Dispersant Name:Water Off
Size range:
Default
Particle RI:
1.330Result Emulation:
Absorption:0.020 to0.1
NormalAnalysis model:
2000.000
Dispersant RI:
1.520
General purposeParticle Name:
um
Tel := +[44] (0) 1684-892456 Fax +[44] (0) 1684-892789Malvern, UKMalvern Instruments Ltd.
Serial Number : MAL1022570Mastersizer 2000 Ver. 5.54
30 May 2011 8:02:59 AMRecord Number: 4File name: Mam Pit1

Result Analysis Report
Vol. Weighted Mean D[4,3]:
%
m²/g
um
Surface Weighted Mean D[3,2]:0.0157 459.408
d(0.9):
Accessory Name:
Span :1.204
umSpecific Surface Area:
17.42
Operator notes:
Uniformity:%Vol
Obscuration:
423.232 743.375d(0.1): um
0.37
381.247
um233.905 d(0.5):
Volume
Particle Size Distribution
0.01 0.1 1 10 100 1000 3000
Particle Size (µm)
0
2
4
6
8
10
12
14
Vol
ume
(%)
S83 - Average, Wednesday, November 19, 2008 4:18:46 PM
Hydro 2000G (A)
Result units:
um
Concentration:1.0359
Weighted Residual:1.472 %
Size (µm)0.010
0.011
0.013
0.015
0.017
0.020
0.023
0.026
0.030
0.035
0.040
0.046
0.052
0.060
0.069
0.079
0.091
0.105
Volume In %
0.00
0.00
0.00
0.00
0.00
0.00
0.00
0.00
0.00
0.00
0.00
0.00
0.00
0.00
0.00
0.00
0.00
Size (µm)0.105
0.120
0.138
0.158
0.182
0.209
0.240
0.275
0.316
0.363
0.417
0.479
0.550
0.631
0.724
0.832
0.955
1.096
Volume In %
0.00
0.00
0.00
0.00
0.00
0.00
0.00
0.00
0.00
0.00
0.00
0.00
0.00
0.00
0.00
0.00
0.00
Size (µm)1.096
1.259
1.445
1.660
1.905
2.188
2.512
2.884
3.311
3.802
4.365
5.012
5.754
6.607
7.586
8.710
10.000
11.482
Volume In %
0.00
0.00
0.00
0.00
0.00
0.00
0.00
0.00
0.00
0.00
0.00
0.00
0.00
0.00
0.00
0.00
0.00
Size (µm)11.482
13.183
15.136
17.378
19.953
22.909
26.303
30.200
34.674
39.811
45.709
52.481
60.256
69.183
79.433
91.201
104.713
120.226
Volume In %
0.00
0.00
0.00
0.00
0.00
0.00
0.00
0.00
0.00
0.00
0.00
0.00
0.00
0.00
0.00
0.00
0.00
Size (µm)120.226
138.038
158.489
181.970
208.930
239.883
275.423
316.228
363.078
416.869
478.630
549.541
630.957
724.436
831.764
954.993
1096.478
1258.925
Volume In %
0.08
0.84
1.82
3.28
5.04
7.00
8.87
10.42
11.37
11.57
10.97
9.65
7.84
5.78
3.79
1.67
0.00
Size (µm)1258.925
1445.440
1659.587
1905.461
2187.762
2511.886
2884.032
3311.311
3801.894
4365.158
5011.872
5754.399
6606.934
7585.776
8709.636
10000.000
Volume In %
0.00
0.00
0.00
0.00
0.00
0.00
0.00
0.00
0.00
0.00
0.00
0.00
0.00
0.00
0.00
Wednesday, November 19, 2008 4:18:46 PM
AveragedPit1
Measured by:student
Sample bulk lot ref:
Mamallapuram
Sample Name:
Analysed:
Measured:
Sample Source & type:Wednesday, November 19, 2008 4:18:47 PM
S83 - AverageSOP Name:
Result Source:
Sensitivity:
Dispersant Name:Water Off
Size range:
Default
Particle RI:
1.330Result Emulation:
Absorption:0.020 to0.1
NormalAnalysis model:
2000.000
Dispersant RI:
1.520
General purposeParticle Name:
um
Tel := +[44] (0) 1684-892456 Fax +[44] (0) 1684-892789Malvern, UKMalvern Instruments Ltd.
Serial Number : MAL1022570Mastersizer 2000 Ver. 5.54
30 May 2011 8:03:12 AMRecord Number: 8File name: Mam Pit1

Result Analysis Report
Vol. Weighted Mean D[4,3]:
%
m²/g
um
Surface Weighted Mean D[3,2]:0.0162 453.500
d(0.9):
Accessory Name:
Span :1.260
umSpecific Surface Area:
21.37
Operator notes:
Uniformity:%Vol
Obscuration:
415.637 745.800d(0.1): um
0.386
369.316
um222.196 d(0.5):
Volume
Particle Size Distribution
0.01 0.1 1 10 100 1000 3000
Particle Size (µm)
0
2
4
6
8
10
12
Vol
ume
(%)
S84 - Average, Wednesday, November 19, 2008 4:25:44 PM
Hydro 2000G (A)
Result units:
um
Concentration:1.2613
Weighted Residual:1.495 %
Size (µm)0.010
0.011
0.013
0.015
0.017
0.020
0.023
0.026
0.030
0.035
0.040
0.046
0.052
0.060
0.069
0.079
0.091
0.105
Volume In %
0.00
0.00
0.00
0.00
0.00
0.00
0.00
0.00
0.00
0.00
0.00
0.00
0.00
0.00
0.00
0.00
0.00
Size (µm)0.105
0.120
0.138
0.158
0.182
0.209
0.240
0.275
0.316
0.363
0.417
0.479
0.550
0.631
0.724
0.832
0.955
1.096
Volume In %
0.00
0.00
0.00
0.00
0.00
0.00
0.00
0.00
0.00
0.00
0.00
0.00
0.00
0.00
0.00
0.00
0.00
Size (µm)1.096
1.259
1.445
1.660
1.905
2.188
2.512
2.884
3.311
3.802
4.365
5.012
5.754
6.607
7.586
8.710
10.000
11.482
Volume In %
0.00
0.00
0.00
0.00
0.00
0.00
0.00
0.00
0.00
0.00
0.00
0.00
0.00
0.00
0.00
0.00
0.00
Size (µm)11.482
13.183
15.136
17.378
19.953
22.909
26.303
30.200
34.674
39.811
45.709
52.481
60.256
69.183
79.433
91.201
104.713
120.226
Volume In %
0.00
0.00
0.00
0.00
0.00
0.00
0.00
0.00
0.00
0.00
0.00
0.00
0.00
0.00
0.00
0.00
0.06
Size (µm)120.226
138.038
158.489
181.970
208.930
239.883
275.423
316.228
363.078
416.869
478.630
549.541
630.957
724.436
831.764
954.993
1096.478
1258.925
Volume In %
0.51
1.22
2.30
3.73
5.38
7.15
8.81
10.14
10.94
11.07
10.49
9.27
7.59
5.66
3.79
1.81
0.09
Size (µm)1258.925
1445.440
1659.587
1905.461
2187.762
2511.886
2884.032
3311.311
3801.894
4365.158
5011.872
5754.399
6606.934
7585.776
8709.636
10000.000
Volume In %
0.00
0.00
0.00
0.00
0.00
0.00
0.00
0.00
0.00
0.00
0.00
0.00
0.00
0.00
0.00
Wednesday, November 19, 2008 4:25:44 PM
AveragedPit1
Measured by:student
Sample bulk lot ref:
Mamallapuram
Sample Name:
Analysed:
Measured:
Sample Source & type:Wednesday, November 19, 2008 4:25:45 PM
S84 - AverageSOP Name:
Result Source:
Sensitivity:
Dispersant Name:Water Off
Size range:
Default
Particle RI:
1.330Result Emulation:
Absorption:0.020 to0.1
NormalAnalysis model:
2000.000
Dispersant RI:
1.520
General purposeParticle Name:
um
Tel := +[44] (0) 1684-892456 Fax +[44] (0) 1684-892789Malvern, UKMalvern Instruments Ltd.
Serial Number : MAL1022570Mastersizer 2000 Ver. 5.54
30 May 2011 8:03:43 AMRecord Number: 12File name: Mam Pit1

Result Analysis Report
Vol. Weighted Mean D[4,3]:
%
m²/g
um
Surface Weighted Mean D[3,2]:0.0153 474.799
d(0.9):
Accessory Name:
Span :1.215
umSpecific Surface Area:
19.65
Operator notes:
Uniformity:%Vol
Obscuration:
437.881 770.735d(0.1): um
0.375
391.637
um238.551 d(0.5):
Volume
Particle Size Distribution
0.01 0.1 1 10 100 1000 3000
Particle Size (µm)
0
2
4
6
8
10
12
Vol
ume
(%)
S85 - Average, Wednesday, November 19, 2008 4:31:56 PM
Hydro 2000G (A)
Result units:
um
Concentration:1.2164
Weighted Residual:1.610 %
Size (µm)0.010
0.011
0.013
0.015
0.017
0.020
0.023
0.026
0.030
0.035
0.040
0.046
0.052
0.060
0.069
0.079
0.091
0.105
Volume In %
0.00
0.00
0.00
0.00
0.00
0.00
0.00
0.00
0.00
0.00
0.00
0.00
0.00
0.00
0.00
0.00
0.00
Size (µm)0.105
0.120
0.138
0.158
0.182
0.209
0.240
0.275
0.316
0.363
0.417
0.479
0.550
0.631
0.724
0.832
0.955
1.096
Volume In %
0.00
0.00
0.00
0.00
0.00
0.00
0.00
0.00
0.00
0.00
0.00
0.00
0.00
0.00
0.00
0.00
0.00
Size (µm)1.096
1.259
1.445
1.660
1.905
2.188
2.512
2.884
3.311
3.802
4.365
5.012
5.754
6.607
7.586
8.710
10.000
11.482
Volume In %
0.00
0.00
0.00
0.00
0.00
0.00
0.00
0.00
0.00
0.00
0.00
0.00
0.00
0.00
0.00
0.00
0.00
Size (µm)11.482
13.183
15.136
17.378
19.953
22.909
26.303
30.200
34.674
39.811
45.709
52.481
60.256
69.183
79.433
91.201
104.713
120.226
Volume In %
0.00
0.00
0.00
0.00
0.00
0.00
0.00
0.00
0.00
0.00
0.00
0.00
0.00
0.00
0.00
0.00
0.01
Size (µm)120.226
138.038
158.489
181.970
208.930
239.883
275.423
316.228
363.078
416.869
478.630
549.541
630.957
724.436
831.764
954.993
1096.478
1258.925
Volume In %
0.14
0.79
1.67
2.99
4.62
6.47
8.31
9.92
11.02
11.45
11.11
10.02
8.37
6.37
4.32
2.24
0.19
Size (µm)1258.925
1445.440
1659.587
1905.461
2187.762
2511.886
2884.032
3311.311
3801.894
4365.158
5011.872
5754.399
6606.934
7585.776
8709.636
10000.000
Volume In %
0.00
0.00
0.00
0.00
0.00
0.00
0.00
0.00
0.00
0.00
0.00
0.00
0.00
0.00
0.00
Wednesday, November 19, 2008 4:31:56 PM
AveragedPit1
Measured by:student
Sample bulk lot ref:
Mamallapuram
Sample Name:
Analysed:
Measured:
Sample Source & type:Wednesday, November 19, 2008 4:31:58 PM
S85 - AverageSOP Name:
Result Source:
Sensitivity:
Dispersant Name:Water Off
Size range:
Default
Particle RI:
1.330Result Emulation:
Absorption:0.020 to0.1
NormalAnalysis model:
2000.000
Dispersant RI:
1.520
General purposeParticle Name:
um
Tel := +[44] (0) 1684-892456 Fax +[44] (0) 1684-892789Malvern, UKMalvern Instruments Ltd.
Serial Number : MAL1022570Mastersizer 2000 Ver. 5.54
30 May 2011 8:04:08 AMRecord Number: 16File name: Mam Pit1

Result Analysis Report
Vol. Weighted Mean D[4,3]:
%
m²/g
um
Surface Weighted Mean D[3,2]:0.0156 464.520
d(0.9):
Accessory Name:
Span :1.211
umSpecific Surface Area:
18.33
Operator notes:
Uniformity:%Vol
Obscuration:
428.733 753.053d(0.1): um
0.373
383.605
um234.071 d(0.5):
Volume
Particle Size Distribution
0.01 0.1 1 10 100 1000 3000
Particle Size (µm)
0
2
4
6
8
10
12
14
Vol
ume
(%)
S86 - Average, Wednesday, November 19, 2008 4:39:11 PM
Hydro 2000G (A)
Result units:
um
Concentration:1.1031
Weighted Residual:1.501 %
Size (µm)0.010
0.011
0.013
0.015
0.017
0.020
0.023
0.026
0.030
0.035
0.040
0.046
0.052
0.060
0.069
0.079
0.091
0.105
Volume In %
0.00
0.00
0.00
0.00
0.00
0.00
0.00
0.00
0.00
0.00
0.00
0.00
0.00
0.00
0.00
0.00
0.00
Size (µm)0.105
0.120
0.138
0.158
0.182
0.209
0.240
0.275
0.316
0.363
0.417
0.479
0.550
0.631
0.724
0.832
0.955
1.096
Volume In %
0.00
0.00
0.00
0.00
0.00
0.00
0.00
0.00
0.00
0.00
0.00
0.00
0.00
0.00
0.00
0.00
0.00
Size (µm)1.096
1.259
1.445
1.660
1.905
2.188
2.512
2.884
3.311
3.802
4.365
5.012
5.754
6.607
7.586
8.710
10.000
11.482
Volume In %
0.00
0.00
0.00
0.00
0.00
0.00
0.00
0.00
0.00
0.00
0.00
0.00
0.00
0.00
0.00
0.00
0.00
Size (µm)11.482
13.183
15.136
17.378
19.953
22.909
26.303
30.200
34.674
39.811
45.709
52.481
60.256
69.183
79.433
91.201
104.713
120.226
Volume In %
0.00
0.00
0.00
0.00
0.00
0.00
0.00
0.00
0.00
0.00
0.00
0.00
0.00
0.00
0.00
0.00
0.03
Size (µm)120.226
138.038
158.489
181.970
208.930
239.883
275.423
316.228
363.078
416.869
478.630
549.541
630.957
724.436
831.764
954.993
1096.478
1258.925
Volume In %
0.20
0.88
1.82
3.20
4.87
6.75
8.58
10.15
11.18
11.50
11.04
9.83
8.07
5.98
4.01
1.91
0.00
Size (µm)1258.925
1445.440
1659.587
1905.461
2187.762
2511.886
2884.032
3311.311
3801.894
4365.158
5011.872
5754.399
6606.934
7585.776
8709.636
10000.000
Volume In %
0.00
0.00
0.00
0.00
0.00
0.00
0.00
0.00
0.00
0.00
0.00
0.00
0.00
0.00
0.00
Wednesday, November 19, 2008 4:39:11 PM
AveragedPit1
Measured by:student
Sample bulk lot ref:
Mamallapuram
Sample Name:
Analysed:
Measured:
Sample Source & type:Wednesday, November 19, 2008 4:39:12 PM
S86 - AverageSOP Name:
Result Source:
Sensitivity:
Dispersant Name:Water Off
Size range:
Default
Particle RI:
1.330Result Emulation:
Absorption:0.020 to0.1
NormalAnalysis model:
2000.000
Dispersant RI:
1.520
General purposeParticle Name:
um
Tel := +[44] (0) 1684-892456 Fax +[44] (0) 1684-892789Malvern, UKMalvern Instruments Ltd.
Serial Number : MAL1022570Mastersizer 2000 Ver. 5.54
30 May 2011 8:04:25 AMRecord Number: 20File name: Mam Pit1

Result Analysis Report
Vol. Weighted Mean D[4,3]:
%
m²/g
um
Surface Weighted Mean D[3,2]:0.0144 501.344
d(0.9):
Accessory Name:
Span :1.186
umSpecific Surface Area:
16.72
Operator notes:
Uniformity:%Vol
Obscuration:
463.281 806.412d(0.1): um
0.365
417.088
um256.802 d(0.5):
Volume
Particle Size Distribution
0.01 0.1 1 10 100 1000 3000
Particle Size (µm)
0
2
4
6
8
10
12
14
Vol
ume
(%)
S87 - Average, Wednesday, November 19, 2008 4:46:15 PM
Hydro 2000G (A)
Result units:
um
Concentration:1.0835
Weighted Residual:1.737 %
Size (µm)0.010
0.011
0.013
0.015
0.017
0.020
0.023
0.026
0.030
0.035
0.040
0.046
0.052
0.060
0.069
0.079
0.091
0.105
Volume In %
0.00
0.00
0.00
0.00
0.00
0.00
0.00
0.00
0.00
0.00
0.00
0.00
0.00
0.00
0.00
0.00
0.00
Size (µm)0.105
0.120
0.138
0.158
0.182
0.209
0.240
0.275
0.316
0.363
0.417
0.479
0.550
0.631
0.724
0.832
0.955
1.096
Volume In %
0.00
0.00
0.00
0.00
0.00
0.00
0.00
0.00
0.00
0.00
0.00
0.00
0.00
0.00
0.00
0.00
0.00
Size (µm)1.096
1.259
1.445
1.660
1.905
2.188
2.512
2.884
3.311
3.802
4.365
5.012
5.754
6.607
7.586
8.710
10.000
11.482
Volume In %
0.00
0.00
0.00
0.00
0.00
0.00
0.00
0.00
0.00
0.00
0.00
0.00
0.00
0.00
0.00
0.00
0.00
Size (µm)11.482
13.183
15.136
17.378
19.953
22.909
26.303
30.200
34.674
39.811
45.709
52.481
60.256
69.183
79.433
91.201
104.713
120.226
Volume In %
0.00
0.00
0.00
0.00
0.00
0.00
0.00
0.00
0.00
0.00
0.00
0.00
0.00
0.00
0.00
0.00
0.00
Size (µm)120.226
138.038
158.489
181.970
208.930
239.883
275.423
316.228
363.078
416.869
478.630
549.541
630.957
724.436
831.764
954.993
1096.478
1258.925
Volume In %
0.02
0.35
1.08
2.23
3.77
5.65
7.62
9.48
10.90
11.66
11.61
10.72
9.15
7.15
5.01
2.86
0.72
Size (µm)1258.925
1445.440
1659.587
1905.461
2187.762
2511.886
2884.032
3311.311
3801.894
4365.158
5011.872
5754.399
6606.934
7585.776
8709.636
10000.000
Volume In %
0.01
0.00
0.00
0.00
0.00
0.00
0.00
0.00
0.00
0.00
0.00
0.00
0.00
0.00
0.00
Wednesday, November 19, 2008 4:46:15 PM
AveragedPit1
Measured by:student
Sample bulk lot ref:
Mamallapuram
Sample Name:
Analysed:
Measured:
Sample Source & type:Wednesday, November 19, 2008 4:46:16 PM
S87 - AverageSOP Name:
Result Source:
Sensitivity:
Dispersant Name:Water Off
Size range:
Default
Particle RI:
1.330Result Emulation:
Absorption:0.020 to0.1
NormalAnalysis model:
2000.000
Dispersant RI:
1.520
General purposeParticle Name:
um
Tel := +[44] (0) 1684-892456 Fax +[44] (0) 1684-892789Malvern, UKMalvern Instruments Ltd.
Serial Number : MAL1022570Mastersizer 2000 Ver. 5.54
30 May 2011 8:04:40 AMRecord Number: 24File name: Mam Pit1

Result Analysis Report
Vol. Weighted Mean D[4,3]:
%
m²/g
um
Surface Weighted Mean D[3,2]:0.0129 564.566
d(0.9):
Accessory Name:
Span :1.235
umSpecific Surface Area:
19.62
Operator notes:
Uniformity:%Vol
Obscuration:
517.641 921.163d(0.1): um
0.382
463.348
um281.796 d(0.5):
Volume
Particle Size Distribution
0.01 0.1 1 10 100 1000 3000
Particle Size (µm)
0
2
4
6
8
10
12
Vol
ume
(%)
S88 - Average, Wednesday, November 19, 2008 4:53:41 PM
Hydro 2000G (A)
Result units:
um
Concentration:1.4369
Weighted Residual:1.980 %
Size (µm)0.010
0.011
0.013
0.015
0.017
0.020
0.023
0.026
0.030
0.035
0.040
0.046
0.052
0.060
0.069
0.079
0.091
0.105
Volume In %
0.00
0.00
0.00
0.00
0.00
0.00
0.00
0.00
0.00
0.00
0.00
0.00
0.00
0.00
0.00
0.00
0.00
Size (µm)0.105
0.120
0.138
0.158
0.182
0.209
0.240
0.275
0.316
0.363
0.417
0.479
0.550
0.631
0.724
0.832
0.955
1.096
Volume In %
0.00
0.00
0.00
0.00
0.00
0.00
0.00
0.00
0.00
0.00
0.00
0.00
0.00
0.00
0.00
0.00
0.00
Size (µm)1.096
1.259
1.445
1.660
1.905
2.188
2.512
2.884
3.311
3.802
4.365
5.012
5.754
6.607
7.586
8.710
10.000
11.482
Volume In %
0.00
0.00
0.00
0.00
0.00
0.00
0.00
0.00
0.00
0.00
0.00
0.00
0.00
0.00
0.00
0.00
0.00
Size (µm)11.482
13.183
15.136
17.378
19.953
22.909
26.303
30.200
34.674
39.811
45.709
52.481
60.256
69.183
79.433
91.201
104.713
120.226
Volume In %
0.00
0.00
0.00
0.00
0.00
0.00
0.00
0.00
0.00
0.00
0.00
0.00
0.00
0.00
0.00
0.00
0.00
Size (µm)120.226
138.038
158.489
181.970
208.930
239.883
275.423
316.228
363.078
416.869
478.630
549.541
630.957
724.436
831.764
954.993
1096.478
1258.925
Volume In %
0.01
0.10
0.65
1.46
2.67
4.25
6.06
7.94
9.61
10.83
11.38
11.16
10.18
8.60
6.66
4.68
2.82
Size (µm)1258.925
1445.440
1659.587
1905.461
2187.762
2511.886
2884.032
3311.311
3801.894
4365.158
5011.872
5754.399
6606.934
7585.776
8709.636
10000.000
Volume In %
0.93
0.02
0.00
0.00
0.00
0.00
0.00
0.00
0.00
0.00
0.00
0.00
0.00
0.00
0.00
Wednesday, November 19, 2008 4:53:41 PM
AveragedPit1
Measured by:student
Sample bulk lot ref:
Mamallapuram
Sample Name:
Analysed:
Measured:
Sample Source & type:Wednesday, November 19, 2008 4:53:42 PM
S88 - AverageSOP Name:
Result Source:
Sensitivity:
Dispersant Name:Water Off
Size range:
Default
Particle RI:
1.330Result Emulation:
Absorption:0.020 to0.1
NormalAnalysis model:
2000.000
Dispersant RI:
1.520
General purposeParticle Name:
um
Tel := +[44] (0) 1684-892456 Fax +[44] (0) 1684-892789Malvern, UKMalvern Instruments Ltd.
Serial Number : MAL1022570Mastersizer 2000 Ver. 5.54
30 May 2011 8:04:54 AMRecord Number: 28File name: Mam Pit1

Result Analysis Report
Vol. Weighted Mean D[4,3]:
%
m²/g
um
Surface Weighted Mean D[3,2]:0.0144 508.749
d(0.9):
Accessory Name:
Span :1.238
umSpecific Surface Area:
16.20
Operator notes:
Uniformity:%Vol
Obscuration:
467.248 830.951d(0.1): um
0.379
416.909
um252.643 d(0.5):
Volume
Particle Size Distribution
0.01 0.1 1 10 100 1000 3000
Particle Size (µm)
0
2
4
6
8
10
12
Vol
ume
(%)
S89 - Average, Wednesday, November 19, 2008 5:01:21 PM
Hydro 2000G (A)
Result units:
um
Concentration:1.0461
Weighted Residual:1.733 %
Size (µm)0.010
0.011
0.013
0.015
0.017
0.020
0.023
0.026
0.030
0.035
0.040
0.046
0.052
0.060
0.069
0.079
0.091
0.105
Volume In %
0.00
0.00
0.00
0.00
0.00
0.00
0.00
0.00
0.00
0.00
0.00
0.00
0.00
0.00
0.00
0.00
0.00
Size (µm)0.105
0.120
0.138
0.158
0.182
0.209
0.240
0.275
0.316
0.363
0.417
0.479
0.550
0.631
0.724
0.832
0.955
1.096
Volume In %
0.00
0.00
0.00
0.00
0.00
0.00
0.00
0.00
0.00
0.00
0.00
0.00
0.00
0.00
0.00
0.00
0.00
Size (µm)1.096
1.259
1.445
1.660
1.905
2.188
2.512
2.884
3.311
3.802
4.365
5.012
5.754
6.607
7.586
8.710
10.000
11.482
Volume In %
0.00
0.00
0.00
0.00
0.00
0.00
0.00
0.00
0.00
0.00
0.00
0.00
0.00
0.00
0.00
0.00
0.00
Size (µm)11.482
13.183
15.136
17.378
19.953
22.909
26.303
30.200
34.674
39.811
45.709
52.481
60.256
69.183
79.433
91.201
104.713
120.226
Volume In %
0.00
0.00
0.00
0.00
0.00
0.00
0.00
0.00
0.00
0.00
0.00
0.00
0.00
0.00
0.00
0.00
0.00
Size (µm)120.226
138.038
158.489
181.970
208.930
239.883
275.423
316.228
363.078
416.869
478.630
549.541
630.957
724.436
831.764
954.993
1096.478
1258.925
Volume In %
0.05
0.54
1.26
2.40
3.86
5.61
7.43
9.14
10.47
11.21
11.22
10.48
9.10
7.27
5.27
3.32
1.35
Size (µm)1258.925
1445.440
1659.587
1905.461
2187.762
2511.886
2884.032
3311.311
3801.894
4365.158
5011.872
5754.399
6606.934
7585.776
8709.636
10000.000
Volume In %
0.02
0.00
0.00
0.00
0.00
0.00
0.00
0.00
0.00
0.00
0.00
0.00
0.00
0.00
0.00
Wednesday, November 19, 2008 5:01:21 PM
AveragedPit1
Measured by:student
Sample bulk lot ref:
Mamallapuram
Sample Name:
Analysed:
Measured:
Sample Source & type:Wednesday, November 19, 2008 5:01:23 PM
S89 - AverageSOP Name:
Result Source:
Sensitivity:
Dispersant Name:Water Off
Size range:
Default
Particle RI:
1.330Result Emulation:
Absorption:0.020 to0.1
NormalAnalysis model:
2000.000
Dispersant RI:
1.520
General purposeParticle Name:
um
Tel := +[44] (0) 1684-892456 Fax +[44] (0) 1684-892789Malvern, UKMalvern Instruments Ltd.
Serial Number : MAL1022570Mastersizer 2000 Ver. 5.54
30 May 2011 8:05:05 AMRecord Number: 32File name: Mam Pit1

Result Analysis Report
Vol. Weighted Mean D[4,3]:
%
m²/g
um
Surface Weighted Mean D[3,2]:0.0144 510.325
d(0.9):
Accessory Name:
Span :1.241
umSpecific Surface Area:
20.87
Operator notes:
Uniformity:%Vol
Obscuration:
468.726 834.418d(0.1): um
0.38
417.502
um252.612 d(0.5):
Volume
Particle Size Distribution
0.01 0.1 1 10 100 1000 3000
Particle Size (µm)
0
2
4
6
8
10
12
Vol
ume
(%)
S90 - Average, Wednesday, November 19, 2008 5:07:55 PM
Hydro 2000G (A)
Result units:
um
Concentration:1.3875
Weighted Residual:1.739 %
Size (µm)0.010
0.011
0.013
0.015
0.017
0.020
0.023
0.026
0.030
0.035
0.040
0.046
0.052
0.060
0.069
0.079
0.091
0.105
Volume In %
0.00
0.00
0.00
0.00
0.00
0.00
0.00
0.00
0.00
0.00
0.00
0.00
0.00
0.00
0.00
0.00
0.00
Size (µm)0.105
0.120
0.138
0.158
0.182
0.209
0.240
0.275
0.316
0.363
0.417
0.479
0.550
0.631
0.724
0.832
0.955
1.096
Volume In %
0.00
0.00
0.00
0.00
0.00
0.00
0.00
0.00
0.00
0.00
0.00
0.00
0.00
0.00
0.00
0.00
0.00
Size (µm)1.096
1.259
1.445
1.660
1.905
2.188
2.512
2.884
3.311
3.802
4.365
5.012
5.754
6.607
7.586
8.710
10.000
11.482
Volume In %
0.00
0.00
0.00
0.00
0.00
0.00
0.00
0.00
0.00
0.00
0.00
0.00
0.00
0.00
0.00
0.00
0.00
Size (µm)11.482
13.183
15.136
17.378
19.953
22.909
26.303
30.200
34.674
39.811
45.709
52.481
60.256
69.183
79.433
91.201
104.713
120.226
Volume In %
0.00
0.00
0.00
0.00
0.00
0.00
0.00
0.00
0.00
0.00
0.00
0.00
0.00
0.00
0.00
0.00
0.00
Size (µm)120.226
138.038
158.489
181.970
208.930
239.883
275.423
316.228
363.078
416.869
478.630
549.541
630.957
724.436
831.764
954.993
1096.478
1258.925
Volume In %
0.06
0.59
1.28
2.39
3.82
5.55
7.36
9.08
10.41
11.17
11.21
10.49
9.13
7.32
5.32
3.38
1.42
Size (µm)1258.925
1445.440
1659.587
1905.461
2187.762
2511.886
2884.032
3311.311
3801.894
4365.158
5011.872
5754.399
6606.934
7585.776
8709.636
10000.000
Volume In %
0.02
0.00
0.00
0.00
0.00
0.00
0.00
0.00
0.00
0.00
0.00
0.00
0.00
0.00
0.00
Wednesday, November 19, 2008 5:07:55 PM
AveragedPit1
Measured by:student
Sample bulk lot ref:
Mamallapuram
Sample Name:
Analysed:
Measured:
Sample Source & type:Wednesday, November 19, 2008 5:07:57 PM
S90 - AverageSOP Name:
Result Source:
Sensitivity:
Dispersant Name:Water Off
Size range:
Default
Particle RI:
1.330Result Emulation:
Absorption:0.020 to0.1
NormalAnalysis model:
2000.000
Dispersant RI:
1.520
General purposeParticle Name:
um
Tel := +[44] (0) 1684-892456 Fax +[44] (0) 1684-892789Malvern, UKMalvern Instruments Ltd.
Serial Number : MAL1022570Mastersizer 2000 Ver. 5.54
30 May 2011 8:05:18 AMRecord Number: 36File name: Mam Pit1

Result Analysis Report
Vol. Weighted Mean D[4,3]:
%
m²/g
um
Surface Weighted Mean D[3,2]:0.0133 544.737
d(0.9):
Accessory Name:
Span :1.210
umSpecific Surface Area:
18.50
Operator notes:
Uniformity:%Vol
Obscuration:
501.211 882.795d(0.1): um
0.373
450.877
um276.177 d(0.5):
Volume
Particle Size Distribution
0.01 0.1 1 10 100 1000 3000
Particle Size (µm)
0
2
4
6
8
10
12
14
Vol
ume
(%)
S91 - Average, Wednesday, November 19, 2008 5:13:48 PM
Hydro 2000G (A)
Result units:
um
Concentration:1.3096
Weighted Residual:1.942 %
Size (µm)0.010
0.011
0.013
0.015
0.017
0.020
0.023
0.026
0.030
0.035
0.040
0.046
0.052
0.060
0.069
0.079
0.091
0.105
Volume In %
0.00
0.00
0.00
0.00
0.00
0.00
0.00
0.00
0.00
0.00
0.00
0.00
0.00
0.00
0.00
0.00
0.00
Size (µm)0.105
0.120
0.138
0.158
0.182
0.209
0.240
0.275
0.316
0.363
0.417
0.479
0.550
0.631
0.724
0.832
0.955
1.096
Volume In %
0.00
0.00
0.00
0.00
0.00
0.00
0.00
0.00
0.00
0.00
0.00
0.00
0.00
0.00
0.00
0.00
0.00
Size (µm)1.096
1.259
1.445
1.660
1.905
2.188
2.512
2.884
3.311
3.802
4.365
5.012
5.754
6.607
7.586
8.710
10.000
11.482
Volume In %
0.00
0.00
0.00
0.00
0.00
0.00
0.00
0.00
0.00
0.00
0.00
0.00
0.00
0.00
0.00
0.00
0.00
Size (µm)11.482
13.183
15.136
17.378
19.953
22.909
26.303
30.200
34.674
39.811
45.709
52.481
60.256
69.183
79.433
91.201
104.713
120.226
Volume In %
0.00
0.00
0.00
0.00
0.00
0.00
0.00
0.00
0.00
0.00
0.00
0.00
0.00
0.00
0.00
0.00
0.00
Size (µm)120.226
138.038
158.489
181.970
208.930
239.883
275.423
316.228
363.078
416.869
478.630
549.541
630.957
724.436
831.764
954.993
1096.478
1258.925
Volume In %
0.00
0.05
0.72
1.59
2.92
4.61
6.51
8.44
10.09
11.21
11.59
11.16
9.97
8.23
6.20
4.20
2.19
Size (µm)1258.925
1445.440
1659.587
1905.461
2187.762
2511.886
2884.032
3311.311
3801.894
4365.158
5011.872
5754.399
6606.934
7585.776
8709.636
10000.000
Volume In %
0.32
0.00
0.00
0.00
0.00
0.00
0.00
0.00
0.00
0.00
0.00
0.00
0.00
0.00
0.00
Wednesday, November 19, 2008 5:13:48 PM
AveragedPit1
Measured by:student
Sample bulk lot ref:
Mamallapuram
Sample Name:
Analysed:
Measured:
Sample Source & type:Wednesday, November 19, 2008 5:13:50 PM
S91 - AverageSOP Name:
Result Source:
Sensitivity:
Dispersant Name:Water Off
Size range:
Default
Particle RI:
1.330Result Emulation:
Absorption:0.020 to0.1
NormalAnalysis model:
2000.000
Dispersant RI:
1.520
General purposeParticle Name:
um
Tel := +[44] (0) 1684-892456 Fax +[44] (0) 1684-892789Malvern, UKMalvern Instruments Ltd.
Serial Number : MAL1022570Mastersizer 2000 Ver. 5.54
30 May 2011 8:05:32 AMRecord Number: 40File name: Mam Pit1

Result Analysis Report
Vol. Weighted Mean D[4,3]:
%
m²/g
um
Surface Weighted Mean D[3,2]:0.0125 586.111
d(0.9):
Accessory Name:
Span :1.246
umSpecific Surface Area:
19.87
Operator notes:
Uniformity:%Vol
Obscuration:
535.818 959.793d(0.1): um
0.383
480.576
um292.186 d(0.5):
Volume
Particle Size Distribution
0.01 0.1 1 10 100 1000 3000
Particle Size (µm)
0
2
4
6
8
10
12
Vol
ume
(%)
S92 - Average, Wednesday, November 19, 2008 5:21:19 PM
Hydro 2000G (A)
Result units:
um
Concentration:1.5123
Weighted Residual:2.093 %
Size (µm)0.010
0.011
0.013
0.015
0.017
0.020
0.023
0.026
0.030
0.035
0.040
0.046
0.052
0.060
0.069
0.079
0.091
0.105
Volume In %
0.00
0.00
0.00
0.00
0.00
0.00
0.00
0.00
0.00
0.00
0.00
0.00
0.00
0.00
0.00
0.00
0.00
Size (µm)0.105
0.120
0.138
0.158
0.182
0.209
0.240
0.275
0.316
0.363
0.417
0.479
0.550
0.631
0.724
0.832
0.955
1.096
Volume In %
0.00
0.00
0.00
0.00
0.00
0.00
0.00
0.00
0.00
0.00
0.00
0.00
0.00
0.00
0.00
0.00
0.00
Size (µm)1.096
1.259
1.445
1.660
1.905
2.188
2.512
2.884
3.311
3.802
4.365
5.012
5.754
6.607
7.586
8.710
10.000
11.482
Volume In %
0.00
0.00
0.00
0.00
0.00
0.00
0.00
0.00
0.00
0.00
0.00
0.00
0.00
0.00
0.00
0.00
0.00
Size (µm)11.482
13.183
15.136
17.378
19.953
22.909
26.303
30.200
34.674
39.811
45.709
52.481
60.256
69.183
79.433
91.201
104.713
120.226
Volume In %
0.00
0.00
0.00
0.00
0.00
0.00
0.00
0.00
0.00
0.00
0.00
0.00
0.00
0.00
0.00
0.00
0.00
Size (µm)120.226
138.038
158.489
181.970
208.930
239.883
275.423
316.228
363.078
416.869
478.630
549.541
630.957
724.436
831.764
954.993
1096.478
1258.925
Volume In %
0.00
0.03
0.45
1.19
2.32
3.84
5.62
7.52
9.25
10.58
11.28
11.22
10.40
8.96
7.11
5.17
3.37
Size (µm)1258.925
1445.440
1659.587
1905.461
2187.762
2511.886
2884.032
3311.311
3801.894
4365.158
5011.872
5754.399
6606.934
7585.776
8709.636
10000.000
Volume In %
1.63
0.05
0.00
0.00
0.00
0.00
0.00
0.00
0.00
0.00
0.00
0.00
0.00
0.00
0.00
Wednesday, November 19, 2008 5:21:19 PM
AveragedPit1
Measured by:student
Sample bulk lot ref:
Mamallapuram
Sample Name:
Analysed:
Measured:
Sample Source & type:Wednesday, November 19, 2008 5:21:21 PM
S92 - AverageSOP Name:
Result Source:
Sensitivity:
Dispersant Name:Water Off
Size range:
Default
Particle RI:
1.330Result Emulation:
Absorption:0.020 to0.1
NormalAnalysis model:
2000.000
Dispersant RI:
1.520
General purposeParticle Name:
um
Tel := +[44] (0) 1684-892456 Fax +[44] (0) 1684-892789Malvern, UKMalvern Instruments Ltd.
Serial Number : MAL1022570Mastersizer 2000 Ver. 5.54
30 May 2011 8:05:51 AMRecord Number: 44File name: Mam Pit1

Result Analysis Report
Vol. Weighted Mean D[4,3]:
%
m²/g
um
Surface Weighted Mean D[3,2]:0.0134 544.129
d(0.9):
Accessory Name:
Span :1.234
umSpecific Surface Area:
16.67
Operator notes:
Uniformity:%Vol
Obscuration:
499.633 888.202d(0.1): um
0.38
446.643
um271.563 d(0.5):
Volume
Particle Size Distribution
0.01 0.1 1 10 100 1000 3000
Particle Size (µm)
0
2
4
6
8
10
12
Vol
ume
(%)
S93 - Average, Wednesday, November 19, 2008 5:27:29 PM
Hydro 2000G (A)
Result units:
um
Concentration:1.1567
Weighted Residual:1.876 %
Size (µm)0.010
0.011
0.013
0.015
0.017
0.020
0.023
0.026
0.030
0.035
0.040
0.046
0.052
0.060
0.069
0.079
0.091
0.105
Volume In %
0.00
0.00
0.00
0.00
0.00
0.00
0.00
0.00
0.00
0.00
0.00
0.00
0.00
0.00
0.00
0.00
0.00
Size (µm)0.105
0.120
0.138
0.158
0.182
0.209
0.240
0.275
0.316
0.363
0.417
0.479
0.550
0.631
0.724
0.832
0.955
1.096
Volume In %
0.00
0.00
0.00
0.00
0.00
0.00
0.00
0.00
0.00
0.00
0.00
0.00
0.00
0.00
0.00
0.00
0.00
Size (µm)1.096
1.259
1.445
1.660
1.905
2.188
2.512
2.884
3.311
3.802
4.365
5.012
5.754
6.607
7.586
8.710
10.000
11.482
Volume In %
0.00
0.00
0.00
0.00
0.00
0.00
0.00
0.00
0.00
0.00
0.00
0.00
0.00
0.00
0.00
0.00
0.00
Size (µm)11.482
13.183
15.136
17.378
19.953
22.909
26.303
30.200
34.674
39.811
45.709
52.481
60.256
69.183
79.433
91.201
104.713
120.226
Volume In %
0.00
0.00
0.00
0.00
0.00
0.00
0.00
0.00
0.00
0.00
0.00
0.00
0.00
0.00
0.00
0.00
0.00
Size (µm)120.226
138.038
158.489
181.970
208.930
239.883
275.423
316.228
363.078
416.869
478.630
549.541
630.957
724.436
831.764
954.993
1096.478
1258.925
Volume In %
0.03
0.22
0.83
1.74
3.04
4.70
6.53
8.38
9.96
11.02
11.39
10.97
9.83
8.15
6.20
4.28
2.34
Size (µm)1258.925
1445.440
1659.587
1905.461
2187.762
2511.886
2884.032
3311.311
3801.894
4365.158
5011.872
5754.399
6606.934
7585.776
8709.636
10000.000
Volume In %
0.38
0.00
0.00
0.00
0.00
0.00
0.00
0.00
0.00
0.00
0.00
0.00
0.00
0.00
0.00
Wednesday, November 19, 2008 5:27:29 PM
AveragedPit1
Measured by:student
Sample bulk lot ref:
Mamallapuram
Sample Name:
Analysed:
Measured:
Sample Source & type:Wednesday, November 19, 2008 5:27:30 PM
S93 - AverageSOP Name:
Result Source:
Sensitivity:
Dispersant Name:Water Off
Size range:
Default
Particle RI:
1.330Result Emulation:
Absorption:0.020 to0.1
NormalAnalysis model:
2000.000
Dispersant RI:
1.520
General purposeParticle Name:
um
Tel := +[44] (0) 1684-892456 Fax +[44] (0) 1684-892789Malvern, UKMalvern Instruments Ltd.
Serial Number : MAL1022570Mastersizer 2000 Ver. 5.54
30 May 2011 8:06:53 AMRecord Number: 48File name: Mam Pit1

Result Analysis Report
Vol. Weighted Mean D[4,3]:
%
m²/g
um
Surface Weighted Mean D[3,2]:0.0144 510.328
d(0.9):
Accessory Name:
Span :1.239
umSpecific Surface Area:
16.61
Operator notes:
Uniformity:%Vol
Obscuration:
469.230 833.722d(0.1): um
0.379
417.452
um252.515 d(0.5):
Volume
Particle Size Distribution
0.01 0.1 1 10 100 1000 3000
Particle Size (µm)
0
2
4
6
8
10
12
Vol
ume
(%)
S94 - Average, Wednesday, November 19, 2008 5:34:34 PM
Hydro 2000G (A)
Result units:
um
Concentration:1.0768
Weighted Residual:1.695 %
Size (µm)0.010
0.011
0.013
0.015
0.017
0.020
0.023
0.026
0.030
0.035
0.040
0.046
0.052
0.060
0.069
0.079
0.091
0.105
Volume In %
0.00
0.00
0.00
0.00
0.00
0.00
0.00
0.00
0.00
0.00
0.00
0.00
0.00
0.00
0.00
0.00
0.00
Size (µm)0.105
0.120
0.138
0.158
0.182
0.209
0.240
0.275
0.316
0.363
0.417
0.479
0.550
0.631
0.724
0.832
0.955
1.096
Volume In %
0.00
0.00
0.00
0.00
0.00
0.00
0.00
0.00
0.00
0.00
0.00
0.00
0.00
0.00
0.00
0.00
0.00
Size (µm)1.096
1.259
1.445
1.660
1.905
2.188
2.512
2.884
3.311
3.802
4.365
5.012
5.754
6.607
7.586
8.710
10.000
11.482
Volume In %
0.00
0.00
0.00
0.00
0.00
0.00
0.00
0.00
0.00
0.00
0.00
0.00
0.00
0.00
0.00
0.00
0.00
Size (µm)11.482
13.183
15.136
17.378
19.953
22.909
26.303
30.200
34.674
39.811
45.709
52.481
60.256
69.183
79.433
91.201
104.713
120.226
Volume In %
0.00
0.00
0.00
0.00
0.00
0.00
0.00
0.00
0.00
0.00
0.00
0.00
0.00
0.00
0.00
0.00
0.00
Size (µm)120.226
138.038
158.489
181.970
208.930
239.883
275.423
316.228
363.078
416.869
478.630
549.541
630.957
724.436
831.764
954.993
1096.478
1258.925
Volume In %
0.09
0.59
1.28
2.39
3.81
5.52
7.33
9.04
10.39
11.18
11.23
10.53
9.17
7.35
5.34
3.37
1.38
Size (µm)1258.925
1445.440
1659.587
1905.461
2187.762
2511.886
2884.032
3311.311
3801.894
4365.158
5011.872
5754.399
6606.934
7585.776
8709.636
10000.000
Volume In %
0.02
0.00
0.00
0.00
0.00
0.00
0.00
0.00
0.00
0.00
0.00
0.00
0.00
0.00
0.00
Wednesday, November 19, 2008 5:34:34 PM
AveragedPit1
Measured by:student
Sample bulk lot ref:
Mamallapuram
Sample Name:
Analysed:
Measured:
Sample Source & type:Wednesday, November 19, 2008 5:34:35 PM
S94 - AverageSOP Name:
Result Source:
Sensitivity:
Dispersant Name:Water Off
Size range:
Default
Particle RI:
1.330Result Emulation:
Absorption:0.020 to0.1
NormalAnalysis model:
2000.000
Dispersant RI:
1.520
General purposeParticle Name:
um
Tel := +[44] (0) 1684-892456 Fax +[44] (0) 1684-892789Malvern, UKMalvern Instruments Ltd.
Serial Number : MAL1022570Mastersizer 2000 Ver. 5.54
30 May 2011 8:07:06 AMRecord Number: 52File name: Mam Pit1

Result Analysis Report
Vol. Weighted Mean D[4,3]:
%
m²/g
um
Surface Weighted Mean D[3,2]:0.0126 571.903
d(0.9):
Accessory Name:
Span :1.176
umSpecific Surface Area:
19.48
Operator notes:
Uniformity:%Vol
Obscuration:
528.514 917.233d(0.1): um
0.363
477.754
um295.741 d(0.5):
Volume
Particle Size Distribution
0.01 0.1 1 10 100 1000 3000
Particle Size (µm)
0
2
4
6
8
10
12
14
Vol
ume
(%)
S95 - Average, Wednesday, November 19, 2008 5:40:32 PM
Hydro 2000G (A)
Result units:
um
Concentration:1.4704
Weighted Residual:2.084 %
Size (µm)0.010
0.011
0.013
0.015
0.017
0.020
0.023
0.026
0.030
0.035
0.040
0.046
0.052
0.060
0.069
0.079
0.091
0.105
Volume In %
0.00
0.00
0.00
0.00
0.00
0.00
0.00
0.00
0.00
0.00
0.00
0.00
0.00
0.00
0.00
0.00
0.00
Size (µm)0.105
0.120
0.138
0.158
0.182
0.209
0.240
0.275
0.316
0.363
0.417
0.479
0.550
0.631
0.724
0.832
0.955
1.096
Volume In %
0.00
0.00
0.00
0.00
0.00
0.00
0.00
0.00
0.00
0.00
0.00
0.00
0.00
0.00
0.00
0.00
0.00
Size (µm)1.096
1.259
1.445
1.660
1.905
2.188
2.512
2.884
3.311
3.802
4.365
5.012
5.754
6.607
7.586
8.710
10.000
11.482
Volume In %
0.00
0.00
0.00
0.00
0.00
0.00
0.00
0.00
0.00
0.00
0.00
0.00
0.00
0.00
0.00
0.00
0.00
Size (µm)11.482
13.183
15.136
17.378
19.953
22.909
26.303
30.200
34.674
39.811
45.709
52.481
60.256
69.183
79.433
91.201
104.713
120.226
Volume In %
0.00
0.00
0.00
0.00
0.00
0.00
0.00
0.00
0.00
0.00
0.00
0.00
0.00
0.00
0.00
0.00
0.00
Size (µm)120.226
138.038
158.489
181.970
208.930
239.883
275.423
316.228
363.078
416.869
478.630
549.541
630.957
724.436
831.764
954.993
1096.478
1258.925
Volume In %
0.00
0.01
0.29
1.03
2.19
3.80
5.71
7.77
9.65
11.10
11.83
11.70
10.72
9.05
6.98
4.84
2.76
Size (µm)1258.925
1445.440
1659.587
1905.461
2187.762
2511.886
2884.032
3311.311
3801.894
4365.158
5011.872
5754.399
6606.934
7585.776
8709.636
10000.000
Volume In %
0.59
0.00
0.00
0.00
0.00
0.00
0.00
0.00
0.00
0.00
0.00
0.00
0.00
0.00
0.00
Wednesday, November 19, 2008 5:40:32 PM
AveragedPit1
Measured by:student
Sample bulk lot ref:
Mamallapuram
Sample Name:
Analysed:
Measured:
Sample Source & type:Wednesday, November 19, 2008 5:40:33 PM
S95 - AverageSOP Name:
Result Source:
Sensitivity:
Dispersant Name:Water Off
Size range:
Default
Particle RI:
1.330Result Emulation:
Absorption:0.020 to0.1
NormalAnalysis model:
2000.000
Dispersant RI:
1.520
General purposeParticle Name:
um
Tel := +[44] (0) 1684-892456 Fax +[44] (0) 1684-892789Malvern, UKMalvern Instruments Ltd.
Serial Number : MAL1022570Mastersizer 2000 Ver. 5.54
30 May 2011 8:07:16 AMRecord Number: 57File name: Mam Pit1

Result Analysis Report
Vol. Weighted Mean D[4,3]:
%
m²/g
um
Surface Weighted Mean D[3,2]:0.0138 538.810
d(0.9):
Accessory Name:
Span :1.280
umSpecific Surface Area:
20.95
Operator notes:
Uniformity:%Vol
Obscuration:
492.920 891.082d(0.1): um
0.394
434.975
um260.193 d(0.5):
Volume
Particle Size Distribution
0.01 0.1 1 10 100 1000 3000
Particle Size (µm)
0
2
4
6
8
10
12
Vol
ume
(%)
S96 - Average, Wednesday, November 19, 2008 5:46:11 PM
Hydro 2000G (A)
Result units:
um
Concentration:1.4518
Weighted Residual:1.787 %
Size (µm)0.010
0.011
0.013
0.015
0.017
0.020
0.023
0.026
0.030
0.035
0.040
0.046
0.052
0.060
0.069
0.079
0.091
0.105
Volume In %
0.00
0.00
0.00
0.00
0.00
0.00
0.00
0.00
0.00
0.00
0.00
0.00
0.00
0.00
0.00
0.00
0.00
Size (µm)0.105
0.120
0.138
0.158
0.182
0.209
0.240
0.275
0.316
0.363
0.417
0.479
0.550
0.631
0.724
0.832
0.955
1.096
Volume In %
0.00
0.00
0.00
0.00
0.00
0.00
0.00
0.00
0.00
0.00
0.00
0.00
0.00
0.00
0.00
0.00
0.00
Size (µm)1.096
1.259
1.445
1.660
1.905
2.188
2.512
2.884
3.311
3.802
4.365
5.012
5.754
6.607
7.586
8.710
10.000
11.482
Volume In %
0.00
0.00
0.00
0.00
0.00
0.00
0.00
0.00
0.00
0.00
0.00
0.00
0.00
0.00
0.00
0.00
0.00
Size (µm)11.482
13.183
15.136
17.378
19.953
22.909
26.303
30.200
34.674
39.811
45.709
52.481
60.256
69.183
79.433
91.201
104.713
120.226
Volume In %
0.00
0.00
0.00
0.00
0.00
0.00
0.00
0.00
0.00
0.00
0.00
0.00
0.00
0.00
0.00
0.00
0.02
Size (µm)120.226
138.038
158.489
181.970
208.930
239.883
275.423
316.228
363.078
416.869
478.630
549.541
630.957
724.436
831.764
954.993
1096.478
1258.925
Volume In %
0.13
0.52
1.13
2.10
3.38
4.95
6.65
8.34
9.74
10.69
10.99
10.59
9.52
7.95
6.11
4.27
2.42
Size (µm)1258.925
1445.440
1659.587
1905.461
2187.762
2511.886
2884.032
3311.311
3801.894
4365.158
5011.872
5754.399
6606.934
7585.776
8709.636
10000.000
Volume In %
0.49
0.00
0.00
0.00
0.00
0.00
0.00
0.00
0.00
0.00
0.00
0.00
0.00
0.00
0.00
Wednesday, November 19, 2008 5:46:11 PM
AveragedPit1
Measured by:student
Sample bulk lot ref:
Mamallapuram
Sample Name:
Analysed:
Measured:
Sample Source & type:Wednesday, November 19, 2008 5:46:13 PM
S96 - AverageSOP Name:
Result Source:
Sensitivity:
Dispersant Name:Water Off
Size range:
Default
Particle RI:
1.330Result Emulation:
Absorption:0.020 to0.1
NormalAnalysis model:
2000.000
Dispersant RI:
1.520
General purposeParticle Name:
um
Tel := +[44] (0) 1684-892456 Fax +[44] (0) 1684-892789Malvern, UKMalvern Instruments Ltd.
Serial Number : MAL1022570Mastersizer 2000 Ver. 5.54
30 May 2011 8:07:27 AMRecord Number: 61File name: Mam Pit1

Result Analysis Report
Vol. Weighted Mean D[4,3]:
%
m²/g
um
Surface Weighted Mean D[3,2]:0.0234 418.491
d(0.9):
Accessory Name:
Span :1.437
umSpecific Surface Area:
18.12
Operator notes:
Uniformity:%Vol
Obscuration:
380.413 725.892d(0.1): um
0.447
256.031
um179.331 d(0.5):
Volume
Particle Size Distribution
0.01 0.1 1 10 100 1000 3000
Particle Size (µm)
0
2
4
6
8
10
12
Vol
ume
(%)
S97 - Average, Wednesday, November 19, 2008 5:51:25 PM
Hydro 2000G (A)
Result units:
um
Concentration:0.7207
Weighted Residual:1.231 %
Size (µm)0.010
0.011
0.013
0.015
0.017
0.020
0.023
0.026
0.030
0.035
0.040
0.046
0.052
0.060
0.069
0.079
0.091
0.105
Volume In %
0.00
0.00
0.00
0.00
0.00
0.00
0.00
0.00
0.00
0.00
0.00
0.00
0.00
0.00
0.00
0.00
0.00
Size (µm)0.105
0.120
0.138
0.158
0.182
0.209
0.240
0.275
0.316
0.363
0.417
0.479
0.550
0.631
0.724
0.832
0.955
1.096
Volume In %
0.00
0.00
0.00
0.00
0.00
0.00
0.00
0.00
0.00
0.00
0.00
0.00
0.00
0.00
0.00
0.00
0.00
Size (µm)1.096
1.259
1.445
1.660
1.905
2.188
2.512
2.884
3.311
3.802
4.365
5.012
5.754
6.607
7.586
8.710
10.000
11.482
Volume In %
0.00
0.00
0.00
0.00
0.00
0.00
0.00
0.00
0.00
0.00
0.00
0.00
0.00
0.03
0.06
0.06
0.07
Size (µm)11.482
13.183
15.136
17.378
19.953
22.909
26.303
30.200
34.674
39.811
45.709
52.481
60.256
69.183
79.433
91.201
104.713
120.226
Volume In %
0.07
0.07
0.07
0.08
0.10
0.13
0.18
0.23
0.27
0.30
0.31
0.29
0.24
0.20
0.22
0.34
0.65
Size (µm)120.226
138.038
158.489
181.970
208.930
239.883
275.423
316.228
363.078
416.869
478.630
549.541
630.957
724.436
831.764
954.993
1096.478
1258.925
Volume In %
1.20
2.05
3.16
4.53
6.00
7.46
8.70
9.58
9.97
9.80
9.09
7.93
6.48
4.87
3.35
1.71
0.15
Size (µm)1258.925
1445.440
1659.587
1905.461
2187.762
2511.886
2884.032
3311.311
3801.894
4365.158
5011.872
5754.399
6606.934
7585.776
8709.636
10000.000
Volume In %
0.00
0.00
0.00
0.00
0.00
0.00
0.00
0.00
0.00
0.00
0.00
0.00
0.00
0.00
0.00
Wednesday, November 19, 2008 5:51:25 PM
AveragedPit1
Measured by:student
Sample bulk lot ref:
Mamallapuram
Sample Name:
Analysed:
Measured:
Sample Source & type:Wednesday, November 19, 2008 5:51:27 PM
S97 - AverageSOP Name:
Result Source:
Sensitivity:
Dispersant Name:Water Off
Size range:
Default
Particle RI:
1.330Result Emulation:
Absorption:0.020 to0.1
NormalAnalysis model:
2000.000
Dispersant RI:
1.520
General purposeParticle Name:
um
Tel := +[44] (0) 1684-892456 Fax +[44] (0) 1684-892789Malvern, UKMalvern Instruments Ltd.
Serial Number : MAL1022570Mastersizer 2000 Ver. 5.54
30 May 2011 8:07:40 AMRecord Number: 65File name: Mam Pit1

Result Analysis Report
Vol. Weighted Mean D[4,3]:
%
m²/g
um
Surface Weighted Mean D[3,2]:0.0281 396.467
d(0.9):
Accessory Name:
Span :1.455
umSpecific Surface Area:
20.90
Operator notes:
Uniformity:%Vol
Obscuration:
359.236 692.141d(0.1): um
0.452
213.484
um169.481 d(0.5):
Volume
Particle Size Distribution
0.01 0.1 1 10 100 1000 3000
Particle Size (µm)
0
2
4
6
8
10
12
Vol
ume
(%)
S98 - Average, Wednesday, November 19, 2008 6:00:36 PM
Hydro 2000G (A)
Result units:
um
Concentration:0.6996
Weighted Residual:1.159 %
Size (µm)0.010
0.011
0.013
0.015
0.017
0.020
0.023
0.026
0.030
0.035
0.040
0.046
0.052
0.060
0.069
0.079
0.091
0.105
Volume In %
0.00
0.00
0.00
0.00
0.00
0.00
0.00
0.00
0.00
0.00
0.00
0.00
0.00
0.00
0.00
0.00
0.00
Size (µm)0.105
0.120
0.138
0.158
0.182
0.209
0.240
0.275
0.316
0.363
0.417
0.479
0.550
0.631
0.724
0.832
0.955
1.096
Volume In %
0.00
0.00
0.00
0.00
0.00
0.00
0.00
0.00
0.00
0.00
0.00
0.00
0.00
0.00
0.00
0.00
0.00
Size (µm)1.096
1.259
1.445
1.660
1.905
2.188
2.512
2.884
3.311
3.802
4.365
5.012
5.754
6.607
7.586
8.710
10.000
11.482
Volume In %
0.00
0.00
0.00
0.00
0.00
0.00
0.00
0.00
0.00
0.00
0.02
0.07
0.07
0.08
0.09
0.09
0.09
Size (µm)11.482
13.183
15.136
17.378
19.953
22.909
26.303
30.200
34.674
39.811
45.709
52.481
60.256
69.183
79.433
91.201
104.713
120.226
Volume In %
0.10
0.10
0.11
0.13
0.16
0.20
0.25
0.31
0.35
0.37
0.35
0.30
0.22
0.15
0.16
0.30
0.68
Size (µm)120.226
138.038
158.489
181.970
208.930
239.883
275.423
316.228
363.078
416.869
478.630
549.541
630.957
724.436
831.764
954.993
1096.478
1258.925
Volume In %
1.34
2.33
3.59
5.09
6.62
8.05
9.16
9.83
9.94
9.49
8.55
7.24
5.75
4.20
2.80
1.27
0.00
Size (µm)1258.925
1445.440
1659.587
1905.461
2187.762
2511.886
2884.032
3311.311
3801.894
4365.158
5011.872
5754.399
6606.934
7585.776
8709.636
10000.000
Volume In %
0.00
0.00
0.00
0.00
0.00
0.00
0.00
0.00
0.00
0.00
0.00
0.00
0.00
0.00
0.00
Wednesday, November 19, 2008 6:00:36 PM
AveragedPit1
Measured by:student
Sample bulk lot ref:
Mamallapuram
Sample Name:
Analysed:
Measured:
Sample Source & type:Wednesday, November 19, 2008 6:00:38 PM
S98 - AverageSOP Name:
Result Source:
Sensitivity:
Dispersant Name:Water Off
Size range:
Default
Particle RI:
1.330Result Emulation:
Absorption:0.020 to0.1
NormalAnalysis model:
2000.000
Dispersant RI:
1.520
General purposeParticle Name:
um
Tel := +[44] (0) 1684-892456 Fax +[44] (0) 1684-892789Malvern, UKMalvern Instruments Ltd.
Serial Number : MAL1022570Mastersizer 2000 Ver. 5.54
30 May 2011 8:07:51 AMRecord Number: 69File name: Mam Pit1

Result Analysis Report
Vol. Weighted Mean D[4,3]:
%
m²/g
um
Surface Weighted Mean D[3,2]:0.0244 433.931
d(0.9):
Accessory Name:
Span :1.451
umSpecific Surface Area:
20.95
Operator notes:
Uniformity:%Vol
Obscuration:
391.478 755.884d(0.1): um
0.452
245.977
um187.960 d(0.5):
Volume
Particle Size Distribution
0.01 0.1 1 10 100 1000 3000
Particle Size (µm)
0
2
4
6
8
10
12
Vol
ume
(%)
S99 - Average, Wednesday, November 19, 2008 6:07:01 PM
Hydro 2000G (A)
Result units:
um
Concentration:0.8108
Weighted Residual:1.221 %
Size (µm)0.010
0.011
0.013
0.015
0.017
0.020
0.023
0.026
0.030
0.035
0.040
0.046
0.052
0.060
0.069
0.079
0.091
0.105
Volume In %
0.00
0.00
0.00
0.00
0.00
0.00
0.00
0.00
0.00
0.00
0.00
0.00
0.00
0.00
0.00
0.00
0.00
Size (µm)0.105
0.120
0.138
0.158
0.182
0.209
0.240
0.275
0.316
0.363
0.417
0.479
0.550
0.631
0.724
0.832
0.955
1.096
Volume In %
0.00
0.00
0.00
0.00
0.00
0.00
0.00
0.00
0.00
0.00
0.00
0.00
0.00
0.00
0.00
0.00
0.00
Size (µm)1.096
1.259
1.445
1.660
1.905
2.188
2.512
2.884
3.311
3.802
4.365
5.012
5.754
6.607
7.586
8.710
10.000
11.482
Volume In %
0.00
0.00
0.00
0.00
0.00
0.00
0.00
0.00
0.00
0.00
0.00
0.02
0.07
0.07
0.08
0.08
0.08
Size (µm)11.482
13.183
15.136
17.378
19.953
22.909
26.303
30.200
34.674
39.811
45.709
52.481
60.256
69.183
79.433
91.201
104.713
120.226
Volume In %
0.08
0.09
0.09
0.10
0.12
0.15
0.19
0.23
0.27
0.29
0.28
0.24
0.17
0.10
0.07
0.16
0.43
Size (µm)120.226
138.038
158.489
181.970
208.930
239.883
275.423
316.228
363.078
416.869
478.630
549.541
630.957
724.436
831.764
954.993
1096.478
1258.925
Volume In %
0.95
1.79
2.91
4.29
5.80
7.30
8.58
9.51
9.93
9.81
9.16
8.07
6.68
5.17
3.69
2.19
0.69
Size (µm)1258.925
1445.440
1659.587
1905.461
2187.762
2511.886
2884.032
3311.311
3801.894
4365.158
5011.872
5754.399
6606.934
7585.776
8709.636
10000.000
Volume In %
0.01
0.00
0.00
0.00
0.00
0.00
0.00
0.00
0.00
0.00
0.00
0.00
0.00
0.00
0.00
Wednesday, November 19, 2008 6:07:01 PM
AveragedPit1
Measured by:student
Sample bulk lot ref:
Mamallapuram
Sample Name:
Analysed:
Measured:
Sample Source & type:Wednesday, November 19, 2008 6:07:03 PM
S99 - AverageSOP Name:
Result Source:
Sensitivity:
Dispersant Name:Water Off
Size range:
Default
Particle RI:
1.330Result Emulation:
Absorption:0.020 to0.1
NormalAnalysis model:
2000.000
Dispersant RI:
1.520
General purposeParticle Name:
um
Tel := +[44] (0) 1684-892456 Fax +[44] (0) 1684-892789Malvern, UKMalvern Instruments Ltd.
Serial Number : MAL1022570Mastersizer 2000 Ver. 5.54
30 May 2011 8:08:02 AMRecord Number: 73File name: Mam Pit1

Result Analysis Report
Vol. Weighted Mean D[4,3]:
%
m²/g
um
Surface Weighted Mean D[3,2]:0.0361 430.939
d(0.9):
Accessory Name:
Span :1.434
umSpecific Surface Area:
20.52
Operator notes:
Uniformity:%Vol
Obscuration:
394.654 748.949d(0.1): um
0.449
166.173
um183.199 d(0.5):
Volume
Particle Size Distribution
0.01 0.1 1 10 100 1000 3000
Particle Size (µm)
0
2
4
6
8
10
12
Vol
ume
(%)
S100 - Average, Wednesday, November 19, 2008 6:13:07 PM
Hydro 2000G (A)
Result units:
um
Concentration:0.5224
Weighted Residual:1.308 %
Size (µm)0.010
0.011
0.013
0.015
0.017
0.020
0.023
0.026
0.030
0.035
0.040
0.046
0.052
0.060
0.069
0.079
0.091
0.105
Volume In %
0.00
0.00
0.00
0.00
0.00
0.00
0.00
0.00
0.00
0.00
0.00
0.00
0.00
0.00
0.00
0.00
0.00
Size (µm)0.105
0.120
0.138
0.158
0.182
0.209
0.240
0.275
0.316
0.363
0.417
0.479
0.550
0.631
0.724
0.832
0.955
1.096
Volume In %
0.00
0.00
0.00
0.00
0.00
0.00
0.00
0.00
0.00
0.00
0.00
0.00
0.00
0.00
0.00
0.00
0.00
Size (µm)1.096
1.259
1.445
1.660
1.905
2.188
2.512
2.884
3.311
3.802
4.365
5.012
5.754
6.607
7.586
8.710
10.000
11.482
Volume In %
0.00
0.00
0.00
0.00
0.00
0.00
0.05
0.07
0.08
0.09
0.10
0.12
0.13
0.14
0.16
0.17
0.18
Size (µm)11.482
13.183
15.136
17.378
19.953
22.909
26.303
30.200
34.674
39.811
45.709
52.481
60.256
69.183
79.433
91.201
104.713
120.226
Volume In %
0.18
0.19
0.19
0.20
0.21
0.22
0.24
0.26
0.27
0.27
0.24
0.19
0.13
0.02
0.01
0.12
0.39
Size (µm)120.226
138.038
158.489
181.970
208.930
239.883
275.423
316.228
363.078
416.869
478.630
549.541
630.957
724.436
831.764
954.993
1096.478
1258.925
Volume In %
0.88
1.65
2.70
4.03
5.49
6.99
8.33
9.37
9.93
9.94
9.39
8.34
6.92
5.31
3.69
2.04
0.40
Size (µm)1258.925
1445.440
1659.587
1905.461
2187.762
2511.886
2884.032
3311.311
3801.894
4365.158
5011.872
5754.399
6606.934
7585.776
8709.636
10000.000
Volume In %
0.00
0.00
0.00
0.00
0.00
0.00
0.00
0.00
0.00
0.00
0.00
0.00
0.00
0.00
0.00
Wednesday, November 19, 2008 6:13:07 PM
AveragedPit1
Measured by:student
Sample bulk lot ref:
Mamallapuram
Sample Name:
Analysed:
Measured:
Sample Source & type:Wednesday, November 19, 2008 6:13:09 PM
S100 - AverageSOP Name:
Result Source:
Sensitivity:
Dispersant Name:Water Off
Size range:
Default
Particle RI:
1.330Result Emulation:
Absorption:0.020 to0.1
NormalAnalysis model:
2000.000
Dispersant RI:
1.520
General purposeParticle Name:
um
Tel := +[44] (0) 1684-892456 Fax +[44] (0) 1684-892789Malvern, UKMalvern Instruments Ltd.
Serial Number : MAL1022570Mastersizer 2000 Ver. 5.54
30 May 2011 8:08:13 AMRecord Number: 77File name: Mam Pit1

Result Analysis Report
Vol. Weighted Mean D[4,3]:
%
m²/g
um
Surface Weighted Mean D[3,2]:0.0169 490.395
d(0.9):
Accessory Name:
Span :1.442
umSpecific Surface Area:
21.69
Operator notes:
Uniformity:%Vol
Obscuration:
440.281 849.235d(0.1): um
0.446
354.186
um214.557 d(0.5):
Volume
Particle Size Distribution
0.01 0.1 1 10 100 1000 3000
Particle Size (µm)
0
2
4
6
8
10
12
Vol
ume
(%)
S101 - Average, Wednesday, November 19, 2008 6:18:37 PM
Hydro 2000G (A)
Result units:
um
Concentration:1.2271
Weighted Residual:1.490 %
Size (µm)0.010
0.011
0.013
0.015
0.017
0.020
0.023
0.026
0.030
0.035
0.040
0.046
0.052
0.060
0.069
0.079
0.091
0.105
Volume In %
0.00
0.00
0.00
0.00
0.00
0.00
0.00
0.00
0.00
0.00
0.00
0.00
0.00
0.00
0.00
0.00
0.00
Size (µm)0.105
0.120
0.138
0.158
0.182
0.209
0.240
0.275
0.316
0.363
0.417
0.479
0.550
0.631
0.724
0.832
0.955
1.096
Volume In %
0.00
0.00
0.00
0.00
0.00
0.00
0.00
0.00
0.00
0.00
0.00
0.00
0.00
0.00
0.00
0.00
0.00
Size (µm)1.096
1.259
1.445
1.660
1.905
2.188
2.512
2.884
3.311
3.802
4.365
5.012
5.754
6.607
7.586
8.710
10.000
11.482
Volume In %
0.00
0.00
0.00
0.00
0.00
0.00
0.00
0.00
0.00
0.00
0.00
0.00
0.00
0.00
0.00
0.00
0.00
Size (µm)11.482
13.183
15.136
17.378
19.953
22.909
26.303
30.200
34.674
39.811
45.709
52.481
60.256
69.183
79.433
91.201
104.713
120.226
Volume In %
0.00
0.00
0.00
0.00
0.03
0.07
0.08
0.10
0.12
0.13
0.13
0.11
0.08
0.01
0.01
0.11
0.33
Size (µm)120.226
138.038
158.489
181.970
208.930
239.883
275.423
316.228
363.078
416.869
478.630
549.541
630.957
724.436
831.764
954.993
1096.478
1258.925
Volume In %
0.73
1.39
2.29
3.46
4.79
6.23
7.59
8.75
9.55
9.89
9.71
9.02
7.91
6.52
4.99
3.49
1.98
Size (µm)1258.925
1445.440
1659.587
1905.461
2187.762
2511.886
2884.032
3311.311
3801.894
4365.158
5011.872
5754.399
6606.934
7585.776
8709.636
10000.000
Volume In %
0.40
0.00
0.00
0.00
0.00
0.00
0.00
0.00
0.00
0.00
0.00
0.00
0.00
0.00
0.00
Wednesday, November 19, 2008 6:18:37 PM
AveragedPit1
Measured by:student
Sample bulk lot ref:
Mamallapuram
Sample Name:
Analysed:
Measured:
Sample Source & type:Wednesday, November 19, 2008 6:18:38 PM
S101 - AverageSOP Name:
Result Source:
Sensitivity:
Dispersant Name:Water Off
Size range:
Default
Particle RI:
1.330Result Emulation:
Absorption:0.020 to0.1
NormalAnalysis model:
2000.000
Dispersant RI:
1.520
General purposeParticle Name:
um
Tel := +[44] (0) 1684-892456 Fax +[44] (0) 1684-892789Malvern, UKMalvern Instruments Ltd.
Serial Number : MAL1022570Mastersizer 2000 Ver. 5.54
30 May 2011 8:08:23 AMRecord Number: 81File name: Mam Pit1

Result Analysis Report
Vol. Weighted Mean D[4,3]:
%
m²/g
um
Surface Weighted Mean D[3,2]:0.0147 518.027
d(0.9):
Accessory Name:
Span :1.366
umSpecific Surface Area:
28.35
Operator notes:
Uniformity:%Vol
Obscuration:
467.973 877.548d(0.1): um
0.418
407.949
um238.310 d(0.5):
Volume
Particle Size Distribution
0.01 0.1 1 10 100 1000 3000
Particle Size (µm)
0
2
4
6
8
10
12
Vol
ume
(%)
S102 - Average, Wednesday, November 19, 2008 6:23:50 PM
Hydro 2000G (A)
Result units:
um
Concentration:1.9313
Weighted Residual:1.707 %
Size (µm)0.010
0.011
0.013
0.015
0.017
0.020
0.023
0.026
0.030
0.035
0.040
0.046
0.052
0.060
0.069
0.079
0.091
0.105
Volume In %
0.00
0.00
0.00
0.00
0.00
0.00
0.00
0.00
0.00
0.00
0.00
0.00
0.00
0.00
0.00
0.00
0.00
Size (µm)0.105
0.120
0.138
0.158
0.182
0.209
0.240
0.275
0.316
0.363
0.417
0.479
0.550
0.631
0.724
0.832
0.955
1.096
Volume In %
0.00
0.00
0.00
0.00
0.00
0.00
0.00
0.00
0.00
0.00
0.00
0.00
0.00
0.00
0.00
0.00
0.00
Size (µm)1.096
1.259
1.445
1.660
1.905
2.188
2.512
2.884
3.311
3.802
4.365
5.012
5.754
6.607
7.586
8.710
10.000
11.482
Volume In %
0.00
0.00
0.00
0.00
0.00
0.00
0.00
0.00
0.00
0.00
0.00
0.00
0.00
0.00
0.00
0.00
0.00
Size (µm)11.482
13.183
15.136
17.378
19.953
22.909
26.303
30.200
34.674
39.811
45.709
52.481
60.256
69.183
79.433
91.201
104.713
120.226
Volume In %
0.00
0.00
0.00
0.00
0.00
0.00
0.00
0.00
0.00
0.00
0.00
0.00
0.00
0.00
0.00
0.00
0.07
Size (µm)120.226
138.038
158.489
181.970
208.930
239.883
275.423
316.228
363.078
416.869
478.630
549.541
630.957
724.436
831.764
954.993
1096.478
1258.925
Volume In %
0.45
0.95
1.75
2.84
4.18
5.69
7.21
8.61
9.68
10.28
10.31
9.75
8.68
7.21
5.55
3.92
2.28
Size (µm)1258.925
1445.440
1659.587
1905.461
2187.762
2511.886
2884.032
3311.311
3801.894
4365.158
5011.872
5754.399
6606.934
7585.776
8709.636
10000.000
Volume In %
0.59
0.01
0.00
0.00
0.00
0.00
0.00
0.00
0.00
0.00
0.00
0.00
0.00
0.00
0.00
Wednesday, November 19, 2008 6:23:50 PM
AveragedPit1
Measured by:student
Sample bulk lot ref:
Mamallapuram
Sample Name:
Analysed:
Measured:
Sample Source & type:Wednesday, November 19, 2008 6:23:51 PM
S102 - AverageSOP Name:
Result Source:
Sensitivity:
Dispersant Name:Water Off
Size range:
Default
Particle RI:
1.330Result Emulation:
Absorption:0.020 to0.1
NormalAnalysis model:
2000.000
Dispersant RI:
1.520
General purposeParticle Name:
um
Tel := +[44] (0) 1684-892456 Fax +[44] (0) 1684-892789Malvern, UKMalvern Instruments Ltd.
Serial Number : MAL1022570Mastersizer 2000 Ver. 5.54
30 May 2011 8:08:39 AMRecord Number: 85File name: Mam Pit1

Result Analysis Report
Vol. Weighted Mean D[4,3]:
%
m²/g
um
Surface Weighted Mean D[3,2]:0.0133 656.179
d(0.9):
Accessory Name:
Span :1.585
umSpecific Surface Area:
18.21
Operator notes:
Uniformity:%Vol
Obscuration:
582.716 1176.772d(0.1): um
0.488
451.517
um253.446 d(0.5):
Volume
Particle Size Distribution
0.01 0.1 1 10 100 1000 3000
Particle Size (µm)
0 1 2 3 4 5 6 7 8 9
10 11
Vol
ume
(%)
S104 - Average, Wednesday, April 08, 2009 11:29:49 AM
Hydro 2000G (A)
Result units:
um
Concentration:1.2872
Weighted Residual:1.855 %
Size (µm)0.010
0.011
0.013
0.015
0.017
0.020
0.023
0.026
0.030
0.035
0.040
0.046
0.052
0.060
0.069
0.079
0.091
0.105
Volume In %
0.00
0.00
0.00
0.00
0.00
0.00
0.00
0.00
0.00
0.00
0.00
0.00
0.00
0.00
0.00
0.00
0.00
Size (µm)0.105
0.120
0.138
0.158
0.182
0.209
0.240
0.275
0.316
0.363
0.417
0.479
0.550
0.631
0.724
0.832
0.955
1.096
Volume In %
0.00
0.00
0.00
0.00
0.00
0.00
0.00
0.00
0.00
0.00
0.00
0.00
0.00
0.00
0.00
0.00
0.00
Size (µm)1.096
1.259
1.445
1.660
1.905
2.188
2.512
2.884
3.311
3.802
4.365
5.012
5.754
6.607
7.586
8.710
10.000
11.482
Volume In %
0.00
0.00
0.00
0.00
0.00
0.00
0.00
0.00
0.00
0.00
0.00
0.00
0.00
0.00
0.00
0.00
0.00
Size (µm)11.482
13.183
15.136
17.378
19.953
22.909
26.303
30.200
34.674
39.811
45.709
52.481
60.256
69.183
79.433
91.201
104.713
120.226
Volume In %
0.00
0.00
0.00
0.00
0.00
0.00
0.00
0.00
0.05
0.06
0.07
0.09
0.11
0.14
0.19
0.28
0.40
Size (µm)120.226
138.038
158.489
181.970
208.930
239.883
275.423
316.228
363.078
416.869
478.630
549.541
630.957
724.436
831.764
954.993
1096.478
1258.925
Volume In %
0.60
0.89
1.31
1.88
2.63
3.56
4.62
5.78
6.91
7.92
8.67
9.07
9.04
8.58
7.72
6.56
5.23
Size (µm)1258.925
1445.440
1659.587
1905.461
2187.762
2511.886
2884.032
3311.311
3801.894
4365.158
5011.872
5754.399
6606.934
7585.776
8709.636
10000.000
Volume In %
3.87
2.53
1.06
0.16
0.00
0.00
0.00
0.00
0.00
0.00
0.00
0.00
0.00
0.00
0.00
Wednesday, April 08, 2009 11:29:49 AM
AveragedPit1
Measured by:JohnstonP
Sample bulk lot ref:
Vadanemelli
Sample Name:
Analysed:
Measured:
Sample Source & type:Wednesday, April 08, 2009 11:29:51 AM
S104 - AverageSOP Name:
Result Source:
Sensitivity:
Dispersant Name:Water Off
Size range:
Default
Particle RI:
1.330Result Emulation:
Absorption:0.020 to0.1
NormalAnalysis model:
2000.000
Dispersant RI:
1.520
General purposeParticle Name:
um
Tel := +[44] (0) 1684-892456 Fax +[44] (0) 1684-892789Malvern, UKMalvern Instruments Ltd.
Serial Number : MAL1022570Mastersizer 2000 Ver. 5.54
30 May 2011 8:33:02 AMRecord Number: 4File name: Vadanemelli

Result Analysis Report
Vol. Weighted Mean D[4,3]:
%
m²/g
um
Surface Weighted Mean D[3,2]:0.0133 555.223
d(0.9):
Accessory Name:
Span :1.294
umSpecific Surface Area:
17.03
Operator notes:
Uniformity:%Vol
Obscuration:
503.698 922.289d(0.1): um
0.399
449.798
um270.644 d(0.5):
Volume
Particle Size Distribution
0.01 0.1 1 10 100 1000 3000
Particle Size (µm)
0
2
4
6
8
10
12
Vol
ume
(%)
S105 - Average, Wednesday, April 08, 2009 11:40:17 AM
Hydro 2000G (A)
Result units:
um
Concentration:1.1923
Weighted Residual:1.739 %
Size (µm)0.010
0.011
0.013
0.015
0.017
0.020
0.023
0.026
0.030
0.035
0.040
0.046
0.052
0.060
0.069
0.079
0.091
0.105
Volume In %
0.00
0.00
0.00
0.00
0.00
0.00
0.00
0.00
0.00
0.00
0.00
0.00
0.00
0.00
0.00
0.00
0.00
Size (µm)0.105
0.120
0.138
0.158
0.182
0.209
0.240
0.275
0.316
0.363
0.417
0.479
0.550
0.631
0.724
0.832
0.955
1.096
Volume In %
0.00
0.00
0.00
0.00
0.00
0.00
0.00
0.00
0.00
0.00
0.00
0.00
0.00
0.00
0.00
0.00
0.00
Size (µm)1.096
1.259
1.445
1.660
1.905
2.188
2.512
2.884
3.311
3.802
4.365
5.012
5.754
6.607
7.586
8.710
10.000
11.482
Volume In %
0.00
0.00
0.00
0.00
0.00
0.00
0.00
0.00
0.00
0.00
0.00
0.00
0.00
0.00
0.00
0.00
0.00
Size (µm)11.482
13.183
15.136
17.378
19.953
22.909
26.303
30.200
34.674
39.811
45.709
52.481
60.256
69.183
79.433
91.201
104.713
120.226
Volume In %
0.00
0.00
0.00
0.00
0.00
0.00
0.00
0.00
0.00
0.00
0.00
0.00
0.00
0.00
0.00
0.00
0.00
Size (µm)120.226
138.038
158.489
181.970
208.930
239.883
275.423
316.228
363.078
416.869
478.630
549.541
630.957
724.436
831.764
954.993
1096.478
1258.925
Volume In %
0.03
0.22
0.85
1.78
3.09
4.73
6.51
8.28
9.74
10.70
11.01
10.60
9.56
8.04
6.29
4.58
2.85
Size (µm)1258.925
1445.440
1659.587
1905.461
2187.762
2511.886
2884.032
3311.311
3801.894
4365.158
5011.872
5754.399
6606.934
7585.776
8709.636
10000.000
Volume In %
1.12
0.03
0.00
0.00
0.00
0.00
0.00
0.00
0.00
0.00
0.00
0.00
0.00
0.00
0.00
Wednesday, April 08, 2009 11:40:17 AM
AveragedPit1
Measured by:JohnstonP
Sample bulk lot ref:
Vadanemelli
Sample Name:
Analysed:
Measured:
Sample Source & type:Wednesday, April 08, 2009 11:40:18 AM
S105 - AverageSOP Name:
Result Source:
Sensitivity:
Dispersant Name:Water Off
Size range:
Default
Particle RI:
1.330Result Emulation:
Absorption:0.020 to0.1
NormalAnalysis model:
2000.000
Dispersant RI:
1.520
General purposeParticle Name:
um
Tel := +[44] (0) 1684-892456 Fax +[44] (0) 1684-892789Malvern, UKMalvern Instruments Ltd.
Serial Number : MAL1022570Mastersizer 2000 Ver. 5.54
30 May 2011 8:33:13 AMRecord Number: 8File name: Vadanemelli

Result Analysis Report
Vol. Weighted Mean D[4,3]:
%
m²/g
um
Surface Weighted Mean D[3,2]:0.0128 576.653
d(0.9):
Accessory Name:
Span :1.274
umSpecific Surface Area:
16.83
Operator notes:
Uniformity:%Vol
Obscuration:
526.363 951.728d(0.1): um
0.393
467.455
um281.384 d(0.5):
Volume
Particle Size Distribution
0.01 0.1 1 10 100 1000 3000
Particle Size (µm)
0
2
4
6
8
10
12
Vol
ume
(%)
S106 - Average, Wednesday, April 08, 2009 11:48:28 AM
Hydro 2000G (A)
Result units:
um
Concentration:1.2236
Weighted Residual:2.005 %
Size (µm)0.010
0.011
0.013
0.015
0.017
0.020
0.023
0.026
0.030
0.035
0.040
0.046
0.052
0.060
0.069
0.079
0.091
0.105
Volume In %
0.00
0.00
0.00
0.00
0.00
0.00
0.00
0.00
0.00
0.00
0.00
0.00
0.00
0.00
0.00
0.00
0.00
Size (µm)0.105
0.120
0.138
0.158
0.182
0.209
0.240
0.275
0.316
0.363
0.417
0.479
0.550
0.631
0.724
0.832
0.955
1.096
Volume In %
0.00
0.00
0.00
0.00
0.00
0.00
0.00
0.00
0.00
0.00
0.00
0.00
0.00
0.00
0.00
0.00
0.00
Size (µm)1.096
1.259
1.445
1.660
1.905
2.188
2.512
2.884
3.311
3.802
4.365
5.012
5.754
6.607
7.586
8.710
10.000
11.482
Volume In %
0.00
0.00
0.00
0.00
0.00
0.00
0.00
0.00
0.00
0.00
0.00
0.00
0.00
0.00
0.00
0.00
0.00
Size (µm)11.482
13.183
15.136
17.378
19.953
22.909
26.303
30.200
34.674
39.811
45.709
52.481
60.256
69.183
79.433
91.201
104.713
120.226
Volume In %
0.00
0.00
0.00
0.00
0.00
0.00
0.00
0.00
0.00
0.00
0.00
0.00
0.00
0.00
0.00
0.00
0.00
Size (µm)120.226
138.038
158.489
181.970
208.930
239.883
275.423
316.228
363.078
416.869
478.630
549.541
630.957
724.436
831.764
954.993
1096.478
1258.925
Volume In %
0.04
0.23
0.72
1.49
2.62
4.11
5.83
7.63
9.25
10.48
11.09
10.97
10.13
8.69
6.88
4.99
3.25
Size (µm)1258.925
1445.440
1659.587
1905.461
2187.762
2511.886
2884.032
3311.311
3801.894
4365.158
5011.872
5754.399
6606.934
7585.776
8709.636
10000.000
Volume In %
1.56
0.05
0.00
0.00
0.00
0.00
0.00
0.00
0.00
0.00
0.00
0.00
0.00
0.00
0.00
Wednesday, April 08, 2009 11:48:28 AM
AveragedPit1
Measured by:JohnstonP
Sample bulk lot ref:
Vadanemelli
Sample Name:
Analysed:
Measured:
Sample Source & type:Wednesday, April 08, 2009 11:48:30 AM
S106 - AverageSOP Name:
Result Source:
Sensitivity:
Dispersant Name:Water Off
Size range:
Default
Particle RI:
1.330Result Emulation:
Absorption:0.020 to0.1
NormalAnalysis model:
2000.000
Dispersant RI:
1.520
General purposeParticle Name:
um
Tel := +[44] (0) 1684-892456 Fax +[44] (0) 1684-892789Malvern, UKMalvern Instruments Ltd.
Serial Number : MAL1022570Mastersizer 2000 Ver. 5.54
30 May 2011 8:33:24 AMRecord Number: 12File name: Vadanemelli

Result Analysis Report
Vol. Weighted Mean D[4,3]:
%
m²/g
um
Surface Weighted Mean D[3,2]:0.0383 550.534
d(0.9):
Accessory Name:
Span :1.445
umSpecific Surface Area:
20.86
Operator notes:
Uniformity:%Vol
Obscuration:
507.908 962.341d(0.1): um
0.455
156.774
um228.240 d(0.5):
Volume
Particle Size Distribution
0.01 0.1 1 10 100 1000 3000
Particle Size (µm)
0
2
4
6
8
10
12
Vol
ume
(%)
S107 - Average, Wednesday, April 08, 2009 11:56:28 AM
Hydro 2000G (A)
Result units:
um
Concentration:0.4959
Weighted Residual:1.695 %
Size (µm)0.010
0.011
0.013
0.015
0.017
0.020
0.023
0.026
0.030
0.035
0.040
0.046
0.052
0.060
0.069
0.079
0.091
0.105
Volume In %
0.00
0.00
0.00
0.00
0.00
0.00
0.00
0.00
0.00
0.00
0.00
0.00
0.00
0.00
0.00
0.00
0.00
Size (µm)0.105
0.120
0.138
0.158
0.182
0.209
0.240
0.275
0.316
0.363
0.417
0.479
0.550
0.631
0.724
0.832
0.955
1.096
Volume In %
0.00
0.00
0.00
0.00
0.00
0.00
0.00
0.00
0.00
0.00
0.00
0.00
0.00
0.00
0.00
0.00
0.00
Size (µm)1.096
1.259
1.445
1.660
1.905
2.188
2.512
2.884
3.311
3.802
4.365
5.012
5.754
6.607
7.586
8.710
10.000
11.482
Volume In %
0.00
0.00
0.00
0.00
0.00
0.06
0.07
0.08
0.09
0.11
0.12
0.13
0.15
0.16
0.18
0.19
0.21
Size (µm)11.482
13.183
15.136
17.378
19.953
22.909
26.303
30.200
34.674
39.811
45.709
52.481
60.256
69.183
79.433
91.201
104.713
120.226
Volume In %
0.22
0.24
0.24
0.25
0.26
0.26
0.27
0.29
0.31
0.33
0.35
0.36
0.33
0.28
0.19
0.11
0.03
Size (µm)120.226
138.038
158.489
181.970
208.930
239.883
275.423
316.228
363.078
416.869
478.630
549.541
630.957
724.436
831.764
954.993
1096.478
1258.925
Volume In %
0.06
0.29
0.74
1.51
2.59
3.97
5.52
7.10
8.50
9.54
10.05
9.96
9.28
8.09
6.58
4.95
3.38
Size (µm)1258.925
1445.440
1659.587
1905.461
2187.762
2511.886
2884.032
3311.311
3801.894
4365.158
5011.872
5754.399
6606.934
7585.776
8709.636
10000.000
Volume In %
1.92
0.07
0.00
0.00
0.00
0.00
0.00
0.00
0.00
0.00
0.00
0.00
0.00
0.00
0.00
Wednesday, April 08, 2009 11:56:28 AM
AveragedPit1
Measured by:JohnstonP
Sample bulk lot ref:
Vadanemelli
Sample Name:
Analysed:
Measured:
Sample Source & type:Wednesday, April 08, 2009 11:56:29 AM
S107 - AverageSOP Name:
Result Source:
Sensitivity:
Dispersant Name:Water Off
Size range:
Default
Particle RI:
1.330Result Emulation:
Absorption:0.020 to0.1
NormalAnalysis model:
2000.000
Dispersant RI:
1.520
General purposeParticle Name:
um
Tel := +[44] (0) 1684-892456 Fax +[44] (0) 1684-892789Malvern, UKMalvern Instruments Ltd.
Serial Number : MAL1022570Mastersizer 2000 Ver. 5.54
30 May 2011 8:33:38 AMRecord Number: 16File name: Vadanemelli

Result Analysis Report
Vol. Weighted Mean D[4,3]:
%
m²/g
um
Surface Weighted Mean D[3,2]:0.0114 656.116
d(0.9):
Accessory Name:
Span :1.250
umSpecific Surface Area:
17.94
Operator notes:
Uniformity:%Vol
Obscuration:
599.587 1077.002d(0.1): um
0.386
527.116
um327.785 d(0.5):
Volume
Particle Size Distribution
0.01 0.1 1 10 100 1000 3000
Particle Size (µm)
0
2
4
6
8
10
12
Vol
ume
(%)
S108 - Average, Wednesday, April 08, 2009 1:25:03 PM
Hydro 2000G (A)
Result units:
um
Concentration:1.4827
Weighted Residual:2.484 %
Size (µm)0.010
0.011
0.013
0.015
0.017
0.020
0.023
0.026
0.030
0.035
0.040
0.046
0.052
0.060
0.069
0.079
0.091
0.105
Volume In %
0.00
0.00
0.00
0.00
0.00
0.00
0.00
0.00
0.00
0.00
0.00
0.00
0.00
0.00
0.00
0.00
0.00
Size (µm)0.105
0.120
0.138
0.158
0.182
0.209
0.240
0.275
0.316
0.363
0.417
0.479
0.550
0.631
0.724
0.832
0.955
1.096
Volume In %
0.00
0.00
0.00
0.00
0.00
0.00
0.00
0.00
0.00
0.00
0.00
0.00
0.00
0.00
0.00
0.00
0.00
Size (µm)1.096
1.259
1.445
1.660
1.905
2.188
2.512
2.884
3.311
3.802
4.365
5.012
5.754
6.607
7.586
8.710
10.000
11.482
Volume In %
0.00
0.00
0.00
0.00
0.00
0.00
0.00
0.00
0.00
0.00
0.00
0.00
0.00
0.00
0.00
0.00
0.00
Size (µm)11.482
13.183
15.136
17.378
19.953
22.909
26.303
30.200
34.674
39.811
45.709
52.481
60.256
69.183
79.433
91.201
104.713
120.226
Volume In %
0.00
0.00
0.00
0.00
0.00
0.00
0.00
0.00
0.00
0.03
0.04
0.05
0.07
0.07
0.06
0.04
0.01
Size (µm)120.226
138.038
158.489
181.970
208.930
239.883
275.423
316.228
363.078
416.869
478.630
549.541
630.957
724.436
831.764
954.993
1096.478
1258.925
Volume In %
0.00
0.00
0.03
0.45
1.25
2.47
4.07
5.95
7.87
9.58
10.81
11.36
11.12
10.14
8.58
6.73
4.90
Size (µm)1258.925
1445.440
1659.587
1905.461
2187.762
2511.886
2884.032
3311.311
3801.894
4365.158
5011.872
5754.399
6606.934
7585.776
8709.636
10000.000
Volume In %
3.08
1.20
0.06
0.00
0.00
0.00
0.00
0.00
0.00
0.00
0.00
0.00
0.00
0.00
0.00
Wednesday, April 08, 2009 1:25:03 PM
EditedPit1
Measured by:JohnstonP
Sample bulk lot ref:
Vadanemelli
Sample Name:
Analysed:
Measured:
Sample Source & type:Wednesday, April 08, 2009 1:25:05 PM
S108 - AverageSOP Name:
Result Source:
Sensitivity:
Dispersant Name:Water Off
Size range:
Default
Particle RI:
1.330Result Emulation:
Absorption:0.020 to0.1
NormalAnalysis model:
2000.000
Dispersant RI:
1.520
General purposeParticle Name:
um
Tel := +[44] (0) 1684-892456 Fax +[44] (0) 1684-892789Malvern, UKMalvern Instruments Ltd.
Serial Number : MAL1022570Mastersizer 2000 Ver. 5.54
30 May 2011 7:47:06 AMRecord Number: 24File name: Vadanemelli

Result Analysis Report
Vol. Weighted Mean D[4,3]:
%
m²/g
um
Surface Weighted Mean D[3,2]:0.0431 575.906
d(0.9):
Accessory Name:
Span :1.614
umSpecific Surface Area:
16.53
Operator notes:
Uniformity:%Vol
Obscuration:
527.039 1043.364d(0.1): um
0.498
139.315
um192.674 d(0.5):
Volume
Particle Size Distribution
0.01 0.1 1 10 100 1000 3000
Particle Size (µm)
0 1 2 3 4 5 6 7 8 9
10 11
Vol
ume
(%)
S109 - Average, Wednesday, July 08, 2009 3:01:10 PM
Hydro 2000G (A)
Result units:
um
Concentration:0.3403
Weighted Residual:1.405 %
Size (µm)0.010
0.011
0.013
0.015
0.017
0.020
0.023
0.026
0.030
0.035
0.040
0.046
0.052
0.060
0.069
0.079
0.091
0.105
Volume In %
0.00
0.00
0.00
0.00
0.00
0.00
0.00
0.00
0.00
0.00
0.00
0.00
0.00
0.00
0.00
0.00
0.00
Size (µm)0.105
0.120
0.138
0.158
0.182
0.209
0.240
0.275
0.316
0.363
0.417
0.479
0.550
0.631
0.724
0.832
0.955
1.096
Volume In %
0.00
0.00
0.00
0.00
0.00
0.00
0.00
0.00
0.00
0.00
0.00
0.00
0.00
0.00
0.00
0.00
0.00
Size (µm)1.096
1.259
1.445
1.660
1.905
2.188
2.512
2.884
3.311
3.802
4.365
5.012
5.754
6.607
7.586
8.710
10.000
11.482
Volume In %
0.00
0.00
0.00
0.00
0.02
0.06
0.08
0.09
0.10
0.12
0.13
0.15
0.16
0.18
0.21
0.23
0.25
Size (µm)11.482
13.183
15.136
17.378
19.953
22.909
26.303
30.200
34.674
39.811
45.709
52.481
60.256
69.183
79.433
91.201
104.713
120.226
Volume In %
0.28
0.30
0.31
0.33
0.34
0.35
0.36
0.37
0.39
0.42
0.45
0.47
0.47
0.45
0.40
0.34
0.28
Size (µm)120.226
138.038
158.489
181.970
208.930
239.883
275.423
316.228
363.078
416.869
478.630
549.541
630.957
724.436
831.764
954.993
1096.478
1258.925
Volume In %
0.29
0.42
0.75
1.34
2.22
3.39
4.74
6.19
7.54
8.62
9.28
9.42
9.02
8.14
6.90
5.49
4.07
Size (µm)1258.925
1445.440
1659.587
1905.461
2187.762
2511.886
2884.032
3311.311
3801.894
4365.158
5011.872
5754.399
6606.934
7585.776
8709.636
10000.000
Volume In %
2.69
1.32
0.12
0.00
0.00
0.00
0.00
0.00
0.00
0.00
0.00
0.00
0.00
0.00
0.00
Wednesday, July 08, 2009 3:01:10 PM
Averaged
Measured by:JohnstonP
Sample bulk lot ref:
Vadanemelli
Sample Name:
Analysed:
Measured:
Sample Source & type:Wednesday, July 08, 2009 3:01:11 PM
S109 - AverageSOP Name:
Result Source:
Sensitivity:
Dispersant Name:Water Off
Size range:
Default
Particle RI:
1.330Result Emulation:
Absorption:0.020 to0.1
NormalAnalysis model:
2000.000
Dispersant RI:
1.520
General purposeParticle Name:
um
Tel := +[44] (0) 1684-892456 Fax +[44] (0) 1684-892789Malvern, UKMalvern Instruments Ltd.
Serial Number : MAL1022570Mastersizer 2000 Ver. 5.54
30 May 2011 7:47:46 AMRecord Number: 37File name: Vadanemelli

Result Analysis Report
Vol. Weighted Mean D[4,3]:
%
m²/g
um
Surface Weighted Mean D[3,2]:0.0123 600.042
d(0.9):
Accessory Name:
Span :1.292
umSpecific Surface Area:
17.07
Operator notes:
Uniformity:%Vol
Obscuration:
545.866 996.535d(0.1): um
0.394
486.045
um291.451 d(0.5):
Volume
Particle Size Distribution
0.01 0.1 1 10 100 1000 3000
Particle Size (µm)
0
2
4
6
8
10
12
Vol
ume
(%)
S110 - Average, Wednesday, July 08, 2009 3:09:08 PM
Hydro 2000G (A)
Result units:
um
Concentration:1.2921
Weighted Residual:1.796 %
Size (µm)0.010
0.011
0.013
0.015
0.017
0.020
0.023
0.026
0.030
0.035
0.040
0.046
0.052
0.060
0.069
0.079
0.091
0.105
Volume In %
0.00
0.00
0.00
0.00
0.00
0.00
0.00
0.00
0.00
0.00
0.00
0.00
0.00
0.00
0.00
0.00
0.00
Size (µm)0.105
0.120
0.138
0.158
0.182
0.209
0.240
0.275
0.316
0.363
0.417
0.479
0.550
0.631
0.724
0.832
0.955
1.096
Volume In %
0.00
0.00
0.00
0.00
0.00
0.00
0.00
0.00
0.00
0.00
0.00
0.00
0.00
0.00
0.00
0.00
0.00
Size (µm)1.096
1.259
1.445
1.660
1.905
2.188
2.512
2.884
3.311
3.802
4.365
5.012
5.754
6.607
7.586
8.710
10.000
11.482
Volume In %
0.00
0.00
0.00
0.00
0.00
0.00
0.00
0.00
0.00
0.00
0.00
0.00
0.00
0.00
0.00
0.00
0.00
Size (µm)11.482
13.183
15.136
17.378
19.953
22.909
26.303
30.200
34.674
39.811
45.709
52.481
60.256
69.183
79.433
91.201
104.713
120.226
Volume In %
0.00
0.00
0.00
0.00
0.00
0.00
0.00
0.00
0.00
0.00
0.00
0.00
0.00
0.00
0.00
0.00
0.00
Size (µm)120.226
138.038
158.489
181.970
208.930
239.883
275.423
316.228
363.078
416.869
478.630
549.541
630.957
724.436
831.764
954.993
1096.478
1258.925
Volume In %
0.00
0.03
0.51
1.25
2.36
3.81
5.49
7.25
8.87
10.13
10.83
10.87
10.24
9.02
7.41
5.63
3.88
Size (µm)1258.925
1445.440
1659.587
1905.461
2187.762
2511.886
2884.032
3311.311
3801.894
4365.158
5011.872
5754.399
6606.934
7585.776
8709.636
10000.000
Volume In %
2.23
0.19
0.00
0.00
0.00
0.00
0.00
0.00
0.00
0.00
0.00
0.00
0.00
0.00
0.00
Wednesday, July 08, 2009 3:09:08 PM
Averaged
Measured by:JohnstonP
Sample bulk lot ref:
Vadanemelli
Sample Name:
Analysed:
Measured:
Sample Source & type:Wednesday, July 08, 2009 3:09:09 PM
S110 - AverageSOP Name:
Result Source:
Sensitivity:
Dispersant Name:Water Off
Size range:
Default
Particle RI:
1.330Result Emulation:
Absorption:0.020 to0.1
NormalAnalysis model:
2000.000
Dispersant RI:
1.520
General purposeParticle Name:
um
Tel := +[44] (0) 1684-892456 Fax +[44] (0) 1684-892789Malvern, UKMalvern Instruments Ltd.
Serial Number : MAL1022570Mastersizer 2000 Ver. 5.54
30 May 2011 7:48:09 AMRecord Number: 41File name: Vadanemelli

Result Analysis Report
Vol. Weighted Mean D[4,3]:
%
m²/g
um
Surface Weighted Mean D[3,2]:0.024 504.748
d(0.9):
Accessory Name:
Span :1.514
umSpecific Surface Area:
16.39
Operator notes:
Uniformity:%Vol
Obscuration:
450.095 893.992d(0.1): um
0.471
249.707
um212.483 d(0.5):
Volume
Particle Size Distribution
0.01 0.1 1 10 100 1000 3000
Particle Size (µm)
0 1 2 3 4 5 6 7 8 9
10 11
Vol
ume
(%)
S111 - Average, Wednesday, July 08, 2009 3:16:29 PM
Hydro 2000G (A)
Result units:
um
Concentration:0.6234
Weighted Residual:1.315 %
Size (µm)0.010
0.011
0.013
0.015
0.017
0.020
0.023
0.026
0.030
0.035
0.040
0.046
0.052
0.060
0.069
0.079
0.091
0.105
Volume In %
0.00
0.00
0.00
0.00
0.00
0.00
0.00
0.00
0.00
0.00
0.00
0.00
0.00
0.00
0.00
0.00
0.00
Size (µm)0.105
0.120
0.138
0.158
0.182
0.209
0.240
0.275
0.316
0.363
0.417
0.479
0.550
0.631
0.724
0.832
0.955
1.096
Volume In %
0.00
0.00
0.00
0.00
0.00
0.00
0.00
0.00
0.00
0.00
0.00
0.00
0.00
0.00
0.00
0.00
0.00
Size (µm)1.096
1.259
1.445
1.660
1.905
2.188
2.512
2.884
3.311
3.802
4.365
5.012
5.754
6.607
7.586
8.710
10.000
11.482
Volume In %
0.00
0.00
0.00
0.00
0.00
0.00
0.00
0.00
0.00
0.01
0.04
0.07
0.08
0.09
0.10
0.11
0.11
Size (µm)11.482
13.183
15.136
17.378
19.953
22.909
26.303
30.200
34.674
39.811
45.709
52.481
60.256
69.183
79.433
91.201
104.713
120.226
Volume In %
0.12
0.12
0.12
0.12
0.12
0.13
0.15
0.17
0.19
0.21
0.21
0.18
0.14
0.02
0.00
0.03
0.18
Size (µm)120.226
138.038
158.489
181.970
208.930
239.883
275.423
316.228
363.078
416.869
478.630
549.541
630.957
724.436
831.764
954.993
1096.478
1258.925
Volume In %
0.52
1.11
1.97
3.12
4.45
5.88
7.24
8.40
9.20
9.56
9.44
8.85
7.88
6.64
5.27
3.90
2.53
Size (µm)1258.925
1445.440
1659.587
1905.461
2187.762
2511.886
2884.032
3311.311
3801.894
4365.158
5011.872
5754.399
6606.934
7585.776
8709.636
10000.000
Volume In %
1.19
0.04
0.00
0.00
0.00
0.00
0.00
0.00
0.00
0.00
0.00
0.00
0.00
0.00
0.00
Wednesday, July 08, 2009 3:16:29 PM
Averaged
Measured by:JohnstonP
Sample bulk lot ref:
Vadanemelli
Sample Name:
Analysed:
Measured:
Sample Source & type:Wednesday, July 08, 2009 3:16:31 PM
S111 - AverageSOP Name:
Result Source:
Sensitivity:
Dispersant Name:Water Off
Size range:
Default
Particle RI:
1.330Result Emulation:
Absorption:0.020 to0.1
NormalAnalysis model:
2000.000
Dispersant RI:
1.520
General purposeParticle Name:
um
Tel := +[44] (0) 1684-892456 Fax +[44] (0) 1684-892789Malvern, UKMalvern Instruments Ltd.
Serial Number : MAL1022570Mastersizer 2000 Ver. 5.54
30 May 2011 7:48:35 AMRecord Number: 45File name: Vadanemelli

Result Analysis Report
Vol. Weighted Mean D[4,3]:
%
m²/g
um
Surface Weighted Mean D[3,2]:0.0224 577.996
d(0.9):
Accessory Name:
Span :1.331
umSpecific Surface Area:
16.76
Operator notes:
Uniformity:%Vol
Obscuration:
532.893 976.104d(0.1): um
0.416
268.318
um266.934 d(0.5):
Volume
Particle Size Distribution
0.01 0.1 1 10 100 1000 3000
Particle Size (µm)
0
2
4
6
8
10
12
Vol
ume
(%)
S112 - Average, Wednesday, July 08, 2009 3:23:55 PM
Hydro 2000G (A)
Result units:
um
Concentration:0.6827
Weighted Residual:1.746 %
Size (µm)0.010
0.011
0.013
0.015
0.017
0.020
0.023
0.026
0.030
0.035
0.040
0.046
0.052
0.060
0.069
0.079
0.091
0.105
Volume In %
0.00
0.00
0.00
0.00
0.00
0.00
0.00
0.00
0.00
0.00
0.00
0.00
0.00
0.00
0.00
0.00
0.00
Size (µm)0.105
0.120
0.138
0.158
0.182
0.209
0.240
0.275
0.316
0.363
0.417
0.479
0.550
0.631
0.724
0.832
0.955
1.096
Volume In %
0.00
0.00
0.00
0.00
0.00
0.00
0.00
0.00
0.00
0.00
0.00
0.00
0.00
0.00
0.00
0.00
0.00
Size (µm)1.096
1.259
1.445
1.660
1.905
2.188
2.512
2.884
3.311
3.802
4.365
5.012
5.754
6.607
7.586
8.710
10.000
11.482
Volume In %
0.00
0.00
0.00
0.00
0.00
0.00
0.00
0.00
0.00
0.03
0.07
0.07
0.08
0.09
0.10
0.11
0.12
Size (µm)11.482
13.183
15.136
17.378
19.953
22.909
26.303
30.200
34.674
39.811
45.709
52.481
60.256
69.183
79.433
91.201
104.713
120.226
Volume In %
0.13
0.14
0.14
0.14
0.13
0.12
0.12
0.12
0.13
0.15
0.18
0.20
0.20
0.18
0.14
0.04
0.00
Size (µm)120.226
138.038
158.489
181.970
208.930
239.883
275.423
316.228
363.078
416.869
478.630
549.541
630.957
724.436
831.764
954.993
1096.478
1258.925
Volume In %
0.02
0.20
0.58
1.27
2.30
3.68
5.29
7.02
8.62
9.89
10.61
10.67
10.03
8.79
7.15
5.34
3.60
Size (µm)1258.925
1445.440
1659.587
1905.461
2187.762
2511.886
2884.032
3311.311
3801.894
4365.158
5011.872
5754.399
6606.934
7585.776
8709.636
10000.000
Volume In %
1.95
0.07
0.00
0.00
0.00
0.00
0.00
0.00
0.00
0.00
0.00
0.00
0.00
0.00
0.00
Wednesday, July 08, 2009 3:23:55 PM
Edited
Measured by:JohnstonP
Sample bulk lot ref:
Vadanemelli
Sample Name:
Analysed:
Measured:
Sample Source & type:Wednesday, July 08, 2009 3:23:56 PM
S112 - AverageSOP Name:
Result Source:
Sensitivity:
Dispersant Name:Water Off
Size range:
Default
Particle RI:
1.330Result Emulation:
Absorption:0.020 to0.1
NormalAnalysis model:
2000.000
Dispersant RI:
1.520
General purposeParticle Name:
um
Tel := +[44] (0) 1684-892456 Fax +[44] (0) 1684-892789Malvern, UKMalvern Instruments Ltd.
Serial Number : MAL1022570Mastersizer 2000 Ver. 5.54
30 May 2011 7:49:03 AMRecord Number: 53File name: Vadanemelli

Result Analysis Report
Vol. Weighted Mean D[4,3]:
%
m²/g
um
Surface Weighted Mean D[3,2]:0.03 517.096
d(0.9):
Accessory Name:
Span :1.613
umSpecific Surface Area:
15.01
Operator notes:
Uniformity:%Vol
Obscuration:
464.944 938.438d(0.1): um
0.5
199.803
um188.350 d(0.5):
Volume
Particle Size Distribution
0.01 0.1 1 10 100 1000 3000
Particle Size (µm)
0 1 2
3 4 5 6 7
8 9
10
Vol
ume
(%)
S113 - Average, Wednesday, July 08, 2009 3:32:22 PM
Hydro 2000G (A)
Result units:
um
Concentration:0.4497
Weighted Residual:1.407 %
Size (µm)0.010
0.011
0.013
0.015
0.017
0.020
0.023
0.026
0.030
0.035
0.040
0.046
0.052
0.060
0.069
0.079
0.091
0.105
Volume In %
0.00
0.00
0.00
0.00
0.00
0.00
0.00
0.00
0.00
0.00
0.00
0.00
0.00
0.00
0.00
0.00
0.00
Size (µm)0.105
0.120
0.138
0.158
0.182
0.209
0.240
0.275
0.316
0.363
0.417
0.479
0.550
0.631
0.724
0.832
0.955
1.096
Volume In %
0.00
0.00
0.00
0.00
0.00
0.00
0.00
0.00
0.00
0.00
0.00
0.00
0.00
0.00
0.00
0.00
0.00
Size (µm)1.096
1.259
1.445
1.660
1.905
2.188
2.512
2.884
3.311
3.802
4.365
5.012
5.754
6.607
7.586
8.710
10.000
11.482
Volume In %
0.00
0.00
0.00
0.00
0.00
0.00
0.00
0.01
0.05
0.07
0.08
0.09
0.10
0.11
0.12
0.13
0.14
Size (µm)11.482
13.183
15.136
17.378
19.953
22.909
26.303
30.200
34.674
39.811
45.709
52.481
60.256
69.183
79.433
91.201
104.713
120.226
Volume In %
0.15
0.17
0.18
0.20
0.22
0.25
0.27
0.29
0.31
0.32
0.31
0.29
0.25
0.23
0.23
0.30
0.47
Size (µm)120.226
138.038
158.489
181.970
208.930
239.883
275.423
316.228
363.078
416.869
478.630
549.541
630.957
724.436
831.764
954.993
1096.478
1258.925
Volume In %
0.78
1.28
1.98
2.87
3.92
5.08
6.25
7.34
8.23
8.82
9.02
8.78
8.12
7.07
5.78
4.38
3.02
Size (µm)1258.925
1445.440
1659.587
1905.461
2187.762
2511.886
2884.032
3311.311
3801.894
4365.158
5011.872
5754.399
6606.934
7585.776
8709.636
10000.000
Volume In %
1.73
0.20
0.01
0.00
0.00
0.00
0.00
0.00
0.00
0.00
0.00
0.00
0.00
0.00
0.00
Wednesday, July 08, 2009 3:32:22 PM
Averaged
Measured by:JohnstonP
Sample bulk lot ref:
Vadanemelli
Sample Name:
Analysed:
Measured:
Sample Source & type:Wednesday, July 08, 2009 3:32:24 PM
S113 - AverageSOP Name:
Result Source:
Sensitivity:
Dispersant Name:Water Off
Size range:
Default
Particle RI:
1.330Result Emulation:
Absorption:0.020 to0.1
NormalAnalysis model:
2000.000
Dispersant RI:
1.520
General purposeParticle Name:
um
Tel := +[44] (0) 1684-892456 Fax +[44] (0) 1684-892789Malvern, UKMalvern Instruments Ltd.
Serial Number : MAL1022570Mastersizer 2000 Ver. 5.54
30 May 2011 7:50:26 AMRecord Number: 57File name: Vadanemelli

Result Analysis Report
Vol. Weighted Mean D[4,3]:
%
m²/g
um
Surface Weighted Mean D[3,2]:0.0106 662.330
d(0.9):
Accessory Name:
Span :1.114
umSpecific Surface Area:
18.13
Operator notes:
Uniformity:%Vol
Obscuration:
610.119 1041.325d(0.1): um
0.345
565.112
um361.944 d(0.5):
Volume
Particle Size Distribution
0.01 0.1 1 10 100 1000 3000
Particle Size (µm)
0
2
4
6
8
10
12
14
Vol
ume
(%)
S114 - Average, Wednesday, July 08, 2009 6:07:56 PM
Hydro 2000G (A)
Result units:
um
Concentration:1.6049
Weighted Residual:2.472 %
Size (µm)0.010
0.011
0.013
0.015
0.017
0.020
0.023
0.026
0.030
0.035
0.040
0.046
0.052
0.060
0.069
0.079
0.091
0.105
Volume In %
0.00
0.00
0.00
0.00
0.00
0.00
0.00
0.00
0.00
0.00
0.00
0.00
0.00
0.00
0.00
0.00
0.00
Size (µm)0.105
0.120
0.138
0.158
0.182
0.209
0.240
0.275
0.316
0.363
0.417
0.479
0.550
0.631
0.724
0.832
0.955
1.096
Volume In %
0.00
0.00
0.00
0.00
0.00
0.00
0.00
0.00
0.00
0.00
0.00
0.00
0.00
0.00
0.00
0.00
0.00
Size (µm)1.096
1.259
1.445
1.660
1.905
2.188
2.512
2.884
3.311
3.802
4.365
5.012
5.754
6.607
7.586
8.710
10.000
11.482
Volume In %
0.00
0.00
0.00
0.00
0.00
0.00
0.00
0.00
0.00
0.00
0.00
0.00
0.00
0.00
0.00
0.00
0.00
Size (µm)11.482
13.183
15.136
17.378
19.953
22.909
26.303
30.200
34.674
39.811
45.709
52.481
60.256
69.183
79.433
91.201
104.713
120.226
Volume In %
0.00
0.00
0.00
0.00
0.00
0.00
0.00
0.00
0.00
0.00
0.00
0.00
0.00
0.00
0.00
0.00
0.00
Size (µm)120.226
138.038
158.489
181.970
208.930
239.883
275.423
316.228
363.078
416.869
478.630
549.541
630.957
724.436
831.764
954.993
1096.478
1258.925
Volume In %
0.00
0.00
0.00
0.01
0.38
1.40
3.06
5.30
7.83
10.25
12.05
12.86
12.51
11.08
8.92
6.51
4.34
Size (µm)1258.925
1445.440
1659.587
1905.461
2187.762
2511.886
2884.032
3311.311
3801.894
4365.158
5011.872
5754.399
6606.934
7585.776
8709.636
10000.000
Volume In %
2.51
0.95
0.05
0.00
0.00
0.00
0.00
0.00
0.00
0.00
0.00
0.00
0.00
0.00
0.00
Wednesday, July 08, 2009 6:07:56 PM
Averaged
Measured by:JohnstonP
Sample bulk lot ref:
Vadanemelli
Sample Name:
Analysed:
Measured:
Sample Source & type:Wednesday, July 08, 2009 6:07:58 PM
S114 - AverageSOP Name:
Result Source:
Sensitivity:
Dispersant Name:Water Off
Size range:
Default
Particle RI:
1.330Result Emulation:
Absorption:0.020 to0.1
NormalAnalysis model:
2000.000
Dispersant RI:
1.520
General purposeParticle Name:
um
Tel := +[44] (0) 1684-892456 Fax +[44] (0) 1684-892789Malvern, UKMalvern Instruments Ltd.
Serial Number : MAL1022570Mastersizer 2000 Ver. 5.54
30 May 2011 7:50:40 AMRecord Number: 61File name: Vadanemelli

Result Analysis Report
Vol. Weighted Mean D[4,3]:
%
m²/g
um
Surface Weighted Mean D[3,2]:0.0154 468.179
d(0.9):
Accessory Name:
Span :1.213
umSpecific Surface Area:
19.00
Operator notes:
Uniformity:%Vol
Obscuration:
429.027 760.175d(0.1): um
0.374
388.990
um239.638 d(0.5):
Volume
Particle Size Distribution
0.01 0.1 1 10 100 1000 3000
Particle Size (µm)
0
2
4
6
8
10
12
14
Vol
ume
(%)
S115 - Average, Tuesday, October 21, 2008 6:59:27 PM
Hydro 2000G (A)
Result units:
um
Concentration:1.1636
Weighted Residual:1.217 %
Size (µm)0.010
0.011
0.013
0.015
0.017
0.020
0.023
0.026
0.030
0.035
0.040
0.046
0.052
0.060
0.069
0.079
0.091
0.105
Volume In %
0.00
0.00
0.00
0.00
0.00
0.00
0.00
0.00
0.00
0.00
0.00
0.00
0.00
0.00
0.00
0.00
0.00
Size (µm)0.105
0.120
0.138
0.158
0.182
0.209
0.240
0.275
0.316
0.363
0.417
0.479
0.550
0.631
0.724
0.832
0.955
1.096
Volume In %
0.00
0.00
0.00
0.00
0.00
0.00
0.00
0.00
0.00
0.00
0.00
0.00
0.00
0.00
0.00
0.00
0.00
Size (µm)1.096
1.259
1.445
1.660
1.905
2.188
2.512
2.884
3.311
3.802
4.365
5.012
5.754
6.607
7.586
8.710
10.000
11.482
Volume In %
0.00
0.00
0.00
0.00
0.00
0.00
0.00
0.00
0.00
0.00
0.00
0.00
0.00
0.00
0.00
0.00
0.00
Size (µm)11.482
13.183
15.136
17.378
19.953
22.909
26.303
30.200
34.674
39.811
45.709
52.481
60.256
69.183
79.433
91.201
104.713
120.226
Volume In %
0.00
0.00
0.00
0.00
0.00
0.00
0.00
0.00
0.00
0.00
0.00
0.00
0.00
0.00
0.00
0.00
0.00
Size (µm)120.226
138.038
158.489
181.970
208.930
239.883
275.423
316.228
363.078
416.869
478.630
549.541
630.957
724.436
831.764
954.993
1096.478
1258.925
Volume In %
0.03
0.52
1.56
3.05
4.88
6.91
8.84
10.42
11.37
11.55
10.95
9.67
7.93
5.96
4.09
2.07
0.18
Size (µm)1258.925
1445.440
1659.587
1905.461
2187.762
2511.886
2884.032
3311.311
3801.894
4365.158
5011.872
5754.399
6606.934
7585.776
8709.636
10000.000
Volume In %
0.00
0.00
0.00
0.00
0.00
0.00
0.00
0.00
0.00
0.00
0.00
0.00
0.00
0.00
0.00
Tuesday, October 21, 2008 6:59:27 PM
AveragedPit2
Measured by:student
Sample bulk lot ref:
Aalikuppam
Sample Name:
Analysed:
Measured:
Sample Source & type:Tuesday, October 21, 2008 6:59:29 PM
S115 - AverageSOP Name:
Result Source:
Sensitivity:
Dispersant Name:Water Off
Size range:
Default
Particle RI:
1.330Result Emulation:
Absorption:0.020 to0.1
NormalAnalysis model:
2000.000
Dispersant RI:
1.520
General purposeParticle Name:
um
Tel := +[44] (0) 1684-892456 Fax +[44] (0) 1684-892789Malvern, UKMalvern Instruments Ltd.
Serial Number : MAL1022570Mastersizer 2000 Ver. 5.54
30 May 2011 7:55:05 AMRecord Number: 6File name: Aalikuppam Pit2

Result Analysis Report
Vol. Weighted Mean D[4,3]:
%
m²/g
um
Surface Weighted Mean D[3,2]:0.0143 515.921
d(0.9):
Accessory Name:
Span :1.295
umSpecific Surface Area:
19.05
Operator notes:
Uniformity:%Vol
Obscuration:
468.490 857.755d(0.1): um
0.396
418.158
um250.992 d(0.5):
Volume
Particle Size Distribution
0.01 0.1 1 10 100 1000 3000
Particle Size (µm)
0
2
4
6
8
10
12
Vol
ume
(%)
S116 - Average, Tuesday, October 21, 2008 7:07:32 PM
Hydro 2000G (A)
Result units:
um
Concentration:1.2551
Weighted Residual:1.268 %
Size (µm)0.010
0.011
0.013
0.015
0.017
0.020
0.023
0.026
0.030
0.035
0.040
0.046
0.052
0.060
0.069
0.079
0.091
0.105
Volume In %
0.00
0.00
0.00
0.00
0.00
0.00
0.00
0.00
0.00
0.00
0.00
0.00
0.00
0.00
0.00
0.00
0.00
Size (µm)0.105
0.120
0.138
0.158
0.182
0.209
0.240
0.275
0.316
0.363
0.417
0.479
0.550
0.631
0.724
0.832
0.955
1.096
Volume In %
0.00
0.00
0.00
0.00
0.00
0.00
0.00
0.00
0.00
0.00
0.00
0.00
0.00
0.00
0.00
0.00
0.00
Size (µm)1.096
1.259
1.445
1.660
1.905
2.188
2.512
2.884
3.311
3.802
4.365
5.012
5.754
6.607
7.586
8.710
10.000
11.482
Volume In %
0.00
0.00
0.00
0.00
0.00
0.00
0.00
0.00
0.00
0.00
0.00
0.00
0.00
0.00
0.00
0.00
0.00
Size (µm)11.482
13.183
15.136
17.378
19.953
22.909
26.303
30.200
34.674
39.811
45.709
52.481
60.256
69.183
79.433
91.201
104.713
120.226
Volume In %
0.00
0.00
0.00
0.00
0.00
0.00
0.00
0.00
0.00
0.00
0.00
0.00
0.00
0.00
0.00
0.00
0.00
Size (µm)120.226
138.038
158.489
181.970
208.930
239.883
275.423
316.228
363.078
416.869
478.630
549.541
630.957
724.436
831.764
954.993
1096.478
1258.925
Volume In %
0.04
0.50
1.30
2.49
3.99
5.73
7.48
9.07
10.25
10.86
10.80
10.09
8.83
7.22
5.45
3.75
2.02
Size (µm)1258.925
1445.440
1659.587
1905.461
2187.762
2511.886
2884.032
3311.311
3801.894
4365.158
5011.872
5754.399
6606.934
7585.776
8709.636
10000.000
Volume In %
0.15
0.00
0.00
0.00
0.00
0.00
0.00
0.00
0.00
0.00
0.00
0.00
0.00
0.00
0.00
Tuesday, October 21, 2008 7:07:32 PM
AveragedPit2
Measured by:student
Sample bulk lot ref:
Aalikuppam
Sample Name:
Analysed:
Measured:
Sample Source & type:Tuesday, October 21, 2008 7:07:34 PM
S116 - AverageSOP Name:
Result Source:
Sensitivity:
Dispersant Name:Water Off
Size range:
Default
Particle RI:
1.330Result Emulation:
Absorption:0.020 to0.1
NormalAnalysis model:
2000.000
Dispersant RI:
1.520
General purposeParticle Name:
um
Tel := +[44] (0) 1684-892456 Fax +[44] (0) 1684-892789Malvern, UKMalvern Instruments Ltd.
Serial Number : MAL1022570Mastersizer 2000 Ver. 5.54
30 May 2011 7:55:26 AMRecord Number: 12File name: Aalikuppam Pit2

Result Analysis Report
Vol. Weighted Mean D[4,3]:
%
m²/g
um
Surface Weighted Mean D[3,2]:0.0137 545.537
d(0.9):
Accessory Name:
Span :1.347
umSpecific Surface Area:
18.49
Operator notes:
Uniformity:%Vol
Obscuration:
490.009 920.069d(0.1): um
0.413
436.961
um259.976 d(0.5):
Volume
Particle Size Distribution
0.01 0.1 1 10 100 1000 3000
Particle Size (µm)
0
2
4
6
8
10
12
Vol
ume
(%)
S117 - Average, Tuesday, October 21, 2008 7:15:40 PM
Hydro 2000G (A)
Result units:
um
Concentration:1.2685
Weighted Residual:1.318 %
Size (µm)0.010
0.011
0.013
0.015
0.017
0.020
0.023
0.026
0.030
0.035
0.040
0.046
0.052
0.060
0.069
0.079
0.091
0.105
Volume In %
0.00
0.00
0.00
0.00
0.00
0.00
0.00
0.00
0.00
0.00
0.00
0.00
0.00
0.00
0.00
0.00
0.00
Size (µm)0.105
0.120
0.138
0.158
0.182
0.209
0.240
0.275
0.316
0.363
0.417
0.479
0.550
0.631
0.724
0.832
0.955
1.096
Volume In %
0.00
0.00
0.00
0.00
0.00
0.00
0.00
0.00
0.00
0.00
0.00
0.00
0.00
0.00
0.00
0.00
0.00
Size (µm)1.096
1.259
1.445
1.660
1.905
2.188
2.512
2.884
3.311
3.802
4.365
5.012
5.754
6.607
7.586
8.710
10.000
11.482
Volume In %
0.00
0.00
0.00
0.00
0.00
0.00
0.00
0.00
0.00
0.00
0.00
0.00
0.00
0.00
0.00
0.00
0.00
Size (µm)11.482
13.183
15.136
17.378
19.953
22.909
26.303
30.200
34.674
39.811
45.709
52.481
60.256
69.183
79.433
91.201
104.713
120.226
Volume In %
0.00
0.00
0.00
0.00
0.00
0.00
0.00
0.00
0.00
0.00
0.00
0.00
0.00
0.00
0.00
0.00
0.00
Size (µm)120.226
138.038
158.489
181.970
208.930
239.883
275.423
316.228
363.078
416.869
478.630
549.541
630.957
724.436
831.764
954.993
1096.478
1258.925
Volume In %
0.04
0.26
1.09
2.16
3.59
5.26
6.97
8.56
9.77
10.48
10.58
10.06
9.03
7.60
6.00
4.42
2.82
Size (µm)1258.925
1445.440
1659.587
1905.461
2187.762
2511.886
2884.032
3311.311
3801.894
4365.158
5011.872
5754.399
6606.934
7585.776
8709.636
10000.000
Volume In %
1.26
0.04
0.00
0.00
0.00
0.00
0.00
0.00
0.00
0.00
0.00
0.00
0.00
0.00
0.00
Tuesday, October 21, 2008 7:15:40 PM
AveragedPit3
Measured by:student
Sample bulk lot ref:
Aalikuppam
Sample Name:
Analysed:
Measured:
Sample Source & type:Tuesday, October 21, 2008 7:15:42 PM
S117 - AverageSOP Name:
Result Source:
Sensitivity:
Dispersant Name:Water Off
Size range:
Default
Particle RI:
1.330Result Emulation:
Absorption:0.020 to0.1
NormalAnalysis model:
2000.000
Dispersant RI:
1.520
General purposeParticle Name:
um
Tel := +[44] (0) 1684-892456 Fax +[44] (0) 1684-892789Malvern, UKMalvern Instruments Ltd.
Serial Number : MAL1022570Mastersizer 2000 Ver. 5.54
30 May 2011 7:55:50 AMRecord Number: 6File name: Aal Pit3

Result Analysis Report
Vol. Weighted Mean D[4,3]:
%
m²/g
um
Surface Weighted Mean D[3,2]:0.0113 628.812
d(0.9):
Accessory Name:
Span :1.151
umSpecific Surface Area:
16.15
Operator notes:
Uniformity:%Vol
Obscuration:
580.423 1001.195d(0.1): um
0.355
530.088
um333.106 d(0.5):
Volume
Particle Size Distribution
0.01 0.1 1 10 100 1000 3000
Particle Size (µm)
0
2
4
6
8
10
12
14
Vol
ume
(%)
S118 - Average, Tuesday, October 21, 2008 7:25:10 PM
Hydro 2000G (A)
Result units:
um
Concentration:1.3262
Weighted Residual:1.790 %
Size (µm)0.010
0.011
0.013
0.015
0.017
0.020
0.023
0.026
0.030
0.035
0.040
0.046
0.052
0.060
0.069
0.079
0.091
0.105
Volume In %
0.00
0.00
0.00
0.00
0.00
0.00
0.00
0.00
0.00
0.00
0.00
0.00
0.00
0.00
0.00
0.00
0.00
Size (µm)0.105
0.120
0.138
0.158
0.182
0.209
0.240
0.275
0.316
0.363
0.417
0.479
0.550
0.631
0.724
0.832
0.955
1.096
Volume In %
0.00
0.00
0.00
0.00
0.00
0.00
0.00
0.00
0.00
0.00
0.00
0.00
0.00
0.00
0.00
0.00
0.00
Size (µm)1.096
1.259
1.445
1.660
1.905
2.188
2.512
2.884
3.311
3.802
4.365
5.012
5.754
6.607
7.586
8.710
10.000
11.482
Volume In %
0.00
0.00
0.00
0.00
0.00
0.00
0.00
0.00
0.00
0.00
0.00
0.00
0.00
0.00
0.00
0.00
0.00
Size (µm)11.482
13.183
15.136
17.378
19.953
22.909
26.303
30.200
34.674
39.811
45.709
52.481
60.256
69.183
79.433
91.201
104.713
120.226
Volume In %
0.00
0.00
0.00
0.00
0.00
0.00
0.00
0.00
0.00
0.00
0.00
0.00
0.00
0.00
0.00
0.00
0.00
Size (µm)120.226
138.038
158.489
181.970
208.930
239.883
275.423
316.228
363.078
416.869
478.630
549.541
630.957
724.436
831.764
954.993
1096.478
1258.925
Volume In %
0.00
0.00
0.01
0.32
1.08
2.36
4.13
6.30
8.54
10.53
11.87
12.30
11.73
10.28
8.26
6.05
3.96
Size (µm)1258.925
1445.440
1659.587
1905.461
2187.762
2511.886
2884.032
3311.311
3801.894
4365.158
5011.872
5754.399
6606.934
7585.776
8709.636
10000.000
Volume In %
2.10
0.20
0.00
0.00
0.00
0.00
0.00
0.00
0.00
0.00
0.00
0.00
0.00
0.00
0.00
Tuesday, October 21, 2008 7:25:10 PM
AveragedPit3
Measured by:student
Sample bulk lot ref:
Aalikuppam
Sample Name:
Analysed:
Measured:
Sample Source & type:Tuesday, October 21, 2008 7:25:11 PM
S118 - AverageSOP Name:
Result Source:
Sensitivity:
Dispersant Name:Water Off
Size range:
Default
Particle RI:
1.330Result Emulation:
Absorption:0.020 to0.1
NormalAnalysis model:
2000.000
Dispersant RI:
1.520
General purposeParticle Name:
um
Tel := +[44] (0) 1684-892456 Fax +[44] (0) 1684-892789Malvern, UKMalvern Instruments Ltd.
Serial Number : MAL1022570Mastersizer 2000 Ver. 5.54
30 May 2011 7:56:03 AMRecord Number: 12File name: Aal Pit3

Result Analysis Report
Vol. Weighted Mean D[4,3]:
%
m²/g
um
Surface Weighted Mean D[3,2]:0.0141 498.302
d(0.9):
Accessory Name:
Span :1.082
umSpecific Surface Area:
18.75
Operator notes:
Uniformity:%Vol
Obscuration:
465.014 775.804d(0.1): um
0.333
426.921
um272.803 d(0.5):
Volume
Particle Size Distribution
0.01 0.1 1 10 100 1000 3000
Particle Size (µm)
0
2
4
6
8
10
12
14
Vol
ume
(%)
S119 - Average, Tuesday, October 21, 2008 7:34:17 PM
Hydro 2000G (A)
Result units:
um
Concentration:1.2588
Weighted Residual:1.287 %
Size (µm)0.010
0.011
0.013
0.015
0.017
0.020
0.023
0.026
0.030
0.035
0.040
0.046
0.052
0.060
0.069
0.079
0.091
0.105
Volume In %
0.00
0.00
0.00
0.00
0.00
0.00
0.00
0.00
0.00
0.00
0.00
0.00
0.00
0.00
0.00
0.00
0.00
Size (µm)0.105
0.120
0.138
0.158
0.182
0.209
0.240
0.275
0.316
0.363
0.417
0.479
0.550
0.631
0.724
0.832
0.955
1.096
Volume In %
0.00
0.00
0.00
0.00
0.00
0.00
0.00
0.00
0.00
0.00
0.00
0.00
0.00
0.00
0.00
0.00
0.00
Size (µm)1.096
1.259
1.445
1.660
1.905
2.188
2.512
2.884
3.311
3.802
4.365
5.012
5.754
6.607
7.586
8.710
10.000
11.482
Volume In %
0.00
0.00
0.00
0.00
0.00
0.00
0.00
0.00
0.00
0.00
0.00
0.00
0.00
0.00
0.00
0.00
0.00
Size (µm)11.482
13.183
15.136
17.378
19.953
22.909
26.303
30.200
34.674
39.811
45.709
52.481
60.256
69.183
79.433
91.201
104.713
120.226
Volume In %
0.00
0.00
0.00
0.00
0.00
0.00
0.00
0.00
0.00
0.00
0.00
0.00
0.00
0.00
0.00
0.00
0.00
Size (µm)120.226
138.038
158.489
181.970
208.930
239.883
275.423
316.228
363.078
416.869
478.630
549.541
630.957
724.436
831.764
954.993
1096.478
1258.925
Volume In %
0.00
0.03
0.54
1.53
3.11
5.23
7.63
9.99
11.83
12.81
12.69
11.47
9.40
6.90
4.42
2.15
0.27
Size (µm)1258.925
1445.440
1659.587
1905.461
2187.762
2511.886
2884.032
3311.311
3801.894
4365.158
5011.872
5754.399
6606.934
7585.776
8709.636
10000.000
Volume In %
0.00
0.00
0.00
0.00
0.00
0.00
0.00
0.00
0.00
0.00
0.00
0.00
0.00
0.00
0.00
Tuesday, October 21, 2008 7:34:17 PM
AveragedPit3
Measured by:student
Sample bulk lot ref:
Aalikuppam
Sample Name:
Analysed:
Measured:
Sample Source & type:Tuesday, October 21, 2008 7:34:18 PM
S119 - AverageSOP Name:
Result Source:
Sensitivity:
Dispersant Name:Water Off
Size range:
Default
Particle RI:
1.330Result Emulation:
Absorption:0.020 to0.1
NormalAnalysis model:
2000.000
Dispersant RI:
1.520
General purposeParticle Name:
um
Tel := +[44] (0) 1684-892456 Fax +[44] (0) 1684-892789Malvern, UKMalvern Instruments Ltd.
Serial Number : MAL1022570Mastersizer 2000 Ver. 5.54
30 May 2011 7:56:16 AMRecord Number: 18File name: Aal Pit3

Result Analysis Report
Vol. Weighted Mean D[4,3]:
%
m²/g
um
Surface Weighted Mean D[3,2]:0.0139 503.194
d(0.9):
Accessory Name:
Span :1.067
umSpecific Surface Area:
17.46
Operator notes:
Uniformity:%Vol
Obscuration:
470.361 779.650d(0.1): um
0.327
432.762
um277.894 d(0.5):
Volume
Particle Size Distribution
0.01 0.1 1 10 100 1000 3000
Particle Size (µm)
0
2
4
6
8
10
12
14
Vol
ume
(%)
S120 - Average, Tuesday, October 21, 2008 7:49:11 PM
Hydro 2000G (A)
Result units:
um
Concentration:1.1792
Weighted Residual:1.297 %
Size (µm)0.010
0.011
0.013
0.015
0.017
0.020
0.023
0.026
0.030
0.035
0.040
0.046
0.052
0.060
0.069
0.079
0.091
0.105
Volume In %
0.00
0.00
0.00
0.00
0.00
0.00
0.00
0.00
0.00
0.00
0.00
0.00
0.00
0.00
0.00
0.00
0.00
Size (µm)0.105
0.120
0.138
0.158
0.182
0.209
0.240
0.275
0.316
0.363
0.417
0.479
0.550
0.631
0.724
0.832
0.955
1.096
Volume In %
0.00
0.00
0.00
0.00
0.00
0.00
0.00
0.00
0.00
0.00
0.00
0.00
0.00
0.00
0.00
0.00
0.00
Size (µm)1.096
1.259
1.445
1.660
1.905
2.188
2.512
2.884
3.311
3.802
4.365
5.012
5.754
6.607
7.586
8.710
10.000
11.482
Volume In %
0.00
0.00
0.00
0.00
0.00
0.00
0.00
0.00
0.00
0.00
0.00
0.00
0.00
0.00
0.00
0.00
0.00
Size (µm)11.482
13.183
15.136
17.378
19.953
22.909
26.303
30.200
34.674
39.811
45.709
52.481
60.256
69.183
79.433
91.201
104.713
120.226
Volume In %
0.00
0.00
0.00
0.00
0.00
0.00
0.00
0.00
0.00
0.00
0.00
0.00
0.00
0.00
0.00
0.00
0.00
Size (µm)120.226
138.038
158.489
181.970
208.930
239.883
275.423
316.228
363.078
416.869
478.630
549.541
630.957
724.436
831.764
954.993
1096.478
1258.925
Volume In %
0.00
0.02
0.41
1.34
2.86
4.97
7.41
9.87
11.84
12.94
12.90
11.72
9.63
7.08
4.52
2.20
0.29
Size (µm)1258.925
1445.440
1659.587
1905.461
2187.762
2511.886
2884.032
3311.311
3801.894
4365.158
5011.872
5754.399
6606.934
7585.776
8709.636
10000.000
Volume In %
0.00
0.00
0.00
0.00
0.00
0.00
0.00
0.00
0.00
0.00
0.00
0.00
0.00
0.00
0.00
Tuesday, October 21, 2008 7:49:11 PM
AveragedPit4
Measured by:student
Sample bulk lot ref:
Aalikuppam
Sample Name:
Analysed:
Measured:
Sample Source & type:Tuesday, October 21, 2008 7:49:12 PM
S120 - AverageSOP Name:
Result Source:
Sensitivity:
Dispersant Name:Water Off
Size range:
Default
Particle RI:
1.330Result Emulation:
Absorption:0.020 to0.1
NormalAnalysis model:
2000.000
Dispersant RI:
1.520
General purposeParticle Name:
um
Tel := +[44] (0) 1684-892456 Fax +[44] (0) 1684-892789Malvern, UKMalvern Instruments Ltd.
Serial Number : MAL1022570Mastersizer 2000 Ver. 5.54
30 May 2011 7:56:35 AMRecord Number: 6File name: Aal pit4

Result Analysis Report
Vol. Weighted Mean D[4,3]:
%
m²/g
um
Surface Weighted Mean D[3,2]:0.0146 478.322
d(0.9):
Accessory Name:
Span :1.071
umSpecific Surface Area:
18.56
Operator notes:
Uniformity:%Vol
Obscuration:
446.837 742.333d(0.1): um
0.332
411.171
um263.678 d(0.5):
Volume
Particle Size Distribution
0.01 0.1 1 10 100 1000 3000
Particle Size (µm)
0
2
4
6
8
10
12
14
Vol
ume
(%)
S121 - Average, Tuesday, October 21, 2008 8:00:48 PM
Hydro 2000G (A)
Result units:
um
Concentration:1.1984
Weighted Residual:1.186 %
Size (µm)0.010
0.011
0.013
0.015
0.017
0.020
0.023
0.026
0.030
0.035
0.040
0.046
0.052
0.060
0.069
0.079
0.091
0.105
Volume In %
0.00
0.00
0.00
0.00
0.00
0.00
0.00
0.00
0.00
0.00
0.00
0.00
0.00
0.00
0.00
0.00
0.00
Size (µm)0.105
0.120
0.138
0.158
0.182
0.209
0.240
0.275
0.316
0.363
0.417
0.479
0.550
0.631
0.724
0.832
0.955
1.096
Volume In %
0.00
0.00
0.00
0.00
0.00
0.00
0.00
0.00
0.00
0.00
0.00
0.00
0.00
0.00
0.00
0.00
0.00
Size (µm)1.096
1.259
1.445
1.660
1.905
2.188
2.512
2.884
3.311
3.802
4.365
5.012
5.754
6.607
7.586
8.710
10.000
11.482
Volume In %
0.00
0.00
0.00
0.00
0.00
0.00
0.00
0.00
0.00
0.00
0.00
0.00
0.00
0.00
0.00
0.00
0.00
Size (µm)11.482
13.183
15.136
17.378
19.953
22.909
26.303
30.200
34.674
39.811
45.709
52.481
60.256
69.183
79.433
91.201
104.713
120.226
Volume In %
0.00
0.00
0.00
0.00
0.00
0.00
0.00
0.00
0.00
0.00
0.00
0.00
0.00
0.00
0.00
0.00
0.00
Size (µm)120.226
138.038
158.489
181.970
208.930
239.883
275.423
316.228
363.078
416.869
478.630
549.541
630.957
724.436
831.764
954.993
1096.478
1258.925
Volume In %
0.00
0.05
0.72
1.86
3.61
5.88
8.35
10.67
12.33
13.02
12.54
10.99
8.71
6.11
3.70
1.46
0.00
Size (µm)1258.925
1445.440
1659.587
1905.461
2187.762
2511.886
2884.032
3311.311
3801.894
4365.158
5011.872
5754.399
6606.934
7585.776
8709.636
10000.000
Volume In %
0.00
0.00
0.00
0.00
0.00
0.00
0.00
0.00
0.00
0.00
0.00
0.00
0.00
0.00
0.00
Tuesday, October 21, 2008 8:00:48 PM
AveragedPit4
Measured by:student
Sample bulk lot ref:
Aalikuppam
Sample Name:
Analysed:
Measured:
Sample Source & type:Tuesday, October 21, 2008 8:00:50 PM
S121 - AverageSOP Name:
Result Source:
Sensitivity:
Dispersant Name:Water Off
Size range:
Default
Particle RI:
1.330Result Emulation:
Absorption:0.020 to0.1
NormalAnalysis model:
2000.000
Dispersant RI:
1.520
General purposeParticle Name:
um
Tel := +[44] (0) 1684-892456 Fax +[44] (0) 1684-892789Malvern, UKMalvern Instruments Ltd.
Serial Number : MAL1022570Mastersizer 2000 Ver. 5.54
30 May 2011 7:56:49 AMRecord Number: 12File name: Aal pit4

Result Analysis Report
Vol. Weighted Mean D[4,3]:
%
m²/g
um
Surface Weighted Mean D[3,2]:0.0195 358.620
d(0.9):
Accessory Name:
Span :1.085
umSpecific Surface Area:
20.32
Operator notes:
Uniformity:%Vol
Obscuration:
333.163 559.358d(0.1): um
0.335
307.969
um197.886 d(0.5):
Volume
Particle Size Distribution
0.01 0.1 1 10 100 1000 3000
Particle Size (µm)
0
2
4
6
8
10
12
14
Vol
ume
(%)
S122 - Average, Wednesday, January 21, 2009 7:38:53 PM
Hydro 2000G (A)
Result units:
um
Concentration:0.9935
Weighted Residual:0.606 %
Size (µm)0.010
0.011
0.013
0.015
0.017
0.020
0.023
0.026
0.030
0.035
0.040
0.046
0.052
0.060
0.069
0.079
0.091
0.105
Volume In %
0.00
0.00
0.00
0.00
0.00
0.00
0.00
0.00
0.00
0.00
0.00
0.00
0.00
0.00
0.00
0.00
0.00
Size (µm)0.105
0.120
0.138
0.158
0.182
0.209
0.240
0.275
0.316
0.363
0.417
0.479
0.550
0.631
0.724
0.832
0.955
1.096
Volume In %
0.00
0.00
0.00
0.00
0.00
0.00
0.00
0.00
0.00
0.00
0.00
0.00
0.00
0.00
0.00
0.00
0.00
Size (µm)1.096
1.259
1.445
1.660
1.905
2.188
2.512
2.884
3.311
3.802
4.365
5.012
5.754
6.607
7.586
8.710
10.000
11.482
Volume In %
0.00
0.00
0.00
0.00
0.00
0.00
0.00
0.00
0.00
0.00
0.00
0.00
0.00
0.00
0.00
0.00
0.00
Size (µm)11.482
13.183
15.136
17.378
19.953
22.909
26.303
30.200
34.674
39.811
45.709
52.481
60.256
69.183
79.433
91.201
104.713
120.226
Volume In %
0.00
0.00
0.00
0.00
0.00
0.00
0.00
0.00
0.00
0.00
0.00
0.00
0.00
0.00
0.00
0.00
0.07
Size (µm)120.226
138.038
158.489
181.970
208.930
239.883
275.423
316.228
363.078
416.869
478.630
549.541
630.957
724.436
831.764
954.993
1096.478
1258.925
Volume In %
0.69
1.94
3.82
6.23
8.76
11.04
12.54
12.98
12.26
10.55
8.25
5.79
3.63
1.36
0.10
0.00
0.00
Size (µm)1258.925
1445.440
1659.587
1905.461
2187.762
2511.886
2884.032
3311.311
3801.894
4365.158
5011.872
5754.399
6606.934
7585.776
8709.636
10000.000
Volume In %
0.00
0.00
0.00
0.00
0.00
0.00
0.00
0.00
0.00
0.00
0.00
0.00
0.00
0.00
0.00
Wednesday, January 21, 2009 7:38:53 PM
AveragedPit1
Measured by:Unknown
Sample bulk lot ref:
Karrikatakuppam
Sample Name:
Analysed:
Measured:
Sample Source & type:Wednesday, January 21, 2009 7:38:54 PM
S122 - AverageSOP Name:
Result Source:
Sensitivity:
Dispersant Name:Water Off
Size range:
Default
Particle RI:
1.330Result Emulation:
Absorption:0.020 to0.1
NormalAnalysis model:
2000.000
Dispersant RI:
1.520
General purposeParticle Name:
um
Tel := +[44] (0) 1684-892456 Fax +[44] (0) 1684-892789Malvern, UKMalvern Instruments Ltd.
Serial Number : MAL1022570Mastersizer 2000 Ver. 5.54
30 May 2011 8:12:56 AMRecord Number: 4File name: Karikattakuppam

Result Analysis Report
Vol. Weighted Mean D[4,3]:
%
m²/g
um
Surface Weighted Mean D[3,2]:0.0196 354.249
d(0.9):
Accessory Name:
Span :1.054
umSpecific Surface Area:
15.53
Operator notes:
Uniformity:%Vol
Obscuration:
330.798 546.968d(0.1): um
0.327
306.363
um198.325 d(0.5):
Volume
Particle Size Distribution
0.01 0.1 1 10 100 1000 3000
Particle Size (µm)
0
2
4
6
8
10
12
14
16
Vol
ume
(%)
S123 - Average, Wednesday, January 21, 2009 7:47:01 PM
Hydro 2000G (A)
Result units:
um
Concentration:0.7341
Weighted Residual:0.496 %
Size (µm)0.010
0.011
0.013
0.015
0.017
0.020
0.023
0.026
0.030
0.035
0.040
0.046
0.052
0.060
0.069
0.079
0.091
0.105
Volume In %
0.00
0.00
0.00
0.00
0.00
0.00
0.00
0.00
0.00
0.00
0.00
0.00
0.00
0.00
0.00
0.00
0.00
Size (µm)0.105
0.120
0.138
0.158
0.182
0.209
0.240
0.275
0.316
0.363
0.417
0.479
0.550
0.631
0.724
0.832
0.955
1.096
Volume In %
0.00
0.00
0.00
0.00
0.00
0.00
0.00
0.00
0.00
0.00
0.00
0.00
0.00
0.00
0.00
0.00
0.00
Size (µm)1.096
1.259
1.445
1.660
1.905
2.188
2.512
2.884
3.311
3.802
4.365
5.012
5.754
6.607
7.586
8.710
10.000
11.482
Volume In %
0.00
0.00
0.00
0.00
0.00
0.00
0.00
0.00
0.00
0.00
0.00
0.00
0.00
0.00
0.00
0.00
0.00
Size (µm)11.482
13.183
15.136
17.378
19.953
22.909
26.303
30.200
34.674
39.811
45.709
52.481
60.256
69.183
79.433
91.201
104.713
120.226
Volume In %
0.00
0.00
0.00
0.00
0.00
0.00
0.00
0.00
0.00
0.00
0.00
0.00
0.00
0.00
0.00
0.00
0.05
Size (µm)120.226
138.038
158.489
181.970
208.930
239.883
275.423
316.228
363.078
416.869
478.630
549.541
630.957
724.436
831.764
954.993
1096.478
1258.925
Volume In %
0.62
1.90
3.81
6.29
8.90
11.26
12.82
13.26
12.48
10.65
8.19
5.57
3.24
0.95
0.00
0.00
0.00
Size (µm)1258.925
1445.440
1659.587
1905.461
2187.762
2511.886
2884.032
3311.311
3801.894
4365.158
5011.872
5754.399
6606.934
7585.776
8709.636
10000.000
Volume In %
0.00
0.00
0.00
0.00
0.00
0.00
0.00
0.00
0.00
0.00
0.00
0.00
0.00
0.00
0.00
Wednesday, January 21, 2009 7:47:01 PM
AveragedPit1
Measured by:Unknown
Sample bulk lot ref:
Karrikatakuppam
Sample Name:
Analysed:
Measured:
Sample Source & type:Wednesday, January 21, 2009 7:47:02 PM
S123 - AverageSOP Name:
Result Source:
Sensitivity:
Dispersant Name:Water Off
Size range:
Default
Particle RI:
1.330Result Emulation:
Absorption:0.020 to0.1
NormalAnalysis model:
2000.000
Dispersant RI:
1.520
General purposeParticle Name:
um
Tel := +[44] (0) 1684-892456 Fax +[44] (0) 1684-892789Malvern, UKMalvern Instruments Ltd.
Serial Number : MAL1022570Mastersizer 2000 Ver. 5.54
30 May 2011 8:13:10 AMRecord Number: 8File name: Karikattakuppam

Result Analysis Report
Vol. Weighted Mean D[4,3]:
%
m²/g
um
Surface Weighted Mean D[3,2]:0.0171 419.242
d(0.9):
Accessory Name:
Span :1.173
umSpecific Surface Area:
18.43
Operator notes:
Uniformity:%Vol
Obscuration:
388.283 672.167
stratigraphically above 123
d(0.1): um
0.362
350.223
um216.518 d(0.5):
Volume
Particle Size Distribution
0.01 0.1 1 10 100 1000 3000
Particle Size (µm)
0
2
4
6
8
10
12
14
Vol
ume
(%)
S124 - Average, Wednesday, January 21, 2009 7:53:19 PM
Hydro 2000G (A)
Result units:
um
Concentration:1.0129
Weighted Residual:0.638 %
Size (µm)0.010
0.011
0.013
0.015
0.017
0.020
0.023
0.026
0.030
0.035
0.040
0.046
0.052
0.060
0.069
0.079
0.091
0.105
Volume In %
0.00
0.00
0.00
0.00
0.00
0.00
0.00
0.00
0.00
0.00
0.00
0.00
0.00
0.00
0.00
0.00
0.00
Size (µm)0.105
0.120
0.138
0.158
0.182
0.209
0.240
0.275
0.316
0.363
0.417
0.479
0.550
0.631
0.724
0.832
0.955
1.096
Volume In %
0.00
0.00
0.00
0.00
0.00
0.00
0.00
0.00
0.00
0.00
0.00
0.00
0.00
0.00
0.00
0.00
0.00
Size (µm)1.096
1.259
1.445
1.660
1.905
2.188
2.512
2.884
3.311
3.802
4.365
5.012
5.754
6.607
7.586
8.710
10.000
11.482
Volume In %
0.00
0.00
0.00
0.00
0.00
0.00
0.00
0.00
0.00
0.00
0.00
0.00
0.00
0.00
0.00
0.00
0.00
Size (µm)11.482
13.183
15.136
17.378
19.953
22.909
26.303
30.200
34.674
39.811
45.709
52.481
60.256
69.183
79.433
91.201
104.713
120.226
Volume In %
0.00
0.00
0.00
0.00
0.00
0.00
0.00
0.00
0.00
0.00
0.00
0.00
0.00
0.00
0.00
0.00
0.04
Size (µm)120.226
138.038
158.489
181.970
208.930
239.883
275.423
316.228
363.078
416.869
478.630
549.541
630.957
724.436
831.764
954.993
1096.478
1258.925
Volume In %
0.47
1.30
2.55
4.24
6.17
8.20
9.99
11.29
11.84
11.54
10.42
8.66
6.55
4.42
2.17
0.14
0.00
Size (µm)1258.925
1445.440
1659.587
1905.461
2187.762
2511.886
2884.032
3311.311
3801.894
4365.158
5011.872
5754.399
6606.934
7585.776
8709.636
10000.000
Volume In %
0.00
0.00
0.00
0.00
0.00
0.00
0.00
0.00
0.00
0.00
0.00
0.00
0.00
0.00
0.00
Wednesday, January 21, 2009 7:53:19 PM
AveragedPit1
Measured by:Unknown
Sample bulk lot ref:
Karrikatakuppam
Sample Name:
Analysed:
Measured:
Sample Source & type:Wednesday, January 21, 2009 7:53:21 PM
S124 - AverageSOP Name:
Result Source:
Sensitivity:
Dispersant Name:Water Off
Size range:
Default
Particle RI:
1.330Result Emulation:
Absorption:0.020 to0.1
NormalAnalysis model:
2000.000
Dispersant RI:
1.520
General purposeParticle Name:
um
Tel := +[44] (0) 1684-892456 Fax +[44] (0) 1684-892789Malvern, UKMalvern Instruments Ltd.
Serial Number : MAL1022570Mastersizer 2000 Ver. 5.54
30 May 2011 8:13:23 AMRecord Number: 12File name: Karikattakuppam

Result Analysis Report
Vol. Weighted Mean D[4,3]:
%
m²/g
um
Surface Weighted Mean D[3,2]:0.0185 442.862
d(0.9):
Accessory Name:
Span :1.422
umSpecific Surface Area:
22.62
Operator notes:
Uniformity:%Vol
Obscuration:
396.236 763.019d(0.1): um
0.439
324.288
um199.407 d(0.5):
Volume
Particle Size Distribution
0.01 0.1 1 10 100 1000 3000
Particle Size (µm)
0
2
4
6
8
10
12
Vol
ume
(%)
S125 - Average, Wednesday, January 21, 2009 8:00:33 PM
Hydro 2000G (A)
Result units:
um
Concentration:1.1787
Weighted Residual:0.495 %
Size (µm)0.010
0.011
0.013
0.015
0.017
0.020
0.023
0.026
0.030
0.035
0.040
0.046
0.052
0.060
0.069
0.079
0.091
0.105
Volume In %
0.00
0.00
0.00
0.00
0.00
0.00
0.00
0.00
0.00
0.00
0.00
0.00
0.00
0.00
0.00
0.00
0.00
Size (µm)0.105
0.120
0.138
0.158
0.182
0.209
0.240
0.275
0.316
0.363
0.417
0.479
0.550
0.631
0.724
0.832
0.955
1.096
Volume In %
0.00
0.00
0.00
0.00
0.00
0.00
0.00
0.00
0.00
0.00
0.00
0.00
0.00
0.00
0.00
0.00
0.00
Size (µm)1.096
1.259
1.445
1.660
1.905
2.188
2.512
2.884
3.311
3.802
4.365
5.012
5.754
6.607
7.586
8.710
10.000
11.482
Volume In %
0.00
0.00
0.00
0.00
0.00
0.00
0.00
0.00
0.00
0.00
0.00
0.00
0.00
0.00
0.00
0.00
0.00
Size (µm)11.482
13.183
15.136
17.378
19.953
22.909
26.303
30.200
34.674
39.811
45.709
52.481
60.256
69.183
79.433
91.201
104.713
120.226
Volume In %
0.00
0.00
0.00
0.00
0.00
0.02
0.08
0.12
0.16
0.19
0.20
0.17
0.13
0.07
0.06
0.14
0.41
Size (µm)120.226
138.038
158.489
181.970
208.930
239.883
275.423
316.228
363.078
416.869
478.630
549.541
630.957
724.436
831.764
954.993
1096.478
1258.925
Volume In %
0.92
1.75
2.89
4.32
5.89
7.46
8.81
9.77
10.20
10.03
9.30
8.13
6.68
5.14
3.67
2.33
0.96
Size (µm)1258.925
1445.440
1659.587
1905.461
2187.762
2511.886
2884.032
3311.311
3801.894
4365.158
5011.872
5754.399
6606.934
7585.776
8709.636
10000.000
Volume In %
0.01
0.00
0.00
0.00
0.00
0.00
0.00
0.00
0.00
0.00
0.00
0.00
0.00
0.00
0.00
Wednesday, January 21, 2009 8:00:33 PM
AveragedPit3
Measured by:Unknown
Sample bulk lot ref:
Karrikatakuppam
Sample Name:
Analysed:
Measured:
Sample Source & type:Wednesday, January 21, 2009 8:00:34 PM
S125 - AverageSOP Name:
Result Source:
Sensitivity:
Dispersant Name:Water Off
Size range:
Default
Particle RI:
1.330Result Emulation:
Absorption:0.020 to0.1
NormalAnalysis model:
2000.000
Dispersant RI:
1.520
General purposeParticle Name:
um
Tel := +[44] (0) 1684-892456 Fax +[44] (0) 1684-892789Malvern, UKMalvern Instruments Ltd.
Serial Number : MAL1022570Mastersizer 2000 Ver. 5.54
30 May 2011 8:13:39 AMRecord Number: 16File name: Karikattakuppam

Result Analysis Report
Vol. Weighted Mean D[4,3]:
%
m²/g
um
Surface Weighted Mean D[3,2]:0.0213 457.930
d(0.9):
Accessory Name:
Span :1.508
umSpecific Surface Area:
21.64
Operator notes:
Uniformity:%Vol
Obscuration:
409.602 808.535d(0.1): um
0.464
281.170
um190.897 d(0.5):
Volume
Particle Size Distribution
0.01 0.1 1 10 100 1000 3000
Particle Size (µm)
0 1 2 3 4 5 6 7 8 9
10 11
Vol
ume
(%)
S126 - Average, Wednesday, January 21, 2009 8:06:17 PM
Hydro 2000G (A)
Result units:
um
Concentration:0.9659
Weighted Residual:0.474 %
Size (µm)0.010
0.011
0.013
0.015
0.017
0.020
0.023
0.026
0.030
0.035
0.040
0.046
0.052
0.060
0.069
0.079
0.091
0.105
Volume In %
0.00
0.00
0.00
0.00
0.00
0.00
0.00
0.00
0.00
0.00
0.00
0.00
0.00
0.00
0.00
0.00
0.00
Size (µm)0.105
0.120
0.138
0.158
0.182
0.209
0.240
0.275
0.316
0.363
0.417
0.479
0.550
0.631
0.724
0.832
0.955
1.096
Volume In %
0.00
0.00
0.00
0.00
0.00
0.00
0.00
0.00
0.00
0.00
0.00
0.00
0.00
0.00
0.00
0.00
0.00
Size (µm)1.096
1.259
1.445
1.660
1.905
2.188
2.512
2.884
3.311
3.802
4.365
5.012
5.754
6.607
7.586
8.710
10.000
11.482
Volume In %
0.00
0.00
0.00
0.00
0.00
0.00
0.00
0.00
0.00
0.00
0.00
0.00
0.00
0.01
0.06
0.06
0.07
Size (µm)11.482
13.183
15.136
17.378
19.953
22.909
26.303
30.200
34.674
39.811
45.709
52.481
60.256
69.183
79.433
91.201
104.713
120.226
Volume In %
0.07
0.06
0.06
0.06
0.07
0.08
0.10
0.14
0.18
0.22
0.26
0.27
0.27
0.26
0.28
0.36
0.58
Size (µm)120.226
138.038
158.489
181.970
208.930
239.883
275.423
316.228
363.078
416.869
478.630
549.541
630.957
724.436
831.764
954.993
1096.478
1258.925
Volume In %
0.99
1.67
2.63
3.85
5.24
6.69
8.00
9.03
9.60
9.65
9.19
8.27
7.04
5.66
4.28
2.92
1.55
Size (µm)1258.925
1445.440
1659.587
1905.461
2187.762
2511.886
2884.032
3311.311
3801.894
4365.158
5011.872
5754.399
6606.934
7585.776
8709.636
10000.000
Volume In %
0.19
0.01
0.00
0.00
0.00
0.00
0.00
0.00
0.00
0.00
0.00
0.00
0.00
0.00
0.00
Wednesday, January 21, 2009 8:06:17 PM
AveragedPit3
Measured by:Unknown
Sample bulk lot ref:
Karrikatakuppam
Sample Name:
Analysed:
Measured:
Sample Source & type:Wednesday, January 21, 2009 8:06:18 PM
S126 - AverageSOP Name:
Result Source:
Sensitivity:
Dispersant Name:Water Off
Size range:
Default
Particle RI:
1.330Result Emulation:
Absorption:0.020 to0.1
NormalAnalysis model:
2000.000
Dispersant RI:
1.520
General purposeParticle Name:
um
Tel := +[44] (0) 1684-892456 Fax +[44] (0) 1684-892789Malvern, UKMalvern Instruments Ltd.
Serial Number : MAL1022570Mastersizer 2000 Ver. 5.54
30 May 2011 8:13:51 AMRecord Number: 20File name: Karikattakuppam

Result Analysis Report
Vol. Weighted Mean D[4,3]:
%
m²/g
um
Surface Weighted Mean D[3,2]:0.0196 403.470
d(0.9):
Accessory Name:
Span :1.301
umSpecific Surface Area:
19.63
Operator notes:
Uniformity:%Vol
Obscuration:
369.235 672.938d(0.1): um
0.404
306.160
um192.502 d(0.5):
Volume
Particle Size Distribution
0.01 0.1 1 10 100 1000 3000
Particle Size (µm)
0
2
4
6
8
10
12
Vol
ume
(%)
S127 - Average, Wednesday, January 21, 2009 8:12:09 PM
Hydro 2000G (A)
Result units:
um
Concentration:0.9485
Weighted Residual:0.569 %
Size (µm)0.010
0.011
0.013
0.015
0.017
0.020
0.023
0.026
0.030
0.035
0.040
0.046
0.052
0.060
0.069
0.079
0.091
0.105
Volume In %
0.00
0.00
0.00
0.00
0.00
0.00
0.00
0.00
0.00
0.00
0.00
0.00
0.00
0.00
0.00
0.00
0.00
Size (µm)0.105
0.120
0.138
0.158
0.182
0.209
0.240
0.275
0.316
0.363
0.417
0.479
0.550
0.631
0.724
0.832
0.955
1.096
Volume In %
0.00
0.00
0.00
0.00
0.00
0.00
0.00
0.00
0.00
0.00
0.00
0.00
0.00
0.00
0.00
0.00
0.00
Size (µm)1.096
1.259
1.445
1.660
1.905
2.188
2.512
2.884
3.311
3.802
4.365
5.012
5.754
6.607
7.586
8.710
10.000
11.482
Volume In %
0.00
0.00
0.00
0.00
0.00
0.00
0.00
0.00
0.00
0.00
0.00
0.00
0.00
0.00
0.00
0.00
0.00
Size (µm)11.482
13.183
15.136
17.378
19.953
22.909
26.303
30.200
34.674
39.811
45.709
52.481
60.256
69.183
79.433
91.201
104.713
120.226
Volume In %
0.00
0.00
0.00
0.00
0.00
0.00
0.02
0.11
0.17
0.21
0.24
0.23
0.19
0.13
0.10
0.17
0.45
Size (µm)120.226
138.038
158.489
181.970
208.930
239.883
275.423
316.228
363.078
416.869
478.630
549.541
630.957
724.436
831.764
954.993
1096.478
1258.925
Volume In %
1.01
1.95
3.24
4.88
6.65
8.39
9.81
10.71
10.93
10.42
9.29
7.70
5.92
4.15
2.33
0.59
0.00
Size (µm)1258.925
1445.440
1659.587
1905.461
2187.762
2511.886
2884.032
3311.311
3801.894
4365.158
5011.872
5754.399
6606.934
7585.776
8709.636
10000.000
Volume In %
0.00
0.00
0.00
0.00
0.00
0.00
0.00
0.00
0.00
0.00
0.00
0.00
0.00
0.00
0.00
Wednesday, January 21, 2009 8:12:09 PM
AveragedPit4
Measured by:Unknown
Sample bulk lot ref:
Karrikatakuppam
Sample Name:
Analysed:
Measured:
Sample Source & type:Wednesday, January 21, 2009 8:12:11 PM
S127 - AverageSOP Name:
Result Source:
Sensitivity:
Dispersant Name:Water Off
Size range:
Default
Particle RI:
1.330Result Emulation:
Absorption:0.020 to0.1
NormalAnalysis model:
2000.000
Dispersant RI:
1.520
General purposeParticle Name:
um
Tel := +[44] (0) 1684-892456 Fax +[44] (0) 1684-892789Malvern, UKMalvern Instruments Ltd.
Serial Number : MAL1022570Mastersizer 2000 Ver. 5.54
30 May 2011 8:14:02 AMRecord Number: 24File name: Karikattakuppam

Result Analysis Report
Vol. Weighted Mean D[4,3]:
%
m²/g
um
Surface Weighted Mean D[3,2]:0.0849 198.355
d(0.9):
Accessory Name:
Span :1.998
umSpecific Surface Area:
18.56
Operator notes:
Uniformity:%Vol
Obscuration:
158.535 383.383d(0.1): um
0.642
70.661
um66.610 d(0.5):
Volume
Particle Size Distribution
0.01 0.1 1 10 100 1000 3000
Particle Size (µm)
0
1
2
3
4
5
6
7
8
9
10
Vol
ume
(%)
S128 - Average, Wednesday, January 21, 2009 8:19:11 PM
Hydro 2000G (A)
Result units:
um
Concentration:0.1956
Weighted Residual:0.253 %
Size (µm)0.010
0.011
0.013
0.015
0.017
0.020
0.023
0.026
0.030
0.035
0.040
0.046
0.052
0.060
0.069
0.079
0.091
0.105
Volume In %
0.00
0.00
0.00
0.00
0.00
0.00
0.00
0.00
0.00
0.00
0.00
0.00
0.00
0.00
0.00
0.00
0.00
Size (µm)0.105
0.120
0.138
0.158
0.182
0.209
0.240
0.275
0.316
0.363
0.417
0.479
0.550
0.631
0.724
0.832
0.955
1.096
Volume In %
0.00
0.00
0.00
0.00
0.00
0.00
0.00
0.00
0.00
0.00
0.00
0.00
0.00
0.00
0.00
0.00
0.00
Size (µm)1.096
1.259
1.445
1.660
1.905
2.188
2.512
2.884
3.311
3.802
4.365
5.012
5.754
6.607
7.586
8.710
10.000
11.482
Volume In %
0.00
0.00
0.01
0.06
0.08
0.10
0.12
0.15
0.17
0.20
0.22
0.24
0.26
0.29
0.33
0.37
0.42
Size (µm)11.482
13.183
15.136
17.378
19.953
22.909
26.303
30.200
34.674
39.811
45.709
52.481
60.256
69.183
79.433
91.201
104.713
120.226
Volume In %
0.47
0.50
0.50
0.46
0.37
0.25
0.09
0.00
0.02
0.29
0.77
1.53
2.57
3.81
5.13
6.37
7.40
Size (µm)120.226
138.038
158.489
181.970
208.930
239.883
275.423
316.228
363.078
416.869
478.630
549.541
630.957
724.436
831.764
954.993
1096.478
1258.925
Volume In %
8.08
8.37
8.25
7.77
7.04
6.14
5.18
4.23
3.35
2.57
1.92
1.37
0.95
0.61
0.37
0.19
0.08
Size (µm)1258.925
1445.440
1659.587
1905.461
2187.762
2511.886
2884.032
3311.311
3801.894
4365.158
5011.872
5754.399
6606.934
7585.776
8709.636
10000.000
Volume In %
0.00
0.00
0.00
0.00
0.00
0.00
0.00
0.00
0.00
0.00
0.00
0.00
0.00
0.00
0.00
Wednesday, January 21, 2009 8:19:11 PM
AveragedPit1
Measured by:Unknown
Sample bulk lot ref:
Muttukaddu
Sample Name:
Analysed:
Measured:
Sample Source & type:Wednesday, January 21, 2009 8:19:13 PM
S128 - AverageSOP Name:
Result Source:
Sensitivity:
Dispersant Name:Water Off
Size range:
Default
Particle RI:
1.330Result Emulation:
Absorption:0.020 to0.1
NormalAnalysis model:
2000.000
Dispersant RI:
1.520
General purposeParticle Name:
um
Tel := +[44] (0) 1684-892456 Fax +[44] (0) 1684-892789Malvern, UKMalvern Instruments Ltd.
Serial Number : MAL1022570Mastersizer 2000 Ver. 5.54
30 May 2011 8:11:48 AMRecord Number: 4File name: Muttukaddu

Result Analysis Report
Vol. Weighted Mean D[4,3]:
%
m²/g
um
Surface Weighted Mean D[3,2]:0.0647 201.566
d(0.9):
Accessory Name:
Span :1.840
umSpecific Surface Area:
21.03
Operator notes:
Uniformity:%Vol
Obscuration:
158.594 369.320d(0.1): um
0.614
92.775
um77.519 d(0.5):
Volume
Particle Size Distribution
0.01 0.1 1 10 100 1000 3000
Particle Size (µm)
0 1 2 3 4 5 6 7 8 9
10 11
Vol
ume
(%)
S129 - Average, Wednesday, January 21, 2009 8:24:14 PM
Hydro 2000G (A)
Result units:
um
Concentration:0.2991
Weighted Residual:0.342 %
Size (µm)0.010
0.011
0.013
0.015
0.017
0.020
0.023
0.026
0.030
0.035
0.040
0.046
0.052
0.060
0.069
0.079
0.091
0.105
Volume In %
0.00
0.00
0.00
0.00
0.00
0.00
0.00
0.00
0.00
0.00
0.00
0.00
0.00
0.00
0.00
0.00
0.00
Size (µm)0.105
0.120
0.138
0.158
0.182
0.209
0.240
0.275
0.316
0.363
0.417
0.479
0.550
0.631
0.724
0.832
0.955
1.096
Volume In %
0.00
0.00
0.00
0.00
0.00
0.00
0.00
0.00
0.00
0.00
0.00
0.00
0.00
0.00
0.00
0.00
0.00
Size (µm)1.096
1.259
1.445
1.660
1.905
2.188
2.512
2.884
3.311
3.802
4.365
5.012
5.754
6.607
7.586
8.710
10.000
11.482
Volume In %
0.00
0.00
0.00
0.00
0.00
0.10
0.12
0.13
0.14
0.14
0.13
0.12
0.12
0.12
0.13
0.15
0.18
Size (µm)11.482
13.183
15.136
17.378
19.953
22.909
26.303
30.200
34.674
39.811
45.709
52.481
60.256
69.183
79.433
91.201
104.713
120.226
Volume In %
0.22
0.24
0.24
0.21
0.14
0.04
0.00
0.00
0.00
0.01
0.47
1.29
2.46
3.90
5.48
6.99
8.25
Size (µm)120.226
138.038
158.489
181.970
208.930
239.883
275.423
316.228
363.078
416.869
478.630
549.541
630.957
724.436
831.764
954.993
1096.478
1258.925
Volume In %
9.07
9.37
9.12
8.39
7.34
6.12
4.90
3.78
2.85
2.12
1.58
1.18
0.88
0.66
0.47
0.33
0.21
Size (µm)1258.925
1445.440
1659.587
1905.461
2187.762
2511.886
2884.032
3311.311
3801.894
4365.158
5011.872
5754.399
6606.934
7585.776
8709.636
10000.000
Volume In %
0.11
0.01
0.00
0.00
0.00
0.00
0.00
0.00
0.00
0.00
0.00
0.00
0.00
0.00
0.00
Wednesday, January 21, 2009 8:24:14 PM
AveragedPit1
Measured by:Unknown
Sample bulk lot ref:
Muttukaddu
Sample Name:
Analysed:
Measured:
Sample Source & type:Wednesday, January 21, 2009 8:24:15 PM
S129 - AverageSOP Name:
Result Source:
Sensitivity:
Dispersant Name:Water Off
Size range:
Default
Particle RI:
1.330Result Emulation:
Absorption:0.020 to0.1
NormalAnalysis model:
2000.000
Dispersant RI:
1.520
General purposeParticle Name:
um
Tel := +[44] (0) 1684-892456 Fax +[44] (0) 1684-892789Malvern, UKMalvern Instruments Ltd.
Serial Number : MAL1022570Mastersizer 2000 Ver. 5.54
30 May 2011 8:12:01 AMRecord Number: 8File name: Muttukaddu

Result Analysis Report
Vol. Weighted Mean D[4,3]:
%
m²/g
um
Surface Weighted Mean D[3,2]:0.156 133.614
d(0.9):
Accessory Name:
Span :1.477
umSpecific Surface Area:
17.98
Operator notes:
Uniformity:%Vol
Obscuration:
109.428 213.549d(0.1): um
0.582
38.486
um51.883 d(0.5):
Volume
Particle Size Distribution
0.01 0.1 1 10 100 1000 3000
Particle Size (µm)
0
2
4
6
8
10
12
Vol
ume
(%)
S130 - Average, Wednesday, January 21, 2009 8:29:25 PM
Hydro 2000G (A)
Result units:
um
Concentration:0.1079
Weighted Residual:0.548 %
Size (µm)0.010
0.011
0.013
0.015
0.017
0.020
0.023
0.026
0.030
0.035
0.040
0.046
0.052
0.060
0.069
0.079
0.091
0.105
Volume In %
0.00
0.00
0.00
0.00
0.00
0.00
0.00
0.00
0.00
0.00
0.00
0.00
0.00
0.00
0.00
0.00
0.00
Size (µm)0.105
0.120
0.138
0.158
0.182
0.209
0.240
0.275
0.316
0.363
0.417
0.479
0.550
0.631
0.724
0.832
0.955
1.096
Volume In %
0.00
0.00
0.00
0.00
0.00
0.00
0.00
0.00
0.00
0.00
0.00
0.00
0.05
0.07
0.08
0.08
0.09
Size (µm)1.096
1.259
1.445
1.660
1.905
2.188
2.512
2.884
3.311
3.802
4.365
5.012
5.754
6.607
7.586
8.710
10.000
11.482
Volume In %
0.09
0.10
0.11
0.12
0.15
0.18
0.21
0.23
0.25
0.27
0.28
0.29
0.31
0.35
0.40
0.47
0.54
Size (µm)11.482
13.183
15.136
17.378
19.953
22.909
26.303
30.200
34.674
39.811
45.709
52.481
60.256
69.183
79.433
91.201
104.713
120.226
Volume In %
0.59
0.61
0.55
0.42
0.21
0.03
0.00
-0.00
0.14
0.90
2.09
3.71
5.61
7.54
9.21
10.30
10.65
Size (µm)120.226
138.038
158.489
181.970
208.930
239.883
275.423
316.228
363.078
416.869
478.630
549.541
630.957
724.436
831.764
954.993
1096.478
1258.925
Volume In %
10.18
9.00
7.36
5.50
3.76
2.30
1.25
0.60
0.30
0.23
0.28
0.35
0.39
0.38
0.32
0.24
0.15
Size (µm)1258.925
1445.440
1659.587
1905.461
2187.762
2511.886
2884.032
3311.311
3801.894
4365.158
5011.872
5754.399
6606.934
7585.776
8709.636
10000.000
Volume In %
0.09
0.04
0.02
0.01
0.00
0.00
0.00
0.00
0.00
0.00
0.00
0.00
0.00
0.00
0.00
Wednesday, January 21, 2009 8:29:25 PM
AveragedPit1
Measured by:Unknown
Sample bulk lot ref:
Muttukaddu
Sample Name:
Analysed:
Measured:
Sample Source & type:Wednesday, January 21, 2009 8:29:27 PM
S130 - AverageSOP Name:
Result Source:
Sensitivity:
Dispersant Name:Water Off
Size range:
Default
Particle RI:
1.330Result Emulation:
Absorption:0.020 to0.1
NormalAnalysis model:
2000.000
Dispersant RI:
1.520
General purposeParticle Name:
um
Tel := +[44] (0) 1684-892456 Fax +[44] (0) 1684-892789Malvern, UKMalvern Instruments Ltd.
Serial Number : MAL1022570Mastersizer 2000 Ver. 5.54
30 May 2011 8:12:10 AMRecord Number: 12File name: Muttukaddu

Result Analysis Report
Vol. Weighted Mean D[4,3]:
%
m²/g
um
Surface Weighted Mean D[3,2]:0.0258 319.038
d(0.9):
Accessory Name:
Span :1.476
umSpecific Surface Area:
20.23
Operator notes:
Uniformity:%Vol
Obscuration:
284.047 555.516d(0.1): um
0.458
232.425
um136.356 d(0.5):
Volume
Particle Size Distribution
0.01 0.1 1 10 100 1000 3000
Particle Size (µm)
0 1 2 3 4 5 6 7 8 9
10 11
Vol
ume
(%)
S131 - Average, Wednesday, January 28, 2009 9:29:50 PM
Hydro 2000G (A)
Result units:
um
Concentration:0.7444
Weighted Residual:0.754 %
Size (µm)0.010
0.011
0.013
0.015
0.017
0.020
0.023
0.026
0.030
0.035
0.040
0.046
0.052
0.060
0.069
0.079
0.091
0.105
Volume In %
0.00
0.00
0.00
0.00
0.00
0.00
0.00
0.00
0.00
0.00
0.00
0.00
0.00
0.00
0.00
0.00
0.00
Size (µm)0.105
0.120
0.138
0.158
0.182
0.209
0.240
0.275
0.316
0.363
0.417
0.479
0.550
0.631
0.724
0.832
0.955
1.096
Volume In %
0.00
0.00
0.00
0.00
0.00
0.00
0.00
0.00
0.00
0.00
0.00
0.00
0.00
0.00
0.00
0.00
0.00
Size (µm)1.096
1.259
1.445
1.660
1.905
2.188
2.512
2.884
3.311
3.802
4.365
5.012
5.754
6.607
7.586
8.710
10.000
11.482
Volume In %
0.00
0.00
0.00
0.00
0.00
0.00
0.00
0.00
0.00
0.00
0.00
0.00
0.00
0.00
0.00
0.00
0.00
Size (µm)11.482
13.183
15.136
17.378
19.953
22.909
26.303
30.200
34.674
39.811
45.709
52.481
60.256
69.183
79.433
91.201
104.713
120.226
Volume In %
0.00
0.00
0.00
0.03
0.07
0.08
0.09
0.10
0.09
0.09
0.10
0.16
0.29
0.54
0.97
1.61
2.51
Size (µm)120.226
138.038
158.489
181.970
208.930
239.883
275.423
316.228
363.078
416.869
478.630
549.541
630.957
724.436
831.764
954.993
1096.478
1258.925
Volume In %
3.63
4.95
6.35
7.71
8.83
9.59
9.85
9.55
8.75
7.54
6.09
4.58
3.17
1.82
0.67
0.17
0.00
Size (µm)1258.925
1445.440
1659.587
1905.461
2187.762
2511.886
2884.032
3311.311
3801.894
4365.158
5011.872
5754.399
6606.934
7585.776
8709.636
10000.000
Volume In %
0.00
0.00
0.00
0.00
0.00
0.00
0.00
0.00
0.00
0.00
0.00
0.00
0.00
0.00
0.00
Wednesday, January 28, 2009 9:29:50 PM
AveragedPit1
Measured by:JohnstonP
Sample bulk lot ref:
Muttukaddu
Sample Name:
Analysed:
Measured:
Sample Source & type:Wednesday, January 28, 2009 9:29:51 PM
S131 - AverageSOP Name:
Result Source:
Sensitivity:
Dispersant Name:Water Off
Size range:
Default
Particle RI:
1.330Result Emulation:
Absorption:0.020 to0.1
NormalAnalysis model:
2000.000
Dispersant RI:
1.520
General purposeParticle Name:
um
Tel := +[44] (0) 1684-892456 Fax +[44] (0) 1684-892789Malvern, UKMalvern Instruments Ltd.
Serial Number : MAL1022570Mastersizer 2000 Ver. 5.54
30 May 2011 8:12:20 AMRecord Number: 24File name: Muttukaddu

Result Analysis Report
Vol. Weighted Mean D[4,3]:
%
m²/g
um
Surface Weighted Mean D[3,2]:0.181 235.648
d(0.9):
Accessory Name:
Span :2.237
umSpecific Surface Area:
18.42
Operator notes:
Uniformity:%Vol
Obscuration:
189.078 481.515d(0.1): um
0.693
33.169
um58.516 d(0.5):
Volume
Particle Size Distribution
0.01 0.1 1 10 100 1000 3000
Particle Size (µm)
0
1
2
3
4
5
6
7
8
Vol
ume
(%)
S132 - Average, Wednesday, January 28, 2009 9:37:46 PM
Hydro 2000G (A)
Result units:
um
Concentration:0.1032
Weighted Residual:0.506 %
Size (µm)0.010
0.011
0.013
0.015
0.017
0.020
0.023
0.026
0.030
0.035
0.040
0.046
0.052
0.060
0.069
0.079
0.091
0.105
Volume In %
0.00
0.00
0.00
0.00
0.00
0.00
0.00
0.00
0.00
0.00
0.00
0.00
0.00
0.00
0.00
0.00
0.00
Size (µm)0.105
0.120
0.138
0.158
0.182
0.209
0.240
0.275
0.316
0.363
0.417
0.479
0.550
0.631
0.724
0.832
0.955
1.096
Volume In %
0.00
0.00
0.00
0.00
0.00
0.00
0.00
0.00
0.00
0.00
0.06
0.08
0.10
0.11
0.12
0.12
0.13
Size (µm)1.096
1.259
1.445
1.660
1.905
2.188
2.512
2.884
3.311
3.802
4.365
5.012
5.754
6.607
7.586
8.710
10.000
11.482
Volume In %
0.13
0.14
0.15
0.16
0.18
0.21
0.24
0.27
0.29
0.31
0.33
0.34
0.35
0.36
0.36
0.38
0.39
Size (µm)11.482
13.183
15.136
17.378
19.953
22.909
26.303
30.200
34.674
39.811
45.709
52.481
60.256
69.183
79.433
91.201
104.713
120.226
Volume In %
0.41
0.42
0.41
0.39
0.35
0.29
0.23
0.19
0.22
0.35
0.63
1.09
1.74
2.55
3.48
4.44
5.37
Size (µm)120.226
138.038
158.489
181.970
208.930
239.883
275.423
316.228
363.078
416.869
478.630
549.541
630.957
724.436
831.764
954.993
1096.478
1258.925
Volume In %
6.17
6.79
7.17
7.29
7.16
6.79
6.25
5.56
4.80
4.02
3.25
2.54
1.89
1.30
0.78
0.33
0.07
Size (µm)1258.925
1445.440
1659.587
1905.461
2187.762
2511.886
2884.032
3311.311
3801.894
4365.158
5011.872
5754.399
6606.934
7585.776
8709.636
10000.000
Volume In %
0.00
0.00
0.00
0.00
0.00
0.00
0.00
0.00
0.00
0.00
0.00
0.00
0.00
0.00
0.00
Wednesday, January 28, 2009 9:37:46 PM
AveragedPit1
Measured by:JohnstonP
Sample bulk lot ref:
Muttukaddu
Sample Name:
Analysed:
Measured:
Sample Source & type:Wednesday, January 28, 2009 9:37:47 PM
S132 - AverageSOP Name:
Result Source:
Sensitivity:
Dispersant Name:Water Off
Size range:
Default
Particle RI:
1.330Result Emulation:
Absorption:0.020 to0.1
NormalAnalysis model:
2000.000
Dispersant RI:
1.520
General purposeParticle Name:
um
Tel := +[44] (0) 1684-892456 Fax +[44] (0) 1684-892789Malvern, UKMalvern Instruments Ltd.
Serial Number : MAL1022570Mastersizer 2000 Ver. 5.54
30 May 2011 8:12:37 AMRecord Number: 28File name: Muttukaddu

Result Analysis Report
Vol. Weighted Mean D[4,3]:
%
m²/g
um
Surface Weighted Mean D[3,2]:0.0393 198.006
d(0.9):
Accessory Name:
Span :1.146
umSpecific Surface Area:
24.74
Operator notes:
Uniformity:%Vol
Obscuration:
183.617 315.120d(0.1): um
0.36
152.725
um104.687 d(0.5):
Volume
Particle Size Distribution
0.01 0.1 1 10 100 1000 3000
Particle Size (µm)
0
2
4
6
8
10
12
14
Vol
ume
(%)
S133 - Average, Wednesday, January 21, 2009 8:46:18 PM
Hydro 2000G (A)
Result units:
um
Concentration:0.6130
Weighted Residual:0.438 %
Size (µm)0.010
0.011
0.013
0.015
0.017
0.020
0.023
0.026
0.030
0.035
0.040
0.046
0.052
0.060
0.069
0.079
0.091
0.105
Volume In %
0.00
0.00
0.00
0.00
0.00
0.00
0.00
0.00
0.00
0.00
0.00
0.00
0.00
0.00
0.00
0.00
0.00
Size (µm)0.105
0.120
0.138
0.158
0.182
0.209
0.240
0.275
0.316
0.363
0.417
0.479
0.550
0.631
0.724
0.832
0.955
1.096
Volume In %
0.00
0.00
0.00
0.00
0.00
0.00
0.00
0.00
0.00
0.00
0.00
0.00
0.00
0.00
0.00
0.00
0.00
Size (µm)1.096
1.259
1.445
1.660
1.905
2.188
2.512
2.884
3.311
3.802
4.365
5.012
5.754
6.607
7.586
8.710
10.000
11.482
Volume In %
0.00
0.00
0.00
0.00
0.00
0.00
0.00
0.00
0.00
0.00
0.00
0.00
0.00
0.00
0.00
0.00
0.00
Size (µm)11.482
13.183
15.136
17.378
19.953
22.909
26.303
30.200
34.674
39.811
45.709
52.481
60.256
69.183
79.433
91.201
104.713
120.226
Volume In %
0.06
0.13
0.20
0.27
0.30
0.28
0.21
0.08
0.00
0.00
0.00
0.00
0.32
1.16
2.54
4.45
6.76
Size (µm)120.226
138.038
158.489
181.970
208.930
239.883
275.423
316.228
363.078
416.869
478.630
549.541
630.957
724.436
831.764
954.993
1096.478
1258.925
Volume In %
9.09
11.07
12.25
12.41
11.49
9.68
7.40
5.04
2.97
1.56
0.26
0.00
0.00
0.00
0.00
0.00
0.00
Size (µm)1258.925
1445.440
1659.587
1905.461
2187.762
2511.886
2884.032
3311.311
3801.894
4365.158
5011.872
5754.399
6606.934
7585.776
8709.636
10000.000
Volume In %
0.00
0.00
0.00
0.00
0.00
0.00
0.00
0.00
0.00
0.00
0.00
0.00
0.00
0.00
0.00
Wednesday, January 21, 2009 8:46:18 PM
AveragedPit1
Measured by:Unknown
Sample bulk lot ref:
Vailanganni
Sample Name:
Analysed:
Measured:
Sample Source & type:Wednesday, January 21, 2009 8:46:19 PM
S133 - AverageSOP Name:
Result Source:
Sensitivity:
Dispersant Name:Water Off
Size range:
Default
Particle RI:
1.330Result Emulation:
Absorption:0.020 to0.1
NormalAnalysis model:
2000.000
Dispersant RI:
1.520
General purposeParticle Name:
um
Tel := +[44] (0) 1684-892456 Fax +[44] (0) 1684-892789Malvern, UKMalvern Instruments Ltd.
Serial Number : MAL1022570Mastersizer 2000 Ver. 5.54
30 May 2011 8:14:24 AMRecord Number: 4File name: Vailanganni
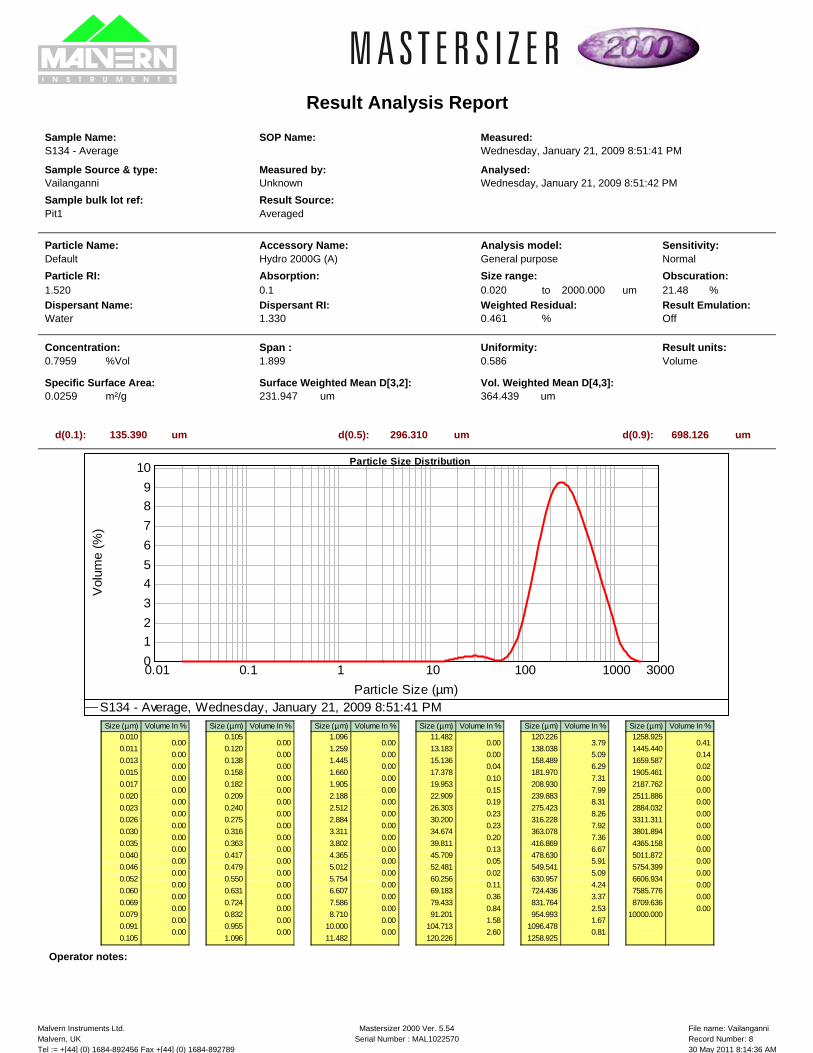
Result Analysis Report
Vol. Weighted Mean D[4,3]:
%
m²/g
um
Surface Weighted Mean D[3,2]:0.0259 364.439
d(0.9):
Accessory Name:
Span :1.899
umSpecific Surface Area:
21.48
Operator notes:
Uniformity:%Vol
Obscuration:
296.310 698.126d(0.1): um
0.586
231.947
um135.390 d(0.5):
Volume
Particle Size Distribution
0.01 0.1 1 10 100 1000 3000
Particle Size (µm)
0
1
2
3
4
5
6
7
8
9
10
Vol
ume
(%)
S134 - Average, Wednesday, January 21, 2009 8:51:41 PM
Hydro 2000G (A)
Result units:
um
Concentration:0.7959
Weighted Residual:0.461 %
Size (µm)0.010
0.011
0.013
0.015
0.017
0.020
0.023
0.026
0.030
0.035
0.040
0.046
0.052
0.060
0.069
0.079
0.091
0.105
Volume In %
0.00
0.00
0.00
0.00
0.00
0.00
0.00
0.00
0.00
0.00
0.00
0.00
0.00
0.00
0.00
0.00
0.00
Size (µm)0.105
0.120
0.138
0.158
0.182
0.209
0.240
0.275
0.316
0.363
0.417
0.479
0.550
0.631
0.724
0.832
0.955
1.096
Volume In %
0.00
0.00
0.00
0.00
0.00
0.00
0.00
0.00
0.00
0.00
0.00
0.00
0.00
0.00
0.00
0.00
0.00
Size (µm)1.096
1.259
1.445
1.660
1.905
2.188
2.512
2.884
3.311
3.802
4.365
5.012
5.754
6.607
7.586
8.710
10.000
11.482
Volume In %
0.00
0.00
0.00
0.00
0.00
0.00
0.00
0.00
0.00
0.00
0.00
0.00
0.00
0.00
0.00
0.00
0.00
Size (µm)11.482
13.183
15.136
17.378
19.953
22.909
26.303
30.200
34.674
39.811
45.709
52.481
60.256
69.183
79.433
91.201
104.713
120.226
Volume In %
0.00
0.00
0.04
0.10
0.15
0.19
0.23
0.23
0.20
0.13
0.05
0.02
0.11
0.36
0.84
1.58
2.60
Size (µm)120.226
138.038
158.489
181.970
208.930
239.883
275.423
316.228
363.078
416.869
478.630
549.541
630.957
724.436
831.764
954.993
1096.478
1258.925
Volume In %
3.79
5.09
6.29
7.31
7.99
8.31
8.26
7.92
7.36
6.67
5.91
5.09
4.24
3.37
2.53
1.67
0.81
Size (µm)1258.925
1445.440
1659.587
1905.461
2187.762
2511.886
2884.032
3311.311
3801.894
4365.158
5011.872
5754.399
6606.934
7585.776
8709.636
10000.000
Volume In %
0.41
0.14
0.02
0.00
0.00
0.00
0.00
0.00
0.00
0.00
0.00
0.00
0.00
0.00
0.00
Wednesday, January 21, 2009 8:51:41 PM
AveragedPit1
Measured by:Unknown
Sample bulk lot ref:
Vailanganni
Sample Name:
Analysed:
Measured:
Sample Source & type:Wednesday, January 21, 2009 8:51:42 PM
S134 - AverageSOP Name:
Result Source:
Sensitivity:
Dispersant Name:Water Off
Size range:
Default
Particle RI:
1.330Result Emulation:
Absorption:0.020 to0.1
NormalAnalysis model:
2000.000
Dispersant RI:
1.520
General purposeParticle Name:
um
Tel := +[44] (0) 1684-892456 Fax +[44] (0) 1684-892789Malvern, UKMalvern Instruments Ltd.
Serial Number : MAL1022570Mastersizer 2000 Ver. 5.54
30 May 2011 8:14:36 AMRecord Number: 8File name: Vailanganni

Result Analysis Report
Vol. Weighted Mean D[4,3]:
%
m²/g
um
Surface Weighted Mean D[3,2]:0.04 223.977
d(0.9):
Accessory Name:
Span :1.087
umSpecific Surface Area:
17.81
Operator notes:
Uniformity:%Vol
Obscuration:
211.823 351.298d(0.1): um
0.344
150.000
um121.073 d(0.5):
Volume
Particle Size Distribution
0.01 0.1 1 10 100 1000 3000
Particle Size (µm)
0
2
4
6
8
10
12
14
Vol
ume
(%)
S135 - Average, Wednesday, January 21, 2009 9:12:59 PM
Hydro 2000G (A)
Result units:
um
Concentration:0.4160
Weighted Residual:0.518 %
Size (µm)0.010
0.011
0.013
0.015
0.017
0.020
0.023
0.026
0.030
0.035
0.040
0.046
0.052
0.060
0.069
0.079
0.091
0.105
Volume In %
0.00
0.00
0.00
0.00
0.00
0.00
0.00
0.00
0.00
0.00
0.00
0.00
0.00
0.00
0.00
0.00
0.00
Size (µm)0.105
0.120
0.138
0.158
0.182
0.209
0.240
0.275
0.316
0.363
0.417
0.479
0.550
0.631
0.724
0.832
0.955
1.096
Volume In %
0.00
0.00
0.00
0.00
0.00
0.00
0.00
0.00
0.00
0.00
0.00
0.00
0.00
0.00
0.00
0.00
0.00
Size (µm)1.096
1.259
1.445
1.660
1.905
2.188
2.512
2.884
3.311
3.802
4.365
5.012
5.754
6.607
7.586
8.710
10.000
11.482
Volume In %
0.00
0.00
0.00
0.00
0.00
0.00
0.00
0.00
0.03
0.06
0.07
0.07
0.07
0.06
0.05
0.04
0.04
Size (µm)11.482
13.183
15.136
17.378
19.953
22.909
26.303
30.200
34.674
39.811
45.709
52.481
60.256
69.183
79.433
91.201
104.713
120.226
Volume In %
0.07
0.11
0.16
0.23
0.29
0.33
0.32
0.26
0.12
0.00
0.00
0.00
0.00
0.18
0.90
2.19
4.09
Size (µm)120.226
138.038
158.489
181.970
208.930
239.883
275.423
316.228
363.078
416.869
478.630
549.541
630.957
724.436
831.764
954.993
1096.478
1258.925
Volume In %
6.42
8.92
11.09
12.54
12.90
12.06
10.21
7.72
5.07
2.83
0.51
0.00
0.00
0.00
0.00
0.00
0.00
Size (µm)1258.925
1445.440
1659.587
1905.461
2187.762
2511.886
2884.032
3311.311
3801.894
4365.158
5011.872
5754.399
6606.934
7585.776
8709.636
10000.000
Volume In %
0.00
0.00
0.00
0.00
0.00
0.00
0.00
0.00
0.00
0.00
0.00
0.00
0.00
0.00
0.00
Wednesday, January 21, 2009 9:12:59 PM
AveragedPit1
Measured by:Unknown
Sample bulk lot ref:
Vailanganni
Sample Name:
Analysed:
Measured:
Sample Source & type:Wednesday, January 21, 2009 9:13:00 PM
S135 - AverageSOP Name:
Result Source:
Sensitivity:
Dispersant Name:Water Off
Size range:
Default
Particle RI:
1.330Result Emulation:
Absorption:0.020 to0.1
NormalAnalysis model:
2000.000
Dispersant RI:
1.520
General purposeParticle Name:
um
Tel := +[44] (0) 1684-892456 Fax +[44] (0) 1684-892789Malvern, UKMalvern Instruments Ltd.
Serial Number : MAL1022570Mastersizer 2000 Ver. 5.54
30 May 2011 8:14:47 AMRecord Number: 12File name: Vailanganni

Result Analysis Report
Vol. Weighted Mean D[4,3]:
%
m²/g
um
Surface Weighted Mean D[3,2]:0.0815 216.102
d(0.9):
Accessory Name:
Span :1.237
umSpecific Surface Area:
17.70
Operator notes:
Uniformity:%Vol
Obscuration:
205.887 356.973d(0.1): um
0.397
73.609
um102.350 d(0.5):
Volume
Particle Size Distribution
0.01 0.1 1 10 100 1000 3000
Particle Size (µm)
0
2
4
6
8
10
12
14
Vol
ume
(%)
S136 - Average, Wednesday, January 28, 2009 9:48:38 PM
Hydro 2000G (A)
Result units:
um
Concentration:0.1911
Weighted Residual:0.570 %
Size (µm)0.010
0.011
0.013
0.015
0.017
0.020
0.023
0.026
0.030
0.035
0.040
0.046
0.052
0.060
0.069
0.079
0.091
0.105
Volume In %
0.00
0.00
0.00
0.00
0.00
0.00
0.00
0.00
0.00
0.00
0.00
0.00
0.00
0.00
0.00
0.00
0.00
Size (µm)0.105
0.120
0.138
0.158
0.182
0.209
0.240
0.275
0.316
0.363
0.417
0.479
0.550
0.631
0.724
0.832
0.955
1.096
Volume In %
0.00
0.00
0.00
0.00
0.00
0.00
0.00
0.00
0.00
0.00
0.00
0.00
0.00
0.00
0.00
0.00
0.00
Size (µm)1.096
1.259
1.445
1.660
1.905
2.188
2.512
2.884
3.311
3.802
4.365
5.012
5.754
6.607
7.586
8.710
10.000
11.482
Volume In %
0.00
0.01
0.07
0.08
0.10
0.12
0.15
0.18
0.21
0.23
0.26
0.28
0.29
0.29
0.29
0.29
0.30
Size (µm)11.482
13.183
15.136
17.378
19.953
22.909
26.303
30.200
34.674
39.811
45.709
52.481
60.256
69.183
79.433
91.201
104.713
120.226
Volume In %
0.32
0.35
0.39
0.44
0.48
0.50
0.46
0.38
0.22
0.03
0.00
0.00
0.02
0.34
1.10
2.36
4.14
Size (µm)120.226
138.038
158.489
181.970
208.930
239.883
275.423
316.228
363.078
416.869
478.630
549.541
630.957
724.436
831.764
954.993
1096.478
1258.925
Volume In %
6.26
8.47
10.34
11.54
11.78
11.01
9.43
7.30
5.08
3.02
1.07
0.04
0.00
0.00
0.00
0.00
0.00
Size (µm)1258.925
1445.440
1659.587
1905.461
2187.762
2511.886
2884.032
3311.311
3801.894
4365.158
5011.872
5754.399
6606.934
7585.776
8709.636
10000.000
Volume In %
0.00
0.00
0.00
0.00
0.00
0.00
0.00
0.00
0.00
0.00
0.00
0.00
0.00
0.00
0.00
Wednesday, January 28, 2009 9:48:38 PM
AveragedPit1
Measured by:JohnstonP
Sample bulk lot ref:
Vailanganni
Sample Name:
Analysed:
Measured:
Sample Source & type:Wednesday, January 28, 2009 9:48:39 PM
S136 - AverageSOP Name:
Result Source:
Sensitivity:
Dispersant Name:Water Off
Size range:
Default
Particle RI:
1.330Result Emulation:
Absorption:0.020 to0.1
NormalAnalysis model:
2000.000
Dispersant RI:
1.520
General purposeParticle Name:
um
Tel := +[44] (0) 1684-892456 Fax +[44] (0) 1684-892789Malvern, UKMalvern Instruments Ltd.
Serial Number : MAL1022570Mastersizer 2000 Ver. 5.54
30 May 2011 8:15:15 AMRecord Number: 29File name: Vailanganni

Result Analysis Report
Vol. Weighted Mean D[4,3]:
%
m²/g
um
Surface Weighted Mean D[3,2]:0.0636 235.449
d(0.9):
Accessory Name:
Span :1.177
umSpecific Surface Area:
17.72
Operator notes:
Uniformity:%Vol
Obscuration:
222.159 381.167d(0.1): um
0.372
94.363
um119.642 d(0.5):
Volume
Particle Size Distribution
0.01 0.1 1 10 100 1000 3000
Particle Size (µm)
0
2
4
6
8
10
12
14
Vol
ume
(%)
S137 - Average, Wednesday, January 28, 2009 9:56:27 PM
Hydro 2000G (A)
Result units:
um
Concentration:0.2462
Weighted Residual:0.613 %
Size (µm)0.010
0.011
0.013
0.015
0.017
0.020
0.023
0.026
0.030
0.035
0.040
0.046
0.052
0.060
0.069
0.079
0.091
0.105
Volume In %
0.00
0.00
0.00
0.00
0.00
0.00
0.00
0.00
0.00
0.00
0.00
0.00
0.00
0.00
0.00
0.00
0.00
Size (µm)0.105
0.120
0.138
0.158
0.182
0.209
0.240
0.275
0.316
0.363
0.417
0.479
0.550
0.631
0.724
0.832
0.955
1.096
Volume In %
0.00
0.00
0.00
0.00
0.00
0.00
0.00
0.00
0.00
0.00
0.00
0.00
0.00
0.00
0.00
0.00
0.00
Size (µm)1.096
1.259
1.445
1.660
1.905
2.188
2.512
2.884
3.311
3.802
4.365
5.012
5.754
6.607
7.586
8.710
10.000
11.482
Volume In %
0.00
0.00
0.01
0.08
0.09
0.11
0.13
0.15
0.17
0.18
0.19
0.20
0.19
0.18
0.17
0.15
0.14
Size (µm)11.482
13.183
15.136
17.378
19.953
22.909
26.303
30.200
34.674
39.811
45.709
52.481
60.256
69.183
79.433
91.201
104.713
120.226
Volume In %
0.14
0.15
0.18
0.22
0.26
0.29
0.29
0.24
0.13
0.00
0.00
0.00
0.00
0.15
0.74
1.81
3.43
Size (µm)120.226
138.038
158.489
181.970
208.930
239.883
275.423
316.228
363.078
416.869
478.630
549.541
630.957
724.436
831.764
954.993
1096.478
1258.925
Volume In %
5.47
7.75
9.84
11.42
12.11
11.79
10.50
8.50
6.20
3.96
1.96
0.32
0.00
0.00
0.00
0.00
0.00
Size (µm)1258.925
1445.440
1659.587
1905.461
2187.762
2511.886
2884.032
3311.311
3801.894
4365.158
5011.872
5754.399
6606.934
7585.776
8709.636
10000.000
Volume In %
0.00
0.00
0.00
0.00
0.00
0.00
0.00
0.00
0.00
0.00
0.00
0.00
0.00
0.00
0.00
Wednesday, January 28, 2009 9:56:27 PM
AveragedPit1
Measured by:JohnstonP
Sample bulk lot ref:
Vailanganni
Sample Name:
Analysed:
Measured:
Sample Source & type:Wednesday, January 28, 2009 9:56:28 PM
S137 - AverageSOP Name:
Result Source:
Sensitivity:
Dispersant Name:Water Off
Size range:
Default
Particle RI:
1.330Result Emulation:
Absorption:0.020 to0.1
NormalAnalysis model:
2000.000
Dispersant RI:
1.520
General purposeParticle Name:
um
Tel := +[44] (0) 1684-892456 Fax +[44] (0) 1684-892789Malvern, UKMalvern Instruments Ltd.
Serial Number : MAL1022570Mastersizer 2000 Ver. 5.54
30 May 2011 8:17:00 AMRecord Number: 33File name: Vailanganni

Result Analysis Report
Vol. Weighted Mean D[4,3]:
%
m²/g
um
Surface Weighted Mean D[3,2]:0.0564 234.277
d(0.9):
Accessory Name:
Span :1.176
umSpecific Surface Area:
18.28
Operator notes:
Uniformity:%Vol
Obscuration:
221.318 379.241d(0.1): um
0.372
106.454
um118.934 d(0.5):
Volume
Particle Size Distribution
0.01 0.1 1 10 100 1000 3000
Particle Size (µm)
0
2
4
6
8
10
12
14
Vol
ume
(%)
S138 - Average, Thursday, July 09, 2009 2:26:57 PM
Hydro 2000G (A)
Result units:
um
Concentration:0.2925
Weighted Residual:0.704 %
Size (µm)0.010
0.011
0.013
0.015
0.017
0.020
0.023
0.026
0.030
0.035
0.040
0.046
0.052
0.060
0.069
0.079
0.091
0.105
Volume In %
0.00
0.00
0.00
0.00
0.00
0.00
0.00
0.00
0.00
0.00
0.00
0.00
0.00
0.00
0.00
0.00
0.00
Size (µm)0.105
0.120
0.138
0.158
0.182
0.209
0.240
0.275
0.316
0.363
0.417
0.479
0.550
0.631
0.724
0.832
0.955
1.096
Volume In %
0.00
0.00
0.00
0.00
0.00
0.00
0.00
0.00
0.00
0.00
0.00
0.00
0.00
0.00
0.00
0.00
0.00
Size (µm)1.096
1.259
1.445
1.660
1.905
2.188
2.512
2.884
3.311
3.802
4.365
5.012
5.754
6.607
7.586
8.710
10.000
11.482
Volume In %
0.00
0.00
0.00
0.00
0.00
0.07
0.10
0.12
0.13
0.15
0.17
0.18
0.18
0.18
0.17
0.17
0.17
Size (µm)11.482
13.183
15.136
17.378
19.953
22.909
26.303
30.200
34.674
39.811
45.709
52.481
60.256
69.183
79.433
91.201
104.713
120.226
Volume In %
0.18
0.21
0.25
0.30
0.35
0.38
0.37
0.31
0.19
0.05
0.00
0.00
0.00
0.13
0.69
1.77
3.40
Size (µm)120.226
138.038
158.489
181.970
208.930
239.883
275.423
316.228
363.078
416.869
478.630
549.541
630.957
724.436
831.764
954.993
1096.478
1258.925
Volume In %
5.47
7.77
9.89
11.48
12.16
11.79
10.47
8.44
6.12
3.88
1.89
0.30
0.00
0.00
0.00
0.00
0.00
Size (µm)1258.925
1445.440
1659.587
1905.461
2187.762
2511.886
2884.032
3311.311
3801.894
4365.158
5011.872
5754.399
6606.934
7585.776
8709.636
10000.000
Volume In %
0.00
0.00
0.00
0.00
0.00
0.00
0.00
0.00
0.00
0.00
0.00
0.00
0.00
0.00
0.00
Thursday, July 09, 2009 2:26:57 PM
Averaged
Measured by:JohnstonP
Sample bulk lot ref:
Vailanganni
Sample Name:
Analysed:
Measured:
Sample Source & type:Thursday, July 09, 2009 2:26:59 PM
S138 - AverageSOP Name:
Result Source:
Sensitivity:
Dispersant Name:Water Off
Size range:
Default
Particle RI:
1.330Result Emulation:
Absorption:0.020 to0.1
NormalAnalysis model:
2000.000
Dispersant RI:
1.520
General purposeParticle Name:
um
Tel := +[44] (0) 1684-892456 Fax +[44] (0) 1684-892789Malvern, UKMalvern Instruments Ltd.
Serial Number : MAL1022570Mastersizer 2000 Ver. 5.54
30 May 2011 8:17:30 AMRecord Number: 57File name: Vailanganni

Result Analysis Report
Vol. Weighted Mean D[4,3]:
%
m²/g
um
Surface Weighted Mean D[3,2]:0.275 226.891
d(0.9):
Accessory Name:
Span :1.824
umSpecific Surface Area:
18.29
Operator notes:
Uniformity:%Vol
Obscuration:
217.540 409.680d(0.1): um
0.493
21.802
um12.958 d(0.5):
Volume
Particle Size Distribution
0.01 0.1 1 10 100 1000 3000
Particle Size (µm)
0
2
4
6
8
10
12
Vol
ume
(%)
S139 - Average, Wednesday, January 28, 2009 9:21:24 PM
Hydro 2000G (A)
Result units:
um
Concentration:0.0659
Weighted Residual:0.609 %
Size (µm)0.010
0.011
0.013
0.015
0.017
0.020
0.023
0.026
0.030
0.035
0.040
0.046
0.052
0.060
0.069
0.079
0.091
0.105
Volume In %
0.00
0.00
0.00
0.00
0.00
0.00
0.00
0.00
0.00
0.00
0.00
0.00
0.00
0.00
0.00
0.00
0.00
Size (µm)0.105
0.120
0.138
0.158
0.182
0.209
0.240
0.275
0.316
0.363
0.417
0.479
0.550
0.631
0.724
0.832
0.955
1.096
Volume In %
0.00
0.00
0.00
0.00
0.00
0.00
0.00
0.00
0.00
0.00
0.07
0.11
0.14
0.17
0.19
0.21
0.22
Size (µm)1.096
1.259
1.445
1.660
1.905
2.188
2.512
2.884
3.311
3.802
4.365
5.012
5.754
6.607
7.586
8.710
10.000
11.482
Volume In %
0.24
0.26
0.29
0.32
0.37
0.41
0.46
0.51
0.56
0.59
0.62
0.64
0.65
0.64
0.63
0.61
0.58
Size (µm)11.482
13.183
15.136
17.378
19.953
22.909
26.303
30.200
34.674
39.811
45.709
52.481
60.256
69.183
79.433
91.201
104.713
120.226
Volume In %
0.56
0.54
0.54
0.53
0.53
0.51
0.46
0.38
0.26
0.11
0.00
0.00
0.00
0.16
0.66
1.52
2.81
Size (µm)120.226
138.038
158.489
181.970
208.930
239.883
275.423
316.228
363.078
416.869
478.630
549.541
630.957
724.436
831.764
954.993
1096.478
1258.925
Volume In %
4.44
6.27
7.99
9.35
10.07
10.04
9.28
7.93
6.27
4.54
2.95
1.52
0.31
0.00
0.00
0.00
0.00
Size (µm)1258.925
1445.440
1659.587
1905.461
2187.762
2511.886
2884.032
3311.311
3801.894
4365.158
5011.872
5754.399
6606.934
7585.776
8709.636
10000.000
Volume In %
0.00
0.00
0.00
0.00
0.00
0.00
0.00
0.00
0.00
0.00
0.00
0.00
0.00
0.00
0.00
Wednesday, January 28, 2009 9:21:24 PM
AveragedPit1
Measured by:JohnstonP
Sample bulk lot ref:
Vailanganni
Sample Name:
Analysed:
Measured:
Sample Source & type:Wednesday, January 28, 2009 9:21:25 PM
S139 - AverageSOP Name:
Result Source:
Sensitivity:
Dispersant Name:Water Off
Size range:
Default
Particle RI:
1.330Result Emulation:
Absorption:0.020 to0.1
NormalAnalysis model:
2000.000
Dispersant RI:
1.520
General purposeParticle Name:
um
Tel := +[44] (0) 1684-892456 Fax +[44] (0) 1684-892789Malvern, UKMalvern Instruments Ltd.
Serial Number : MAL1022570Mastersizer 2000 Ver. 5.54
30 May 2011 8:15:02 AMRecord Number: 25File name: Vailanganni

Result Analysis Report
Vol. Weighted Mean D[4,3]:
%
m²/g
um
Surface Weighted Mean D[3,2]:0.0335 239.705
d(0.9):
Accessory Name:
Span :1.397
umSpecific Surface Area:
19.76
Operator notes:
Uniformity:%Vol
Obscuration:
213.873 409.131d(0.1): um
0.434
179.071
um110.429 d(0.5):
Volume
Particle Size Distribution
0.01 0.1 1 10 100 1000 3000
Particle Size (µm)
0
2
4
6
8
10
12
Vol
ume
(%)
S140 - Average, Wednesday, January 28, 2009 10:04:34 PM
Hydro 2000G (A)
Result units:
um
Concentration:0.5573
Weighted Residual:0.611 %
Size (µm)0.010
0.011
0.013
0.015
0.017
0.020
0.023
0.026
0.030
0.035
0.040
0.046
0.052
0.060
0.069
0.079
0.091
0.105
Volume In %
0.00
0.00
0.00
0.00
0.00
0.00
0.00
0.00
0.00
0.00
0.00
0.00
0.00
0.00
0.00
0.00
0.00
Size (µm)0.105
0.120
0.138
0.158
0.182
0.209
0.240
0.275
0.316
0.363
0.417
0.479
0.550
0.631
0.724
0.832
0.955
1.096
Volume In %
0.00
0.00
0.00
0.00
0.00
0.00
0.00
0.00
0.00
0.00
0.00
0.00
0.00
0.00
0.00
0.00
0.00
Size (µm)1.096
1.259
1.445
1.660
1.905
2.188
2.512
2.884
3.311
3.802
4.365
5.012
5.754
6.607
7.586
8.710
10.000
11.482
Volume In %
0.00
0.00
0.00
0.00
0.00
0.00
0.00
0.00
0.00
0.00
0.00
0.00
0.00
0.00
0.00
0.00
0.00
Size (µm)11.482
13.183
15.136
17.378
19.953
22.909
26.303
30.200
34.674
39.811
45.709
52.481
60.256
69.183
79.433
91.201
104.713
120.226
Volume In %
0.00
0.04
0.09
0.13
0.17
0.18
0.16
0.08
0.00
0.00
0.00
0.09
0.47
1.15
2.17
3.51
5.10
Size (µm)120.226
138.038
158.489
181.970
208.930
239.883
275.423
316.228
363.078
416.869
478.630
549.541
630.957
724.436
831.764
954.993
1096.478
1258.925
Volume In %
6.75
8.32
9.54
10.28
10.41
9.91
8.87
7.44
5.83
4.23
2.77
1.72
0.58
0.00
0.00
0.00
0.00
Size (µm)1258.925
1445.440
1659.587
1905.461
2187.762
2511.886
2884.032
3311.311
3801.894
4365.158
5011.872
5754.399
6606.934
7585.776
8709.636
10000.000
Volume In %
0.00
0.00
0.00
0.00
0.00
0.00
0.00
0.00
0.00
0.00
0.00
0.00
0.00
0.00
0.00
Wednesday, January 28, 2009 10:04:34 PM
AveragedPit1
Measured by:JohnstonP
Sample bulk lot ref:
Vailanganni
Sample Name:
Analysed:
Measured:
Sample Source & type:Wednesday, January 28, 2009 10:04:35 PM
S140 - AverageSOP Name:
Result Source:
Sensitivity:
Dispersant Name:Water Off
Size range:
Default
Particle RI:
1.330Result Emulation:
Absorption:0.020 to0.1
NormalAnalysis model:
2000.000
Dispersant RI:
1.520
General purposeParticle Name:
um
Tel := +[44] (0) 1684-892456 Fax +[44] (0) 1684-892789Malvern, UKMalvern Instruments Ltd.
Serial Number : MAL1022570Mastersizer 2000 Ver. 5.54
30 May 2011 8:18:02 AMRecord Number: 37File name: Vailanganni

Result Analysis Report
Vol. Weighted Mean D[4,3]:
%
m²/g
um
Surface Weighted Mean D[3,2]:0.0421 220.809
d(0.9):
Accessory Name:
Span :1.126
umSpecific Surface Area:
16.38
Operator notes:
Uniformity:%Vol
Obscuration:
207.912 350.623d(0.1): um
0.355
142.493
um116.595 d(0.5):
Volume
Particle Size Distribution
0.01 0.1 1 10 100 1000 3000
Particle Size (µm)
0
2
4
6
8
10
12
14
Vol
ume
(%)
S141 - Average, Wednesday, January 28, 2009 10:15:29 PM
Hydro 2000G (A)
Result units:
um
Concentration:0.3615
Weighted Residual:0.627 %
Size (µm)0.010
0.011
0.013
0.015
0.017
0.020
0.023
0.026
0.030
0.035
0.040
0.046
0.052
0.060
0.069
0.079
0.091
0.105
Volume In %
0.00
0.00
0.00
0.00
0.00
0.00
0.00
0.00
0.00
0.00
0.00
0.00
0.00
0.00
0.00
0.00
0.00
Size (µm)0.105
0.120
0.138
0.158
0.182
0.209
0.240
0.275
0.316
0.363
0.417
0.479
0.550
0.631
0.724
0.832
0.955
1.096
Volume In %
0.00
0.00
0.00
0.00
0.00
0.00
0.00
0.00
0.00
0.00
0.00
0.00
0.00
0.00
0.00
0.00
0.00
Size (µm)1.096
1.259
1.445
1.660
1.905
2.188
2.512
2.884
3.311
3.802
4.365
5.012
5.754
6.607
7.586
8.710
10.000
11.482
Volume In %
0.00
0.00
0.00
0.00
0.00
0.00
0.00
0.04
0.06
0.07
0.07
0.07
0.07
0.06
0.05
0.04
0.04
Size (µm)11.482
13.183
15.136
17.378
19.953
22.909
26.303
30.200
34.674
39.811
45.709
52.481
60.256
69.183
79.433
91.201
104.713
120.226
Volume In %
0.07
0.11
0.16
0.23
0.28
0.32
0.30
0.24
0.12
0.00
0.00
0.00
0.04
0.40
1.23
2.58
4.50
Size (µm)120.226
138.038
158.489
181.970
208.930
239.883
275.423
316.228
363.078
416.869
478.630
549.541
630.957
724.436
831.764
954.993
1096.478
1258.925
Volume In %
6.76
9.11
11.08
12.30
12.48
11.56
9.75
7.40
4.96
2.85
0.57
0.00
0.00
0.00
0.00
0.00
0.00
Size (µm)1258.925
1445.440
1659.587
1905.461
2187.762
2511.886
2884.032
3311.311
3801.894
4365.158
5011.872
5754.399
6606.934
7585.776
8709.636
10000.000
Volume In %
0.00
0.00
0.00
0.00
0.00
0.00
0.00
0.00
0.00
0.00
0.00
0.00
0.00
0.00
0.00
Wednesday, January 28, 2009 10:15:29 PM
AveragedPit1
Measured by:JohnstonP
Sample bulk lot ref:
Vailanganni
Sample Name:
Analysed:
Measured:
Sample Source & type:Wednesday, January 28, 2009 10:15:30 PM
S141 - AverageSOP Name:
Result Source:
Sensitivity:
Dispersant Name:Water Off
Size range:
Default
Particle RI:
1.330Result Emulation:
Absorption:0.020 to0.1
NormalAnalysis model:
2000.000
Dispersant RI:
1.520
General purposeParticle Name:
um
Tel := +[44] (0) 1684-892456 Fax +[44] (0) 1684-892789Malvern, UKMalvern Instruments Ltd.
Serial Number : MAL1022570Mastersizer 2000 Ver. 5.54
30 May 2011 8:18:13 AMRecord Number: 41File name: Vailanganni

Result Analysis Report
Vol. Weighted Mean D[4,3]:
%
m²/g
um
Surface Weighted Mean D[3,2]:0.0897 194.883
d(0.9):
Accessory Name:
Span :1.566
umSpecific Surface Area:
20.35
Operator notes:
Uniformity:%Vol
Obscuration:
177.551 348.618
NOTE: Pits 1,2 and 3 are all in this one document. (140-141 = pit2) (142+ = pit3)
d(0.1): um
0.489
66.890
um70.613 d(0.5):
Volume
Particle Size Distribution
0.01 0.1 1 10 100 1000 3000
Particle Size (µm)
0 1 2 3 4 5 6 7 8 9
10 11
Vol
ume
(%)
S142 - Average, Wednesday, January 28, 2009 10:24:44 PM
Hydro 2000G (A)
Result units:
um
Concentration:0.2035
Weighted Residual:0.467 %
Size (µm)0.010
0.011
0.013
0.015
0.017
0.020
0.023
0.026
0.030
0.035
0.040
0.046
0.052
0.060
0.069
0.079
0.091
0.105
Volume In %
0.00
0.00
0.00
0.00
0.00
0.00
0.00
0.00
0.00
0.00
0.00
0.00
0.00
0.00
0.00
0.00
0.00
Size (µm)0.105
0.120
0.138
0.158
0.182
0.209
0.240
0.275
0.316
0.363
0.417
0.479
0.550
0.631
0.724
0.832
0.955
1.096
Volume In %
0.00
0.00
0.00
0.00
0.00
0.00
0.00
0.00
0.00
0.00
0.00
0.00
0.00
0.00
0.00
0.00
0.00
Size (µm)1.096
1.259
1.445
1.660
1.905
2.188
2.512
2.884
3.311
3.802
4.365
5.012
5.754
6.607
7.586
8.710
10.000
11.482
Volume In %
0.00
0.01
0.07
0.08
0.10
0.12
0.15
0.18
0.21
0.24
0.26
0.27
0.29
0.30
0.31
0.32
0.35
Size (µm)11.482
13.183
15.136
17.378
19.953
22.909
26.303
30.200
34.674
39.811
45.709
52.481
60.256
69.183
79.433
91.201
104.713
120.226
Volume In %
0.38
0.43
0.47
0.51
0.53
0.51
0.46
0.38
0.30
0.28
0.37
0.66
1.22
2.09
3.25
4.65
6.16
Size (µm)120.226
138.038
158.489
181.970
208.930
239.883
275.423
316.228
363.078
416.869
478.630
549.541
630.957
724.436
831.764
954.993
1096.478
1258.925
Volume In %
7.58
8.76
9.49
9.67
9.26
8.32
7.01
5.47
3.97
2.56
1.62
0.40
0.00
0.00
0.00
0.00
0.00
Size (µm)1258.925
1445.440
1659.587
1905.461
2187.762
2511.886
2884.032
3311.311
3801.894
4365.158
5011.872
5754.399
6606.934
7585.776
8709.636
10000.000
Volume In %
0.00
0.00
0.00
0.00
0.00
0.00
0.00
0.00
0.00
0.00
0.00
0.00
0.00
0.00
0.00
Wednesday, January 28, 2009 10:24:44 PM
AveragedPit1
Measured by:JohnstonP
Sample bulk lot ref:
Vailanganni
Sample Name:
Analysed:
Measured:
Sample Source & type:Wednesday, January 28, 2009 10:24:46 PM
S142 - AverageSOP Name:
Result Source:
Sensitivity:
Dispersant Name:Water Off
Size range:
Default
Particle RI:
1.330Result Emulation:
Absorption:0.020 to0.1
NormalAnalysis model:
2000.000
Dispersant RI:
1.520
General purposeParticle Name:
um
Tel := +[44] (0) 1684-892456 Fax +[44] (0) 1684-892789Malvern, UKMalvern Instruments Ltd.
Serial Number : MAL1022570Mastersizer 2000 Ver. 5.54
30 May 2011 8:18:24 AMRecord Number: 45File name: Vailanganni

Result Analysis Report
Vol. Weighted Mean D[4,3]:
%
m²/g
um
Surface Weighted Mean D[3,2]:0.0644 217.158
d(0.9):
Accessory Name:
Span :1.153
umSpecific Surface Area:
19.44
Operator notes:
Uniformity:%Vol
Obscuration:
205.703 349.255
NOTE: Pits 1,2 and 3 are all in this one document. (140-141 = pit2) (142+ = pit3)
d(0.1): um
0.369
93.109
um112.090 d(0.5):
Volume
Particle Size Distribution
0.01 0.1 1 10 100 1000 3000
Particle Size (µm)
0
2
4
6
8
10
12
14
Vol
ume
(%)
S143 - Average, Wednesday, January 28, 2009 10:37:31 PM
Hydro 2000G (A)
Result units:
um
Concentration:0.2707
Weighted Residual:0.527 %
Size (µm)0.010
0.011
0.013
0.015
0.017
0.020
0.023
0.026
0.030
0.035
0.040
0.046
0.052
0.060
0.069
0.079
0.091
0.105
Volume In %
0.00
0.00
0.00
0.00
0.00
0.00
0.00
0.00
0.00
0.00
0.00
0.00
0.00
0.00
0.00
0.00
0.00
Size (µm)0.105
0.120
0.138
0.158
0.182
0.209
0.240
0.275
0.316
0.363
0.417
0.479
0.550
0.631
0.724
0.832
0.955
1.096
Volume In %
0.00
0.00
0.00
0.00
0.00
0.00
0.00
0.00
0.00
0.00
0.00
0.00
0.00
0.00
0.00
0.00
0.00
Size (µm)1.096
1.259
1.445
1.660
1.905
2.188
2.512
2.884
3.311
3.802
4.365
5.012
5.754
6.607
7.586
8.710
10.000
11.482
Volume In %
0.00
0.00
0.00
0.06
0.09
0.10
0.12
0.14
0.16
0.18
0.19
0.19
0.18
0.17
0.16
0.15
0.14
Size (µm)11.482
13.183
15.136
17.378
19.953
22.909
26.303
30.200
34.674
39.811
45.709
52.481
60.256
69.183
79.433
91.201
104.713
120.226
Volume In %
0.15
0.17
0.21
0.26
0.30
0.32
0.30
0.21
0.09
0.00
0.00
0.00
0.00
0.33
1.16
2.53
4.46
Size (µm)120.226
138.038
158.489
181.970
208.930
239.883
275.423
316.228
363.078
416.869
478.630
549.541
630.957
724.436
831.764
954.993
1096.478
1258.925
Volume In %
6.72
9.04
10.97
12.14
12.27
11.34
9.54
7.24
4.86
2.80
0.56
0.00
0.00
0.00
0.00
0.00
0.00
Size (µm)1258.925
1445.440
1659.587
1905.461
2187.762
2511.886
2884.032
3311.311
3801.894
4365.158
5011.872
5754.399
6606.934
7585.776
8709.636
10000.000
Volume In %
0.00
0.00
0.00
0.00
0.00
0.00
0.00
0.00
0.00
0.00
0.00
0.00
0.00
0.00
0.00
Wednesday, January 28, 2009 10:37:31 PM
AveragedPit1
Measured by:JohnstonP
Sample bulk lot ref:
Vailanganni
Sample Name:
Analysed:
Measured:
Sample Source & type:Wednesday, January 28, 2009 10:37:32 PM
S143 - AverageSOP Name:
Result Source:
Sensitivity:
Dispersant Name:Water Off
Size range:
Default
Particle RI:
1.330Result Emulation:
Absorption:0.020 to0.1
NormalAnalysis model:
2000.000
Dispersant RI:
1.520
General purposeParticle Name:
um
Tel := +[44] (0) 1684-892456 Fax +[44] (0) 1684-892789Malvern, UKMalvern Instruments Ltd.
Serial Number : MAL1022570Mastersizer 2000 Ver. 5.54
30 May 2011 8:18:35 AMRecord Number: 49File name: Vailanganni

Result Analysis Report
Vol. Weighted Mean D[4,3]:
%
m²/g
um
Surface Weighted Mean D[3,2]:0.0278 252.132
d(0.9):
Accessory Name:
Span :1.094
umSpecific Surface Area:
19.97
Operator notes:
Uniformity:%Vol
Obscuration:
234.208 394.212
NOTE: Pits 1,2 and 3 are all in this one document. (140-141 = pit2) (142+ = pit3)
d(0.1): um
0.339
215.783
um137.984 d(0.5):
Volume
Particle Size Distribution
0.01 0.1 1 10 100 1000 3000
Particle Size (µm)
0
2
4
6
8
10
12
14
Vol
ume
(%)
S144 - Average, Wednesday, January 28, 2009 10:45:35 PM
Hydro 2000G (A)
Result units:
um
Concentration:0.6823
Weighted Residual:0.715 %
Size (µm)0.010
0.011
0.013
0.015
0.017
0.020
0.023
0.026
0.030
0.035
0.040
0.046
0.052
0.060
0.069
0.079
0.091
0.105
Volume In %
0.00
0.00
0.00
0.00
0.00
0.00
0.00
0.00
0.00
0.00
0.00
0.00
0.00
0.00
0.00
0.00
0.00
Size (µm)0.105
0.120
0.138
0.158
0.182
0.209
0.240
0.275
0.316
0.363
0.417
0.479
0.550
0.631
0.724
0.832
0.955
1.096
Volume In %
0.00
0.00
0.00
0.00
0.00
0.00
0.00
0.00
0.00
0.00
0.00
0.00
0.00
0.00
0.00
0.00
0.00
Size (µm)1.096
1.259
1.445
1.660
1.905
2.188
2.512
2.884
3.311
3.802
4.365
5.012
5.754
6.607
7.586
8.710
10.000
11.482
Volume In %
0.00
0.00
0.00
0.00
0.00
0.00
0.00
0.00
0.00
0.00
0.00
0.00
0.00
0.00
0.00
0.00
0.00
Size (µm)11.482
13.183
15.136
17.378
19.953
22.909
26.303
30.200
34.674
39.811
45.709
52.481
60.256
69.183
79.433
91.201
104.713
120.226
Volume In %
0.00
0.00
0.00
0.00
0.00
0.00
0.00
0.00
0.00
0.00
0.00
0.00
0.00
0.03
0.38
1.44
3.02
Size (µm)120.226
138.038
158.489
181.970
208.930
239.883
275.423
316.228
363.078
416.869
478.630
549.541
630.957
724.436
831.764
954.993
1096.478
1258.925
Volume In %
5.15
7.61
9.97
11.84
12.79
12.63
11.39
9.33
6.91
4.52
2.49
0.49
0.00
0.00
0.00
0.00
0.00
Size (µm)1258.925
1445.440
1659.587
1905.461
2187.762
2511.886
2884.032
3311.311
3801.894
4365.158
5011.872
5754.399
6606.934
7585.776
8709.636
10000.000
Volume In %
0.00
0.00
0.00
0.00
0.00
0.00
0.00
0.00
0.00
0.00
0.00
0.00
0.00
0.00
0.00
Wednesday, January 28, 2009 10:45:35 PM
AveragedPit1
Measured by:JohnstonP
Sample bulk lot ref:
Vailanganni
Sample Name:
Analysed:
Measured:
Sample Source & type:Wednesday, January 28, 2009 10:45:36 PM
S144 - AverageSOP Name:
Result Source:
Sensitivity:
Dispersant Name:Water Off
Size range:
Default
Particle RI:
1.330Result Emulation:
Absorption:0.020 to0.1
NormalAnalysis model:
2000.000
Dispersant RI:
1.520
General purposeParticle Name:
um
Tel := +[44] (0) 1684-892456 Fax +[44] (0) 1684-892789Malvern, UKMalvern Instruments Ltd.
Serial Number : MAL1022570Mastersizer 2000 Ver. 5.54
30 May 2011 8:18:47 AMRecord Number: 53File name: Vailanganni

Result Analysis Report
Vol. Weighted Mean D[4,3]:
%
m²/g
um
Surface Weighted Mean D[3,2]:0.0289 239.991
d(0.9):
Accessory Name:
Span :1.049
umSpecific Surface Area:
22.27
Operator notes:
Uniformity:%Vol
Obscuration:
224.307 369.878d(0.1): um
0.321
207.682
um134.500 d(0.5):
Volume
Particle Size Distribution
0.01 0.1 1 10 100 1000 3000
Particle Size (µm)
0
2
4
6
8
10
12
14
16
Vol
ume
(%)
S145 - Average, Tuesday, October 21, 2008 10:12:35 PM
Hydro 2000G (A)
Result units:
um
Concentration:0.7424
Weighted Residual:0.499 %
Size (µm)0.010
0.011
0.013
0.015
0.017
0.020
0.023
0.026
0.030
0.035
0.040
0.046
0.052
0.060
0.069
0.079
0.091
0.105
Volume In %
0.00
0.00
0.00
0.00
0.00
0.00
0.00
0.00
0.00
0.00
0.00
0.00
0.00
0.00
0.00
0.00
0.00
Size (µm)0.105
0.120
0.138
0.158
0.182
0.209
0.240
0.275
0.316
0.363
0.417
0.479
0.550
0.631
0.724
0.832
0.955
1.096
Volume In %
0.00
0.00
0.00
0.00
0.00
0.00
0.00
0.00
0.00
0.00
0.00
0.00
0.00
0.00
0.00
0.00
0.00
Size (µm)1.096
1.259
1.445
1.660
1.905
2.188
2.512
2.884
3.311
3.802
4.365
5.012
5.754
6.607
7.586
8.710
10.000
11.482
Volume In %
0.00
0.00
0.00
0.00
0.00
0.00
0.00
0.00
0.00
0.00
0.00
0.00
0.00
0.00
0.00
0.00
0.00
Size (µm)11.482
13.183
15.136
17.378
19.953
22.909
26.303
30.200
34.674
39.811
45.709
52.481
60.256
69.183
79.433
91.201
104.713
120.226
Volume In %
0.00
0.00
0.00
0.00
0.00
0.00
0.00
0.00
0.00
0.00
0.00
0.00
0.00
0.03
0.43
1.64
3.42
Size (µm)120.226
138.038
158.489
181.970
208.930
239.883
275.423
316.228
363.078
416.869
478.630
549.541
630.957
724.436
831.764
954.993
1096.478
1258.925
Volume In %
5.78
8.42
10.84
12.62
13.31
12.75
11.10
8.69
6.06
3.60
1.27
0.05
0.00
0.00
0.00
0.00
0.00
Size (µm)1258.925
1445.440
1659.587
1905.461
2187.762
2511.886
2884.032
3311.311
3801.894
4365.158
5011.872
5754.399
6606.934
7585.776
8709.636
10000.000
Volume In %
0.00
0.00
0.00
0.00
0.00
0.00
0.00
0.00
0.00
0.00
0.00
0.00
0.00
0.00
0.00
Tuesday, October 21, 2008 10:12:35 PM
AveragedPit1
Measured by:student
Sample bulk lot ref:
Kallar
Sample Name:
Analysed:
Measured:
Sample Source & type:Tuesday, October 21, 2008 10:12:36 PM
S145 - AverageSOP Name:
Result Source:
Sensitivity:
Dispersant Name:Water Off
Size range:
Default
Particle RI:
1.330Result Emulation:
Absorption:0.020 to0.1
NormalAnalysis model:
2000.000
Dispersant RI:
1.520
General purposeParticle Name:
um
Tel := +[44] (0) 1684-892456 Fax +[44] (0) 1684-892789Malvern, UKMalvern Instruments Ltd.
Serial Number : MAL1022570Mastersizer 2000 Ver. 5.54
30 May 2011 7:58:17 AMRecord Number: 6File name: Kallar Pit1

Result Analysis Report
Vol. Weighted Mean D[4,3]:
%
m²/g
um
Surface Weighted Mean D[3,2]:0.0252 273.240
d(0.9):
Accessory Name:
Span :1.020
umSpecific Surface Area:
19.62
Operator notes:
Uniformity:%Vol
Obscuration:
256.538 417.272d(0.1): um
0.312
238.250
um155.625 d(0.5):
Volume
Particle Size Distribution
0.01 0.1 1 10 100 1000 3000
Particle Size (µm)
0
2
4
6
8
10
12
14
16
Vol
ume
(%)
S146 - Average, Tuesday, October 21, 2008 10:26:09 PM
Hydro 2000G (A)
Result units:
um
Concentration:0.7388
Weighted Residual:0.553 %
Size (µm)0.010
0.011
0.013
0.015
0.017
0.020
0.023
0.026
0.030
0.035
0.040
0.046
0.052
0.060
0.069
0.079
0.091
0.105
Volume In %
0.00
0.00
0.00
0.00
0.00
0.00
0.00
0.00
0.00
0.00
0.00
0.00
0.00
0.00
0.00
0.00
0.00
Size (µm)0.105
0.120
0.138
0.158
0.182
0.209
0.240
0.275
0.316
0.363
0.417
0.479
0.550
0.631
0.724
0.832
0.955
1.096
Volume In %
0.00
0.00
0.00
0.00
0.00
0.00
0.00
0.00
0.00
0.00
0.00
0.00
0.00
0.00
0.00
0.00
0.00
Size (µm)1.096
1.259
1.445
1.660
1.905
2.188
2.512
2.884
3.311
3.802
4.365
5.012
5.754
6.607
7.586
8.710
10.000
11.482
Volume In %
0.00
0.00
0.00
0.00
0.00
0.00
0.00
0.00
0.00
0.00
0.00
0.00
0.00
0.00
0.00
0.00
0.00
Size (µm)11.482
13.183
15.136
17.378
19.953
22.909
26.303
30.200
34.674
39.811
45.709
52.481
60.256
69.183
79.433
91.201
104.713
120.226
Volume In %
0.00
0.00
0.00
0.00
0.00
0.00
0.00
0.00
0.00
0.00
0.00
0.00
0.00
0.00
0.01
0.32
1.53
Size (µm)120.226
138.038
158.489
181.970
208.930
239.883
275.423
316.228
363.078
416.869
478.630
549.541
630.957
724.436
831.764
954.993
1096.478
1258.925
Volume In %
3.30
5.76
8.48
11.07
12.91
13.63
13.03
11.22
8.68
5.85
3.45
0.75
0.00
0.00
0.00
0.00
0.00
Size (µm)1258.925
1445.440
1659.587
1905.461
2187.762
2511.886
2884.032
3311.311
3801.894
4365.158
5011.872
5754.399
6606.934
7585.776
8709.636
10000.000
Volume In %
0.00
0.00
0.00
0.00
0.00
0.00
0.00
0.00
0.00
0.00
0.00
0.00
0.00
0.00
0.00
Tuesday, October 21, 2008 10:26:09 PM
AveragedPit1
Measured by:student
Sample bulk lot ref:
Kallar
Sample Name:
Analysed:
Measured:
Sample Source & type:Tuesday, October 21, 2008 10:26:10 PM
S146 - AverageSOP Name:
Result Source:
Sensitivity:
Dispersant Name:Water Off
Size range:
Default
Particle RI:
1.330Result Emulation:
Absorption:0.020 to0.1
NormalAnalysis model:
2000.000
Dispersant RI:
1.520
General purposeParticle Name:
um
Tel := +[44] (0) 1684-892456 Fax +[44] (0) 1684-892789Malvern, UKMalvern Instruments Ltd.
Serial Number : MAL1022570Mastersizer 2000 Ver. 5.54
30 May 2011 7:58:40 AMRecord Number: 12File name: Kallar Pit1

Result Analysis Report
Vol. Weighted Mean D[4,3]:
%
m²/g
um
Surface Weighted Mean D[3,2]:0.0488 252.140
d(0.9):
Accessory Name:
Span :1.448
umSpecific Surface Area:
20.52
Operator notes:
Uniformity:%Vol
Obscuration:
221.512 435.343d(0.1): um
0.458
122.871
um114.609 d(0.5):
Volume
Particle Size Distribution
0.01 0.1 1 10 100 1000 3000
Particle Size (µm)
0
2
4
6
8
10
12
Vol
ume
(%)
S147 - Average, Wednesday, October 22, 2008 4:13:42 PM
Hydro 2000G (A)
Result units:
um
Concentration:0.3858
Weighted Residual:0.716 %
Size (µm)0.010
0.011
0.013
0.015
0.017
0.020
0.023
0.026
0.030
0.035
0.040
0.046
0.052
0.060
0.069
0.079
0.091
0.105
Volume In %
0.00
0.00
0.00
0.00
0.00
0.00
0.00
0.00
0.00
0.00
0.00
0.00
0.00
0.00
0.00
0.00
0.00
Size (µm)0.105
0.120
0.138
0.158
0.182
0.209
0.240
0.275
0.316
0.363
0.417
0.479
0.550
0.631
0.724
0.832
0.955
1.096
Volume In %
0.00
0.00
0.00
0.00
0.00
0.00
0.00
0.00
0.00
0.00
0.00
0.00
0.00
0.00
0.00
0.00
0.00
Size (µm)1.096
1.259
1.445
1.660
1.905
2.188
2.512
2.884
3.311
3.802
4.365
5.012
5.754
6.607
7.586
8.710
10.000
11.482
Volume In %
0.00
0.00
0.00
0.00
0.00
0.07
0.09
0.10
0.12
0.13
0.13
0.13
0.12
0.11
0.10
0.08
0.08
Size (µm)11.482
13.183
15.136
17.378
19.953
22.909
26.303
30.200
34.674
39.811
45.709
52.481
60.256
69.183
79.433
91.201
104.713
120.226
Volume In %
0.09
0.11
0.14
0.18
0.21
0.21
0.17
0.07
0.00
0.00
0.00
0.00
0.09
0.57
1.47
2.75
4.40
Size (µm)120.226
138.038
158.489
181.970
208.930
239.883
275.423
316.228
363.078
416.869
478.630
549.541
630.957
724.436
831.764
954.993
1096.478
1258.925
Volume In %
6.20
7.96
9.39
10.28
10.48
10.00
8.96
7.52
5.95
4.41
3.07
1.99
1.18
0.61
0.22
0.06
0.00
Size (µm)1258.925
1445.440
1659.587
1905.461
2187.762
2511.886
2884.032
3311.311
3801.894
4365.158
5011.872
5754.399
6606.934
7585.776
8709.636
10000.000
Volume In %
0.00
0.00
0.00
0.00
0.00
0.00
0.00
0.00
0.00
0.00
0.00
0.00
0.00
0.00
0.00
Wednesday, October 22, 2008 4:13:42 PM
AveragedPit1
Measured by:student
Sample bulk lot ref:
Kallar
Sample Name:
Analysed:
Measured:
Sample Source & type:Wednesday, October 22, 2008 4:13:43 PM
S147 - AverageSOP Name:
Result Source:
Sensitivity:
Dispersant Name:Water Off
Size range:
Default
Particle RI:
1.330Result Emulation:
Absorption:0.020 to0.1
NormalAnalysis model:
2000.000
Dispersant RI:
1.520
General purposeParticle Name:
um
Tel := +[44] (0) 1684-892456 Fax +[44] (0) 1684-892789Malvern, UKMalvern Instruments Ltd.
Serial Number : MAL1022570Mastersizer 2000 Ver. 5.54
30 May 2011 7:58:58 AMRecord Number: 18File name: Kallar Pit1

Result Analysis Report
Vol. Weighted Mean D[4,3]:
%
m²/g
um
Surface Weighted Mean D[3,2]:0.0383 201.018
d(0.9):
Accessory Name:
Span :1.090
umSpecific Surface Area:
23.47
Operator notes:
Uniformity:%Vol
Obscuration:
188.520 315.100d(0.1): um
0.339
156.489
um109.573 d(0.5):
Volume
Particle Size Distribution
0.01 0.1 1 10 100 1000 3000
Particle Size (µm)
0
2
4
6
8
10
12
14
Vol
ume
(%)
S148 - Average, Wednesday, October 22, 2008 4:23:01 PM
Hydro 2000G (A)
Result units:
um
Concentration:0.5912
Weighted Residual:0.638 %
Size (µm)0.010
0.011
0.013
0.015
0.017
0.020
0.023
0.026
0.030
0.035
0.040
0.046
0.052
0.060
0.069
0.079
0.091
0.105
Volume In %
0.00
0.00
0.00
0.00
0.00
0.00
0.00
0.00
0.00
0.00
0.00
0.00
0.00
0.00
0.00
0.00
0.00
Size (µm)0.105
0.120
0.138
0.158
0.182
0.209
0.240
0.275
0.316
0.363
0.417
0.479
0.550
0.631
0.724
0.832
0.955
1.096
Volume In %
0.00
0.00
0.00
0.00
0.00
0.00
0.00
0.00
0.00
0.00
0.00
0.00
0.00
0.00
0.00
0.00
0.00
Size (µm)1.096
1.259
1.445
1.660
1.905
2.188
2.512
2.884
3.311
3.802
4.365
5.012
5.754
6.607
7.586
8.710
10.000
11.482
Volume In %
0.00
0.00
0.00
0.00
0.00
0.00
0.00
0.00
0.00
0.00
0.00
0.00
0.00
0.00
0.00
0.00
0.00
Size (µm)11.482
13.183
15.136
17.378
19.953
22.909
26.303
30.200
34.674
39.811
45.709
52.481
60.256
69.183
79.433
91.201
104.713
120.226
Volume In %
0.07
0.13
0.21
0.27
0.31
0.29
0.21
0.08
0.00
0.00
0.00
0.00
0.08
0.71
1.99
3.87
6.25
Size (µm)120.226
138.038
158.489
181.970
208.930
239.883
275.423
316.228
363.078
416.869
478.630
549.541
630.957
724.436
831.764
954.993
1096.478
1258.925
Volume In %
8.75
10.99
12.47
12.89
12.15
10.40
8.05
5.53
3.23
1.03
0.03
0.00
0.00
0.00
0.00
0.00
0.00
Size (µm)1258.925
1445.440
1659.587
1905.461
2187.762
2511.886
2884.032
3311.311
3801.894
4365.158
5011.872
5754.399
6606.934
7585.776
8709.636
10000.000
Volume In %
0.00
0.00
0.00
0.00
0.00
0.00
0.00
0.00
0.00
0.00
0.00
0.00
0.00
0.00
0.00
Wednesday, October 22, 2008 4:23:01 PM
AveragedPit1
Measured by:student
Sample bulk lot ref:
Pushpavanam
Sample Name:
Analysed:
Measured:
Sample Source & type:Wednesday, October 22, 2008 4:23:02 PM
S148 - AverageSOP Name:
Result Source:
Sensitivity:
Dispersant Name:Water Off
Size range:
Default
Particle RI:
1.330Result Emulation:
Absorption:0.020 to0.1
NormalAnalysis model:
2000.000
Dispersant RI:
1.520
General purposeParticle Name:
um
Tel := +[44] (0) 1684-892456 Fax +[44] (0) 1684-892789Malvern, UKMalvern Instruments Ltd.
Serial Number : MAL1022570Mastersizer 2000 Ver. 5.54
30 May 2011 8:19:21 AMRecord Number: 6File name: Push Pit1

Result Analysis Report
Vol. Weighted Mean D[4,3]:
%
m²/g
um
Surface Weighted Mean D[3,2]:0.0369 196.904
d(0.9):
Accessory Name:
Span :1.061
umSpecific Surface Area:
19.08
Operator notes:
Uniformity:%Vol
Obscuration:
183.951 304.880d(0.1): um
0.328
162.777
um109.782 d(0.5):
Volume
Particle Size Distribution
0.01 0.1 1 10 100 1000 3000
Particle Size (µm)
0
2
4
6
8
10
12
14
16
Vol
ume
(%)
S149 - Average, Wednesday, October 22, 2008 4:31:28 PM
Hydro 2000G (A)
Result units:
um
Concentration:0.4907
Weighted Residual:0.836 %
Size (µm)0.010
0.011
0.013
0.015
0.017
0.020
0.023
0.026
0.030
0.035
0.040
0.046
0.052
0.060
0.069
0.079
0.091
0.105
Volume In %
0.00
0.00
0.00
0.00
0.00
0.00
0.00
0.00
0.00
0.00
0.00
0.00
0.00
0.00
0.00
0.00
0.00
Size (µm)0.105
0.120
0.138
0.158
0.182
0.209
0.240
0.275
0.316
0.363
0.417
0.479
0.550
0.631
0.724
0.832
0.955
1.096
Volume In %
0.00
0.00
0.00
0.00
0.00
0.00
0.00
0.00
0.00
0.00
0.00
0.00
0.00
0.00
0.00
0.00
0.00
Size (µm)1.096
1.259
1.445
1.660
1.905
2.188
2.512
2.884
3.311
3.802
4.365
5.012
5.754
6.607
7.586
8.710
10.000
11.482
Volume In %
0.00
0.00
0.00
0.00
0.00
0.00
0.01
0.01
0.02
0.02
0.02
0.02
0.01
0.01
0.00
0.00
0.00
Size (µm)11.482
13.183
15.136
17.378
19.953
22.909
26.303
30.200
34.674
39.811
45.709
52.481
60.256
69.183
79.433
91.201
104.713
120.226
Volume In %
0.00
0.00
0.00
0.00
0.00
0.00
0.00
0.00
0.00
0.00
0.00
0.00
0.13
0.90
2.36
4.42
6.94
Size (µm)120.226
138.038
158.489
181.970
208.930
239.883
275.423
316.228
363.078
416.869
478.630
549.541
630.957
724.436
831.764
954.993
1096.478
1258.925
Volume In %
9.49
11.66
12.94
13.09
12.06
10.07
7.58
5.00
2.81
0.43
0.00
0.00
0.00
0.00
0.00
0.00
0.00
Size (µm)1258.925
1445.440
1659.587
1905.461
2187.762
2511.886
2884.032
3311.311
3801.894
4365.158
5011.872
5754.399
6606.934
7585.776
8709.636
10000.000
Volume In %
0.00
0.00
0.00
0.00
0.00
0.00
0.00
0.00
0.00
0.00
0.00
0.00
0.00
0.00
0.00
Wednesday, October 22, 2008 4:31:28 PM
AveragedPit1
Measured by:student
Sample bulk lot ref:
Pushpavanam
Sample Name:
Analysed:
Measured:
Sample Source & type:Wednesday, October 22, 2008 4:31:30 PM
S149 - AverageSOP Name:
Result Source:
Sensitivity:
Dispersant Name:Water Off
Size range:
Default
Particle RI:
1.330Result Emulation:
Absorption:0.020 to0.1
NormalAnalysis model:
2000.000
Dispersant RI:
1.520
General purposeParticle Name:
um
Tel := +[44] (0) 1684-892456 Fax +[44] (0) 1684-892789Malvern, UKMalvern Instruments Ltd.
Serial Number : MAL1022570Mastersizer 2000 Ver. 5.54
30 May 2011 8:19:37 AMRecord Number: 12File name: Push Pit1

Result Analysis Report
Vol. Weighted Mean D[4,3]:
%
m²/g
um
Surface Weighted Mean D[3,2]:0.0283 247.891
d(0.9):
Accessory Name:
Span :1.101
umSpecific Surface Area:
18.82
Operator notes:
Uniformity:%Vol
Obscuration:
229.823 388.420d(0.1): um
0.34
211.819
um135.298 d(0.5):
Volume
Particle Size Distribution
0.01 0.1 1 10 100 1000 3000
Particle Size (µm)
0
2
4
6
8
10
12
14
Vol
ume
(%)
S150 - Average, Wednesday, October 22, 2008 4:41:39 PM
Hydro 2000G (A)
Result units:
um
Concentration:0.6267
Weighted Residual:0.745 %
Size (µm)0.010
0.011
0.013
0.015
0.017
0.020
0.023
0.026
0.030
0.035
0.040
0.046
0.052
0.060
0.069
0.079
0.091
0.105
Volume In %
0.00
0.00
0.00
0.00
0.00
0.00
0.00
0.00
0.00
0.00
0.00
0.00
0.00
0.00
0.00
0.00
0.00
Size (µm)0.105
0.120
0.138
0.158
0.182
0.209
0.240
0.275
0.316
0.363
0.417
0.479
0.550
0.631
0.724
0.832
0.955
1.096
Volume In %
0.00
0.00
0.00
0.00
0.00
0.00
0.00
0.00
0.00
0.00
0.00
0.00
0.00
0.00
0.00
0.00
0.00
Size (µm)1.096
1.259
1.445
1.660
1.905
2.188
2.512
2.884
3.311
3.802
4.365
5.012
5.754
6.607
7.586
8.710
10.000
11.482
Volume In %
0.00
0.00
0.00
0.00
0.00
0.00
0.00
0.00
0.00
0.00
0.00
0.00
0.00
0.00
0.00
0.00
0.00
Size (µm)11.482
13.183
15.136
17.378
19.953
22.909
26.303
30.200
34.674
39.811
45.709
52.481
60.256
69.183
79.433
91.201
104.713
120.226
Volume In %
0.00
0.00
0.00
0.00
0.00
0.00
0.00
0.00
0.00
0.00
0.00
0.00
0.00
0.06
0.47
1.63
3.29
Size (µm)120.226
138.038
158.489
181.970
208.930
239.883
275.423
316.228
363.078
416.869
478.630
549.541
630.957
724.436
831.764
954.993
1096.478
1258.925
Volume In %
5.49
7.97
10.27
12.01
12.78
12.44
11.08
8.97
6.57
4.26
2.27
0.42
0.00
0.00
0.00
0.00
0.00
Size (µm)1258.925
1445.440
1659.587
1905.461
2187.762
2511.886
2884.032
3311.311
3801.894
4365.158
5011.872
5754.399
6606.934
7585.776
8709.636
10000.000
Volume In %
0.00
0.00
0.00
0.00
0.00
0.00
0.00
0.00
0.00
0.00
0.00
0.00
0.00
0.00
0.00
Wednesday, October 22, 2008 4:41:39 PM
AveragedPit1
Measured by:student
Sample bulk lot ref:
Viludamavadi North
Sample Name:
Analysed:
Measured:
Sample Source & type:Wednesday, October 22, 2008 4:41:41 PM
S150 - AverageSOP Name:
Result Source:
Sensitivity:
Dispersant Name:Water Off
Size range:
Default
Particle RI:
1.330Result Emulation:
Absorption:0.020 to0.1
NormalAnalysis model:
2000.000
Dispersant RI:
1.520
General purposeParticle Name:
um
Tel := +[44] (0) 1684-892456 Fax +[44] (0) 1684-892789Malvern, UKMalvern Instruments Ltd.
Serial Number : MAL1022570Mastersizer 2000 Ver. 5.54
30 May 2011 8:31:32 AMRecord Number: 6File name: Pit1

Result Analysis Report
Vol. Weighted Mean D[4,3]:
%
m²/g
um
Surface Weighted Mean D[3,2]:0.0339 226.593
d(0.9):
Accessory Name:
Span :1.121
umSpecific Surface Area:
20.40
Operator notes:
Uniformity:%Vol
Obscuration:
211.370 358.500d(0.1): um
0.351
177.001
um121.493 d(0.5):
Volume
Particle Size Distribution
0.01 0.1 1 10 100 1000 3000
Particle Size (µm)
0
2
4
6
8
10
12
14
Vol
ume
(%)
S151 - Average, Wednesday, October 22, 2008 4:48:57 PM
Hydro 2000G (A)
Result units:
um
Concentration:0.5710
Weighted Residual:0.744 %
Size (µm)0.010
0.011
0.013
0.015
0.017
0.020
0.023
0.026
0.030
0.035
0.040
0.046
0.052
0.060
0.069
0.079
0.091
0.105
Volume In %
0.00
0.00
0.00
0.00
0.00
0.00
0.00
0.00
0.00
0.00
0.00
0.00
0.00
0.00
0.00
0.00
0.00
Size (µm)0.105
0.120
0.138
0.158
0.182
0.209
0.240
0.275
0.316
0.363
0.417
0.479
0.550
0.631
0.724
0.832
0.955
1.096
Volume In %
0.00
0.00
0.00
0.00
0.00
0.00
0.00
0.00
0.00
0.00
0.00
0.00
0.00
0.00
0.00
0.00
0.00
Size (µm)1.096
1.259
1.445
1.660
1.905
2.188
2.512
2.884
3.311
3.802
4.365
5.012
5.754
6.607
7.586
8.710
10.000
11.482
Volume In %
0.00
0.00
0.00
0.00
0.00
0.00
0.00
0.00
0.00
0.00
0.00
0.00
0.00
0.00
0.00
0.00
0.00
Size (µm)11.482
13.183
15.136
17.378
19.953
22.909
26.303
30.200
34.674
39.811
45.709
52.481
60.256
69.183
79.433
91.201
104.713
120.226
Volume In %
0.00
0.07
0.14
0.20
0.25
0.27
0.24
0.15
0.04
0.00
0.00
0.00
0.00
0.25
1.08
2.46
4.43
Size (µm)120.226
138.038
158.489
181.970
208.930
239.883
275.423
316.228
363.078
416.869
478.630
549.541
630.957
724.436
831.764
954.993
1096.478
1258.925
Volume In %
6.74
9.14
11.12
12.35
12.54
11.64
9.88
7.60
5.25
3.09
1.04
0.02
0.00
0.00
0.00
0.00
0.00
Size (µm)1258.925
1445.440
1659.587
1905.461
2187.762
2511.886
2884.032
3311.311
3801.894
4365.158
5011.872
5754.399
6606.934
7585.776
8709.636
10000.000
Volume In %
0.00
0.00
0.00
0.00
0.00
0.00
0.00
0.00
0.00
0.00
0.00
0.00
0.00
0.00
0.00
Wednesday, October 22, 2008 4:48:57 PM
AveragedPit1
Measured by:student
Sample bulk lot ref:
Viludamavadi North
Sample Name:
Analysed:
Measured:
Sample Source & type:Wednesday, October 22, 2008 4:48:58 PM
S151 - AverageSOP Name:
Result Source:
Sensitivity:
Dispersant Name:Water Off
Size range:
Default
Particle RI:
1.330Result Emulation:
Absorption:0.020 to0.1
NormalAnalysis model:
2000.000
Dispersant RI:
1.520
General purposeParticle Name:
um
Tel := +[44] (0) 1684-892456 Fax +[44] (0) 1684-892789Malvern, UKMalvern Instruments Ltd.
Serial Number : MAL1022570Mastersizer 2000 Ver. 5.54
30 May 2011 8:31:43 AMRecord Number: 12File name: Pit1

Result Analysis Report
Vol. Weighted Mean D[4,3]:
%
m²/g
um
Surface Weighted Mean D[3,2]:0.0301 244.154
d(0.9):
Accessory Name:
Span :1.283
umSpecific Surface Area:
19.15
Operator notes:
Uniformity:%Vol
Obscuration:
219.912 403.271d(0.1): um
0.395
199.190
um121.143 d(0.5):
Volume
Particle Size Distribution
0.01 0.1 1 10 100 1000 3000
Particle Size (µm)
0
2
4
6
8
10
12
Vol
ume
(%)
S152 - Average, Wednesday, October 22, 2008 4:57:38 PM
Hydro 2000G (A)
Result units:
um
Concentration:0.6004
Weighted Residual:0.825 %
Size (µm)0.010
0.011
0.013
0.015
0.017
0.020
0.023
0.026
0.030
0.035
0.040
0.046
0.052
0.060
0.069
0.079
0.091
0.105
Volume In %
0.00
0.00
0.00
0.00
0.00
0.00
0.00
0.00
0.00
0.00
0.00
0.00
0.00
0.00
0.00
0.00
0.00
Size (µm)0.105
0.120
0.138
0.158
0.182
0.209
0.240
0.275
0.316
0.363
0.417
0.479
0.550
0.631
0.724
0.832
0.955
1.096
Volume In %
0.00
0.00
0.00
0.00
0.00
0.00
0.00
0.00
0.00
0.00
0.00
0.00
0.00
0.00
0.00
0.00
0.00
Size (µm)1.096
1.259
1.445
1.660
1.905
2.188
2.512
2.884
3.311
3.802
4.365
5.012
5.754
6.607
7.586
8.710
10.000
11.482
Volume In %
0.00
0.00
0.00
0.00
0.00
0.00
0.00
0.00
0.00
0.00
0.00
0.00
0.00
0.00
0.00
0.00
0.00
Size (µm)11.482
13.183
15.136
17.378
19.953
22.909
26.303
30.200
34.674
39.811
45.709
52.481
60.256
69.183
79.433
91.201
104.713
120.226
Volume In %
0.00
0.00
0.00
0.00
0.00
0.00
0.00
0.00
0.00
0.00
0.00
0.00
0.01
0.48
1.57
2.93
4.70
Size (µm)120.226
138.038
158.489
181.970
208.930
239.883
275.423
316.228
363.078
416.869
478.630
549.541
630.957
724.436
831.764
954.993
1096.478
1258.925
Volume In %
6.61
8.50
10.02
11.00
11.24
10.72
9.55
7.90
6.06
4.27
2.66
1.43
0.35
0.00
0.00
0.00
0.00
Size (µm)1258.925
1445.440
1659.587
1905.461
2187.762
2511.886
2884.032
3311.311
3801.894
4365.158
5011.872
5754.399
6606.934
7585.776
8709.636
10000.000
Volume In %
0.00
0.00
0.00
0.00
0.00
0.00
0.00
0.00
0.00
0.00
0.00
0.00
0.00
0.00
0.00
Wednesday, October 22, 2008 4:57:38 PM
AveragedPit1
Measured by:student
Sample bulk lot ref:
Puthupalli
Sample Name:
Analysed:
Measured:
Sample Source & type:Wednesday, October 22, 2008 4:57:39 PM
S152 - AverageSOP Name:
Result Source:
Sensitivity:
Dispersant Name:Water Off
Size range:
Default
Particle RI:
1.330Result Emulation:
Absorption:0.020 to0.1
NormalAnalysis model:
2000.000
Dispersant RI:
1.520
General purposeParticle Name:
um
Tel := +[44] (0) 1684-892456 Fax +[44] (0) 1684-892789Malvern, UKMalvern Instruments Ltd.
Serial Number : MAL1022570Mastersizer 2000 Ver. 5.54
30 May 2011 8:19:57 AMRecord Number: 6File name: Pit1

Result Analysis Report
Vol. Weighted Mean D[4,3]:
%
m²/g
um
Surface Weighted Mean D[3,2]:0.062 189.494
d(0.9):
Accessory Name:
Span :1.035
umSpecific Surface Area:
19.02
Operator notes:
Uniformity:%Vol
Obscuration:
181.850 293.616d(0.1): um
0.334
96.765
um105.457 d(0.5):
Volume
Particle Size Distribution
0.01 0.1 1 10 100 1000 3000
Particle Size (µm)
0
2
4
6
8
10
12
14
16
Vol
ume
(%)
S153 - Average, Wednesday, October 22, 2008 5:04:56 PM
Hydro 2000G (A)
Result units:
um
Concentration:0.2788
Weighted Residual:0.619 %
Size (µm)0.010
0.011
0.013
0.015
0.017
0.020
0.023
0.026
0.030
0.035
0.040
0.046
0.052
0.060
0.069
0.079
0.091
0.105
Volume In %
0.00
0.00
0.00
0.00
0.00
0.00
0.00
0.00
0.00
0.00
0.00
0.00
0.00
0.00
0.00
0.00
0.00
Size (µm)0.105
0.120
0.138
0.158
0.182
0.209
0.240
0.275
0.316
0.363
0.417
0.479
0.550
0.631
0.724
0.832
0.955
1.096
Volume In %
0.00
0.00
0.00
0.00
0.00
0.00
0.00
0.00
0.00
0.00
0.00
0.00
0.00
0.00
0.00
0.00
0.00
Size (µm)1.096
1.259
1.445
1.660
1.905
2.188
2.512
2.884
3.311
3.802
4.365
5.012
5.754
6.607
7.586
8.710
10.000
11.482
Volume In %
0.00
0.00
0.00
0.00
0.00
0.07
0.10
0.12
0.14
0.16
0.18
0.18
0.18
0.17
0.16
0.15
0.16
Size (µm)11.482
13.183
15.136
17.378
19.953
22.909
26.303
30.200
34.674
39.811
45.709
52.481
60.256
69.183
79.433
91.201
104.713
120.226
Volume In %
0.19
0.25
0.31
0.37
0.40
0.39
0.31
0.13
0.00
0.00
0.00
0.00
0.05
0.49
1.61
3.49
6.12
Size (µm)120.226
138.038
158.489
181.970
208.930
239.883
275.423
316.228
363.078
416.869
478.630
549.541
630.957
724.436
831.764
954.993
1096.478
1258.925
Volume In %
9.04
11.73
13.43
13.72
12.49
10.06
7.12
4.28
2.05
0.22
0.00
0.00
0.00
0.00
0.00
0.00
0.00
Size (µm)1258.925
1445.440
1659.587
1905.461
2187.762
2511.886
2884.032
3311.311
3801.894
4365.158
5011.872
5754.399
6606.934
7585.776
8709.636
10000.000
Volume In %
0.00
0.00
0.00
0.00
0.00
0.00
0.00
0.00
0.00
0.00
0.00
0.00
0.00
0.00
0.00
Wednesday, October 22, 2008 5:04:56 PM
AveragedPit1
Measured by:student
Sample bulk lot ref:
Puthupalli
Sample Name:
Analysed:
Measured:
Sample Source & type:Wednesday, October 22, 2008 5:04:57 PM
S153 - AverageSOP Name:
Result Source:
Sensitivity:
Dispersant Name:Water Off
Size range:
Default
Particle RI:
1.330Result Emulation:
Absorption:0.020 to0.1
NormalAnalysis model:
2000.000
Dispersant RI:
1.520
General purposeParticle Name:
um
Tel := +[44] (0) 1684-892456 Fax +[44] (0) 1684-892789Malvern, UKMalvern Instruments Ltd.
Serial Number : MAL1022570Mastersizer 2000 Ver. 5.54
30 May 2011 8:20:08 AMRecord Number: 12File name: Pit1

Result Analysis Report
Vol. Weighted Mean D[4,3]:
%
m²/g
um
Surface Weighted Mean D[3,2]:0.0301 244.154
d(0.9):
Accessory Name:
Span :1.283
umSpecific Surface Area:
19.15
Operator notes:
Uniformity:%Vol
Obscuration:
219.912 403.271d(0.1): um
0.395
199.190
um121.143 d(0.5):
Volume
Particle Size Distribution
0.01 0.1 1 10 100 1000 3000
Particle Size (µm)
0
2
4
6
8
10
12
Vol
ume
(%)
S154 - Average, Wednesday, October 22, 2008 4:57:38 PM
Hydro 2000G (A)
Result units:
um
Concentration:0.6004
Weighted Residual:0.825 %
Size (µm)0.010
0.011
0.013
0.015
0.017
0.020
0.023
0.026
0.030
0.035
0.040
0.046
0.052
0.060
0.069
0.079
0.091
0.105
Volume In %
0.00
0.00
0.00
0.00
0.00
0.00
0.00
0.00
0.00
0.00
0.00
0.00
0.00
0.00
0.00
0.00
0.00
Size (µm)0.105
0.120
0.138
0.158
0.182
0.209
0.240
0.275
0.316
0.363
0.417
0.479
0.550
0.631
0.724
0.832
0.955
1.096
Volume In %
0.00
0.00
0.00
0.00
0.00
0.00
0.00
0.00
0.00
0.00
0.00
0.00
0.00
0.00
0.00
0.00
0.00
Size (µm)1.096
1.259
1.445
1.660
1.905
2.188
2.512
2.884
3.311
3.802
4.365
5.012
5.754
6.607
7.586
8.710
10.000
11.482
Volume In %
0.00
0.00
0.00
0.00
0.00
0.00
0.00
0.00
0.00
0.00
0.00
0.00
0.00
0.00
0.00
0.00
0.00
Size (µm)11.482
13.183
15.136
17.378
19.953
22.909
26.303
30.200
34.674
39.811
45.709
52.481
60.256
69.183
79.433
91.201
104.713
120.226
Volume In %
0.00
0.00
0.00
0.00
0.00
0.00
0.00
0.00
0.00
0.00
0.00
0.00
0.01
0.48
1.57
2.93
4.70
Size (µm)120.226
138.038
158.489
181.970
208.930
239.883
275.423
316.228
363.078
416.869
478.630
549.541
630.957
724.436
831.764
954.993
1096.478
1258.925
Volume In %
6.61
8.50
10.02
11.00
11.24
10.72
9.55
7.90
6.06
4.27
2.66
1.43
0.35
0.00
0.00
0.00
0.00
Size (µm)1258.925
1445.440
1659.587
1905.461
2187.762
2511.886
2884.032
3311.311
3801.894
4365.158
5011.872
5754.399
6606.934
7585.776
8709.636
10000.000
Volume In %
0.00
0.00
0.00
0.00
0.00
0.00
0.00
0.00
0.00
0.00
0.00
0.00
0.00
0.00
0.00
Wednesday, October 22, 2008 4:57:38 PM
EditedPit1
Measured by:student
Sample bulk lot ref:
Karaikal
Sample Name:
Analysed:
Measured:
Sample Source & type:Wednesday, October 22, 2008 4:57:39 PM
S154 - AverageSOP Name:
Result Source:
Sensitivity:
Dispersant Name:Water Off
Size range:
Default
Particle RI:
1.330Result Emulation:
Absorption:0.020 to0.1
NormalAnalysis model:
2000.000
Dispersant RI:
1.520
General purposeParticle Name:
um
Tel := +[44] (0) 1684-892456 Fax +[44] (0) 1684-892789Malvern, UKMalvern Instruments Ltd.
Serial Number : MAL1022570Mastersizer 2000 Ver. 5.54
30 May 2011 7:59:38 AMRecord Number: 18File name: Pit1

Result Analysis Report
Vol. Weighted Mean D[4,3]:
%
m²/g
um
Surface Weighted Mean D[3,2]:0.062 189.494
d(0.9):
Accessory Name:
Span :1.035
umSpecific Surface Area:
19.02
Operator notes:
Uniformity:%Vol
Obscuration:
181.850 293.616d(0.1): um
0.334
96.765
um105.457 d(0.5):
Volume
Particle Size Distribution
0.01 0.1 1 10 100 1000 3000
Particle Size (µm)
0
2
4
6
8
10
12
14
16
Vol
ume
(%)
S155 - Average, Wednesday, October 22, 2008 5:04:56 PM
Hydro 2000G (A)
Result units:
um
Concentration:0.2788
Weighted Residual:0.619 %
Size (µm)0.010
0.011
0.013
0.015
0.017
0.020
0.023
0.026
0.030
0.035
0.040
0.046
0.052
0.060
0.069
0.079
0.091
0.105
Volume In %
0.00
0.00
0.00
0.00
0.00
0.00
0.00
0.00
0.00
0.00
0.00
0.00
0.00
0.00
0.00
0.00
0.00
Size (µm)0.105
0.120
0.138
0.158
0.182
0.209
0.240
0.275
0.316
0.363
0.417
0.479
0.550
0.631
0.724
0.832
0.955
1.096
Volume In %
0.00
0.00
0.00
0.00
0.00
0.00
0.00
0.00
0.00
0.00
0.00
0.00
0.00
0.00
0.00
0.00
0.00
Size (µm)1.096
1.259
1.445
1.660
1.905
2.188
2.512
2.884
3.311
3.802
4.365
5.012
5.754
6.607
7.586
8.710
10.000
11.482
Volume In %
0.00
0.00
0.00
0.00
0.00
0.07
0.10
0.12
0.14
0.16
0.18
0.18
0.18
0.17
0.16
0.15
0.16
Size (µm)11.482
13.183
15.136
17.378
19.953
22.909
26.303
30.200
34.674
39.811
45.709
52.481
60.256
69.183
79.433
91.201
104.713
120.226
Volume In %
0.19
0.25
0.31
0.37
0.40
0.39
0.31
0.13
0.00
0.00
0.00
0.00
0.05
0.49
1.61
3.49
6.12
Size (µm)120.226
138.038
158.489
181.970
208.930
239.883
275.423
316.228
363.078
416.869
478.630
549.541
630.957
724.436
831.764
954.993
1096.478
1258.925
Volume In %
9.04
11.73
13.43
13.72
12.49
10.06
7.12
4.28
2.05
0.22
0.00
0.00
0.00
0.00
0.00
0.00
0.00
Size (µm)1258.925
1445.440
1659.587
1905.461
2187.762
2511.886
2884.032
3311.311
3801.894
4365.158
5011.872
5754.399
6606.934
7585.776
8709.636
10000.000
Volume In %
0.00
0.00
0.00
0.00
0.00
0.00
0.00
0.00
0.00
0.00
0.00
0.00
0.00
0.00
0.00
Wednesday, October 22, 2008 5:04:56 PM
EditedPit1
Measured by:student
Sample bulk lot ref:
Karaikal
Sample Name:
Analysed:
Measured:
Sample Source & type:Wednesday, October 22, 2008 5:04:57 PM
S155 - AverageSOP Name:
Result Source:
Sensitivity:
Dispersant Name:Water Off
Size range:
Default
Particle RI:
1.330Result Emulation:
Absorption:0.020 to0.1
NormalAnalysis model:
2000.000
Dispersant RI:
1.520
General purposeParticle Name:
um
Tel := +[44] (0) 1684-892456 Fax +[44] (0) 1684-892789Malvern, UKMalvern Instruments Ltd.
Serial Number : MAL1022570Mastersizer 2000 Ver. 5.54
30 May 2011 7:59:52 AMRecord Number: 24File name: Pit1

Result Analysis Report
Vol. Weighted Mean D[4,3]:
%
m²/g
um
Surface Weighted Mean D[3,2]:0.227 193.383
d(0.9):
Accessory Name:
Span :1.913
umSpecific Surface Area:
23.21
Operator notes:
Uniformity:%Vol
Obscuration:
183.042 364.574d(0.1): um
0.543
26.489
um14.350 d(0.5):
Volume
Particle Size Distribution
0.01 0.1 1 10 100 1000 3000
Particle Size (µm)
0 1 2 3 4 5 6 7 8 9
10 11
Vol
ume
(%)
S156 - Average, Wednesday, October 29, 2008 2:47:35 PM
Hydro 2000G (A)
Result units:
um
Concentration:0.0994
Weighted Residual:0.481 %
Size (µm)0.010
0.011
0.013
0.015
0.017
0.020
0.023
0.026
0.030
0.035
0.040
0.046
0.052
0.060
0.069
0.079
0.091
0.105
Volume In %
0.00
0.00
0.00
0.00
0.00
0.00
0.00
0.00
0.00
0.00
0.00
0.00
0.00
0.00
0.00
0.00
0.00
Size (µm)0.105
0.120
0.138
0.158
0.182
0.209
0.240
0.275
0.316
0.363
0.417
0.479
0.550
0.631
0.724
0.832
0.955
1.096
Volume In %
0.00
0.00
0.00
0.00
0.00
0.00
0.00
0.00
0.00
0.00
0.00
0.06
0.09
0.11
0.12
0.13
0.14
Size (µm)1.096
1.259
1.445
1.660
1.905
2.188
2.512
2.884
3.311
3.802
4.365
5.012
5.754
6.607
7.586
8.710
10.000
11.482
Volume In %
0.16
0.18
0.21
0.24
0.29
0.35
0.40
0.46
0.52
0.57
0.61
0.65
0.67
0.69
0.70
0.71
0.73
Size (µm)11.482
13.183
15.136
17.378
19.953
22.909
26.303
30.200
34.674
39.811
45.709
52.481
60.256
69.183
79.433
91.201
104.713
120.226
Volume In %
0.75
0.78
0.82
0.85
0.87
0.86
0.80
0.69
0.54
0.39
0.28
0.30
0.53
1.05
1.91
3.08
4.50
Size (µm)120.226
138.038
158.489
181.970
208.930
239.883
275.423
316.228
363.078
416.869
478.630
549.541
630.957
724.436
831.764
954.993
1096.478
1258.925
Volume In %
5.99
7.39
8.46
9.06
9.07
8.51
7.48
6.11
4.66
3.22
1.89
0.39
0.00
0.00
0.00
0.00
0.00
Size (µm)1258.925
1445.440
1659.587
1905.461
2187.762
2511.886
2884.032
3311.311
3801.894
4365.158
5011.872
5754.399
6606.934
7585.776
8709.636
10000.000
Volume In %
0.00
0.00
0.00
0.00
0.00
0.00
0.00
0.00
0.00
0.00
0.00
0.00
0.00
0.00
0.00
Wednesday, October 29, 2008 2:47:35 PM
AveragedPit1
Measured by:student
Sample bulk lot ref:
Tranquebar
Sample Name:
Analysed:
Measured:
Sample Source & type:Wednesday, October 29, 2008 2:47:37 PM
S156 - AverageSOP Name:
Result Source:
Sensitivity:
Dispersant Name:Water Off
Size range:
Default
Particle RI:
1.330Result Emulation:
Absorption:0.020 to0.1
NormalAnalysis model:
2000.000
Dispersant RI:
1.520
General purposeParticle Name:
um
Tel := +[44] (0) 1684-892456 Fax +[44] (0) 1684-892789Malvern, UKMalvern Instruments Ltd.
Serial Number : MAL1022570Mastersizer 2000 Ver. 5.54
30 May 2011 8:30:59 AMRecord Number: 6File name: Pit1

Result Analysis Report
Vol. Weighted Mean D[4,3]:
%
m²/g
um
Surface Weighted Mean D[3,2]:0.303 180.040
d(0.9):
Accessory Name:
Span :1.852
umSpecific Surface Area:
20.94
Operator notes:
Uniformity:%Vol
Obscuration:
175.817 333.809d(0.1): um
0.525
19.799
um8.268 d(0.5):
Volume
Particle Size Distribution
0.01 0.1 1 10 100 1000 3000
Particle Size (µm)
0 1 2 3 4 5 6 7 8 9
10 11
Vol
ume
(%)
S157 - Average, Wednesday, October 29, 2008 2:58:13 PM
Hydro 2000G (A)
Result units:
um
Concentration:0.0672
Weighted Residual:0.502 %
Size (µm)0.010
0.011
0.013
0.015
0.017
0.020
0.023
0.026
0.030
0.035
0.040
0.046
0.052
0.060
0.069
0.079
0.091
0.105
Volume In %
0.00
0.00
0.00
0.00
0.00
0.00
0.00
0.00
0.00
0.00
0.00
0.00
0.00
0.00
0.00
0.00
0.00
Size (µm)0.105
0.120
0.138
0.158
0.182
0.209
0.240
0.275
0.316
0.363
0.417
0.479
0.550
0.631
0.724
0.832
0.955
1.096
Volume In %
0.00
0.00
0.00
0.00
0.00
0.00
0.00
0.00
0.00
0.00
0.05
0.09
0.12
0.15
0.17
0.19
0.20
Size (µm)1.096
1.259
1.445
1.660
1.905
2.188
2.512
2.884
3.311
3.802
4.365
5.012
5.754
6.607
7.586
8.710
10.000
11.482
Volume In %
0.22
0.25
0.30
0.35
0.42
0.50
0.58
0.67
0.75
0.82
0.87
0.91
0.92
0.92
0.90
0.87
0.84
Size (µm)11.482
13.183
15.136
17.378
19.953
22.909
26.303
30.200
34.674
39.811
45.709
52.481
60.256
69.183
79.433
91.201
104.713
120.226
Volume In %
0.82
0.80
0.80
0.79
0.77
0.71
0.61
0.46
0.28
0.12
0.01
0.06
0.27
0.78
1.69
2.99
4.64
Size (µm)120.226
138.038
158.489
181.970
208.930
239.883
275.423
316.228
363.078
416.869
478.630
549.541
630.957
724.436
831.764
954.993
1096.478
1258.925
Volume In %
6.41
8.07
9.27
9.82
9.60
8.65
7.19
5.46
3.77
2.24
0.83
0.05
0.00
0.00
0.00
0.00
0.00
Size (µm)1258.925
1445.440
1659.587
1905.461
2187.762
2511.886
2884.032
3311.311
3801.894
4365.158
5011.872
5754.399
6606.934
7585.776
8709.636
10000.000
Volume In %
0.00
0.00
0.00
0.00
0.00
0.00
0.00
0.00
0.00
0.00
0.00
0.00
0.00
0.00
0.00
Wednesday, October 29, 2008 2:58:13 PM
AveragedPit1
Measured by:student
Sample bulk lot ref:
Tranquebar
Sample Name:
Analysed:
Measured:
Sample Source & type:Wednesday, October 29, 2008 2:58:14 PM
S157 - AverageSOP Name:
Result Source:
Sensitivity:
Dispersant Name:Water Off
Size range:
Default
Particle RI:
1.330Result Emulation:
Absorption:0.020 to0.1
NormalAnalysis model:
2000.000
Dispersant RI:
1.520
General purposeParticle Name:
um
Tel := +[44] (0) 1684-892456 Fax +[44] (0) 1684-892789Malvern, UKMalvern Instruments Ltd.
Serial Number : MAL1022570Mastersizer 2000 Ver. 5.54
30 May 2011 8:31:12 AMRecord Number: 12File name: Pit1

Result Analysis Report
Vol. Weighted Mean D[4,3]:
%
m²/g
um
Surface Weighted Mean D[3,2]:0.0268 258.884
d(0.9):
Accessory Name:
Span :1.047
umSpecific Surface Area:
21.82
Operator notes:
Uniformity:%Vol
Obscuration:
241.974 398.667d(0.1): um
0.325
224.143
um145.352 d(0.5):
Volume
Particle Size Distribution
0.01 0.1 1 10 100 1000 3000
Particle Size (µm)
0
2
4
6
8
10
12
14
16
Vol
ume
(%)
S158 - Average, Wednesday, October 29, 2008 3:07:48 PM
Hydro 2000G (A)
Result units:
um
Concentration:0.7831
Weighted Residual:0.720 %
Size (µm)0.010
0.011
0.013
0.015
0.017
0.020
0.023
0.026
0.030
0.035
0.040
0.046
0.052
0.060
0.069
0.079
0.091
0.105
Volume In %
0.00
0.00
0.00
0.00
0.00
0.00
0.00
0.00
0.00
0.00
0.00
0.00
0.00
0.00
0.00
0.00
0.00
Size (µm)0.105
0.120
0.138
0.158
0.182
0.209
0.240
0.275
0.316
0.363
0.417
0.479
0.550
0.631
0.724
0.832
0.955
1.096
Volume In %
0.00
0.00
0.00
0.00
0.00
0.00
0.00
0.00
0.00
0.00
0.00
0.00
0.00
0.00
0.00
0.00
0.00
Size (µm)1.096
1.259
1.445
1.660
1.905
2.188
2.512
2.884
3.311
3.802
4.365
5.012
5.754
6.607
7.586
8.710
10.000
11.482
Volume In %
0.00
0.00
0.00
0.00
0.00
0.00
0.00
0.00
0.00
0.00
0.00
0.00
0.00
0.00
0.00
0.00
0.00
Size (µm)11.482
13.183
15.136
17.378
19.953
22.909
26.303
30.200
34.674
39.811
45.709
52.481
60.256
69.183
79.433
91.201
104.713
120.226
Volume In %
0.00
0.00
0.00
0.00
0.00
0.00
0.00
0.00
0.00
0.00
0.00
0.00
0.00
0.00
0.13
0.89
2.32
Size (µm)120.226
138.038
158.489
181.970
208.930
239.883
275.423
316.228
363.078
416.869
478.630
549.541
630.957
724.436
831.764
954.993
1096.478
1258.925
Volume In %
4.38
6.95
9.56
11.80
13.13
13.26
12.16
10.07
7.46
4.85
2.57
0.47
0.00
0.00
0.00
0.00
0.00
Size (µm)1258.925
1445.440
1659.587
1905.461
2187.762
2511.886
2884.032
3311.311
3801.894
4365.158
5011.872
5754.399
6606.934
7585.776
8709.636
10000.000
Volume In %
0.00
0.00
0.00
0.00
0.00
0.00
0.00
0.00
0.00
0.00
0.00
0.00
0.00
0.00
0.00
Wednesday, October 29, 2008 3:07:48 PM
AveragedPit1
Measured by:student
Sample bulk lot ref:
Cuddalore
Sample Name:
Analysed:
Measured:
Sample Source & type:Wednesday, October 29, 2008 3:07:50 PM
S158 - AverageSOP Name:
Result Source:
Sensitivity:
Dispersant Name:Water Off
Size range:
Default
Particle RI:
1.330Result Emulation:
Absorption:0.020 to0.1
NormalAnalysis model:
2000.000
Dispersant RI:
1.520
General purposeParticle Name:
um
Tel := +[44] (0) 1684-892456 Fax +[44] (0) 1684-892789Malvern, UKMalvern Instruments Ltd.
Serial Number : MAL1022570Mastersizer 2000 Ver. 5.54
30 May 2011 7:57:18 AMRecord Number: 6File name: Pit1

Result Analysis Report
Vol. Weighted Mean D[4,3]:
%
m²/g
um
Surface Weighted Mean D[3,2]:0.0492 261.880
d(0.9):
Accessory Name:
Span :1.151
umSpecific Surface Area:
17.68
Operator notes:
Uniformity:%Vol
Obscuration:
246.388 420.283d(0.1): um
0.366
121.999
um136.789 d(0.5):
Volume
Particle Size Distribution
0.01 0.1 1 10 100 1000 3000
Particle Size (µm)
0
2
4
6
8
10
12
14
Vol
ume
(%)
S159 - Average, Wednesday, October 29, 2008 3:15:51 PM
Hydro 2000G (A)
Result units:
um
Concentration:0.3227
Weighted Residual:0.526 %
Size (µm)0.010
0.011
0.013
0.015
0.017
0.020
0.023
0.026
0.030
0.035
0.040
0.046
0.052
0.060
0.069
0.079
0.091
0.105
Volume In %
0.00
0.00
0.00
0.00
0.00
0.00
0.00
0.00
0.00
0.00
0.00
0.00
0.00
0.00
0.00
0.00
0.00
Size (µm)0.105
0.120
0.138
0.158
0.182
0.209
0.240
0.275
0.316
0.363
0.417
0.479
0.550
0.631
0.724
0.832
0.955
1.096
Volume In %
0.00
0.00
0.00
0.00
0.00
0.00
0.00
0.00
0.00
0.00
0.00
0.00
0.00
0.00
0.00
0.00
0.00
Size (µm)1.096
1.259
1.445
1.660
1.905
2.188
2.512
2.884
3.311
3.802
4.365
5.012
5.754
6.607
7.586
8.710
10.000
11.482
Volume In %
0.00
0.00
0.00
0.00
0.00
0.07
0.09
0.11
0.13
0.14
0.16
0.16
0.16
0.16
0.14
0.12
0.10
Size (µm)11.482
13.183
15.136
17.378
19.953
22.909
26.303
30.200
34.674
39.811
45.709
52.481
60.256
69.183
79.433
91.201
104.713
120.226
Volume In %
0.09
0.09
0.11
0.15
0.20
0.26
0.29
0.29
0.22
0.10
0.00
0.00
0.00
0.00
0.15
0.82
2.09
Size (µm)120.226
138.038
158.489
181.970
208.930
239.883
275.423
316.228
363.078
416.869
478.630
549.541
630.957
724.436
831.764
954.993
1096.478
1258.925
Volume In %
3.90
6.17
8.52
10.61
11.98
12.36
11.68
10.07
7.90
5.56
3.40
1.34
0.09
0.00
0.00
0.00
0.00
Size (µm)1258.925
1445.440
1659.587
1905.461
2187.762
2511.886
2884.032
3311.311
3801.894
4365.158
5011.872
5754.399
6606.934
7585.776
8709.636
10000.000
Volume In %
0.00
0.00
0.00
0.00
0.00
0.00
0.00
0.00
0.00
0.00
0.00
0.00
0.00
0.00
0.00
Wednesday, October 29, 2008 3:15:51 PM
AveragedPit1
Measured by:student
Sample bulk lot ref:
Cuddalore
Sample Name:
Analysed:
Measured:
Sample Source & type:Wednesday, October 29, 2008 3:15:52 PM
S159 - AverageSOP Name:
Result Source:
Sensitivity:
Dispersant Name:Water Off
Size range:
Default
Particle RI:
1.330Result Emulation:
Absorption:0.020 to0.1
NormalAnalysis model:
2000.000
Dispersant RI:
1.520
General purposeParticle Name:
um
Tel := +[44] (0) 1684-892456 Fax +[44] (0) 1684-892789Malvern, UKMalvern Instruments Ltd.
Serial Number : MAL1022570Mastersizer 2000 Ver. 5.54
30 May 2011 7:57:38 AMRecord Number: 12File name: Pit1

Result Analysis Report
Vol. Weighted Mean D[4,3]:
%
m²/g
um
Surface Weighted Mean D[3,2]:0.039 286.772
d(0.9):
Accessory Name:
Span :1.143
umSpecific Surface Area:
17.27
Operator notes:
Uniformity:%Vol
Obscuration:
268.938 458.336d(0.1): um
0.361
153.694
um151.019 d(0.5):
Volume
Particle Size Distribution
0.01 0.1 1 10 100 1000 3000
Particle Size (µm)
0
2
4
6
8
10
12
14
Vol
ume
(%)
S160 - Average, Wednesday, October 29, 2008 3:24:32 PM
Hydro 2000G (A)
Result units:
um
Concentration:0.4017
Weighted Residual:0.564 %
Size (µm)0.010
0.011
0.013
0.015
0.017
0.020
0.023
0.026
0.030
0.035
0.040
0.046
0.052
0.060
0.069
0.079
0.091
0.105
Volume In %
0.00
0.00
0.00
0.00
0.00
0.00
0.00
0.00
0.00
0.00
0.00
0.00
0.00
0.00
0.00
0.00
0.00
Size (µm)0.105
0.120
0.138
0.158
0.182
0.209
0.240
0.275
0.316
0.363
0.417
0.479
0.550
0.631
0.724
0.832
0.955
1.096
Volume In %
0.00
0.00
0.00
0.00
0.00
0.00
0.00
0.00
0.00
0.00
0.00
0.00
0.00
0.00
0.00
0.00
0.00
Size (µm)1.096
1.259
1.445
1.660
1.905
2.188
2.512
2.884
3.311
3.802
4.365
5.012
5.754
6.607
7.586
8.710
10.000
11.482
Volume In %
0.00
0.00
0.00
0.00
0.00
0.00
0.04
0.08
0.09
0.10
0.11
0.12
0.12
0.12
0.10
0.09
0.07
Size (µm)11.482
13.183
15.136
17.378
19.953
22.909
26.303
30.200
34.674
39.811
45.709
52.481
60.256
69.183
79.433
91.201
104.713
120.226
Volume In %
0.06
0.01
0.06
0.12
0.16
0.22
0.27
0.28
0.24
0.14
0.00
0.00
0.00
0.00
0.01
0.38
1.31
Size (µm)120.226
138.038
158.489
181.970
208.930
239.883
275.423
316.228
363.078
416.869
478.630
549.541
630.957
724.436
831.764
954.993
1096.478
1258.925
Volume In %
2.80
4.84
7.15
9.47
11.29
12.30
12.26
11.19
9.33
7.03
4.70
2.69
0.66
0.00
0.00
0.00
0.00
Size (µm)1258.925
1445.440
1659.587
1905.461
2187.762
2511.886
2884.032
3311.311
3801.894
4365.158
5011.872
5754.399
6606.934
7585.776
8709.636
10000.000
Volume In %
0.00
0.00
0.00
0.00
0.00
0.00
0.00
0.00
0.00
0.00
0.00
0.00
0.00
0.00
0.00
Wednesday, October 29, 2008 3:24:32 PM
AveragedPit1
Measured by:student
Sample bulk lot ref:
Cuddalore
Sample Name:
Analysed:
Measured:
Sample Source & type:Wednesday, October 29, 2008 3:24:34 PM
S160 - AverageSOP Name:
Result Source:
Sensitivity:
Dispersant Name:Water Off
Size range:
Default
Particle RI:
1.330Result Emulation:
Absorption:0.020 to0.1
NormalAnalysis model:
2000.000
Dispersant RI:
1.520
General purposeParticle Name:
um
Tel := +[44] (0) 1684-892456 Fax +[44] (0) 1684-892789Malvern, UKMalvern Instruments Ltd.
Serial Number : MAL1022570Mastersizer 2000 Ver. 5.54
30 May 2011 7:57:53 AMRecord Number: 18File name: Pit1