Embed Size (px)
Citation preview

Geometry-Based Stochastic Channel Models for5G: Extending Key Features for Massive MIMO
Alex Oliveras Martınez, Patrick Eggers, Elisabeth De CarvalhoFaculty of Engineering and Science, Dept. of Electronic Systems, APNet section
Aalborg University, Aalborg, DenmarkEmail: {aom,pe,edc}@es.aau.dk
Abstract—This paper introduces three key features ingeometry-based stochastic channel models in order to includemassive MIMO channels. Those key features consists of multi-user (MU) consistency, non-stationarities across the base stationarray and inclusion of spherical wave modelling. To ensure MUconsistency, we introduce the concept of “user aura”, whichis a circle around the user with radius defined according tothe stationarity interval. The overlap between auras determinesthe share of common clusters among users. To model non-stationarities across a massive array, sub-arrays are defined forwhich clusters are independently generated. At last, we describea procedure to incorporate spherical wave modelling, where acluster focal point is defined to account for distance betweenuser and cluster.
I. INTRODUCTION
In a massive MIMO (Multiple-Input Multiple-Output) sys-tem, the base station is equipped with a very large number ofantenna elements and serves multiple users in the same time-frequency resource [1]. Under certain favorable propagationconditions (e.g. [2]), fast fading and uncorrelated noise at thereceiver vanish, bringing huge gains in throughput, reliabilityand energy efficiency [3]. Massive MIMO is considered a keytechnology for the development of 5G [4].
The characteristics of the massive MIMO channel bringsome challenges for inclusion in the existing geometry-basedstochastic channel models (GSCM). The existing GSCM canbe divided into two groups. We name them Winner-typeand COST-type. The first ones are the main focus of thiswork and examples are the 3GPP spatial channel model(SCM), extended SCM (SCME) [5], Winner (WIM1), WinnerII (WIM2) [6], Winner+ (WIM+) and QuaDRiGa [7]. Theirmain characteristic consists of the definition of the scatterersbased on the angles of departure and angles of arrival, i.e.terminal perspective. On the other hand COST-type GSCM [8]defines the physical position of the scatterers in the simulationarea.
Existing work proposes an extension of COST-type GSCMfor massive MIMO [9]. The COST-type GSCM channel mod-els defines the physical position of the scatterers, not directlyangles of departure or arrival as seen from terminal. Conse-quently, it is difficult to extract parameters for the COST modelusing measurements (contrary to the case of the Winner typeGSCM channel model). Those reasons explain why Winner-type GSCM is currently more widespread and is the preferredcandidate for 5G channel modelling in standardization efforts.
One major drawback of Winner-type GSCM is that it doesnot support multi-user (MU) consistency. MU consistencyrefers to the generation of channels for each users that areconsistent with the distance between users in terms of observedclusters and their correlation. Winner-type GSCM fails torepresent scenarios where the users are in close proximity,as the channels are generated independently for each user,regardless of the distance between users. As the performanceof massive MIMO is related to the user channel vectorsorthogonality [2], Winner-type GSCM models results in over-optimistic performance.
With the increase in the number of antennas, the size ofthe arrays also increases. Although compact array designsare desirable for operators, some papers argue that the realadvantages of massive MIMO appear when the size of thearray become large [10]. Non-stationarities have been ob-served in measurements [10], [11] for large but also compactarrays [10], so that it would appear that even for compactarrays, it becomes important to model non-stationarities. Thenon-stationarities are of different nature: the power can vary,the directions of departure/arrival varies, different parts of thearray see different clusters, etc.
Winner-type GSCM define the clusters by their angles ofdeparture and angles of arrival and rely on a planar wave ap-proximation. When the array becomes larger or the clusters areat close proximity to the users, the planar wave approximationbecomes inexact calling for a spherical wave modelling and amodification of Winner-type GSCM models.
The present study proposes solutions to extend Winner-typeGSCM to include MU consistency, non-stationarities acrossthe base station array and spherical wave modelling. Weintroduce the concept of “aura” associated to each user, whichis a circle centered on the user with radius defined by thestationarity interval. When users are at close proximity, theirauras overlap and the overlapping surface defines the commonclusters shared among users. An example is presented in Fig. 1.We propose an algorithm to compute the number of clustersto be shared among pairs of users, then groups of multipleusers. As a pre-step, an algorithm to divide the users intoconnected groups is used to increase the speed of the process.The large scale parameters (LSP) of one of the users sharingthe cluster are used to compute the parameters of the cluster.Finally the cluster parameters are shared with the other userssharing the cluster. Then the parameters or the position of the
arX
iv:1
609.
0563
9v1
[cs
.IT
] 1
9 Se
p 20
16

Fig. 1. Left: Existing GSCM with independent clusters for users closelylocated. Right: Proposed extension with multiuser consistency where closelylocated users have common clusters
clusters (depending on the distance between user and cluster)is recalculated according to the position of the new user.
To account for non-stationarity effects, the base station isdivided into sub-arrays with size defined by the stationaritydistance (i.e. correlation or coherence distance with regard tovisible clusters). Different realizations of the LSP at each sub-array are used to generate the clusters.
Spherical wave modeling, (similarly to QuaDRiGa’s driftingprocedure [7]) supports near field clusters at the base stationside, by fixing focal points derived from the delays and anglesof the clusters.
This work uses QuaDRiGa, a Winner-type GSCM, as areference model on top of which to build the proposedextensions. However the ideas in the paper can also be appliedto other Winner-type GSCM.
II. DEFINITION OF BASIC CONCEPTS
A. Segments
From WIM1 onwards the trajectory of the users is dividedinto smaller segments. These segments are defined such as theLSP of the channel remain constant (i.e. the segment lengthequals the stationarity interval). Therefore the number of clus-ters that each user has and the correspondent parameters canonly change segment wise. This paper proposes an algorithmthat checks the relative position of the users at the beginningof each segment and defines the number of common clusterfor the rest of the segment. The proposed extension of theGSCM can only be applied if the user segment transitions aresynchronized.
B. Clusters
In GSCM, physical objects are modeled as scatterers wherethe transmitted waves are reflected. These scatterers are di-vided into groups according to their delay and angle ofdeparture or arrival, forming clusters. Each cluster is composedby 20 scatterers. The angles of the scatterers are samples of aLaplacian function, as shown in Fig. 2. The parameters of theclusters of each user define the channel properties of that user.The proposed extension proposes to share some of the clustersbetween users that are near to each other to achieve the desiredmultiuser consistency. The number of shared clusters is relatedto the distance between users, but which clusters are sharedcan vary according to the implementation.
Fig. 2. Angular representation of the clusters in Winner-type GSCM. TheAoA defines the mean angle of the cluster and the angles of the scatters havea deterministic offset from this angle. All the scatterers in the cluster havethe same delay (Not represented in this figure)
Common Cluster
Common Clusterabababababababab
1
2
3
4
5
6
7
8
Users
0 50 100 150
Angles [deg]
-165
-160
-155
-150
-145
-140
dB
Fig. 3. Common cluster observed between user 1 and 3 in an indoor NLoSscenario. Red dots mark the angle of maximum power
The common clusters between users have been observed ina massive MIMO channel measurement described in [10]. Dueto lack of space the measurement campaign is not describedhere (for detail see [10]). In the measurement campaignthe base station array has 64 elements divided in sets of 8elements. There are 8 users holding a handset with 2 elementscalled a and b. The angle of arrival is estimated using steering-vector beamforming at each set of 8 elements. The 8 elementset has a 13◦ −3 dB beamwidth and max. sidelobe level of−14.7 dB. We focus on the maximum power cluster to avoida misinterpretation of the side lobes. This cluster is markedwith a red dot. In Fig. 3 the power angular spectrum for the 8users in a non-Line-of-Sight scenario (called S-NLoS in [10])is presented. Fig. 3 shows that user 1 and user 3 separated2.2m have a cluster at 104◦ and 110◦ respectively. Due to the13◦ resolution of the beamforming this can be considered acommon cluster.
C. User aura
Where COST-type GSCM provide natural cluster sharing asit is cluster centric, the Winner-type GSCM are user centric.Despite QuaDRiGa made a mapping of the parameters to
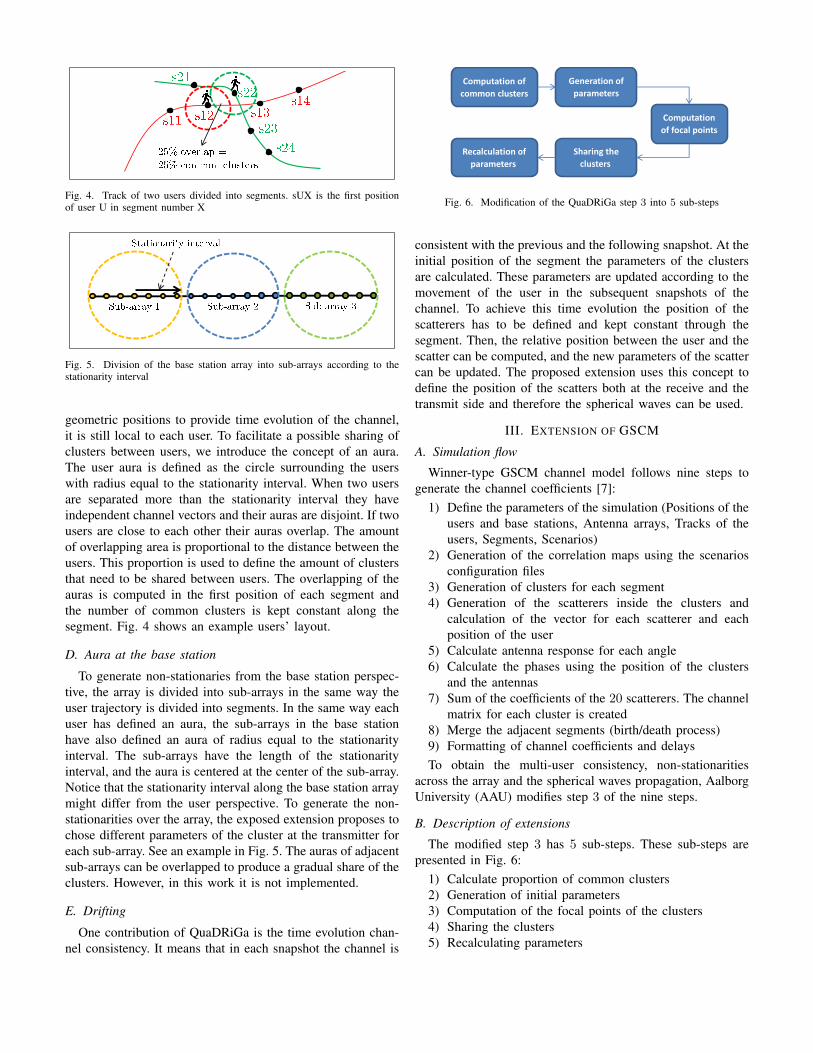
Fig. 4. Track of two users divided into segments. sUX is the first positionof user U in segment number X
Fig. 5. Division of the base station array into sub-arrays according to thestationarity interval
geometric positions to provide time evolution of the channel,it is still local to each user. To facilitate a possible sharing ofclusters between users, we introduce the concept of an aura.The user aura is defined as the circle surrounding the userswith radius equal to the stationarity interval. When two usersare separated more than the stationarity interval they haveindependent channel vectors and their auras are disjoint. If twousers are close to each other their auras overlap. The amountof overlapping area is proportional to the distance between theusers. This proportion is used to define the amount of clustersthat need to be shared between users. The overlapping of theauras is computed in the first position of each segment andthe number of common clusters is kept constant along thesegment. Fig. 4 shows an example users’ layout.
D. Aura at the base station
To generate non-stationaries from the base station perspec-tive, the array is divided into sub-arrays in the same way theuser trajectory is divided into segments. In the same way eachuser has defined an aura, the sub-arrays in the base stationhave also defined an aura of radius equal to the stationarityinterval. The sub-arrays have the length of the stationarityinterval, and the aura is centered at the center of the sub-array.Notice that the stationarity interval along the base station arraymight differ from the user perspective. To generate the non-stationarities over the array, the exposed extension proposes tochose different parameters of the cluster at the transmitter foreach sub-array. See an example in Fig. 5. The auras of adjacentsub-arrays can be overlapped to produce a gradual share of theclusters. However, in this work it is not implemented.
E. Drifting
One contribution of QuaDRiGa is the time evolution chan-nel consistency. It means that in each snapshot the channel is
Computation of
common clusters
Generation of
parameters
Computation
of focal points
Sharing the
clusters
Recalculation of
parameters
Fig. 6. Modification of the QuaDRiGa step 3 into 5 sub-steps
consistent with the previous and the following snapshot. At theinitial position of the segment the parameters of the clustersare calculated. These parameters are updated according to themovement of the user in the subsequent snapshots of thechannel. To achieve this time evolution the position of thescatterers has to be defined and kept constant through thesegment. Then, the relative position between the user and thescatter can be computed, and the new parameters of the scattercan be updated. The proposed extension uses this concept todefine the position of the scatters both at the receive and thetransmit side and therefore the spherical waves can be used.
III. EXTENSION OF GSCM
A. Simulation flow
Winner-type GSCM channel model follows nine steps togenerate the channel coefficients [7]:
1) Define the parameters of the simulation (Positions of theusers and base stations, Antenna arrays, Tracks of theusers, Segments, Scenarios)
2) Generation of the correlation maps using the scenariosconfiguration files
3) Generation of clusters for each segment4) Generation of the scatterers inside the clusters and
calculation of the vector for each scatterer and eachposition of the user
5) Calculate antenna response for each angle6) Calculate the phases using the position of the clusters
and the antennas7) Sum of the coefficients of the 20 scatterers. The channel
matrix for each cluster is created8) Merge the adjacent segments (birth/death process)9) Formatting of channel coefficients and delaysTo obtain the multi-user consistency, non-stationarities
across the array and the spherical waves propagation, AalborgUniversity (AAU) modifies step 3 of the nine steps.
B. Description of extensions
The modified step 3 has 5 sub-steps. These sub-steps arepresented in Fig. 6:
1) Calculate proportion of common clusters2) Generation of initial parameters3) Computation of the focal points of the clusters4) Sharing the clusters5) Recalculating parameters

Fig. 7. Simulation layout with six users converted into a graph and an edgesdescription
C. Calculate proportion of common clusters
The proposed solution uses a simple preprocessing algo-rithm and an algorithm designed by AAU to compute thenumber of common cluster between users depending on theirproximity. These algorithms are simple to implement. We wantto remark that an algorithm for computing the overlappingof circles with exact precision already exist in [12]. Theimplementation of such algorithm can be complex and the pro-cessing time long. The accuracy provided by such algorithmis not necessary. Therefore we develop a simplified method.
First there is a preprocessing of the layout to cluster theusers in connectivity groups. This algorithm makes groups ofusers whose auras are overlapping [13]. This step is necessaryto increase the efficiency of the algorithm to compute thenumber of common clusters. This algorithm uses graph theoryto find connected components. Each user is represented asa vertex of the graph. If the distance between two users issmaller than the sum of its radius their auras are overlappingand there is an edge between the two vertices representing thetwo users. An example can be seen in Fig. 7. The algorithmperforms a deep search on each connected component. Eachnew vertex reached is marked. When no more vertices canbe reached along edges from marked vertices, a connectedcomponent has been found. An unmarked vertex is thenselected, and the process is repeated until the entire graph isexplored. This algorithm requires memory space linear withmax(V,E), and time linear with max(V,E). Where V is thenumber of vertices (i.e. users in the layout) and E is thenumber of edges of the graph (i.e. overlapping auras in thelayout).
The algorithm to compute the common clusters is designedby AAU and it is based on finding the mean distance of thegroups of users to the centroid of the groups. Then using alinear relationship (or another relationship) this distance givesa proportion of clusters to be shared among the group ofusers. This procedure is repeated for groups of two, three,four, etc. users until the maximum is reached. This algorithmis presented in Algorithm 1 and Fig. 8 shows an example.
In the previous algorithm the centroid of the group of users(i.e. m) is computed as,
m =(x1, y1, z1) + · · ·+ (xN , yN , zN )
N(1)
where (xn, yn, zn) is the position of user n in Cartesiancoordinates (lets call it Posn).
foreach group of N users (N ∈ {1, ...,max(users)}) doif N = 1 then
proportion of clusters for the individual users= 1;
elsefind centroid of the group of users: m;if (all distances to m)<R then
find mean distance to m: md;proportion of clusters = −md
R + 1: p;subtract p
N−1 from the groups containingN − 1 users;
elsethe users with (distance to m)>R are too faraway and no clusters are shared in this group;
endend
endAlgorithm 1: Compute the number of common clusters
Pos1=(x1,y1,z1)
Pos2=(x2,y2,z2)
m
Pos1
Pos2 Pos3 Pos3
m m
Fig. 8. Example of the clustering algorithm for groups of 2 users (N = 2).User 1 in green, user 2 in red and user 3 in blue
Compute the distances from the users to the centroid andfind if the auras are overlapping using:
‖m− Posn‖ < R (2)
To compute the mean distance of the group of users to thecentroid use:
md =‖m− Pos1‖+ · · ·+ ‖m− PosN‖
N(3)
The proportion of clusters to share corresponds to a linearrelationship with the mean distance to the centroid (proportionof clusters p = −md
R +1). This linear function has been chosenfor its simplicity. However, empirically derived cluster sharingfunctions can easily be substituted here.
After the explained algorithm, each user has a proportionof individual clusters and each intersection of auras has aproportion of common clusters. Knowing the proportion ofclusters to share and the total number of clusters, each userand group of users is assigned with a number of clusters asseen in Fig. 9. Notice that the parameters defining each cluster(i.e. angles, delay, position) have not been computed yet. Theclusters are only defined by its number, and the parametersare computed in the following sub-step.

𝑈1 = 𝐶1, 𝐶2, 𝐶3, 𝐶4
𝑈2 = 𝐶5, 𝐶6, 𝐶7
𝑈3 = 𝐶8, 𝐶9, 𝐶10
𝑈1 𝑎𝑛𝑑 𝑈2 = 𝐶11
𝑈1 𝑎𝑛𝑑 𝑈3 = 𝐶12
𝑈2 𝑎𝑛𝑑 𝑈3 = 𝐶13, 𝐶14
𝑈1, 𝑈2 𝑎𝑛𝑑 𝑈3 = 𝐶15
= 𝑈1
= 𝑈2
= 𝑈3
𝑈𝑥 𝑎𝑛𝑑 𝑈𝑦 = 𝐶𝑧
Fig. 9. Example of the clustering algorithm with 7 clusters (C) per user(U).First compute the proportion of common clusters for each group, then computethe number of clusters and finally assign a set of cluster names
D. Generation of initial parameters
The initial delays, powers and angles (i.e. azimuth ofdeparture and arrival, elevation of departure and arrival) aregenerated for each cluster (Cx) in each segment follow-ing QuaDRiGa’s procedure explained in [7]. To create non-stationarities across the array, we modify this procedure tohave one azimuth angle and one elevation angle of departurefor each sub-array. There are 4 + 2A parameters for eachcluster (being A the number of sub-arrays). This procedureuses user (Ux) specific parameters (drawn from the largescale parameter maps) to generate the cluster parameters. Ifthe cluster belongs only to one user (e.g. C3 in Fig. 9) theparameters of that user are used to generate the cluster. On theother hand if the cluster belongs to more than one user (e.g.C11 in Fig. 9) one of the users is picked to use its parameters togenerate the cluster. We propose to pick the users randomlywith a uniform distribution, but other methods are possible.The values of the departure angles are drawn independentlyfor each sub-array.
E. Computation of the focal points of user side clusters
QuaDRiGa’s drifting procedure determines the position ofthe Last Bounce Scatterer (LBS) and keeps it fixed during thewhole segment, [7], global step 4. In this sub-step only thefirst part of the QuaDRiGa’s drifting procedure is used to findthe focal point of the LBS and add it to the table of parametersfor each cluster. Even if the cluster belongs to more than oneuser (e.g. C11 in Fig. 9) the focal point is referenced to theuser used to generate the parameters of the cluster.
Then it is necessary to find the focal point at the transmitterside. We call the focal point at the transmit side First BounceScatterer (FBS) analogous to the QuaDRiGa nomenclature.We propose to use the same procedure used by QuaDRiGa tofind the focal point of the clusters at the transmit side. Next
we explain how to adapt their procedure to the transmit side.Fig. 10 shows the parameters used.
First the total length (from transmitter, to cluster, to receiver)is obtained from the delay,
dc = τcc0 + |r0,a,k| (4)
where |r0,a,k| is the distance between sub-array a and user k(i.e. ||APosa−Posk,s||, where APosa is the central positionof the sub-array a and Posk,s is the first position of the user kin the segment s), τc is the excess delay and c0 is the speed oflight. Then the departure angles of the cluster are convertedinto Cartesian coordinates. ec,a,s is the vector defining thedirection of the cluster c of sub-array a at segment s.fc,a,s defines the vector from the user to the cluster. Consid-
ering the triangle with vertices at the center of the sub-array,at the user position, and at the focal point of the cluster, andusing the cosine theorem we can compute the distance fromthe sub-array to the cluster.
f2c,a,s = |r0,a,k|2 + |ec,a,s|2 − 2|r0,a,k||ec,a,s|cos(βc,a,s) (5)
(dc−|ec,a,s|)2 = |r0,a,k|2+|ec,a,s|2+2|ec,a,s|rT0,a,kec,a,s (6)
|ec,a,s| =d2c − |r0,a,k|2
2(dcrT0,a,kec,a,s)(7)
The vector from the transmitter position to the focal pointof the cluster at the transmit side is,
ec,a,s = |ec,a,s|ec,a,s (8)
And using this vector and the position of the transmit arraywe can find the position of the focal point of the cluster at thetransmit side (FBS) as
BCPosc,a,s = ec,a,s +APosa (9)
After adding the focal points, the clusters have 5+3Aparameters in their tables (i.e. power, delay, azimuth of arrival,elevation of arrival, focal point at receiver and for each sub-array: azimuth of departure, elevation of departure and focalpoint at transmitter).
F. Sharing the clusters
In sub-step III-C we showed that each cluster could havemore than one owner, but in sub-step III-D the parameters ofonly one user have been used to generate the cluster. In thissub-step the clusters are shared with the other users that theybelong to, according to the results of III-C. In other words, theclusters and their generated parameters are duplicated to theparameter tables of the corresponding users. See an examplein Fig. 11.

𝐵𝐶𝑃𝑜𝑠𝑐,𝑎,𝑠
𝐴𝑃𝑜𝑠𝑎 𝑃𝑜𝑠𝑘,𝑠
𝑟0
Fig. 10. Computation of the focal point of the cluster at the transmitter side
𝐺𝑟𝑜𝑢𝑝{𝑈1} = 𝐶1, 𝐶2, 𝐶3, 𝐶4
𝐺𝑟𝑜𝑢𝑝{𝑈2} = 𝐶5, 𝐶6, 𝐶7
𝐺𝑟𝑜𝑢𝑝{𝑈3} = 𝐶8, 𝐶9, 𝐶10
𝐺𝑟𝑜𝑢𝑝{𝑈1, 𝑈2} = 𝐶11
𝐺𝑟𝑜𝑢𝑝{𝑈1, 𝑈3} = 𝐶12
𝐺𝑟𝑜𝑢𝑝{𝑈2, 𝑈3} = 𝐶13, 𝐶14
𝐺𝑟𝑜𝑢𝑝{𝑈1, 𝑈2, 𝑈3} = 𝐶15
𝑈1 = 𝐶1, 𝐶2, 𝐶3, 𝐶4, 𝐶11, 𝐶12, 𝐶15
𝑈2 = 𝐶5, 𝐶6, 𝐶7, 𝐶11, 𝐶13, 𝐶14, 𝐶15
𝑈3 = 𝐶8, 𝐶9, 𝐶10, 𝐶12, 𝐶13, 𝐶14, 𝐶15
Fig. 11. Example of the cluster sharing
Fig. 12. If the cluster is near to the users to share the parameters can resultin very different clusters (right). It is better to share the focal point (left)
G. Recalculating parameters
As some clusters have been generated using the parametersof one user, but after sub-step III-F they have been sharedwith another user, it is necessary to recalculate the parametersfor the new user. The reason is because the focal point of thecluster has been calculated using the angles and positions ofone user, but the position of the other user can be different.There are two options to recalculate the parameters, bothshown in Fig. 12. The first option is to keep the sameparameters generated in sub-step 3 and recalculate the twofocal points of the cluster for the new user. The second optionis to keep the same focal point and recalculate the otherparameters (including the angles of departure). If the clustersare far away from the users it is possible to keep the sameparameters and avoid recalculating the focal point becausethe relative position does not change very much. However,if the cluster is near the users, we have to recalculate thefocal point, else it would result in effectively different clustersfor the users. We propose that if the clusters are less than 3segment lengths away the focal point is kept and the otherparameters are recalculated. Otherwise, the opposite happens.
IV. CONCLUSION
This paper extends the framework of the existing Winner-type GSCM towards the evolution of 5G channel models formassive MIMO. Winner-type GSCM are heavily employedby the industry, so a modification is necessary to continuebuild on existing knowledge base. The paper focuses on thethree main limitations of the existing models that prevents theproper simulation of massive MIMO systems. First of all thelack of a method to model the multiuser consistency. Then,the impossibility to generate non-stationarities over the basestation array. Finally the limitation of using the planar waveapproximation. Using QuaDRiGa as a reference model, severalmodifications are proposed to overcome these limitations.
ACKNOWLEDGMENT
The research presented in this paper was partly supportedby the Danish Council for Independent Research (Det FrieForskningsrad) DFF133500273. This work was supported byHuawei Technologies Co. Ltd. (Huawei Sweden) in the frame-work of the cooperation project No. 861020.
REFERENCES
[1] T. L. Marzetta, “Noncooperative Cellular Wireless with UnlimitedNumbers of Base Station Antennas,” Wireless Communications, IEEETransactions on, vol. 9, no. 11, pp. 3590–3600, Nov. 2010.
[2] H. Q. Ngo, E. G. Larsson, and T. L. Marzetta, “Aspects of favorablepropagation in Massive MIMO,” in Signal Processing Conference (EU-SIPCO), 2014 Proceedings of the 22nd European. IEEE, 2014, pp.76–80.
[3] E. Larsson, O. Edfors, F. Tufvesson, and T. Marzetta, “Massive MIMOfor next generation wireless systems,” Communications Magazine, IEEE,vol. 52, no. 2, pp. 186–195, Feb. 2014.
[4] F. Boccardi, R. W. Heath, A. Lozano, T. L. Marzetta, and P. Popovski,“Five disruptive technology directions for 5G,” Communications Maga-zine, IEEE, vol. 52, no. 2, pp. 74–80, Feb. 2014.
[5] D. S. Baum, J. Hansen, G. D. Galdo, and M. Milojevic, “An InterimChannel Model for Beyond-3G Systems,” IEEE 61st Vehicular Technol-ogy Conference, vol. 5, pp. 3132–3136, 2005.
[6] P. Kyosti, J. Meinila, L. Hentila, X. Zhao, T. Jamsa, C. Schneider, andM. Narandzic, “WINNER II Channel Models,” D1.1.2 V1.1, 2007.
[7] S. Jaeckel, L. Raschkowski, K. Borner, and L. Thiele, “QuaDRiGa: A3-D multi-cell channel model with time evolution for enabling virtualfield trials,” IEEE Transactions on Antennas and Propagation, vol. 62,no. 6, pp. 3242–3256, 2014.
[8] L. Liu, C. Oestges, J. Poutanen, K. Haneda, P. Vainikainen, F. Quitin,F. Tufvesson, and P. Doncker, “The COST 2100 MIMO channel model,”IEEE Wireless Communications, vol. 19, no. 6, pp. 92–99, 2012.
[9] X. Gao, J. Flordelis, G. Dahman, F. Tufvesson, and O. Edfors, “Mas-sive mimo channel modeling-extension of the cost 2100 model,” inJoint NEWCOM/COST Workshop on Wireless Communications (JNCW),2015.
[10] A. O. Martinez, E. de Carvalho, and J. O. Nielsen, “Towards very largeaperture massive MIMO: A measurement based study,” in GlobecomWorkshops (GC Wkshps), 2014. IEEE, Dec. 2014, pp. 281–286.
[11] X. Gao, F. Tufvesson, O. Edfors, and F. Rusek, “Measured propagationcharacteristics for very-large MIMO at 2.6 GHz,” 2012 ConferenceRecord of the Forty Sixth Asilomar Conference on Signals, Systems andComputers (ASILOMAR), pp. 295–299, 2012.
[12] F. Librino, M. Levorato, and M. Zorzi, “An algorithmic solution forcomputing circle intersection areas and its applications to wirelesscommunications,” in Modeling and Optimization in Mobile, Ad Hoc, andWireless Networks, 2009. WiOPT 2009. 7th International Symposium on,June 2009, pp. 1–10.
[13] J. E. Hopcroft and R. E. Tarjan, “Efficient algorithms for graph manip-ulation,” Stanford, CA, USA, Tech. Rep., 1971.