Embed Size (px)
Citation preview
Geometrie Reetifieation of PCD and ST-FOC Datawith MIDASD. Baade 1, O. Ponz 2 and S. di Serego A/ighieri 1H
1 The Space Telescape European Coordinating Facility, European Southern Observatory2 European Southern Observatory
It is now about six months since ESA's Photon CountingDetector (PCD), the ground-based counterpart to the FaintObject Camera (FOG) to be flown with the Hubble SpaceTelescope, was put into operation at la Silla and madeavailable to Visiting Astronomers. There it proved to be veryreliable and, also thanks to good weather conditions, was veryproductive. By now, quite a few readers of the Messenger willbe busy analysing their own PCD observations.
The PCD owes its high sensitivity and its ability to countsingle photon events to a three-stage image intensifier whichis the technical heart of the instrument. The price to be paid isthe S-like geometrical distortion which is a typical and inevitable property of image tubes. Unlike e. g. the IPCS (Boksenberg 1972) where this distortion is corrected for in onedimension by the hardware so that the correction only needsto be done in the second coordinate, PCD (and FOG) imagesrequire abi-dimensional rectification. To this end, a regulargrid of reseaux marks are etched on the first photocathode toprovide the necessary reference points. However, they canonly be used in the direct imaging mode since only then theystand out dark against the brighter sky background. Bycontrast, in the long-slit spectroscopic mode the oppositeprinciple has to be adopted where separate calibration imageswith bright spots are obtained by observing an arc spectrumthrough a mask with aseries of equidistant holes parallel to thespectrograph slit.
So far there was no dedicated software available at ESO tocope with those special requirements of PCD data. On theother hand, the number of totally different steps necessary toreduce any kind of optical astronomical data is not all thatlarge. Owing to the modular structure of MIDAS, it mighttherefore be possible to merely adapt some existing programsfrom the growing pool of MIDAS software to this problem.
let us briefly summarize what one would like to expect fromthe solution:(1) find and identify the reseaux marks and comparison
spectrum features, respectively,(2) determine a parametrization of the geometric distortion,(3) conserve the flux on a small local scale,(4) handle undersampled data like those of some of the FOC
modes,(5) correct spectral data for geometrie distortion and non
linearity of the wavelength scale in one step in order toavoid unnecessary degradation of the data due to multiplerebinning.
The detection and identification of features which combineto a rather similar pattern as in the long-slit spectroscopicmode of the PCD is one of the major steps during the course ofthe reduction of CASPEC data (cf. MIDAS manual). In fact, inMIDAS this PCD related task can be done on the commandprocedure level by combining existing CASPEC softwaremodules (Ponz and di Serego Alighieri, in preparation). TheMIDAS TABlE system furthermore supports a two-dimen-
• Affiliated to the Astrophysics Division. Space Science Department. EuropeanSpace Agency
• On leave from Osservatorio Astronomico. Padova
sional polynomial regression analysis (so far mostly used forthe CASPEC data reduction) required for point 2 on the listabove.
Only for the rebinning a new main program had to be writtenin order to also cope with severely undersampled point spreadfunctions having a FWHM of the order of one detector element(such as in the f/48 mode of the ST-FOC, but also in groundbased PCD data obtained under exceptionally good seeingconditions). Assuming (or in more sophisticated future versions also knowing) the point spread function, the data are firsteffectively deconvolved and each input pixel subdivided into3 x 3 sub-pixels holding the result of the deconvolution.According to the prescriptions found by the two-dimensionalregression analysis, the input flux is then dropped sub-pixel bysub-pixel into the grid of again regular-sized pixels defining thegeometrically rectified (output) image.
This procedure is faster than to strictly project each subpixel onto the output grid because varying (across the image)input-to-output pixel size ratios and orientations do not permitone to define one fixed algorithm to be followed across theentire image. The trade-off is with the local flux conservationwhose accuracy obviously deteriorates with increasing size ofthe sub-pixels. For very high S/N data there is an option toreplace each sub-pixel by a number of still smaller units("substepping", no further interpolation done). Without thisadditional subdivision an image with uniform flux distributionshows after the rectification little "cracks" with an amplitude ofthe order of 1%. Their number is increased but their amplitudeis reduced by making use of the sub-stepping option. From thevarying input-to-output pixel size ratio it is clear that a smalllarge-scale modulation of the flux density must necessarily bepresent and that the quality criterion can only be the smoothness of this modulation. The penalty to be paid in terms of CPUtime for the usage of a large additional sub-stepping factor ishigh and only justified in extreme cases.
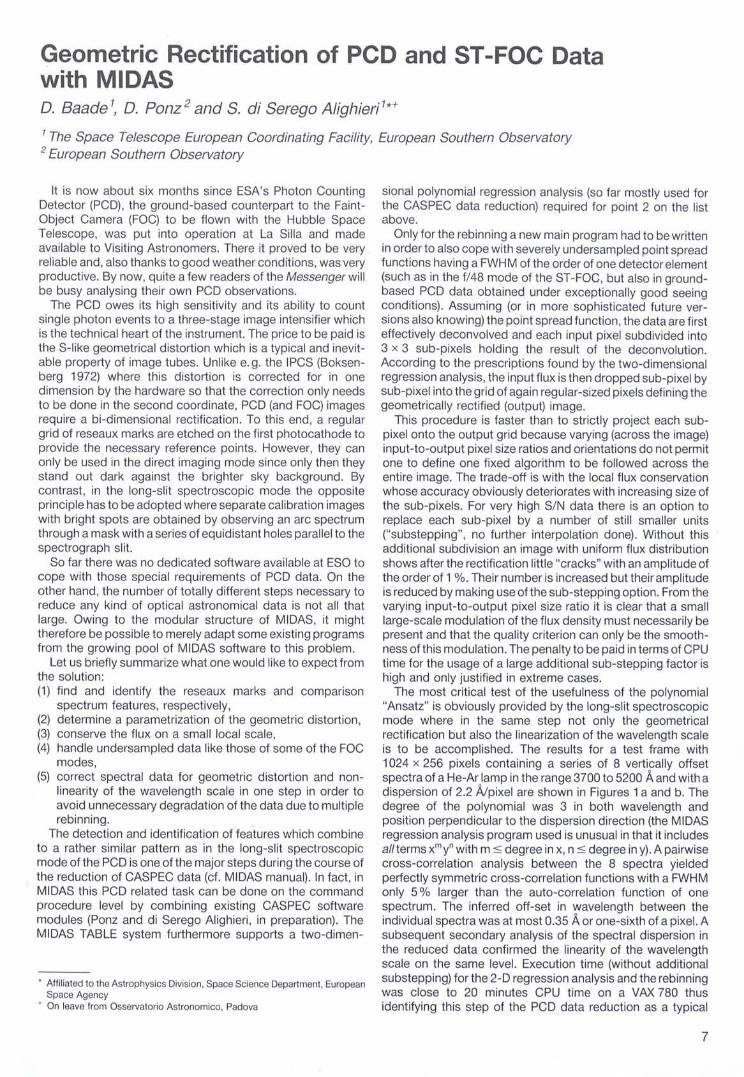
The most critical test of the usefulness of the polynomial"Ansatz" is obviously provided by the long-slit spectroscopicmode where in the same step not only the geometricalrectification but also the linearization of the wavelength scaleis to be accomplished. The results for a test frame with1024 x 256 pixels containing aseries of 8 vertically offsetspectra of a He-Ar lamp in the range 3700 to 5200 Aand with adispersion of 2.2 Älpixel are shown in Figures 1a and b. Thedegree of the polynomial was 3 in both wavelength andposition perpendicular to the dispersion direction (the MIDASregression analysis program used is unusual in that it includesal/terms xrnyn with m :5 degree in x, n:5 degree in V). A pairwisecross-correlation analysis between the 8 spectra yieldedperfectly symmetric cross-correlation functions with a FWHMonly 5 % larger than the auto-correlation function of onespectrum. The inferred off-set in wavelength between theindividual spectra was at most 0.35 Aor one-sixth of a pixel. Asubsequent secondary analysis of the spectral dispersion inthe reduced data confirmed the linearity of the wavelengthscale on the same level. Execution time (without additionalsubstepping) for the 2-D regression analysis and the rebinningwas Glose to 20 minutes CPU time on a VAX 780 thusidentifying this step of the PCD data reduction as a typical
7
0
07
'"...JW><
<>:
0
0
~
oocn
oo7
i I
.................... - .
.... , - .
" '" , '"
.. " -. '" ..
" , _ .
.- .. , .
'" .
..... ""
0.50 0.75PIXEL
o0'
o
o
'"
oo
3.50 4.00LAMBDA
r--r I
11.50 5.00RNGSIAOEM IOWJl'l3
Figures 1a and b: The positions of the stronger are lines (a) in the raw data and (b) after the simultaneous geometrieal reetifieation and rebinning towavelength. (In Figure 1a the vertieal and horizontal seales are different in order to enhanee the visibility of the distortion. The step size in y hasbeen ehanged from Figure 1a to b; this is of no relevanee.)
batch task to be executed only at night time. This can beconveniently done, since once reseaux marks and/or comparison spectra are correctly identified, no further user intervention is necessary.
We have written this short note about the reduction of PCDdata within MIDAS in order to inform PCD observers about thisnew possibility to treat their data. We furthermore believe thatit is a good example ofthe growing maturity of MIDAS becausemore and more problems can now be treated by simply usingMIDAS as a high-level problem solving language, often with-
out having to do any FORTRAN coding. After some furtherimprovements have been included, the software describedwill be available to the MIDAS users community.
ReferencesBoksenberg, A.: 1972, in Proc. ESO/CERN Workshop "Auxiliary
Instrumentation tor Large Telescopes", eds. S. Laustsen and A.Reiz, Geneva, p. 295.
di Serego Alighieri, S., Perryman, M.A. C., Macchelto, F.: 1985,Asuon.Asuophys. 149, 179.
Variations of the High Resolution Ha-line Profilesof the Very Young Stars: HR 5999 and HO 163296P. s. The and H. R. E. Tjin A Ojie, Astronomical Institute, AmsterdamC. Catala, F. Praderie and P. Felenbok, Observatoire de Paris, Meudon
Introduction
It was recognized long ago that the Ha line (6563 A) is veryimportant for the study of stellar winds in pre-main sequence(PMS) stars (Kuhi 1964). There are two reasons for this. Firstly,the Ha line is usually the most intense emission line in thevisible spectrum of PMS stars.lt is expected to be formed in anextended region of the wind, thus providing a good globalinsight tool on the structure of the wind. Secondly, the locationof the Ha line in the optical spectrum is such that this line canbe very easily observed with Reticon and CCD detectors.
Two southern emission-line stars, HR 5999 and HD 163296,drew much attention lately because these bright A-typeobjects possess most of the spectacular properties of the socalled Herbig Ae/Be stars (TM et al. 1985 a and The et al.1985 b). This class of Herbig (1960) stars was shown by Stromet al. (1972) to consist of younger than main-sequence objects.
8
In the present short communication the remarkable variations of the Ha profile in HR 5999 during a space/groundbased coordinated campaign in September 1983, and atother epochs, will be discussed. The emission line star HD163296, originally intended as a comparison star, was alsoobserved at the same observing runs as HR 5999; its Haprofile variation will be shown as weil. Suggestions for aninterpretation of the Ha-Iine formation are then presented.
Some Properties 01 the Ha fine in PMS Stars
Finkenzeller and Mundt (1984) have surveyed 57 candidateHerbig Ae/Be stars in the line of Ha, Nal D and Hel)"5876. Theyconclude that the Herbig Ae/Be stars can be devided in 3subclasses according to the shape of the Ha-Iine profile: (1)with a double peak, comprising 50 % of the whole sampie; (2)with a single peak (25 %), and (3) with a P Cygni profile (20 %).
A similar survey was reported for T Tauri stars by Kuhi
![건설철강 주식회사 를 midas Gen / FEA 제안서 · 2018-04-05 · 5. midas FEA [ 사용자 인터페이스] [ 기하형상 모델링] midas Gen / Gen midas FEA [ 후처리](https://img.dokumen.tips/doc/110x75/5f4e6ff8b6f9633f2c3bc686/ee-oe-e-midas-gen-fea-oeoe-2018-04-05-5-midas-fea.jpg)


![midas DShop Auto-drafting Module for midas Gen 01 02admin.midasuser.com/UploadFiles2/84/Dshop_catalog.pdf · Auto-drafting Module for midas Gen [midas Gen Design Results] [midas DShop](https://img.dokumen.tips/doc/110x75/5ade06cd7f8b9a9a768db6e7/midas-dshop-auto-drafting-module-for-midas-gen-01-module-for-midas-gen-midas-gen.jpg)