Embed Size (px)
Citation preview

Geometric, Topological & Semantic Analysis of Multi-Building Floor Plan Data
by
Emily J. Whiting
B.A.Sc. Engineering Science University of Toronto, 2004
SUBMITTED TO THE DEPARTMENT OF ARCHITECTURE IN PARTIAL FULFILLMENT OF THE REQUIREMENTS FOR THE
DEGREE OF
MASTER OF SCIENCE IN ARCHITECTURAL STUDIES AT THE
MASSACHUSETTS INSTITUTE OF TECHNOLOGY
MAY 2006
© 2006 Emily J. Whiting. All rights reserved.
The author hereby grants to MIT permission to reproduce and to distribute publicly paper and electronic copies of this thesis document in whole or in part in any medium now known or
hereafter created.
Signature of Author: Department of Architecture
May 25, 2006
Certified by: Seth Teller
Associate Professor of Electrical Engineering & Computer Science Thesis Supervisor
Certified by:
Takehiko Nagakura Associate Professor of Architecture
Thesis Co-Supervisor
Accepted by: Julian Beinart
Professor of Architecture Chairman, Department Committee on Graduate Students

2 Geometric, topological & semantic analysis of multi-building floor plan data
Axel Kilian
Post-Doctoral Associate in Computation, Department of Architecture Thesis Reader

3 Geometric, topological & semantic analysis of multi-building floor plan data
Geometric, Topological & Semantic
Analysis of Multi-Building Floor Plan Data
by
Emily J. Whiting
Submitted to the Department of Architecture on May 25, 2006 in Partial Fulfillment of the Requirements for the Degree of Master of Science in Architectural Studies.
ABSTRACT Generating a comprehensive model of a university campus or other large urban space is a challenging undertaking due to the size, geometric complexity, and levels of rich semantic information contained in inhabited environments. This thesis presents a framework for constructing a topological representation of large environments from labeled floor plan geometry. An exhaustive classification of adjacency types is provided for a university infrastructure including roads, walkways, green-space, and the detailed interior spaces of campus buildings. A prototype application has been developed that provides custom routes on the MIT campus using the proposed data framework. The application is designed to assist campus visitors in finding their way from one location to another, with the additional ability of specifying route constraints. We provide an interface for collaborative tagging of geographical locations on the MIT campus, designed for interfacing with users to collect semantic data. The database will serve as a collective record of the public’s knowledge of campus. The main motivation of this work is to develop an intuitive, human-centered approach to navigation systems. This thesis presents an application for generating efficient routes between locations on MIT’s campus with coverage of both interior and exterior environments. A second application, the MIT WikiMap, aims to generate a more expressive record of campus spaces by drawing from the knowledge of its inhabitants.
Thesis supervisor: Seth Teller Title: Associate Professor of Electrical Engineering & Computer Science

4 Geometric, topological & semantic analysis of multi-building floor plan data
Acknowledgements
First I would like to thank my thesis supervisor, Professor Seth Teller, for making this project possible. His support, clarity of mind, and infinite well of ideas … To my thesis co-supervisor Professor Takehiko Nagakura I owe my gratitude for it is through his research that I entered the Computation and Design field. Professor Terry Knight has given me every encouragement. Without it I would have gone on a less challenging path. I thank my reader, Axel Kilian, for his constructive feedback and many comments that brought new perspectives and depth to my thesis. Yoni Battat, my two fellow student on the BMG project, ... The WikiMap was developed as a project for 6.831: User Interface Design & Implementation instructed by Professor Rob Miller. My two project partners Grayson Giovine and Will Stoltzman were invaluable for their expertise in PHP, databases and their willingness to spend countless nights discussing tack minutiae (although it was a push-pin all along). I would like to end by thanking my parents, who have provided unconditional support and love from Dundas, Ontario.
5 Geometric, topological & semantic analysis of multi-building floor plan data
Table of Contents
1 Introduction 1.1 Motivation 1.2 Contributions 1.3 Related Work 1.4 Background
1.4.1 Building Model Generation Project 1.4.1.1 Overview 1.4.1.2 Floor Plan Data 1.4.1.3 Basemap 1.4.1.4 Location Server
1.4.2 Core Data Structures & Algorithms 1.4.2.1 Out-of-Core Graphs 1.4.2.2 Dijkstra’s Graph Search Algorithm 1.4.2.3 Medial Axis 1.4.2.4 Constrained Delaunay Triangulation
1.5 System Design Considerations 2 Campus Data Corpus
2.1 Data Representation 2.1.1 Introduction 2.1.2 Spatial Hierarchy 2.1.3 Floors 2.1.4 Spaces 2.1.5 Portals
2.1.5.1 Vertical Portals 2.1.5.2 Horizontal Portals
2.1.6 Space-Portal Graph 2.1.7 Landmarks
2.2 Generating Campus Topology Data 2.2.1 Introduction 2.2.2 Portal Populating Agents 2.2.3 Intra-Floor Portals 2.2.4 Inter-Floor Portals 2.2.5 Mezzanines in Inter-Floor Connections 2.2.6 Inter-Building Portals 2.2.7 Dangling Portals 2.2.8 Intra-Basemap Portals 2.2.9 Summary 2.2.10 Remaining Challenges
3 MIT Route Finder 3.1 Introduction 3.2 User Interface
3.2.1 Route Visualization 3.2.2 Route Queries
3.3 Implementation

6 Geometric, topological & semantic analysis of multi-building floor plan data
3.3.1 Inter-Space Path Finding 3.3.2 Intra-Space Path Finding 3.3.3 Route Optimizations 3.3.4 Path Relaxation 3.3.5 Route Constraints
3.4 Results & Discussion 3.4.1 Route Optimizations 3.4.2 Medial Axis & Path Relaxation 3.4.3 Robustness & Space Geometry 3.4.4 Path discontinuities
4 MIT WikiMap 4.1 Introduction 4.2 Motivation 4.3 User Interface Design
4.3.1 Browsing 4.3.2 Adding a New Landmark 4.3.3 Displaying Added Items 4.3.4 Editing Landmarks 4.3.5 Deterring Vandalism 4.3.6 System Information
4.4 Implementation 4.4.1 Languages 4.4.2 Database 4.4.3 User Information 4.4.4 Coordinate Locators 4.4.5 Saving Item Edits 4.4.6 Item State
4.5 User Testing 4.5.1 Procedure 4.5.2 Results
4.6 Discussion 5 Conclusions & Future Work
5.1 Future Work 5.1.1 Landmark Salience
• Visual Salience • Structural Salience
5.1.2 Route Preferences 5.1.3 Route Visualization
5.2 Conclusions Bibliography A Project Build Instructions
B Portal & Space Types

7 Geometric, topological & semantic analysis of multi-building floor plan data
1 Introduction
1.1 Motivation Navigation tasks are essential to any environment involving movement through complex spaces. The recent developments of online mapping tools such as Google Maps® and Mapquest® have made available interactive geographic visualization tools with comprehensive route searching functions. However, these applications are targeted primarily at travel on the resolution of street networks at the speed of automobiles. Their comprehensive survey of highways, traffic intersections and neighborhood streets overlook local details, which may be important navigational cues to travelers on foot. Using MIT campus as a test-bed, this thesis presents a system for modeling geospatial features of built environments at the scale of the walking traveler. Methods for analyzing the environment aim to extract an exhaustive set of geometric, topological and semantic properties of space. Geometric features encapsulate the physical characteristics of space such as coordinates and containment properties. For example rooms have a set of dimensions describing their boundaries and a floor in which they are contained. Topological features represent adjacency relationships between spaces, such as doors that connect a hallway to a classroom, or elevators that afford vertical movement through a building. Lastly, semantic features capture the various meanings of space (e.g. functional, historic or cultural), which are not expressed through geometric and topological relationships. For example, a specific building may function as a concert hall, student services center, or research laboratories. A certain area of a building may be a classroom, office, or cafe.
The main motivation of this work is to develop an intuitive, human-centered approach to navigation systems. This thesis presents an application for generating efficient routes between locations on MIT’s campus with coverage of both interior and exterior environments. A second application, the MIT WikiMap, aims to generate a more expressive record of campus spaces by drawing from the knowledge of its inhabitants.

8 Geometric, topological & semantic analysis of multi-building floor plan data
We offer a searchable and user-populated database, allowing visitors to find "points of interest" on campus, and how to locate them. Specifically, the work in this thesis aims to make possible the following scenarios:
a) A new student at MIT needs to get to class but is bewildered by the numbering system of buildings on campus. In a web form, he enters his residence Westgate as the start location, and the lecture hall 1-190 as the destination. As he types, Westgate is automatically interpreted as W85. He submits his query and is presented with a route displayed on the campus map directing him along Amherst Alley and through Building 1, as seen in Figure 1-1.
b) A visitor to MIT has an appointment at the Media Lab. When
submitting her route query she also chooses to display locations of sculptures and paintings on the map. Discovering that her route through Lobby 10 passes by Killian Court, she takes note to stop and see the Henry Moore sculpture.
c) It’s 12:15 PM, and an undergrad student is about to bike to
campus for her 1 PM class in 10-250. In the time before class, she would also like to grab lunch. Using MIT WikiMap, she clicks to display all bike rack and quick food locations. Zooming into the area around Building 10, she quickly finds a place nearby to lock her bike, and notes the Building 4 café as the closest place to eat.
Fig.1-1: A sample route from Westgate to lecture room 1-190.

9 Geometric, topological & semantic analysis of multi-building floor plan data
1.2 Contributions This thesis makes the following contributions: • Framework for constructing graphs of large environments from floor
plan data, including an exhaustive classification of portal types for both building interiors and building interfaces.
• User interface for interactive map application: database for storing, editing, and visualizing campus landmarks.
• Substantial improvements to the Location-Aware API developed by [Nichols 2004], including performance optimizations in route generation, and improvements to path rendering methods for route visualization.
• Re-implementation of space triangulation – more robust formatting of output data, and structured as isolated process in pipeline rather than embedded in “stew” of geometry processing.
• Approximated medial axis derived from space triangulation, with applications to intra-space path finding.
• Proposals for identifying landmarks based on properties of the campus topology and geometry.
1.3 Related Work Substantial work has been done on digitizing road maps such as [Haunert and Sester 2004] and [Gold 1997]. However, extraction of a link-node graph representation for street networks is a clearly defined problem considering the common geometric properties of roads: streets have standard width, a single direction of motion, and intersections can be modeled as a point. Further, centerline maps are often available which obviate the need for simplifying road contours into a 1-D representation. In contrast, walkers in urban environments are not limited to movement along one-dimensional paths. Instead of point intersections, pathways may meet at a courtyard or lobby. Pedestrians can move freely from interior to exterior space, and take short cuts across fields. Online mapping services such as Google Maps® and Mapquest® fail to model these more diverse environments, as seen by the empty space covering MIT campus in Figure 1-2.
Fig.1-2: Example of route through the city of Cambridge generated by Google Maps. Coverage of paths through the MIT campus is sparse.

10 Geometric, topological & semantic analysis of multi-building floor plan data
A sophisticated example of route generation for indoor environments is the MIT Stata Walking Guide [Look et al. 2005]. The Stata Walking Guide provides both graphical route maps and written walking directions between different locations in MIT's Stata Center. The data model incorporates not just metric distances but higher-level concepts such as the functional purpose of a place, which are then incorporated as landmarks in the written directions (see Fig. 1-3). “Head out of G494 and Turn right. You will see a set of double doors on your left; walk towards it. Walk through the doorway into a new area (4th Floor Gates). Walk forward. You will pass the Elevator Lobby on your right along the way. Turn right. Walk through the doorway into a new area (4G Kitchenette).
--------------- Turn right, then left, and go straight down the hall through the doors and past the elevators. Go through the first door on your right. [2]”
What’s missing in the Stata system is an automated process for constructing the underlying data model. Manual methods are used to build the graph for the route-finding component, as well as for landmark identification and collection of other high-level information (e.g. waypoints belonging to the same corridor). These methods are clearly labor-intensive and intractable for extension to all buildings on the MIT campus. The methods proposed in this thesis could fill an important niche, offering a streamlined process from floor plan data to high-level route descriptions. Other projects have addressed the problem of automatic graph construction from floor plans. However, in examples such as [Lee 2004], the topological model is derived from hallway elements which share the convenient property of street networks: movement is straight and linear, with constant width between opposing boundaries (e.g. walls). Still lacking is a system that robustly generates topology from arbitrarily shaped spaces and varied connectivity types present in raw floor plan data. Further, existing systems apply only to networks within an enclosed building, and do not consider graphs between buildings, spanning outdoor terrain.
Fig.1-3: Stata Walking Guide: output consisting of graphical route map and written instructions [Look et al 2005].

11 Geometric, topological & semantic analysis of multi-building floor plan data
1.4 Background This section provides background material relevant to this thesis, including work by members of the MIT Building Model Generation (BMG) group. The Location Aware API developed by Nichols [2004] and Bell [2003] is reviewed, and subsequent modifications made to the API are discussed. A review of algorithms used in route-finding and geometric computations is also presented, including a brief discussion of Dijkstra’s graph search algorithm, constrained Delaunay triangulation, and the medial axis transform.
1.4.1 Building Model Generation Project
1.4.1.1 Overview The Building Model Generation (BMG) group at MIT has been tackling the problem of automatic interpretation of floor plan data for a number of years. This project originated at the University of Berkeley [Teller et al 1996] and has expanded through support at MIT [Nichols 2004, Kulikov 2004]. Floor plans in their native DXF format are processed into a more human-readable geometric format, which is then further analyzed to derive three-dimensional models (Fig. 1-4) and a topological layout of the environment. BMG has seen significant progress but still requires improvement of accuracy and completeness in its output. Previous work in the BMG project had shortcomings at two distinct stages in the pipeline: the initial geometric processing of the floor plan data, and the topological interpretation of the data. The topology-generating engine recognized only a fraction of the connectivity types present on campus. Vertical connections (stairs and elevators) were less than 50% complete, and implicit connections (e.g. continuous corridors) were excluded from the model entirely. The research in this thesis aims to generate a more exhaustive topological representation of campus, building upon the foundations developed by the BMG project.
1.4.1.2 Floor Plan Data In order to build the applications described in this thesis, a comprehensive dataset describing the campus geometry is required. Given the size of the MIT campus – over 160 buildings and nearly 1,000 individual floors – the proposition of manual data collection is unfeasible. Our computations are based instead on floor plans. The advantages of adhering to this format are three-fold:
• They are an immediately available data source: floor plans are maintained and regularly updated by MIT’s Department of Facilities for every building on campus.
Fig.1-4: Three-dimensional model of MIT generated by BMG.

12 Geometric, topological & semantic analysis of multi-building floor plan data
• The drawings are structured to follow strict conventions, such as unique space names, consistent room use codes, and implied adjacency information.
• Construction details are segmented into functional layers including room contours, floor extents and exterior walls, which lends to more streamlined parsing routines.
MIT floor plans are available on the web at https://floorplans.mit.edu. Methods are discussed in Section 2.2 for extracting geometric and topological information from the native DXF format.
1.4.1.3 Basemap The campus basemap in its raw form is a contour map describing the physical layout of MIT. Position and orientation is specified for building footprints, along with other physical infrastructure such as locations of sidewalks, streets and grass. The methods developed in [Kulikov 2004] process the original CAD DXF file to generate a properly labeled model of the campus terrain (Fig. 1-5). The basemap is further divided into patches with known adjacency relationships so that inter-building routes can be generated.
Each patch is labeled with a terrain type including sidewalk, street, grass, construction, and building. See appendix B for a full listing. These type classifications are later incorporated into constraints for inter-building routes, discussed in chapter 3.
1.4.1.4 Location Server The Location Server is a network-accessible Java RMI program introduced by Bell [2003] and developed by Nichols [2004] which provides campus geometry and route-finding capabilities to client applications through a general API. The location server currently provides these services to MIT Maps [http://maps.csail.mit.edu] which will be discussed in chapter 3.
Fig.1-5: The campus basemap. The close-up image is colored according to space type. Black outlines indicate partitioning of street (dark grey) and sidewalk (light grey) regions into smaller patches.

13 Geometric, topological & semantic analysis of multi-building floor plan data
As illustrated in Fig.1-6, route requests are made by the client and embedded in a Java route object containing a source space, a destination space and route constraints. The route object is then passed to the Location Server over Java RMI. The returned route contains a path described at three levels of abstraction: as a sequence of spaces traversed, as a sequence of portals traversed while moving between spaces, and as a collection of ordered connected points in the polyline path. The procedures used by the Location Server for generating routes have been substantially modified since the initial developments of [Bell 2003] and [Nichols 2004]. Performance optimizations and improved rendering routines have been incorporated and will be explained in detail in the implementation section of chapter 3. Geometry and adjacency data is provided to the Location Server by the BMG pipeline in the form of XML documents. This is a further modification made in this thesis, meant to replace the custom file format for input data specified in [Nichols 2004]. For details on the structure of the XML data model refer to section 2.1.
1.4.2 Core Data Structures & Algorithms
1.4.2.1 Out-of-Core Graphs Large datasets composed of millions of geometric primitives are commonly used to represent complex geometric models such as architectural buildings and urban environments. The massive size of these models poses challenges for both storage and interactive display. Consequently, “out-of-core” algorithms have been proposed which are designed to process data too large to fit into a computer’s main memory at one time. Such algorithms must be optimized to efficiently fetch and access data stored in slow bulk memory [Varadhan and Manocha 2002].
Fig.1-6: Route passing between server and client over Java RMI [Nichols 2004].
SERVERCLIENT
Location Server
RMI
XML geometry,adjacency data
maps.csail.mit.edu
BMG Pipeline
MIT Floor Plan Corpus
Routes
User Applications
DXF floor plans
Fig. 1-7: Location Server overview.

14 Geometric, topological & semantic analysis of multi-building floor plan data
As will be discussed in section 2.1.6., our data model stores adjacency relationships between campus spaces using a graph (G) data structure. Each node in G is one XML element. Each edge in G is also an XML element – stored as a child element of its source node, and containing an attribute naming its destination node. By parsing the XML tree structure it is possible to quickly reconstruct portions of the graph in main memory as needed.
1.4.2.2 Dijkstra’s Graph Search Algorithm
Dijkstra’s algorithm obtains the shortest path from a source node s to every other node in a weighted graph G [Cormen et al. 2001].
Given a graph G = (V, E), where V is the set of vertices and E is the set of weighted edges, find the shortest path from a given source vertex s V to each vertex v V.
In our application, vertices represent locations on campus, and edge weights represent positive distances between pairs of locations connected by a portal. Dijkstra’s algorithm is used to find the shortest route between two locations.
The input to the algorithm is a weighted graph G, a source vertex s, and a weighting function w which gives the weights of edges in the graph. The cost of a path between two vertices is the sum of weights of edges in that path.
An initial distance of infinity is assigned to each node except for the source, which has an initial distance of zero from itself. The algorithm updates the distance estimates for each node with edge relaxation: consider an edge connecting two vertices u and v. If the distance estimate to v from the source is reduced by first traveling through u, then the shorter distance value for v is saved. The algorithm is structured so that each edge (u, v) is relaxed only once, when the shortest distance to u is known.
The algorithm maintains a set S of vertices for which the minimum weight path is known, and priority queue Q containing all other vertices in the graph. The following pseudocode has been modified to terminate when the destination node is found.
Dijkstra(G, s, dest, w) 1 for each vertex v V(G) // initialization 2 Distance(v) ∞ 3 Distance(s) 0

15 Geometric, topological & semantic analysis of multi-building floor plan data
4 S ∅ 5 Q V(G) 6 while Q ≠ ∅ 7 curr Extract-Min(Q) 8 if curr = dest 9 return Path(s, curr) 10 else S S ∪ {curr} 11 for each vertex v adjacent to curr // edge relax 12 if Distance(v) > Distance(curr) + w(curr, v) 13 Distance(v) Distance(curr) + w(curr, v) In order to extract the actual path to the destination node, one possible approach is to store the path in the queue, updating it along with the distance estimate every time an edge is relaxed:
line 14: Path(source, v) {Path(s, curr), v}
Alternatively, an attribute Previous(v) could be stored for every node that represents the previous node in the shortest path towards source s.
line 14: Previous(v) curr
Then the path can be read from the source to v by iteration, assuming all vertices are initialized with Previous(v) ∅: Path(s, v) 1 P ∅ 2 while Previous(v) ≠ ∅ 3 P {Previous(v), P} 4 v Previous(v) 5 P {s, P} 5 return P
1.4.2.3 Medial Axis The medial axis is a set of curves which roughly follows the centerline of a space. It is a representation often used in navigation applications, as it can generate valid and natural appearing paths with maximal clearance from all obstacles. Formally, the medial axis is the locus of the centers of all maximal discs inscribed in the polygon boundary [Lee 1982]. The set of boundary elements consists of the line segments making up the polygon edges, and the points at concave vertices. The type of curve the medial axis path follows is defined by its two closest boundary elements:
Fig.1-9: Taxonomy of medial axis points [Joan-Arinyo 1996].

16 Geometric, topological & semantic analysis of multi-building floor plan data
• straight line: equidistant from two concave vertices (Fig. 1-10a) or two boundary edges (Fig. 1-10c).
• parabolic arc: equidistant from a concave vertex and a boundary edge (Fig. 1-10b).
Each medial axis point can be further classified according to the number of boundary elements its maximal disc is incident on. Regular points have a maximal disc touching two boundary elements. Junction points are where several branches in the medial axis meet, and the maximal disc is tangent to at least three boundary elements. End points occur at convex vertices where the medial axis runs into the polygon boundary and the disc radius is zero [Joan-Arinyo 1996].
1.4.2.4 Constrained Delaunay Triangulation In order to triangulate general polygonal regions, the incremental Constrained Delaunay Triangulation (CDT) algorithm is used. This is a generalization of the standard Delaunay triangulation that forces certain edges (the boundaries) into the triangulation. We use the public domain implementation of [Bern and Eppstein 1992] by Dani Lischinski [1994]. The implementation is based on the quad-edge data structure, designed for representing general subdivisions of orientable manifolds [Guibas and Stolfi 1985].
…
The incremental CDT is initialized with vertices of a bounding convex polygon. This forms a starting triangle mesh large enough to contain all of the edges in the input. Constrained edges are then added into the triangulation one by one. A completed mesh can be seen in Fig.1-10. Next, in order to find the triangulation for the polygonal region (i.e. triangles inside the polygon), we perform a depth first search. The implementation relies on the following edge functions (see Fig.1-11):
• Lnext() returns the counter-clockwise edge around the left face following the current edge.
• Sym() returns the edge from the destination to the origin of the current edge.
Additionally, each edge stores two Boolean values, c and triangleMark, that indicate a constrained edge and a visited left face (respectively). The depth first search is illustrated in Fig.1-12: the root triangle is chosen as the left face of a polygon edge E. This will return an interior triangle
eLnext(e)
Lnext(Lnext(e))
left face
e Sym(e)
Fig.1-11: Basic edge functions.
Fig.1-10: CDT construction. Constrained contour edges (black) inserted into an initial bounding mesh. All other edges in the mesh (grey) are unconstrained.
Fig.1-10: Shape of medial axis segments. (a) straight line between a concave-vertex pair; (b) parabolic arc between concave vertex and boundary edge; (c) straight line between two boundary edges [Joan-Arinyo 1996].

17 Geometric, topological & semantic analysis of multi-building floor plan data
assuming E is oriented counter-clockwise. We first determine the orientation of the ordered list of contour points, and if clockwise, then Sym(E) is used instead as the starting edge.
. . .
From the root triangle, the search proceeds by finding neighboring triangles that share an unconstrained edge. Recall that only the boundary edges of the polygon are constrained. Since the search never crosses a constrained edge, the search is guaranteed to remain inside the polygon. The algorithm maintains a list T of triangles forming the polygon’s interior mesh. Freshly discovered edges are added to a ‘last in first out’ stack S for expansion. Polygon-CDT(rootEdge) 1 T ∅ 2 S ∅ 3 Push(S, rootEdge) 4 while S ≠ ∅ 5 currEdge Pop(S) 6 T T ∪ {leftFace(currEdge)} 7 for e in [currEdge, Lnext(currEdge), Lnext(Lenxt(currEdge))] 8 if e not constrained and leftFace(Sym(e)) not visited 9 Push(S, Sym(e)) 10 set leftFace(currEdge) visited 11 return T These methods are applied when determining intra-space paths, discussed in Section 5.3.2.
Fig.1-12: Depth-first search for polygon triangulation: light grey/ dark grey are discovered/visited. The search expands only over unconstrained edges interior to the polygon.

18 Geometric, topological & semantic analysis of multi-building floor plan data
1.5 System Design The goals of the Building Model Generation project as a whole are to develop a system that is comprehensive, automated, intuitive to the user, and scalable. To achieve these goals, our system is composed of a central database for storing geospatial elements, and a set of agents designed for a specific set of read/write operations. Section 2.1 reviews the design of the data model itself, and the conventions of our XML representation for geometric, topological and semantic features of locations on campus. The data model is populated through input agents that extract information from our common data sources. The work of [Battat] involved the development of an AutoCAD DXF parser that reads geometry data from raw DXF files, and populates the data model with pertinent information such as building footprints, space contours, and portal locations. Section 2.2 provides an overview of floor plan conventions used by the DXF Parser to recognize portal locations.
MIT CAD DXF Corpus(Data Corpus)
DXF Parser(Input Agent)
XML Data Model
CAD files
XML spaces,dangling portals
CDT(Derivative Agent)
spaces
space triangulations
Portal Linker(Derivative Agent)
dangling portals
linked portals
Visualization Interface(Output Agent)
landmarks
Landmark Interface(Input Agent)
MIT Route FinderMIT WikiMap
routes
graph geometry
Location Server(Derivative Agent)
Once the data is inserted in the data model, derivative agents operate on the data to derive richer geometric information including space triangulations and topological information such as stairway connections that require further computation on the raw geometry data. These agents can both read and write to the data model. Section 2.2 provides a review of connectivity types and methods for deriving adjacency data.
Fig.1-13: Project overview.

19 Geometric, topological & semantic analysis of multi-building floor plan data
Output agents act as intermediaries between the geospatial database and external applications, and have only read capabilities. A visualization output agent is designed specifically for display of the campus map in a web interface. Chapters 3 and 4 present two web-based applications that combine the visualization interface with additional agents. The MIT Route Finder uses the location server to derive campus routes based on adjacency data stored in the data model, and the MIT WikiMap incorporates an additional input agent designed to collect landmark data directly from users.

20 Geometric, topological & semantic analysis of multi-building floor plan data
2 Campus Data Corpus
2.1 Data Representation
2.1.1 Introduction This section introduces a robust and scalable data representation designed to exhaustively characterize geospatial features. In particular, this chapter discusses the spatial hierarchy used to represent containment relationships in our geometric model of campus. Elements of the data model are described including floors, spaces, portals, and landmarks, as well as the specific XML format designed for each. A review of the space-graph structure is also given, which models the adjacency relationships between geospatial features.
2.1.2 Spatial Hierarchy The data framework is organized into a tree hierarchy, where each feature node can have attributes and children nodes. For example, the root element of MIT is the basemap of the campus; the basemap has individual buildings as children nodes; buildings have floors as children nodes; and so on. Concurrently, each of those nodes carries with it a series of properties that define it such as its name and its defining contour.
The hierarchical approach lends itself naturally to a number of geometric operations. For example given a 2D point, its enclosing space may be efficiently computed by progressively refining the search space from regions (e.g. North campus), to buildings (e.g. N51), to rooms (e.g. N51-105).
Fig.2-1: Spatial hierarchy of MIT campus.

21 Geometric, topological & semantic analysis of multi-building floor plan data
The XML file format (Extensible Markup Language) was chosen to represent this hierarchy for its ability to store information in a tree-based structure [Bray et al 2004]. Additionally, XML is designed for transferring such richly structured data over the internet, making it well-suited for the web applications described later in this thesis.
2.1.3 Floors Floors embody the containing region for a set of spaces. They are represented in our XML data model with a top level node called MITquest which is the parent element of all spaces on that floor. Floors are physically represented with a contour consisting of an ordered set of 2D points. Each contour has additional elements specifying a bounding box and centroid. For example, floor 1 of Building 1 appears as:
<MITquest>
<floor name="FLOORCONTOUR">
<contour>
<centroid x="710039.91" y="495107.19"/>
<extent maxx="710223.83" maxy="495264.34"
minx="709923.96" miny="494964.77"/>
<point x="709923.96" y="495181.27"/>
<point x="709935.56" y="495186.55"/>
<point x="709927.75" y="495203.69"/>
...
</contour>
</floor>
<space name="1-142" type="CMPUTR"> ... </space>
<space name="1-171" type="OFF"> ... </space>
...
</MITquest>
2.1.4 Spaces Spaces are physical locations on campus, including both the outdoor environment (such as streets, sidewalks, and grass) and places within indoor environments (such as corridors, classrooms, and lobbies). Spaces may be physically surrounded by walls, or have only implied boundaries such as the transitions between buildings along MIT’s infinite corridor.
p0
p1
p2
p3
p4
p5
T(0,4,5)
T(0,1,4)
T(1,2,4)
T(2,3,4) contour extent
(minx , miny )
centroid
(maxx , maxy )
Fig.2-2: Example space. Spaces are physically represented with a set of contour points and a triangulation.

22 Geometric, topological & semantic analysis of multi-building floor plan data
Spaces are represented geometrically as closed simple polygons bounded by an ordered polyline of 2D points that define the contour of the space. Each contour has child properties including its centroid and bounding box extents. A set of triangles corresponds to the space’s constrained Delaunay triangulation. And each space has a globally unique name, following the convention [BUILDING]—[FLOOR][ROOM] set by MIT’s Department of Facilities. In our XML data model, spaces are represented in the following format:
<space name=SPACE_NAME type=SPACE_TYPE>
CONTOUR
CENTROID
EXTENT
POINT1 POINT2 POINT3 ...
TRIANGLE1 TRIANGLE2 TRIANGLE3 ...
</space>
Triangle vertices contain an index which refers to the ordered list of contour points. Contour points are specified in global campus coordinates, corresponding to the Massachusetts “state plane” coordinate system. For example, to specify a classroom in building 1:
<space name="1-150" type="CLASS">
<contour>
<centroid x="710044.28" y="495033.19"/>
<extent maxx="710062.06" maxy="495054.31"
minx="710024.92" miny="495011.80"/>
<point x="710030.10" y="495036.59"/>
<point x="710039.67" y="495015.58"/>
<point x="710038.15" y="495014.89"/>
...
</contour>
<triangle v0="0" v1="1" v2="12"/>
<triangle v0="0" v1="12" v2="19"/>
<triangle v0="0" v1="19" v2="20"/>
..
</space>
Basemap spaces have the same geometric representation as interior spaces, and follow the naming convention: BMAP-[ID] where ID is a unique integer ranging from 0 to 7,070. A complete listing of codes used for specifying space types can be found in appendix B.
2.1.5 Portals Portals are physical connections (such as doors, elevators, and stairs) representing an adjacency relationship between two spaces. Each portal has a source and a destination space, representing one direction of the
S2
S1
P12
Fig.2-3: Node-edge representation of spaces and portals. Portals have a distinct source and destination, representing one direction of the physical connection between two spaces.

23 Geometric, topological & semantic analysis of multi-building floor plan data
physical connection between two spaces. Portals also have an associated type (e.g. DOOR, ELEV) and a physical representation in the x-y plane.
<space name=SOURCE_NAME type=SOURCE_TYPE>
<portal class=CLASS target=TARGET_NAME type=TYPE [OTHER]/>
</space>
In our XML data model, every portal is represented as a child element of its source space. Each portal has class, target and type attributes. The class attribute captures a distinction between vertical and horizontal portals, defined below.
2.1.5.1 Vertical Portals Vertical portals involve connections between adjacent floors including elevators and stairs. An additional direction attribute is included in the portal definition to indicate an upward or downward traversal. The convention is:
<portal class="vertical" target=NAME type=["STAIR"|"ELEV"]
direction=["UP"|"DOWN"]/>
For example, a staircase connecting the first floor to the second floor of building 1 is written: <space name="1-100SB" type="STAIR">
<portal class="vertical" target="1-200SB" type="STAIR" direction="UP"/>
</space> The data model representation of a vertical portal is a closed polyline identical to its source space (e.g. an elevator portal has the same shape as the elevator itself). Rather than repeat the 2D points, each vertical portal is defined by the contour of its source.
2.1.5.2 Horizontal Portals Non-vertical portals are classified as horizontal. These include connections between spaces on the same floor, connections between buildings, or adjacent basemap spaces. Possible portal types are door, outdoor and implicit. Horizontal portals are represented geometrically as a line segment (Fig.2-5). In our XML representation, horizontal portals have an “edge” child element that provides the line segment parameters: Maxparam and minparam values specify the parameterized position of the portal along edge (pindex, pindex+1), where pi is a point on the source contour and minparam is strictly less than maxparam. The format is as follows:
<portal class="horizontal" target=NAME type=["DOOR"|"OUTDOOR"|"IMPLICIT"]>
<edge index=INT maxparam=FLOAT minparam=FLOAT/>
Fig.2-5: A sample horizontal portal. Portal position is defined by an edge index – referencing the ordered list of points for the source space – and the parameterized position along the edge.
Fig.2-4: A sample vertical portal. Two overlapping staircases.

24 Geometric, topological & semantic analysis of multi-building floor plan data
</portal>
For example:
<portal class="horizontal" target="1-150" type="DOOR">
<edge index="1" maxparam="0.7" minparam="0.25"/>
</portal>
Methods for inferring portal connections from the floor plan geometry are discussed in section 2.2.
2.1.6 Space-Portal Graph Connectivity relationships between locations are represented with a graph data structure. A graph G = (V, E) is a set of elements V, called nodes or vertices, linked by a set of edges E [Cormen et al 2001]. In our representation, spaces are modeled as graph nodes and portals as graph edges.
Floor
Spaces
Floor
Spaces
(a) (b) A directed graph has the additional property that each edge has an ordered pair of vertices. Specifically, an edge = (v1, v2) is considered to be directed from v1 to v2, where v1 is the source and v2 is the destination. We model the MIT campus under this convention, capturing the physical fact that portals such as security doors allow exit but not unconditional reentry.
v2
e(v1, v2)
v1 The graph structure is extended by assigning weights to edges. Since we are modeling connections between physical locations, weights are used to represent the distance traversed when moving from one space to the next.
Fig. 2-6: Topological model of campus representing adjacent spaces as nodes (solid circles) connected by graph edges (dashed arrows).
Fig.2-7: Directed graph.

25 Geometric, topological & semantic analysis of multi-building floor plan data
Finally, a graph is connected if for every pair of vertices (v1, v2) V, there exists a path from v1 to v2. For a directed graph, if the same property holds when all directed edges are replaced by undirected edges, it is called weakly connected. One of the goals of the BMG pipeline is to generate a (weakly) connected graph with coverage of all rooms, hallways, streets, sidewalks and other spaces within MIT. In the XML data model, a portal edge is contained as a child element of its source space. Each portal has a “target” attribute which points to the portal’s uniquely named destination space.
Fig.2-8: XML representation of the space-graph. Boxes denote nodes in the graph. The target attribute of a portal stores a pointer to the portal’s destination space.

26 Geometric, topological & semantic analysis of multi-building floor plan data
2.1.7 Landmarks Landmarks are physical objects representing points of interest within the MIT campus environment. They may vary broadly in scale – some landmarks are large and seen at great distances, such as the Green Building, others may only be visible at close range, such as a painting in a faculty lounge. Further, landmarks may be characterized by a number of different qualities such as visual contrast (e.g. a brightly-colored wall), structural prominence (e.g. the intersection of Mass. Ave. and Vassar St.), or functional significance (e.g. the Building 4 café) [Sorrows and Hirtle 1999]. To capture variability in scale and salient features, we represent landmarks with the following attributes:
Name – descriptive title.
Location – name of containing region. This allows for varying granularity. A landmark may apply to a single space (e.g. lobby 7-100), an entire building (e.g. Kresge Auditorium), or an outdoor courtyard (e.g. Killian Court).
Position – 2D coordinate. For small objects such as a sculpture in Killian Court, an exact point accurately describes its position within the containing space. When the landmark pertains to a larger area, the coordinate is used for visualization purposes only.
Category – landmark classifications such as painting, sculpture, or public computer cluster.
Description – supplementary unstructured information not accounted for in the above attributes.
We store landmarks in a geo-referenced database using the fields listed above. Although this implementation uses a separate database, landmarks could naturally be incorporated into the xml data model as child elements of a space. For example:
<space name="7-407" type="FOODSV">
<landmark name="steam cafe" category="quick food"
description="a student-designed cafe">
<point x="710030.10" y="495036.59"/>
</landmark>
</space>
A landmark could be similarly represented as a child of a floor or building element to reflect the varying scale of salient features on campus.

27 Geometric, topological & semantic analysis of multi-building floor plan data
2.2 Generating Campus Topology Data
2.2.1 Introduction This chapter describes the methods used in populating the data model with adjacency information. The chapter begins with an overview of BMG pipeline components dedicated to portal construction. Subsequent sections present a portal taxonomy, which classifies all portal types found in the MIT floor plans. Geometric properties for portal identification are summarized, along with methods for matching portals to their source and destination spaces.
2.2.2 Portal Populating Agents Methods for populating the data model with portal information are handled by both the DXF Parser, developed by [Battat], and a set of derivative agents designed specifically for portal linking.
DXF Parser(Input Agent)
XML Data Model
DXF CAD files
spaces, dangling portals, linked intra-floor portals
Inter-building Linker
dangling portals, spaces
linked portals
Vertical Linker
Building-basemapLinker
stair, elevator spaces
dangling portals, basemap spaces
dangling portals
Portal Linkers (Derivative Agents)
Portal construction can be divided into two stages: a “creation” stage that associates a portal with a source space, followed by a “linking” stage that determines the portal’s destination space. We term portals that are created but not linked as “dangling” portals. The DXF Parser is responsible for all portal information that can be extracted from a single floor plan: intra-floor portals are fully constructed, and inter-building portals are created but left dangling. See section 2.2.3 for intra-floor portal identification and linking methods; and section 2.2.6 for inter-building portal creation. A set of Portal Linkers then derives additional topological information. Dangling portals created by the DXF Parser are linked – accounting for both inter-building connections and connections from interior spaces to the basemap (cf. section 2.2.7). An additional agent constructs portal
Fig.2-8: Components of BMG pipeline involved in generating portal data.

28 Geometric, topological & semantic analysis of multi-building floor plan data
edges between stair and elevator spaces on adjacent floors, providing the vertical connections within multi-story buildings.
2.2.3 Intra-Floor Portals Portals between spaces on the same floor of a building can be classified as either explicit or implicit connections:
• Explicit Explicit portals represent connections between spaces that are physically separated by a barrier. The most common example is a doorway embedded in a wall between two rooms. In the floor plan data, doorways also have an explicit geometric representation (Fig. 2-9a): A circular arc is positioned along the dividing wall between its source and destination spaces. The two spaces have non-overlapping contours indicating the thickness of the dividing wall.
(a) ½ R ½ R
(b)
A difficulty is that in the floor plan data, a door arc has no association other than geometric proximity with the polylines defining its two adjacent rooms. Further analysis is required to determine the source and destination of the portal: First a vector is positioned through the door frame, normal to the incident wall. Two points are then placed at the head and tail of the vector, at a distance of half the arc radius from the wall. To guarantee each point lies inside the correct space, the vector length must be smaller than shallow spaces such as closets, but large enough to protrude through the wall thickness. An additional script computes, among all spaces within the floor plan, which space contour contains each point. The geometric relationship is pictured in Fig. 2-9b. HorizontalPortal(door, Floor) 1 Position(p1) Center(door) + NormalVec(door) × Radius(door)/2 2 Position(p2) Center(door) − NormalVec(door) × Radius(door)/2 3 for each space s Floor 4 if Contour(s) contains p1 5 Source s 6 break out of loop 7 for each space s Floor 8 if Contour(s) contains p2 9 Dest s 10 break out of loop 11 return {Source, Dest}
Fig.2-9: Explicit portal. (a) Floor plan representation. (b) Two points offset in opposite directions along the normal vector to the wall. Source and destination spaces are found as the containing region for each point.

29 Geometric, topological & semantic analysis of multi-building floor plan data
• Implicit Implicit portals represent connections between spaces where no physical barrier exists. It is normally for organizational reasons that implicit divisions are placed in the floor plans. For example, the photo in Fig. 2-10 shows a large open space outside the “Steam Café” in Building 7. Although there is no wall between the corridor and the café tables, these two regions are defined as separate spaces in the floor plans to differentiate between circulation zones and food services.
CORRIDOR FOOD
Implicit portals are recognized in the floor plans by a coincident edge between two space contours. This is denoted by the dotted line in figure 2-10. The portal adopts the entire length of the coincident edge as its physical representation in the data model.
2.2.4 Inter-Floor Portals Inter-floor portals provide the vertical links in a building. Stair and elevator spaces – made for vertical movement between floors – are represented as source and destination nodes in our topological data model. We determine links by finding pairs of vertically adjacent spaces. Specifically, two staircases are said to be vertically adjacent if they belong to neighboring floors and their axis-aligned bounding boxes intersect in the x-y plane.
(a) (b)
Fig.2-11: Vertical portal. (a) Plan view of stairs on adjacent floors; (b) axis-aligned bounding box for each stair space. Matches are made by testing for overlapping bounding boxes.
Fig.2-10: A sample implicit portal. The dotted line denotes an incident edge between the space contours. Although no physical barrier exists, the portal places an implicit divide between the corridor and café tables.

30 Geometric, topological & semantic analysis of multi-building floor plan data
Our implementation has two stages. First we construct an ordered list of floors for each building. One complication is that MIT Inventory orders floors alphabetically rather than numerically (e.g. {1, 10, 11, 2, 3 … 9} vs. {1, 2, 3, … 9, 10, 11}), so an additional sorting algorithm was required. Second, for each ordered pair of floors, we find stair and elevator spaces that overlap in plan view. This is done by simply computing the axis-aligned bounding box for each space (without the height dimension) and testing for intersections in terms of the unit axes: BoundingBoxOverlap(s1, s2) 1 if (minX(s1) > maxX(s2) or minX(s2) > maxX(s1) or 2 minY(s1) > maxY(s2) or minY(s2) > maxY(s1)) 3 return false 4 else return true Each stair and elevator space is assumed to have two neighbors – one on the floor above, and one on the floor below – with the exception of the lowest and highest floors of a building. Consequently, each portal is given an explicit direction to indicate an upward or downward direction of movement. LinkFloors (Floors) // naïve: without mezzanines 1 for each floor F Floors 2 for each vertical space s F 3 LinkVertPortal(s, Next(F))
For each stair or elevator space s1, a match is found by testing for intersection with every space on Floor2, the floor directly above s1. LinkVertPortal(s1, Floor2) 1 for each vertical space s2 Floor2 2 if BoundingBoxOverlap(s1, s2) 3 if s1 and s2 are stair spaces 4 Portals(s1) Portals(s1) ∪ StairUp(s1, s2) 5 Portals(s2) Portals(s2) ∪ StairDown(s2, s1) 6 else if s1 and s2 are elevator spaces 7 Portals(s1) Portals(s1) ∪ ElevUp(s1, s2) 8 Portals(s2) Portals(s2) ∪ ElevDown(s2, s1)
2.2.5 Mezzanines in Inter-Floor Connections In the general case, vertical portals are matched by analyzing pairs of adjacent floors, and creating links between vertically aligned stair and elevator spaces. However in the instance of a mezzanine, it can become

31 Geometric, topological & semantic analysis of multi-building floor plan data
ambiguous which floors are adjacent to each other. We account for the possible scenarios using a technique analogous to ray-casting: Cast a ray upward from the bottom-most staircase s1. If the ray originating from s1
intersects the mezzanine floor, then only portals on the mezzanine may provide a valid connection. If the ray does not intersect the mezzanine, then the portal may connect to the full floor above. To implement the intersection test for a ray originating at s1, we test for bounding box overlap with all spaces on the mezzanine level. AdjacentFloor (s1, Floor2, Mezzanine) 1 for each space sM Mezzanine 2 if BoundingBoxOverlap(sM, s1) 3 return Mezzanine 4 return Floor2 Three cases are illustrated in Fig. 2-12. In (a), the first floor staircase is clear of the mezzanine and connects to a second floor staircase. In (b), the first floor staircase connects to the mezzanine.
floor 1
mezzanine
floor 2
(a) (b)
The following LinkFloors procedure is modified from 2.2.4 to account for the presence of mezzanine floors: LinkFloors (Floors) \\ corrected for mezzanines 1 for each floor F Floors 2 for each vertical space s F 3 if Next(F) is a mezzanine 4 nextFloor AdjacentFloor(s, Next(F), Next(Next(F))) 5 LinkVertPortal(s, nextFloor) 6 else LinkVertPortal(s, Next(F))
2.2.6 Inter-Building Portals Inter-building portals represent connections between spaces in abutting buildings. Like intra-floor portals, these can be classified as either explicit or implicit.
Fig.2-12: Mezzanine floors in vertical portal matching.

32 Geometric, topological & semantic analysis of multi-building floor plan data
• Explicit Explicit portals represent physical doorway connections between adjacent buildings. These are recognized using the same method as explicit intra-floor portals.
½ R
½ R
For any door arc found in the floor plans, a normal vector to the incident wall is constructed. Two points are positioned along the normal vector, at distances of 0.5(arc radius) and −0.5(arc radius) from the wall (cf. Figure 2.9b). If one of the points lies outside the floor contour (i.e. it is not contained by any space in the floor), then the portal is tagged to connect to an adjacent building. The source space is detected as the containing region for the second point.
• Implicit Implicit portals represent connections between adjacent buildings where no physical barrier is crossed. For example, in the photo below the corridor spans buildings 3 and 7 without any visual indicator. Implicit portals are represented in the floor plans by a coincident edge between the space contour and the floor contour.
(a)
Bldng 3
Bldng 7
(b)
An implementation challenge for inter-building connections is that the source and destination spaces reside in separate floor plans. In the example above, an outgoing portal is created from Building 7 with corridor 7-400 as its source. However the target could be any of over 160 buildings on campus. Linking mechanisms employ dangling portals, which are the subject of section 2.2.7.
Fig.2-13: Implicit connection between buildings. (a) The floor contour overlaps the space contour, indicated by the dotted line; (b) A corridor in Building 7 connects to a corridor in Building 3, but no physical door or other barrier is present between the two spaces.
Fig.2-13: Explicit inter-building portal. A point is placed on either side of the door frame. One point is contained by the portal’s source space, the other point lies outside the floor contour (red line).

33 Geometric, topological & semantic analysis of multi-building floor plan data
2.2.7 Dangling Portals Dangling portals are graph edges with a known source space, but an undetermined destination. Dangling portals provide a mechanism to defer analysis of connections between buildings, and connections from buildings to the basemap terrain. In both cases, the challenge faced is a highly unconstrained search for the portal destination space. A portal leading onto the basemap could link to any one of 7,000 basemap spaces. A portal leading to another building must search over 160 distinct buildings at MIT. Rather than process these large sets of geometric data every time we encounter an inter-building portal, we instead perform all inter-building linkages with a multi-stage process: First, all building geometry is processed by the DXF Parser and any portal that leads out of the building is simply tagged, and attached to its source space. Dangling portals are represented in XML with a target pointing to the floor contour, communicating that the portal is incident on the edge of the building.
<space name=SOURCE_NAME type=SOURCE_TYPE>
<portal class="horizontal" target="FLOORCONTOUR"/>
</space>
Once all dangling portals have been created for every building on campus, the second stage is to match proximal pairs: For each dangling portal pi, a set of candidate destinations is collected (i.e. all spaces within a preset radius). A successful match occurs when one of the candidate spaces contains a corresponding dangling portal coincident with pi.. LinkDanglingPortals(Buildings) 1 for each building Bi Buildings 2 for each dangling portal pi Bi 3 proximalSpaces Proximal(Buildings, pi, Radius) 4 for each space sj proximalSpaces 5 if dangling portal pj Portals(sj) exists 6 if Distance(pi, pj) < Tolerance 7 Target(pi) Source(pj) 8 Target(pj) Source(pi) 9 break Connections from buildings to the basemap use similar operations, with the additional constraint that only explicit portals are assumed to link an interior space to the campus terrain. LinkDanglingPortals(Buildings, Basemap) 1 for each building Bi Buildings 2 for each explicit dangling portal pi Bi
?
Fig.2-14: Stages of portal linking. Middle is dangling portal with a source but no destination.

34 Geometric, topological & semantic analysis of multi-building floor plan data
3 proximalSpaces Proximal(Basemap, pi, Radius) 4 for each basemap space sj proximalSpaces 5 for each edge ej Contour(sj) 6 if Distance(pi, ej) < Tolerance 7 Target(pi) sj 8 Portals(sj) Portals(sj) ∪ Portal(sj, Source(pi))
2.2.8 Intra-Basemap Portals Basemap portals are a simple case of implicit portals. Any two basemap spaces whose boundaries have a coincident edge are considered adjacent. Physically, basemap portals are a straight line segment spanning the incident edge between the two neighboring spaces.
2.2.9 Summary A summary of portal types is presented in Table 2-1 below: Type Test
Intra-Floor Space-space contour overlap Inter-Building Space contour overlap with floor contour
Implicit
Intra-Basemap Space-space contour overlap Intra-Floor Door arc Explicit Inter-Building Door arc on floor contour
Stair/Elevator Inter-Floor Axis-aligned bounding box overlap
2.2.10 Remaining Challenges • Misaligned Floors
A remaining challenge for future work is to account for height differentials between adjacent buildings. For example, the third floor of the Stata Center is slightly lower than the third floor of Building 36, necessitating the short staircase in Fig. 2-15. Height differentials may be ignored if we assume that inter-building connections always occur at the same floor. However with the varied building styles at MIT and variations in height of terrain, this assumption does not always hold. An example is at the east end of the Infinite Corridor where floor numbers increase by one from Building 8 to Building 16.
Table 2-1: Summary of portal types and detection methods.

35 Geometric, topological & semantic analysis of multi-building floor plan data
• Visual Stairway Identifiers The DXF Parser recognizes stairways as any space with the “STAIR” room use code. However, this relies on a thorough labeling scheme specific to MIT, rather than more generic visual identifiers. For example, in the figure below there is no “STAIR” label. Nevertheless a staircase is clearly recognizable to the human eye by a sequence of closely spaced line segments and a directional arrow. Incorporating such visual markers into the DXF Parser may result in more complete semantic data, while reducing a reliance on conventions specific to MIT.
• Ramp Vertical Portals
Our current implementation does not incorporate ramp connections. Ramps can be identified by directional arrows labeled “RAMP UP” or “RAMP DOWN”. In contrast to stairs and elevators, ramps are typically contained within larger spaces such as the corridor in Figure 2-17. One complication is that the majority of indoor ramps connect spaces within the same floor (to account for a height differential). A systematic method is still needed to determine a ramp’s source and destination, differentiating between intra-floor and inter-floor connections.
Fig.2-15: The stairs account for a height differential between the Stata Center and Building 36.
Fig.2-16: Unlabeled staircase. The staircase is part of a larger circulation area and does not carry the “STAIR” type label. However, the closely spaced line segments and arrow make it clear to a human eye that the staircase exists.

36 Geometric, topological & semantic analysis of multi-building floor plan data
Fig.2-17: A ramp within a corridor space, indicated by a labeled arrow.

37 Geometric, topological & semantic analysis of multi-building floor plan data
3 MIT Route Finder
3.1 Introduction ‘MIT Maps’ is a prototype application that provides custom routes on the MIT campus using the data framework proposed by BMG. The application is designed to assist campus visitors in the common task of finding their way from one location to another, with the additional ability of specifying route constraints. For example, on a cold or rainy day a visitor might only be interested in routes that remain indoors; or travelers in wheelchairs or carrying excessive luggage may want to avoid taking the stairs. A web interface is provided for specifying source and destination locations, along with visualization capabilities for displaying routes on the campus map.
XML Data Model
Visualization Interface(Output Agent)
routes
graph geometry
Location Server(Derivative Agent)
MIT Route Finder
Routes between locations are supplied by a central Location Server, introduced by [Bell 2003], and substantially expanded in this work. The Location Server provides this information through a Java RMI interface (see 1.4.1.3).
3.2 User Interface
3.2.1 Map Display A framework for route visualization has been developed combining information from the campus model geometry and path-drawing abstractions. The interface is implemented as an interactive web-based application modeled after the Google Maps API (see [Battat] for implementation details). The interface is designed for use in a regular browser, without plugins or other installation requirements for the user. Navigating the map is central to the user experience. Direct manipulation controls are provided that allow the user to drag the map to pan and double-click a point to re-center the map. A zoom bar is provided to change the zoom level. Users may also submit a location in the search
Fig.3-1: Components of the “MIT Maps” route finder application.

38 Geometric, topological & semantic analysis of multi-building floor plan data
field at the top of the page, and the map will zoom and pan appropriately to display the result.
3.2.2 Route Queries Route queries are run from the search field with the simple command:
[source] to [destination]
Source and destination points may be specified at varying levels of granularity, either by building (e.g. “50 to W11”), room (e.g. “1-205 to 1-100LA”) or a combination (e.g. “W11 to 1-100LA”). Auto-complete functionality has also been incorporated in the form of a drop-down menu to help prevent errors in location requests. To visualize space contours and triangulations along with the route, queries can also be run in debug mode using the command:
[source] to [destination] to debug
Figure 3-2 shows an example route in debug mode from a staircase on the first floor of building 10 to office 10-183A. Each space also has a tack positioned at its centroid, which will display the space’s name on mouse-over.
Fig.3-2: MIT Maps user interface.
Fig.3-2: Route display in debug mode. Red lines denote space contours, green lines denote space triangulations, and red tacks are positioned at space centroids.

39 Geometric, topological & semantic analysis of multi-building floor plan data
3.2.3 Space and Portal Visualization The search field also supports visualization queries. Space contours for an entire floor are displayed with the command:
draw: [Building]-[Floor]
For example, “draw: 50-1” will render all rooms on the first floor of Building 50, as shown in Figure 3-3. Space contours are drawn in red with space labels positioned at space centroids. Every explicit portal (e.g. door) is drawn as an arrow perpendicular to its incident wall. Every implicit portal is drawn as a line segment along its incident contour edge.
Basemap spaces are drawn with the command:
draw: BMAP-[index]
The index parameter is an integer between 0 and 14, specifying a chunk of 500 basemap spaces (among a total of 7,070) to be displayed on the map. For example, “draw: BMAP-4” will display all named basemap spaces in the range [BMAP-2000, BMAP-2499].
Fig.3-3: Visualization of spaces and portals on floor 1 of Building50. Blue arrows represent explicit portals. Blue line segments incident on contour edges represent implicit portals.

40 Geometric, topological & semantic analysis of multi-building floor plan data
3.3 Implementation A requirement of the route finder is the ability to quickly generate routes between any two locations on campus. On the basemap alone there are over 7,000 spaces and 88,000 portals. The problem of generating routes can be subdivided into two distinct sub-problems: finding the collection of spaces that optimally connect the source and destination spaces, and finding the actual path through each space.
3.3.1 Inter-Space Path Finding The first search is performed by considering spaces to be “nodes”, and portals to be “edges” for the purpose of graph construction and traversal. Edge weights are estimated by the distance between space centroids as depicted in Fig.3-2. Although the distance between adjacent spaces could be estimated by the length of a valid path (e.g. the shortest path between pairs of portals), this is potentially expensive to compute and ambiguous when multiple portal exit/entry pairs exist. Dijkstra’s algorithm was implemented for graph searching, which is a fundamental algorithm for shortest-path route-finding problems. See section 1.4.2.2 for a review. An optimal sequence of spaces is then determined by applying this standard graph searching technique to the network of spaces as depicted in Figure 3-2.
Fig.3-2: Sample space-portal graph. Edges are placed between adjacent spaces, and weights are calculated as the distance between space centroids.

41 Geometric, topological & semantic analysis of multi-building floor plan data
3.3.2 Intra-Space Path Finding Additional work is required to determine the physical path through a collection of spaces. For convex spaces, a simple straight line from an entry point to an exit portal represents the shortest possible path through the space. However for concave spaces, a straight line can result in an illegal path as shown in Fig.3-3a.
(a) (b) (c) The solution proposed by Nichols [2004] is to construct a valid path by connecting centroids of adjacent triangles as illustrated in Fig.5-3b. While the triangulated path doesn’t intersect any of the space’s boundaries, it also looks unnatural compared to the kind of path a person might draw by hand (Fig.3-3c). Instead we propose the use of the medial axis for intra-space path drawing, which is commonly used in motion planning applications [Latombe 1991]. The medial axis provides a central skeleton for the space, where every point on the skeleton is equidistant from its two closest boundary edges. The medial axis can be thought of as composed of paths with maximal clearance through a room, furthest from obstacle boundaries.
(a)
(b)
When computed precisely, the medial axis consists of straight line segments and parabolic arcs. Fig.3-4a shows the exact medial axis of a typical room contour. On the right, the medial axis has been simplified by trimming off all branches that lead to a convex corner. In the resultant graph, a valid path can be found between any pair of portals. However, the practical complexity of computing the medial axis is high, and provides more precision than required for path rendering routines. As an alternative, one can approximate the medial axis (MA) with straight line segments using the constrained Delaunay triangulation [Joan-Arinyo et al 1996] as illustrated in Fig.3-5. Medial axis points are placed at the midpoint of all interior triangle edges, and line segments are constructed between MA points incident on the same triangle. Fig. 3-5a is the
Fig.3-3: Finding a path through a concave polygon: (a) a straight line results in an illegal path; (b) a path traversing triangle centroids yields a valid but jagged path; (c) a smoothed path [Nichols 2004].
Fig.3-4: (a) Exact medial axis of a typical room contour. Spikes in the contour are portal positions. (b) Trimmed to remove branches that do not lead to portals.

42 Geometric, topological & semantic analysis of multi-building floor plan data
trimmed version, approximating Fig. 3-4b. To find the shortest path between any pair of portals, we simply run Dijkstra’s algorithm on the resultant MA graph. A sample path is shown in Fig. 3-5b.
(a) (b)
In addition to being a simpler representation, the benefit of this method is it leverages triangulation data already present in the data model.
3.3.3 Route Optimizations The route finding algorithm begins by first finding an inter-space path (as described in section 3.3.1). This is a course-grained search that looks at which spaces are linked to each other, but defers computation of the exact polyline path to a later stage. Dijkstra’s algorithm finds the optimal sequence of spaces that connect the source and destination, and edge weights are simply the centroid-to-centroid distances between adjacent spaces.
Fig.3-5: (a) Approximate medial axis of a room contour, connecting midpoints of shared triangles edges; (b) Example of one intra-space path.
Fig.3-6: (a) Outdoor route from building 50 to building 6.
(a)

43 Geometric, topological & semantic analysis of multi-building floor plan data
S6242
S6878S6936
S3371
S5872
S5990
S6236
S6242
S6878S6936
S3371
S5872
S5990
S6236
S6242
S6878S6936
S3371
S5872
S5990
S6236
S6242
S6878S6936
S3371
S5872
S5990
S6236
The second search is performed by constructing the medial axis graph of each space (as described in section 3.3.2). Figure 3-7 below shows the MA graphs for two example spaces S1 and S2. Nodes incident on a space contour represent portals. The graphs are combined by finding corresponding portal nodes between each pair of adjacent spaces. For example, a portal node in S1 that has space S2 as its destination is matched with a portal node in S2 that has space S1 as its destination. When multiple matches are available, portal nodes are paired by geometric proximity. The resultant graph provides
S2
S1
to S2
to S2
to S1
to S1
S1 U S2
to Sn
to Sn
Dijkstra’s algorithm is then run on the combined medial axis graph to determine the actual polyline path. The search terminates when it reaches a portal node leading into the destination space.
(b)
(b) A course search first finds the optimal sequence of spaces connecting the source and destination.
Fig.3-7: Combination of internal graphs for spaces S1 and S2. Green lines are graph edges, solid circles are graph nodes, and gray lines are space triangulations. Nodes incident on the space contour represent portals. The two graphs are connected at corresponding portal nodes.

44 Geometric, topological & semantic analysis of multi-building floor plan data
start
end
3.3.4 Path Relaxation Once the polyline path has been determined, a final shape simplification process is applied. This stage reduces the number of segments in the path while leaving the overall shape of the route intact. The main motivation is to yield a cleaner looking map, removing artifacts present in the medial axis representation. A simpler route polyline may also increase the speed of subsequent rendering routines in our web interface.
Our approach to simplification considers the path through each space independently. In a step-wise fashion we remove interior points from the medial axis path, checking to ensure that the removal does not cause an intersection with any of the space’s boundaries. This method is similar to work by [Agrawala 2001] in shape simplification of road maps, with the difference that we maintain overall shape by constraining the route within the space boundaries.
3.3.5 Route Constraints Route constraints are implemented by selectively restricting undesirable space and portal types in the campus graph. In the edge relaxation step of
Fig. 3-8: Dijkstra’s algorithm is run on the combined graph to find the actual path through the sequence of spaces.

45 Geometric, topological & semantic analysis of multi-building floor plan data
Dijkstra’s algorithm, connections with restricted types are ignored, effectively removing the edge from the graph. For example, paved routes prohibit portals leading to grass or construction on the basemap, but allow streets, sidewalks, and any indoor space type. Rolling routes are additionally constrained to elevator portals and ramps when moving vertically within buildings. On the other hand, walking routes are free to cut across fields and traverse any indoor space, and are consequently shorter than highly constrained paths.
3.4 Results & Discussion
3.4.1 Route Optimizations In rare cases, the optimizations built into the route-finder make it impossible to find the shortest path. This occurs when the best route requires leaving a space, and then entering the space again at a different point. Figure 3-6 illustrates one example with the U-shaped sidewalk segment. The problem occurs during the first phase of the route-finder which searches for a sequence of spaces. The optimal route in Fig. 3-6 would result in a cycle. Shortest-path graph search algorithms prohibit cycles, and therefore the optimal route is not found. Instead, the path is forced to stay within the oddly-shaped space (Fig.3-6a), or find an alternative route (Fig.3-6b). A possible solution is to split basemap spaces with large ratios of perimeter to area into more balanced components, or more rigorously, to break up all concave spaces into convex components.
3.4.2 Medial Axis & Path Relaxation The path relaxation methods discussed in section 3.3.4 do not consistently produce better results than the medial axis path. There are two distinct cases where each method produces the more natural appearance:
1) When the direction of travel is across the main axis of a space contour (e.g. traversing the short distance across a rectangular space, as in Fig.3-7a), the medial axis rendering pulls the path toward the center of the space, away from the intended
S1
S3
S2
Fig.3-6: Concave basemap spaces. The optimal route involves a cycle in the sequence of spaces.
(a) (b)
(a)

46 Geometric, topological & semantic analysis of multi-building floor plan data
destination. Iterative shortening substantially improves the appearance of the path.
2) For street, sidewalk and hallway segments – paths following the centerline of the space with approximately constant width – the medial axis produces a more natural appearance. This is particularly evident in winding sections.
A possible remedy could be to take a denser sampling of contour points when constructing the CDT, which would more closely mirror the exact medial axis, or take into account the portal positions. For example, constrain a triangle edge to span the width of a door frame rather than the full length of its incident wall.
3.4.3 Robustness & Space Geometry For a practical implementation of the geometric algorithms used in this project, problems in numerical errors and geometric degeneracies needed to be addressed. Numerical errors are uncertainties resulting from the use of data of varying precision. For example, interior measurements may be accurate within fractions of a foot, while the position of the building itself may be known only to within a few feet. This results from the great variations in the scale of the site: the campus coordinate system has an order of magnitude of 105 ft., yet walls separating individual rooms are only inches thick. Double precision floating point values are used in all computations, with epsilon tolerances to determine when two points coincide.
(a) (b) Geometric degeneracies were prevalent in the basemap. Partitioning of the basemap in [Kulikov 2004] resulted in instances of self-intersecting polygons and repeated edges (see Fig. 3-8). This caused a number of problems when determining triangulations. Specifically, self-intersecting polygons result in an incomplete triangulation, since the search algorithm (separating interior and exterior triangles) finds only the triangulation of one simple polygon component. Repeated edges are interpreted as a single constrained edge in the CDT since they share source and destination coordinates. As illustrated in Fig. 3-8b, if the search algorithm chooses the bad edge as a starting point, the root triangle will be outside the polygon, and the triangulation of the outer mesh will be returned in error. To alleviate this issue, a filtering script pre-processes all basemap spaces to remove any repeated edges from the space contours.
Fig.3-8: Geometric degeneracies present in basemap spaces: (a) Self-intersecting polygon. Performing a depth first search on the CDT finds the triangulation for only one simple polygon component. (b) Repeated edge. Both right and left face triangles are outside the polygon.
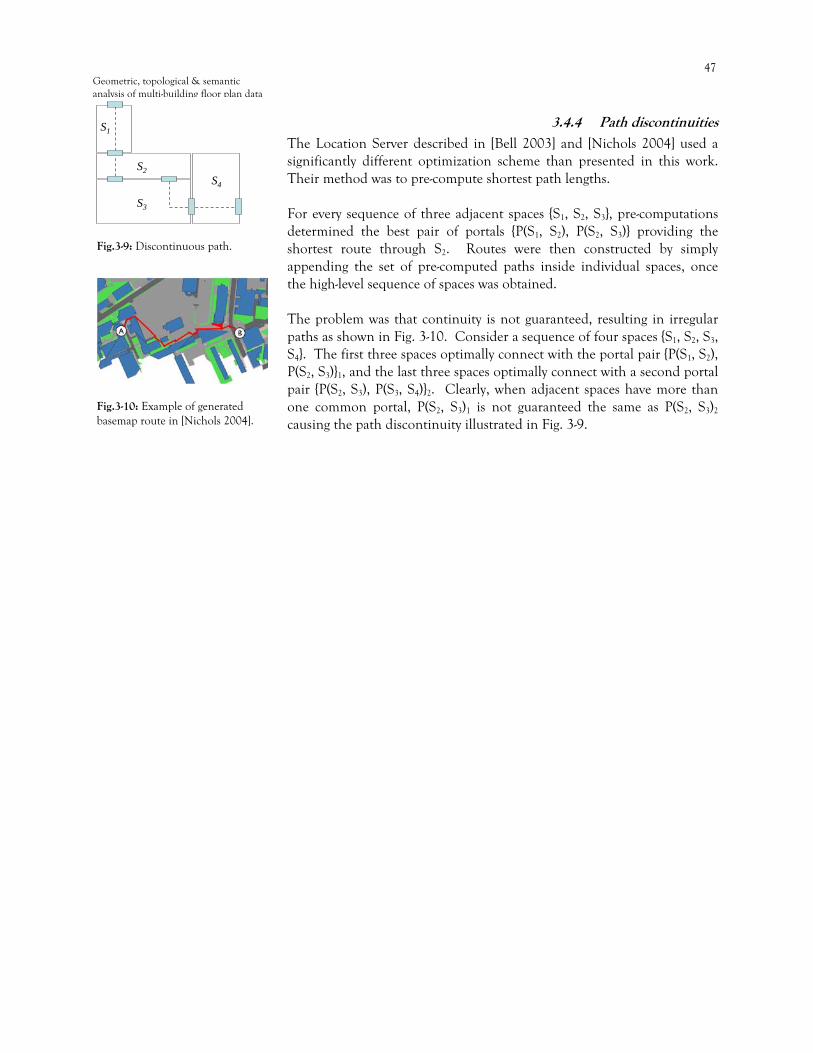
47 Geometric, topological & semantic analysis of multi-building floor plan data
3.4.4 Path discontinuities The Location Server described in [Bell 2003] and [Nichols 2004] used a significantly different optimization scheme than presented in this work. Their method was to pre-compute shortest path lengths. For every sequence of three adjacent spaces {S1, S2, S3}, pre-computations determined the best pair of portals {P(S1, S2), P(S2, S3)} providing the shortest route through S2. Routes were then constructed by simply appending the set of pre-computed paths inside individual spaces, once the high-level sequence of spaces was obtained. The problem was that continuity is not guaranteed, resulting in irregular paths as shown in Fig. 3-10. Consider a sequence of four spaces {S1, S2, S3, S4}. The first three spaces optimally connect with the portal pair {P(S1, S2), P(S2, S3)}1, and the last three spaces optimally connect with a second portal pair {P(S2, S3), P(S3, S4)}2. Clearly, when adjacent spaces have more than one common portal, P(S2, S3)1 is not guaranteed the same as P(S2, S3)2 causing the path discontinuity illustrated in Fig. 3-9.
S4
S1
S2
S3
Fig.3-9: Discontinuous path.
Fig.3-10: Example of generated basemap route in [Nichols 2004].

48 Geometric, topological & semantic analysis of multi-building floor plan data
4 MIT WikiMap
4.1 Introduction An expressive representation for location is an important component of many applications. Semantic properties focus on the meaning of a feature, such as its cultural, historical or functional significance. While the previous two chapters reasoned about space at the level of coordinates, containment relationships and adjacency networks, these representations have no way to express the semantics that define how a particular space is used. This chapter presents the MIT WikiMap, an application that addresses this problem by modeling the geographical relationships between spaces as well as the functional significance or other meanings of a given space.
XML Data Model
Visualization Interface(Output Agent)
landmarks
Landmark Interface(Input Agent)
MIT WikiMap
geometry
The broad-view motivation for this work is landmark-based navigation. As the semantic layer becomes populated with distinct visual entities from around campus, route-finding algorithms may provide directions or plan paths based upon particular landmarks. Further, route visualizations may provide richer information to travelers in the form of visual markers supplementing map geometry, or even landmark descriptions integrated into textual route instructions. Material in this chapter appeared in a report for course 6.831 User Interface Design & Implementation instructed by Professor R. Miller [Whiting, Giovine and Stoltzman 2005].
4.2 Motivation Complex public spaces, such as a college campus, are host to a wealth of interesting and practical locations that are too often neglected or underutilized simply due to lack of awareness. As a collective, the denizens of a space encapsulate this information, but there is currently no scalable way of disseminating this knowledge to the individual.
Fig.4-1: MIT Wikimap components. A map visualization interface is combined with UI controls for adding landmarks to the data model.
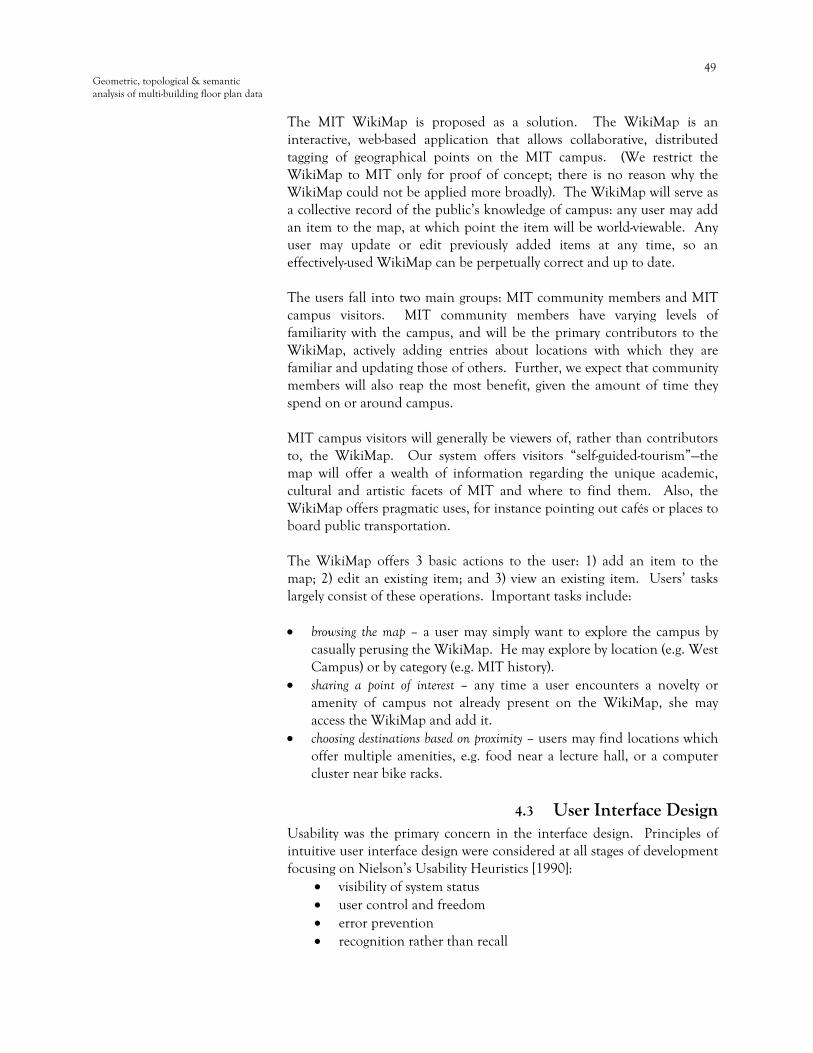
49 Geometric, topological & semantic analysis of multi-building floor plan data
The MIT WikiMap is proposed as a solution. The WikiMap is an interactive, web-based application that allows collaborative, distributed tagging of geographical points on the MIT campus. (We restrict the WikiMap to MIT only for proof of concept; there is no reason why the WikiMap could not be applied more broadly). The WikiMap will serve as a collective record of the public’s knowledge of campus: any user may add an item to the map, at which point the item will be world-viewable. Any user may update or edit previously added items at any time, so an effectively-used WikiMap can be perpetually correct and up to date. The users fall into two main groups: MIT community members and MIT campus visitors. MIT community members have varying levels of familiarity with the campus, and will be the primary contributors to the WikiMap, actively adding entries about locations with which they are familiar and updating those of others. Further, we expect that community members will also reap the most benefit, given the amount of time they spend on or around campus. MIT campus visitors will generally be viewers of, rather than contributors to, the WikiMap. Our system offers visitors “self-guided-tourism”—the map will offer a wealth of information regarding the unique academic, cultural and artistic facets of MIT and where to find them. Also, the WikiMap offers pragmatic uses, for instance pointing out cafés or places to board public transportation. The WikiMap offers 3 basic actions to the user: 1) add an item to the map; 2) edit an existing item; and 3) view an existing item. Users’ tasks largely consist of these operations. Important tasks include: • browsing the map – a user may simply want to explore the campus by
casually perusing the WikiMap. He may explore by location (e.g. West Campus) or by category (e.g. MIT history).
• sharing a point of interest – any time a user encounters a novelty or amenity of campus not already present on the WikiMap, she may access the WikiMap and add it.
• choosing destinations based on proximity – users may find locations which offer multiple amenities, e.g. food near a lecture hall, or a computer cluster near bike racks.
4.3 User Interface Design Usability was the primary concern in the interface design. Principles of intuitive user interface design were considered at all stages of development focusing on Nielson’s Usability Heuristics [1990]:
• visibility of system status • user control and freedom • error prevention • recognition rather than recall

50 Geometric, topological & semantic analysis of multi-building floor plan data
• aesthetic and minimalist design The following sections describe each component of the user interface, summarizing design decisions and the alternatives considered during various stages of development.
4.3.1 Browsing
• Navigating the Map
The interface incorporates the same map navigation tools as implemented in the MIT Maps route-finder application. Direct manipulation controls allow the user to drag the map to pan and double-click to re-center. A zoom bar is also provided to change the map scale.
• Category Selection
We chose to implement category selection as a set of toggle buttons. Our user tests clearly showed this was desirable, and in designs which pre-dated this selection idiom, users would ask why we didn't have this. The buttons offer a clear affordance for clicking and are better mouse pointer targets than, say, hyperlinks. Including icon images on the buttons acts as a visual attraction and makes clear the connection between buttons and map icons. Toggle buttons also offer easy undo: the user clicks in exactly the same place to reverse a display or hide action. To increase efficiency, we implemented “Add All” and “Remove All” options, along with keyboard shortcuts for every button.
Fig.4-2: WikiMap user interface, shown while viewing items
Fig.4-3: Toggle-button widget for category selection.

51 Geometric, topological & semantic analysis of multi-building floor plan data
An alternative “K of N” selection model can be seen in our original selection UI, which uses two list boxes: one list box to display the set of N fixed choices, and a second list box for the K selected categories. This UI scales better with the number of categories, addressing a concern we had in early designs. However, this UI has many drawbacks. Adding a category requires at least a double click, and undoing an action would require the user to move the mouse between the two list boxes. Further, the mapping between category names and icons was established by a small legend, which led users to erroneously click on the icons in the legend hoping to display items from that category.
• Search Box
Users may submit a location in the search field at the top of the page. A drop-down menu was incorporated with incremental search of all possible location names on campus. This ensures users will select a valid search item before submitting the query. A successful search re-centers the map and highlights the selected location (room, building or green space). In earlier iterations, the search box was intended for multiple query types. For example, a valid query would be “bldg 10 food bike racks” in an attempt to display all bike racks and places to eat in the area surrounding building 10. We decided implementation of such a sophisticated search tool was beyond the scope of this project. Complications would arise in recognizing which part of a query corresponds to location, and which part to category, and how to provide error recovery when search queries cannot be resolved.
4.3.2 Adding a New Landmark
• The Tack: Initializing a Landmark
For the Add-Item task, we introduced an affordance for pinpointing a location. We chose a tack because it is a well-understood metaphor for representing information on traditional paper maps. It also provides a visual representation for new items that is distinct from existing category icons. Using direct manipulation, the tack is simply dragged across the map to designate the new item location. Tacks are created via a prominently placed button at the top corner of the map. Multiple features are implemented for user freedom and efficiency:
1) Every time the tack button is pressed, an additional tack is added to the map. This allows users to plan multiple items. For example, many tacks can be positioned at their intended locations before entering descriptive information for each one.
2) We included a “Delete Tack” button which removes the tack from the map and cancels an Add-Item in progress.
3) New tacks are positioned in the center of the viewable region of the map. This increases efficiency when used in conjunction with the
Fig.4-4: Alternative “K of N” widget for category selection – one list box for the K selected choices, the other listing all N choices.
Fig.4-5: Draggable tack used as metaphor for tagging information points on the map.

52 Geometric, topological & semantic analysis of multi-building floor plan data
search box. A location search followed by an Add-Item action will position the tack directly on top of the desired room.
The earliest design iterations included separate modes for adding and viewing items, but this approach had poor learnability. Users were not familiar with the operations available on the WikiMap, and modes restrained exploration of all functionality in viewing, adding and editing items. The result was frequent mode errors, for instance, attempting to add items while in view mode and vice versa.
• Selecting Landmark Location
We treat the campus as 2.5D (layers of 2D stacked on top of each other), e.g. by floors within a building. Consequently, choosing a location may sometimes be ambiguous. We chose to alleviate this issue with a location-selection bubble that provides a user with all the possibilities at a particular 2D point. For instance, dropping a tack on 10-250 also offers 10-455 and the hallway below the lecture hall, among other possible rooms. The user may alternatively choose a broader space destination (e.g. Building 10) if the entry pertains to a larger area. In order to speak the user’s language, we incorporate room types into location choices. For instance, instead of the formal space code “7-100LA,” the location bubble displays “7-100 lobby.” A text field is also available if the user prefers to enter a colloquial location name.
(a) (b) (c)
If a user were to type a valid location name in the text field, we considered automatically moving the tack to that location. This would act as an alternative to dragging the tack across the map. In the end, we decided against this feature because it would be disorienting to users and confused with the ability to submit colloquial names.
Fig.4-6: Stages in adding WikiMap items: (a) choosing a location; (b) adding descriptive information; and (c) the final display.

53 Geometric, topological & semantic analysis of multi-building floor plan data
4.3.3 Displaying Added Items A consistency issue arose when prototyping the Add-item feature: What is displayed if the category of the added item is not selected as a Displayed Category? For example, the user adds a Sculpture item to the map, but only Quick Food and Bike Racks are selected. To deal with this issue, we decided to include the check box “Show all items I've added/edited this session” that decouples selection of display categories from the user’s personal contributions. In every round of user tests (since the paper prototype), we found that users frequently re-check items immediately after saving to ensure the information is displayed as expected. As such, we decided added item icons should always be displayed. This provides visual feedback for a successful save, and allows users to easily view and edit their contributions (i.e. user control). One considered alternative was to enforce consistency by automatically selecting the category of the added item as a Displayed Category. We decided it would be disorienting for a user’s category selections to be over-ridden. Instead, users are given complete control over category display.
4.3.4 Editing Landmarks
• Changing Location of an Entry
In the spirit of the Wiki, entries may need to be moved to new locations, while still retaining the rest of their data. We address this ‘user freedom’ feature by allowing the entry icons to be dragged. Upon a drop of an existing entry, we present the user with a location-selection bubble (as when adding an item for the first time). A special case arises when the user drags an icon while editing the entry. Here, we store the current state of the edit so that it is once again available upon drop. Edit state is also maintained if the user closes the edit bubble, or views other existing items before saving.
• Category Selection
For the sake of consistency we decided to restrict category edits to administrators, for example, to prevent redundant item groupings such as “buildings” and “architecture”. Future extensions may include hierarchal category lists to allow for greater variety of display selections and a form for user suggestions of categories. An alternative was to allow custom categories. Although this follows our original goal of having all content controlled by the user, the danger is a long, cluttered category list with inconsistent or absent icon images.

54 Geometric, topological & semantic analysis of multi-building floor plan data
4.3.5 Deterring Vandalism The ability to add and edit items is restricted to members of the MIT community. This distinction is made for two reasons: (1) community members are assumed to have sufficient familiarity with the campus that they can appropriately add items; and (2) this allows the WikiMap to deter vandalism.
Several measures were taken to deter vandalism. First, users are made accountable by requiring a valid MIT email address before finalizing a user's edits and additions. This allows the WikiMap administrators to associate every change to the system with a member of the MIT community so that proper actions may be taken against those who confirm inappropriate items.
Second, the power to delete an entry lies exclusively in the hands of the administrators. Any user may flag a WikiMap entry for deletion, but the action doesn't occur until an administrator approves it.
For efficiency reasons, users with add/edit permissions (MIT community members) will get only one email asking them to confirm all changes they made during a WikiMap session. This email is sent after completing the first change, but the confirmation will apply to all changes during the session, no matter when the user confirms. Only after this confirmation will a user's changes be publicly visible on the WikiMap.
4.3.6 System Information
• System Status
Some actions, such as displaying all sculpture items, may have no visible effect on the map, either because no such items exist, or the items are outside the viewport extents. To ensure users receive immediate feedback, status messages are displayed prominently above the map. A blue background hue (contrasting with map colors) and bold type add to visibility. This feature gives confirmation an action was completed successfully and speaks the user’s language. Displaying a category will return the message “Displayed n items on the map.” Pressing save on an edit will be confirmed with “Item successfully saved.” Messages are
Fig.4-7: Email confirmation dialog. After adding or editing a landmark for the first time, users are asked to submit an MIT email address. A confirmation email is automatically generated and sent to the address provided.
55 Geometric, topological & semantic analysis of multi-building floor plan data
removed after approximately 10 seconds to avoid screen clutter or messages taken out of context.
• Help & Documentation
For comprehensive information and instructions for use of the WikiMap, users are one click away from our background and help page.
4.4 Implementation
4.4.1 Languages The MIT WikiMap is built using Javascript, PHP, and MySQL aiming for a lightweight implementation that is easily loaded into a browser. The tradeoff is restricted functionality by Javascript’s narrow range of capabilities. One example where usability was compromised is that the map does not scroll when an icon is dragged outside the visible region. Scrollable maps are much easier to implement in a Java applet, however, this would add a large overhead on the initial load of the system.
4.4.2 Database The MIT WikiMap has a MySQL database for its backend. Data is stored persistently in the database as users add and edit items, organized in three tables:
1. “wikiobj” stores the data for each landmark object. 2. “wikiconfirm” tracks which entries are awaiting confirmation. 3. “wikicategories” binds category names to icon images.
We decided that we wanted the system to be as real-time as possible. We took advantage of many of the asynchronous capabilities of Javascript. When a user clicks a category to load it onto the map, an asynchronous call is made to our database, and XML is returned. This XML is then parsed and displayed to the user appropriately. This system design means that the user never needs to reload the page in order to view changes; they are all available immediately. Furthermore, when a user clicks an icon to load its information, it will first display a local version of the information (stored client-side in Javascript variables), and then will query the database to find the most up to date information for that item. If another user changes the information for a particular icon, that change will be immediately visible to other users (after clicking on that icon) - no page reloads are necessary. Note this only occurs if a user is viewing, rather than editing an item, since we would not want to overwrite a user’s edit.

56 Geometric, topological & semantic analysis of multi-building floor plan data
This real-time nature leads to a slight usability issue – a flicker upon opening an item’s information. This is caused by the call to the server asynchronously coming back and refreshing the information displayed to the user.
4.4.3 User Information The implementation relies on session variables for storing user information. When a user accesses the web page, a session variable called overallnonce is generated that uniquely identifies that user during the session. The session expires only if the browser window is closed. If the page is refreshed or the user presses back/forward in the browser, the session will persist. This was driven by a design decision to increase user control and freedom. Once a user adds or edits an item for the first time, she must enter an email address. Since we are using a session variable, this step needs to be completed only once. A confirmation email is then generated and sent to the address provided. The new item is stored in the database, with the “confirm” column of the entry initially set to 0 (off). Once the user confirms the object, the entry’s “confirm” column updates to 1 (on). Email confirmation is flexible. The user may click on the confirmation at any time. For example, a user may add/edit 10 different items then click on the link via email to confirm. Since all of the objects were changed in the same session, they will all be confirmed at once. Alternately, a user may add/edit an item, then click on the link provided in the email, and continue editing items. Future adds/edits in this session will be automatically confirmed, since the user already confirmed his/her identity.
4.4.4 Coordinate Locators When an item’s location is changed (after the user drags and drops an icon), the location matches for the new point are displayed. This information is retrieved by doing a point query, returning matches for the provided layer of data. There are four layers that we use in order to return these locations - rooms, greens, parking, and landmarks. For the rooms layer, we query a script that finds all rooms in our data model containing that x,y coordinate. As a consequence, multiple rooms will be returned if the coordinate goes through multiple floors. For the greens, parking, and landmarks layers, we query the IMS server to retrieve the results. The greens layer allows points such as Killian Court or McDermott Court to be identified. Parking is for parking lots and garages, and landmarks are for a small set of commonly known locations, such as 77 Mass Ave or the Harvard Bridge.

57 Geometric, topological & semantic analysis of multi-building floor plan data
One complication is that IMS returns space codes rather than colloquial names. For example, IMS calls Killian Court “G6”. In order to resolve this, an additional table stores all known bindings between space codes and colloquial names. After doing a point query to the various layers, we send off another asynchronous call to a script that returns these bindings as XML, and then replace the space codes with the colloquial names if available. Similarly, we make sense of the space codes when we know a more human-readable form for the location. We did this for lobbies, corridors, stairs, and elevators. Instead of returning “10-100LA” to the user, we return “10-100 lobby”.
4.4.5 Saving Item Edits When an item is edited, previous versions of the item in the database are left intact. The only part that changes is the “active” column of those entries. Only one entry in the database for a particular object (identified uniquely by a nonce) may be active at any time. This facilitates rolling back an entry if a user inappropriately edited an item.
4.4.6 Item State Finally, data entered by the user is persistent. When a user clicks to edit an item, makes a change, then closes the edit bubble without saving, the item’s state will be the same when the user returns to that item’s information. This is done by maintaining two sets of the item’s data – one that is editable and one that is not. Any time a change is detected (using onKeyUp and onMouseUp events), the editable version will change to reflect what the user did. If a user saves his/her changes, the editable version of the data will overwrite the non-editable version. Alternately, if the user cancels changes, the non-editable version will overwrite the editable version. This can be used even for location changes. Therefore, if a user drags an item to another location, then decides to put it back, there is a link he/she can click on that will jump the item back to its original location. We made this design decision in order to reduce errors and increase user control and freedom.
4.5 User Testing
4.5.1 Procedure User tests were conducted by finding volunteer users, briefing them, and then observing their ease of use while completing prescribed tasks at a computer. Since the WikiMap is web-based, the only equipment requirement was a computer with access to the Internet. To represent the MIT community, we requested participation from several friends and acquaintances, both undergraduates and graduates. The bulk

58 Geometric, topological & semantic analysis of multi-building floor plan data
of our users were from this group, which is reflective of our anticipated demographic for WikiMap usage. To represent MIT visitors, we asked a college student who was visiting MIT for a day. We began our user briefing with an overview: “The MIT WikiMap is a web-based, collaborative way of tagging features of the MIT campus by location.” We then asked our users if they were familiar with the concept of a Wiki. Those who were not familiar were briefed on how a Wiki allows public editing of common resources. Next, we asked our users if they had used Google Maps, after which we modeled our map zooming and panning UI. All users had used Google Maps. We did not provide a demo, since we hoped to observe the learnability of the interface. Before performing tasks, most users preferred to have a few moments to explore and experiment with the interface, which was granted. We asked each user to perform 3 tasks. MIT community members were asked the following:
1) Find a place to eat with bike parking nearby. 2) Add an item to the map at a specified location (different items and
locations for each user). 3) Edit an existing item on the map.
Non-community members currently do not have add/edit privileges so their tasks differed:
1) Locate 26-100 exactly. 2) Find a place to eat with bike parking nearby. 3) Find something interesting to see (artwork, sculpture, etc. at the
user’s discretion) on the eastern side of campus. To encourage a relaxed testing environment, the users were told that we were “testing the interface, not the user”.
4.5.2 Results The results of user testing were classified as cosmetic, minor, major or catastrophic usability problems. In the final design no cosmetic or catastrophic usability concerns were raised. Minor and major concerns are summarized below with proposed solutions: Minor: A user complained some icons (e.g. “Fun”) blend into the background. This could be solved by redesigning the icons, for example to have drop shadows. Text asking a user to enter an email address to validate the session was not easily understood at first read. We solved this by rewording the dialog box to be more concise.

59 Geometric, topological & semantic analysis of multi-building floor plan data
Major: Many users were unconsciously reluctant to zoom the map. All users had used Google Maps before, so all users knew that the map was zoom-able and how they could accomplish this. Despite this, new users tended to remain at the default zoom level, regardless of the number of items they displayed on the map or the area they were interested in. This could be alleviated by reminding users that they may zoom the map whenever more than a certain number of icons become displayed. Alternatively, zooming could be made more accessible, say, by having the scroll wheel control the zoom level. Users were often quick to enter their own place names. When presented with a list of locations in the location bubble, many users went straight to the “Name this location” field. Sometimes the user did this correctly (e.g. to put the item “DDR machine” in the “Game Room”), but other times users entered a room location simply because the tack was in the wrong place and they did not see their room listed. The users may have expected the tack or item to relocate to the correct location, but we made the decision not to do this as it could be disorienting, especially if the entered location was off-screen. We tried to mitigate this mistaken usage by explicitly stating to the user that their best action may be to reposition the tack.
4.6 Discussion Upon reflection, the iterative design process was critical to the success of our interface. We can all remember how pleased we were with our initial design, and we now all look back at it aghast at how much more usable and elegant our current design is. We chose to paper prototype virtually all of our front end. This exercise helped us recognize elements of our back end which were unrealistic (e.g. an intelligent search box that would parse complex search expressions). The paper prototype session also had its drawbacks. For instance, until the final user testing, we had a false sense of security that our status messages would guide the user. Indeed, they did in the paper prototype, but that probably owed to the fact that they were physically placed onto the interface, thus drawing attention to them. In our user testing, we found that users barely noticed the status messages, let alone took their advice.
Fig.4-8: An early paper prototype.

60 Geometric, topological & semantic analysis of multi-building floor plan data
5 Conclusions & Future Work
5.1 Future Work
5.1.1 Landmark Salience A compelling challenge is to integrate local landmarks into route-representations. Research in spatial cognition has shown that landmarks can be a powerful tool for communicating and visualizing directions [Lovelace et al 1999]. Examples include identifying origin and destination points, identifying decision points (points of reorientation, or junctions where current orientation is maintained), verifying route progress, and influencing expectation [Raubal and Winter 2002]. The main challenge is to develop a system to automatically define and extract salient landmarks from the existing campus model. Drawing from the semantic dataset described in Section 4, a measure of salience could be incorporated by analyzing landmarks according to such features as singularity (contrast with the surroundings), prominence/visibility, or content (having meaning or cultural significance).
• Visual Salience
Some landmarks fit naturally into the mechanisms developed for describing model geometry in generic walkthrough systems: e.g., interior windows, unusual entranceway dimensions, distinctive floor surfaces or wall colors or textures. Such regional differentiating features provide contrast with their surroundings and contribute to a measure of visual salience. [Raubal and Winter 2002] also suggest visibility of façade and shape factor (deviation of façade area to bounding rectangle) as salient qualities.
• Structural Salience
Structural salience corresponds to the elements defined by Kevin Lynch [1960] that structure a city, classified as nodes, boundaries, and regions.
Fig.5-2: Structurally salient locations on campus. (Left) the entrance to Lobby 7; (right) navigational signs posted inside Lobby 10.

61 Geometric, topological & semantic analysis of multi-building floor plan data
The topological model presented in this thesis affords a number of possibilities for extracting structurally salient locations on campus. For example, comparing the relative connectivity of spaces in the space-graph may reveal important nodes in the structure of MIT campus. In Figure 5-3 below, hallways emerge as structurally salient spaces due to the many classrooms to which they provide access. Connectivity comparisons could be further enhanced by weighting edges based on predefined notions of importance. For instance, a connection to a corridor or elevator is more useful for movement through a building than a connection to an office. Thus, a lobby linked to two corridor spaces might rank higher than a classroom with two portal edges to a lab and storage space.
5.1.2 Route Preferences As an alternative to hard constraints (e.g. rolling routes that cannot ascend staircases), future work could incorporate route preferences. For example, during the winter a student may prefer an indoor route to class, but will agree to take a short detour outdoors if it reduces his travel time by five minutes. Soft constraints such as this could be implemented through edge weight adjustments – any graph edge leading to an outdoor space is weighted more heavily, depending how strongly the traveler specifies his inclinations.
5.1.3 Route Visualization The problem of visualizing routes inside buildings presents specific challenges. In particular, an extra dimension (the z-axis) is required to illustrate vertical movement such as ascending a staircase. Our current 2D map does not make use of height information; instead, all features are projected onto a plane which may result in a cluttered and ambiguous path when traversing multiple floors (see Fig. 5-4).
Fig.5-3: Floor plans of MIT buildings 10 and 7, superimposed with a graph representation. Hallways emerge as nodes with high connectivity.

62 Geometric, topological & semantic analysis of multi-building floor plan data
A possible solution is to display route maps in 3D. However, this requires a display mechanism allowing viewers to simultaneously see interior spaces and exterior structure of the environment. Standard viewers for three-dimensional building models are suited to display exterior structure, but occlude indoor spaces. On the other hand, walkthrough interfaces reveal inner structure, but only for individual rooms. One technique used by illustrators is to create exploded views separating buildings into individual floors. The work by [Niederauer et al. 2003] presents a system for interactively generating such views of 3D architectural environments. Incorporating such a display interface into the MIT Route Finder would greatly enhance usability. Furthermore, the Niederauer visualization system provides interactive control. Allowing users the additional ability of visualizing routes from multiple viewpoints may have great benefits to their spatial cognition, enhancing the mental map they form of a route.
5.1.4 Route Granularity The route-finding applications described in this thesis offer a fine-grained, human-centered approach to navigation services in built environments. If integrated with other higher-level mapping services, this could lead to applications which model multiple levels of granularity in urban environments, providing a continuous representation between traffic networks and interior spaces. For example, defining interface points between Google Maps and MIT Maps could enable the following scenario:
A student’s parents are visiting for the weekend. Their hotel is near Boston Commons and their son’s architecture studio is in 7-403. A query to MIT Maps automatically redirects the first part of the search to Google Maps for a route from the hotel address to the parking lot nearest Building 7. MIT Maps determines the remaining path as a walking route from the lot to 7-403. The final display presents one continuous route with an icon to mark the parking lot location, and color coded paths indicating walking and driving segments.
Fig.5-4: Sample vertical route inside a building. The path goes through 1st and 2nd floor corridors that overlap in plan view.
Fig.5-5: An exploded view of a multi-story building showing both interior and exterior structure [Niederauer et al. 2003].

63 Geometric, topological & semantic analysis of multi-building floor plan data
5.2 Conclusions [what is the impact? Will this be used as a design tool or change the way people perceive space?]
The principal motivation of this work was to develop an intuitive, human-centered approach to landmark-based navigation systems in a large urban space. This thesis presents a framework for constructing a topological representation of large environments from floor plan geometry. The MIT campus (over 160 buildings, containing over 1000 floors, 30,000 interior spaces and 7,000 outdoor spaces) is used as a test bed. A framework was developed for constructing graphs of the campus from MIT floor plan data to generate detailed maps of individual buildings in their correct locations, incorporating information on the identity of rooms and spaces.
An exhaustive classification of adjacency types is provided for the university infrastructure, including roads, walkways, green-space, and the detailed interior spaces of campus buildings (portals, rooms, corridors, lobbies, stairs, elevators, etc.). In particular, methods were developed to identify and classify portals comprehensively for building interiors and interfaces.
The system is designed to assist campus visitors in finding their way from one location to another, with the additional ability of specifying route constraints. For this purpose a prototype application was developed using a modified Dijkstra’s graph search algorithm that provides for efficient custom routes throughout the MIT campus with coverage of interior and exterior environments. To visualize natural-appearing intra-space paths an improved path representation algorithm based on constrained Delaunay triangulation was developed, which approximates the medial axis with reduced computational cost.
A second application, an interactive database (the MIT WikiMap) provides for collaborative tagging of geographical locations on the MIT campus by functional, historical or cultural features. The database was designed and user-tested for interfacing with users to collect semantic data. The MIT Wikimap can be used to add, edit and search information about campus locations and serves as a collective record of the university community’s knowledge of campus.

64 Geometric, topological & semantic analysis of multi-building floor plan data
Bibliography Agrawala, M. and Stolte, C. Rendering Effective Route Maps: Improving Usability
Through Generalization. In Proc. of SIGGRAPH 2001, pp. 241-249, 2001.
Battat, Y. M.Eng. Thesis, Massachusetts Institute of Technology (In Progress).
Bell, J. An API for Location Aware Computing. M.Eng. Thesis, Massachusetts Institute of Technology, 2003.
Bern, M. and Eppstein, D. Mesh generation and optimal triangulation. In Hwang, F. and Du, D. (eds.), Computing in Euclidean Geometry, pp. 23-90, World Scientific, 1992.
Bray, T., Paoli, J., Sperberg-McQueen, C., Maler, E. and Yergeau, F. Extensible Markup Language (XML) 1.0 – 3rd edition, originally published 2004. [http://www.w3.org/TR/REC-xml/].
Cham, J. In Piled Higher & Deeper, originally published December 1, 2005. [http://www.phdcomics.com/comics/archive.php?comicid=656].
Cormen, T., Leiserson, C., Rivest, R. and Stein, C. Introduction to Algorithms – 2nd edition. The MIT Press and McGraw-Hill, 2001.
Darken, R. and Peterson, B. Spatial orientation, wayfinding, and representation. In Stanney, K. (ed.), Handbook of Virtual Environments: Design, Implementation, and Applications, pp. 493-518, Lawrence Erlbaum Associates, 2002.
de Berg, M., van Kreveld, M., Overmars, M. and Schwarzkopf, O. Computational Geometry: Algorithms and Applications. Springer-Verlag, 2000.
Gold, C. Simple Topology Generation from Scanned Maps. In Proc. of Auto-Carto 13, ACM/ASPRS, pp. 337-346, Seattle, April 1997.
Guibas, L. and Stolfi, J. Primitives for the Manipulation of General Subdivisions and the Computation of Voronoi Diagrams, ACM Transactions on Graphics, Vol. 4, No. 2, pp. 75-123, 1985.
Haunert, J.-H. and Sester. M. Using the Straight Skeleton for Generalisation in a Multiple Representation Environment. In Proc. of ICA Workshop on Generalisation and Muliple Representation, Leicester, August 2004.
Joan-Arinyo, R., Perez-Vidal, L. and Gargallo-Monllau, E. An Adaptive Algorithm to Compute the Medial Axis Transform of 2-D Polygonal Domains. In Brunet, P. and Roller, D. (eds.), CAD Tools for Products, Springer-Verlag, 1996.
Klippel, A., Tappe, H., Kulik, L. and Lee, P. Wayfinding Choremes – A Language for Modeling Conceptual Route Knowledge.
Klippel, A. and Winter, S. Structural Salience of Landmarks for Route Directions.
Kulikov, V. Generating a Model of the MIT Campus Terrain. M.Eng. Thesis, Massachusetts Institute of Technology, May 2004.
Latombe, J. Robot Motion Planning. Kluwer Academic Publishers, 1991.

65 Geometric, topological & semantic analysis of multi-building floor plan data
Lee, D.T. Medial Axis Transformation of a Planar Shape. IEEE Trans. Pattern Anal. and Mach. Intelligence PAMI-4, pp. 363-369, 1982.
Lee, J. A Spatial Access Oriented Implementation of a Topological Data Model for 3D Urban Entities. GeoInformatica, Vol. 8, No. 3, pp. 235-262, 2004.
Lischinski, D. Incremental Delaunay Triangulation. In Heckbert, S. (ed.), Graphics Gems IV, Academic Press, pp. 47-59, 1994.
Look, G., Kottahachchi, B., Laddaga, R. and Shrobe, H. A Location Representation for Generating Descriptive Walking Directions. IUI'05, January, 2005.
Lovelace, K., Hegarty, M., and Montello, D. Elements of Good Route Directions in Familiar and Unfamiliar Environments. Spatial Information Theory, pp. 65-82, Springer, Berlin, 1999.
Lynch, K. The Image of the City. The MIT Press, 1960.
Nichols, P. Location-Aware Active Signage. M.Eng Thesis, Massachusetts Institute of Technology, January 2004.
Niederauer, C., Houston, M., Agrawala, M. and Humphreys, G. Non-Invasive Interactive Visualization of Dynamic Architectural Environments. In Proc. of ACM SIGGRAPH’03 Symposium on Interactive 3D Graphics, 2003.
Nielsen, J., and Molich, R. Heuristic Evaluation of User Interfaces. Proceedings of ACM CHI’90 Conference on Human Factors in Computing Systems, pp. 249-256, 1990.
Nothegger, C., Winter, S. and Raubal, M. Computation of the Salience of Features. Spatial Cognition and Computation, Vol. 4, No. 2, pp. 113-136, 2004.
Raubal, M. and Winter, S. Enriching Wayfinding Instructions with Local Landmarks. In Egenhofer, M.J. and Mark, D.M. (eds.), Geographic Information Science. Vol. 2478, pp. 243—259, Springer, Berlin, 2002.
Richter, K. and Klippel, A. A Model for Context-Specific Route Directions. Spatial Cognition IV, pp. 58-78, 2005.
Roush, W. Killer Maps. Technology Review, Vol. 108, No. 10, pp. 54-60, October 2005.
Sorrows, M. and Hirtle, S. The Nature of Landmarks for Real and Electronic Spaces. In Freksa, C. and Mark, D. (eds.), Spatial Information Theory, pp.37-50, Springer, Berlin, 1999.
Timpf, S and Frank, A. Using Hierarchical Spatial Data Structures for Hierarchical Spatial Reasoning. In Hirtle, S. and Frank, A. (eds.), Spatial Information Theory, pp. 69-83, Springer, Berlin, 1997.
Teller, S., Funkhouser, T., Khorramabadi, D. and Sequin, C. The UCB System for Interactive Visualization of Large Architectural Models. Prescence, Vol. 5, No. 1, January, 1996.
Varadhan, G. and Manocha, D. Out-of-Core Rendering of Massive Geometric Environments. In Proc. of IEEE Visualization, 2002.
Whiting, E., Giovine, G. and Stoltzman, W. MIT WikiMap. 6.831: User Interface Design & Implementation, Final Report, Massachusetts Institute of Technology, December 2005.

66 Geometric, topological & semantic analysis of multi-building floor plan data
MassGIS Datalayers/GIS Database Overview. Office of Geographic and Environmental Information, Commonwealth of Massachusetts Executive Office of Environmental Affairs. March 2006. [http://www.mass.gov/mgis/dd-over.htm].

67 Geometric, topological & semantic analysis of multi-building floor plan data
A Project Build Instructions This chapter describes how to checkout, build and execute the applications described in this thesis, including the vertical portal linker, dangling portal linker, CDT generator, and the location server. The instructions assume an MIT CSAIL account and a LINUX command-line environment.
A.1 Checkout Instructions The applications described in this thesis are stored in the CSAIL SVN repository as part of the walkthru/mit source tree. To check out the entire directory, first move to the directory where your local checkout of the walkthru source tree will be hosted, then type one of the following commands: From a CSAIL machine with local access to the repository:
% svn checkout file:///${REPOSITORY} With remote access to the repository through ssh:
% svn checkout svn+ssh://login.csail.mit.edu/${REPOSITORY}
The variable REPOSITORY is the path to the repository, which currently resides at: /afs/csail/group/rvsn/Repository/walkthru/mit.
A.2 Invoking Applications
A.2.1 Location Server
The location server is invoked with the following command-line arguments:
% LocationServer mode file directory floor1 ... floorN The mode parameter specifies whether the location server is run in batch processing mode, where the parameter is BATCH_OUT, or quick start mode, where the parameter is QUICK_START. To compile and invoke the location server using the included Makefile, first move to the directory LocationAwareXML/locationserver then type:
% rmiregistry & % make all % make full
Alternatively, to load only the basemap spaces, type make basemap instead of make full.

68 Geometric, topological & semantic analysis of multi-building floor plan data
A.2.2 Vertical Portal Linker
A.2.3 CDT
% cdtxml –input inputDirectory inputFilename –output outputDirectory outputFilename
e.g.
% cdtxml –input cdt/input/ 1-0.xml –output cdt/output 1-0.xml

69 Geometric, topological & semantic analysis of multi-building floor plan data
B Portal & Space Types The following are lists of type codes used to define spaces and portals in the xml data model. Portal Class Portal Type Code vertical stair STAIR elevator ELEV horizontal explicit EXPLICIT implicit IMPLICIT basemap OUTDOOR slope SLOPE Space Type Code sidewalk SDWLK street HGWAY grass GRASS construction CNSTR slope SLOPE building footprint BLDNG unknown UKNWN Space Type Code ALTER/CONVERSION ALTER ANIMAL QUARTERS AN QTR ANIMAL RSCH LAB AN LAB ANIMAL SERVICE AN SV APARTMENT APTMNT APARTMENT SVC APTSVC ATH LOCKER ROOM ATH LK ATH SHOWER ROOM ATH SH ATHLETIC FACIL ATHLET ATHLETIC SERVICE ATH SV BRIDGE/TUNNEL BR/TUN CLASSROOM CLASS CLASSROOM SVC CLA SV COAT ROOM COAT COMPUTER FACIL CMPUTR COMPUTER SERVICE CMP SV CONFERENCE ROOM CONF CORRIDOR CORR DARK ROOM DK RM DAY CARE DAY CR DAY CARE SV DC SVC DIAGNOS SVC LAB DS LAB DRAFTING ROOM DRAFT ELEC/TEL CLOSET EL/TEL ELECTRIC CLOSET ELEC ELEVATOR ELEV EXHIBITION FACIL EXHIB EXHIBITION SVC EXH SV FEMALE LAVATORY F LAV FOOD FACIL SVC FOODSV FOOD FACILITY FOOD
Table B-1: Portal types.
Table B-2: Basemap space types [Kulikov 2004].
Table B-3: Indoor space types as defined by MIT’s Department of Facilities [https://floorplans.mit.edu/mit-explore.html].

70 Geometric, topological & semantic analysis of multi-building floor plan data
GUEST ROOM GUEST HEALTH CARE SVC HC SV HOUSEMASTER APT H MSTR INSTRUCTION SHOP INSTRC INSTRUMENT ROOM INSTRU JANITOR CLOSET JAN CL JANITOR LOCKER JAN LK JANITOR STORAGE JAN ST LAB SUPPORT SHOP LAB SP LABORATORY SVC LAB SV LAUNDRY FACIL LAUN LECTURE HALL LECT H LIBRARY PROCESS LIB PR LIVING QUARTERS LIVING LOBBY LOBBY LOUNGE LOUNGE MAIL ROOM MAIL MAINTENANCE SHOP M SHOP MALE LAVATORY M LAV MEDIA PRODUCTION MEDIAP MEDIA SERVICE MEDIAS MERCHAND FACIL MERCH MERCHAND SVC MER SV MULTI-PURPOSE RM MULTI MUSIC PRACTICE MU PRA NON-ATH LOCKR RM N-A LK NURSE STATION NURSE OFFICE OFF OFFICE SERVICE OFF SV PATIENT BATHROOM PBATH PATIENT BEDROOM PBEDR PRINT/DUP SHOP PR/DUP PUBLIC LAVATORY PB LAV PUBLIC WAITING P WAIT PVT CIRCULATION P CIRC PVT LAVATORY P LAV RECEIVING ROOM RCVG RECREATION FACIL RECREA RESEARCH LAB RS LAB RSCH LAB-OFFICE RES LO SECY/RECEPTION SECY/R SHAFT SPACE SHAFT SHOP SERVICE SHP SV SLEEP/STD W/BATH SLPBTH SLEEP/STUDY SVC SLPSVC SLEEPSTD W/OBATH SLEEP STACK/STUDY STKSTD STAIRWAY STAIR STORAGE FACILITY STOR STUDIO STUDIO STUDY ROOM STUDY SURGERY SURG TEACHING LAB TC LAB TELECOM CLOSET TELE TERRACE TERR TOILET OR BATH BATH TREATMNT/EXAM RM TRT/XM UTILITY/MECH RM U/M VAULT VAULT VEHICLE STORAGE VEH ST