Embed Size (px)
Citation preview
1
Geology of the Snap Lake kimberlite intrusion, NW Territories, Canada: Field 1
observations and their interpretation 2
T. M. Gernon1, M. Field
2 & R.S.J. Sparks3 3
1 School of Ocean and Earth Science, University of Southampton, Southampton, SO14 3ZH, UK 4
2 DiaKim Consulting Limited, Wells Road, Wookey Hole, Wells, Somerset, BA5 1DN, UK 5
3 Department of Earth Sciences, University of Bristol, Bristol, BS8 1RJ, UK 6
Running title: Geology of the Snap Lake kimberlite intrusion 7
ABSTRACT 8
The Cambrian (523 Ma) Snap Lake hypabyssal kimberlite intrusion, Northwest Territories, 9
Canada, is a complex segmented diamond-bearing ore-body. Detailed geological investigations 10
suggest that the kimberlite is a multi-phase intrusion with at least four different magmatic 11
lithofacies. In particular, olivine-rich (ORK) and olivine-poor (OPK) varieties of hypabyssal 12
kimberlite have been identified. Key observations are that the olivine-rich lithofacies has a strong 13
tendency to be located where the intrusion is thickest and that there is a good correlation between 14
intrusion thickness, olivine crystal size and crystal content. Heterogeneities in the lithofacies are 15
attributed to variations in intrusion thickness and structural complexities. The geometry and 16
distribution of lithofacies points to magmatic co-intrusion, and flow segregation driven by 17
fundamental rheological differences between the two phases. We envisage that the low viscosity 18
OPK magma acted as a lubricant for the highly viscous ORK magma. The presence of such low 19
viscosity, crystal-poor magmas may explain how crystal-laden kimberlite magmas (> 60 vol.%) 20
2
are able to reach the surface during kimberlite eruptions. We also document the absence of 21
crystal settling and the development of an unusual sub-vertical fabric of elongate olivine crystals, 22
which are explained by rapid degassing-induced quench crystallisation of the magmas during and 23
after intrusion. 24
KEY WORDS: kimberlite; magma; intrusion; Snap Lake; emplacement processes 25
26
This paper presents a field and petrographic description of an exceptionally well-exposed 2 to 3 27
m-thick hypabyssal kimberlite intrusion at Snap Lake Diamond Mine, NW Territories, Canada. 28
We present data on intrusion thickness, lithofacies relationships, crystal size distributions, crystal 29
fabric, crystal content and crystal concentration profiles. The Snap Lake intrusion provides 30
important new insights into the architecture and emplacement processes of high-level magmatic 31
plumbing systems. 32
Many processes can occur during magma transport or intrusion, including melting and 33
solidification (Delaney & Pollard, 1982; Huppert & Sparks, 1988; Marsh, 1996), crystallisation 34
and gravity-driven crystal fractionation (Shaw, 1965; Martin & Nokes, 1988; Blundy & 35
Cashman, 2001, 2005), in-situ differentiation (Sparks et al., 1984; Mitchell, 2008), assimilation 36
of wall-rock and contamination (Philpotts & Asher, 1993; Sparks et al., 2009), injection of 37
different magma batches (Eichelberger, 1980; Eichelberger et al., 2000), magma mixing or 38
unmixing (Sparks et al., 1977; McBirney, 1980; Spera, 2000; Couch et al., 2001), and flow 39
differentiation (Komar, 1972a-b). Another key magmatic process is viscous segregation, which 40
can occur during the co-intrusion of discrete magma batches (Carrigan, 2000). Where present in 41
kimberlite intrusions, rheological segregation may have economic implications in that there could 42
3
be variability in diamond size distributions within different magma batches. This provides an 43
explanation for the juxtaposition of barren and economic hypabyssal kimberlite lithofacies. It is 44
likely that a complex interplay of all these processes occurs during kimberlite ascent from the 45
asthenospheric mantle to the upper crust. 46
Magma ascent rates are controlled by rheology and vary over several orders of magnitude. 47
Ascent rates range from 0.001 to 0.15 m s-1 for basaltic magmas (Carrigan et al., 1992). Ar–Ar 48
investigations of xenolith phlogopites (Kelley & Wartho, 2000), garnet dissolution studies (Canil 49
& Fedortchouk, 1999) and dynamical and thermodynamic constraints (Sparks et al., 2006; 50
Kavanagh and Sparks, 2009) suggest that kimberlite magmas are transported from the mantle to 51
upper crustal levels in a matter of hours to days at velocities on the order of > 4 to 20 m s-1. The 52
timescales required for chemical corrosion and alteration observed in the host-rock adjacent to 53
kimberlite intrusions requires stalling of magma at shallow to intermediate crustal levels prior to 54
transport to the surface (Brown et al., 2007). Kimberlites are known to show evidence for in-situ 55
differentiation (e.g., Dawson and Hawthorne, 1973), which is also indicative of magma stalling 56
prior to eruption. 57
The intrusive emplacement of kimberlite magmas is usually considered a precursor to, or 58
contemporaneous with diatreme–vent formation (Sparks et al., 2006; Mitchell, 2008). As such, 59
detailed geological studies are needed to understand the dynamics of kimberlite eruptions. Snap 60
Lake Mine presents excellent 3D exposures of a hypabyssal kimberlite intrusion. The kimberlite 61
intrusion contains abundant large olivine crystals whose distribution and fabric provide 62
constraints on rheological properties and emplacement processes. Its study constrains the large- 63
and small-scale processes of kimberlite emplacement in the upper crust and may shed light more 64
generally on the magmatic plumbing of diatreme–vent systems. The relationship between olivine 65

4
abundance and grain size with diamond grade and distribution at Snap Lake is assessed elsewhere 66
(Field et al., 2009). 67
GEOLOGICAL SETTING 68
The Snap Lake Diamond Mine is located ~220 km northeast of Yellowknife in the Northwest 69
Territories of Arctic Canada (Fig. 1a). The Snap Lake Intrusion (SLI) is a complex segmented 70
orebody comprising a series of sub-parallel sheets, dipping 5 to 30° towards the northeast. In 71
parts of the mine, the SLI is exposed as a single well-defined intrusion, ranging in thickness 72
between 0.1 and 15 m, but typically in the thickness range 3 to 5 m. In other areas there are 73
multiple intrusions that are thought to be connected in three-dimensions. Multiple intrusions can 74
extend over vertical distances of < 30 m in borehole intersections. A key and critical part of the 75
intrusion are offsets or ‘steps’ and interconnections or ‘ramps’ between adjacent dyke segments, 76
the location of which are commonly related to structural and compositional variability in the 77
country rock. 78
The kimberlite was intruded in the Cambrian period (535 to 523 Ma; Agashev et al., 2001; 79
Heaman et al., 2003, 2004) into complex deformed country rocks that form part of the Archaean 80
Slave Province (Fig. 1b; Hammer et al., 2004). Country rocks in the Snap Lake area comprise 81
granodiorites, tonalites and granites of the Defeat Pluton Suite (2610 to 2590 Ma) and 82
metavolcanic rocks including layered amphibolites, high-grade metaturbidites and migmatites of 83
the Yellowknife Supergroup (Figs. 1b to 1c; Stubley, 2000, unpublished data). The country rocks 84
adjacent to the intrusion do not show any evidence of a thermal aureole. Underground the SLI 85
crosses the NNW-SSE trending contact between the granitoids and metavolcanic rocks (Fig. 1e). 86
The crustal stress regime likely governed the location and geometry of the intrusion, as has been 87

5
reported at other kimberlite clusters (e.g. Venetia, South Africa; Kurszlaukis and Barnett, 2003). 88
Although on a regional scale the intrusion is modelled as a continuous discordant sheet, locally it 89
runs parallel to undulating foliations within the metavolcanic rocks, and a primary set of sub-90
horizontal joints within the granitoids (McBean et al., 2003). At Snap Lake, Archaean host rocks 91
are cut by several northeast-trending Proterozoic faults (Fig. 1c) and by three suites of diabase 92
dykes, of likely Paleoproterozoic age (LeCheminant and van Breemen, 1994; LeCheminant et al., 93
1997). The dextral strike-slip Snap Fault and associated structures (Fig. 1c) are related to the 94
collision of the Slave and Churchill Cratons (1840 to 1735 Ma; Stubley, 2000). Although fault 95
movement dominantly occurred >1.27 Ga (as constrained by Mackenzie diabase dykes), later 96
reactivation occurred prior to kimberlite emplacement, resulting in normal high-angle 97
displacements (Stubley, 2000). This process is thought to have produced extensive tension 98
fracture systems dipping at low to intermediate angles to the north (M. McCallum, pers. comm.). 99
The orientation of these fractures closely matches that of the SLI (Fig. 1d), and it is thought that 100
these may have influenced kimberlite emplacement (Stubley, 2000). 101
OBJECTIVES & METHODOLOGY 102
Active workings at Snap Lake Mine (Figs. 1c & 1e) were mapped at 1 : 750 and 1 : 400 scales on 103
mine-produced base maps. Mapping was undertaken in ramps (inclined tunnels used for haulage) 104
and test panels (block excavations supported by multiple ore columns), both of which provided 105
superb three-dimensional exposures. Here, mining ramps are referred to as tunnels to avoid 106
confusion with the ramps or steps related to dyke emplacement. The intrusion is exposed in the 107
main tunnels of the mine (zone 1, Fig. 1e) and test panels to the southeast (zone 2, Fig. 1e). Most 108
of the outcrops described are exposed from 280 to 300 m elevation (Fig. 1d). For poorly 109
accessible regions of the intrusion, geological information was gained from logging drill-core and 110
6
drill-core records. The Snap Lake area has been intersected by 460 boreholes over a 12-year 111
period, accounting for > 2.7 km of core. In general, the drill holes were evenly distributed across 112
the area to facilitate early stages of exploration. 113
The architecture, structure and lithofacies of the intrusion were documented, and variations in 114
texture, crystal (olivine) size distribution and crystal content in the intrusion were measured. 115
Olivine crystal sizes were measured in a 1 m2 grid using digital callipers at regularly spaced 116
intervals, and measurements included maximum olivine size and the mean of the 5 largest olivine 117
crystals. Crystal content (area %) was measured using a combination of visual estimates and 118
image analysis employing high-resolution oriented photographs of rock faces. Sub-vertical 119
graphic logs and crystal concentration profiles were constructed through sections of the intrusion 120
at regular intervals (perpendicular to the margins). Image analysis was used to quantify olivine 121
crystal fabrics. Images of olivine crystals were digitised in the image analysis program, ImageJ 122
(NIH, 2006), which provided major axis measurements, together with the angles of these major 123
axes from the horizontal. These data were then plotted in the “R” program (R, 2006) that 124
generated rose diagrams depicting crystal axis orientation and length. Polished slabs and thin 125
sections were produced from representative samples of each lithofacies in the intrusion. 126
Petrography was carried out using an optical microscope and a HITACHI S-3500 N Scanning 127
Electron Microscope. Ogilvie-Harris et al. (2009) present a detailed study of the petrology of the 128
intrusion. 129
TERMINOLOGY 130
We adopt the definition of a hypabyssal kimberlite as “a hybrid rock consisting of mantle-derived 131
xenocrysts and primary phases that crystallised from the magma” (Mitchell, 1986, 2008). The 132

7
term macrocryst is used to describe anhedral-to-subhedral crystals, which are typically > 0.5 mm 133
in diameter and inferred to be mantle-derived. In the following description, we distinguish 134
macrocrysts using the terms fine, medium, coarse and very coarse to describe grains with the 135
following respective diameters: 0.5 – 2 mm, 2 – 6 mm, 6 – 20 mm and > 20 mm. The term 136
microcryst refers to small (< 0.5 mm diameter) groundmass crystals. We use the term olivine to 137
refer to a serpentinised olivine pseudomorph. In discussing crystal orientations, the term sub-138
vertical fabric is used to describe the dominant inclination of elongate macrocrysts within 10° of 139
the vertical with respect to the intrusion contacts. A sub-horizontal fabric refers to the 140
imbrication of elongate crystals within 10° of the horizontal relative to the intrusion contacts. The 141
term ramp is used to describe thin (typically 0.1 – 1 m diameter), relatively high angle (10º – 40º) 142
dilations within the intrusion, which cut through the country rock connecting adjacent intrusion 143
segments. In this paper, we follow the terminology introduced to kimberlite geology by Sparks et 144
al. (2006). 145
FIELD AND PETROGRAPHIC OBSERVATIONS 146
The SLI is typically a moderate to highly porphyritic hypabyssal intrusion consisting of 147
suspended altered olivine crystals in a fine-grained matrix (Fig. 2a). The rock is pervasively 148
altered; fresh olivine has not yet been found and all olivine crystals are pseudomorphed by 149
serpentine. Calcite and dolomite are present, both in the interstices between crystals and as 150
lenticular veins, which commonly cut across original igneous textures and fabrics. Alteration 151
varies in style; for example, olivine is commonly replaced by pale (low Mg) serpentine and in 152
some zones by dark (high Mg) serpentine. The proportion of olivine crystals varies significantly 153
throughout the intrusion. In places, the content of macrocrysts is ≥ 20% and here it is defined as 154
8
olivine-rich. Where the crystal content is < 20%, it is defined as olivine-poor. This threshold was 155
chosen because samples show bimodality in crystal content and 20% is approximately the 156
boundary between the two groups. 157
Kopylova et al. (2010) describe the mineralogy of Snap Lake kimberlites, and interpret the OPK 158
to represent a pervasively altered version of ORK. However, the alteration model presented in 159
Kopylova et al. (2010) is inconsistent with our field observations and petrological investigations. 160
Below, we present detailed textural observations and measurements of the kimberlites, which 161
provide compelling evidence for a discrete olivine-poor kimberlite (OPK) lithofacies. Further 162
support for the existence of OPK and ORK is given by the contrasted mineralogical and 163
petrological characteristics of the two key lithofacies (Ogilvie-Harris et al., 2009). Additional 164
evidence for a complex multi-phase emplacement is provided by anisotropy of magnetic 165
susceptibility (AMS) analyses, which demonstrates at least two distinct flow directions attributed 166
to a late-stage second phase of kimberlite magma within the intrusion (O'Keefe and Cruden, 167
1999). 168
Textural variations 169
Olivine-rich hypabyssal kimberlite (ORK) 170
The olivine-rich lithofacies typically has a massive appearance (Figs. 2a), and dominantly 171
comprises fine to coarse olivine macrocrysts (20 to 75 area %; Figs. 2a-b), olivine microcrysts 172
(10 to 50 area %; Fig. 2c-d), very coarse macrocrysts (~5 area %), and a range of country rock 173
xenoliths (typically 2 to 10 area %, locally ≥ 25 area %). The country-rock xenoliths are 174
restricted in distribution, and tend to occur near major offsets in the segmented intrusion. In thin 175
section, serpentine both replaces olivine and is recognised in the interstices between crystals. 176
9
Some pseudomorphed groundmass microcrysts may be after monticellite rather than olivine 177
based on their equant shapes (e.g. Fig. 2d). Complex intergrowths of serpentine and apatite are 178
observed. Secondary dolomite occurs in the interstices between crystals. Together with 179
serpentinised olivine, groundmass components include phlogopite (3 to 20%), apatite (3 to 10%), 180
chrome spinel (~ 1%), rutile (~ 1%) and titanite (< 1%). Phlogopite and apatite are typically 181
highly localised and occur in small (100 to 500 μm diameter) accumulations. In general, the ORK 182
contains relatively large (0.1 to 1 mm) elongate phlogopite laths, commonly exhibiting decussate 183
textures. 184
Olivine crystal fabrics: Olivine macrocrysts are generally anhedral-to-subhedral and typically 185
elongate, with length : width ratios ranging between 2 : 1 to 10 : 1. At an outcrop scale, a 186
preferred sub-vertical alignment fabric of olivine long axes (i.e. perpendicular to the intrusion 187
walls) is commonly seen (Fig. 2a-c). The fabric orientation is generally consistent over lateral 188
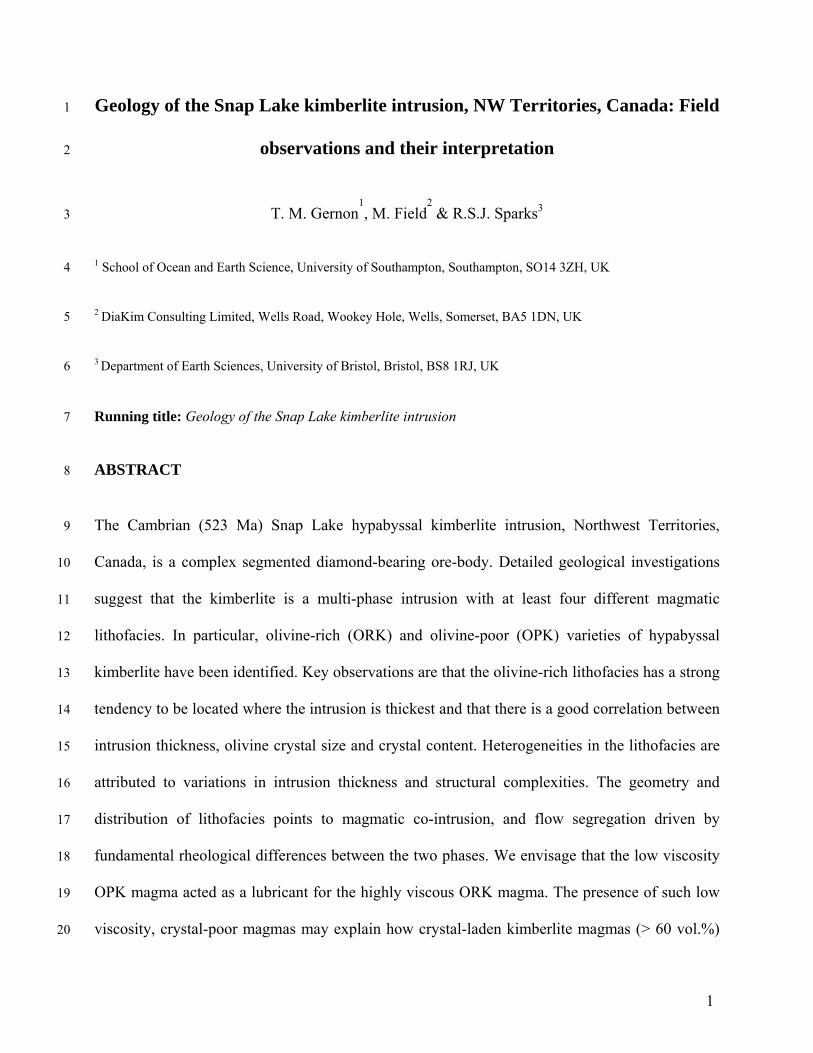
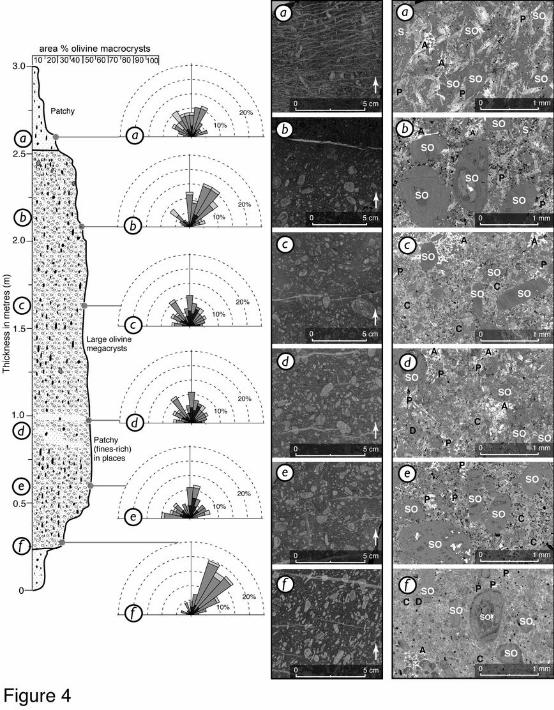
distances of tens of metres (Fig. 3), but typically varies vertically in the intrusion (e.g. Fig. 3, logs 189
2 & 3). Within olivine-rich regions, the crystal content occasionally increases in cm-dm scale 190
patches so that the crystals are densely packed (60 to 75 area %). 191
Figure 3 shows a graphic log through a typical section of hypabyssal kimberlite from zone 1 192
of the intrusion (Fig. 1e). The crystal content is uniform throughout, with the exception of 193
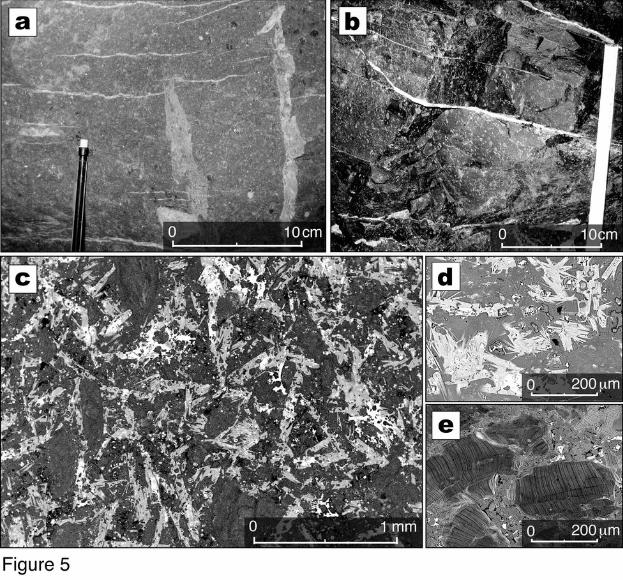
relatively thin (0.3 – 1 m) regions of olivine-poor kimberlite (OPK, described below) at the top 194
and bottom of the intrusion. Several traverses show an increase in crystal size towards the centre 195
of the intrusion (e.g. Fig. 3, logs 4 & 6). Crystal orientations are generally random in the upper 196
0.5 metres (e.g. Fig. 3, log 2). The central crystal-rich zone exhibits steeply inclined fabrics, 197
ranging from 60° to 90° relative to the intrusion margins (Fig. 3). The basal metre also shows 198

10
strong fabrics, with macrocrysts being inclined at 50º to 80º (from W to E, e.g. Fig. 3, log 2). A 199
similar fabric is developed near the base of the ORK component of profile ND1-01 (see Fig. 1e), 200
where macrocrysts are strongly inclined at angles ranging from 10° to 75° (from SW to NE; Fig. 201
4). However, in this part of the intrusion, macrocryst orientations are generally highly variable 202
(Fig. 4). 203
Olivine-poor hypabyssal kimberlite (OPK) 204
The olivine-poor kimberlite (OPK) lithofacies is characterised by a relatively low proportion of 205
fine to medium olivine macrocrysts (5 to 20 area %; Figs. 5a-b), a paucity of coarse olivine 206
macrocrysts and mantle nodules (< 5 area %), and a high abundance of phlogopite crystals 207
(typically 30 to 60 area %). Phlogopite is particularly abundant immediately adjacent to the 208
country rock contact. In most cases, the distribution of crystals is heterogeneous, giving the rock 209
a very patchy appearance (Fig. 5b). 210
Olivine crystal orientations are typically random in the OPK (e.g. Fig. 4, section (a)), but 211
occasionally sub-horizontal relative to the boundaries of the intrusion (e.g. Fig. 3, log 4). In the 212
OPK, olivines occur mainly as small microcrysts, commonly separated by elongate phlogopite 213
laths (Figs. 5c–d). The olivine grain boundaries are poorly discernible, constituting amorphous 214
masses of serpentine. Phlogopite (Ti-rich and Ti-poor varieties) generally occurs as relatively 215
large laths (100 to 750 μm) in the OPK. The phlogopite laths commonly contain inclusions of 216
chromite, Ti-rich spinel (with atoll textures), rutile, and small serpentinised equigranular crystals; 217
the latter are thought to be pseudomorphs after monticellite. Phlogopite crystals commonly 218
exhibit random orientations (Figs. 5c–d), though towards the upper and lower contacts are 219
strongly aligned parallel to the intrusion contact. The interstitial groundmass contains secondary 220
11
serpentines (Mg-rich and Mg-poor) and dolomite. 221
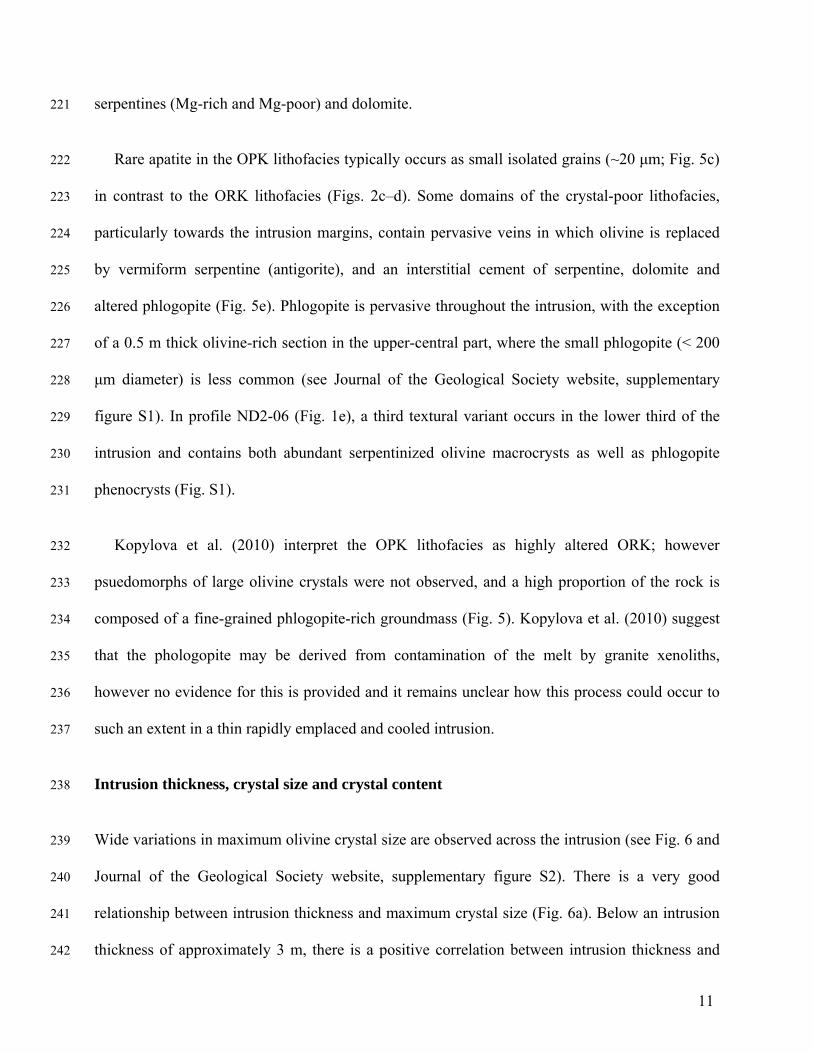
Rare apatite in the OPK lithofacies typically occurs as small isolated grains (~20 μm; Fig. 5c) 222
in contrast to the ORK lithofacies (Figs. 2c–d). Some domains of the crystal-poor lithofacies, 223
particularly towards the intrusion margins, contain pervasive veins in which olivine is replaced 224
by vermiform serpentine (antigorite), and an interstitial cement of serpentine, dolomite and 225
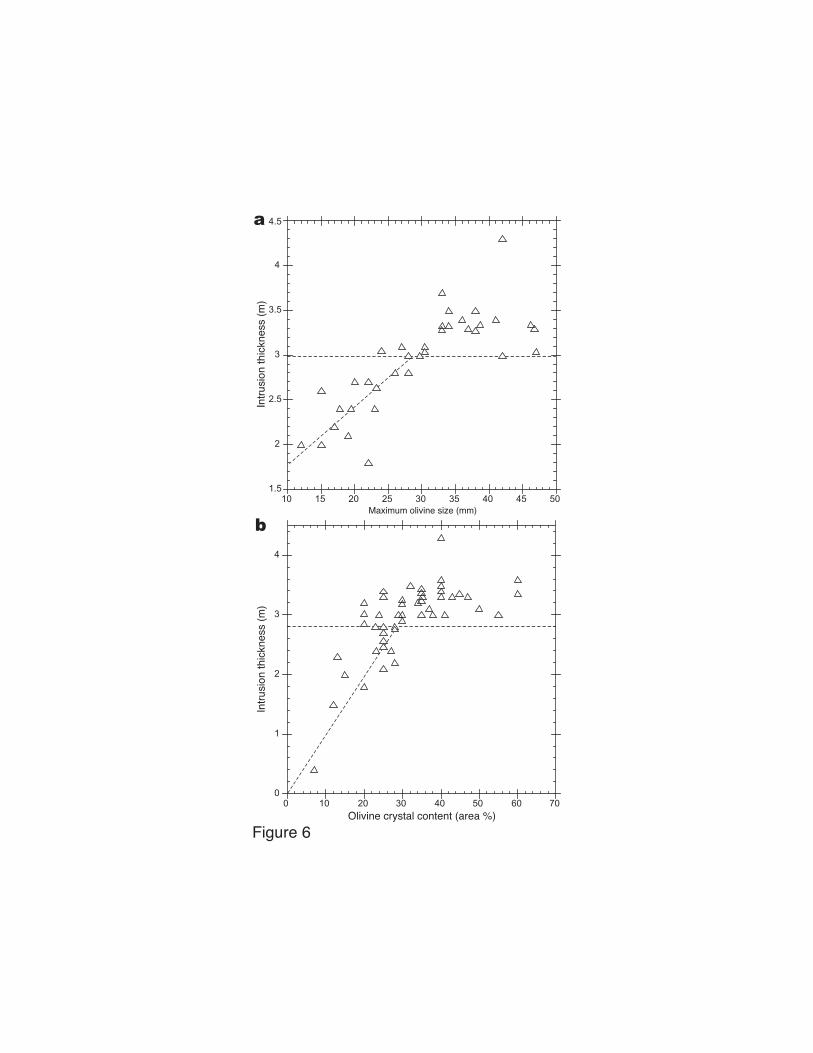
altered phlogopite (Fig. 5e). Phlogopite is pervasive throughout the intrusion, with the exception 226
of a 0.5 m thick olivine-rich section in the upper-central part, where the small phlogopite (< 200 227
μm diameter) is less common (see Journal of the Geological Society website, supplementary 228
figure S1). In profile ND2-06 (Fig. 1e), a third textural variant occurs in the lower third of the 229
intrusion and contains both abundant serpentinized olivine macrocrysts as well as phlogopite 230
phenocrysts (Fig. S1). 231
Kopylova et al. (2010) interpret the OPK lithofacies as highly altered ORK; however 232
psuedomorphs of large olivine crystals were not observed, and a high proportion of the rock is 233
composed of a fine-grained phlogopite-rich groundmass (Fig. 5). Kopylova et al. (2010) suggest 234
that the phologopite may be derived from contamination of the melt by granite xenoliths, 235
however no evidence for this is provided and it remains unclear how this process could occur to 236
such an extent in a thin rapidly emplaced and cooled intrusion. 237
Intrusion thickness, crystal size and crystal content 238
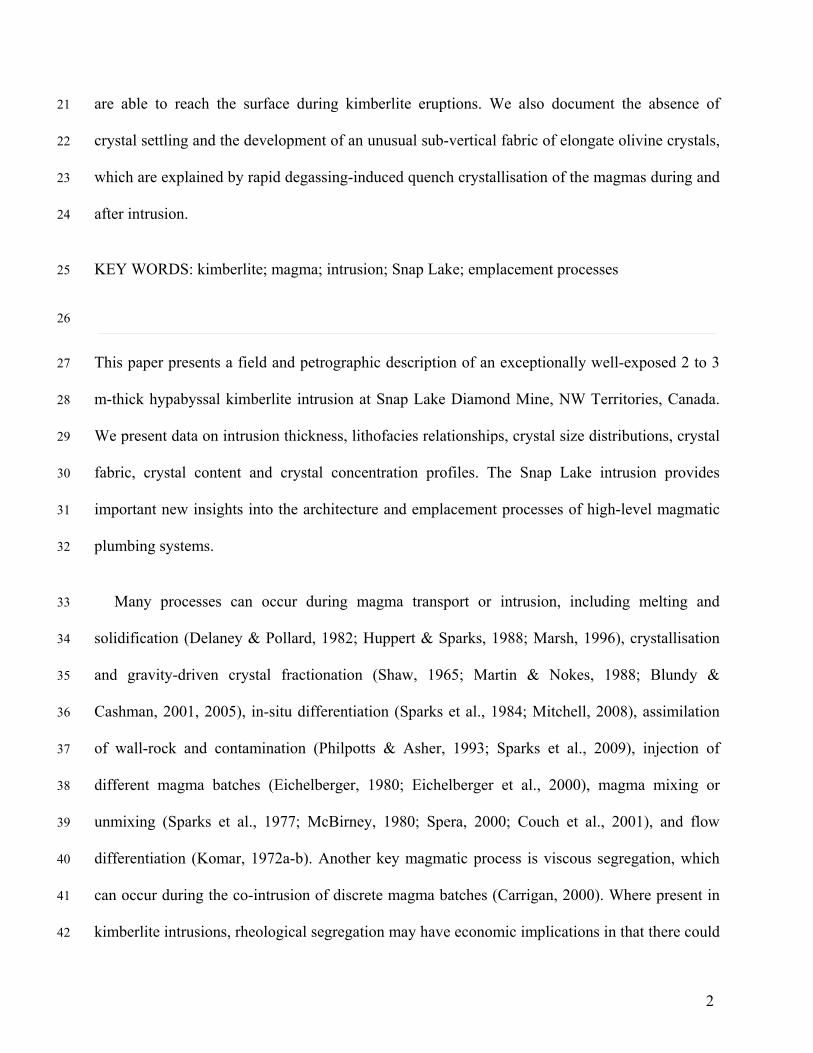
Wide variations in maximum olivine crystal size are observed across the intrusion (see Fig. 6 and 239
Journal of the Geological Society website, supplementary figure S2). There is a very good 240
relationship between intrusion thickness and maximum crystal size (Fig. 6a). Below an intrusion 241
thickness of approximately 3 m, there is a positive correlation between intrusion thickness and 242
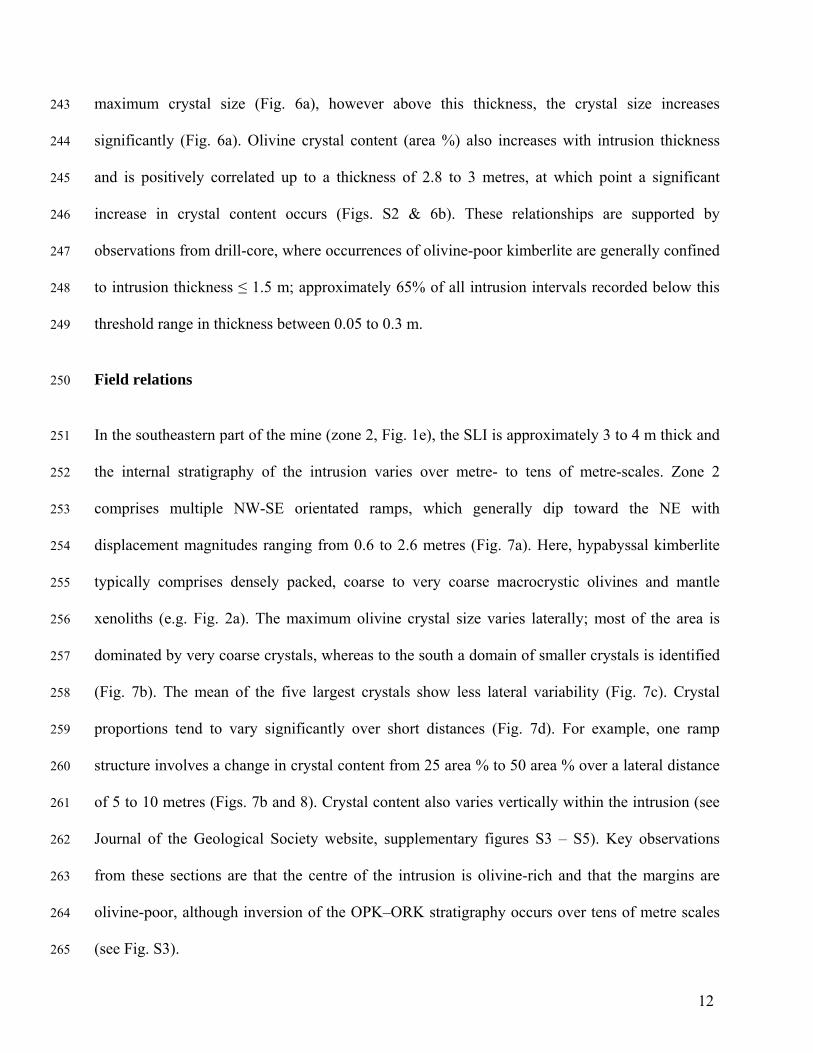
12
maximum crystal size (Fig. 6a), however above this thickness, the crystal size increases 243
significantly (Fig. 6a). Olivine crystal content (area %) also increases with intrusion thickness 244
and is positively correlated up to a thickness of 2.8 to 3 metres, at which point a significant 245
increase in crystal content occurs (Figs. S2 & 6b). These relationships are supported by 246
observations from drill-core, where occurrences of olivine-poor kimberlite are generally confined 247
to intrusion thickness ≤ 1.5 m; approximately 65% of all intrusion intervals recorded below this 248
threshold range in thickness between 0.05 to 0.3 m. 249
Field relations 250
In the southeastern part of the mine (zone 2, Fig. 1e), the SLI is approximately 3 to 4 m thick and 251
the internal stratigraphy of the intrusion varies over metre- to tens of metre-scales. Zone 2 252
comprises multiple NW-SE orientated ramps, which generally dip toward the NE with 253
displacement magnitudes ranging from 0.6 to 2.6 metres (Fig. 7a). Here, hypabyssal kimberlite 254
typically comprises densely packed, coarse to very coarse macrocrystic olivines and mantle 255
xenoliths (e.g. Fig. 2a). The maximum olivine crystal size varies laterally; most of the area is 256
dominated by very coarse crystals, whereas to the south a domain of smaller crystals is identified 257
(Fig. 7b). The mean of the five largest crystals show less lateral variability (Fig. 7c). Crystal 258
proportions tend to vary significantly over short distances (Fig. 7d). For example, one ramp 259
structure involves a change in crystal content from 25 area % to 50 area % over a lateral distance 260
of 5 to 10 metres (Figs. 7b and 8). Crystal content also varies vertically within the intrusion (see 261
Journal of the Geological Society website, supplementary figures S3 – S5). Key observations 262
from these sections are that the centre of the intrusion is olivine-rich and that the margins are 263
olivine-poor, although inversion of the OPK–ORK stratigraphy occurs over tens of metre scales 264
(see Fig. S3). 265
13
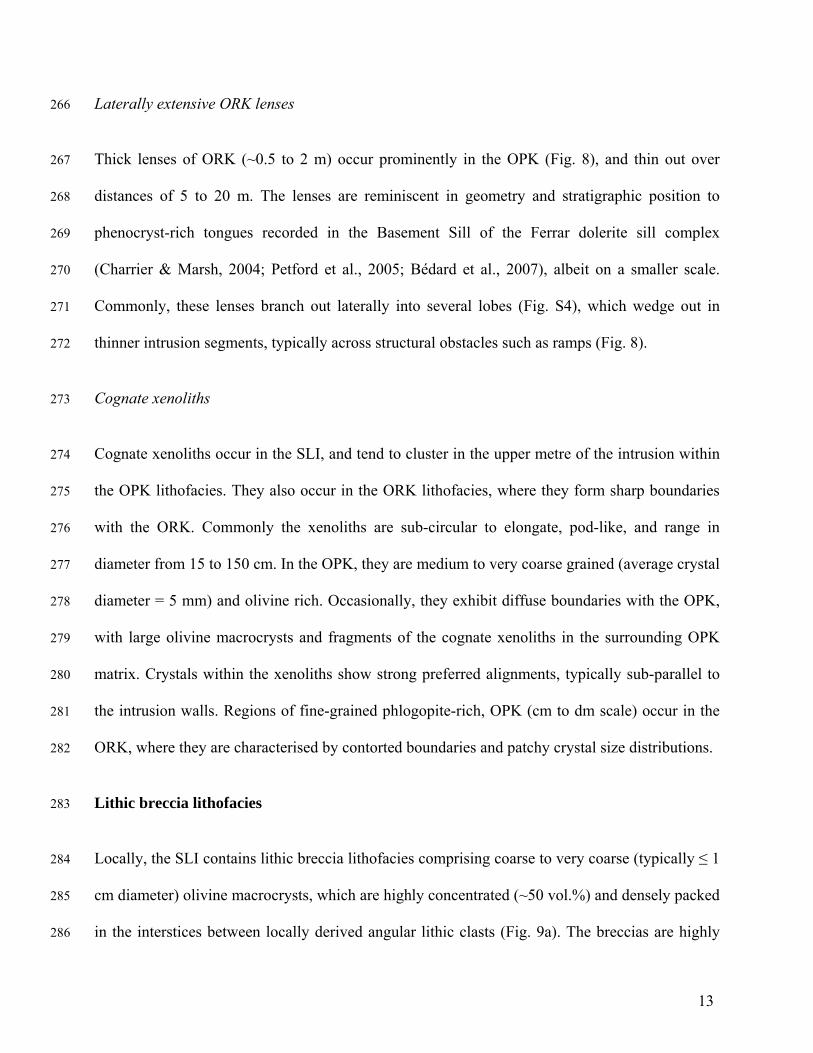
Laterally extensive ORK lenses 266
Thick lenses of ORK (~0.5 to 2 m) occur prominently in the OPK (Fig. 8), and thin out over 267
distances of 5 to 20 m. The lenses are reminiscent in geometry and stratigraphic position to 268
phenocryst-rich tongues recorded in the Basement Sill of the Ferrar dolerite sill complex 269
(Charrier & Marsh, 2004; Petford et al., 2005; Bédard et al., 2007), albeit on a smaller scale. 270
Commonly, these lenses branch out laterally into several lobes (Fig. S4), which wedge out in 271
thinner intrusion segments, typically across structural obstacles such as ramps (Fig. 8). 272
Cognate xenoliths 273
Cognate xenoliths occur in the SLI, and tend to cluster in the upper metre of the intrusion within 274
the OPK lithofacies. They also occur in the ORK lithofacies, where they form sharp boundaries 275
with the ORK. Commonly the xenoliths are sub-circular to elongate, pod-like, and range in 276
diameter from 15 to 150 cm. In the OPK, they are medium to very coarse grained (average crystal 277
diameter = 5 mm) and olivine rich. Occasionally, they exhibit diffuse boundaries with the OPK, 278
with large olivine macrocrysts and fragments of the cognate xenoliths in the surrounding OPK 279
matrix. Crystals within the xenoliths show strong preferred alignments, typically sub-parallel to 280
the intrusion walls. Regions of fine-grained phlogopite-rich, OPK (cm to dm scale) occur in the 281
ORK, where they are characterised by contorted boundaries and patchy crystal size distributions. 282
Lithic breccia lithofacies 283
Locally, the SLI contains lithic breccia lithofacies comprising coarse to very coarse (typically ≤ 1 284
cm diameter) olivine macrocrysts, which are highly concentrated (~50 vol.%) and densely packed 285
in the interstices between locally derived angular lithic clasts (Fig. 9a). The breccias are highly 286

14
weathered and consequently difficult to sample. The coarse olivine macrocrysts occur within 287
pods in sharp contact with the OPK (Fig. 9a). Such breccia zones are unconfined and laterally 288
continuous over tens of metres (Fig. 1e). A second breccia lithofacies is olivine-poor (5 area %) 289
to moderately (15 area %) rich (Fig. 9b). This type of breccia is typically a localised, wedge-290
shaped feature (Fig. 9b), occurring in the hangingwall of the intrusion associated with ramp 291
systems. Both lithofacies are matrix-supported with subordinate patches of clast-supported 292
breccia developed locally, particularly adjacent to ramp structures. The breccia lithofacies 293
account for approximately 5 to 8 vol.% of the intrusion. 294
In the vicinity of ramps, the intrusion is characteristically disrupted and enriched in shattered 295
country rocks (Fig. 9c). Commonly, lozenge-shaped regions enriched in xenoliths (25 to 40 296
vol.%) are confined to the centre of the intrusion, though isolated slab-like fragments occur in the 297
uppermost 0.5 metres where they rest on the ORK-OPK contact. In many cases, the proportion of 298
xenoliths decreases along the intrusion away from ramp structures (Fig. 9c) over lateral distances 299
on the order of 20 metres (Fig. 9d). Intrusion thickness is highly variable in ramp zones, probably 300
due to the irregular structure of the metavolcanic host-rock. All these data demonstrate that 301
significant variations in lithofacies geometry and crystal size, crystal content, crystal distribution 302
and xenolith content occur over short distances (metres to tens of metres) in the Snap Lake 303
intrusion. 304
DISCUSSION 305
The Snap Lake kimberlite is a discordant thin intrusion composed of various hypabyssal 306
lithofacies. The two end-member lithofacies are petrologically and geochemically distinct 307
(Ogilvie-Harris et al., 2009). Together, textural, mineralogical and geochemical differences point 308
15
towards the two lithofacies representing different magmatic phases that have undergone different 309
processes during ascent and emplacement. Magma batches with different characteristics have 310
been observed in other kimberlite intrusions (e.g. Wesselton and Lethlakhane; Sparks et al., 2006, 311
2009). 312
Formation of the lithic breccia lithofacies 313
The structure and lithofacies of complex ramp zones in the SLI are consistent with a multi-stage 314
formation. Firstly, magma is transported through propagating intrusion segments, and a radial 315
fracture network develops around the tips of the intrusion splays (Fig. 10a). Both sets of fractures 316
then interact, and a major fracture system develops between the intrusions (i.e. bridge zone), 317
where the country rock is fragmented. Eventually, magma forces its way through the fractures, 318
the intrusion segments connect and a ramp is formed (Fig. 10b). The original intrusion tips are 319
preserved as dead splays (Figs. 9c & 10c). Finally, strong inflation and dilation occurs to 320
accommodate increased magma flow (Fig. 10c). Fractures in the bridge of the ramp zone 321
contribute shattered lithic material to the intrusion. Several features of the breccia lithofacies, 322
such as localisation of coarse components and lateral continuity and geometry of the bodies, can 323
be explained by explosive flow emplacement associated with inflation of the intrusion. Isolated 324
slab-like blocks in the upper metre of the intrusion are attributed to stoping from the 325
metasedimentary host rock. 326
Importance of magma viscosity 327
Crystal-laden magmas are known to exhibit complex rheological behaviour (Pinkerton & 328
Stevenson, 1992; Spera, 2000; Castruccio et al., 2010). As such, the major textural differences 329
between OPK and ORK lithofacies imply markedly different rheological properties during 330
16
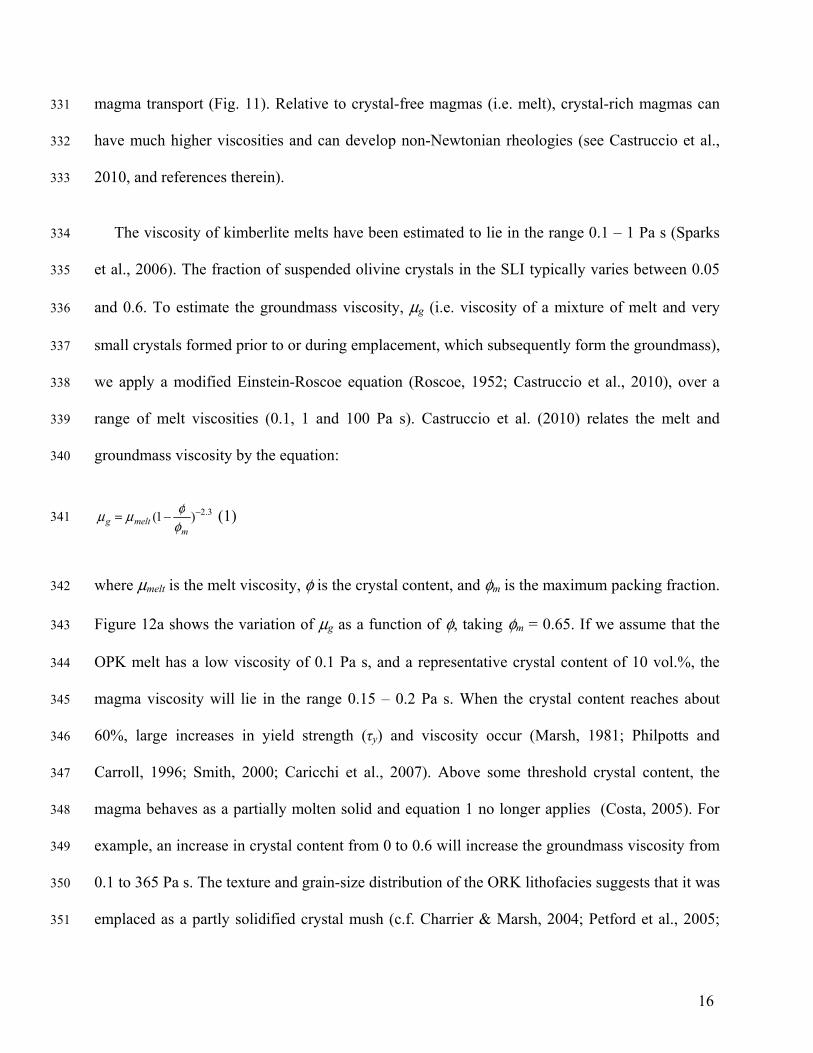
magma transport (Fig. 11). Relative to crystal-free magmas (i.e. melt), crystal-rich magmas can 331
have much higher viscosities and can develop non-Newtonian rheologies (see Castruccio et al., 332
2010, and references therein). 333
The viscosity of kimberlite melts have been estimated to lie in the range 0.1 – 1 Pa s (Sparks 334
et al., 2006). The fraction of suspended olivine crystals in the SLI typically varies between 0.05 335
and 0.6. To estimate the groundmass viscosity, μg (i.e. viscosity of a mixture of melt and very 336
small crystals formed prior to or during emplacement, which subsequently form the groundmass), 337
we apply a modified Einstein-Roscoe equation (Roscoe, 1952; Castruccio et al., 2010), over a 338
range of melt viscosities (0.1, 1 and 100 Pa s). Castruccio et al. (2010) relates the melt and 339
groundmass viscosity by the equation: 340
μg = μmelt (1− φφm
)−2.3 (1) 341
where μmelt is the melt viscosity, φ is the crystal content, and φm is the maximum packing fraction. 342
Figure 12a shows the variation of μg as a function of φ, taking φm = 0.65. If we assume that the 343
OPK melt has a low viscosity of 0.1 Pa s, and a representative crystal content of 10 vol.%, the 344
magma viscosity will lie in the range 0.15 – 0.2 Pa s. When the crystal content reaches about 345
60%, large increases in yield strength (τy) and viscosity occur (Marsh, 1981; Philpotts and 346
Carroll, 1996; Smith, 2000; Caricchi et al., 2007). Above some threshold crystal content, the 347
magma behaves as a partially molten solid and equation 1 no longer applies (Costa, 2005). For 348
example, an increase in crystal content from 0 to 0.6 will increase the groundmass viscosity from 349
0.1 to 365 Pa s. The texture and grain-size distribution of the ORK lithofacies suggests that it was 350
emplaced as a partly solidified crystal mush (c.f. Charrier & Marsh, 2004; Petford et al., 2005; 351

17
Bédard et al., 2007) in a plug flow regime (Komar, 1972a; Ross, 1986; Ventura et al., 1996). 352
The complex spatial relationships observed between the OPK and ORK lithofacies (Figs. 10 353
& 12) can be explained by a two-component magma flow (c.f. Ross, 1986; Carrigan and 354
Eichelberger, 1990). Field, experimental and theoretical studies of two-component flows have 355
shown that it is common for low-viscosity components to flow in advance of high-viscosity 356
components, lubricating their passage (Carrigan and Eichelberger, 1990; Koyaguchi and Takada, 357
1994; Carrigan, 2000). The high viscosity component is confined to a zone of weaker shear in the 358
intrusion centre, and the pressure gradient required to drive the high viscosity component through 359
the intrusion is substantially reduced (Komar, 1976; Barrière, 1976; Carrigan and Eichelberger, 360
1990; Carrigan, 2000). This process does not require the magmas to be genetically related, and 361
can explain the observed lithofacies variations (Figs. 3 & 8) and lateral inversion of the OPK– 362
ORK stratigraphy commonly observed in the SLI (Figs. S3 & 11a). 363
Absence of crystal settling and magma solidification 364
A key feature in the Snap Lake intrusion is the general absence of size grading (see Figs. 3 & S1). 365
In addition, large (≤ 2 m) locally derived country rock xenoliths are commonly observed to rest 366
upon the upper contact of the ORK lithofacies at the base of the OPK, suggesting that the ORK 367
had crystallised extensively before solidification of the OPK. Here, we present calculations on the 368
timescales of crystal settling, which are then compared with the timescale for conductive cooling 369
of the intrusion. A magma density (ρf) of 2800 kg m-3 is assumed (Sparks et al., 2006) and the 370
density of olivine (ρs) is taken as 3300 kg m-3 (i.e. Δρ = 500 kg m-3). The terminal velocity of a 371
crystal settling through the melt phase only (Ut) depends on the particle Reynolds number (Rep) 372
and is calculated by: 373
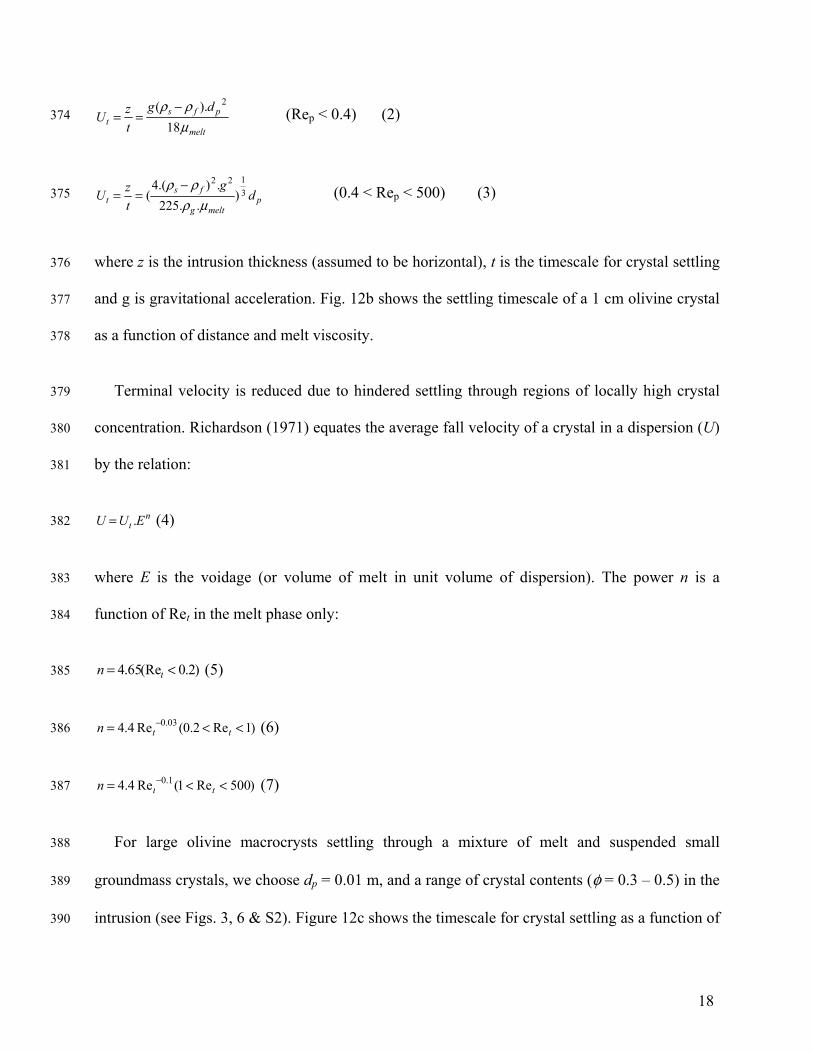
18
Ut = zt
=g(ρs − ρ f ).d p
2
18μmelt (Rep < 0.4) (2) 374
Ut = zt
= (4.(ρs − ρ f )2 .g 2
225.ρg .μmelt)
13 d p (0.4 < Rep < 500) (3) 375
where z is the intrusion thickness (assumed to be horizontal), t is the timescale for crystal settling 376
and g is gravitational acceleration. Fig. 12b shows the settling timescale of a 1 cm olivine crystal 377
as a function of distance and melt viscosity. 378
Terminal velocity is reduced due to hindered settling through regions of locally high crystal 379
concentration. Richardson (1971) equates the average fall velocity of a crystal in a dispersion (U) 380
by the relation: 381
U = Ut .En (4) 382
where E is the voidage (or volume of melt in unit volume of dispersion). The power n is a 383
function of Ret in the melt phase only: 384
n = 4.65(Ret < 0.2) (5) 385
n = 4.4 Ret−0.03 (0.2 < Ret < 1) (6) 386
n = 4.4 Ret−0.1(1 < Ret < 500) (7) 387
For large olivine macrocrysts settling through a mixture of melt and suspended small 388
groundmass crystals, we choose dp = 0.01 m, and a range of crystal contents (φ = 0.3 – 0.5) in the 389
intrusion (see Figs. 3, 6 & S2). Figure 12c shows the timescale for crystal settling as a function of 390
19
depth in the intrusion using equation 6 for a melt viscosity of μ = 0.1 Pa s. Hindered settling 391
increases crystal settling times (Fig 12c), but these remain much less than the intrusion cooling 392
time. To a first approximation, the Snap Lake intrusion would take 55 – 60 days to cool (Fig. 393
12c), given a representative dyke thickness of 4 m and thermal diffusivity of 8 × 10⁻⁷ m2 s-1. The 394
timescale for crystal settling (Fig. 12b-c) is therefore substantially shorter (102-4 times) than that 395
of conductive cooling of the intrusion for all reasonable geological conditions. In order for 396
settling times to equal cooling times, and assuming a very high crystal content (60%), the 397
primary melt viscosity would have to be on the order of 103 - 104 Pa s. Although kimberlite melt 398
compositions, temperatures and volatile contents are poorly constrained with much uncertainty 399
(Sparks et al., 2009), the evidence from field relationships, pyroclast textures and experiments on 400
silica-poor melts is that the viscosities are very low. Sparks et al. (2006) summarised the 401
evidence and concluded that they are likely less than 1 Pa s. 402
Fabric development 403
Crystal preferred orientations within intrusions are typically developed parallel to the walls (i.e. 404
parallel to the magma flow; Blanchard et al., 1979; Higgins, 2006), as documented in studies 405
such as Shelley (1985), Ross (1986), Greenough et al. (1988), Wada (1992) and Philpotts & 406
Asher (1994). Within the OPK, a sub-horizontal alignment fabric (Fig. 3) indicates intrusion-407
parallel flow. We propose that the sub-vertical alignment fabric in the ORK (Figs. 2 & 3) was 408
generated during intrusion inflation (Fig. 11b). The elongate olivine crystals were initially 409
aligned parallel to the magma flow and the intrusion walls, and were subsequently stretched into 410
more stable sub-vertical orientations parallel to σ3 during inflation (Fig. 11b). Shearing of crystals 411
is occasionally observed near the base of the ORK lithofacies (e.g. Fig. 4f); this is attributed to a 412
20
combination of pure shear related to mechanical compaction of the crystal mush (cf. Petford et 413
al., 2005), and simple shear due to lateral flow of the OPK fluid. Random crystal orientations 414
recorded towards the centre of the intrusion at several localities (e.g. Fig. 4) may support the 415
presence of a plug region as documented in high-viscosity Bingham magmas (Ross, 1986) and 416
lava flows (Ventura et al., 1996). 417
Cognate xenoliths 418
Cognate xenoliths are a common feature in magmatic intrusions (Green & Ringwood, 1967; 419
Preston & Bell, 1997) and are typically found in the uppermost metre of the SLI within the OPK 420
lithofacies (Fig. 8). The xenoliths are texturally and compositionally similar to the underlying 421
ORK. We infer that the xenoliths were eroded from the ORK by the relatively mobile OPK 422
magma and transported laterally along the intrusion margins (Fig. 11a). Diffuse boundaries to the 423
xenoliths suggest that they were not fully solidified when this occurred. Together, these features 424
demonstrate that the OPK magma post-dated at least part solidification of the ORK magma. The 425
cognate xenoliths, branching lobes and interfingering of the OPK and ORK indicate that the two 426
magmatic phases are broadly contemporaneous. The distinct textural and geochemical differences 427
between the lithofacies (Ogilvie-Harris et al., 2009) can be explained by separate magma batches 428
that sampled the mantle in varying efficiency and were emplaced contemporaneously. The OPK 429
magma likely represents a more evolved liquid, which has lost most of its phenocrystal olivines, 430
mantle components and spinel and undergone crystal-liquid differentiation during transit and 431
stalling (Price et al., 2000). The occurrence of segregation processes en route to the surface is 432
supported by significant differences in diamond size distributions between the ORK and OPK 433
(Field et al., 2009). It is likely that kimberlite magmas ascending from depths of ~150 to 200 km 434
will differentiate at choke points in branching vein and dyke systems, leading to crystal 435
21
accumulation, slurry formation and melt segregation (Mitchell, 2008). 436
Intrusion heterogeneity explained by thickness variation and flow duration? 437
In larger intrusive complexes (e.g. the Basement Sill, Antarctica), the thickness of crystal-rich 438
lithofacies is directly related to the location of feeder intrusions (Charrier & Marsh, 2004). Since 439
the SLI represents an inclined sheet with no recognised feeder intrusions (Fig. 1d), the lithofacies 440
distribution and architecture are attributed to intrusion thickness and flow duration. The observed 441
relationships between intrusion thickness, crystal size and crystal content in the SLI (Fig. 6) 442
strongly suggest a change in flow behaviour over a threshold thickness of ~2.8 metres. Further 443
evidence is provided by the lensing out of ORK into thinner intrusion segments (e.g. Fig. 8). 444
Field and fluid dynamical investigations of other sheet intrusions (e.g. sills) reveal that sustained 445
flow is only possible in regions where the thickness exceeds 3 to 3.5 metres (Holness & 446
Humphreys, 2003). Sustained flow may have occurred in thick (≥ 2.8 m) parts of the SLI, 447
explaining the observed high concentrations of large crystals in thicker intrusion segments (see 448
Figs. 6 – 7 & S2). 449
Degassing-induced crystallisation 450
There is a large discrepancy between crystal settling time, even at high crystal fractions (Fig. 451
12c), and cooling time (Fig. 12c) of the intrusion. Even accounting for hindered settling through a 452
crystal mush, olivine crystals should have settled easily and very rapidly if the groundmass were 453
a melt (Fig. 12b-c). The observed absence of size grading (see Fig. 3), and the preservation of a 454
strong sub-vertical fabric (Figs. 2 – 3) can be explained by pervasive internal groundmass 455
crystallisation during and after emplacement; this would lead to highly elevated magma 456
viscosities and abrupt solidification (Sparks et al., 2006). It is proposed that fabric generation 457
22
coincided with quench crystallisation of decussate phlogopite crystals, observed in the interstices 458
between large crystals and attributed to rapid degassing during emplacement (c.f. Bacon, 1986). 459
460
CONCLUSIONS 461
Detailed geological mapping has demonstrated that the Snap Lake hypabyssal kimberlite 462
intrusion is texturally heterogeneous, comprising olivine-rich and olivine-poor lithofacies. The 463
lithofacies are petrologically distinct suggesting that the SLI is a multi-phase intrusion, emplaced 464
by at least two magma batches. The variation in crystal content of the ORK and OPK indicates 465
fundamental rheological differences between the magmas and different flow processes during 466
transport and emplacement. The occurrence and nature of branching lobes, cognate xenoliths, 467
internal stratigraphic zonation and lateral lithofacies variations can be explained by a 468
combination of thickness variations and flow transformations due to the preferential flow of low-469
viscosity magma around high-viscosity magma, and associated localisation of shear along the 470
walls. This “lubrication” process explains how highly viscous, crystal rich (> 60 vol.%) 471
kimberlite magmas are transported to the surface to erupt in diatremes. The results show a 472
moderate to strong correlation between intrusion thickness and crystal size and crystal content, 473
which has important implications for diamond distributions in kimberlite intrusions. A marked 474
change in crystal size and content occurs at a thickness of approximately 3 m, probably due to a 475
change in flow regime at this level as documented in other sheet intrusions. In addition, 476
significant changes in crystal size, content and concentration profiles occur laterally over metre to 477
tens of metre scales in the intrusion. The observed lack of grading and preservation of a sub-478
vertical fabric within the Snap Lake intrusion suggests that groundmass crystallisation occurred 479

23
rapidly during and after emplacement. The emplacement processes outlined in this paper are 480
potentially important in other types of sub-volcanic sheet intrusions, particularly those associated 481
with mafic and ultramafic diatreme–vent systems. 482
483
ACKNOWLEDGEMENTS 484
485
This work was funded by De Beers Canada with support from the De Beers MRM R&D Group, 486
Wells. We acknowledge the input of Dr Malcolm Thurston (De Beers Canada) together with Josh 487
Harvey and the staff of the geology department at Snap Lake Mine. Nicholas Arndt, Chris 488
Bonson, Thea Hincks, Thierry Menand, Madeleine Humphreys, and Rachael Ogilvie-Harris are 489
thanked for helpful discussions. We are grateful to Kelly Russell and Dante Canil for their 490
thorough reviews. 491
492
REFERENCES 493
Bacon, C. R. (1986). Magmatic inclusions in silicic and intermediate volcanic rocks. Journal of 494
Geophysical Research 91, 6091-6112. 495
Barrière, M. (1976). Flowage differentiation: Limitation of the “Bagnold effect” to the narrow 496
intrusions. Contributions to Mineralogy and Petrology 55 (2), 139-145. 497
Bédard, J. H. J., Marsh, B. D., Hersum, T. G., Naslund, H. R. & Mukasa, S. B. (2007). Large-498
scale mechanical redistribution of orthopyroxene and plagioclase in the Basement Sill, Ferrar 499
24
Dolerites, McMurdo Dry Valleys, Antarctica: Petrological, mineral-chemical and field evidence 500
for channelized movement of crystals and melt. Journal of Petrology 48 (12), 2289-2326. 501
Blanchard, J. P., Boyer, P., & Gagny, C. (1979). Un nouveau critère de sens de mise en place 502
dans une caisse filonienne: le “pincement” des minèreaux aux èpontes. Tectonophysics 53, 1-25. 503
Blundy, J. D. & Cashman, K. (2001). Ascent-driven crystallisation of dacite magmas at Mount St 504
Helens, 1980-1986. Contributions to Mineralogy and Petrology 140 (6), 631-650. 505
Blundy, J. D. & Cashman, K. (2005). Rapid decompression-driven crystallization recorded by 506
melt inclusions from Mount St. Helens volcano. Geology 33 (10), 793-796. 507
Brown, R. J., Kavanagh, J., Sparks, R. S. J., Tait M. & Field, M. (2007). Mechanically disrupted 508
and chemically weakened zones in segmented dyke systems cause vent localisation: evidence 509
from kimberlite volcanic systems. Geology 35, 184-188. 510
Canil, D. & Fedortchouk, Y. (1999). Garnet dissolution and the emplacement of kimberlites. 511
Earth and Planetary Science Letters 167, 227-237. 512
Caricchi, L., Burlini, L., Ulmer, P., Gerya, T., Vassalli, M. & Papale, P. (2007). Non-Newtonian 513
rheology of crystal-bearing magmas and implications for magma ascent dynamics. Earth and 514
Planetary Science Letters 264 (3-4), 402–419. 515
Carrigan, C. R. (2000). Plumbing Systems. In: Sigurdsson, H. (ed.) Encyclopedia of Volcanoes. 516
Academic Press, 219–235. 517
Carrigan, C. R. & Eichelberger, J. C. (1990). Zoning of magmas by viscosity in volcanic 518
25
conduits. Nature 343, 248–251. 519
Carrigan, C., Schubert, G. & Eichelberger, J. (1992). Thermal and dynamical regimes of single- 520
and two-phase magmatic flow in dikes. Journal of Geophysical Research 97(B12): doi: 521
10.1029/92JB01244. 522
Castruccio, A., Rust, A. C. & Sparks, R. S. J. (2010). Rheology and flow of crystal-bearing lavas: 523
Insights from analogue gravity currents. Earth and Planetary Science Letters 297, 471-480, 524
doi:10.1016/ j.epsl.2010.06.051. 525
Charrier, A. D. & Marsh, B. D. (2004). Sill emplacement dynamics from regional flow sorting of 526
opx phenocrysts, Basement Sill, McMurdo Dry Valleys, Antarctica. Eos Trans. AGU 85 (17), Jt. 527
Assem. Suppl., Abstract V42A-03. 528
Costa, A. (2005). Viscosity of high crystal content melts: Dependence on solid fraction. 529
Geophysical Research Letters 32, L22308: doi:10.1029/2005GL024303. 530
Couch, S., Sparks, R. S. J. & Carroll, M. R. (2001). Mineral disequilibrium in lavas explained by 531
convective self-mixing in open magma chambers. Nature 411, 1037-1039. 532
Dawson, J. B. & Hawthorne, J. B. (1973). Magmatic sedimentation and carbonatitic 533
differentiation in kimberlite sills at Benfontein, South Africa. Journal of the Geological Society 534
of London 129 (1), 61-85. 535
Delaney, P. T. & Pollard, D. D. (1982). Solidification of basaltic magma during flow in a dike. 536
American Journal of Science 282, 856-885. 537
26
Eichelberger, J. C. (1980). Vesiculation of mafic magma during replenishment of silicic magma 538
reservoirs. Nature 288, 446-450. 539
Eichelberger, J. C., Chertkoff, D. G., Dreher, S. T. & Nye, C. J. (2000). Magmas in collision: 540
Rethinking chemical zonation in silicic magmas. Geology 28 (7), 603-606. 541
Field, M., Gernon, T. M., Mock, A., Walters, A., Sparks, R. S. J. & Jerram, D. A. (2009). 542
Variations of olivine abundance and grain size in the Snap Lake kimberlite intrusion, Northwest 543
Territories, Canada: A possible proxy for diamonds. Lithos 112S, 23–35. 544
Green, D. H. & Ringwood, A. E. (1967). The genesis of basaltic magmas. Contributions to 545
Mineralogy and Petrology 15 (2), 103-190. 546
Greenough, J. D., Ruffman, A. & Owen, J. V. (1988). Magma injection directions inferred from a 547
fabric study of the Popes Harbour dike, eastern shore, Nova Scotia, Canada. Geology 16, 547-548
550. 549
Heaman, L. M., Kjarsgaard, B. A., Creaser, R. A. (2003). The timing of kimberlite magmatism 550
in North America: implications for global kimberlite genesis and diamond exploration. Lithos 71, 551
153-184. 552
Heaman, L. M., Kjarsgaard, B. A, Creaser, R. A. (2004). The temporal evolution of North 553
American kimberlites. Lithos 76, (1-4), 377-397. 554
Higgins, M. D. (2006). Quantitative textural measurements in igneous and metamorphic 555
petrology. Cambridge University Press. 556

27
Holness, M. B. & Humphreys, M. C. S. (2003). The Traigh Bhàn na Sgùrra sill, Isle of Mull: 557
Flow localization in a major magma conduit. Journal of Petrology 44 (11), 1961-1976. 558
Huppert, H. E. & Sparks, R. S. J. (1988). The generation of granitic magmas by intrusion of 559
basalt into continental crust. Journal of Petrology 29 (3), 599-624. 560
Kelley, S. P. & Wartho, J. A. (2000). Rapid kimberlite ascent and the significance of Ar-Ar ages 561
in xenolith phlogopites. Science 289, 609-611. 562
Komar, P. D. (1972a). Mechanical interactions of phenocrysts and flow differentiation of igneous 563
dikes and sills. Bulletin of the Geological Society of America 83 (4), 973-988. 564
Komar, P. D. (1972b). Flow differentiation in igneous dikes and sills; profiles of velocity and 565
phenocryst concentration. Bulletin of the Geological Society of America 83 (11), 3443-3448. 566
Komar, P. D. (1976). Phenocryst interactions and the velocity profile of magma flowing through 567
dykes or sills. Bulletin of the Geological Society of America 87, 1336–1342. 568
Kopylova, M.G., Mogg, T. and Scott Smith, B. (2010). Mineralogy of the Snap Lake kimberlite, 569
Northwest Territories, Canada, and compositions of phlogopite as records of its crystallisation. 570
The Canadian Mineralogist 48, 549-570. 571
Koyaguchi, T. & Takada, A. (1994). An experimental study on the formation of composite 572
intrusions from zoned magma chambers. Journal of Volcanology and Geothermal Research 59, 573
261–267. 574
Kurszlaukis, S. & Barnett, W. (2003). Volcanological and structural aspects of the Venetia 575
28
kimberlite cluster – a case study of South African kimberlite maar-diatreme volcanoes. South 576
African Journal of Geology 106, 145-172. 577
Marsh, B. D. (1981). On the crystallinity, probability of occurrence, and rheology of lava and 578
magma. Contributions to Mineralogy and Petrology 78 (1), 85-98. 579
Marsh, B. D. (1996). Solidification Fronts and Magmatic Evolution. Mineralogical Magazine 60 580
(398), 5-40. 581
Martin, D. & Nokes, R. (1988). Crystal settling in a vigorously converting magma chamber. 582
Nature 332, 534-536. 583
McBean, D., Kirkley, M. & Revering, C. (2003). Structural controls on the morphology of the 584
Snap Lake kimberlite dyke. In: 8th International Kimberlite Conference, Extended Abstracts, 69-585
74. 586
McBirney, A. R. (1980). Mixing and unmixing of magmas. Journal of Volcanology and 587
Geothermal Research 7 (3-4), 357-371. 588
Mitchell, R. H. (1986). Kimberlites: Mineralogy, Geochemistry, and Petrology. Plenum Press. 589
Mitchell, R. H. (2008). Petrology of hypabyssal kimberlites: Relevance to primary magma 590
compositions. Journal of Volcanology and Geothermal Research 174, 1–8. 591
NIH (2006). ImageJ software package, U.S. National Institute of Health. URL 592
http://rsb.info.nih.gov/ij/download.html. 593
Ogilvie-Harris, R., Sparks, R.S.J., Field, M. & Gernon, T.M. (2009). The Geochemistry of the 594
29
Snap Lake kimberlite dyke, NW Territories, Canada: Phlogopite and Spinel. Eos Trans. AGU, 595
90(22), Jt. Assem. Suppl., Abstract V33D-01. 596
Petford, N., Jerram, D. & Davidson, J. (2005). Slurry flow and structures formation in a magma 597
mush: the Basement Sill, McMurdo Dry Valleys, Antarctica. Eos Trans. AGU 86 (52), Fall Meet. 598
Suppl., Abstract V13H-05. 599
Philpotts, A. R. & Asher, P. M. (1993). Wallrock Melting and Reaction Effects along the 600
Higganum Diabase Dike in Connecticut: Contamination of a Continental Flood Basalt Feeder. 601
Journal of Petrology 34 (5), 1029-1058. 602
O’Keefe, M. D. & Cruden, A. R. (1999). AMS and fabric study of the Snap Lake NW-peninsula 603
kimberlite dyke. Unpublished report prepared for Winspear Resources Ltd., 106 pp. 604
Philpotts, A. R. & Asher, P. M. (1994). Magmatic flow-direction indicators in a giant diabase 605
feeder dike, Connecticut. Geology 22, 363-366. 606
Philpotts, A. R. & Carroll, M. (1996). Physical properties of partly melted tholeiitic basalt. 607
Geology 24 (11), 1029–1032. 608
Pinkerton, H. & Stevenson, R. J. (1992). Methods of determining the rheological properties of 609
magmas at sub-liquidus temperatures. Journal of Volcanology and Geothermal Research 53(1-4), 610
47-66. 611
Preston, R. J. & Bell, B. R. (1997). Cognate gabbroic xenoliths from a tholeiitic subvolcanic sill 612
complex; implications for fractional crystallization and crustal contamination processes. 613
Mineralogical Magazine 61 (3), 329-349. 614
30
Price, S. E., Russell, J. K. & Kopylova, M. G. (2000). Primitive magma from the Jericho Pipe, 615
N.W.T., Canada: Constraints on primary kimberlite melt chemistry. Journal of Petrology 41 (6), 616
789-808. 617
R (2006). The R Project for Statistical Computing. CRAN. URL: http://cran.r-project.org/ 618
Richardson, J. F. (1971). Incipient fluidisation and particle systems. In: Davidson, J. F. & 619
Harrison, D. (eds.) Fluidisation, Academic Press, London and New York, 26-64. 620
Roscoe, R. (1952). The viscosity of suspensions of rigid spheres. British Journal of Applied 621
Physics 3, 267: doi: 10.1088/0508-3443/3/8/306. 622
Ross, M. E. (1986). Flow differentiation, phenocryst alignment and compositional trends within a 623
dolerite dyke at Rockport, Massachusetts. Bulletin of the Geological Society of America 97, 232-624
240. 625
Shaw, H. R. (1965). Comments on viscosity, crystal settling, and convection in granitic magmas. 626
American Journal of Science 263, 120-152. 627
Shelley, D. (1985). Determining paleo-flow directions from groundmass fabrics in the Lyttelton 628
radial dykes, New Zealand. Journal of Volcanology and Geothermal Research 25, 69–79. 629
Smith, J. V. (2000). Textural evidence for dilatant (shear thickening) rheology of magma at high 630
crystal concentrations. Journal of Volcanology and Geothermal Research 99, 1–7. 631
Sparks, R. S. J., Sigurdsson, H. & Wilson, L. (1977). Magma mixing: a mechanism for triggering 632
acid explosive eruptions. Nature 267, 315-318. 633
31
Sparks, R. S. J., Huppert, H. E., Turner, J. S., Sakuyama M. & O’Hara, M. J. (1984). The Fluid 634
Dynamics of Evolving Magma Chambers [and Discussion]. Philosophical Transactions of the 635
Royal Society of London 310 (1514), 511-534. 636
Sparks, R. S. J., Baker, L., Brown, R. J., Field, M., Schumacher, J. Stripp, G. & Walters, A. 637
(2006). Dynamical constraints on kimberlite volcanism. Journal of Volcanology and Geothermal 638
Research 155 (1-2), 18-48. 639
Sparks, R. S. J., Brooker, R. A., Field, M., Kavanagh, J., Schumacher, J. C., Walter, M. J., White, 640
J. (2009). The nature of erupting kimberlite melts. Lithos 1125, 429-438. 641
Spera, F. J. (2000). Physical Properties of Magma. In: Sigurdsson, H. (ed.) Encyclopedia of 642
Volcanoes. Academic Press, New York, pp. 171-190. 643
Stubley, M. (2000). Bedrock geology of the Snap Lake area, Camsell Lake Property: A report to 644
accompany a 1:10,000 scale geological map. Unpublished report, prepared for Winspear 645
Resources Ltd. 646
Ventura, G., De Rosa, R., Colletta, E. & Mazzuoli, R. (1996). Deformation patterns in a high-647
viscosity Iava flow inferred from the crystal preferred orientation and imbrication structures: an 648
example from Salina (Aeolian Islands, southern Tyrrhenian Sea, Italy). Bulletin of Volcanology 649
57, 555-562. 650
Wada, Y. (1992). Magma flow directions inferred from preferred orientations of phenocrysts in a 651
composite feeder dyke, Miyake-Jima, Japan. Journal of Volcanology and Geothermal Research 652
49, 119-126. 653
32
654
FIGURE CAPTIONS 655
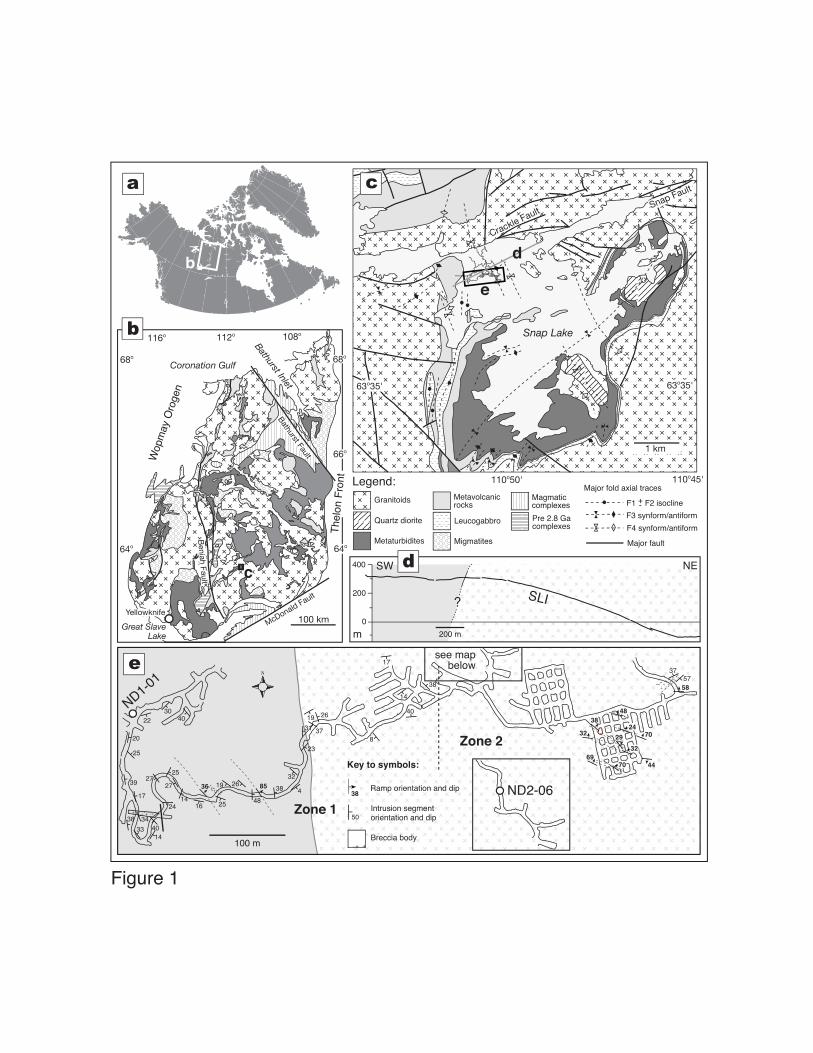
Figure 1: (a) Map of Canada showing the location of the Slave craton, Northwest Territories. (b) 656
Summary geological maps of the Slave craton and (c) the Snap Lake area (modified after 657
Stubley, 2000, unpublished data), showing the location of mine-works covered in this study; (d) 658
NE-SW trending profile (see (c)) of the Snap Lake intrusion produced from vertical intercepts of 659
kimberlite in boreholes. (e) Outline map of the Snap Lake Mine showing the locations of zones 1 660
and 2 (separated by vertical dashed line), and the generalised structural geology of the area (refer 661
to (c) for location, and (d) for elevation data). Also included are the locations of sampling 662
traverses ND1-01 and ND2-06 (inset), depicted in Figs. 4 & S1 respectively. 663
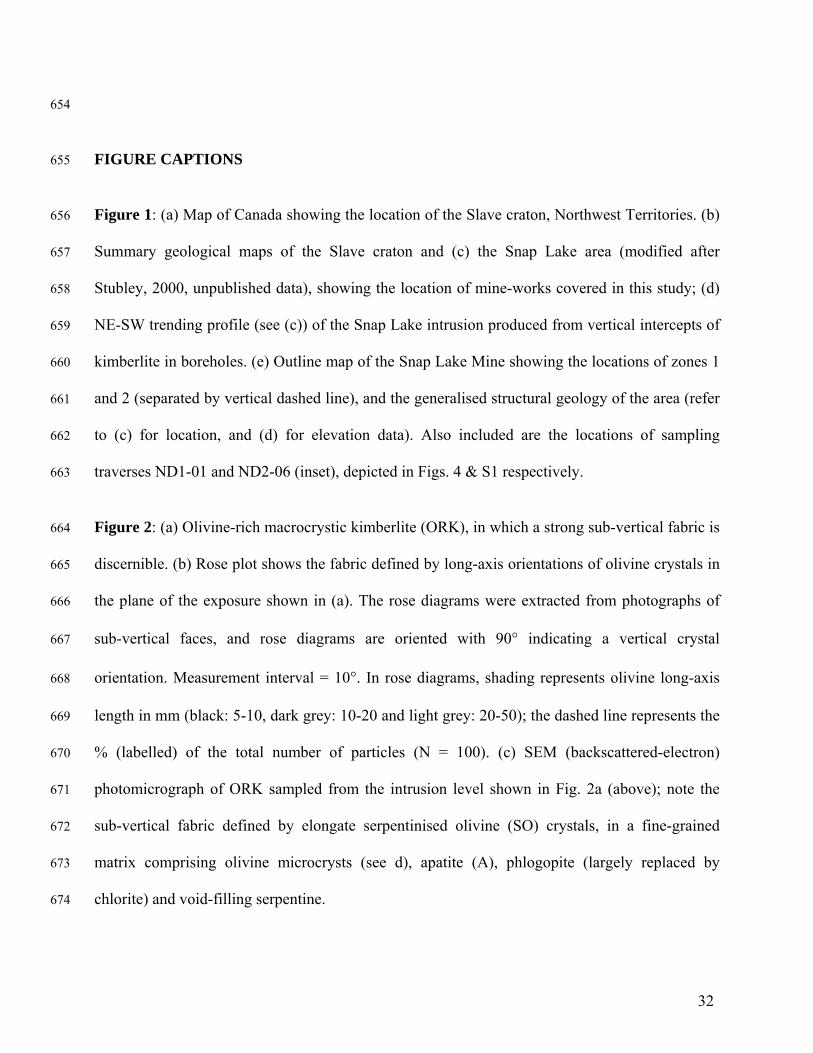
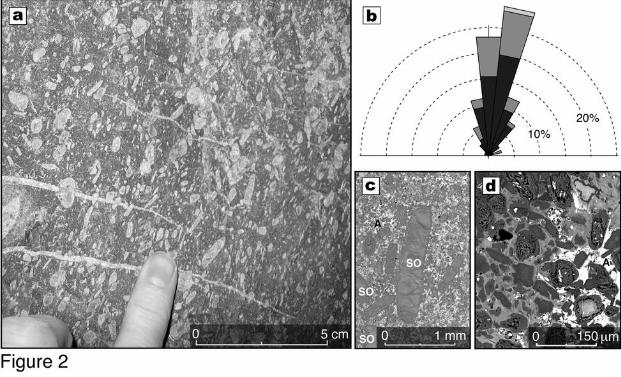
Figure 2: (a) Olivine-rich macrocrystic kimberlite (ORK), in which a strong sub-vertical fabric is 664
discernible. (b) Rose plot shows the fabric defined by long-axis orientations of olivine crystals in 665
the plane of the exposure shown in (a). The rose diagrams were extracted from photographs of 666
sub-vertical faces, and rose diagrams are oriented with 90° indicating a vertical crystal 667
orientation. Measurement interval = 10°. In rose diagrams, shading represents olivine long-axis 668
length in mm (black: 5-10, dark grey: 10-20 and light grey: 20-50); the dashed line represents the 669
% (labelled) of the total number of particles (N = 100). (c) SEM (backscattered-electron) 670
photomicrograph of ORK sampled from the intrusion level shown in Fig. 2a (above); note the 671
sub-vertical fabric defined by elongate serpentinised olivine (SO) crystals, in a fine-grained 672
matrix comprising olivine microcrysts (see d), apatite (A), phlogopite (largely replaced by 673
chlorite) and void-filling serpentine. 674
33
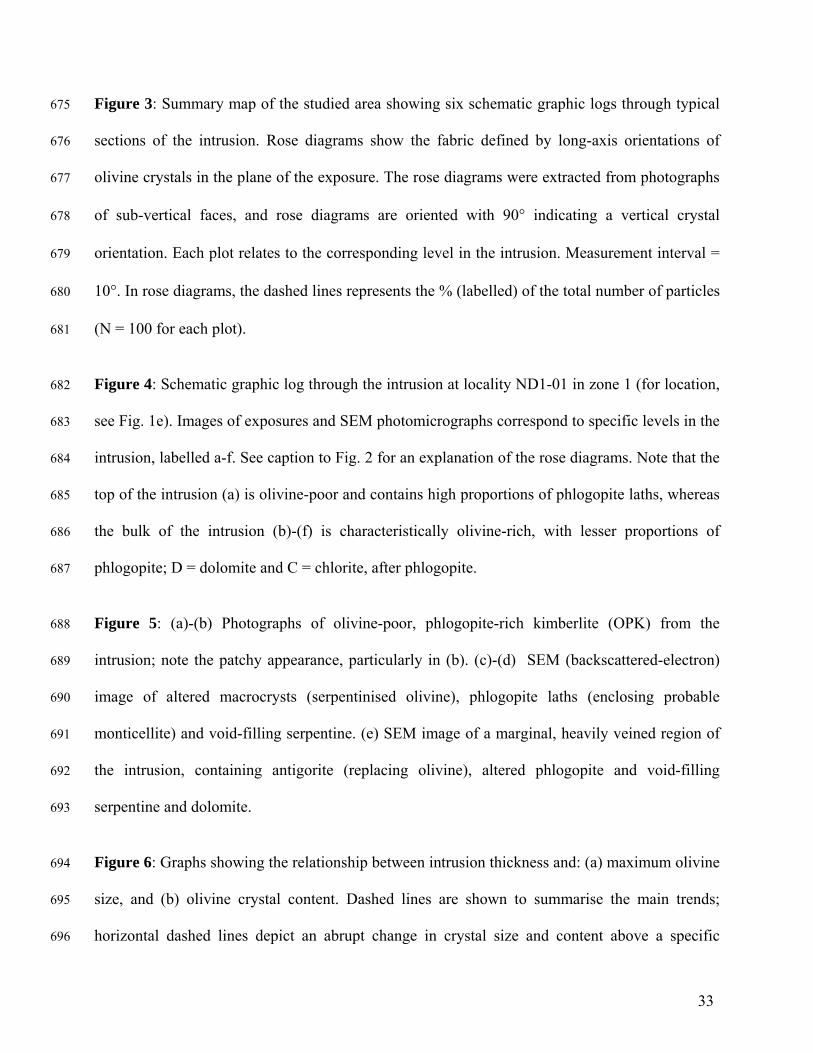
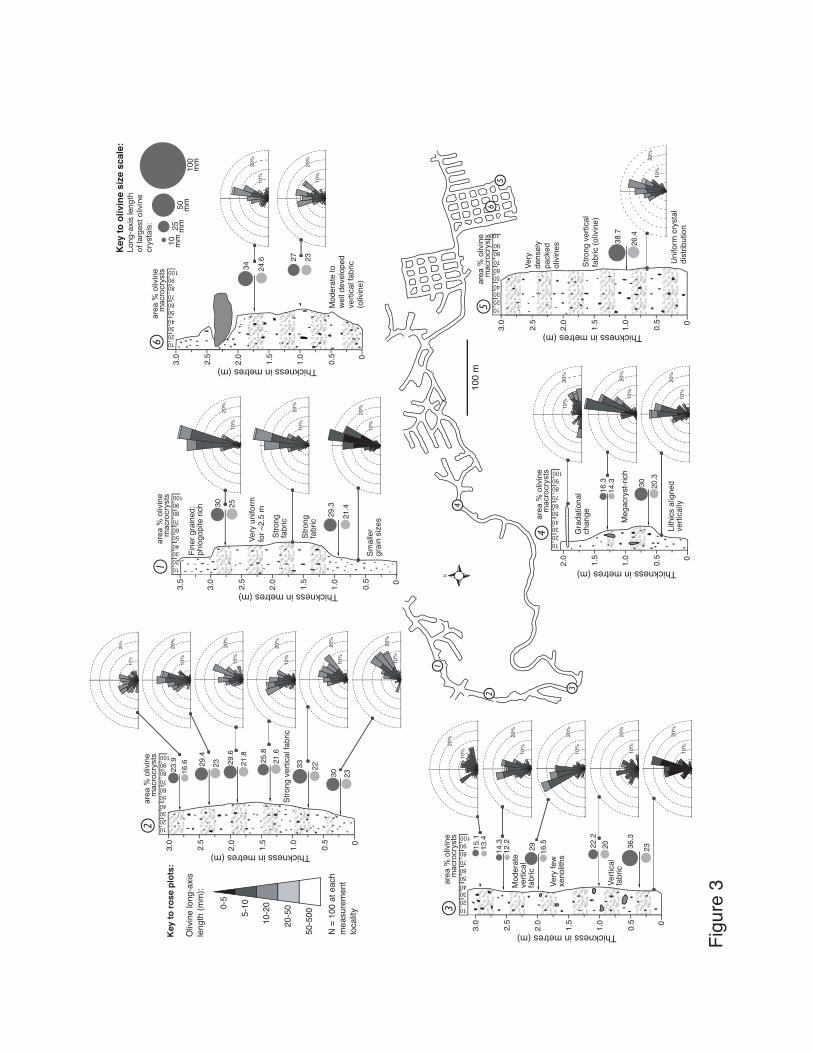
Figure 3: Summary map of the studied area showing six schematic graphic logs through typical 675
sections of the intrusion. Rose diagrams show the fabric defined by long-axis orientations of 676
olivine crystals in the plane of the exposure. The rose diagrams were extracted from photographs 677
of sub-vertical faces, and rose diagrams are oriented with 90° indicating a vertical crystal 678
orientation. Each plot relates to the corresponding level in the intrusion. Measurement interval = 679
10°. In rose diagrams, the dashed lines represents the % (labelled) of the total number of particles 680
(N = 100 for each plot). 681
Figure 4: Schematic graphic log through the intrusion at locality ND1-01 in zone 1 (for location, 682
see Fig. 1e). Images of exposures and SEM photomicrographs correspond to specific levels in the 683
intrusion, labelled a-f. See caption to Fig. 2 for an explanation of the rose diagrams. Note that the 684
top of the intrusion (a) is olivine-poor and contains high proportions of phlogopite laths, whereas 685
the bulk of the intrusion (b)-(f) is characteristically olivine-rich, with lesser proportions of 686
phlogopite; D = dolomite and C = chlorite, after phlogopite. 687
Figure 5: (a)-(b) Photographs of olivine-poor, phlogopite-rich kimberlite (OPK) from the 688
intrusion; note the patchy appearance, particularly in (b). (c)-(d) SEM (backscattered-electron) 689
image of altered macrocrysts (serpentinised olivine), phlogopite laths (enclosing probable 690
monticellite) and void-filling serpentine. (e) SEM image of a marginal, heavily veined region of 691
the intrusion, containing antigorite (replacing olivine), altered phlogopite and void-filling 692
serpentine and dolomite. 693
Figure 6: Graphs showing the relationship between intrusion thickness and: (a) maximum olivine 694
size, and (b) olivine crystal content. Dashed lines are shown to summarise the main trends; 695
horizontal dashed lines depict an abrupt change in crystal size and content above a specific 696

34
intrusion thickness. 697
Figure 7: Map summarising the spatial distribution of ramps across a test panel in zone 2 of the 698
mine (for location refer to Fig. 1e). Also shown are the variations in (b) maximum crystal size 699
(symbol as in Fig. S2), (c) mean crystal size (depicted as scaled light grey circles, see legend), 700
and (d) olivine crystal content (symbol as in Fig. 8). 701
Figure 8: Schematic cross-section of the internal structure of the intrusion in zone 2 (see inset for 702
location). Rose diagrams show the fabric defined by long-axis orientations of olivine crystals in 703
the plane of the exposure. Note the dominantly sub-vertical alignment of olivine crystals. 704
Measurement interval = 10°. In rose diagrams, the dashed line represents 10% of the total number 705
of crystals (N = 100). 706
Figure 9: (a) Olivine-rich lithic breccia (ORBr) containing concentrations of olivine crystals in 707
the interstices between lithic clasts. Note the sharp contact with OPK. (b) Olivine-poor lithic 708
breccia (OPBr) occurring in a wedge-shaped irregularity in the hangingwall of the intrusion 709
associated with a ramp system. (c) Distribution of lithic clasts in a typical ramp from zone 1 in 710
the SLI (Fig. 1e). (d) Graph showing the variation in lithic proportion with distance from the 711
ramp depicted in (c). 712
Figure 10: Schematic cross-section illustrating the three key stages involved in ramp formation 713
in the SLI and breccia emplacement. See text for further details. 714
Figure 11: (a) Schematic summary of structural complexities and lithofacies relationships within 715
the SLI. Heterogeneities in crystal size and content occur over short distances (metres to tens of 716
metres) in the intrusion. Inset: entrainment of cognate xenolith of ORK by relatively mobile OPK 717
35
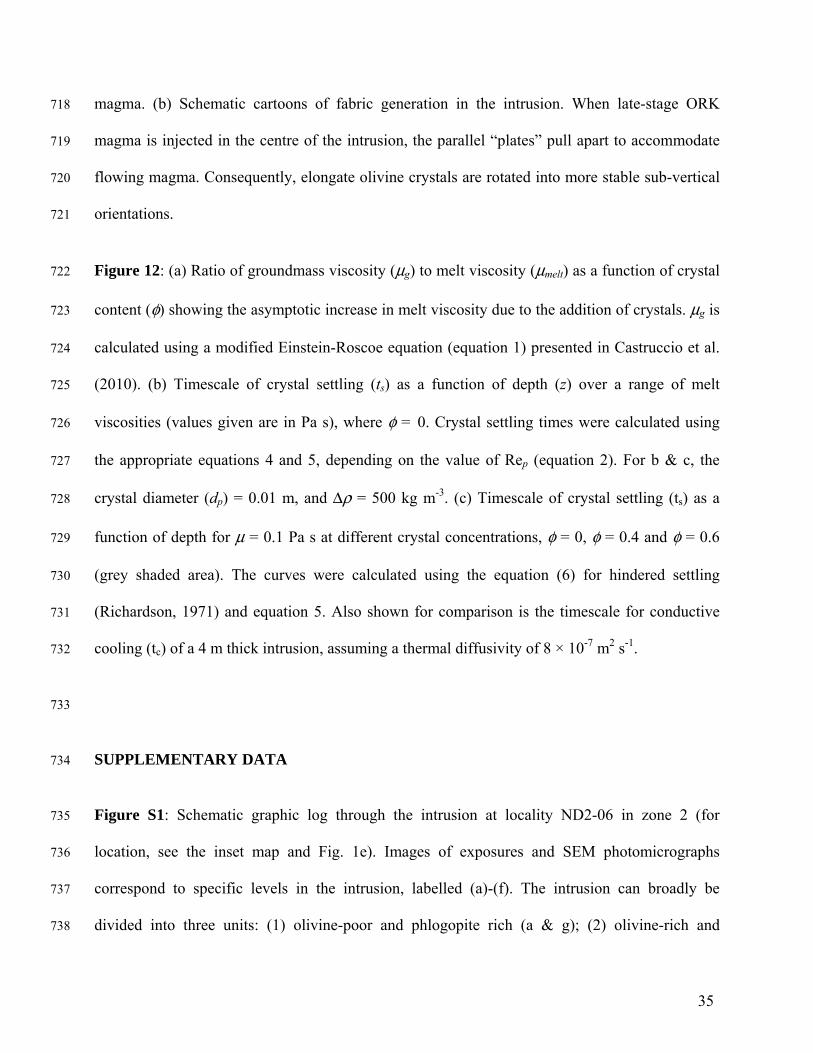
magma. (b) Schematic cartoons of fabric generation in the intrusion. When late-stage ORK 718
magma is injected in the centre of the intrusion, the parallel “plates” pull apart to accommodate 719
flowing magma. Consequently, elongate olivine crystals are rotated into more stable sub-vertical 720
orientations. 721
Figure 12: (a) Ratio of groundmass viscosity (μg) to melt viscosity (μmelt) as a function of crystal 722
content (φ) showing the asymptotic increase in melt viscosity due to the addition of crystals. μg is 723
calculated using a modified Einstein-Roscoe equation (equation 1) presented in Castruccio et al. 724
(2010). (b) Timescale of crystal settling (ts) as a function of depth (z) over a range of melt 725
viscosities (values given are in Pa s), where φ = 0. Crystal settling times were calculated using 726
the appropriate equations 4 and 5, depending on the value of Rep (equation 2). For b & c, the 727
crystal diameter (dp) = 0.01 m, and Δρ = 500 kg m-3. (c) Timescale of crystal settling (ts) as a 728
function of depth for μ = 0.1 Pa s at different crystal concentrations, φ = 0, φ = 0.4 and φ = 0.6 729
(grey shaded area). The curves were calculated using the equation (6) for hindered settling 730
(Richardson, 1971) and equation 5. Also shown for comparison is the timescale for conductive 731
cooling (tc) of a 4 m thick intrusion, assuming a thermal diffusivity of 8 × 10⁻⁷ m2 s-1. 732
733
SUPPLEMENTARY DATA 734
Figure S1: Schematic graphic log through the intrusion at locality ND2-06 in zone 2 (for 735
location, see the inset map and Fig. 1e). Images of exposures and SEM photomicrographs 736
correspond to specific levels in the intrusion, labelled (a)-(f). The intrusion can broadly be 737
divided into three units: (1) olivine-poor and phlogopite rich (a & g); (2) olivine-rich and 738
36
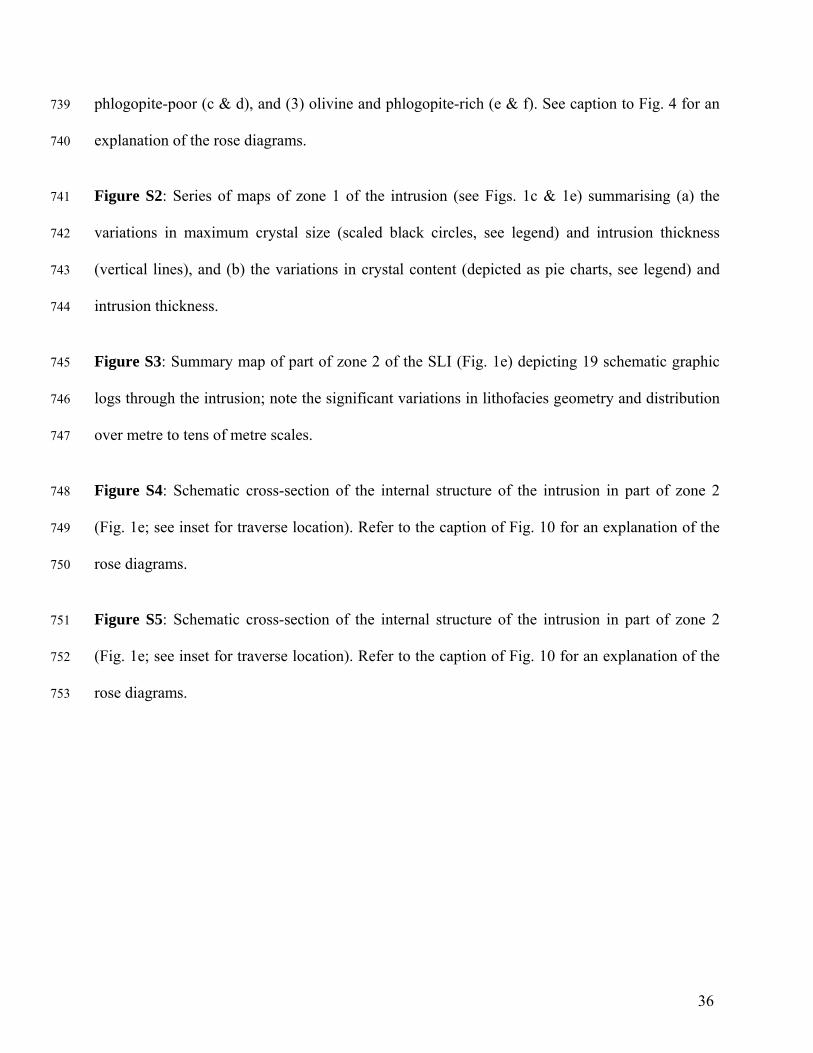
phlogopite-poor (c & d), and (3) olivine and phlogopite-rich (e & f). See caption to Fig. 4 for an 739
explanation of the rose diagrams. 740
Figure S2: Series of maps of zone 1 of the intrusion (see Figs. 1c & 1e) summarising (a) the 741
variations in maximum crystal size (scaled black circles, see legend) and intrusion thickness 742
(vertical lines), and (b) the variations in crystal content (depicted as pie charts, see legend) and 743
intrusion thickness. 744
Figure S3: Summary map of part of zone 2 of the SLI (Fig. 1e) depicting 19 schematic graphic 745
logs through the intrusion; note the significant variations in lithofacies geometry and distribution 746
over metre to tens of metre scales. 747
Figure S4: Schematic cross-section of the internal structure of the intrusion in part of zone 2 748
(Fig. 1e; see inset for traverse location). Refer to the caption of Fig. 10 for an explanation of the 749
rose diagrams. 750
Figure S5: Schematic cross-section of the internal structure of the intrusion in part of zone 2 751
(Fig. 1e; see inset for traverse location). Refer to the caption of Fig. 10 for an explanation of the 752
rose diagrams. 753
+ ++ + ++ ++ ++ ++ +
+ + ++ + ++ + ++ + ++ + ++ + +
+ + ++ + ++ + ++ + ++ + ++ + +
+ + ++ + ++ + ++ + ++ + ++ + +
+ + ++ + ++ + ++ + ++ + ++ + +
+ + ++ + ++ + ++ + ++ + ++ + +
+ + ++ + ++ + ++ + ++ + ++ + +
+ + ++ + ++ + ++ + ++ + ++ + +
+ + ++ + ++ + ++ + ++ + ++ + +
+ + ++ + ++ + ++ + ++ + ++ + +
+ + ++ + ++ + ++ + ++ + ++ + +
+ + ++ + ++ + ++ + ++ + ++ + +
+++
+ ++ ++ ++ +++ +
+ + ++ + ++ + ++ + ++ + ++ + +
+ + ++ + ++ + ++ + ++ + ++ + +
+ + ++ + ++ + ++ + ++ + ++ + +
+ + ++ + ++ + ++ + ++ + ++ + +
+ + ++ + ++ + ++ + ++ + ++ + +
+ + ++ + ++ + ++ + ++ + ++ + +
+ + ++ + ++ + ++ + ++ + ++ + +
+ + ++ + ++ + ++ + ++ + ++ + +
+ + ++ + ++ + ++ + ++ + ++ + +
+ + ++ + ++ + ++ + ++ + ++ + +
+ + ++ + ++ + ++ + ++ + ++ + +
+++
++ +++++
+ + ++ + ++ + ++ + ++ + ++ + +
+ + ++ + ++ + ++ + ++ + ++ + +
+ + ++ + ++ + ++ + ++ + ++ + +
+ + ++ + ++ + ++ + ++ + ++ + +
+ + ++ + ++ + ++ + ++ + ++ + +
+ + ++ + ++ + ++ + ++ + ++ + +
+ + ++ + ++ + ++ + ++ + ++ + +
+ + ++ + ++ + ++ + ++ + ++ + +
+ + ++ + ++ + ++ + ++ + ++ + +
+ + ++ + ++ + ++ + ++ + ++ + +
+ + ++ + ++ + ++ + ++ + ++ + +
+++
++++++
+ + ++ + ++ + ++ + ++ + ++ + +
+ + ++ + ++ + ++ + ++ + ++ + +
+ + ++ + ++ + ++ + ++ + ++ + +
+ + ++ + ++ + ++ + ++ + ++ + +
+ + ++ + ++ + ++ + ++ + ++ + +
+ + ++ + ++ + ++ + ++ + ++ + +
+ + ++ + ++ + ++ + ++ + ++ + +
+ + ++ + ++ + ++ + ++ + ++ + +
+ + ++ + ++ + ++ + ++ + ++ + +
+ + ++ + ++ + ++ + ++ + ++ + +
+ + ++ + ++ + ++ + ++ + ++ + +
+++
+++++
+ + ++ + ++ + ++ + ++ + ++ + +
+ + ++ + ++ + ++ + ++ + ++ + +
+ + ++ + ++ + ++ + ++ + ++ + +
+ + ++ + ++ + ++ + ++ + ++ + +
+ + ++ + ++ + ++ + ++ + ++ + +
+ + ++ + ++ + ++ + ++ + ++ + +
+ + ++ + ++ + ++ + ++ + ++ + +
+ + ++ + ++ + ++ + ++ + ++ + +
+ + ++ + ++ + ++ + ++ + ++ + +
+ + ++ + ++ + ++ + ++ + ++ + +
+ + ++ + ++ + ++ + ++ + ++ + +
+++
+ + ++ + + + + ++ + + + + ++ + + + + ++ + + + + ++ + + + + ++ + + + + ++ + + + + ++ + + + + ++ + + + + ++ + + + + ++ + + +
+ + + + + + + + + + + + + + + + + + + +
++
+ +++ + +++ + ++ + +++ + ++ + +
+ + ++ + ++ + ++ + ++ + ++ + +
+ + ++ + ++ + ++ + ++ + ++ + +
+ + ++ + ++ + ++ + ++ + ++ + +
+ + ++ + ++ + ++ + ++ + ++ + +
+ + ++ + ++ + ++ + ++ + ++ + +
+ + ++ + ++ + ++ + ++ + ++ + +
+++
+++++++
+ + ++ + ++ + ++ + ++ + ++ + +
+ + ++ + ++ + ++ + ++ + ++ + +
+ + ++ + ++ + ++ + ++ + ++ + +
+ + ++ + ++ + ++ + ++ + ++ + +
+ + ++ + ++ + ++ + ++ + ++ + +
+ + ++ + ++ + ++ + ++ + ++ + +
+ + ++ + ++ + ++ + ++ + ++ + +
+++
? SLI
b
Metaturbidites
Quartz diorite
Granitoids
38Ramp orientation and dip
50
25
34
33
36
20
1440
38
1416 25
19
24
2627
39
3022
38
32
4
4817
23
31
26
8
38
17
40
14
37
1940
6944
7032
25
27
58
3757
100 m
Key to symbols:
Breccia body
Zone 2
85
e
Major fold axial traces
F4 synform/antiform
F3 synform/antiform
F1 + F2 isocline-
Major fault
Zone 1
70
32
29
24
4838
Migmatites
Leucogabbro
Metavolcanicrocks
Magmaticcomplexes
Pre 2.8 Gacomplexes
ND1-01
see mapbelow
Intrusion segmentorientation and dip
Snap Lake
63o35'
110o45'
1 km
110o50'
63o35'
Snap Fau
lt
Crackle
Fault
c
Great SlaveLake
Coronation Gulf
Bathurst Inlet
64o
108o
68o
116o 112o
McDo
nald F
ault
Bathurst Fault
YellowknifeBeniah
Fault
a c
e
Legend:
WopmayOrogen
bThelonFront
66o
68o
64o
100 km
400
0
200
SW NE
200 m
d
d
m
ND2-06
Figure 1
+
+
16.6
23.9 2329.4
21.8
29.6
21.6
25.8
2233
2330
Strongverticalfabric
++
Finergrained;
phlogopiterich
Smaller
grainsizes
2530
21.4
29.3
Vertical
fabric
Moderate
vertical
fabric
13.4
15.1
12.2
14.3
16.5
29 2022.2
2336.3
0.5
1.0
1.5
2.0
2.5
3.0
Thicknessinmetres(m)
0
10
20
30
90
80
70
60
50
40
100
+
26.4
38.7
10%
20%
ll
5
10%
20%
ll
10%
20%
ll
+
+
++
2327
24.6
34
+
Lithicsaligned
vertically
Megacryst-rich
14.3
16.3
20.3
30
10%
20%
ll
10%
20%
ll
5%
10%
20%
ll
4
10%
20%
ll
10%
20%
ll
10%
20%
ll
5%10%
20%
ll
10%
20%
ll
10%
20%
ll
10%
20%
ll
10%
20%
ll
3
16
2
10%
20%
ll
10%
20%
ll
10%
20%
ll
10%
20%
ll
10%
20%
ll
10%
20%
ll
0-5
5-10
10-20
20-50
50-500
Olivinelong-axis
length(mm):
Keytoroseplots:
N=100ateach
measurement
locality
10 mm25 mm
50 mm
100
mm
Keytoolivinesizescale:
Long
-axisleng
thof
larges
tolivine
crystals:
100m
1
2
3
4
56
Very
densely
packed
olivines
Strongvertical
fabric(olivine)
Uniformcrystal
distribution
area%olivine
macrocrysts
0.5
1.0
1.5
2.0
2.5
3.0
Thicknessinmetres(m)
0
10
20
30
90
80
70
60
50
40
100
area%olivine
macrocrysts
Moderateto
welldeveloped
verticalfabric
(olivine)
10
20
30
90
80
70
60
50
40
100
area%olivine
macrocrysts
0.5
1.0
1.5
2.0
2.5
3.0
Thicknessinmetres(m)
0
3.5
Strong
fabric
Veryuniform
for~2.5m
Strong
fabric
10
20
30
90
80
70
60
50
40
100
area%olivine
macrocrysts
10
20
30
90
80
70
60
50
40
100
area%olivine
macrocrysts
10
20
30
90
80
70
60
50
40
100
area%olivine
macrocrysts
0.5
1.0
1.5
2.0
Thicknessinmetres(m)
0
0.5
1.0
1.5
2.0
2.5
3.0
Thicknessinmetres(m)
0
0.5
1.0
1.5
2.0
2.5
3.0
Thicknessinmetres(m)
0
Gradational
change
Veryfew
xenoliths
Figure3
1.5
2
2.5
3
3.5
4
4.5
10 15 20 25 30 35 40 45 50
Intrusionthickness(m)
Maximum olivine size (mm)
0
1
2
3
4
0 10 20 30 40 50 60 70
Intrusionthickness(m)
Olivine crystal content (area %)
a
b
Figure 6

0 20 m
48
D =0.9m
38D =1.4m
24
70
38
Ramp orientation (strike and dip)D = displacement in metres
3254D =
1.6m
D =0.9m
46
3228
44D =1.6m
70
D =2.2m
D =1.5m
69
5542
29
26
Maximummegacrystobserved(major axis)
51
25
31
23
71
663124
5122
19
31
60
33
40
54
56
47
3125
52
35
92
45
21
28
63
2633
77
32
35
39
40
17
1916
1618
43
34
32
300
71 26
111
31
31
24
40102
2830
17
37 33
9656
23
Maximum olivinedimension
Key to crystal sizes:
20
24
20
18
41
20
29
18
16
16
15
23
26
17
22
20
16
18
22
18
20
23
16
22
20
23
1920
16
29
2733
2226
16
21
26
21
14
14
24
10mm 25
mm 50mm
Examples:
25%
50%
0 20 m
0 20 m 0 20 m
10mm25
mm50mm100
mm
100mm
a b
c
d
Figure 7
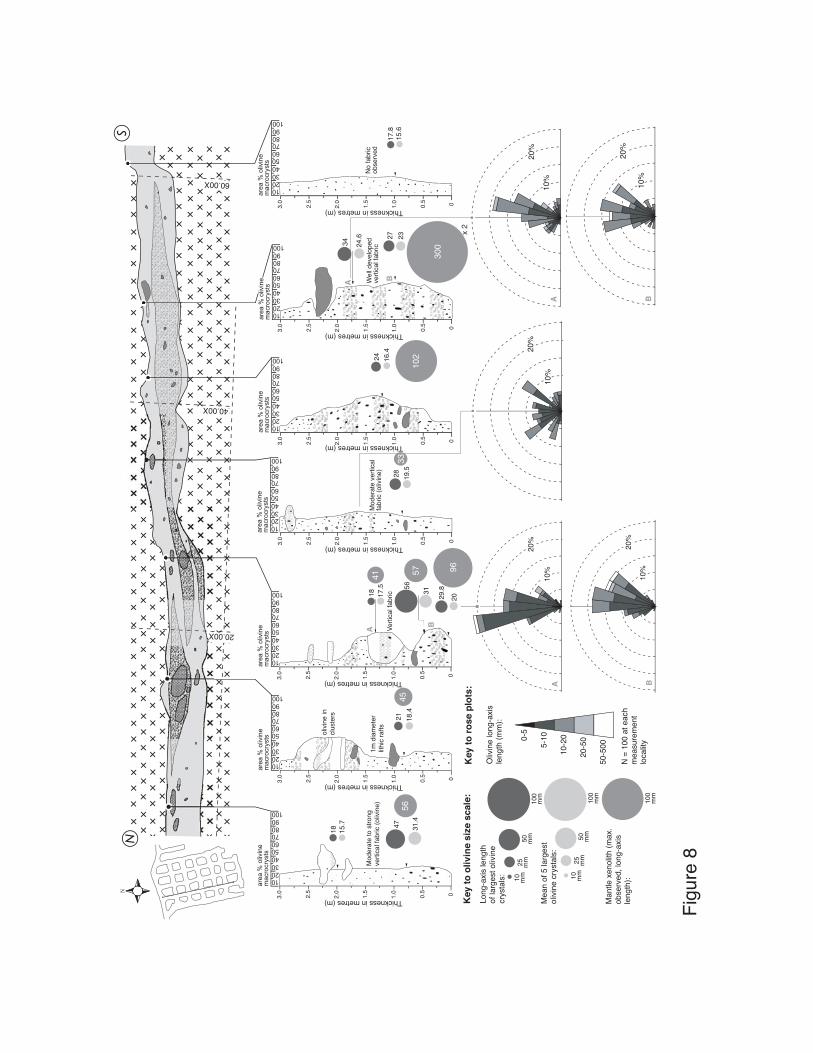
Figure8
+++++++++++++++++++++++++++++++++++++++++++
++ ++++ +++
++++++
++++++
+++
++++++
++++++
++
++++++
++++++
++
++++++
++++++
+++
++++++
++++++
+
++++++
+++++++
+++ +
++++
+
++++++
+++
++++++
+++
+++++++
++++++
+++
+
++++++++
+++++++++++++++++++
+ ++++++
+ ++ ++++ ++
++
++++++
++++++
+ ++++++
+++++++
+++++
++++++
+++
++++++
++++++
+ ++++++
+++++++
+ ++
++++++
+++++++
+++++
++++++
+++++++
+++++
++++++
+++++++
+++++
++++++
+++++++
+++++
++++++
+++++++
+++++
++++++
+++++++
+++++
++++++
+++++++
+++++
++++++
+++++++
+ ++++ ++++++
+++++
++
++
+
+
+++
+
+++
++
++
++
+++
++++
+
+ +
40.00X
60.00X
20.00X
S
+
+
16.4
24
102
15.6
17.8
Nofabric
observed
31.4
4756
Moderatetostrong
verticalfabric(olivine)
15.7
18
18.4
2145
10 mm
25 mm
50 mm
100
mm
100
mm
Mantlexenolith(max.
observed,long-axis
length):
0-5
5-10
10-20
20-50
50-500
ll
10%
20%
10%
20%
ll
10%
20%
ll
10%
20%
ll
Olivinelong-axis
length(mm):
10%
20%
ll
Keytoroseplots:
N=100ateach
measurement
locality
Keytoolivinesizescale:
+ +
19.5
2833
Moderatevertical
fabric(olivine)
x2
+
+
++
2327
30024.6
34
Welldeveloped
verticalfabric
BA
A BBA
+
2029.8
96
Verticalfabric 31
5657
17.5
1841
B
A
Meanof5largest
olivinecrystals:
Long-axislength
oflargestolivine
crystals: 10 mm
25 mm
50 mm
100
mm
102030
9080706050
40
100
area%olivine
macrocrysts
0.5
1.0
1.5
2.0
2.5
3.0
Thicknessinmetres(m)
0
0.5
1.0
1.5
2.0
2.5
3.0
Thicknessinmetres(m)
0
102030
9080706050
40
100
area%olivine
macrocrysts
102030
9080706050
40
100
area%olivine
macrocrysts
0.5
1.0
1.5
2.0
2.5
3.0
Thicknessinmetres(m)
0
0.5
1.0
1.5
2.0
2.5
3.0
Thicknessinmetres(m)
0
0.5
1.0
1.5
2.0
2.5
3.0
Thicknessinmetres(m) 0
0.5
1.0
1.5
2.0
2.5
3.0
Thicknessinmetres(m)
0
0.5
1.0
1.5
2.0
2.5
3.0
Thicknessinmetres(m)
0
102030
9080706050
40
100
area%olivine
macrocrysts
102030
9080706050
40
100
area%olivine
macrocrysts
102030
9080706050
40
100
102030
9080706050
40
100
area%olivine
macrocrysts
area%olivine
macrocrysts
olivinein
clusters
1mdiameter
lithicrafts
N

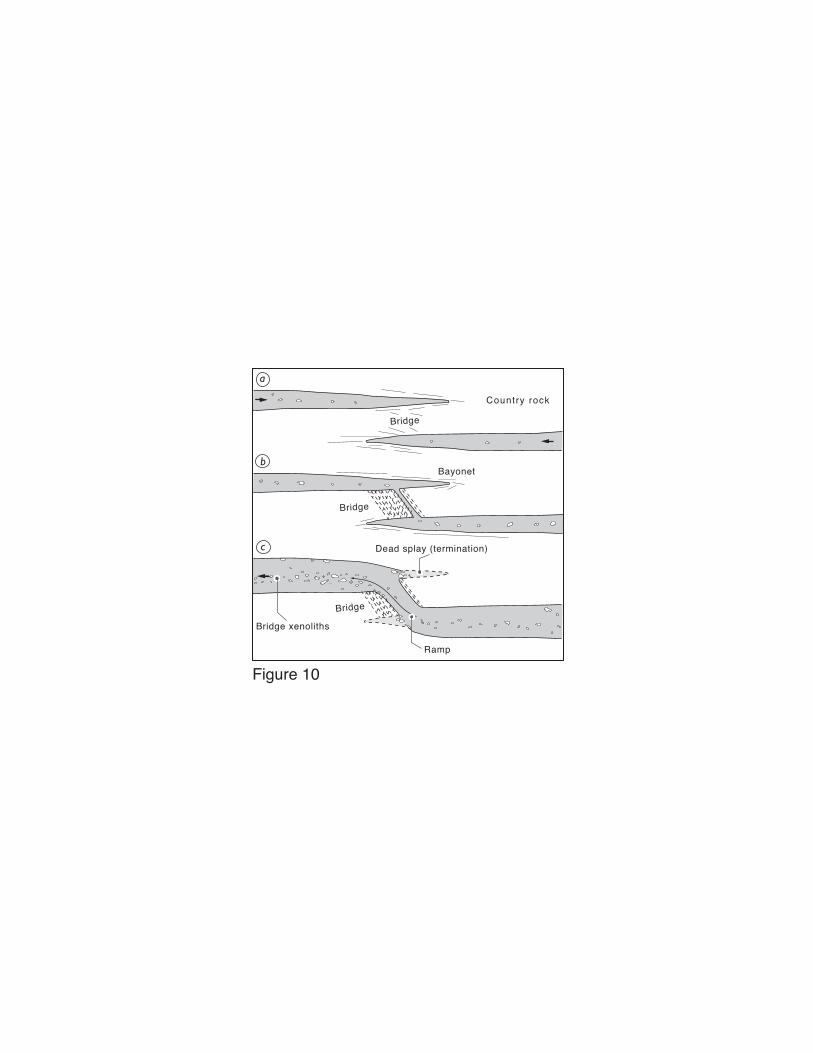
Bridge
Bridge
Bayonet
Country rock
Dead splay (termination)
Bridge xenoliths
Ramp
Bridge
a
b
c
Figure 10
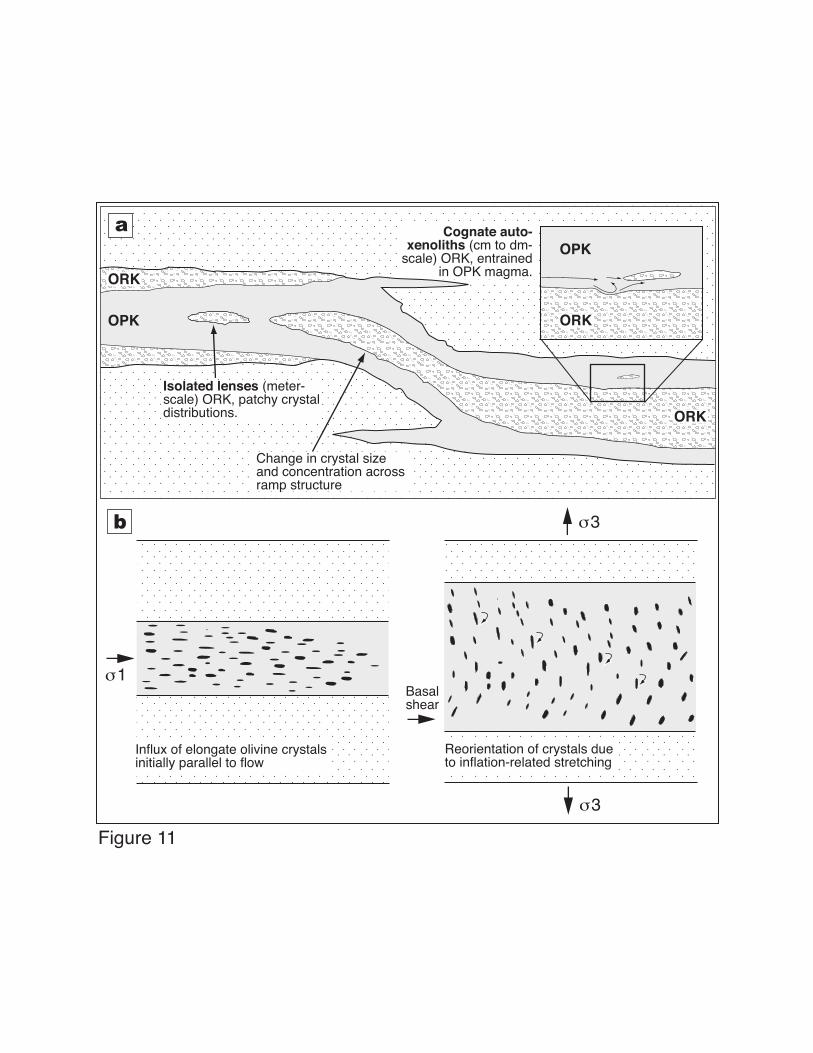
s1
s3
s3
Cognate auto-xenoliths (cm to dm-scale) ORK, entrained
in OPK magma.
Isolated lenses (meter-scale) ORK, patchy crystaldistributions.
Change in crystal sizeand concentration acrossramp structure
OPK
ORK
ORK
ORK
OPK
a
b
Basalshear
Influx of elongate olivine crystalsinitially parallel to flow
Reorientation of crystals dueto inflation-related stretching
Figure 11
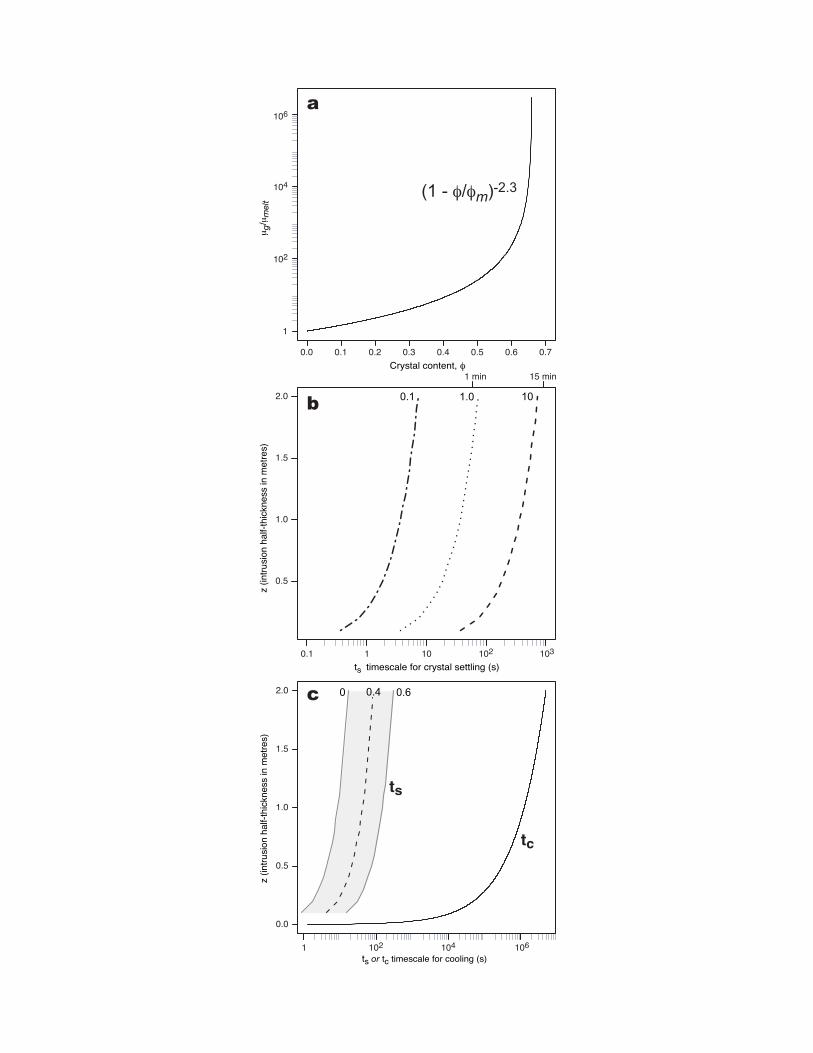
1 102 104 106
0.0 0.1 0.2 0.3 0.4 0.5 0.6 0.7
0.0
0.5
1.0
1.5
2.0
a
mg/mmelt
Crystal content, f
b
c
1 min 15 min
0.1 1 10 102 103
0.5
1.0
1.5
2.0
z(intrusionhalf-thicknessinmetres)
z(intrusionhalf-thicknessinmetres)
ts timescale for crystal settling (s)
1
102
104
106
ts or tc timescale for cooling (s)
tc
ts
0 0.60.4
0.1 1.0 10
(1 - f/fm)-2.3


![Garnets of polimict breccia from Noyabrskaya kimberlite pipe (Yakutia) [1] Pokhilenko et al. (1999) Proceedings of the 7th International Kimberlite Conference:](https://img.dokumen.tips/doc/110x75/56649f0e5503460f94c22f55/garnets-of-polimict-breccia-from-noyabrskaya-kimberlite-pipe-yakutia-1.jpg)