Embed Size (px)
Citation preview

\ North Carolina
Department op Conservation and Development
William P. Saunders, Director
Division of Mineral Resources
Jasper L. Stuckey, State Geologist
Bulletin Number 73
GEOLOGY AND GROUND-WATER RESOURCESIN THE
GREENVILLE AREA, NORTH CAROLINA
By
Philip M. Brown
Geologist, Geological Survey
United States Department of the Interior
Prepared Cooperatively by the Geological Survey
United States Department op the Interior
1959

Members of the Board of Conservation and Development
Governor Luther H. Hodges, Chairman Raleigh
Miles J. Smith, First Vice Chairman Salisbury
Walter J. Damtopt, Second Vice Chairman Asheville
Charles S. Allen Durham
W. B. Austin Jefferson
F. J. Boling Siler City
H. C. Buchan, Jr North Wilkesboro
Scroop W. Enloe, Jr Spruce Pine
VoiT Gilmore _;;::;:.__ Southern Pines
R. M. Hanes* Winston-Salem
Leo H. Harvey* Kinston
Amos R. Kearns . High Point
H. C. Kennett Durham
R. W. Martin Raleigh
Lorimer W. Midgett Elizabeth City
Cecil Morris Atlantic
Hugh M. Morton _ . Wilmington
W. Eugene Simmons Tarboro
T. Max Watson Spindale
♦Deceased
]i
1•Iif-
I
Letter of Transmittal
To His Excellency, Honorable Luther H. Hodges
Governor of North Carolina
Sir:
I have the honor to submit herewith manuscript for publica
tion Bulletin No. 73, "Geology and Ground-Water Resources in
the Greenville Area, North Carolina", by Philip M. Brown.
This is another in the series of reports being prepared on
ground water and geology in North Carolina by the Department
of Conservation and Development in cooperation with the United
States Geological Survey. In most parts of North Carolina,
ground water is becoming increasingly important as a source of
supply for industries, municipalities and schools. It is believed
that this report will be of value to those interested in the geology
and ground-water resources of the Greenville area.
Respectfully submitted,
William P. Saunders
Director
in

2p^
Table of Contents
Page
fipstract 1
introduction : 3
J Location of area 3
Cooperation and direction . 3
Previous work - 3
Acknowledgments 3
Geography . 3
Area and population 3
Physiography 3
Climate „. 5
Agriculture _• 5
Industry 5
Transportation 12L-1 . 5
General geology = 5
Geologic formations in the Greenville area 10
Cretaceous system 10
Lower Cretaceous series 10
Unnamed unit 10
Upper Cretaceous series 10
Tuscaloosa formation 10
Black Creek formation 10
Peedee formation 11
Tertiary system 12
Paleocene series 12
Beaufort formation 12
Eocene series 13
Castle Hayne limestone 13
Miocene series 14
Middle (?) Miocene deposits 14
Yorktown formation 15
Quaternary system 15
Pleistocene and Recent series 15
iv

Surficial sands » . 15
Ground-water hydrology 16
Hydrologic cycle 1 ■ *"
Source of ground water '— ^
Occurrence of ground water., ^
Water-bearing properties of rocks '• 1'
Recharge and discharge 17
Recovery of water *8
General features 18
Dug wells 18
Bored wells *8
Driven wells *8
Drilled wells " 18
Hydrologic principles affecting recovery I9
Quality of water 19
Mineral composition of ground waters I9
Silica (SiO2) 2*
Iron (Fe) - 21
Calcium and magnesium (Ca and Mg) 21
Sodium and potassium (Na and K) 2*
Bicarbonate and carbonate (HCO3 and C03) 22
Sulfate (So4) 22
Chloride (Cl) 22
Fluoride (F) 23
Nitrate (NO3) 2S
Phosphate (PO4) 23
Dissolved solids 23
Hardness 23
Hydrogen-ion concentration (pH) 23
Principal formations and their hydrologic characteristics 24
Strata of Early Cretaceous age : 24
Tuscaloosa formation 24
Black Creek formation 24
Peedee formation 2^
Beaufort formation 2^
v

Castle Hayne limestone - 25
Yorktown formation 26
Surficial sands 26
Quantitative measurements of ground water - 27
County descriptions 27
Beaufort County 27
Bertie County j. 36
Chowan County 43
Gates County 49
Greene County ^ . 56
Hertford County 62
Martin County 70
Pitt County 78
Selected bibliography 86
VI

Illustrations
Figure 1. Index map of North Carolina showing areas covered by
major ground-water investigations 2
2. Distribution of major streams in the Greenville area 4
3. Climatic summary for Edenton, Chowan County— 6
4. Diagram showing wells in water-table and artesian aquifers 20
5. Map of Beaufort County showing the location of water
supplies 31
6. Map of Bertie County showing the location of water supplies 39
7. Map of Chowan County showing the location of water
supplies _: 46
8. Map of Gates County showing the location of water supplies 53
9. Map of Greene County showing the location of water
supplies 59
10. Map of Hertford County showing the location of water
supplies . 66
11. Map of Martin County showing the location of water
supplies 74
12. Map of Pitt County showing the location of water supplies. 82
Table 1. Geologic units and their water-bearing characteristics in the
Greenville area 8-9
2. Records of wells in Beaufort County 32, 33, 34
3. Chemical analyses of ground water from Beaufort County 34, 35
4. Records of wells in Bertie County 40,41
5. Chemical analyses of ground water from Bertie County 41, 42
6. Records of wells in Chowan County 47, 48
7. Chemical analyses of ground water from Chowan County 48
8. Records of wells in Gates County 54
9. Chemical analyses of ground water from Gates County 55
10. Records of wells in Greene County 60
11. Chemical analyses of ground water from Greene County.. 61
12. Records of wells in Hertford County 67, 68
13. Chemical analyses of ground water from Hertford County 68, 69
14. Records of wells in Martin County 75, 76
15. Chemical analyses of ground water from Martin County. 76, 77
16. Records of wells in Pitt County 83,84
17. Chemical analyses of ground water from Pitt County 84, 85
vn

h* >■/-■■
GEOLOGY AND GROUND-WATER RESOURCES
in the
GREENVILLE AREA, NORTH CAROLINA
By
Philip M. Brown
ABSTRACT
The area described in this report, the Greenville
area, includes the following counties: Beaufort, Ber
tie, Chowan, Gates, Greene, Hertford, Martin, and
Pitt. These counties lie in the north-central CarolinaCoastal Plain and extend in a north-south direction
from the Virginia State line south to the Neuse
River.
The area is underlain by a group of sedimentary
formations that thicken in a southeast direction and
slope toward the southeast at a rate of 15 to 30 feetper mile, forming a simple monocline. The strati-graphic relationships are more complex; the oldestsediments, exposed at the surface in the southwest
and central sections of the area, are transgressively
buried by younger sediments in a northeast direc
tion along the prevailing strike.
The hydrology of the area is controlled by sedi
ments of Mesozoic and Cenozoic age: sands, clays,
marls, and limestones of Early Cretaceous, Late
Cretaceous. Paleocene, Eocene, Miocene, and Quater
nary age. Ground water in the area is largely undeveloped in terms of the ultimate potential supply.Generally speaking, no one section in the area ispresently using more than one-fourth or one-fifth ofthe available and replenishable supply of ground water. There are sections where little of the large
potential supply available is being used.
The majority of wells throughout the area are
shallow dug or driven wells that yield from severalto 20 gpm. Drilled municipal and industrial wellsmay yield from 200 to 1,000 gpm, according to their
location and depth.
The water obtained from most wells is generallyof adequate quality. It ranges from the relativelyhard calcium bicarbonate waters emanating fromshallow marls and limestones to the soft sodium bicarbonate waters in the deeper "greensands."- Salinewaters occur progressively nearer the land* surface
toward the present coastline. Waters having highconcentrations of fluoride occur in some areas ofBertie, Gates, Hertford, and Martin Counties.

a. Halifax area, Bulletin 51
b. Greensboro area, Bulletin 55
c. Charlotte area, Bulletin^€x3
d. Statesville area, Bulletin 68
e. Greenville area, Described in this report
f. Wilmington area, Report in preparation
g. Fayetteville area, Report in preparation
Index map of North Carolina showing areas
covered by major ground-water investigations
Figure 1.

INTRODUCTION
The purpose of the investigation on which this
report is based was to determine the lithic character,
areal extent, thickness, and water-bearing properties
of the stratified rocks underlying the eight counties
in the Greenville area, the potentiality for the de
velopment of additional water supplies from those
rocks, and the chemical quality of the water they
contain. This.information was obtained by review
ing the available geologic and hydrologic literatureon the area, by examining wells and recording perti
nent data,' by making chemical analyses of water
samples from representative wells, and by confer
ring with well owners, well drillers, and town of
ficials in regard to ground-water conditions in the
area. The information was synthesized and arranged
by counties in a report describing the entire area.
Location of Area
The Greenville area is in the northeastern section
of the State (see fig. 1), a section that is predomi
nantly rural. The report takes its name from the
city of Greenville in Pitt County, the largest city in
the area of investigation. It includes the following
counties: Beaufort, Bertie, Chowan, Gates, Greene,
Hertford, Martin, and Pitt.
Cooperation and Direction
The investigation was made by the Ground Water
Branch, U. S. Geological Survey, in cooperation with
the Division of Mineral Resources, North Carolina
Department of Conservation and Development. The
report was prepared under the general supervision of
A. N. Sayre and P. E. LaMoreaux, former and pres-
sent Chiefs, Ground Water Branch, U. S. Geological
Survey, and J. L. Stuckey, State Geologist. Field in
vestigations and preparation of the report were un
der the supervision of H. E. LeGrand, former Dis
trict Geologist, Ground Water Branch, U. S. Geological Survey.
Previous Work
This report is the fifth in a series of areal reports
(fig. 1) that are designed to give a preliminary or
reconnaissance appraisal of ground-water conditions
in the entire State. Emphasis has been placed on
ground-water appraisals in areas of immediate eco
nomic interest. Previous information concerning the
ground-water resources of the Greenville area is in
cluded in volume III of the North Carolina Geological
and Economic Survey, entitled, 'The Coastal Plain of
'References are on p. 197-200.
North Carolina" (Clark, Miller, Stephenson, Johnson,
and Parker, 1912).
'Information relative to the subsurface geology of
the Greenville area is taken largely from Bulletin
71 of the North Carolina Division of Mineral Re
sources, entitled "Well Logs from the Coastal Plain
of North Carolina", which was prepared by the writ
er in 1954-55 and published in 1958.
Acknowledgments
Many well drillers and town officials cooperated in
making well data available during the course of the
investigation. Officials and employees of the Heater
Well Drilling Co., the Carolina Drilling and Equip
ment Co., the Layne Atlantic Co., and the Magette
Well Drilling Co. were especially cooperative.
GEOGRAPHY
Area and Population
The area described in this report totals 3,589
square miles. Roughly classified, this total area con
sists of 1,319 square miles of cleared land and 2,270
square miles that is forested.
Total population in the eight counties of the area,
according to the 1950 census, was 216,872, an aver
age of 60.4 people per square mile. Urban population
is centered in seven cities or towns that have a
population in excess of 2,500. Total urban popula
tion is 44,914, or about 20 percent of the total popu
lation for the area. The remaining 80 percent of the
total population is rural and is centered in and
around some 40 incorporated and unincorporated
towns and villages in the area. Population it! the
area has remained relatively static during the past
decade. Six of the counties have gained slightly in
population and two have lost.
Physiography
The Greenville area lies entirely within the At-
lntic Coastal Plain province, which in North Carolina
is characterized by a broad, flat surface that slopes
gently toward the southeast. This surface represents
an emerged ocean floor, a landward extension of the
present ocean floor which forms the surface of the
continental shelf. Marked topographic variations are
lacking on the emerged surface; broad, flat inter-
stream areas are the dominant topographic features;
moderately dissected portions of the surface are con
fined to narrow belts bordering the major streams.
Elevations in the area of investigation range from
about 135 feet along the western border to sea level
along Albemarle and Pamlico Sounds.

WASHINGTON / TYRRELL
DISTRIBUTION OF MAJOR STREAMS
IN THE
GREENVILLE AREA
FlGUltK 2.

The major rivers that drain the area all rise or
flow through the Piedmont province, ^which lies to
the west. These rivers—the Chowan, the Roanoke,
the Tar, and the Neuse—follow subparallel courses
and flow in a southeasterly direction down the pre
vailing slope of the Coastal Plain, debouching into
either Albemarle or Pamlico Sound (fig. 2). The
river valleys in the area are all first-cycle valleys, and
the rivers have not, as yet, become deeply incised in
the flat plain or established significant delta systems.
Broad, featureless flood plains and poorly drained
swamps bordering large estuaries are characteristic
of the area. The most extensive of these swamps is
the Dismal Swamp, whose western boundary lies in
Gates County, and the East Dismal Swamp, which
extends into Martin and Beaufort Counties.
Climate
Comparison of records from four stations of the
U. S. Weather Bureau located at Edenton, Green
ville, Washington, and Williamston show that the
average yearly precipitation ranges from a maxi
mum of 50 inches, at Edenton in Chowan County to a
minimum of 47 inches at Williamston in Martin
County. Monthly distribution of precipitation at the
Edenton station is plotted in figure 3. This is the
only official station in the area for which a current
10-year record is available.
The average annual temperature at the same four
recording stations varies slightly and averages
61.0°F. Average, maximum, and minimum monthly
temperatures at the Edenton station are plotted in
figure 3.
Agriculture
All eight counties in the area are predominantly
rural. The agricultural products that provide the
main source of income are tobacco, corn, peanuts,
cotton, soy beans, sweet potatoes, and livestock. An
nual cash value of these products ranges from about
$4,000,000 in Gates County to more than $30,000,000
in Pitt County. Total annual cash income from agri
cultural products is slightly in excess of $130,000,000
in the eight-county area.
Industry
The larger towns are marketing and processing-
centers for the agricultural products grown on ^ear-
by farms. Except in Greenville, industrial develop
ment consists mainly of small, locally owned opera
tions engaged in the packaging and processing of
farm products. Commercial fishing and seafood pro
cessing are major industries in several communities
bordering on Albemarle and Pamlico Sounds. Small
lumbering operations and sawmills are common
throughout the area, there being one large pulp mill
in Martin County, Greenville, the largest population
center in the area, has the largest and most diversi
fied group of industries.
Transportation
The area is served by three principal railroads, the
Atlantic Coast Line Railroad, the Seaboard Air Line
Railroad, and the Norfolk and Southern Railroad.
All counties are traversed by at least one main or
branch line.
Several of the major rivers are important avenues
for commercial transportation within the practicable
limits of navigation as controlled by depth of chan
nel and fluctuating water levels. In the past, the
Chowan. Roanoke, Tar, and Neuse Rivers were all
open to commercial navigation. At present, the
Chowan and Roanoke Rivers are maintained for com-
merical navigation throughout their extent in the
Greenville area.
An adequate network of State and Federal roads
is maintained in the area. However, some difficulty
is experienced in crossing the broad estuaries and
sounds, where bridge and ferry service is limited.
GENERAL GEOLOGY
For a clear concept of the occurrence, availability,
and chemical quality of the ground water in theGreenville area, one first must gain an understanding
of the processes by which the rocks are formed and
then in part destroyed, of the composition of the
rocks, and of those physical properties of the rocks
that govern their ability to store and transmit water.
Except where granite is exposed at Fountain, in
Pitt County, the entire Greenville area is underlain
by an eastward-thickening succession of sand, silt,
and clay beds that were deposited, for the most
part, in sea water. The sources of these sediments
were the crystalline rocks in the areas now known as
the Blue Ridge and Piedmont provinces. The crystal
line rocks were fragmented through the processes of
weathering and were transported to the sea by
streams, there to be sorted by wave action and cur
rents, mixed with seashells and with-chemical pre-
cipitants, and eventually buried beneath later sedi
ments. From time to time the sea retreated, each
time exposing the latest sediments laid down on its
floor. Streams extended their courses across the ex
posed area and deposited, in times of flood, layers of

Precipitation
(inches)
Temperature
(°F.)
m a.
o o
HIGHES-
o 5' o
to
en
o 3-K
o^
c <
•
o 0)
•c 3 3 a
o D
o
JANFEB
ro
^
1=
e—
£—
is
:MMWMM
—HrHiBi
1iiill
—^^B
—^B
mm
—m
-mmm
U>
CD
o
WMMMk
WSiSk
issiiii
Illllllll
1
1 Ml
■ iiiil
a 1 1
ro
1 m i8 s I I1 * i i 11
#&■
■
cn
CD
o
J
ro
•$>
o>
(D
oro
OO
Oo
Oo
o
vJ ^MINIMUM/
\
> 7
V. V'
B o
MAXIMUM

sediment on their flood plains, and when the sea
again encroached on the land the stream-deposited
sediments became buried beneath and mixed with
new accumulations on the sea floor. Thus the compo
sition and distribution of the rock units that underlie
the Greenville area are the end result of all the geo
logic processes to which the area has been subjected
since the beginning of time.
The stratified rocks have been subdivided into for
mations, or other units, that can be identified from
their position in the sequence of sediments, their lith-
ic composition, and their contained fossils; each strat-
igraphic unit consists of deposits laid down during a
unit of geologic time. The planes separating strati-
graphic units from each other are referred to as con
tacts. If there was no significant lapse of time be
tween the deposition of two units, their contact with
each other is said to be conformable; if there was a
significant lapse of time, their plane of contact is
said to represent an unconformity. An unconformity
represents a period of either erosion or nondeposition
and in profile view generally is an undulating line.
If the bedding in a stratigraphic unit above an un
conformity is parallel to that in the unit below, the
contact is termed a disconformity, whereas if the
bedding in the two units is not parallel, the contact
is termed a nonconformity. That each type of for-
mational contact is present in the Greenville area
will be shown in the discussion that follows.
The geologic history of the Greenville area, prior
to the deposition of the sediments, is largely .un
known. The basement rocks, presumed to be of Pre-
cambrian or early Paleozoic age and to be analogous
to similar types of rock in the Piedmont province to
the west, underlie the sedimentary units and slope
toward the southeast. That the slope increases be
yond a point near the present coast and that the base
ment floor is very uneven are inferred from geo
physical data in the Greenville area and from the
logs of wells in the area that have fully penetrated
the sedimentary cover. Further evidence of the un
even nature of the basement floor is the presence of a
granite monadnock surrounded by more than 400
feet of sediments at Fountain in Pitt County (Mun-
dorff, 1947, p. 103). Well cuttings, representative of
the basement floor beneath the sediments, generally
consist of weathered granite, gneiss, schist, and
slate.
Unconformably overlying the basement rocks are
sediments of both Early Cretaceous and Late Creta
ceous age. The presence of Lower Cretaceous sedi
ments in the Greenville area was established only
recently by examination of cuttings from a deep-well
at Greenville in Pitt County. The extent of these
Lower Cretaceous sediments is unknown; they are
confined to the subsurface and may extend over a
broad area. Unconformably overlying the basement
rocks in parts of the Greenville area are sediments of
Late Cretaceous age. the Tuscaloosa formation.
Unconformably overlying the Tuscaloosa forma
tion are strata that compose the Black Creek forma
tion. The unconformity separating the two forma
tions may be observed along Contentnea Creek in
Greene County and along the Tar River in Pitt Coun
ty. The Black Creek formation, consisting of an
unnamed lower member and an upper member (the
Snow Hill marl) is overlain by the Peedee forma
tion, which is the youngest Cretaceous formation in
the Greenville area. The Peedee formation is con
formable with the upper member of the Black Creek
formation in some parts of the area; where the upper
member is absent the Peedee lies unconformably on
the lower member of the Black Creek formation.
At the close of ihe Cretaceous period a partial
withdrawal of the sea toward the southeast was fol
lowed by extensive erosion of the exposed land sur
face. During the Paleocene epoch which followed,
the sea again encroached upon the land and deposited
sediments, which in this report are named and de
fined (p. 26) as the Beaufort formation. The Beau
fort formation lies unconformably on the Peedee for
mation and exhibits a pseudo-offlap relationship to
that formation. The Paleocene sediments have riot
been recognized at the surface, but are widesptfeacl
in the subsurface.
The withdrawal of the Paleocene sea was followed
again by an extensive period of erosion prior to de
position of the Casde Hayne limestone, a limestone
that includes both middle and upper Eocene sedi
ments (LeGrand and Brown, 1955, p. 9). The Castle
Hayne limestone lies unconformably on rocks of both
Cretaceous and Paleocene age in the Greenville area.
After deposition of the Castle Hayne limestone the
sea again withdrew from the area and was absent
during all of Oligocsne and early Miocene time. Iso
lated remnants of the Castle Hayne limestone that
occur at a distance of 50 or 60 miles inland from the
main body attest to the great quantity of limestone
that was removed from the exposed surface during
this period.
Later in Miocene time the sea again encroached
upon the land, and phosphorites, referred to in this
report as middle (?) Miocene in age, were deposited
in a shallow, partially restricted, marine basin. The
phosphorites are largely confined to Beaufort Coun-

00
Table 1. Geologic units and their water-bearing characteristics in the Greenville area.
System
1Quaternary
1Tertiary
Scries
Pleistocene
and
Recent
Miocene
Eocene
Paleocene
Middle(?)
Upper
Middle
and
late
Indicated
correlation
Rocks
of
Calvert(?)
age
Rocks
of
Claiborneand
Jackson
age
Rocks
of
Midway
age
FormationsandmembersSurficialdeposits Yorktownformation Sandandsandysilt CastleHaynelimestone Beaufortformation
Light-coloredsandyshellbeds andmarlsinupperpart.Lower partconsistsofblue-graymarls shellbedsandmassiveinterbedded marineclays.Browntochocolate-coloredphos- phaticsundsandsandysiltscon tainingcollophaneandquartzwith shell-limestoneintercalations. Whitetograysandandmarl fuciespredominant.Sandycalcitic anddolomiticshelllimestones prominent.Glauconite,pyrite,and phosphateoccurasprominentac cessories. Variableincomposition,rang ingfromgreenglauconitesands containing±90percentglauco nitetograyargillaceoussands containing±5percentglauconite. Induratedshell-limestoneintercal ationscommon.Euhedralpyriteoc cursasacommonaccessory.
trolled
largely
bypHof
the
basin
waters.
Marine—shallow,open-waterde position.Remainsofsedentary marineorganismspredominatelo cally.Marine—depositioninamoder atelydeepbasineharacterisiedl»y bottomconditionsthatwereoxi dizing.Pyriteisauthigenic.face.Extensivesubsurfacedistri
butioninUeaufort,Gates,Martin. Bertie.Hertford,andChowan Counties.Limiteddistributionin easternPittCounty.Thickness generallyrangesfromseveralfeet to400feet.

Pedee formation
.6 *
1
Snow Hill marl member
Unnamed member
£ *'S'PSo1
Tuscaloosa formation
Sand and clay (subsurface only)
Dark-gray coarse-grained glau-
conite sands in upper part. Drab-black massive marine clays in lower part. Indurated shell bedsthroughout section.
Black to gray interbedded claysand marls. Marls are locally indurated to form impure shell-lime-
stoneu.
Gray to black micaceous sandsand clays, thinly bedded to mas
sive; variable amounts of lignite,marcasite, and glauconite. Cross-bedding prominent. Sand and claycomponents predominantly lenti
cular.
Tan, red, and gray arkosic sandsand interbedded clays. Hematiteis a common accessory mineral,
siderite being less common. Massive to lenticular aspect in allsections.
Green clay and tan sand. Micais a common accessory mineral.
Marine — shallow shelf-type deposition. Deltaic deposits that arenot fossiliferous are correlatedwith the Peedee formation inHertford and Bertie Counties.
Marine—shallow water deposition.
Near-shore marine and continental deposition. Origin is masked by transgressive and regressivemovements of the sea resulting inlittoral, sublittoral, and paludal deposition.
Marine and nonmarine origin.Marine facies indicate near-shoredeposition. Continental facies indicate deposition along the innermargins of bays and estuaries.Coarsely graded fossil stream deposits are common.
Marine — shallow-water deposi
tion.
Exposed along major streamsin Pitt and Greene Counties. Extensive subsurface distributionthroughout the Greenville area.Thickness ranges from 300 to 500feet or more.
Exposed along major streams inparts of Pitt and Greene Counties.In- the minsurface not adequatelydelimited from the unnamed mem
ber of the Black Creek formation.
Exposed along major streams inparts of Pitt and Greene Counties.Subsurface distribution widespread
throughout the Greenville area.Thickness ranges from 300 to 400
feet or more.
Exposed along major streams inPitt, Greene, and Bertie Counties.Lies unconformably on crystallinerocks in the western part of theGreenville area. Subsurface distribution widespread. Thickens progressively coastward.
According to present informa
tion the formation has limited sub
surface occurrence in Pitt andMartin Counties but may extendover broad areas throughout subsurface of the Greenville area.
Sand beds in the formation arevery good aquifers and supply water for municipal, industrial, domestic, and farm use. Water, gen
erally of good quality, may be
moderately hard at shallow depths.
Marls and indurated shell bedssupply fair to moderate amountsof water to domcHtic and farmwells.
Sand beds in the formation yieldlarge supplies to industrial, municipal, domestic, and farm wells inGreene, Pitt, Martin, Hertford,and Bertie Counties. Contains sa
line waters in Gates, Chowan, andBeaufort Counties.
A very good aquifer; supplieslarge amounts of water to industrial and municipal wells in Pitt,
Greene, Martin, Bertie, and Hertford Counties. Probably containssaline waters in Gates, Chowan,and Beaufort Counties. Water isgenerally of good quality.
Contains saline waters in cen
tral Pitt County. May containpotable waters in the western
parts of Pitt and Martin Counties.
ty where they lie unconformably on the Castle Hayne
limestone.
Lying unconformably above the phosphorites are
sediments of late Miocene age, the Yorktown forma
tion, which were deposited in a transgressive sea
that extended to cover crystalline rocks west of the
Greenville area. No sediments of Pliocene age were
recognized in the area of investigation.
Unconformably overlying the Yorktown formation
are thin deposits of Quaternary age. These deposits
may correspond in part to the so-called marine ter
race deposits of Pleistocene age and in part, may
represent fluviatile deposits.
The sequence of events which took place during
the deposition of the sedimentary rocks in the Green
ville area, and which have been only briefly outlined
in this section of the report, is not evident in every
part of the area. As shown in the majority of the
well sections included with the county descriptions,
one or more of the stratigraphic units in the deposi-
tional sequence are missing.
GEOLOGIC FORMATIONS IN THE
GREENVILLE AREA
Cretaceous System
Lower Cretaceous Series
Unnamed Unit
The presence of sediments of Early Cretaceous age
was recently established in a well at Greenville, Pitt
County. On the basis of a well-preserved ostracode
fauna the sediments were determined to be roughly
equivalent to sediments of Trinity age and older as
recognized in the Gulf Coast Province.
The sediments consist principally of chocolate-
colored argillaceous quartz sand and green calcareous
clay. Common accessory minerals include hematite
and mica, siderite and pyrite occurring less common
ly. Data are insufficient to determine the strike or
dip of this unit, but the faunal evidence indicates
that the unit, though roughly contemporaneous with
Lower Cretaceous sediments in several of the deeper
oil tests to the southeast of the Greenville area, is
not a traceable updip extension of those Lower Creta
ceous sediments.
Upper Cretaceous series
Tuscaloosa formation
The name Tuscaloosa was proposed by Smith and
Johnson (1887, p. 95-116) for sediments of Creta
ceous age exposed at Tuscaloosa, Tuscaloosa County,
Ala. The name Tuscaloosa was applied first to Creta-
10
ceous equivalents in North Carolina by Cooke (1936,
p. 19).
The Tuscaloosa formation in the Greenville area is
variable lithologically, but over large areas it is com
posed predominantly of interbedded lenses of pink
ish to drab-gray micaceous sand and clay. Coarse to
medium-grained sand and gravel occur at all horizons
but are generally more prevalent below the upper
most 150 feet of the formation at any one locality.
The uppermost 150 feet of the formation invariably
is composed of layers of compact lenticular clay.
The Tuscaloosa formation in outcrop is confined to
narrow bands along several of the major streams in
Greene, Pitt, and Bertie Counties. Outcropping sec
tions of the formation can be observed in Greene
County along Contentnea Creek from a point above
Contentnea to the Greene-Wilson County line, in Pitt
County along the Tar River above Bruce, and in Ber
tie County along the Roanoke River above Lewiston.
The strike of the formation is northeast and
roughly parallel to the outcrop belt. The dip of the
formation cannot be accurately determined at the
surface. However, subsurface information indicates
a dip slightly greater than 20 feet per mile toward
the southeast.
In the western part of the Greenville area the
Tuscaloosa formation lies unconformably on crystal
line rocks of Precambrian or early Paleozoic age
and, at least in the vicinity of Greenville, on sedi
ments of Early Cretaceous age.
In the Greenville area the formation contained no
fossils and correlation is based on lithology and strat
igraphic position.
Black Creek formation
The Black Creek formation consists of a lower un
named member and an upper member, the Snow. Hill
marl. The term Black Creek was used by Sloan .
(1907, p. 12, 13, 14) for typical exposures of black
laminated sand and clay along Black Creek in Dar
lington and Florence Counties, S. C. Stephenson
(1923, p. 10) proposed the name Snow Hill marl
member for the upper 100 to 200 feet of' the forma
tion, which consists of calcareous layers and inter
bedded glauconitic and micaceous sand and clay. The
type locality for the Snow Hill marl is along Content
nea Creek near Snow Hill, Greene County, N. C. At
this locality the Snow Hill, marl member consists of
"drab-black arenaceous and micaceous clays contain
ing an abundant but fragile assemblage of mega-
fossils" (LeGrand and Brown, 1955, p. 24).
The Black Creek formation is exposed along,
streams in the northern part of Greene and Pitt Coun-

ties, particularly along Contentnea Creek, Little Con-
tentnea Creek, and the Tar River. North and east of
Pitt County the formation has been recognized only
in the subsurface. The formation strikes north-north
east in the outcrop area, whereas subsurface infor
mation from Martin, Bertie, and Hertford Counties
indicates that the strike of the formation is east-
northeast in that area.
The dip of the formation cannot be determined
with any degree of accuracy, because of the flat-lying
nature of the beds, the lenticular and thinly-lami
nated nature of the sediments, and the lack of topo
graphic expression in the outcrop area. Subsurface
formational contacts in water wells establish an av
erage dip of about 15 feet per mile for the formation
in Pitt and Greene Counties. When a dip of 15 feet
per mile is transposed to the outcrop areas the thick
ness of the formation exposed along the Tar River
is about 150 feet, the thickness along Little Content
nea Creek about 75 feet, and the thickness along Con
tentnea Creek about 135 feet. The fossiliferous Snow
Hill marl member is exposed for a distance of about
2 miles, normal to the strike, in the Snow Hill area.
The Snow Hill member, therefore, is about 30 feet
thick in the type area.
The Black Creek formation lies unconformably on
the Tuscaloosa formation, exhibiting a transgres-
sive offlap relationship to that formation.
According to Stephenson (1923, p. 10) "Paleonto-
logically the Snow Hill marl member belongs to the
upper part of the zone of Exogyra ponderosa of the
Atlantic and Gulf Coastal Plain". The indicated cor
relation, therefore, is with the Taylor group of the
Gulf Coastal Plain and with the Matawan group (or
formation) of the Atlantic Coastal Plain (Stephen-
son, 1923, pi. VIII). No faunal evidence for the age
of the lower unnamed member of the Black Creek
has been recognized in outcropping sections in the
Greenville area. However, subsurface evidence based
on Ostracoda and Foraminifera indicates that the
lower member is pre-Taylor in age and should be
correlated with Austin equivalents of the Gulf Coast
al Plain and with the Magothy formation of the At
lantic Coastal Plain.
The paleontologic hiatus between the upper and
lower members of the formation is not sharp in sub
surface sections and is characterized mainly by the
relative abundance of diagnostic species in the upper
member in contrast with their scarcity in the lower
member.
The following ostracodes have been identified in
samples of the Black Creek formation from water
wells in the Greenville area:
Brachycythere ledaforma (Israelsky)
Brachycythere sphe?wides (Reuss)
Brachycythere nausiformis Swain
Cytheridea (Haplocytheridea) monmouthensisBerry
Cytherella bullata Alexander
Cytheropteron (Eocytheropteron) striatum
Brown
Cythencra glossensis Brown
Orthonotacythere sulcata Brown
Orthonotacythere hannai (Israelsky)
Orthonotacythere tarensis Brown
Protocythere paratriplicata Swain
Trachyleberis gapensis (Alexander)
Pedee formation
The name Peedee was proposed by Ruffin (1843, p.
6-7) for a sedimentary unit of Cretaceous age in
Florence and Horry Counties, South Carolina. Ste
phenson (in Clark and others, 1912, p. 45) used the
name Peedee for equivalent sediments in North
Carolina that he previously (1907, p. 93-99) had re
ferred to the Ripley formation.
In the Greenville area the Peedee formation, at the
surface, is confined to small segments of Greene and
Pitt Counties, where it is characteristically exposed
along some of the streams, especially along Content
nea and Little Contentnea Creeks. To the north and
east of Pitt County the formation is transgressively
overlapped by younger sediments and is known to
extend in the subsurface to the North Carolina-Vir
ginia State line (LeGrand and Brown, 1955, fig. 2).
The lithologic character of the Peedee formation
is not uniform either laterally or vertically through
out the Greenville area. In the upper part, green to
light-gray glauconitic sands predominate, with minor
occurrences of gray interbedded and lenticular mica
ceous clays, whereas in the lower part of the forma
tion black massive marine clays predominate, with
minor occurrences of glauconitic sands. Coarse to
medium-grained calcareous and indurated sands, to
gether with indurated shell beds, occur at all horizons
within the formation, but owing to their lenticular
nature they cannot be traced or assigned to any
particular horizon over large areas.
The strike of the Peedee formation is in a general
northeast direction. The dip of the formation, like
that of the underlying Black Creek formation, is dif
ficult to determine at surface exposures. However,
subsurface formational contacts in water wells indi
cate that the Peedee formation in Greene and Pitt
Counties slopes toward the coast at a rate of about
15 feet per mile. This dip when transposed to the
outcrop area indicates that the formation, as exposed
11

along Contentnea Creek, is about 130 feet thick, and
as exposed along Little Contentnea Creek, slightly
in excess of 100 feet thick. Southeast of Greene and
Pitt Counties, toward the coast, the formation thick
ens considerably; more than 500 feet of the forma
tion was recognized in a well at Richlands, Onslow
County.
The Peedee formation throughout much of the
Greenville area lies conformably on the upper Snow
Hill marl member of the Black Creek formation or,
where that unit is absent, unconformably on the
lower unnamed member of the Black Creek forma
tion. In parts of Bertie, Hertford, and Gates Coun
ties there is some evidence, as inferred from lithol-
ogy and stratigraphic position, that nonfossiliferous
material of deltaic origin may be contemporaneous
with definitely recognizable sediments of the Peedee
that lie downdip and to the east (LeGrand and
Brown, 1955, fig. 2). These deltaic sediments lie un
conformably on the Tuscaloosa formation. Uncon
formably overlying the Peedee formation are sedi
ments of Tertiary age. Subsurface contacts estab
lished from well cuttings have shown the formation
to be overlain by transgressive deposits of Paleo-
cene, middle and late Eocene, and late Miocene age.
The contact relationships of the Peedee formation
with these younger Tertiary units are discussed in
the sections dealing with the geology of the individ
ual counties.
Stephenson (1943, p. 13) states that "Paleonto-
logically the Peedee formation falls within the zone of
Exogyra costata of the Atlantic Coastal Plain, though
probably the uppermost part of the zone is not repre
sented. Approximately the lower half of the forma
tion is embraced within the Exogyra cancellata sub-
zone." Stephenson (1923, p. 48-58) discusses in de
tail the correlation of the Peedee formation, which
is equivalent in part to the Navarro group of the
Gulf Coastal Province and in part to the Monmouth
group of the Atlantic Coastal Province. Recent
studies by Brown (1957, p. 1-24) of the Ostracoda in
the Peedee formation substantiate Stephenson's cor
relation.
The following ostracodes have been identified in
well cuttings from the Peedee formation in the
Greenville area:
Alatacythere alqta atlantica (Schmidt)
Bairdia pittensis Brown
Bairdoppilata pondera Jennings
Bairdoppilata postextensa (Swain)
Brachycythere raleighensis Brown
Brachycythere ledaforma (Israelskyj
12
Brachycythere rhomboidalis (Berry)
Brachycythere plena Alexander
Cytheridea (Haplocytheridea) monmouthensis
Berry
Cytheridea (Haplocytheridea) ulrichi (Berry)
Cytheridea (Haplocytheridea) fabaformis
(Berry)Cytheridea (Haplocytheridea) councilli Brown
Cytheridea (Haplocytheridea) plummeri
Alexander
Cytheridea (Haplocytheridea) wilmingtonensis
Brown
Cytherella tuberculifera Alexander
Cytherella herricki Brown
Cytherelloidea sicaini Brown
Cytherelloidea sohni Brown
Cytherelloidea inflata Brown
Cythentra glossensis Brown
Eucytherura curia (Jennings)
Loxoconcha neusensis Brown
Loxoconcha sera/phae Brown
Monoceratvrua biloba Schmidt
Orthonotacythere hannai (Israelsky)
Platycythereis costatana angula (Schmidt)
Trachyleberis bassleri (Ulrich)
Trachyleberis communis (Israelsky)
Trachyleberis gapensis (Alexander)
Trachyleberis pidgeoni (Berry)
Velarocythere arachoides (Berry)
Velarocythere cacumenata Brown
Velarocythere eikonata Brown
Velarocythere scuffeltonensis Brown
Tertiary System
Paleocene series
Beaufort formation
The existence of strata of Paleocene age in the
North Carolina Coastal Plain was first postulated by"
Spangler (1950,,p. 131), who stated that "Tentative
ly faunas from the Eocene beds in Hatteras Light
No. 1 (well) have been identified as indicating Mid
way, Wilcox, Claiborne, and Jackson ages." Presum
ably, Spangler based his statement on examinations
of the Foraminifera. McLean (1951, p. 22) stated
that "Two wells were drilled in the Washington,
North Carolina area, both of which contain a definite
Paleocene fauna." McLean's statement was based on
an examination of the Foraminifera. Swain (1952,
p. 5) states, concerning well samples from North
Carolina tentatively identified as representing Paleo
cene strata, that "The assignment to the Paleo
cene (?) is based on lithologic similarity to the Clay
ton formation of Georgia (Cooke, 1943, p. 39-47)
f

and not on paleontologic evidence." The writer
(Brown, 1958, p. 6), in describing well samples- from
the North Carolina Coastal Plain, called attention to
the existence of Paleocene strata and stated: "Strata
of Paleocene and early Eocene age, not known to oc
cur in surface exposures, can be differentiated both
faunally and lithologically in the subsurface." In
Brown's report lithologic intervals were described
and Ostracoda were listed from many water wells.
Correlation with the Midway group (Paleocene) was
based on the Ostracoda. J •
The name Beaufort formation is here proposjed for
sediments of Paleocene age that occur in the (jJreen-
ville area. The name is derived from Beaufort iCoun-
ty, where extensive deposits of Paleocene age; occur
in the subsurface. The formation has been i*ecog-
nized also in wells in Martin, Bertie, Hertford, Gates,
and Chowan Counties. The formation has not been
recognized at the surface; therefore, the selected
type locality is a well 215 feet deep, drilled in 1952
for the Nelson Motel at Chocowinity, Beaufort Coun
ty, North Carolina. The land-surface elevation of
the well is 44 feet above sea level, and the well pene
trated 65 feet of Paleocene strata between the depths
of 150 and 215 feet. The type lithology for the Beau
fort formation is designated as that described by the
writer (1958, p. 7) for the aforementioned well be
tween the depths of 150 and 215 feet (p. 7). Ostra
coda identified by the writer from the type section
are as follows:
Bairdia magna Alexander
Brachycythere interrasilis Alexander
Brachycythere plena Alexander
Brachycythere verrucosa Harris and Jobe
Trachyleberis midioayensis (Alexander)
Trachyleberis prestiuichiana
(Jones and Sherborn)
Trachyleberis bassleri (Ulrich)
Trachyleberis spiniferrima (Jones and Sherborn)
Cytheridea (Haplocytheridea) ruginosa
Alexander
Cytheromorpha scrobiculata Alexander
Loxoconcha comtgata Alexander
Orthonotacythere cristata Alexander
Mr. Richard Page of the U. S. National Museum
kindly identified the following Foraminifera from
the 150-215-foot interval of the type well:
Spiroplectammina wilcoxensis
Cushman and Ponton
Robuhcs midioayensis (Plummer)
Dentalina virginiana Cushman
Dentalina wilcoxensis Cushman
Dentalina naheolensis Cushman and Todd
Dentalina pseudo-obliquestriata (Plummer)
Citharina q)lum7noides (Plummer)
Nodosaria affinis Reuss
Vaginulina gracilis Plummer
Rectoglandulina tenuistriata (Franke)
Siphogenennoides elongata (Plummer)
Bulimina virginiana Cushman
Bulimina cacumenata Cushman and Parker
Pseudovalvidineria midtvayensis (Plummer)
Pseudovalvulineria umbonifera (Schwager)
Eponides lotus (Schwager)
Gyroidinoides octocavierata
(Cushman and Hanna)
Alabamina midwayensis Brotzen
Globigerina triloculinoides Plummer
Globigerina compressa Plummer
Globigerina pseudobbidloides Plummer
Globigerinoides daubjergensis (Broniman)
Anomalinoides vvlgaris (Plummer)
Anomalinoides wnbonata (Cushman)
Cibicides irenae Van Bellen
Eocene series
Castle Hayne limestone
The name Castle Hayne limestone was proposed
by Miller (Clark, and others, 1912, p. 185) for de
posits of late Eocene age typically exposed near the
town of Castle Hayne, New Hanover County, North
Carolina.
Surface exposures of this limestone unit in the
Greenville area are limited to the southeastern part
of Pitt County. The surface exposures are generally
characterized by light-colored, iron-stained shell-
limestones or cream to green-colored calcareous
sands and clays reflecting different degrees of de
composition and induration. The limestone unit has
a widespread occurrence in the subsurface in the
Greenville area, especially in Beaufort and Martin
Counties. Typical subsurface sections have a lith
ology as follows: gray to white shell-limestones and
dolomitic shell-limestones interbedded with and un
derlain by fine to medium-grained calcareous sands
and clays.
The thickness of the formation as determined from
the examination of well cuttings ranges from about
20 feet to as much as several hundred feet, the thick
est sections of the formation occurring in wells in
eastern Beaufort County. In the Greenville area the
formation strikes east-northeast and dips toward the
coast at the rate of 10 to 30 feet per mile, the dip
progressively increasing in a southeast direction.
Cooke (1916), Canu and Bassler (1920), Kellum
13

(1926), and Richards (1950) have cited evidence sub
stantiating the late Eocene age of the.Castle Hayne
limestone. Cooke and MacNeil (1952, p. 25), follow
ing a study of Tertiary deposits in South Carolina
restricted the Castle Hayne limestone to the middle
Eocene. LeGrand and Brown (1955, p. 9) and
Brown (1958, p. 7) recognize both upper and middle
Eocene biofacies in the Castle Hayne limestone and
consider the formation in North Carolina to have
been deposited during both middle and late Eocene
time.
The Castle Hayne limestone throughout much of
the Greenville area lies unconformably on the Beau
fort formation of Paleocene age or, where that unit
is absent, unconformably on the Peedee formation
of late Cretaceous age.
The Castle Hayne limestone as it occurs in the sub
surface throughout the Greenville area is predomi
nantly of middle Eocene age, and correlation, based
on Ostracoda and Foraminifera, shows it to be gen
erally equivalent to sediments of middle Eocene age
in the Gulf Coast Province. No attempt was made to
correlate the Castle Hayne limestone with recognized
Eocene sediments north of North Carolina.
The following ostracodes have been identified in
well samples from the Castle Hayne limestone in the
Greenville area:
Pdracypris franquesi Howe and Chambers
Cytheridea (H.) montgomeryensis
Howe and Chambers
Cytheridea (C.) virginica (Schmidt)
Cytheridea (C.) caldwellensis
Howe and Chambers
Paracytheridea belhavenensis
Howe and Chambers
Cytherura %oashburni Stephenson
Brachycythere toatervalleyensis
Howe and Chambers
Brachycythere martini Murray and Hussey
Brachycythere bernardi Murray and Hussey
Alatacythere ivani Howe
Trachyleberis rukasi (Gooch)
Trachyleberis montgomeryensis
(Howe and Chambers)
Trachyleberis broussardi (Howe and Chambers)
Trachyleberis pellucinoda (Swain)
Trachyleberis bassleri (Ulrich)
Pterygocythereis luashingtonensis Swain
Actinocythereis davidiuhitei (Stadnichenko)
Actinocythereis stenzeli (Stephenson)
Actinocythereis hilgardi (Howe and Garrett)
Loxoconcha creolensis Howe and Chambers
Loxoconcha jacksonensis Howe and Chambers
14
Loxoconcha claibornensis Murray
Cytheromorpha eocenica Stephenson
Cytheretta alexanderi Howe and Chambers
Monoceratina alexanden Howe and Chambers
Buntonia howei (Stephenson)
Miocene series
Middle (?) Miocene deposits
Phosphorite deposits that contain substantial
amounts of the mineral collophane (probably carbo-
nate-fluorapatite) occur mainly in eastern and cen
tral Beaufort County with minor occurrence in Gates
and Chowan County. In Beaufort County the depos
its lie unconformably on the Castle Hayne limestone,
and are unconformably overlain by late Miocene
marl. Questionable designation of the phosphorites
as middle Miocene is based on the identification of
foraminifers that occur in the top few feet of the
material as encountered in water wells. The follow
ing list is reproduced from a paper by the writer
(Brown, 1958, p. 90).
Siphogenerina lamellaia Cushman
Siphogenerina spinosa Bagg
Cibicides concentricu-s (Cushman)
Discorbis cavernata Dorsey
Nonion pizzarense W. Berry
Nonion grateloupi (d'Orbigny)
Cassidulina crassa d'Orbigny
TJvigerina kernensis Barbat and von Estoroff
Bolivina, calvertensis Cushman
Ellipsonodosaria calvertensis Cushman
The phosphorite section consists of layers of phos-
phatic sand and thin intercalated shell-limestone. The
overall section ranges from several feet to more.than
90 feet in thickness. Average thickness, throughout _
an area approximating 450 square miles, is estimated
to be 30 feet.
The lithology of the phosphorites is surprisingly
consistent over long distances. The deposits consist
of a variable mixture of quartz sand and collophane.
The collophane occurs in the form of brown spherules
showing oolitic or banded structure; less commonly
the collophane occurs as shards.
Evaluation of available subsurface data suggest
that the phosphatic sands do not represent a facies
that grades laterally into adjacent material of com
parable age. The origin of the deposits (Brown, 1958,
p. 96) is attributed to chemical precipitation and
in situ replacement in a restricted basin, where the
pH of the basin's waters acted as the controlling de-
positional factor.

Yorktown formation
The name Yorktown was first used irnNorth Caro
lina for deposits of late Miocene age by Miller (Clark,
and others, 1912, p. 229). Miller stated that "The
formation with few changes does extend from; Vir
ginia southward into the State of North Carolina."
Gardner (1943) defined certain faunal zones in the
Yorktown formation as it occurred north or the
Neuse River in North Carolina. These zones .form
the basis for the correlation of late Miocene deposits
in the Greenville area.
The lithology of the formation in the Greenville
area consists chiefly of gray-colored shell marls, in
durated or unconsolidated shell beds, and massive
marine clays with interbedded sands. The predomi
nant lenticular character of the strata in any given
locality obviates the possibility of uniform hydrologic
characteristics even in small localized areas.
The formation strikes northeast and dips toward
the southeast. The dip is generally less than 15 feet
per mile in the outcrop area and rarely more than 25
feet per mile in the subsurface. At the surface the
exposed thickness of the formation, as observed by
the writer at any one place, is everywhere less.than
60 feet. In Greene, Pitt, Hertford, and Martin Coun
ties the subsurface, thickness rarely exceeds 90 feet,
although to the east in Beaufort, Bertie, Gates,
Chowan, and Martin Counties the formation mdy in
crease in thickness to as much as 250 feet. At Eden-
ton, Chowan County, the Yorktown formation, as
shown by examination of well cuttings, attains a
thickness of 195 feet and lies unconformably on
phosphatic sands of middle (?) Miocene age.
From east to west, the Yorktown formation over
laps and lies unconformably on successively older de
posits of the Coastal Plain sequence. Some previous
evidence indicates that the Yorktown formation as
herein defined includes strata at its base that is
equivalent to the St. Marys formation of middle Mio
cene age (Gardner, 1943, p. 11). This evidence is not
substantiated by current studies of the microfaunal
assembleges.
Deposits in the southern part of the State (south
of the Neuse River and outside of the Greenville
area) have been referred to the Duplin marl, which
is considered to be equivalent to the uppermost
Yorktown as it occurs'north of the Neuse River
(Gardner, 1943, p. 2). Edwards (1944, p. 505-528)
has described many species of Ostracodes from the
Duplin marl, nearly all of which have been recog
nized by the writer in Yorktown material north of
the Neuse River. In addition, Mansfield (1936, p.
173) has shown that stratigraphically the Yorktown,
in part, is equivalent to the Cancellaria zone of the
Choctawhatchee formation of former usage in
Florida.
The following ostracodes have been identified in
well cuttings from the Yorktown formation in the
Greenville area:
Cytheridea (H.) probocsidiala Edwards
Paracytheridea vandenboldi Puri
ParacytheHdea cf. P. xoetherelli (Jones)
Cytherura elongata Edwards
Cytheropteron subreticulatum van den Bold
Leguminocythereis whitei Swain
Puriana rugipunctata (Ulrich and Bassler)
Actinocythereis exanthemata
(Ulrich and Bassler)
Actinocythereis mundorffi (Swain)
Echinocythereis evax (Ulrich and Bassler)
Echinocythereis garretti (Howe and McGuirt)
Echinocythereis planibasilis (Ulrich and Bassler)
Murrayina martini (Ulrich and Bassler)
Orionina vaughani (Ulrich and Bassler)
Hemicythere conradi Howe and McGuirt
Hemicythere confragosa Edwards
Hemicythere laevicula Edwards
Hemicythere schmidtae Malkin
Loxoconcha purisubrhomboidea Edwards
Loxoconcha reticularis Edwards
Cytheromorpha ivameri Howe and Spurgeon
Cytheretta reticulata Edwards
Basslerites giganticus Edwards
Cushmanidea ashermani (Ulrich and Bassler)
Quaternary system
Pleistocene and Recent Series
Surficial sands
Quaternary deposits include those underlying the
three lowermost Pleistocene terraces designated by
Stephenson (Clark and others, 1912, p. 27) as the
Wicomico, Chowan, and Pamlico terraces of the
Columbia group. In the Greenville area there is no
lithologic or faunal control that will permit the
separation into individual units of that material
which is younger than late Miocene, the Yorktown
formation.
This undifferentiated material consists of sand,
sandy clay, clay, and scattered gravel units that show
little evidence of stratification other than local cross-
bedding. The thickness of the materialranges from
a few feet to as much as 60 feet with no definite
thickness trend in any one compass direction. Dep
osition of the material as a thin, discontinuous,
blanketing layer precludes the determination of a
local or regional strike.
15

Inasmuch as the origin, definition, and delineation
of the terrace deposits throughout the Atlantic Coast
al states have been the subject of continuous contro
versy, it is not advisable to attempt any correlation
between the Quaternary deposits in North Carolina
and similar deposits elsewhere without substantial
evidence. The absence of original lithologic contrast
between so-called terrace formations, coupled with
the changes effected by subaerial erosion would make
any attempted correlation discretionary and of limit
ed value.
Some of the material of Quaternary age in North
Carolina probably is analogous to material included
in the Pleistocene marine terraces elsewhere, al
though in the Greenville area the great bulk of the
material represents nonmarine fluviatile deposition.
GROUND-WATER HYDROLOGY
Hydrologic Cycle
The earth has a fixed supply of water that is kept
in unending circulation between the earth and the
atmosphere; the energy for this circulation is sup
plied by the sun. The continuous circulation of wa
ter in its various forms has been termed the hydro-
logic cycle, and the study of the many complex and
interrelated phases of the hydrologic cycle is the
science of hydrology.
Oceans are by far the largest storage components
of this circulatory water system, lesser amounts of
water occurring in the atmosphere, on the land sur
face, and beneath the land surface. Climatic forces,
oceans, and landforms exert modifying influences on
the hydrologic cycle. This report describes some of
the modifying physical and geologic influences that
govern the amount, availability, and quality of wa
ter in that limited part of the circulatory system
which occurs beneath the land surface in the Green
ville area.
Source of Ground Water
Ground water, the water occurring beneath the
land surface in the zone of saturation, is usable only
when it is brought to the surface by natural or arti
ficial means. Ground water in the area of investiga
tion is derived from precipitation, either rain or
snow, that infiltrates the soil cover and percolates
downward to the zone of saturation. The proportion
of precipitation that reaches the zone of saturation
is controlled, in part, by the topographic relief of the
land surface, and by the permeability of the soil
cover above the zone of saturation. Soil cover
throughout the Greenville area has about the same
16
average permeability; topographic relief in the area
ranges from 130 feet to sea level.
Occurrence of Ground Water
A rock formation that yields sufficient water to
serve as a source of supply for human consumption
is called an aquifer. The term aquifer is relative and
denotes no fixed volume of recoverable water. Thus
a rock formation of low yield may be considered an
aquifer in an area where other rock formations yield
even less. The same rock formation would not neces
sarily be considered an aquifer if it occurred in an
area where other rocks had relatively high yields.
Basically, then, the designation of a rock formation
as an aquifer lies in its ability to store and transmit
usefull quantities of water, in relation to other rock
formations in its area of occurrence.
The quantity of water that may be safely with
drawn from any aquifer is dependent upon the trans-
missibility, the storage capacity, and the amount of
water available for recharge to the acquifer. If dis
charge of water from an aquifer exceeds recharge
to it over a period of time, the ground-water level
or piezometric surface of the aquifer declines.
The two major classes of aquifers are the water-
table aquifer and the artesian aquifer.
A water-table aquifer is a rock containing an un-
confined zone of saturation. The surface of the zone
of saturation is the water table. However, the water
table does not represent a flat table-like surface as
the name implies. If viewed in profile, its peaks and
troughs would represent a subdued likeness to the
overlying land configuration.
The water table is not static but fluctuates in re
sponse to changes in the ratio of recharge to and
discharge from the zone of saturation. Natural .for
ces causing fluctuations of the water table would in
clude variations in precipitation, transpiration, evap-""
oration, temperature, and atmospheric pressure.
Artificial forces that cause variations in the water
table would include withdrawal of water from the
ground-water reservoir either by pumping or by arti
ficial drainage through ditches and canals or other
man-made channels.
A zone of saturation in which water is confined
under pressure is termed an artesian aquifer. Wa
ter entering an artesian aquifer where it crops out
or is overlain by permeable material percolates down-
dip by gravity, eventually passing a line beyond
which the aquifer is filled to capacity and is both
overlain and underlain by relatively impermeable
beds. Because the weight of the water updip in an
artesian aquifer exerts pressure on the water down-

dip in the same aquifer, the hydrostatic pressure in
creases progressively in a downdip direction. Thus,
the water level in a well that taps an artesian aquifer
stands above the top of the aquifer and the weight
of the column of water in the well counterbalances
the hydrostatic pressure in the aquifer at the point
where entered by the well. The level at which the
water stands in the well coincides with an imaginary
surface known as the piezometric, or pressure, sur
face of the aquifer and if that surface is above the
land surface water will flow from the well. In the
Greenville area wells that will flow can be drilled
throughout most of the eastern third of Beaufort
County and elsewhere in the valleys of the major
streams and their principal tributaries.
Water-Bearing Properties of Rocks
In the zone of saturation all space not occupied by
solid material is occupied by water. The capacity of
a rock to store water is governed by its porosity,
which is the ratio of the volume of voids, or pore
spaces, to the volume of solid material. Porosity is
a function of the size, shape, assortment, and cemen
tation of the solid components of the rock.
The rate at which a rock will transmit water is
determined by its permeability and the hydraulic
gradient. Permeability is the rock's capacity for
transmitting fluids in response to variations in
hydrostatic pressure or gravity, and is measured
volumetrically as a function of time. In general, the
permeability of a rock is determined by the size and
shape of its pore spaces and the manner in which
they are connected. Porosity and permeability are
not necessarily proportional. A clay may have a high
porosity because of its large volume of pore space.
However, because the individual pore spaces are
small only a little water is transmitted under the
hydraulic gradients that exist in nature. Specific
yield, a function of both porosity and permeability,
is the difference between the total amount of water
in the voids of a saturated rock and the amount that
is retained by tht rock after it is drained by gravity.
Recharge and Discharge
Ground waters generally move at rates varying
from a few feet a day to a few feet a year as sug
gested by Meinzer (1949, p. 449). The movement of
ground water is along arcuate lines and results from
differences in head between any two points in the
direction of movement. In the Greenville area, un
der natural conditions, the watertable aquifer dis
charges water by effluent seepage into streams and
ponds laterally and into adjacent aquifers vertically.
Recharge to the water-table aquifer comes from pre
cipitation that infiltrates the zone of aeration and
reaches the zone of saturation.
Locally recharge may be effected by artifically in
duced infiltration of water from streams into an
aquifer. This reversal of the normal ground-water
gradient is brought about by creation, through
pumping, of a cone of depression in the water table
that intersects a surface stream and results in the
establishment of an artificial hydraulic gradient from
the stream to the aquifer.
An artesian aquifer is recharged by precipitation
in areas where permeable beds crop out at the sur
face or by leakage of water through overlying and
underlying confining beds in the subsurface. In the
southeastern section of the Greenville area, in Greene
and Pitt Counties, there are extensive areas where
the Cretaceous aquifers (Tuscaloosa, Black Creek,
and Peedee formations) are at the surface or at shal
low depths beneath a thin mantle of predominantly
sandy soil. Precipitation in this area is about 47
inches yearly.
In that part of the Greenville area lying north of
the Tar River, except near Lewiston and Bruce, geo
logic factors preclude the possibility of the artesian
aquifers being recharged by direct precipitation.
North of the Tar River, artesian aquifers of Creta
ceous, Paleocene, and Eocene age are buried beneath
Miocene strata at depths of from 25 to 200 feet. The
Miocene strata, consisting of nearly impermeable
sandy clays containing lenticular shell beds, are in
turn overlain by Quaternary strata, predominantly
sands and sandy clays. The artesian aquifers^arS
effectively sealed off insofar as direct recharge by
precipitation is concerned. Recharge to these artes
ian sand and limstone aquifers is believed to result
in part from upward leakage from the basal Creta
ceous beds and in part by downward leakage from
and through overlying Miocene and Quaternary beds.
The Tuscaloosa formation also crops out west of,
and updip from, the Greenville area. The formation,
composed of lenticular sands and clays, is an import
ant source of ground-water supply in its outcrop
area. Downdip, chemical analyses of water from
this aquifer and st&tigraphically higher aquifers in
dicate that the Tuscaloosa formation is an important
source of recharge to the overlying aquifers of the
Black Creek and Peedee formations. -
Water levels in strata of late Miocene and Quater
nary age are generally within a few feet of the sur
face throughout the Greenville area. The land sur
face is relatively fiat, resulting in a low hydraulic
17

gradient, and consequently the lateral movement of
water toward the streams, the natural discharge
points, is very slow. This material is saturated with
water at all times, but because of its low transmis-
sibility it is not generally tapped as an aquifer ex
cept locally where small to copious supplies of water
are obtained from lenticular sand or shell beds of
relatively high permeability. However, strata of low
permeability, particularly those in the Yorktown
formation, assume major hydrologic importance as a
source of recharge to the underlying sand and lime
stone aquifers of Cretaceous, Paleocene, and Eocene
age.
Recovery of Water
General Features
Ground water may be recovered from wells,
springs, or seeps. So far as the writer knows all
ground-water supplies in the Greenville area are ob
tained from wells. Wells can be most conveniently
classed according to their method of construction.
Such a classification would include dug wells, bored
wells, driven wells, and drilled wells.
Dug Wells
Dug wells are large-diameter holes that are deep
enough to intersect the water table. The dug well
is .excavated manually, and cribbing consisting of
wood, tile, brick, cement, or stone is placed to prevent
slumping of unstable material from the wells into
the hole. Curbing is installed at the top of the hole
to prevent the direct seepage into the well of surface
water or the entry of foreign matter that might
otherwise pollute the ground-water supply. Dug
wells in the Greenville area, usually 15 to 30 feet
deep, are generally constructed during the summer
and fall months when seasonal ground-water levels
are at their lowest point.
Bored Wells
Bored wells are excavated by means of hand or
power augers. The depth of such excavations is de
pendent upon the nature of the material penetrated
and upon the depth to the water table. The larger
holes are lined with tile or stone, whereas the smaller
holes are cased with a metal pipe that is perforated
opposite the water-bearing formation. Bored wells
are uncommon in the Greenville area, and few ex
ceed a depth of 45 feet.
Driven Wells
In constructing a driven well, a screened well point
attached to a length of pipe is driven into the ground
18
either manually or mechanically. Successive lengths
of pipe are attached as the driving continues until
the desired depth is reached. The wells range from
1 to 3 inches in diameter and few are more than 40
feet deep. These wells, commonly equipped with
pitcher pumps, are common in the Greenville area
and generally yield 2 to 30 gpm.
Drilled Wells
Drilled wells are of three main types as follows:
the jetted well, the cable-tool well, and the rotary
well. In all three types, penetration of the rock is
accomplished, in whole or in part, by the percussion
or rotary action of a drill bit against rock.
Jetted wells.—Jetted wells are constructed by
forcing water down a drill stem, out through a drill
bit, and back up the hole to the surface. In uncon-
solidated material, the force of the water as it passes
out of the bit loosens material which is then carried
by the water to the surface and deposited in a con
veniently located sump. In drilling through consoli
dated formations the bit is alternately raised and
dropped in the hole. The cutting action of the bit
augments the jetting action of the water and the
drill stem is "rocked" back and forth during the
drilling operation in order to insure a straight hole.
Casing is sunk around the drill stem as the hole be
comes progressively deeper, or it may be sunk in
one complete operation after drilling ceases.
Cable-tool wells.—In a well that is constructed by
the cable-tool method a bit and a string of tools at
tached to a cable is alternately raised and dropped
in the hole. The percussion action of the bit, moti
vated by a walking beam, causes the rock to be brok
en and crushed in the hole. When sufficient cuttings
have accumulated in the hole the tools are withdrawn
and cuttings are removed by a bailer or sand pump.
As drilling progresses casing is sunk until competent
rock is reached and caving is no longer a danger.
Rotary wells.—In a well that is constructed by the
rotary method a bit is attached to a length of drill
pipe which is then rotated in the hole. Drilling fluid
is pumped down the drill pipe, out through the bit
and up to the surface alongside the drill stem. The
drilling fluid brings the cuttings to the surface and
because it contains clay, also serves to seal the sides
of the hole and to prevent caving during drilling.
Casing may be sunk behind the bit as drilling pro
gresses or it may be installed in one complete opera
tion after drilling ceases.
A common type of rotary well in the Greenville
area is referred to as a "gravel-wall" well. This well

is a standard rotary hole of a diameter greater than
the desired diameter of the casing. Sized gravel is
forced or fed by gravity into the hole and forms
a gravel envelope around the casing. The advantage
of this method is that it minimizes some of the er
ror involved in placing the screens and in determin
ing the correct size of screen opening. Generally
speaking, however, a well with screens advantage
ously placed and of correct magnitude will yield as
much water as a gravel-wall well in the same loca
tion. However, owing to the thin, lenticular nature
of the sediments in the Greenville area, difficulty is
experienced in placing screens most advantageously,
and screened wells rarely yield as much water as
gravel-walled wells of comparable depth.
Hydrologic Principles Affecting Recovery
The natural level of water in a well, prior to pump
ing, is in equilibrium with the water level in the sur
rounding aquifer and is called the static water level.
When pumping commences, the water level in the
well drops, ceasing to be a static water level and be
coming a pumping water level. The distance between
the normal static water level and the pumping water
level, at any one time, is a measurable distance called
the drawdown. The lowering of water in the well
causes water to flow from the surrounding aquifer
into the well. This flow of water into the well causes
the ground-water levels in the aquifer to be drawn
down in the shape of an inverted cone whose apex is
at the wall. The cone is called the "cone of depres
sion" and the area within the perimeter of the cone
is termed the "area of influence". Both the extent
and the growth of the cone of depression and its cor
responding area of influence are directly proportional
to the amount of water being pumped from the well
and to the coefficient of transmissibility of the aqui
fer.
The capacity of a well may be defined as the
amount of water, measured in gallons per minute,
that a well will yield continuously over a period of
time. The specific capacity of a well is the amount
of water measured in gallons per minute per foot of
drawdown that a well will produce. A numerical
value for specific capacity is obtained by dividing
the yield by the drawdown at any given time.
Some of the features discussed for both water-
table and artesian aquifers are illustrated in figure 4.
QUALITY OF WATER
Information relative to the chemical quality of
ground waters is necessary in an appraisal of the
ground-water resources of the Greenville area. Such :
information will be a strong influencing factor in the
industrial development of the area, particularly in
regard to locating those industries that, because of
the nature of their processes, must be selective in
their choice of a water supply. The satisfactory and
economic treatment of domestic, municipal, and in
dustrial supplies for consumptive use also is depend
ent on a knowledge of the chemical quality of ground
waters. In addition, the chemical characteristics of
ground waters are a valuable aid in mapping sub
surface water-bearing formations.
The best results are achieved in a ground-water
appraisal when the recognized chemical characteris
tics of the ground waters are correlated with the
available geologic information in the area. Other
wise, the observed chemical characteristics of ground
waters have only local significance in application.
Mineral Composition of Ground Waters
The chemical quality of ground water is governed
by the amount and type of dissolved solids and
absorbed gases that it contains. Rain water absorbs
gases, mainly carbon dioxide and oxygen. Water
containing these gases becomes a strong weathering
agent capable of reacting with mineral compounds
found in the soil and rocks of the earth's crust. The
quantities of absorbed gases and dissolved solids
that occur in a ground water at any one time are
chiefly dependent upon such factors as the gases and
dissolved solids already in solution, the temperature
of the water, the hydrostatic and atmospheric pres
sures present in the system, the chemical composition
and physical nature of the host rock or rocks, and the
duration of the contact between the water and the
individual mineral grains in the host rock.
The salts of the common metals, which include
potassium, sodium, calcium, magnesium, and iron,
make up a large percentage of the dissolved solids in
ground waters. True salts are ionic in character;
that is they are composed of cations and anions.
Chemical analyses of ground water are a quantitative
measure of the individual cations and anions present
in the aqueous solution. The proportionate amounts
and chemical relationships of the anions and cations
present in the solution, in turn, determine such re
ported factors as hardness, specific conductance, and
hydrogen-ion concentration.
In this report the chemical analyses of ground
waters are expressed in parts per million (milligrams
per kilogram). To classify waters according to their
chemical character it is advisable to report the ionic
constituents in chemical equivalent quantities
19

too
3 a U
qa
n—
-*.
o
2.a
a3
3 O^-
•a
o <D
CO
3 > Q O CD I
a or
o .c a a.
WATER
TABLE
AQUIFER

(equivalents per million). Such expression, while
useful in comparing waters having wide ranges of
dissolved solids, is not readily applicable to use by
the layman, and is, therefore, omitted Ifrom this report.
The following discussion concerns the chemical
constituents of ground water in the Greenville area,
as commonly reported in water analyses, in relationto their occurrence.
Silica (SiO2).—Silica in ground water results fromthe weathering of silicate minerals that are abundant in nearly all rocks. It is generally believed that
silica in natural waters is in the colloidal state and,therefore, is not involved in the chemical equilibriumbetween acids and bases.
The concentration of silica in water samples fromthe Greenville area ranges from about 3 to 65 ppm.
Silica concentration was highest in water samples
from dolomitic limestone, and commonly was less
than 15 ppm from other water-bearing material.
Iron (Fe).—Iron compounds are common in nearlyall rocks and soils, and iron is readily taken into solu
tion by ground water, particularly by water that is
acidic. Water containing as much as 0.3. ppm of iron
is acceptable for most domestic uses, whereas mostindustrial uses require water that contains less than0.1 ppm. of iron. A common complaint in the Green
ville area is that well water stains fixtures and utensils yellow, brown, or red. This condition is due to the
presence of iron in the water when it came from the
well or the "pickup" of iron by corrosive "waterspassing through iron pipes in the water—distribution system. A water containing dissolved iron maylook perfectly clear when it comes from a well, but
upon exposure to air the salt is oxidized and ferric
hydroxide forms; the latter is responsible for thestaining condition. Ferric hydroxide can generallybe removed by attachng one of several commercialtypes of sand filters to the water system.
The occurrence of iron in the ground-watersamples from the Greenville area follows no generally predictable pattern, except that the amount ofiron present in waters from the surficial aquifers isgreater than that present in the deeper aquifers
and, therefore, is roughly proportionate to the acidityof ground waters in the area. In places in the Greenville area where shallow ground water contains objectionable amount of iron, water that is low in ironmay be obtained from deeper aquifers.
Calcium and magnesium (Ca and Mg).—Compounds of calcium and magnesium are common in
the sediments of the Greenville area. Ground water
circulating through the sediments dissolves calcium
from the limestones and calcareous sands and clays.
The calcium passes into solution as calcium bicarbo
nate which may be precipitated as calcium carbonate
and then may pass again into solution as calcium
bicarbonate. This reversible reaction is caused by
the changes in the carbon dioxide content of the wa
ter that result from changes in pressure and temper
ature within the aquifer. Ultimately, this contin
uing cycle would be expected to remove all the cal
cium from the sediments, final deposition occuring
in the ocean. Because magnesium is similar to cal
cium in chemical reaction insofar as most water
usage is concerned, the two ions generally are con
sidered together. The salts of calcium and magnes
ium account for most of the hardness of ground wa
ters and their effect is discussed in the paragraph
dealing with hardness.
Sodium and potassium (Na and K).—Compounds
containing sodium and potassium are present in near
ly all types of soil and rock. In the Greenville area
these constituents generally are present in waters in
small to moderate amounts, not exceeding 50 ppm.
However, samples of water from some of the deeper
aquifers contained as much as 650 ppm of these
constituents. In general, high concentrations of
sodium and potassium may reflect such conditions asfollows:
1. Contamination of fresh water by infiltration of
brackish water.
2. The presence of connate (fossil) saline water.
2. The presence of strata containing alkali salts. •:■
4. Intimate contact of the ground water with base- *exchange minerals.
Some of the above listed conditions are probable
causes for excessive amounts of sodium and potas
sium in some of the water in the Greenville area.
Near the towns of Washington and Belhaven wells
adjacent to bodies of brackish surface water yield
water that contains increasing amounts of sodium,
potassium, and chloride when they are pumped con
tinuously over long periods of time. The increases in
concentration are due largely to induced lateral in
filtration of the brackish surface water into the aqui
fer when the wells are pumped. Connate water is
present at several localities in the area. An excellent
example is the occurrence of such water in a well at
Sunbury, Gates County. Water containing a little
more than 500 ppm of chloride and a little more than
650 ppm of sodium and potassium is present between
the depths of 390 and 450 feet. Above and belowthis interval water generally contains less than 50
21

ppm of chloride and less than 300 ppm of sodium
and potassium. The presence and action of base-
exchange minerals in the water-bearing formations
of the area are commonly recognized. Base-exchange
minerals such as the various clay minerals, the
micas, and glaiiconite have the capacity for exchang
ing cations and anions in their crystal structure with
cations and anions in an aqueous solution when they
are in intimate contact. Little is known of the anion-
exchanging capacity of these minerals or of their
capacity for regeneration under natural conditions.
However, it is known that water containing the ca
tions calcium and magnesium, when in contact with
base exchange minerals such as glauconite, are gen
erally enriched in sodium and potassium at the ex
pense of their calcium and magnesium. In this man
ner the relatively hard calcium and magnesium bicar
bonate waters are changed to the soft sodium bicar
bonate waters under natural conditions. The natural
softening of waters by base exchange is common in
the water-bearing formations of Cretaceous and
Paleocene age throughout the Greenville area. Wa
ter containing as much as 50 ppm of sodium and
potassium may be used for most domestic purposes.
Water containing more than 50 ppm of sodium
and potassium may cause foaming in high-pressure
boilers. Sodium and potassium do not impart a
noticeable taste to ground water unless their con
centration is greater than several hundred parts per
million.
Bicarbonate and carbonate (HCO3 and CO3).—
Very few ground waters in the Greenville area con
tain measureable amounts of carbonate. Generally
the water is of the bicarbonate type and contains as
the principal cations either calcium and magnesium
or sodium and potassium. The bicarbonate content
of the water samples collected in the Greenville area
ranges from less than 4 ppm to 812 ppm. Bicarbo
nate has little effect on either the domestic or indus
trial utilization of the water. The Castle Hayne lime
stone in Beaufort and Martin Counties yield water
that is high in calcium bicarbonate. When this hard
water is heated, the carbon dioxide is driven off and
a residue of-relatively insoluble calcium carbonate is
formed. This residue coats cooking vessels and is
cause for common complaint by residents in those
counties. The residue-producing hardness can be
relieved by the use of zeolite water softeners on the
water distribution system.
Sulfate (SO4).—Most sulfate minerals, such as
gypsum (CaSO4.2H2O), are soluble and will yield sul-
22
fate ions upon solution. The insoluble sulfides of iron
(pyrite and marcasite) are partially oxidized during
the normal weathering processes to soluble sulfates
and are a common source of the sulfates in the
ground waters of the Greenville area. Reduction of
sulfates by bacterial action may produce hydrogen
sulfide (a weak acid) and (or) sulfur, which in turn
may be oxidized by bacteria to produce sulfates.
The occurrence of sulfates in ground waters in
the Greenville area follows no generally predictable
pattern. Water from the shallow water-bearing
sands and limestones of intermediate depth general
ly contain more sulfate than do waters from the
deeper greensands. Ground water containing a high
er than.normal concentration of chloride due to salt
water contamination also contains a high concentra
tion of sulfate. Hydrogen sulfide generally is pres
ent in water from the Castle Hayne limestone, where
it occurs below a depth of about 150 feet, and im
parts a noticeable taste and odor to the water.
Chloride (Cl).—Chloride, in small amounts, dis
solved from rocks during the normal weathering
processes is responsible for some of the chloride not
ed in ground waters of the Greenville area. Other
possible sources are sewage, industrial waste, ferti
lizers used in predominantly agricultural areas, and
salt spray blown inland during heavy storms along
the coast. Back-flooding of low coastal areas during
the hurricanes of 1955 left a residual deposit high
in chloride which made much of the land unfit for
agricultural use until it had been treated with gyp
sum. A large part of this residual chloride will
eventually be dispersed through the ground water
in the near coastal areas.
However, the normal chloride content of ground
water from any of the above-mentioned sources in.
the Greenville area is generally less than 25 ppm.
A chloride concentration much in excess of this
figure indicate the presence of connate water, intru
sive brackish water, or strata containing saline salts
through which the ground water had passed. Both
connate and intrusive chloride waters are recognized
in the area of investigation. At Sunbury, Gates
County, connate water containing 500 to 600 ppm of
chloride is encountered between the depths of 425
and 475 feet. Above and below this zone ground wa
ter containing less than 100 ppm. is encountered. At
the towns of Belhaven and Washington wells tap
ping porous limestone adjacent to brackish surface
waters yield water high in chloride upon continual
pumping. This high chloride content is probably due
to lateral intrusion of the surface water into the

limestone. No evidence is available concerning the
presence of beds containing saline salts^in the area
of investigation.
Fluoride (F).—Fluoride in ground water is due to
the solution of fluoride-bearing minerals such as the
apatites, the fluorapatites, the phosphates, the njiicas,
and the hornblendes, as well as organic matter'such
as shells. Of these, the micas, the phosphates", and
the organic matter are the most prevalent in the
sediments of the Greenville area and are thought to
account for most of the fluoride in the ground water.
Fluoride in concentrations between 1.0 and 1.5
ppm in drinking water aids in reducing tooth decay
in children. Fluoride in concentrations in excess of
1.5 ppm may cause permanent mottling of the teeth
(dental fluorosis) when used by children (Dean, 1936,
pp. 1269-1272). ;
The fluoride content of ground water in the Green
ville area generally is less than the acceptable
amount of 1.5 ppm. However, in parts of some coun
ties, especially in the vicinity of Gatesville and Sun-
bury in Gates County, water from the Cretaceous and
Paleocene aquifers contains as much as 8.0 ppm of
fluoride. To minimize the effect in this high cqncen-
tration it would be necessary to dilute watery that
are high in fluoride with waters containing little or
no fluoride. I
Nitrate (NO3).—Nitrate in ground water is gen
erally considered to be the final oxidation product of
nitrogenous (organic) waste. A nitrate concentra
tion in excess of 3.0 ppm generally would indicate a
nearby source of pollution. Shallow dug wells and
well points are most often subject to pollution from
such influences as sewage, fertilizers, and polluted
surface waters. Water from all types of wells that
are adequately cased so as to exclude the surface
sources of contamination will generally have a nit
rate content of less than 3.0 ppm.
Phosphate (PO4).—Phosphate of ground waters in
the Greenville area has been determined for only a
few samples. No phosphate was recorded in excess
of 0.3 ppm.
Dissolved solids.—Dissolved solids are the residue
remaining after a given volume of water has evapo
rated, and has been dried at some definite tempera
ture (180°C by U. S. Geol. Survey). The calculation
of the dissolved solids is approximately half the bi-
carboante plus the sum of the other mineral con
stituents."
In public water supplies dissolved solids prefer
ably should not exceed 500 ppm, but if water of such
quality is not available dissolved solids of 1,000 ppm
may be permitted. However, comparatively few sup
plies having a dissolved-solids content in excess of
500 and 1,000 ppm are known in the Greenville area.
Hardness.—Hardness of water is usually recog
nized by the increased amount of soap necessary to
form and maintain a lather. Hard water is objection
able not only because of its soap-consuming proper
ties but also because it forms scale in boilers and,
to a lesser degree, encrustations in cooking utensils.
The principal chemical constituents that produce
hardness in ground waters are compounds containing
calcium and magnesium.
To list the hardness tolerances acceptable to vari
ous domestic and industrial users is not within the
scope of this report. However, the U. S. Geological
Survey classifies water with respect to hardness as
follows:
Hardness as CaCO3
0-60
61-120
121-200
200+
Classification
Soft water
Moderately hard water
Hard water
Very hard water
Hydrogen-ion concentration (pH). — The hydro
gen-ion concentration, expressed as the pH, is a
measure of the degree of acidity or alkalinity of the
water. The pH of a solution is represented by a
number which is the negative logarithm of the con
centration of hydrogen ions in moles per liter.
Numerically the pH scale extends from 0 to 14./A"
water having a pH value of 7 is assumed to be neu
tral and the concentration of hydrogen ions is equal
to the concentration of the hydroxyl ions. A water
with a pH value less than 7 is said to be acid (the
concentration of H+ ions is greater than the concen
tration of OH— ions), and the acidity increases as
the numerical pH value decreases toward 0. A water
with a pH value greater than 7 is said to be alkaline
(the concentration of OH— ions is greater than the
concentration of H+ ions) and the alkalinity in
creases as the numerical pH value increases toward
14. Inasmuch as the pH values are the numerical
change to the logarithmic base, a water with a pH
of 3 is ten times as acid as a water with a pH of 4,
and conversely a water with a pH of 9 is ten times
as alkaline as a water with a pH of 8.
The pH values given for ground waters are im
portant as an indication of their corrosive potential.
Generally speaking, acid waters have a much greater
corrosive potential than do the alkaline waters.
23-

PRINCIPAL FORMATIONS AND THEIR
HYDROLOGIC CHARACTERISTICS
Strata of Early Cretaceous age
A formation of Early Cretaceous age was encount
ered at a depth of 608 feet at Greenville, Pitt County.
An examination of the cuttings and the electric log
of this unnamed formation show it to consist of
interbedded sands and clays; the sands are capable
of furnishing large amounts of water. However, in
the well in which the formation was encountered it
yielded brackish water that was unsuitable for fur
ther development. Updip, this formation may con
tain water of suitable quality so as to serve as a
source of ground water to deep wells in the area west
of Greenville and Williamston.
The water in this formation is under artesian head
and recharge is probably in the form of downward
leakage from overlying beds. The formation lies un-
conformably on basement rocks and is thought to be
confined to the subsurface.
No quantitative data regarding the storage capaci
ty and water-yielding potential of this formation are
available.
Tuscaloosa formation
Large quantities of ground water are stored in the
lenticular gravels, sands, and clays of the Tuscaloosa
formation. This formation is a major aquifer in
Hertford, Bertie, Martin, Pitt, and Greene Counties.
To the east of these counties no water wells have
penetrated the Tuscaloosa formation and it is be
lieved that the entire potential aquifer contains
saline waters in Beaufort, Chowan, and Gates Coun
ties.
The water in the Tuscaloosa formation is normal
ly under artesian head throughout the Greenville
area, with the exception of limited segments of west
ern Greene and Pitt Counties where water-table con
ditions exist in the outcrop area. Lenticular sands
and gravels occur at all horizons within the forma
tion but are more prevalent below the upper 150
feet. Many of the wells that utilize the Tuscaloosa
formation as a source of water are "gravel-wall"
wells that also obtain waters from the younger Cre
taceous formations. These gravel-walled wells yield
from 500 to 1,000 gpm with specific capacities that
range from 4 to 15 gpm per foot of drawdown. Single-
screen wells in the Tuscaloosa formation obtain wa
ter from beds of sand and produce from 10 to 300
gpm with specific capacities ranging from 1 to 5 gpm
per foot of drawdown. To the writer's knowledge
24
there are no multiple-screened tubular wells that tap
the Tuscaloosa formation in the Greenville area.
Water levels in this aquifer are variable, depend
ing upon the head in the various sand and gravel
lenses at depth. The piezometric surface is generally
constant in local areas in sand strata of similar
depths. The pressure head generally increases with
depth in any given area. In the valleys of the major
streams and their main tributaries the piezometric
surface is above land surface, resulting in artesian
flows.
In general the chemical quality of water from this
aquifer is adequate for most domestic and industrial
uses. However, shallow wells in the outcrop area of
the aquifer may yield water that contains a realtive-
]y high concentration of iron.
Black Creek formation
The Black Creek formation is one of the most
productive aquifers in the Greenville area. Like the
underlying Tuscaloosa formation, its use is limited in
the outer coastal counties where it lies at great depth
and presumably contains saline water. The forma
tion is developed as an aquifer in Bertie, Martin, Pitt,
and Greene Counties.
The lower part of the formation, the unnamed
member, is predominantly composed of sands and
clays. Except in shallow sands in the outcrop area,
the contained water is under artesian pressure in
lenticular, flat-lying beds confined between lenticular
beds of clay. There is a little uniformity to these
sands. Where one well may penetrate one or two
of these lenticular sands, a well less than 2 miles
away and drilled to a comparable depth may pene
trate as many as five water-producing sands. The
upper part of the Black Creek formation, the Snow
Hill marl member, is composed of black clays.and
interbedded sands and sandy marls. Lenticular sands
are rarely as thick or as extensive as in the lower
part of the formation. Drillers seeking large
amounts of water generally bypass this member.
Locally, however, many small-diameter domestic
wells obtain adequate supplies from thin strata of
sand and sandy marl in the Snow Hill marl member.
"Gravel-wall" wells that tap both the Black Creek
and Tuscaloosa formations are capable of yielding as
much as 1,000 gpm. with specific capacities that
range from 4 to 15 gpm. per foot of drawdown.
Single-screen wells and open-end wells generally
yield 5 to 50 gpm. The water-yielding capacity of
the Black Creek formation increases to the east and
southeast because the formation becomes more
sandy in a downdip direction.

Artesian or pressure head is farly constant in sand
beds at comparable depth over large areas. Artesian
flows are common in wells penetrating the forma
tion, some flows occurring from wells less than 40.
feet deep. These artesian flows are largely confined
to the lower river terraces in the major stream val
leys.
The chemical quality of water from this aquifer is
generally satisfactory for most purposes. However,
relatively hard waters can be expected from wells
that obtain water from the calcareous beds in the
Snow Hill marl member.
Peedee formation
The Peedee formation is one of the major aquifers
in Beaufort, Greene, Pitt, Martin, Bertie, Hertford,
and Gates Counties. In Chowan County the forma
tion lies at a depth in excess.of 450 feet and presum
ably contains saline water in all but the northern
most part of the county adjacent to Gates County.
Water in the Peedee formation is under artesian
pressure, except in local areas at or near the surface
in its area of outcrop. In common with the bolder
Cretaceous formations, the Peedee formation has no
single water-bearing zone that can be traced; over
long distances. Permeable water-bearing sands that
are confined between relatively impermeable clays
occur at all horizons throughout the formation. In
addition, indurated layers composed largely of Shellsand shell fragments occur above and below the water
bearing sands.
The majority of wells tapping this formation are
single-screened or open-end wells that yield 5 to 50
gpm. The open-end wells are constructed so that the
casing is firmly seated in an indurated layer. The
well is then drilled through this layer and a large
cavity is created by forcing compressed air down the
well and blowing out large quantities of sand. This
type of well construction probably is the most com
mon in wells that tap the Peedee formation. In addi
tion, gravel-wall wells in the area obtain a portion
of their water from this formation.
The piezometric surface remains nearly uniform in
sands of comparable depth over most of the area,
the deeper sands containing water under a greater
pressure head than the shallower sands. Artesian
flows are common from wells that tap the Peedee
formation and that lie adjacent to or in the major
stream valleys.
The chemical quality of waters from the Peedee
formation- is not uniform. Water from wells less
than 100 feet deep are relatively hard (high in cal
cium and magnesium). Wells penetrating the forma
tion at depths in excess of 100 to 150 feet obtain wa
ters that are relatively soft (high in sodium and
potassium). This difference in the chemical quality
of the water in the formation is largely due to base
exchange (p.57).
Beaufort formation
The Beaufort formation is utilized as an aquifer in
parts of the following counties: Gates, Hertford,
Bertie, Martin, Chowan, Pitt, and Beaufort. The for
mation, according to present observation, is confined
to the subsurface and is composed of glauconitic
sand, argillaceous sand, indurated shell, and impure
limestone facies. Unlike the underlying Cretaceous
formations it has not been found to contain any
large number of lenticular clay beds. All strata with
in the formation are water bearing, the most import
ant being the glauconitic sands that lie beneath the
argillaceous sands and impure limestones.
However, the strata are lenticular and have not
been traced from well to well over long distances.
Water in the various sand layers is everywhere un
der artesian head and the piezometric surface even
in the interstream areas of greatest relief is rarely
more than 30 feet below the land surface. Artesian
flows from this aquifer are common at low elevations
in and adjacent to the major stream valleys.
Most of the wells tapping the Beaufort formation
are single-screen or open-end wells that yield from
15 to 150 gpm. In addition, several gravel-walled
wells obtain all or parr of their water from this
aquifer and yield as much as 750 gpm. ^ * .*The chemical quality of water from the Beaufort
formation is satisfactory for most purposes. Locally
the water may contain as much as 6 or 7 ppm of
fluoride and water derived from shell beds or im
pure limestones may be objectionably hard. Typical
water from the Beaufort formation is soft and of
the sodium bicarbonate type.
Castle Hayne limestone
The Castle Hayne limestone of middle and late
Eocene age is an important aquifer in Beaufort
County and in parts of Martin County. The forma
tion is at or near the surface in the southeastern
corner of Pitt County. Throughout the rest of the
Greenville area the formation is confined to the sub
surface, being buried progressively deeper in an east
erly direction. The limstone normally contains fresh
water. However, in eastern Beaufort County it is
probable that the limestone in its lower parts con
tains saline waters unsuitable for development.
The yield of wells penetrating the formation is
25

variable. Small-diameter (1 inch to 4 inch) wells
yield from 5 to 150 gpm. Gravel-wall wells 10 to 12
inches in diameter yield as much as 1,000 gpm with
specific capacities of 10 to 30 gpm per foot of draw
down.
Water in the Castle Hayne limestone is under
artesian pressure and the piezometric surface is gen
erally within 20 feet of the land surface. Locally,
this pressure surface may be as much as, 15 feet
above the land surface, accounting for many strong
artesian flows, especially in eastern Beaufort County.
Recharge to the Castle Hayne limstone occurs as both
upward and downward leakage from underlying and
overlying confining beds. There is no direct recharge
from precipitation because the formation, covered
by younger material, does not crop out in most of the
area and is not near the surface- except in a small
area in Pitt County.
The chemical quality of the water is adequate for
most domestic purposes, although objectionably
hard, and large amounts of hydrogen sulfide may
give the waters an objectionable taste and odor in
. local areas.
Locally, the aquifer has been contaminated by
lateral infiltration of brackish surface waters from
the sounds and estuaries bordering the eastern seg
ments of the Greenville area.
Yorktown formation
The Yorktown formation of late Miocene age
transgressively covers nearly all the Greenville area.
Individual wells in all the counties described in this
report obtain small to large supplies of water from
the formation. The predominant lithology is that
of thick, massive marine clays interbedded with len
ticular sands, shell beds, and indurated shell lime
stones. These water-bearing beds occur at all hori
zons within the formation and cannot be traced from
well to well over long distances or predicted at any
given locality on the basis of present information.
The water in the formation generally is under ar
tesian pressure, except at shallow depths at or near
the outcrop area. Most of the wells that obtain wa
ter from this formation are jetted, driven, or dug
wells. Both the jetted and driven wells obtain water
from the sands and shell strata. Dug wells of large
diameter obtain water from the clays in the form of
slow seepage and rarely penetrate to the sand or shell
beds. Individual wells yield 5 to 300 gpm. No re
liable information is available as to the specific
capacities of these wells. General observations sug
gest that specific capacities average less than 5 gpm
per foot of drawdown over most of the area. No
large diameter drilled wells or "gravel-wall" wells
obtain water from this formation, with the exception
of the municipal wells at Edenton in Chowan County.
The artesian head is uniform at comparable depths
over most of the area of investigation and increases
with depth at any given locality. The artesian head
in this formation is above the land surface in the
major stream valleys and flowing wells may be ex
pected. The formation is recharged by direct precipi
tation in outcrop areas or by downward leakage from
thin overlying sands and clays of Quaternary age.
The chemical quality of the water is generally ade
quate for most domestic purposes. Where wells ob
tain water from shell beds or impure limestones,
the water may be noticeably hard.
Hydrologically, the Yorktown formation is im
portant largely as a source of water to the underlying
aquifers of Eocene, Paleocene, and Cretaceous age.
Enormous quantities of water are stored in the clays
of the Yorktown formation. This water moves slow
ly as downward leakage into the more permeably
underlying formations and serves as their main
source of recharge.
Surficial sands
Surficial sands of Quaternary age blanket the in-
terstream areas throughout the Greenville area.
These sands furnish water to more individual wells
than any other water-bearing unit. Sands in this
unit, occurring between thin beds of clay, range from
coarse to fine-graned and well sorted to poorly sorted
sands of all sizes. Generally speaking, the sand-clay
ratio in any given section is about 2:3.
Water in these sands ocurs under water-table con
ditions, and water levels show great variation in re
sponse to seasonal variations in rainfall and evapo-
transpiration. Wells that obtain water from this ma
terial are shallow driven or dug wells that rarely ex
ceed 25 or 30 feet in depth. This type of well may
yield from 2 to 10 gpm, according to the amount of
water desired. Such wells are commonly equipped
with hand-operated pitcher pumps or buckets.
Water-level records indicate that, although sea
sonal variations in the water table in this material
are marked, over a period of years there has been
no long-term rise or decline in water levels.
The chemical quality of water from this unit is
suitable for most domestic uses. The water is soft
but generally is corrosive and may contain consider
able iron.
The surficial sands are the main source of water
for small tenant farms, but the present trend in the
Greenville area is toward abandonment of this
26

source of water in favor of deeper wells that obtain
water of better quality, both chemically and bacter-
iologically, below the surficial sands.
QUANTITATIVE MEASUREMENTS OF
GROUND WATER
In the Greenville area few data are available upon
which to base an estimate of the amount of ground
water that may be available in the aquifers in any
given section. The emphasis in a reconnaissance in-
vestigaton is to delineate and describe the physical
characteristics of the water-bearing formations and
their contained water.
Current and previous measurements of ground-
water levels in the area suggest that, in most places,
only a very small part of the available ground-water
supply is being utilized. Future ground-water in
vestigations in the area should be directed toward se
curing detailed data concerning the water-bearing
capacity of the ground-water reservoirs. Current
statements regarding quantitative withdrawal of
ground water and the effects of this withdrawal on
future supplies in the Greenville area are largely
empirical.
COUNTY DESCRIPTIONS
Beaufort County
(Area 831 square miles, population 37,134)
Beaufort County, the largest and easternmost
county in the area of investigation, is roughly divid
ed in an east-west direction by the Pamlico River,
an inland extension of Pamlico Sound. The county
is bounded to the north by Martin and Washington
Counties, to the east by Hyde County and Pamlico
Sound, to the south by Pamlico and Craven Counties,
and to the west by Pitt County. Washington, the
county seat, is the second largest town in the Green
ville area. Other population centers in the county
include Aurora, Bath, Belhaven, Chocowinity, and
Pantego.
The county is drained by broad, slow-moving
creeks that flow into the Pungo and Pamlico River;
these in turn flow into Pamlico Sound. Large areas
of the county consist of broad swamps, locally termed
"pocosins". In the area north and west of the com
munities of Terra Ceia and Swindell, large segments
of swamp land have been reclaimed through con
struction of deep drainage ditches. This reclaimed
land is among the most fertile in the State. Agricul
ture and seafood processing are the main sources of
income in the county.
Geology—The entire county is mantled by surficial
sands and clays of Quaternary age. This surficial
material is rarely more than 30 feet thick and in
many places less than 10 feet thick. Underlying the
surficial deposits are beds of blue clay, marl, shells,
and impure shell limestone that constitute the York-
town formation of late Miocene age. The Yorktown
formation ranges in thickness from about 40 feet in
the extreme western part of the county to as much
as 200 feet in the extreme eastern part of the coun
ty. In the central and eastern parts of the county
the Yorktown formation is underlain by layers of
phosphatic sand that are separated by one or more
indurated shell beds. This unit, which has been
designated in this report as middle (?) Miocene,
ranges from a few feet to more than 90 feet in
thickness. Individual beds of phosphatic sand are as
much as 20 feet thick. Underlying the upper and
middle (?) Miocene deposits are shell limestones and .
interlayered calcareous sands of the Castle Hayne
limestone of late and middle Eocene age. This form
ation is about 60 feet thick near the western border
of the county and perhaps as much as 250 feet thick
along the eastern border of the county. The Beau
fort formation of Paleocene age, composed of argil
laceous sand, glauconitic sand, and marl, underlies
the Castle Hayne limestone throughout most of the
county. Few data are available concerning the thick
ness of the Beaufort formation. Two miles north of
Washington, the formation is 35 feet thick and, ac
cording to limited data, the formation thickens^rap
idly and is buried progressively deeper toward the
east. Underlying the Beaufort formation are glau
conitic sands and micaceous clays of the Peedee
formation of Late Cretaceous age. No data regarding
the total thickness of this formation in Beaufort
County are available. One mile west of Washington
the top of the Peedee was penetrated at a depth of
158 feet below sea level. In eastern Beaufort County
extrapolated data indicate that the top of the Peedee
formation lies about 700 to 800 feet below sea level.
Beneath the Peedee formation are older Cretaceous
sediments that are believed to contain saline waters,
and are not, therefore, discussed in this section.
Ground water.—With the exception of the supply
for the town of Washington, all public and private
water supplies in Beaufort County are obtained from
wells. Surficial sands of Quaternary-age and near-
surface sand and shell beds of the Yorktown forma
tion furnish water to shallow dug wells and driven
wells that extend to a depth of 30 feet. A yield of
2 to 30 gpm can be expected from shallow wells in
this material. Such wells are commonplace through-
.27

out the entire county. In central and eastern Beau
fort County drilled wells obtain water from lenticular
sands and shell beds in the Yorktown formation and
from shell limestones and calcareous sands in the un
derlying Castle Hayne limestone. These wells range
in depth from 100 to 300 feet and yield as much as
300 gpm. The depth of an individual well is largely
determined by the area in which it is drilled, by the
quantity and quality of water desired, and by indi
vidual driller's preference. Several wells in central
Beaufort County obtain water from the Beaufort
formation. However, this aquifer is seldom utilized
in the eastern and central sections of the county
because of the abundance of water in overlying aqui
fers. Water below a depth of 30-50 feet in this area
is under artesian pressure and flowing wells are
very common. Much of the land is only a few feet
above sea level and the piezometric surface is gen
erally within 15 feet of land surface or higher. In
western Beaufort County, water is obtained from the
Castle Hayne limestone, the Beaufort formation, and
less commonly from the Peedee formation. The rela
tive thinness of the Castle Hayne limestone in this
part of the county limits its value as an aquifer.
Where large quantities of water are desired, wells
must be of large diameter, if tapping the Castle
Hayne limestone, or must tap the Beaufort and Pee
dee formations. Yields of several hundred gallons
per minute may be expected from deep wells in this
area.
The chemical quality of ground water in Beaufort
County is not uniform. Water from the surficial
sands contains objectionable iron and is generally
corrosive. Water from the shell beds and impure
limestone layers of the Yorktown formation is moder
ately hard. Water from the shell limestone layers
and calcareous sand layers of the Castle Hayne lime
stone is moderately hard to very hard and may con
tain objectionable amount of hydrogen sulfide, par
ticularly in the eastern sections of the county. Most
of the water from the Beaufort and Peedee forma
tions is soft, but may be hard if the water is emanat
ing from calcareous strata. At Washington and Bel-
haven several wells yield waters relatively high in
chloride. Available data indicate that the chloride
probably results from a lateral infiltration of brack
ish surface water into the aquifer as the wells are
pumped. Relocation of supply wells at a greater dis
tance from brackish surface waters in these areas
would result in a lower incidence of chloride content.
Large supplies of ground water are available
throughout the county from aquifers of Mesozoic
and Cenozoic age. Present use of ground water in
28
the county is only a small amount of the total water
available.
The following well logs describe the physical
characteristics of the principal aquifers in Beaufort
County (see figure 5 for location).
Beaufort County
Number 32
Location: South shore of the Pungo River at Woodstock Point.
2.4 miles north of Winsteadville, North Carolina.
Owner: Walter Johnson
Date drilled: 1952
Driller: Truman Sawyer
Elevation of well: 6 feet above sea level
Hydrologic Information
Diameter of well: 2 inches
Depth of well: 240 feet
Cased to: 230 feet
Finish: open end
Static (nonpumping) water level: 5 feet above land surface
Temperature: 62°P
Yield: 10 gallons per minute (flow, 1954)
Chemical analysis of water available
Remarks: Very strong odor of hydrogen sulphide around the
well. Water tastes very strongly of hydrogen sul
phide.
Log of Well
Depth
(feet)
0-65 No sample.
Miocene—Yorktown formation
65-75 Sand, white; 80 per cent fine-grained angular to sub-
angular quartz sand. 15 percent light-gray to white
calcareous clay matrix, loosely consolidated. 5 per
cent broken shell and limestone fragments. Ostracoda
and Forarninifera abundant.
75-85 Sand, white; Same 65-75-foot interval.
S5-95 Sand, white; 90 percent fine-grained subangular quartz
sand; grain surfaces predominantly etched and frost
ed. 10 percent gray calcareous clay matrix, loosely
consolidated. Trace of broken abraded shell and lime
stone fragments. Abundant Ostracoda and Foramini-
fera.
95-105 Sand, white; Same as 85-95-foot interval, with trace of
medium-grained black phosphate nodules. Abundant
Ostracoda and Foraminifera.
105-115 Sand, white; Same as 95-105-foot interval.
115-125 Marl, white; 55 per cent fine-grained angular quartz
sand. 35 percent cream-colored shell fragments. 10
percent white to light-gray calcareous clay matrix,
loosely consolidated. Trace of black phosphate no
dules. Ostracoda and Foraminifera1 abundant.
135-145 Marl, white; Same as 115-125-foot interval.
145-165 Marl, gray; same as 115-125-foot interval with matrix
changing from white to gray in color. Ostracoda and
Foraminifera abundant.

Ostracoda from 65-3 65-feet include: j
Cytheridea (Haplocythcridca) j)roboscidi\ila Edwards \ i
Letjumvnocythcreis whitei Swain I
Actinocythereis exanthemata (Ulrich and Bassler)
Echinocythereis garretti (Howe and McGuirt)
M-urrayina martini (Ulrich and Bassler)
Orionina vauyhani (Ulrich and Bassler)
Hcmicythere conradi Howe and McGuirt
Loxoconcha purisubrhomboidea Edwards
Cush man idea ashermani (Ulrich and Bassler)
Middle (?) Miocene—unnamed unit
1GS-1SO Phosphatic sand, brown to gray; 50 percent fine-grain
ed angular quartz sand. 30 percent fine-grained tan
black cellophane spherules and shards. 20 percent
brown <ilt and clay matrix, unconsolidated.
200-210 Phosphatic sand, brown; Same as 168-lSO-foot interval
with 5 percent increase in collophane percentage. No
microfossils.
Middle Eocene—lower part of Castle Hayne limestone
230-240 Sandy limestone; white; 30 percent fine-grained angu
lar water-polished quartz sand. 70 percent white
chalky limestone moderately indurated and hard in
streaks. Ostracoda and Poraminifera rare.
Ostracoda from 230-240-feet include:
Cytheridea (Haplocytheridea) montgom eryensis
Howe and Chambers
Trachyleberis rukasi (Gooch)
Trachyleberis pellucinoda (Swain)
Trachyleberis bassleri (Ulrich)
Beaufort County
Number 100
Location: Stratigraphic test hole 0.6 mile west of-bridge cross
ing Cherry Run on U. S. Route 17, 2.4 miles north
east of Washington, North Carolina.
Owner: American Metals Co.
Date drilled: 1952
Driller: Heater Well Co.
Elevation of well: 30 feet above sea level
Hydrologic Information
Diameter of test hole: 4 inches
Depth oi test hole: 310 feet *
Sampled to: 235 feet
Static monpumping) water level: 1G feet below land surface
(reported 1952)
Log of Test Hole
Depth
(feet)
Quaternary—sand and clay
10-20 ' Sand and clay, tan; 60 percent fine to medium-grained
angular to subangular quartz sand. 40 percent tan
clay matrix, unconsolidated. No microfossils.
20-30 Sand, tan; SO percent coarse to medium-grained sub-
rounded quartz sand. 20 percent tan clay matrix,
unconsolidated. Limonitic staining of quartz grains
predominate. No microfossils.
30-40 Sand, tan; Same as 20-30-foot interval. No micro
fossils.
Upper Miocene—Yorktoion formation
40-50 Marl, gray; 40 percent medium-grained subrounded
quartz sand. 30 percent blue-gray clay matrix, un
consolidated. 30 percent broken shell fragments. Os
tracoda and Foraminifera very rare.
50-70 Clay, dark-gray; 20 percent very fine-grained angular
quartz sand. 80 percent gray clay matrix, unconsoli
dated. Ostraccda and Foraminifera rare.
70-80 Marl, light-gray; 40 percent medium-grained subround
ed quartz sand. 35 percent gray clay matrix, uncon
solidated. 25 percent broken abraded shell fragments.
Ostracoda rare and Foraminifera common.
Ostracoda from 40-70-feet include:
Purtan a rugipunctata (Ulrich and Bassler)
Actinocythereis exanthemata (Ulrich and Bassler)
Murrayina martini (Ulrich and Bassler)
Hemicyihere conradi Howe and McGuirt
Middle Eocene—lower part of Castle Hayne limestone
SO-90 Sandy limestone, white; 35 percent medium-grained
subangular water-polished quartz sand. 65 percent
white shell and limestone fragments in a calcareous
clay matrix, loosely consolidated to hard in streaks.
Trace of glauconite and phosphate. Ostracoda and
Foraminifera abundant.
90-100 Sandy limestone, white; Same as 80-90-foot interval.
Ostracoda and Foraminifera abundant.
100-110 Sandy limestone, white; Same as 80-90-foot interval
with glauconite limestone increasing to ±5 percent.
Ostracoda and Foraminifera abundant.
110-120 Sandy limestone, white; Same as 80-90-foot interval.
Ostracoda and Foraminifera abundant.
120-130 Sandy limestone, white; Same as 80-90-foot interval.
Ostracoda and Foraminifera abundant.
130-140 Sandy limestone, white; Same as 80-90-foot interval
but indurated and very hard. Ostracoda and Foram
inifera common.
140-145 Sand and clay, green; 60 percent fine-grained angular
quartz sand. 30 percent green clay matrix, uncon
solidated. 10 percent light-green fine-grained glauco
nite. Ostracoda rare, Foraminifera common.
Ostracoda from 80-140-feet include:
Cytheridea (Haplocytheridea) montgorneryensis
Howe and Chambers
Cytheridea (Clithrocytheridea) virginica (Schmidt)
Cytlierura sp. aff. C. washburni Stephenson
TrachyJcberis pellucinoda (Swain)
Trachyleberis rukasi (Gooch)
Trachyleberis bassleri (Ulrich)
Pterygocythereis washmgtonensis Swain
Butonia hoxoei (Stephenson)
Paleocene—Beaufort formation
145-150 Glauconitic sand, "salt and pepper"; 40 percent coarse
to medium-grained subrounded quartz sand. 30 per
cent dark-green medium-grained glauconite. 15 per
cent green clay matrix, unconsolidated. 15 per
cent large broken shell fragments, primarily brachio-
pods. Nodosaria sp. prominent in hand specimen. No
Ostracoda, Foraminifera common.
155-105 Sand, gray; 70 percent coarse to medium-grained sub
angular to subrounded quartz sand. 20 percent gray
clay and silt matrix, unconsolidated.. 10 percent dark-
green medium-grained glauconite. Ostracoda and
Foraminifera rare.
29
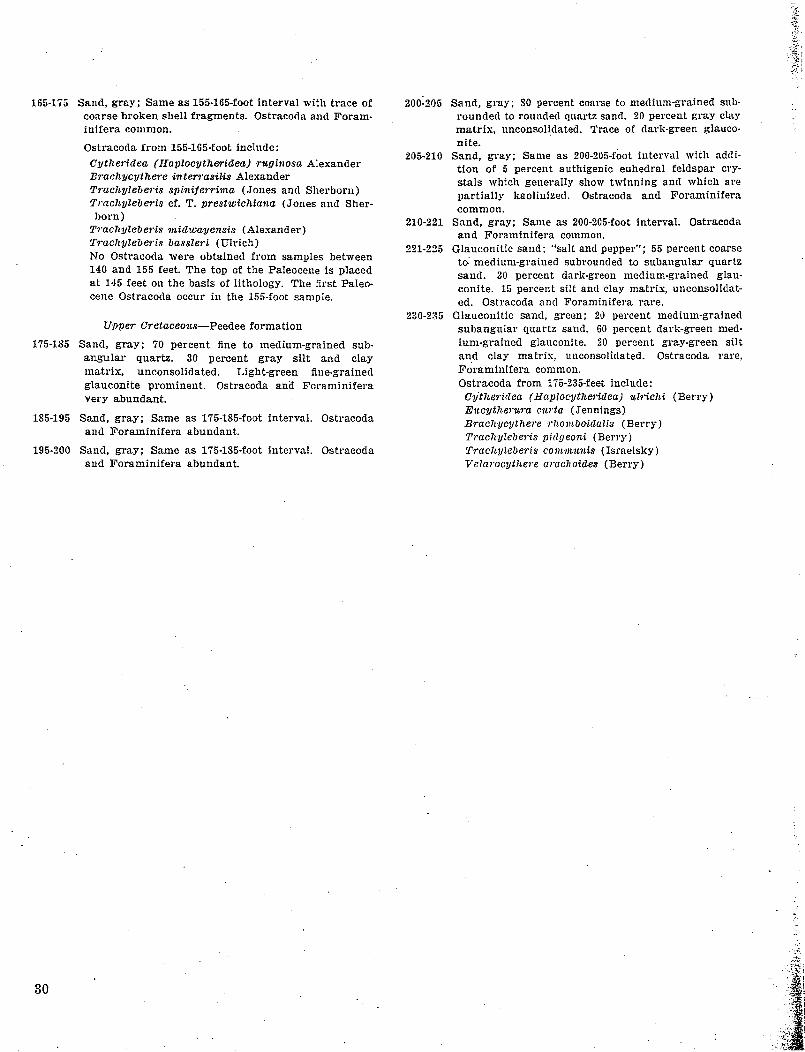
165-175 Sand, gray; Same as 155-165-foot interval with trace of
coarse broken shell fragments. Ostracoda and Foram-
inifera common.
Ostracoda from 155-165-foot include:
Cytheridea (Haplocytheridea,) ruginosa Alexander
Brachycythere interrasilis Alexander
Trachyleberis spiniferrima (Jones and Sherborn)
Trachyleberis cf. T. prestwichiana (Jones and Sher
born)
Trachyleberis midtcayensis (Alexander)
Trachyleberis bassleri (Ulrich)
No Osti*aeoda were obtained from samples between
140 and 155 feet. The top of the Paleocene is placed
at 145 feet on the basis of lithology. The first Paleo
cene Ostracoda occur in the 155-foot sample.
Upper Cretaceous—Peedee formation
175-185 Sand, gray; 70 percent fine to medium-grained sub-
angular quartz. 30 percent gray silt and clay
matrix, unconsolidated. Light-green fine-grained
glauconite prominent. Ostracoda and Foraminifera
very abundant.
185-195 Sand, gray; Same as 175-185-foot interval. Ostracoda
and Foraminifera abundant.
195-200 Sand, gray; Same as 175-185-foot interval. Ostracoda
and Foraminifera abundant.
200-205 Sand, gray; 80 percent coarse to medium-grained sub-
rounded to rounded quartz sand. 20 percent gray clay
matrix, unconsolidated. Trace of dark-green glauco
nite.
205-210 Sand, gray; Same as 200-205-foot interval with addi
tion of 5 percent authigenic euhedral feldspar cry
stals which generally show twinning and which are
partially kaolinized. Ostracoda and Foraminifera
common.
210-221 Sand, gray; Same as 200-205-foot interval. Ostracoda
and Foraminifera common.
221-225 Glauconitic sand; "salt and pepper"; 55 percent coarse
to medium-grained subrounded to subangular quartz
sand. 30 percent dark-green medium-grained glau
conite. 15 percent silt and clay matrix, unconsolidat-
. ed. Ostracoda and Foraminifera rare.
230-235 Glauconitic sand, green; 20 percent medium-grained
subangular quartz sand. 60 percent dark-green med
ium-grained glauconite. 20 percent gray-green silt
and clay matrix, unconsolidated. Ostracoda rare,
Foraminifera common.
Ostracoda from 175-235-feet include:
Cytheridea (Haplocytheridea) ulrichi (Berry)
Eucytherura curta (Jennings)
Brachycythere rhomboidalte (Berry)
Trachyleberis pidgeoni (Berry)
Trachyleberis communis (Israeisky)
Velarocythere arachoides (Berry)
30

CO
Mop Of
Beaufort County
showing the location
of water supplies
scale of miles
0 12 3 4 5
Figure 5.

TABLE 2. Rkcoiip of Wklls in Bkaufort County
Well
no.
1
•■>
4
5
6
7
S
9
10
11
12
13
14
15
16
17
18
19
20
21
22
23
24
25
26
27
28
29
30
31
32
33
34
35
36
37
38
39
40
41
42
43
44
45
46
47
48
40
50
51
52
53
54
55
Location
6K» miles XNK of Pantcso
do
8 miles XXK of Pinetowu
2 miles X of Pinctown
2}-> miles E of Pinetown
2 miles Xl£ of Terra Ceia ._
\li miles X of Terra Ccia
Terra Ceia
....do
....do
\\o miles E of Terra Ceia
U miles NW of Swindell
IK miles SE of Swindell
....do
2 miles S of Swindell . .
2K miles S of Swindell
Pantego
..do.....
do
....do
\\i miles S of Pantego
2 miles NW of Belhaven
Belhaven
..^.do
....do
....do
do
do
....do
3 miles SW of Belhaven
....do
iy* miles NE of Winstcadville—
....do
V/> miles NW of Winsteadville.
1K miles NE of Winsteadville..
Winsteadville
2 miles SW of Winsteadville
4H miles W of Winsteadville
3 miles SW of Winsteadville
6 miles SE of Bath...
—do
do
—do
. do
do.
3 miles SE of Bath .
3 miles SE of Bath
W> miles E of Bath
do
Yeatsville
2 miles W of Yeatsville
3 miles SW of Yeatsville
Bath
....do
Owner
J. Adams
D. Livcrman
L. Sullivan
R. Boweu
G. Bowcn
M. Rcspess
J. Rcspess
M. Ratcliff
Dutch Reformed Church.
L. Pilly
A. Swindell
American Metals Co.
Orville Jones
Mrs L Harris
M. Ratcliff..
R. Y. Wilkinson
T Dovle
Beaufort County Board
of Education
D. Lupton
R. Hamilton
N. C. State Highway
Dcpt
Town of Belhaven
do
...do
..do
do
do
do
J. L. Walls
R. 0. Smith
W. Johnston
W.Taylor
W. Boshen
F. Winstead
W F Winstead
R. C. Moore
J. B. Brinn
A. N. Roper
St. Clair Church of Chris
G. D. Ross
W R. White
B.Godley
do
do
B. Selby
B. F. Bowers
T. A. Brooks
Harold Ormond
J M Tankard
J. Waters
L P Harris
T. Brooks
Bath School
T. A. Brooks
Tyiic
of
Well
Open-
end
do
do
do
-do...
-do...
do
. do ..
..do...
do
.do ..
-do...
do
..do...
Open-
end
...do...
...do
do
do
do
—do—
..do ..
do
do
Screen
Open-
end
do
Screen
Open
end
. do...
—do-
Open
end
Point
Open
end
Point
Open
end
— do-
...do-
Point
Open
end
do
do
...do
do
do
Screen
Point
Open
end
.-do
do
...do
do
...do..
...do-
Point
Depth
(ft.)
231
244
140
175
179
225
360
402
300
300
265
190
200
231
235
380
250
232
200
285
275
230
410
185
101
100
100
306
225
285
230
270
30
213
30
350
311
180
50
250
250
225
269
168
90
20
200
145
185
195
120
265
20
Diam
eter
Cm.)
2 i
2
2
2
2
2
4-2
2
IK
IK i
2 ;
2 :
2 !
24 ' i
6
2
2
2
2
2.5
8
2
8
3
3
6
3
2
2
2
IK
IK
3-2
3
2
IK
IK
2
2
2
2
a
2
2
2
2
IK
Depth
of
casing
(ft.)
220
240
140
160
179
220
°85
402
300
250
265
165
220
230
305
250
930
°45
°85
260
210
265
180
97
97
SO
030
280
230
265
30
213
30
260
300
180
50
180
ISO
180
210
190
168
90
! 20
200
130
185
195
190
85
265
20
Water-bearing
material
Limestone . -- -
do
do
do
do
..do
do
Limestone
do
do
Phosphatic sand
Limestone
do
Limestone
Greensaud
Limestone
do
do
do
do
do
....do....
....Marl
do
do
do
Limestone
do
do
—do
Limestone
Sand
Sand
Limestone - ...
do
.do
Marl
do
do . —
do
do
do
Marl
Sand
do
do .. .
Sand .
Sand
Water
level
(ft.)
Flows
+8.9
—9.0
Flows...
Flows
Flows
Flows
Flows
Flows
Flows
Flows
Flows
Flows
Flows
Flows
Flows
Flows
Flows
Flows
Yield
(gpm)
5
Draw
down
(ft.)
Remarks
Analysis Temperature 62°F.
Water level measured, 1954
Water level reported by
driller, 1952. Temperature
6l°F.
Analysis.
Analysis.
Analysis. Temperature 6l°F.
Analysis. Temperature 61°F"
Water level measured, 1956.
Analysis. Temperature
61°F.
Analysis. Public supply.
Abandoned.
Analysis. Public supply.
Public supply.
Public supply.
Analysis. Abandoned.
Analysis.
Analysis.
Analysis.
Temperature 62°F.
Temperature 62°F.
Analysis.
Water has very strong H2S
odor and taste
Water has very strong H2S
odor and Taste. Tempera
ture 62°F
....do
Temperature 63°F.
Temperature 63°F.
Analysis.
32

TABLE 2. Recoki) of Wklls in Bkaufout County—Continued
Well
no.
56
57
58
59
60
61
62
63
64
65
66
67
68
69
70
71
72
73
74
75
76
77
7S
79
80
81
82
83
84
85
86
87
88
89
90
91
92
93
94
95
96
97
98
99
100
101
102
103
104
105
106
107
108
109
110
111
112
113
Location
VA miles NW of Bath
....do
—do
....do
3H miles NW of Bath
—do
2}4 miles WXW of Bath
....do
4 miles WSW of Bath
....do
2 miles E of Bunyan
1 mile E of Bunyan
—do
2H miles NNE of Bunyan
VA miles W of Bunyan
VA miles W of Bunyan ....
1 mile NE of Washington.
Washington
—do
....do
..-do
—do
—do
—do
—do
—do
—do
—do
...-do
Washington
....do
....do
....do
do
....do
—do
—do
....do
....do
—do
....do
1 mile N of Washington... ..
VA mile N of Washington
....do
11A miles NW of Washington....
VA miles NW of Washington....
7 miles NW of Washington
VA miles NW of Washington....
VA miles NW of Washmgton....
10 miles NW of Washington
3H miles NNW of Mineola
3 miles NNW of Mineola
2H miles NNW of Mineola
Mineola -
—do...:
Chocowinity
—do
—do
Owner
W.T.Wallace
American Metals Co... _
W. WaUace. Jr
R. Boweu
L. C. Jefferson .
T. Sawyer
H. Gurganus
B. Davis
Camp Leech
....do
C. Sheppard
R. Warner
J. Ward
John Singleton
H. Williamson
Ethel Rhodes
Couuty Home
Colonial Ice Co
—do
Dr. Pepper Bottling Co.
....do
F. Mayo & Co
—do
C. F. Cowell
—do
Maola Ice Cream Co
Adams Wholesale Co
R. Whisnant
A. Moore
W. J. Edwards
Sullivan's Hatchery
S. M. Lee
F. Caraway
Washington Light &
Power Co
—do
—do
....do
City of Washington
do
—do
do
A. T. Williams
Airport
American Metals Co
—do
R. Harrison
N. Cherry
W. Cherry
K. B. Dixon
R. Leggett
J.J. Wynn
W. Leggette
R. Leggette
Old Ford School
G. Wollard
Norfolk Southern Railroad
P. A. Taylor
Nelson Motel
Type
of
Well
Open
end
Open
end
Point
Open
end
—do...
—do...
—do...
—do...
. do
—do...
Open
end
—do...
—do...
Point
Open-
end
—do
...do
—do
do
Screen
- do .
—do ..
—do...
...do -
- do
—do .
—do. .
do
Screen
Open
end "
Open
end
. do
-do—
—do—
—do -
—do
Gravel
waU
Open
end
do...
Gravel
wall
Open
end
Screen
Open
end
—do...
—do-
Open
end
—do—
—do—
—do—
—do
do
do
-do—
...do—
—do...
Depth
(ft.)
228
130
,100
130
1
150
145
jioino
115
93
200
:95
110
340
35
180
74
60
65
142
152
145
152
J158
150
147
; 741
120
!lO7
60
140
108
160
113
141
103
273
168
168
173
65
215
245
310
120
170
130
135
185
179
112
165
100
80
125
160
215
Diam
eter
(in.)
2
2
2
VA
V4
IK2
2
IK
IK
IK2
4
2
4
4
8
g
6
4
6
g
o
4
Q
Q
IK
VA
IK
g
G
6
g
12-8
6
6
10-8
IK8
VA2
2
2
2
2
2
2
2
4
2
4
Depth
of
casing
(ft.)
228
130
87
30
145
140
S5
90
105
90
200
95
105
300
35
180
70
60
60
140
152
138
145
115
87
99
91
70
70
99
60
140
100
160
100
141
100
273
100
100
160
65
210
120
170
130
55
130
179
90
160
90
80
125
160
210
Water-bearing
matciial
do
Marl
do
Sand
....do
do
do
Limestone
Sand
do
Greensand ...
Sand
Marl
do
do
do
do
do
...do
do
do
do
do
do
Limestone
do
....do
do
do
do
do
do
. do
do
Sand
Limestone .......
do
Sand
do
Greensand
....do
. do „
Limestone
Greensand
....do
Limestone
Greensand
Sand
do
do
....do
Greensand .._
Water
level
(ft.)
—20.3
21 7
—8.0
Flows
r\
Yield
(gpm)
180
Draw
down
(ft)
6
Remarks
Analysis.
Anulvsis Temi)orattire fVoK
Temperature 62°F.
Analysis
Analysis. Water level meas
ured, 1956.
Water level measured, 1956.
.X
■■
Analysis. Public supply.
Analysis. Public supply.
Public supply.
Public supply.
Temperature 62°F.
Analysis.
Analvsis
Analysis.
33

TABLE 2. Record of Wkm.s ix Bkai-fokt County—Continued
Well
no.
114
115
116
117
118
119
120
121
122
123
124
125
126
127
128
129
130
131
132
133 !
134
Location
Chocowinity
....do
..do
5 miles SE of Chocowinitv
9» -J miles SE or Chocowinity
10 miles SE of Chocowinity
12 miles SE of Chocowinitv
Cors Cross Roads
Edward
4? 4 miles SSE of Edward
Idalia
....do
...do
....do
.._.do
Aurora
....do
....do
do
Aurora „__
... do
Owner
G. B. Smith
T. H. Moore
J. 13. Winfield
do
R. Mavne
J. C. Cayton
N. C. State Highway
Dept.
A. 0. Mason
Bennett and Sawyer
C.T.Allen
CM. Hardy
Harvey Bros
B. Thompson
A. Baker
B. Thompson ..
Max Thompson .
A. C. Lupton
Town of Aurora
Beaufort Co. Board of
Education
Atlantic Coast Line
Railroad
Aurora Potato Co.
Type
of
Well
Poiut
Open
end
Open
end
...do...
...do...
...do...
...do...
Open
end
Point
Open
end
Point
Open
end
...do...
...do...
.- do
—do...
...do...
...do...
...do...
Screen
Open
end
Depth
(ft.)
30
90
165
165
190
100
140
125
50
209
18
210
200
215
200
323
235
180
200
100
200
Diam
eter
(in.)
IK
2
2H
2}4
IK
IK
IKIK
2
2
2
2
2
2
2
2
2
6
4
Depth
of
casing
(ft)
30
90
160
165
180
100
98
125
50
209
18
210
200
205
204
200
180
190
100
190
Water-bearing
material
Sand
Marl
Sand
do
do
Limestone
....do
Sand
do
Limestone
Sand
Limestone
do
do
do
do
....do
do
do
Marl
Limestone
Water
level
(ft.)
Flows
Fl
Flows
Flows
Yield
(gpm)
Draw
down
(ft.)
Rbuarks
TABLE 3. Chemical Analyses of Ground Water from Beaufort County
(Numbers at heads of columns correspond to well numbers in table of well data)
(Parts per million)
Silica (SiOa)
Iron (Fc), total
Iron (Fe), in solution
Calcium (Ca)
Magnesium (Mg)
Sodium and potassium (Na+K)
Bicarbonate (HCO3)
Sulfate(S04)
Chloride (Cl)
Fluoride (F)
Nitrate (NOa)
Dissolved solids
Hardness as CaCO 3
pH
Water-bearing material .
Date of collection
1
0.08
.00
29
396
212
7.3
Limestone
6-21-55
6
53
.35
.01
75
21
34
417
.1
6.8
.4
.5
395
275
7.7
Limestone
3-18-55
8
37
.14
.02
59
29
45
427
.1
15
.4
1.0
411
268
7.6
Greeiisand
3-8-55
12
2.7
.01
34
10
20
178
21
10
.6
.8
243
138
7.5
Phosphatic
saud
9-17-56
14
52
1.1
00
49
28
51
400
.1
19
.6
1.5
395
240
7.7
Limestone
3-18-55
20
54
.04
43
29
65
3659 9
on
.8
.2
412
226
Limcstouc
12-1-43
Analyzed by the Quality of Water Branch, U. 3. Geological Survey.
34

TABLE 3. Chemical Analyses of Ground Water from Bkaufort Covxty—Continued(Numbers at heads qf columns correspond to well numbers in table of well data)
(Parts per million)
Silica (SiO2)
Iron (Fe). total
Iron (Fe), in solution
Calcium (Ca)
Magnesium (Mg)
Sodium and potassium (Na-j-K)
Bicarbonate (HCO3)
Sulfatc(S04)
Chloride (Cl)
Fluoride (F)
Nitrate (NO3)
Dissolved solids
Hardness as CaCO3pH
Water-bearing material
Date of collection
. 23
40
.09
.04
41
30
538
514
80
655
1.3
.1
1630
263
7.5
Limestono
2-26-51
25
46
.39
90
11
154
459
29
138
.5
1.6
702
270
7.3
Marl
11-10-47
29
448
4
98
1.2
231
Limestono
1-6-42
31
39
.14
.00
56
29
82
417
2.1
65
.7
.0
512
250
7.4
Limestone
4-21-54
32
26
.02
.00
28
31
369
509
39
382
1.0
.0
1150
197
7.5
Limestone
4-21-54
40
435
1
50
302
7.2
Limestone
4-21-54
Analyzed by the Quality of Water Branch, U. S. Geological Survey.
Silica (SiOz)
Iron (Fe), total
Iron (Fe), in solution
Calcium (Ca)
Magnesium (Mg)
Sodium and potassium (Na-fK)
Bicarbonate (HCO3)
Sulfate (SO4)
Chloride (Ci)
Fluoride (F)
Nitrate (NOs)
Dissolved solids
Hardness as CaCO3. „ . .
pH
Water-bearing material
Date of collection
52
430
9
13
331
7.1
Limestone
4-21-54
56
64
.65
.00
98
10
18
384
1.4
5.8
.5
.0
399
286
7.1
Limestone
3-31-54
61
62
.39
.01
74
17
10
327
.1
5.4
.6
1.5
347
255
7.5
Limestone
3-18-55
69
442
1
52
.8
234
7.8
Greensand
3-30-54
71
234
1
4.2
.0
181
7.5
Limestone
3-30-54
93
9.7
.13
.09
33
15
154
378
17
no
.7
.9
545
144
7.4
Limestone
10-19-56
Analyzed by the Quality of Water Branch, U. S. Geological Survey.
Silica (SiO2)
Iron (Fe), total
Iron (Fe), in solution
Calcium (Ca)
Mamesium (Mg)
Sodium and potassium (Na+K)
Bicarbonate (HCO3)
Sulfate (S04)
Chloride (Cl)
Fluoride (F)
Nitrate (NOs)
Dissolved solids
Hardness as CaCO3...
pH
Water-bearing material
Date of collection. . .
94
15
.38
.01
73
6.3
50
200
29
88
.1
2.7
373
208
7.4
Limestone
10-19-56
103 107
j
277
1
4.8
.5
190
7.7
Greensand
3-30-54
71
15
317
1
4.8
.5
239
7.5
Limestone
3-31-54
112
199
1
4.2
.5
147
7.8
Sand
3-29-54
117
252
2
5
0.2
192
Sand
12-4-43
Analyzed by the Quality of Water Branch, U. S. Geological Survey.
35

Bertie County
(Area 691 square miles, population 26,440)
Bertie, the second largest county in the area of
investigation, is bordered on three sides by rivers;
the Chowan River to the east and the Roanoke River
to the south and west. Northampton and Hertford
Counties form the northern boundary. Windsor, the
county seat, is the largest town; other population
centers in the county include Aulander, Colerain,
Kelford, Lewiston, and Powellsville.
The southern third of the county is drained by the
Roanoke River, the central third by the Cashie
River, and the northern third drains through Hert
ford County into the Chowan River. Although the
Chowan River forms the eastern boundary of the
county there is no direct drainage along the bound
ary into the river; this eastern county boundary is
characterized by prominent river bluffs along its
entire extent.
The sale of agricultural products provides the
major source of income in the county; tobacco is the
chief crop. Several small industries, such as lumber
and sawmill operations, are located mainly in and
near Windsor.
Geology.—Surficial sand, clay, and gravel of Quat
ernary age form a mantling deposit over the county.
Only where major streams and tributaries have cut
down through this surficial material are older for
mations exposed. The light-colored surficial mater
ials range in thickness from a few feet to as much
as 40 feet and generally are thinnest in the inter-
stream areas.
Underlying the surficial material throughout most
of the county are clays, sands, and marls of the York-
town formation of late Miocene age. Individual beds
in this formation are lenticular and cannot be traced
laterally for any great distance. Massive blue-gray
clays with subordinate occurrences of interbedded
sands and marls are widespread in the central and
eastern sections of the county. The Yorktown at
tains its maximum thickness in the eastern part of
the county and becomes thinner to the west. It is
48 feet thick in a well at Windsor and is 120 feet
thick in a well near Mount Gould.
Underlying the Yorktown formation in central and
eastern Bertie County are greensands and impure
shell limestones of the Beaufort formation of Paleo-
cene age. The thickness and subsurface extent of
this formation west of Windsor are unknown, be
cause of the scarcity of well samples. At Windsor, in
a well drilled for the town, the formation was 78 feet
thick. At Mount Gould the formation was more than
250 feet thick. There seems to be little change in
the lateral continuity of this stratigraphic unit in
Bertie County. Greensands predominate at any one
locality, with impure shell limestones occurring at
several horizons. Chronologically, the Beaufort for
mation in Bertie County is represented by a younger
facies than in other parts of the Greenville area. Al
though containing a dominant Paleocene microfauna,
in this area, it also contains faunal elements common
to lower Eocene (Wilcox) sediments elsewhere, par
ticularly to the microfauna of the Aquia formation
of Virginia and Maryland.
Underlying the Beaufort formation in central and
eastern Bertie County are formations of Late Cretac
eous age, the Peedee, Black Creek, and Tuscaloosa
formations. The Cretaceous sediments are composed
of lenticular clays and interbedded sands that have
little lateral continuity. Water-bearing beds in both
the Peedee and Black Creek formations of this area
are generally composed of finer sands and more clay
than in comparable water-bearing beds of the same
age in Martin, Pitt, and Greene Counties. The Tus
caloosa formation is the only Cretaceous formation
that is exposed in Bertie County. Intermittent ex
posures of the arkosic sands and clays of this for
mation can be seen along the banks of the Roanoke
River from a point opposite Lewiston to the Bertie-
Northampton County line to the north. Both the
Peedee and the Black Creek formations are overlap
ped by the Yorktown formation and finally pinch out
between the overlying Yorktown formation and un
derlying Tuscaloosa formation. According to incom
plete subsurface data the Beaufort, Peedee, and
Black Creek formations, which consist of marine
facies in south-central Bertie County, interfinger
with predominately deltaic facies of comparable age
in the northwestern part of the county. The Peedee
formation at Windsor is 82 feet thick and the under
lying Black Creek formation at least 179 feet thick.
Sediments of Tuscaloosa age are presumed to under
lie the younger Cretaceous sediments in the eastern
and central sections of the county. The writer be
lieves that deep wells in the county will encounter
Lower Cretaceous sediments beneath the Tuscaloosa
sediments, as was the case in Pitt County to the
south.
Ground water.—Surficial sands and gravels of
Quaternary age furnish more water to individual
wells than any other aquifer in the county. Dug wells
and driven wells, ranging in depth from 10 to 40 feet,
obtain from 2 to 15 gpm from this material in most
parts of the county.
Driven wells deeper than 40 feet and jetted wells
36

as deep as 120 feet obtain water from the sand and
marl beds in the Yorktown formation. Inasmuch as
no single water-bearing horizon is recognized in this
formation, the depths of individual wells is quite
variable. No adequate figure for the yield of wells
tapping the Yorktown formation can be given. Indi
vidual wells yield 5 to 50 gpm, and several times the
maximum figure might be obtained at specific sites.
Many jetted and drilled wells up to 4 inches in
diameter obtain water from the Beaufort formation
at depths as great as 450 feet; the depth depends
upon the location within the county. This formation
is utilized as an aquifer in the central and eastern
sections of the county. West and northwest of Wind
sor jetted and drilled wells obtain the bulk of their
water from the Cretaceous formations at depths as
great as 300 feet. Because no single water-bearing
horizon is present in these formations, again the
depths of individual wells cannot be determined in
advance of the drilling.
Several of the municipal wells at Windsor are
gravel-walled wells that are 12 inches in diameter
and obtain water from the Beaufort, Peedee, and
Black Creek formations. These wells, tapping mul
tiple aquifers, have specific capacities ranging from
4 to 8 gpm per foot of drawdown and generally yield
300 gpm or more.
The chemical quality of ground water in Bertie
County is adequate for most purposes. Water in
shallow surficial sands, although soft, may be cor
rosive and have objectionable concentrations of iron.
Water in shell beds of the Yorktown formation and
impure shell limestones of the Beaufort formation
may be hard but is otherwise of good quality. The
waters in any one area generally become more soft
with depth below a minimum of 100-125 feet. Brack
ish waters are commonly present in the deeper Cre
taceous aquifers in all parts of the county below an
arbitrary depth of 500 feet. Fluoride in excess of the
maximum concentration (1.5 ppm) recommended in
drinking water is present in waters from several
acquifers below a depth of 300 feet, particularly in
the vicinity of Windsor.
The present rate of withdrawal of ground water
in the county is only a small fraction of the total
available supply.
The following well log describes the physical
characteristics of some of the principal acquifers in
Bertie County (see figure 6 for well location).
Bertie County
Well Number 64
Location: Windsor, North Carolina, Well at rear of water
treatment plant.
Owner: Town of Windsor
Date drilled: .1953
Driller: Layne Atlantic Co.
Elevation of well: 46 feet above sea level
Hydrologic Information
Diameter of well: 10 inches
Depth of well: 40 5 feet
Cased to: 405 feet
Finish: Gravel-wall and screens
Static water level: G.7 feet above sea level (1953)
Yield: 250 gallons a minute
Log of Well
Depth
(feet)
Quaternary—surficial sands
0-22 Sand, tan; 75 percent fine-grained angular to sub-
angular quartz sand. 15 percent tan clay matrix, un-
consolidated. 10 percent coarse blocky grains of
potash feldspar. Trace of coarse mica flakes. No
microfossils.
Upiicr Miocene—Yorktown formation
22-42 Sand and clay, gray; 65 percent medium to fine
grained subrounded to subangular quartz sand. 25
percent blue-gray clay matrix, unconsolidated but
tight. 10 percent fine broken shell fragments. Trace
of coarse mica flakes. Ostracoda and Foraminifera
common.
42-57 Sand and clay, gray; 55 percent fine to medium-grain
ed subanguiar quartz sand. 35 percent blue-gray clay
matrix, unconsolidated. 10 percent fine broken shell
fragments. Trace of dark-green fine-grained glauco-
nite. Ostracoda and Foraminifera common.
57-70 Sand and clay, gray; Same as 42-57-foot interval with
slight increase in percentage of shell fragments* Os
tracoda and Foraminifera abundant. ^ ••*■
Ostracoda from the. 22-57-foot intervals include:
Puriana ntgipunctata (Ulrich and Bassler)
Murray'ma martini (Ulrich and Bassler)
Orionina vaugliani (Ulrich and Bassler)
Hemicythere schmidtae Malkin
Hemicythere confragosa Edwards
Hemicythere conracli Howe and McGuirt
Paleocene—Beaufort formation
70-S3 Sand, gray; 70 percent coarse to medium-grained sub-
rounded quartz sand. 20 percent light-gray calcareous
clay matrix, indurated and moderately consolidated.
10 percent dark-green coarse-grained glauconite. Au-
thigenic pyrite and pyrite aggregates prominent.
Trace of coarse broken abraded shell fragments. Os
tracoda and Foraminifera common.
83-9G Glauconitic sand, "salt and pepper"; 50 percent coarse
grained subrounded to subangular quartz sand. 25
percent dark-green coarse-grained glauconite. 25 per
cent white calcareous clay matrix indurated and
moderately consolidated. Trace of coarse broken
abraded shell fragments. Ostracoda and Foramini
fera common.
96-134 Glauconitic sand, "salt and pepper"; 30 percent med
ium-grained subrounded to subangular quartz sand.
37

50 percent dark-green medium-grained glauconite. 20
percent calcareous clay and silt matrix, unconsoli-
clated. Ostracoda and Foraminifera common.
134-144 Glauconitic sand, "salt and pepper"; 40 percent coarse
grained subangular quartz sand. 25 percent dark-
green coarse-grained glauconite. 35 percent calcar
eous clay matrix, indurated and well consolidated.
Ostracoda from the 70-134-foot intervals include:
Cytheridea (Haplocytheridea) ruginosa Alexander
Brachycythere interrasilis Alexander
Brachycythere plena Alexander
Trachyleberis miclicayensis (Alexander)
Trachyleberis presticichiana (Jones and Sherborn)
Trachyleberis bassleri (Ulrich)
Upper Cretaceous—Peedee formation
144-165 Clay and sand, gray; 25 percent fine to medium-grained
angular to subangular water-polished quartz sand.
75 percent gray clay matrix, unconsolidated but com
pact. Dark-green fine-grained glauconite prominent.
Trace of coarse mica flakes. Ostracoda- and Foramini-fera common.
165-1S5 Clay and sand, gray; Same as 144-165-foot interval
with slight increase of coarse mica flakes. Ostracodaand Foraminifera common.
1S5-206 Sand, gray; 70 percent medium-grained subrounded to
subangular well-sorted clay matrix, unconsolidated.
. 10 percent dark to light-green fine-grained glauconite.
Trace of broken abraded.shell fragments. Ostracodaand Foraminifera common.
206-226 Sand, gray; 90 percent very fine-grained angularquartz sand. 10 percent gray micaceous clay matrix,
unconsolidated but compact. Pyrite aggregates prom
inent. Trace of dark-green fine-grained glauconiteand phosphate spherules. Ostracoda and Foramini-
- fera rare.
Ostracoda from the 144-226-foot intervals include:Cytherella herricki Brown
Cytherelloiclea sioaini Brown
Cytherelloidea sohni Brown
Brachycythere rhomboidalis (Berry)
Trachyleberis pidgeoni (Berry)
Trachyleberis praecursora Brown
226-246
Upper Cretaceous—Black Creek formation
Sand and gravel, tan; 50 percent coarse to fine-grained
subrounded to angular quartz sand. 30 percent fine
rounded gravel. 20 percent tan clay and silt matrix,
unconsolidated. Pyrite aggregates and coarse blocky
potash feldspar grains prominent. Trace of dark-
green glauconite. Ostracoda and Foraminifera very
rare.
246-266 Sand, tan; 80 percent medium to coarse-grained sub
rounded quartz sand. 15 percent tan clay matrix,
unconsolidated. 5 percent light-green fine-grained
glauconite. Pyrite aggregates and coarse-grained pot
ash feldspar prominent. Ostracoda and Foraminifera
very rare.
266-2SS Sand, tan; Same as 246-266-foot interval with the addi
tion of hematite aggregates prominent. Ostracoda
common, Foraminifera very rare.
288-30S Sand and clay, tan to gray; 60 percent coarse to fine
grained subrounded to angular poorly sorted quartz
sand. 35 percent tan to gray clay matrix, unconsoli
dated. 5 percent light-green medium-grained glauco
nite. Pyrite and hematite aggregates prominent. No
microfossils.
308-330 Sand and clay, tan to gray; Same as 2SS-30S-foot in
terval. No Ostracoda, Foraminifera very rare.
330-350 Sand and clay, tan to gray; Same as 2SS-30S-foot in
terval. No microfossils.
350-370 Sand and clay, tan to gray; Same as 2S8-308-foot in
terval. No microfossils.
370-400 Sand and clay, gray; 60 percent very coarse to fine
grained subrounded to angular poorly-sorted quartz
sand. 35 percent gray ciay matrix, unconsolidated but
compact. 5 percent light-green medium-grained glau
conite. Pyrite and hematite aggregates prominent,
trace of broken abraded shell fragments. No micro
fossils.
400-405 Clay, brick-red; 10 percent subrounded medium gravel.
90 percent brick-red clay matrix, unconsolidated but
very compact. Hematite aggregates prominent in
washed residue. Trace of dark to light-green fine
grained glauconite and coarse mica flakes. Ostracoda
and Foraminifera rare.
Ostracoda occurring in the 226-400-foot intervals include:
Cytheridea (Haplocytherklea) cf. H. berryi (Swain)
Cytheridea (Hoplocytheridea) monmouthensis
(Berry)
Trachyleberis'l austinensis (Alexander)
Protocythere parat7-iplicata Swain
Remarks: The occurrence of Citharina texana Cushman.in.
266-28S-foot interval and the occurrence of Trachylel)eris(f)
austinensis (Alexander) in the 400-405-foot interval indicates
an Austin age, and it seems probable that the upper Snow
Hill marl member of the Black Creek formation, which is of
Taylor age, is absent in this well.
38

HERTFORD
NORTHAMPTON
COUNTY
/ —V -.. ._* .. __..
/ Aulonder \'5 14 >* "7 VToT"
C 0 U N T Y
Mop of
BERTIE COUNTY
Showing location of woter supplies
COCO Figure 6.

TABLE 4. Rkcokds of Wells in Beutie Couxty
Weil
110.
1
2
3
4
5
6
7
8
9
10
u
12
13
14
15
1G
17
18
19
20
21
22
23
24
25
26
27
28
29
30
31
32
33
34
35
36
37
38
39
40
41
42
43
44
45
46
47
4S
49
50
Location
Roxobcl
....do
....do
Kelford
do
....do
»2 mile N of Rhodes
2H miles E of Roxobel
V/> mile W of Aulander
Aulander
Aulander
do
....do
....do
....do
Aulander ... ..
....do..
....do
....do
Connaritsa...
Powellsville •_
....do _
....do
1M miles S. of Powellsville
1 mile E of Powellsville
YA mile W of Trap
% mile E of Trap
Colerain
....do
....do
....do
....do .'
VA miles SW of Colerain
% mile WNW ofColerain
2H miles WSW of Colerain
V/i mile of Rosemead
1 mile NE of Mount Gould
1 mile W of Mount Gould
VA miles NW of Mount Gould..
1 mile S of Mount Gould
VA miles NW of Mount Gould..
Whites X-Roads
% mile E of Askewville
4K miles E of Republican
1 mile SE of Burden
3H miles SE of Rhodes
1 mile SW of Woodville
IK miles SW of Woodville
Woodville
Republican
Owner
Farmville-Woodard
Lumber Co.
... do
....do
Coca Cola Plant —
Texaco Gas Station
E. A. Outlaw
W.C. Tester
H. D. Thomas
\Y. D. Rawls
do
....do
....do
....do
Town of Aulander
....do
....do
Seaboard Airline R. R.
J. W. Howard
Town of Powellsville
B. Reynor
H.HarreU
J. TV. rlolloman
Lee Freeman
C.W.Wade
Trap Lumber Co
Town of Colerain
Perry, Belch, Fish Co.
Town of Colerain
....do
F. McCrarv
F.W.Leary
Zion Hill Baptist Church.
Charles Brinkley
Bertie County Board
of Education .
W. R. Lawrence
M.W.Britt
J. D. Rayuor
Bertie County Board of
Education
W.G. Baker
Hugh White
J. H. Cowan
X. C. State Highway
C. Cowan
J. D. Francis
Bertie County Board of
Education
Bertie County Board of
Education _
C.B. Griffin
J J? Buzeiiiore
Type
of
Well
Open
end
do
do
. do
Dug
do
Open-
end
Dug
...do...
Screen
Gravel
Wall
Open
end
do
...do...
...do ..
Open
end
. do ._
.. do ..
do
Dug
Screen
Open
end
...do...
Dug
Screen
...do...
Open
end
Screen
do
...do...
Screen
Open
end
Screen
Screen
...do...
...do...
...do...
...do...
Open
end
Dug
Open-
end
Screen
Open
end
. do ..
Screen
...do...
Screen
...do...
Open
end
Depth
(ft.)
22
150
330
196
13
20
105
16
12.8
255
354
187
164
132
160
140
160
135
45
11.2
310
46
52
13
255
335
105
170
192
264
189
238
115
338
360
139
150
382
341
52
15.8
260
306
20
30
210
171
170.
169
130
Diam
eter
(in.)
IK4
3
6
36
36
IK
36
36
4-2
8
2
2
2
2
3
3
3
2
36
4-2
IK
IK
4-2
4-2
VAg
4
8-4
21
4
2
4-2
4-2
4
4
4-2
4-2
\\i
2
4-2
IX
IK2
4-2
4-2
a
4
Depth
of
casing
(ft.)
22
150
330
196
99
255
354
1S7
164
132
160
140
160
135
45
310
46
52
255
335
170
192
264
184
238
115
360
134
150
382
341
52
260
306
20
210
171
170
169
130
Water-bearing
material
Sand
do
do
do
Sand and clay
do
Sand
Sand and clay
do
Sand
do
do
do
do
do
Sand
do
do
Gravel
Sand and clay
Sand
do
do
do
Greensand
do
Sand
do
do
do
do
Sand
Sand
do
.. do
do
Sand
do
....do
do
do
....do
do
Sand
do
....do
Water
level
(ft.)
—9.9
13 0
—S.98
—11.8
—10 9
—30
—9.7
—16.8
\\ g
—32
Flows
Flows
—33
32
—6
—36
—13 5
17 46
—30
Flows
-31
-31
Yield
(gpm)
5
^=20
550
10
50
10
10
65
15
•'00
s =
5
5
Draw
down
(ft.)
±40
Remarks
Water level measured, 195G
Wati»r IpvoI mpnsurpil lQ'ifi
Water level measured per-
iodically by the U. S.
Geological Survey.
Water level measured, 1943
Water level measured 1956
Reported by driller.
Analysis. Public Supply.
Abandoned,
do
do
do
Abandoned,
do
do
Water level measured 1956
Aualysis. Public Supply.
Abandoned.
Water level measured, 1955.
Analysis.
Reported to flow periodically.
Analysis. Water level and
yield reported by driller.
Public Supply.
Yield reported by driller.
Water level measured 1956
Water level reported by driller.
Temperature. 61.5°F. •
Water level measured peri
odically by the U. S.
Geological Survey.
Water level reported by
driller. 1956.
Flow measured, 1954.
Water level reported by
driller, 1956.
Water level and yield reported
by driller, 1956.
40

i * "«J
TABLE 4. Rkcokds of Wklls in Bkutie County—Continued
Well
no.
51
52
53
54
55
50
57
5S
oil
CO
61
02
63
64
65
66
67
W
70
71
-9
73
74
75
76
77
Location
Rpnublicau
Drew
1*£ miles EXE of Drew
do
2 miles XE of Gra.***own
l j, mile W of Grat-">>wn
1?2 miles X of Wir-isor
9 miles XE of Wir**or
do
4 miles E of Winder
"?'•«> miles \W of ^"'ndsor
1 *Y milps W of WWisor
Windsor. ...
Windsor
do
do
do
do
44' miles XW of M-rry HU1
2\i miles XW of Mfrry Hill
13 i miles XW of M-rry HU1
Eden House 190 f—* W of
Chowan River ....
Merrv Hill
....do
do
4}i miles SE of Merry Hill
Owner
Clifton Ward
V. L. Jones
W. S. Austin
do
J. J Ethridge
F H Harden
Thompson Lumber Co...
Rov V* Thompson
....do
Green Cross Baptist
Church
Lea Lumber Co.
Lewis Powell
Town of Windsor
Town of Windsor
do
....do
do
do
T. S. Taylor
Cecil White
; C. Beasely
I Will Perrv
i R. J.MitchellBertie County Board of
1 Education
! R. L. Askew
! X. C. State Highway: Dept
\
Type
of
Well
Screen
do
Open
end
do
do
Driven
Open
end
do
Screen
Open
end
Screen
...do...
Gravel
wall
Gravel
wall
do
Screen
Gravel
wall
Screen
Open
end
Screen
...do...
Screeu
do
Driven
Screen
...do...
—do...
Depth
(ft.)
175
195
100
100
220
18
956
190
231
60
130
130
286
375
350
350
334
370
120
398
42
400
378
75
103
420
150
Diam
eter
(in.)
• 4
2
VA
VA2
Ui
9
4
4-2
IK
6
6
8
10
s
4
8
10
3-2
4-2
VA
4-2
4-2
4
4-2
4-2
Depth
of
casing
(ft.)
175
195
100
100
220
18
256
120
231
60
130
130
286
375
350
350
334
370
120
398
42
400
378
75
103
420
150
Water-bearing
material
do
.do
do
do
do
do
....do-
Sand
do
do
do .. .
do
....do
do
do
do
do
do
do
do
do
do
do
....do
Water
level
(ft.)
—25
Flows
—12
Flows
Flows
Flows
14.6
Flows
Yield
(gpm)
12
Draw
down
(ft.)
Remarks
Water level reported by well
owner, 1955
Yield measured, 1956.
Analysis. Temperature 63°F
Analysis.
Water level reported by well
owner, 1956
Public Supply. Analysis.
Analysis. Public supply.
Analysis. Public supply.
Abandoned.
Public supply Temperature
63°F.
Abandoned.
Analysis.
Analysis.
Water level measured peri
odically by the U. S. Geo
logical Survey.
X
TABLE 5. Chemical Analyses of Ground Water from Bertie County
(Numbers at heads of columns correspond to well numbers in table of well data)
(Parts per million)
Silica (SiO-0
Iron (Fe) total . .
Iron fFe) in solution
Calcium (Ca)
Bicarbonate (HCOa)
Sulfate (SO-0
Chloride (Cl)
Fluoride (F)
Xitrate (NO 3)
Dissolved solids
Hardness as CaCO 3
pH
Water-bearing material *
Date of collection. _._....__ . ...
11
49
.21
.02
47
3.6
15
175
5.3
12
.1
1.6
230
133
7.0
Sand
9-27-55
21
20
.58
.37
2.8
2.2
150
387
5.8
14
1.2
1.6
396
16
7.8
Sand
9-27-55
26
16
.00
7.7
6.6
96
311
.6
4.0
.4
.3
50
7.6
Greensand
9-28-55
28
51
.26
24
13
27
198
3.3
3.2
.7
.0
224
113
7.4
Greensand
7-3-47
58
447
23
14
6
8.2
Greensand
6-54
59
457
11
23
116
7.5
Greensand
6-54
Aualyied by the Quality of Water Branch, U. S. Geological Survey.
41

TABLE 5. Chemical Analyses of Ground Water fkom Bertie County—Continued
(Numbers at heads of columns correspond to well numbers in table of well data)
(Parts per million)
63 64 65 70 72
Silica (SiOa)
Iron (Fe), total
Iron (Fe), in solution
Calcium (Ca)
Magnesium (Mg)
Sodium and potassium (Na+K)
Bicarbonate (HCCb)
Sulfate (S04)
Chloride (Cl)
Fluoride (F)
Nitrate (NOa)
Dissolved solids
Hardness as CaCO 3
pH
Water-bearing material
Date of collection
19
.79
.53
3.3
1.8
249
413
52
115
2.5
1.0
664
16
7.8
Sand
15
.10
.07
.8
.4
273
420
56
137
3.4
.1
720
4
8.0
Sand
17
4.0
95
216
24
42
1.3
.1
316
59
6.9
Sand
8.7
1.8
.12
2.4
2.3
256
475
33
85
3.3
1.0
649
15
8.1
Sand
29
IS
107
403
11
24
1.3
144
7.8
Sand
9-27-55 9-27-55 5-17-49 3-29-50 9-27-55
Analyzed by the Quality of Water Branch, U. S. Geological Survey.
42
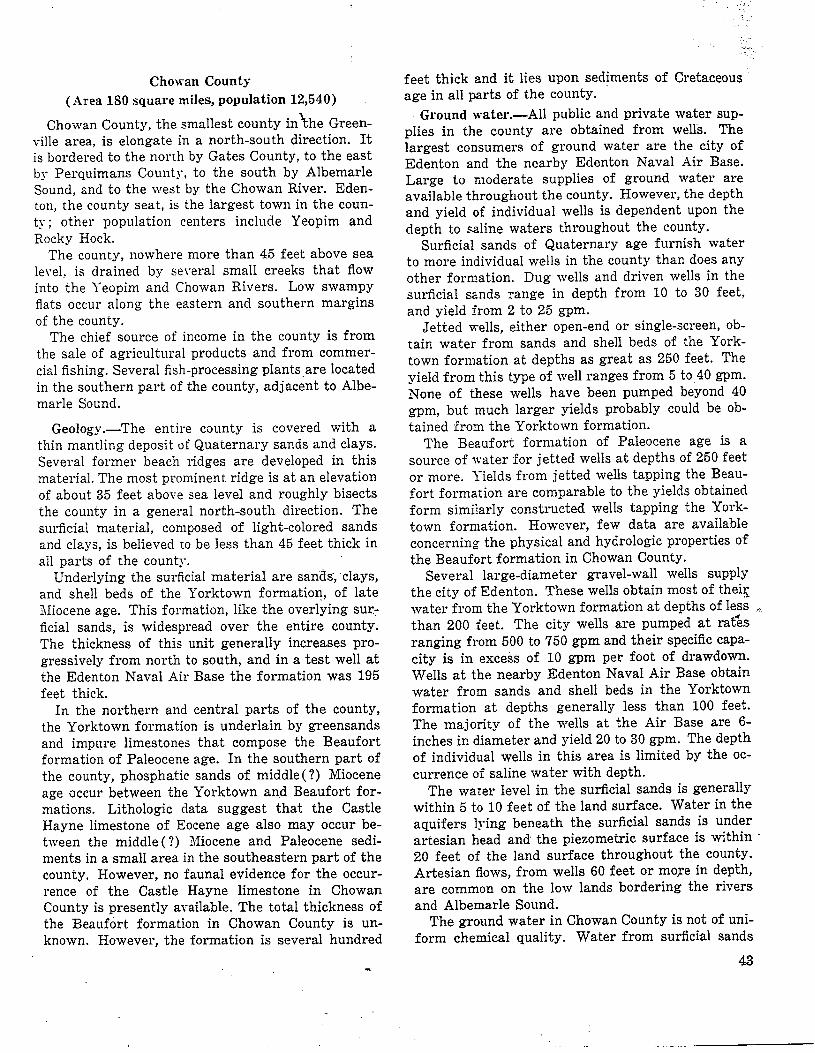
Chowan County
(Area 180 square miles, population 12,540)
Chowan County, the smallest county in\he Greenville area, is elongate in a north-south direction. It
is bordered to the north by Gates County, to the east
by Perquimans County, to the south by Albemarle
Sound, and to the west by the Chowan River. Eden-
ton, the county seat, is the largest town in the coun
ty; other population centers include Yeopim and
Rocky Hock.
The county, nowhere more than 45 feet above sea
level, is drained by several small creeks that flow
into the Yeopim and Chowan Rivers. Low swampy
flats occur along the eastern and southern margins
of the county.
The chief source of income in the county is from
the sale of agricultural products and from commer
cial fishing. Several fish-processing plants are located
in the southern part of the county, adjacent to Albe
marle Sound.
Geology.—The entire county is covered with a
thin mantling deposit of Quaternary sands and clays.
Several former beach ridges are developed in this
material. The most prominent ridge is at an elevation
of about 35 feet above sea level and roughly bisects
the county in a general north-south direction. The
surficial material, composed of light-colored sands
and clays, is believed to be less than 45 feet thick in
all parts of the county.
Underlying the surficial material are sands, clays,
and shell beds of the Yorktown formation, of late
Miocene age. This formation, like the overlying sur
ficial sands, is widespread over the entire county.
The thickness of this unit generally increases pro
gressively from north to south, and in a test well at
the Edenton Naval Air Base the formation was 195
feet thick.
In the northern and central parts of the county,
the Yorktown formation is underlain by greensands
and impure limestones that compose the Beaufort
formation of Paleocene age. In the southern part of
the county, phosphatic sands of middle (?) Miocene
age occur between the Yorktown and Beaufort for
mations. Lithologic data suggest that the Castle
Hayne limestone of Eocene age also may occur be
tween the middle (?) Miocene and Paleocene sedi
ments in a small area in the southeastern part of the
county. However, no faunal evidence for the occur
rence of the Castle Hayne limestone in Chowan
County is presently available. The total thickness of
the Beaufort formation in Chowan County is un
known. However, the formation is several hundred
feet thick and it lies upon sediments of Cretaceous
age in all parts of the county.
Ground water.—All public and private water sup
plies in the county are obtained from wells. The
largest consumers of ground water are the city of
Edenton and the nearby Edenton Naval Air Base.
Large to moderate supplies of ground water are
available throughout the county. However, the depth
and yield of individual wells is dependent upon the
depth to saline waters throughout the county.
Surficial sands of Quaternary age furnish water
to more individual wells in the county than does any
other formation. Dug wells and driven wells in the
surficial sands range in depth from 10 to 30 feet,
and yield from 2 to 25 gpm.
Jetted wells, either open-end or single-screen, ob
tain water from sands and shell beds of the York-
town formation at depths as great as 250 feet. The
yield from this type of well ranges from 5 to 40 gpm.
None of these wells have been pumped beyond 40
gpm, but much larger yields probably could be ob
tained from the Yorktown formation.
The Beaufort formation of Paleocene age is a
source of water for jetted wells at depths of 250 feet
or more. Yields from jetted wells tapping the Beau
fort formation are comparable to the yields obtained
form similarly constructed wells tapping the York-
town formation. However, few data are available
concerning the physical and hydrologic properties of
the Beaufort formation in Chowan County.
Several large-diameter gravel-wall wells supply
the city of Edenton. These wells obtain most of theij
water from the Yorktown formation at depths of less ,
than 200 feet. The city wells are pumped at rates
ranging from 500 to 750 gpm and their specific capa
city is in excess of 10 gpm per foot of drawdown.
Wells at the nearby Edenton Naval Air Base obtain
water from sands and shell beds in the Yorktown
formation at depths generally less than 100 feet.
The majority of the wells at the Air Base are 6-
inches in diameter and yield 20 to 30 gpm. The depth
of individual wells in this area is limited by the oc
currence of saline water with depth.
The water level in the surficial sands is generally
within 5 to 10 feet of the land surface. Water in the
aquifers lying beneath the surficial sands is under
artesian head and the piezometric surface is within
20 feet of the land surface throughout the county.
Artesian flows, from wells 60 feet or more in depth,
are common on the low lands bordering the rivers
and Albemarle Sound.
The ground water in Chowan County is not of uni
form chemical quality. Water from surficial sands
43

is generally corrosive and often contains objection
able amounts of iron. "Water from the sand and shell
beds of the Yorktown formation is moderately hard,
but otherwise of good chemical quality. The Beau
fort formation contains waters that range from soft
to moderately hard.
The chloride content of waters from both Miocene
and Paleocene strata is often very high in areas ad
jacent to Albemarle Sound. According to Mundorff
(1945, p. 33) a test well drilled at the Edenton Naval
Air Base tapped water with a chloride content of 900
ppm. at a depth of 250 feet, 2,400 ppm. at a depth of
290 feet, and 3,000 ppm. at a depth of 420 feet. The
upper sample (250 feet) was obtained from mid
dle (?) Miocene strata, the middle sample (290) feet
from middle (?) Eocene strata, and the lower sample
(420 feet) from Paleocene strata. The fresh water-
brackish water boundary at Edenton has not been
accurately determined, but available data indicate
that this boundary lies between 250 and 300 feet
below land surface. A well at the Chowan County
High School, 13 miles north of Edenton, yields wa
ter containing 900 ppm. of chloride at a depth of 320
feet. A recently drilled well at the same location •
yields water containing 220 parts per million at a
depth of 420 feet. Fresh water may underlie brack-
ish waters in other parts of the county also.
The following well log gives a physical description
of'the principal aquifers in Chowan County (see
figure 7 for location).
Chowan County
, ; Well Number 42
Location: Test well at Edenton Naval Air Base, 4 miles east
~ of Edenton, North Carolina. ••: :.
Owner: U. S. Navy ;.
Date drilled: 1943 . ...... \
Driller: Heater Well Co.
Elevation of well: 14.8 feet above sea level
Hydrologic Information
Diameter of well: 6 inches
Depth of well: 420 feet
Cased to: 420 feet
Static (nonpumping) water level: Unknown
Yield: Unknown
Finish: Abandoned due to poor yield and and excessive chlo-
/; -S.*• 7 ride below 180 feet. 7. . , "• -
'■^'-'t'^-' .'":' Log of Weil :';:.,;'' .;;J^\';Depth '■■.:I-'V.v •• :•- • ' •■■■; •"■;■■'.•■..■. " '; ' ' '
(feet) f-t' -V^ ' ; .-■ ' •" -• :V ..Quaternary—surlicial sands and clays ~
■0-10 Sand and clay, gray; 60 percent fine-grained angular
"V^;^ J.quartz..sand. 40 percent gray clay matrix, unconsoli-
dated. Trace of fine-grained ilmenite. No microfos-
20-30 Sand, gray; 85 percent medium-grained subrounded
well-sorted quartz sand. 15 percent gray clay matrix,
unconsolidated. No Ostracoda, Foraminifera very
rare. ';•'"'.." :
30-36 Sand, white; 95 percent medium to fine-grained sub-
angular quartz sand. 5 percent tan clay matrix, un
consolidated. No Ostracoda, Foraminifera very rare.
36-45 Sand, gray; 80 percent medium to fine-grained sub-rounded to subangular quartz sand. 20 percent gray
clay matrix, unconsolidated. No Ostracoda, Foramini
fera very rare.
Upper Miocene—Yorktown formation
45-60 Marl, gray; 55 percent medium to fine-grained subangular quartz sand. 25 percent coarse broken
abraded shell fragments. 20 percent blue-gray clay
matrix, unconsolidated but compact. Ostracoda com
mon, Foraminifera abundant.
60-72 Marl, gray; 45 percent fine-grained angular quartz
sand. 20 percent fine broken shell fragments. 35 per
cent blue-gray clay matrix, unconsolidated but com
pact. Ostracoda common, Foraminifera abundant.
72-80 Marl, gray; 30 percent medium-grained subangular
quartz sand. 50 percent coarse broken abraded shellfragments. 20 percent blue-gray clay matrix, uncon
solidated. Ostracoda common, Foraminifera abun
dant.
80-90 Marl, gray; 60 percent medium to fine-grained sub-rounded quartz sand. 10 percent fine broken shell
fragments. 30 percent blue-gray clay matrix, uncon
solidated. Ostracoda and Foraminifera common.
90-100 Marl, gray; Same as 80-90-foot interval. Ostracoda
and Foraminifera abundant.
100-110 Marl, gray; Same as 80-90-foot interval. Ostracoda and
Foraminifera abundant.
110-120 Marl, gray; Same as 80-90-foot interval, with a slightincrease in percentage occurrence of clay. Ostracoda
and Foraminifera abundant. : •
120-140 Marl, gray; Same as 110-120-foot interval. Ostracoda
and Foraminifera abundant. ^
150-170 Marl, gray; 20 percent very fine-grained ^angularquartz sand. 15 percent fine broken shell fragments.
65 percent blue-gray clay matrix, unconsolidated.
Ostracoda and Foraminifera abundant.
170-1SO Clay, gray; 10 percent fine to very fine-grained angularquartz sand. 90 percent blue-gray clay matrix, un
consolidated but very compact. Trace of broken shell
fragments. Ostracoda and Foraminifera common.
180-200 Clay, gray; Same as 170-180-foot interval. Ostracoda
and Foraminifera common.
200-220 Clay, gray; Same as 170-180-foot interval. Ostracoda
and Foraminifera common. ' "'" ',';t
220-240 Clay, gray; Same as 170-180-foot interval with/a'UOpercent increase in quartz sand. Ostracoda}and
Foraminifera common. ;-v;
Ostracoda from the 45-220-foot intervals include:
Paracytfieridea vanderiboldi Puri ' ]}:""'.Murrayina martini (Ulrich and Bassler)
OHonina vaughani (Ulrich and Bassler)

4,i
Hem-Icythere conradl Howe and McGuirt 1
Hemicythere confragosa Edwards
Loxoconcha purisubrhomboidea Edwards
Cytheretta reticnlata Edwards ^Cushmanidea ashermani (Ulrich and Bassler)
Middle(f) Miocene—unnamed unit :
240-243 Phosphatic sand, dark-brown; 20 percent fine to,med
ium-grained, angular to subangular quartz sand. 35
percent medium-grained brown collophane spherules
and shards. 45 percent dark-brown silt and clay, mat
rix, unconsolidated. Trace of broken shell fragments.
No Ostracoda, Foraminifera very rare.
245-255 Phosphatic sand, dark-brown; Same as 240-245-foot
interval with a slight increase in shell content. No
Ostracoda, Foraminifera very rare. j
i
Middle(?) Eocene—Castle Hayne(?) limestone
255-270 Calcareous sand, gray; 60 percent medium-grained
subangular to subrounded quartz sand. 40 percent
gray shell limestone matrix, indurated and moderate
ly consolidated. Dark-green medium-grained glauco-.
nite prominent. No Ostracoda, Foraminifera very '
rare.
270-2S0 Sandy limestone, white; 35 percent medium to fine
grained angular quartz sand. 65 percent white lime
stone matrix, indurated and moderately hard. Trace
of dark-green fine-grained glauconite. No Ostracoda,
Foraminifera very rare. •;
2S0-290 Sandy limestone, white; Same as 270-2S0-foot j inter
val, but very hard. No microfossils.
290-310 Sand, white; 95 percent coarse to medium-grained
subangular to subrounded quartz sand. 5 percent
white calcareous clay matrix, unconsolidated. No
Ostracoda, Foraminifera very rare. ---.-■ < _
Paleocene—Beaufort formation
310-320 Sand and clay; light-gray; 45 percent fine to medium-"
grained angular quartz sand. 40 percent gray clay
matrix, unconsolidated. 15 percent dark-green fine
grained glauconite and coarse mica flakes. Ostracoda
and Foraminifera common.
320-340 Sand and clay, light-gray; iSaine'te'sib-Sio-foc1'7'-"''""*^val. Ostracoda and Foraminifera common. 1...
340-360 Clay and sand, gray; 30 percent medium-grained
rounded water-polished quartz sand. 60 percent 7^
micaceous clay matrix, unconsolidated but very com—^pact. 10 percent dark-green medium to coarse-grained
glauconite. Ostracoda and Foraminifera common. *•
360-370 Clay and sand, gray; Same as 340-360-foot interval.
Ostracoda and Foraminifera common.
370-3S0 Glauconitic sand, "salt and pepper"; 45 percent fine
to medium-grained angular quartz sand. 30 percent
dark-green medium-grained glauconite. 25 percent
gray calcareous clay matrix, indurated and loosely
consolidated. Trace of authigenic pyrite aggregates.
Ostracoda and Foraminifera rare.
3S0-400 Glauconitic sand and clay, light-green; 40 percent
medium to coarse-grained subrounded quartz sand.
30 percent dark-green medium-grained glauconite. 30
percent green clay matrix, unconsolidated. Ostracoda
and Foraminifera rare.
400-420 Glauconitic sand and clay, light-green; Same as 330-
400rfoot interval. Ostracoda and Foraminifera rare.
Ostracoda from the 310-400-foot intervals include: .
Gytheridea (Eaplocytheridea) hopkinsi Howe and
Garret
Gytheridea (Haplocytheridea) moodyi Howe and
Garrett
Gytheridea (Glithrocytheridea) virginica (Schmidt)
Gytherura sp. aff. C. oxycruris Munsey
Brachycythere interrasilis Alexander
Brachycythere formosa Alexander
Trachyleoeris prestxoichiana (Jones and Sherborn)
Tracliyleberis fcossleri (Ulrich) : ":
Gytheromorpha sp. aff. G. scrooiculata Alexander
Remarks: No Ostracoda were recovered from the interval
designated as middle(?). Miocene or middle(?) Eocene. Corre
lation is based on lithologic similarity to middle (?) Miocene
and Middle (?) Eocene strata in nearby wells. The interval
designated as the Beaufort formation of Paleocene age carries*-,
an ostracode faunule having many lower Eocene forms and is
regarded by the writer as somewhat younger than other Paleo
cene units recognized in this study. The top of the Paleocene
unit is marked by the first occurrence of Brachycythere inters,
rasilis Alexander.
45

MAP OF
CHOWAN COUNTY
showing the locations of water supplies.
of Miles
I 2 3 4 5
ALBEMARLE
FlQUBE 7.
46

--'-r-J,
«' J
TABLE 6. Records of Wells ix Chowan County
Well
no.
Location Owner
Type
of
Well
Depth
(ft)
Diam
eter
(in.)
Depth
of
casing
(ft)
Water-bearingv;
material
Water
kvel
(ft)
Yield
(gpm)
Draw
down
(ft)
Remarks
7
8
9
10
11
12
13
14
15
16
17
18
19
20
21
22
23
24
25
26
27
28
29
30
31
32
33
56
Rt. 32, M mile S of Gates-
Chowan County Line
Rt. 32, 1 mile S of Gates-
Chowan County Line
2 miles NW of Ryland
Rt. 31, Gates-Chowan Co. Line.
...do -
C. A- White.
T. Berryman
G.H. Baker
J.Spirey
I. Bynum
Screen
—do...
-do...
Dug
Screen
x/i mile SE of Cannon Ferry
H mile S. of Cannon Ferry
...do
0. Cline
A. Ward
R. C. Nixon
..do.,
-do..
Dug
}4 mile E of Ryland
1 mile SE of Cannon Ferry
...do
X mile N of Small's X-Roads. .
X mile N of Small's X-Roads..
H mile W of Small's X-Roads..
...do
Small's X-Roads.-
Tyner
.do..
L mile S of Small's X-Roads
3 mile W of SmaU's X-Roads
4 mile W of Mavaton
2 miles W of Mavaton
Rocky Hock _
1 mile SW of Mavaton
2 miles S of Rocky Hock..
Valhalla ._ ....
1 mile S of Valhalla
3 miles NE of Hancock
W. J. Outland
E. Elliot
R. Howerwell
County High School...
County High School..
Conroy Peny
J. Ward
Z. W.Evans
Tyner School
C.Bdeh
Negro County School.
Oak Grove School
do..
Screen
...do..
..do..
Screen
...do..
-do.,
—do..
—do..
-do..
..do.,
-do..
J. Lane
B. W. Evans
Rocky Hock Church....
Chovran County Home..
W. Bynum
Valhalla Esso Station...
D. ILHare
C.H. Barber
VA miles E of Hancock...
Hancock
0.7 mile S of Macedonia..
2 miles E of Hancock
...do
H.Boss
C. T. Dixon
—do..
...do..
-do..
Screen
...do..
...do..
Dug
Open
end
Screen
CKBeleh
D. Jones
J.R-Peele
VA miles S of Hancock.. W. Morris..
1M miles S of Hancock
2 miles NW of Yeopim
H mile SE of Yeopim
4 miles SE of Yeopim
5 miles SE of Yeopim. ...
B.C. Hare
J. Sawyer
J. Webb
M.Jethro
J. G. Wood
IX miles S of St Johns
Edenton Naval Air Base
....do
...do
Edenton Naval Ah Base
...do
...do ......—.
...do
...do
...do..
...do.... —
H mile W of Naval Air Base.
1H miles E of Edenton
Edenton, Virginia Bd.
J.C.Cobb
U. S. Navy
....do
....do
...do...
Dug
Open
end
Screen
...do..,
Dug
...do..
Screen
Open
end
Screen
...do..
U. S. Navy
...do
...do
...do..
...do..
Screen
...do..
...do.
..do..
...do..
..do..
..do.
..do.
..do.
A. L. Gray
T.E.Harrell....
City of Edenton..
Edenton, Freemason Street
Edenton. .——._■—......
—do-
.do-
do - —do—
...do.
...do.
...do-
Gravel
wall
...do..
Open
end
—do..
415
432
416
11.0
320
438
424
10
412
403
320
420
416
414
216
65
210
13
35
10
280
50
13
75
15
210
35
9.1.
250
240
8
22
20
75
25
269
420
80
40
55
55
52
112
114
105
65
175
358
290
212
214
4-2
4-2
4-2
36
4-2
4-2
4-2
36
36
4-2
4-2
6
4-2
4-2
4-2
IX
4
2
4-2
24
2
4-2
2
36
4-2
36
4
2
2
36
36
IX
2
IX
2
4
8
8
8
18.8
2
3
10-8
24-12
8
415
430
416
10
320
438
424
10
7
412
403
320
420
416
414
30
30
216
35
219
10
35
10
280
50
12
75
210
35
225
236
240
4
4
20
75
25
269
420
55
40
32
112
114
105
65
175
358
290
212
214
Sand...
..do..
..do..
..do.. —7.0
..do..
..do..
..do..
..do..
....do
...do
....do
....do
Sand
....do
do
-S.4
—6.7
.do
do ... -6.3
.do..
,_do..
....do —6.9
...do
...do
...do
Sand
...do.
Shell
Sand and Clay.. -S.I
Shell...
Sand...
....do.. —27.0
....do
Sand and Clay -
Shell..
Sand...
-6.6
—9.0
W.O
—do..
Sand and Clay.
—do
.do
6.6
S.4
Shell -—
Sand
Shell Limestone..
....do
Sand and Shell..
Sand and Shell...
....do
..-do
do
....do
do
.do
.do
.do...-—.
Shell limestone..
Sand and Shell
—do
....do,--
500
750
Water Wei measured.
• 9/23/43
Chloride. 1300 ppm. (State
Board of Health, 7/12/37)
Abandoned.
Water kvel measured,
9/1S. 43.
Water fevel measured 9/23/43.
Analysis. Abandoned.
Water level measured 9/27/55
Abandoned. Water level mea
sured 0/22/43
Abandoned. Water level mea
sured 9/18/43.
Flows
Flows
Water kvel measured.9/17/43.
Water kvel reported by driller,
1955.
Water kvel measured. 1955^
»"• •
Water kvel reported by driller,
1944.
Water kvel reported by driller,
1955.
Water kvel measured, 1943.
Water kvel measured, 1943.
Analysis-
Analysis. Abandoned.
Analysis. Abandoned.
Analysis. Public supply.
Yield measured, 1956.
Analysis. Public supply.
Analysis. Public supply.
",;47

Well
no.
57
58
59
60
61
62
63
64
65
66
67
68
Location
Edenton
....do
....do
....do
....do -
....do
....do
11*> miltks YV of Eden ton
....do
....do.....
2 miles W of Edenton
1 mile W of Edenton
TABLE 6. ]
Owner
Edenton Peanut Company
C. Y.Parrish
D. Pruden
Conger Ice Plant
....do
Albemarle Peanut Co
G. S. Harrem
U. S. Fish and Wildlife
....do
....do
....do
J. W. Bembridgc
Edenton Bay Packing Co.
Records of Wells ix
Type
of
Well
Open-
end
...do...
...do...
...do...
Screen
Open-
end
Screen
Opcn-
...do...
...do...
...do...
Screen
...do...
Depth
(ft)
90
22
55
60
100
70
65
91fi
236
208
60
35
212
Diam
eter
(in.)
IK
IK
IK
5-3
6
IK2
3
4
2
2
6
Cuowax Coi-nty—Contxn ued
Depth
of
casiug
(ft.)
90
22
45
60
100
i
t 65
' 65
88
195
; 208
j 60
i 35
21°
Water-bearing
material
Sand and Shell
do
do
....do
do
do
....do
....do
....do
....do
Water
level
(ft.)
Yield
(gpni)
200
!
Draw
down
(ft.)
Remarks
Analysis.
Water yield measured, 1956.
Chloride, 153 ppm., 194o.
Chloride, 203 ppm., 1945.
Chloride, 22 ppm 1945.
TABLE 7. Chemical Analyses oi? Ground Water from Chowax County(Numbers at heads of columns correspond to well numbers in table of well data)
(Parts per million)
41 45 50 53 54
Silica f.3iO2)
Iron j'Fe), total
Iron (Fe), in solution
Calcium (Ca)
Magnesium (Mg)
Sodium and potassium \Na+K)..
Bicarbonate (HCO3)
Sulfate (SO4)
Chloride (Cl)
Fluoride (F)
Nitrate (XO3)
Dissolved solids
Hardness as CaCO3
pH
46
.05
60
5.4
51
7.1
50
.33
249
10
58
45
547
524
83
710
297
1738
330
Water-bearing material.. Sand Shell
limestone
104
7.S
23
374
l.S
23
.2
.1
40S
292
7.1
Sand
and shell
102
6.6
13
355
2.6
11
0.3
.0
366
282
6.9
Sand and
shell
58
13
174
477
32
106
1.0
198
7.4
Shell
limestone
Date of collection. 6-27-44 10-21-42 3-20-45 9-19-45 5-24-47
52
.05
59
14
134
464 .
31
85
.8
.3
639
205
8.3
Sand and
shell
1-16-56
Analyzed by the Quality of Water Branch, U. S. Geological Survey.
55
Silica (SiOa)
Iron iTe), total
Iron (Fe), in solution
Calcium (Ca)
Magnesium (Mg)
Sodium and potassium (Na-f-K).
Bicarbonate (HCO3)
Sulfate (CO4)
Chloride (Cl)
Fluoride (F)
Nitrate (NOa)
Dissolved solids
Hardness as CaCO3
pH
65
28
120
227
70
75
.10
.0
.0
210 228
Water-bearing material. Sand and
shell
Sand and
shell
Date of collection. 1-20-33 Jan. 1943
Analyzed by the Quality of Water Branch, U. S. Geological Survey.
48

Gates County -^
(Area 343 square miles, population 9,555)
Gates County lies in the extreme northeast corner
of the area included in this report. The county,
which abuts Virginia to the north, is bordered by
Camden, Pasquotank, and Perquimans Counties to
the east, by Chowan County to the south, and by the
Chowan River to the west. Gatesville, the county
seat., is the largest town in the county; other popu
lation centers include Sunbury, Roduco, Gates, Eure,
and Hobbsville.
With the exception of Bennetts Creek, which
drains into the Chowan River, there are no large
streams within the county. Drainage is largely ef
fected by short, meandering streams that feed the
large swamps bordering much of the county. An
extensive area along the eastern edges of the county
is occupied by the Dismal Swamp, and extensive
areas along the southern and western edges of the
county are bordered by Chowan Swamp.
The sale of agricultural products, chiefly peanuts,
is the major source of income in the county. In addi
tion, small, local lumber and sawmill operations are
common in the County.
Geology.—The entire county is mantled by sands
and clays of Quaternary age, ranging in thickness
from 15 to 40 feet. This material, composed of
light-colored iron-stained sands and clays, occurs at
elevations ranging from nearly 80 feet in the north
western part of the county to less than 20 feet in
the southeastern part of the county. Several former
beach ridges are developed in this material, particu
larly in a northeast direction from Hobbsville and
Sunbury. The height of these fossil beach ridges is
everywhere less than 10 or 15 feet.
Underlying the surficial material are clays, sands,
and shell beds of the Yorktown formation of late
Miocene age. Individual beds within the formation
are lenticular and cannot be traced from well to well
in the subsurface. In any one locality the Yorktown
formation consists of a blue-gray marine clay with
subordinate occurrences of lenticular sand and shell
beds. In a recently drilled well (1956) at Gatesville
the Yorktown formation was 126 feet thick. It is
thought that the formation is somewhat less than
100 feet thick west of Gatesville, and that it is not
more than 150 feet thick east of Gatesville.
Underlying the Yorktown formation in central
parts of the county are deposits of middle (?) Mio
cene age. The deposits, which are as much as 30
feet thick in the vicinity of Gatesville, are composed
of brown phosphatic clays and interbedded sands.
The phosphate, occurring as collophane, is in the
form of brown, sand-sized spherules and shards
showing banded and concentric structure. The phos
phate generally amounts to less than 20 percent of
the total sample and nowhere within the county is
as abundant as in deposits of similar age in Beau
fort and Washington Counties to the south. The
deposits of middle (?) Miocene age in Gates County
were not deposited in the same basin of deposition
as deposits of comparable age in Beaufort and Wash
ington Counties to the south.
The middle (?) Miocene deposits in Gates County
were deposited in a less-restricted depositional en
vironment than were deposits of comparable age in
Beaufort and Washington Counties. West of Gates
ville no subsurface information is presently available
to indicate the presence of middle (?) Miocene de- -,
posits. These deposits are probably absent west of
Gatesville.
Underlying the middle (?) Miocene deposits in the
central part of Gates County and the Yorktown for
mation in western and eastern Gates County are de
posits of Paleocene age, the Beaufort formation. The
Beaufort formation in this county is composed pri
marily of interbedded and lenticular sand and calcar
eous clay facies containing variable amounts of glau-
conite. The glauconite ranges from a trace in light-
colored sands to as much as 70 percent in the dark
to apple-green "greensands." Euhedral crystals of
authigenic pyrite occur in sufficient abundance so as
to give well cuttings a metallic sheen. In the absence
of microfossils this authigenic pyrite serves as a
guide to the presence of Paleocene strata; euhedral
pyrite is noticeably absent from underlying and over
lying sediments. The thickness of the Beaufort for
mation in Gates County increases from west to east
across the county. In the central part of the county,
according to a study of well cuttings the formation
is more than 300 feet thick, and in the western part
of the county it is no more than 150 feet thick. Ex
amination of incomplete samples from several wells
suggests that the formation may be more than 400
feet thick in the eastern part of the county.
Underlying the Beaufort formation within the
county are sediments of Late Cretaceous age, the
Peedee formation. The Peedee formation is com
posed of drab-black lenticular sands and clays that
contain lignitized wood fragments and minor
amounts of glauconite. No wells have been drilled
deep enough in this area to pass entirely through
49

the Peedee formation and, therefore, no information
is available regarding its total thickness. Accordingto LeGrand and Brown (1955, fig. 2), the top of thePeedee formation lies about 300 feet below sea levelin the western part of the county and about 700 feetbelow sea level in the eastern part of the county.Older Cretaceous formations underlie the Peedee
formation throughout the county.
Ground water.—Gates County is the only county
in the Greenville area that has no public water sys
tems. All domestic supplies are obtained from wells,and as many as 7 or 8 families often obtain their
water supply from a single well.
Surficial sands of Quaternary age and near-sur
face shell and sand beds of the Yorktown formationare tapped by large numbers of dug and driven wellsthat range in depth from 10 to 60 feet. The yieldfrom this type of well ranges from several to 20 gpm.
Sand and shell beds in the Yorktown formation andmiddle (?) Miocene strata below depths of 60-80-feetare infrequently utilized as aquifers. However, Miocene strata are capable of yielding small to copious
supplies of water throughout the county.
Jetted and drilled wells obtain water from theBeaufort formation and the upper beds of the Peedeeformation at depths of as much as 300 feet in thewestern part of the county and at depths slightlymore than 600 feet in the eastern part of the county.
Such wells, rarely greater than 4 inches in diameter,
yield 5 to 50 gpm throughout the county.
Water occurring at depths greater than 40 to 50feet throughout the county is under artesian pres
sure and will rise to within 5 to 30 feet of the landsurface at most places. Flowing wells are common
along the low land bordering the Chowan River, and
several flows occur in and near Gatesville.
The chemical quality of the water is adequate for
most domestic purposes. Water from the shallow
sands is soft but may be corrosive and may contain
objectionable quantities of iron. Water from thedeeper aquifers is soft sodium bicarbonate water.Water from the Paleocene and Cretaceous aquifers,
particularly in the vicinity of Gatesville and Sun-
bury, contains excessive amounts'of fluoride, as muchas 6 to 8 ppm, but otherwise the water is of accept
able quality. In the vicinity of Hobbsville, brackish
waters occur at a depth of about 600 feet.
The following log describes the physical character
istics of the aquifers that occur above the UpperCretaceous formations in Gates County. (See figure
8 for location.
Gates County
Well Number 49
Location: County Office Building, Gatesville, North Carolina.
Owner: Gates County
Date drilled: 195G
Driller: Magette Well and Pump Co.
Elevation well: 27 feet above sea level
Hydrologic Information
Diameter of well: 4-2 inches
Depth of well: 483 feet
Cased to: 4S3 feet
Finish: screens
Static (nonpumping) water level: 5.5 feet below land surface,
1956
Temperature: 63°F
Log of Well
Depth
(feet)
Quaternary—undifferentiated
0-10 Sand and clay, yellow; 60 percent fine to very fine
grained angular quartz sand. 40 percent yellow clay
matrix, unconsolidated. Limonitic staining of quartz
grains predominant. No microfossils.
10-20 Sand, white; 80 percent very fine to medium-grainedangular to subangular quartz sand. 20 percent white
clay and silt matrix, unconsolidated. Trace of light-
green glauconite and black opaques. No microfossils.
Upper Miocene—Yorktown formation
20-30 Sand, tan;'85 percent very fine to fine-grained angularfeldspathic quartz sand. 15 percent tan silt and clay
matrix, unconsolidated. Trace of broken and abraded
shell fragments. Ostracoda and Foraminifera rare.
30-42 Marl, gray; 45 percent fine to medium-grained angularquartz sand. 30 percent biue-gray clay and silt mat-,
rix, unconsolidated. 25 percent broken and abraded
shell fragments. Trace of dark-green glauconite.
Ostracoda and Foraminifera abundant.
42-52 Marl, gray; Same as 30-42-foot interval. Ostracoda
and Foraminifera abundant.
52-63 Marl, gray; 35 percent fine to medium-grained angu
lar quartz sand. 40 percent blue-gray silt and clay
matrix, unconsolidated. 25 percent broken shell frag
ments; sponge spicules prominent. Trace of dark-
green glauconite and mica flakes. Ostracoda and
Foraminifera abundant.
63-73 Marl, gray; Same as 52-63-foot interval. Ostracoda and
Foraminifera abundant.
73-S4 Clay, blue-gray; 15 percent very fine to fine-grained
angular quartz sand. 70 percent blue-gray clay mat
rix, unconsolidated but compact. 15 percent white
broken and abraded shell fragments; sponge spicules
prominent, trace of dark-green glauconite. Ostracoda
and Foraminifera abundant.
50

84-94 Clay, blue-gray; Same as 73-84-foot interval. Ostracoda
and Foraminifera abundant. ^
D4-105 Marl, blue-gray; 40 percent very tine to medium-grained, angular to subangular quartz sand. 30 percent
blue-gray micaceous clay matrix unconsolidated. 30
percent broken and abraded shell fragments; sponge
spicules prominent. Trace of dark-green glauconite.
Ostracoda and Foraminifera abundant.
105-115 Clay, blue-gray; 20 percent very fine to fine-grained
angular quartz sand. 70 percent blue-gray clay ma
trix, unconsolidated but compact. 10 percent broken
shell fragments; sponge spicules prominent. Trace
of dark-green glauconite. Ostracoda and Foramini
fera abundant.
115-12G Clay, blue-gray; Same as 105-115-foot interval. Ostra
coda and Foraminifera abundant.
126-136 Clay, blue-gray; Same as 105-115-foot interval. Ostra
coda and Foraminifera abundant.
136-147 Marl, blue-gray; 25 percent very fine to medium-grained angular quartz sand. 40 percent blue-gray
clay matrix, unconsolidated. 20 percent broken shell
fragments; sponge spicules prominent. 15 percent
dark-green fine-grained glauconite. Ostracoda and
Foraminifera abundant.
147-157 Marl, blue-gray; Same as 136-147-foot interval, but
with a trace of brown spherulitic collophane. Micro-
fossils rare.
Ostracoda from the 20-157-foot interval include:
Cythencra elongata Edwards
Puriana rugipunctata (Ulrich and Bassler)
Actinocythereis mundorffi (Swain)
Actinocythereis exanthemata (Ulrich and Bassler)
Orionina vaughani (Ulrich and Bassler)
Hemicythere laevieula Edwards
Hemicythere conradi Howe and McGuirt
Hemicythere confragosa Edwards
Loxoconcha purisubrhombo idea Edwards
Cytheretta sp. aff. C. karlana Howe and Pyeatt
Cushmanidea ashermani (Ulrich and Bassler)
Middle(f) Miocene—unnamed unit
157-168 Phosphatic sand and clay, brown; 45 percent mediumto fine-grained angular water-polished quartz sand.
35 percent brown clay matrix, unconsolidated. 20
percent brown medium-grained spherulitic collo
phane. No Ostracoda, Foraminifera rare.
168-17S Phosphatic sand and clay, brown; Same as 157-168-foot interval, but containing indurated streaks. No
Ostracoda, Foraminifera very rare.
No ostracodes were recovered from the 157-158-foot
interval. Age determination is based on the presence
of Siphogenerina lamellata Cushman, the only Foram
inifera recovered from the 157-17S-foot interval.
Paleocene—Beaufort formation
17S-189 Glauconitic sand and clay, green; 40 percent fine tocoarse-grained angular to subangular quartz sand.
35 percent green to gray clay matrix, unconsolidated
to indurated in streaks. 25 percent dark-green
medium to coarse-grained glauconite with pyrite filled
fissures. Trace of coarse broken shell fragments.
Ostracoda and Foraminifera rare.
1S9-200 Glauconitic sand and clay, green; Same as 17S-1S9-
foot interval, but with prominent euhedral pyrite
crystals. Ostracoda and Foraminifera common.
200-210 Glauconitic sand and clay, green; Same as 1S9-200-
foot interval. Ostracoda and Foraminifera common.
210-220 Glauconitic sand, green; 25 percent medium to fine
grained subrounded to subangular quartz sand. 20
percent gray to white calcareous clay matrix, un
consolidated to indurated in streaks. 40 percent dark-
green coarse to medium-grained glauconite. 15 per
cent broken shell and sandy limestone fragments.
Euhedral pyrite crystals prominent. Ostracoda and
Foraminifera abundant.
220-231 Glauconitic sand, green; Same as 210-220-foot inter
val. Ostracoda and Foraminifera abundant.
231-241 Glauconitic sand, green; Same as 210-220-foot interval.
Ostracoda and Foraminifera abundant.
241-252 Glauconitic sand, green; Same as 210-220-foot inter
val. Ostracoda and Foraminifera abundant.
252-262 Glauconitic sand, "salt and pepper"; 55 percent med
ium to coarse grained angular to subrounded quartz
sand. 20 percent gray to white calcareous clay ma
trix, unconsolidated to indurated in streaks. 25 per
cent dark-green medium-grained glauconite. Pyrite
prominent as euhedral crystals and as a fine-grained
mass filling fissures in glauconite grains. Trace of
shell and sandy limestone fragments. Ostracoda and
Foraminifera common.
262-273 Glauconitic sand, "salt and pepper"; Same 252-262-
foot interval. Ostracoda and Foraminifera common.
273-283 Glauconitic sand, "salt and pepper", Same 252-262-
foot interval. Ostracoda and Foraminifera common.
2S3-294 Glauconitic sand, "salt and pepper", Same 252-262-
foot interval. Ostracoda and Foraminifera common.
294-304 Glauconitic sand, "salt and pepper"; Same as 252-
262-foot interval, with a slight increase in clay ma
trix. Ostracoda and Foraminifera abundant.
304-315 Glauconitic sand, "salt and pepper"; Same 294-304-foot
interval. Ostracoda and Foraminifera abundant.
315-326 Glauconitic sand, "salt and pepper"; Same as 294-304-
foot interval. Ostracoda and Foraminifera common.
326-330 Sand, "salt and pepper"; 65 percent coarse to fine
grained subrounded to subangular quartz sand. 20
percent gray silt and clay matrix, unconsolidated. 15
percent dark-green coarse-grained glauconite. Euhed
ral pyrite crystals prominent. Trace of broken shell
and limestone fragments. Ostracoda and Foramini
fera rare.
336-347 Sand, "salt and pepper"; Same as 326-336-foot interval.
Ostracoda and Foraminifera very rare.
347-352 Sand, "salt.and pepper"; Same as 326-336-foot interval.
Ostracoda and Foraminifera very rare.
352-358 Sand, "salt and pepper"; Same as 326-336-foot interval.
Ostracoda and Foraminifera very rare.
35S-367 Sand and clay, gray; 60 percent coarse to fine-grained
subrounded to subangular quartz sand. 35 percent
gray clay matrix, unconsolidated. 5 percent dark-
green coarse-grained glauconite. Trace of euhedral
pyrite crystals. Red hematite staining of sand matrix
prominent. Ostracoda and Foraminifera common.
51

367-378
378-388
388-399
399-410
410-420
420-430
430-441
441-452
Sand and clay, gray; Same as 358-367-foot interval.
Ostracoda and Foraminifera common.
Sand and clay, gray; Same as 358-367-foot interval.
Ostracoda and Foraminifera common.
Sand and clay, gray; Same as 358-367-foot interval.
Ostracoda and Foraminifera common.
Sand and silt, gray; 65 percent coarse to fine-grainedsubrounded to angular quartz sand. 30 percent gray
silt matrix, unconsolidated. 5 percent dark-green
coarse-grained glauconite. Eunedral pyrite crystalsprominent. Trace o£ broken and abraded shell frag
ments. Ostracoda and Foraminifera rare.
Sand and silt, gray; Same as 399-410-foot interval.
Ostracoda and Foraminifera rare.
Sand and silt, gray; Same as 399-410-foot interval.
Ostracoda and Foraminifera rare.
Sand and silt, gray; Same as 399-410-foot interval.
Ostracoda and Foraminifera rare.
Sand, gray; S5 percent coarse to medium-grainedrounded to subaugular quartz sand. 10 percent gray
silt and clay matrix, unconsolidated. 5 percent dark-
green coarse-grained glauconite Broken shell fragment and euhedral pyrite crystals prominent. Ti aceS hematite aggregates and block llgnltu-d woodfragments. Ostracoda and Foraminifera common.
452-462 Sand, gray; Same as 441-452-foot interval. Ostracodaand Foraminifera common.
402-472 Sand, gray; Same as 441-452-foot interval. Ostracodaand Foraminifera rare.
472-483 Sand, gray; Same as 441-452-foot interval. Ostracodaand Foraminifera very rare.
Ostracoda from the 178-483-foot interval include:
Cytherldea (HaplocytJiericlea) ruginosa Alexander
lirarhycythere interrasiUs Alexander
Brachycythere verrucosa Harris and Jobe
Brachycythere plena Alexander
Trachyleberis miclwayensis (Alexander)
Trachyleberis spiniferrima (Jones and Sherborn)Trachyleberis presticichiana (Jones and Sherborn)
Trachyleberis bassleri (Ulrich)
Actinocythereis siegristae (Schmidt)
Loxoconcha corrugata Alexander
Orthonotacythcre cristata Alexander
52

VIRGINIA
x
m
^o-\
-n
O
■jo
o
Winton
Showing the
MAP OF
GATES COUNTY
location of water supplies
Scale of Miles
0 12 3 4
\
en

TABLE S. Recokds of Wklls in Gates
LocationOwner
12
4 miles W of Reynoldson
A\i miles WSW of Reynoldson..
5 miles NW of Roduco
Gates
do
Hazelton
H mile NE of Hazelton...,
V/i miles SE of Hazelton..
3 miles SE of Hazelton
\i mile SW of Corapeake
1M miles S of Holly Grove—
2H miles S of Holly Grove
VA miles S of Holly Grove
2 miles E of Sunbury
\Y> miles N of Sunbury—.
...do
Sunbury
....do
Sunbury
....do
...do
H mile S of Sunbury
leS of Sunbury
\i mile W of Wardsvillemiles S of Sunbury
2H miles S of Sunbury
2 miles W of Sunbury
5 miles W of Sunbury
..do
1H miles N of Easons X-Roads,
"do.do
Easons X-Roads
...do
3 miles NE of GatesviUe—.
D. G. Freeman
G. C. Dodd
D. G. Freeman
....do
T. E. Pitman ■
C.King
E. Mullin
L. Taylor
Mrs. Effie Wheedee
J. Rogers
W. K. Parker
F. C. Copeland
Paul Rountxee
G. E. Rountree
F.E. McCoy
R.KeUogg ■
G. Hathaway
J. M. Byrum
Depth
(ft.)
37
...do—
...do..
.do..
C. C. Edwards
Gates County Board of
Education •
Tom Morgan
D. C. Griffin
Mrs. E. Brooks
H. C.Benton
T. Hobbs
W.H. Hofler
J. L. Hofler
J. Hunter
W. E. Hinton
L. B. Lawrence
C.W.Jones
J. B. Rountree
R. W.Jones
R. Turner
C. E. Lang
Prison Camp No. 108-
....do
560
,_do_.
Open-
2 miles NE of GatesvUle.
Buckland
do
Roduco
Eure
mile W of Eure
2 miles NW of Eure
2lA miles W of Eure
Gatesville
.do
3 mi. NW of MintonsviUe—
2\4 miles NW of MintonsviUe. ..
3H miles NW of MintonsviUe..
....do
MintonsviUe
Mrs. 0. C. Turner —do—
W. C. Rawls I Screen
Gates County Board of
Education ...do.
Mrs. Lucy Brown —do—
E. D. Eure —do..
Mr. Parker —do—
G.Tinkhara ...do...
Mr.Felton —do—IClaude Bundy Screen
Gatesville Hotel I—do—I
Conger Ice Co -I-Gates County Office Bldg.)
H. W. White
W. A. Brown
VV. E. Brown
S. E. Spivey
Pure Oil Co
59
E. L. Winslow.-
W. C. Winslow..
Clyde Jones
Gates County Board of
Education -
....do.. I Dr.Blanchard
...do
Yi mile S of MintonsviUe..
Hobbsville
....do
4-2
4-2
4-2
Wa.
Water-bearing
material
Water
level
(ft.)
Flows
Yield
(gpm)
560 Sand.
-10
....do
9.0', do
8 I—do
120 I Marl
-10.6
Sand..
do
?and
....do
....do
2 I 42
3 130
4-2 I 424
—17
—15
....do
Marl..
Sand..
Sand ■
do
....do
....do
Marl
Sand
-6
Flows
+10
Flows
Flows
Clay
Clay
Sand
490
Draw
down
(ft.)
Remarks
Temperature 58°F.
Analysis.
Temperature 59°F.
Supplies 3 stores and 5 houses.
Analysis. Water level re
ported in 1947.
Analysis. Water level mea
sured 10/8/53.
Water level measured 4/1$ 54.
Analysis. Water level mea
sured S/3/48.
Water level reported in 1943.
Analysis. Water level mea
sured $,'53.
Analysis.
Analysis.
Water level measured
10/16/55.
...do
Water level measured 10/2/43.
Temperature 64°F.
Water level reported in 1944.
Water level reported in 1941.
Water level messured 5/5/46.
Analysis. Water level mea
sured 10/22/49.
Water level measured 9/43.
Water level reported in 1949.
Water level reported in 1949.
Analysis.
Analysis.
Water level reported in 1945.
Analysis.
Analysis.
Analysis. Water level mea
sured 10/2/43.
Water used for cooling.
Temperature 63°F.
Water level reported in 1948.
Water level measured 10. 2/43.
Water level measured 10.2/43.
Abandoned.
Abandoned.
Abandoned. ^
54

TABLE 9. Chemical Analyses of Gkound Watf.r fuom Gates County
(Numbers at heads of columns correspond to well numbers in table of well data)
(Parts per million)
Silica (SiOz)
Iron (Fc), total
Iron (Fe), in solution
Calcium (Ca)
Magnesium (Mg)
Sodium and potassium
Bicarbonate (HCO3)
Sulfate (80 4)
Chloride (Cl)
Fluoride (F)
Nitrate (NO 3)
Dissolved solids
Hardness as CaC03
PH
Water-bearing material-
Date of collection..
10
.92
.07
3.7
3.3
257
416
36
140
1.8
2.2
680
23
7.8
Sand
10-7-53
643
17
50
4.5
8.2
Sand
10-8-53
12
1
7.2
1.3
17
5.6
Saud
10-8-53
.76
.33
1.0
1.2
315
24
62
3.4
1.0
775
7
8.5
Sand
8-3-48
IS 20
22
72
4.8
657
20
4.0
9
8.2
Sand
14
Sand
21
13
6.0
.02
5.4
4.9
657
812
60
512
4.8
.4
1690
34
8.1
Sand
10-S-53 : 10-2-43 3-2-54
Analyzed by the Quality of Water Branch, U. S. Geological Survey.
Silica (SiO2)
Palninm (Pa.}
Rirarhnnatft (HCO3)
Sulfate (SO 4)
Chloride (CD
Nitrate (NO3)
Hardness as CaC03
pn
Water-bearing material
36
10
.51
.18
1.0
1.4
268
545
46
61
4.4
1.9
676
10
8.1
Sand
10-22-49
41
12
1.5
.23
1.9
2.1
282
454
40
148
1.8
.4
722
13
8.2
Sand
3-2-54
42
471
2
9
1.0
' 82
Marl
10-12-43
45
20
120
Sand
10-4-44
46
597
23
178
2.6
13
7.8
Sand
1953
47
477
40
156
1.7
14
Sand
10-2-43
Analyzed by the Quality of Water Brauch, U. S. Geological Survey.
55

Greene County
(Area 267 square miles, population 18,550)
Greene County, one of the smallest counties inthe State, lies in the southwest corner of the Greenville area. The county is bounded by Wilson Countyto the north, Pitt County to the east, Lenoir Countyto the south, and Wayne County to the west. SnowHill, the county seat, is the largest town in thecounty; other population centers include Hookerton,
Maury, and Walstonburg.
The county is drained by Contentnea Creek andLittle Contentnea Creek, which in turn dram intothe Neuse River. The youthful stage of drainage
accounts for several swampy areas within tne
C°The'sale of agricultural products provides themajor source of income in the county; tobacco isthe chief marketable crop. Small local industry is
centered largely in Snow Hill and Maury.
Geology—The entire county is covered by sands,clays, and gravels of Quaternary age, except in dissected areas bordering the major stream valleys,where erosion has exposed older formations. TheQuaternary deposits occur at elevations ranging
from 130 feet above sea level in the western part otthe county to 30 feet above sea level in the easternpart of the county and probably are no more than35 feet thick in any section of the county. _
In large, scattered areas the surficial material isunderlain by the Yorktown formation of late Miocene age. This formation was deposited in a trans-gressive sea that probably covered the entire county.Post-depositional erosion has removed or thinned theoriginial sediments so that the formation, as it nowoccurs in Greene County, is largely confined to depressions in the surface of the underlying Cretaceousformations. The thickness of the Yorktown formation is variable, from less than a foot to as much as15 feet in most areas of its occurrence.
Underlying both the Quaternary and late Miocene
sediments are sediments of Late Cretaceous age—
the Peedee, Black Creek, and Tuscaloosa formations.
The Cretaceous formations, which strike northeast
' and dip toward the southeast at a rate of 15 to 20feet per mile, have a regressive offlap relationshipthat results in younger formations successively out
cropping toward the southeast.The uppermost Cretaceous unit, the Peedee forma
tion is at or near the surface in the southern thirdof the county. Typical exposures of the formation
along major streams show it to be composed of mter-bedded and lenticular glauconitic sands and clays.
56
Massive clay beds are most abundant inithetoweithird of the formation, and indurated ^U beds afoot to several feet in thickness are P^^™^out the formation. The total exposed thickness ofthis formation in the outcrop area is about 100 to130 feet and probably no greater tha14feetmsubsurface sections in the extreme southeast cornel
of the county.
Underlying the Peedee formation is the BlackCreek formation, which is at or near the surface inthe central third of the county. The formation con-sSs of a lower unnamed member and an uppermember (the Snow Hill mar!) the.latter^having i^stype locality in Greene County (p. 18). The ^hologyof the Black Creek formation is not uniform. Theupper member is composed of drab-gray marls inter-bedded with thin layers of glauconitic sand and micaceous clay; indurated layers are common throughout The lo'wer member consists of interbeddesandsand black micaceous clays that are generally thickeiand of greater lateral extent than those occurring n
Supper member. Black lignitized^ *»£«*are prominent throughout the formation The foimatton is about 165 feet thick in its; outcrop aieaand the maximum thickness in the subsurface is 220
feet
Underlying the Black Creek formation is the Tus-cabosa formation. This formation crops out updipfrom the Peedee and Black Creek formations and isat or near the surface in the northern third of thecounty The Tuscaloosa formation is composed ofenticuter and interbedded layers of drab-gray toPTnk fetdspathic quartz sand and dense micaceousclay. Lenticular gravel deposits occur throughoutthe formation, but commonly are more prevalent toward the base' of the formation The total thicknessof the formation within the county is about 120.feet,total thickness in the outcrop area, which includesseveral counties, is probably between 250 to 30C.feetThe formation thickens progressively downdip andmay be as much as 400 to 500 feet thick in the subsurface in the southeastern part of the county.
It is not known whether sediments of Early Cretaceous age underlie Greene County. It is probablethat deeper drilling will penetrate Lower Cretaceoussediment's underlying the Tuscaloosa —^ -was the case in adjoining Pitt and Lenon Counties.
Ground water.-All public and private water supplies in the county are obtained from wells. Supplies of several millions of gallons a day of potableground water can be developed anywhere in the coun
ty.

Surficial sands and gravels and near-surface sands
of the Cretaceous formations are tapped by shallow
dug wells and driven wells in all sections of thecounty. These wells, few of which are deeper than
35 feet, yield from 2 to 10 gpm.
Jetted wells, either open-end or single-screen, at
depths of 60 to 200 feet obtain water from sands of
the following Cretaceous formations; the Tuscaloosa
formation in the northwestern third of the county,
the Black Creek and Tuscaloosa formations in the
central third of the county, and the Peedee and Black
Creek formations in the southeastern third of the
county. Jetted wells range in diameter from 1% to
4 inches and yield from 2 to 60 gpm. No information
is available regarding specific capacities and maxi
mum yields from jetted wells.
Several gravel-wall wells in the area tap multiple
sands in one or more of the Cretaceous aquifers and
supply water for irrigation or municipal use. These
wells range from 8 to 12 inches in diameter, yield
200 to 500 gpm or more, and have specific capacities
of 4 to 10 gpm per foot of drawdown. The Cretaceous
sands are lenticular and have little lateral continuity.
For this reason wells in any one area that have com
parable yields may show considerable variation in
depth even though they obtain water from the same
formation.
Water levels in the surficial sands are generally
within 10 to 20 feet of the land surface. Water in
the Cretacous aquifers, below a depth of 40 to 60 feet,
is under artesian pressure and will generally rise in
wells to within a few few of the surface. Flowing
wells are common in areas bordering Contentnea
Creek, especially in the vicinity of Lindell and north
east of Hookerton.
The chemical quality of ground water is adequate
for domestic purposes throughout most of the coun
ty. The artesian waters are generally soft sodium
bicarbonate waters. Locally, indurated shell beds
may impart moderate hardness to some water. Wa
ter from the surficial sands and gravels may be cor
rosive and may contain objectionable amounts of
iron but is otherwise acceptable for domestic use.
The following well log describes the physical
characteristics of the principal aquifers in Greene
County (see figure 9 for well location).
Greene County
Well Number 11
Location: Moye Farm en an unnumbered county road, 2 miles
northeast of Maury, North Carolina
Owner: George Moye
Date drilled: 1954
Driller: Heater Well Co.
Elevation of well: 73 feet above sea level
Hydrologic Information
Diameter of well: 10 inches
Depth of well: 341 feet
Cased to: 341 feet
Finish: Gravel wall and screens
Static (nonpumping) water level: 20 feet below land surface
(1954)
Yield: Tested at 550 gallons a minute with a 122-foot draw
down (1954)
Log of Well
Depth
(feet)
Quaternary—surficial sands
S-31 Sand, white; 90 percent coarse-grained subroundedquartz sand. 10 percent tan clay matrix, unconsoli-
dated. No microfossils.
31-41 Sand, tan; Same as 8-21-foot interval with limonitic
staining of quartz grains predominant. No micro-
fossils.
Upper Cretaceous—Peedee formation
41-5S Sand, tan; SO percent coarse to medium-grained sub-angular quartz sand. 20 percent tan silt and clay
matrix, unconsolidated. Trace of light-green weath
ered glauconite. No microfossils,
53-61 Sand, tan; Same as 41-58-foot interval. No microfos
sils.
61-71 Sand, tan; Same as 41-58-foot interval. No microfos
sils. * .
71-81 Sand, tan; Same as 41-58-foot interval. No mj$rof6s-
sils.
81-S7 Sand, tan; Same as 41-58-foot interval. No microfos
sils.
Upper Cretaceous—Black Creek formation
87-91 Clay and sand, black; 30 percent fine-grained angularquartz sand. 65 percent black micaceous clay matrix,unconsolidated. 5 percent black lignitized plant frag
ments. Dark-green fine-grained glauconite prominent.
Trace of broken shell fragments and marcasite aggre
gates. Ostracoda and Foraminifera common.
91-101 Clay and sand, black; Same as 87-91-foot interval.Ostracoda common, Foraminifera rare.
101-136 Clay, black; 10 percent fine-grained angular quartzsand 85 percent black micaceous clay matrix, uncon
solidated.' 5 percent dark-green fine-grained glauco
nite. Black lignitized plant fragments prominent.
Trace of marcasite aggregates and broken shell frag
ments. Ostracoda common, Foraminifera rare.
136-141 Clay, black; Same as 101-136-foot interval. Ostracoda
and Foraminifera rare.
141-151 Clay, black; Same as 101-136-foot interval. Ostracoda
and Foraminifera rare.
57

151-162 Clay and sand, black; 30 percent fine-grained angular
quartz sand. 60 percent black micaceous clay matrix,
unconsolidated. 10 percent black lignitized plant frag
ments. Trace of glauconite and shell fragments.
Ostracoda and Foraminifera rare.
1C2-1S0 Sand, gray; 85 percent medium to coarse-grained sub-
rounded to subangular quartz sand. 15 percent black
micaceous clay matrix, unconsolidated. Trace of glau
conite marcasite aggregates and fine broken shell
fragments. Ostracoda common, Foraminifera rare.
Ostracoda from the 87-162-foot interval include:
Cytheropteron (Eocytheropteron) striatum Brown
Brachycythere leadforma (Israelsky)
Brachycythere sphenoldes (Reuss)
Brachycythere nausiformis Swain
Alatacythere sp. aff. A. gulfensis (Alexander)
OrthonotacytJiere tarensis Brown
Orthonotacythere sulcata Brown
Upper Cretaceous—Tuscaloosa formation
1S0-193 Clay and sand, light-gray; 30 percent medium-grained
subrounded quartz sand. 70 percent gray micaceous
clay matrix, unconsolidated but tight.
193-201 Clay and sand, light-gray; Same as 180-193-foot inter
val.
201-213 Clay and sand, light-gray; Same as lS0-193-foot inter
val.
213-220 Sand, gray; 90 percent coarse to medium-grained sub-rounded quartz sand. 10 percent gray silt and clay
matrix, unconsolidated. Trace of mica flakes.
220-227 Sand and clay, gray; 60 percent coarse-grained sub-
rounded quartz sand. 40 percent gray clay matrix,
unconsolidated.
227-241 Sand and clay, gray; Same as 220-227-foot interval.
241-251 Sand and clay, gray; Same as 220-227-foot interval.
251-261 Sand and clay, gray; Same as 220-227-foot interval.
261-27S Sand and clay, gray; Same as 220-227-foot interval.
27S-2S9 Sand, gray; SO percent coarse-grained subrounded
quartz sand. 15 percent gray clay matrix, unconsoli
dated. 5 percent coarse-grained blocky potash feld
spar.
289-296 Sand, gray; Same as 27S-2S9-foot interval.
296-30S Sand, gray; Same as 27S-2S9-foot interval.
30S-330 Sand, gray; Same as 27S-2S9-foot interval.
Remarks: No microfossils were recovered from the 41-to S7
and ISO-to 330-foot intervals. Correlation of these intervals isbased upon lithology and stratigraphic position as inferred
from nearby outcropping sections.
58

h
MAP OF
GREENE COUNTY
Showing the location of water supplies
Scale of Miles
-) I 2 3 4 5
Figure 9.
59

TABLE 10. Rkcokos of Wells ix Guee.ne County
Well
no.
Location
2 miles N of Lindcll
1 mile NW of Appie
Appie
1 mile S of Appie
miles NE of Walstonburg—
Walstonburg
2H miles SW of Walstonburg..-.
Owner
C. A. Dawson —
....do
L. Byrum |
H. Herring
H. Herring, Jr
E. L. Jones
Town of Walstonburg 1
Frank Walston \
....do..
Type
of
Well
Open-
end
Screen
...do
do—
—do...
...do...
Gravel-
wall
Screen
Open-
end
Depth
(ft.)
Diam
eter
(in.)
12
13
14
15
16
17
IS
19
20
21
22
23
24
25
26
27
28
29
Willow Green H. Darden2 miles W of Willow Green G. Moye
Screen
Gravel-
wall
105
50
ISO
165
185
175
240
139
90
3G0
341
Lizzie
..-do
mile SW of Lizzie I
W. T. Eason
....do
E. A. Rasberry
\i mile SW of Lizzie
1 mile SW of Lizzie
niles SW of Lizzie
1 mile SW of Lizzie
1 mile W of Maury.
IK miles NE of Maury
|....do.„ miles E of Maury
1 mile E of Maury
H mile S of Maury
2lA miles S of Maury
ZlA miles SW of Maury •
E. A. Rasberry
....do —
....do
....do
State Highway Dept
W. Soggs
P. Frizel
E. Soggs
E.Jackson
R. Wood
J.C.Jones
L. Daniels
Screen
—do...
...do...1
Screen
—do—I
...do—1
...do...|
...do...
I—doIK miles E of Snow Hill
Snow Hill
-do..
31
32
33
34
35
36
37
38
39
40
41
42
43
44
45
4G
47
48
49
50
51
52
H mile N of Snow Hill.
% mile N of Snow Hill.
}4 mile NW of Snow Hill |K mile NW of Snow Hill
V/i miles NW of Snow Hill I
U-doH mile SW of Snow Hill
Jason
E. Nellican - |
A. Beddard
Carolina Power and
Light Co ■
Greene County Board of
Education —
J. Beaman -
J. Exum.
..do...1...do..-]
...do.-
...do...
Dug
Screen
Open-
end
..do..
Screen
—do—
...do-
Screen
...do...
91
285
223
41
220
15S
182
165
185
178
170
177
17
102
85
75
87
260
2 miles S of Snow Hill W. Ginn
I 3H miles SW of Hookerton....
\\i miles S of Hookerton
A. Warren do~A. Mewborn do~G. F. Thomas
G. Thomas
Snow Hill Tape Co
W.D. Cobb
—do..
—do..
—do._
do-
| 2K miles S of Hookerton
VA miles SW of Hookerton....
| ZH miles W of Hookerton114 miles SW of Hookcrton
Hookerton.
J. Crews
J. Creech
A. Haddock
L. Worthingtou
D. Dixon
W.Cary
Town of Hookerton..
....do
—do-
Open-
end
....do-
Screen
...do...
Open-
end
—do..
..do..
..do..
Depth
of
casing
(ft.)
152
50
80
85
125
67
84
209
156
130
50
85
140
109
78
105
105
105
105
200
339
380
2
10
4
6
4
6
4
4
4
4
2
4
36
2
IK4
8-5
4
4
4
4
4
4
4
4
Water-bearing
material
Water
level
(ft.)
105
50
180
165
183
171
240
139
90
300
341
Sand
....do •
....do
....do—40.4
Yield
(gpm)
Draw
down
(ft)
.-.do
-29.6
—27.3
..do.,
Sand..
2
4-2
4
4
279
223
41
218
156
180
165
185
178
170
177
8
102
85
75
85
260
165
150
45
76
85
123
67
76
209
154
130
50
85
140
109
550 122
....do '
Sand
....do
....do
35.3
40.2
Sand and Clay |
Sand
13.4
....do |
....do
....do ]Sand
Flows
Flows
23.5
15
....do24
4
IK
IK2
4
2
6
S
78
105
105
105
105
200
339
360
Sand
....do
....do
do
....do ■
—do
....do
—do
Flows
Flows
Flows
Flows
Flows
Flows
Flows
Remarks
Temperature GO°F.
....do
Analysis. Water level mea
sured 1/23/54.
Analysis.
Analysis.
Analysis. Water level mea
sured 2/15/55.
Analysis. . Water level mea
sured 2/15/55.
Used for irrigation. Yield
and draw-down measure,
1957.
Abondaned.
Analysis.
Abandoned.
Abandoned.
Water level measured 3/18/53.
Analysis. Water level mea-
sured, 1955.
Analysis.
Water level measured 1/23/54.
Analysis.
Flow measured, 1955.
Flows periodically.
Analysis. Public Supply.
Water level measured, 1955.
Water level reported by owner,
1955.
Analysis.
Analysis.
Analysis.
Abandoned.
Abandoned.
Abandoned.
Analysis. Abandoned.
Abandoned.
Analysis. Abandoned.
Analysis. Public supply.
60

TABLE 11. Chemical Axai.vsi-s of Quooxd Watkk fbou Cheese County(Numbers at Heads of columns correspond to well numbers in table of well data)
(Parts per million)
Silica (SiO2)
Iron (Fe), total
Iron (Fe), in solution
Calcium (Ca)
Magnesium (Mg)
Sulfate (SO-*)
Chloride (Cl)
Fluoride (F)
Nitrate (NO3)
Dissolved solids
nTI
Water-bearing material
4
174
2
5.2
47
7.2
Sand
6
192
2O Q
99
7.3
Sand
7
26
.47
5.2
41
142
5.5
R 1
.3
.4
1G4
43
7.0
Sand
7-28-49
8
1.3
.6 -
34
6.6
Sand
2-15-55
9
0.68
4.9
20
7.8
.7
21
6.2
Sand
2-15-55
13
11
.10
.05
2.2
2.8
81
211
6.4
10
.0
.3
229
17
7.5
Sand
11-11-53
Analyzed by the Quality of Water Branch, U. S. Geological Survey.
Silica (SiOa)
Iron (Fe), total
Iron (Fe), in solution
Calcium (Ca)
Magnesium (Mg)..-
Sodium and potassium (Na+K)
Bicarbonate (HCO 3)
Sulfate (SO*)
Chloride (Cl)
Fluoride (F)
Nitrate (NOa) -
Dissolved solids
Hardness as CaC03
pH
Water-bearing material-
Date of collection.
19
19
.08
10
5.2
46
167
1.9
4.5
.4
.1
174
46
7.1
Sand
1-5-50
23 25
206
1
4.2
7.2
Sand
1-22-54
213
1
5.8
47
7.2
Sand
1-22-54
29
.09
4.4
2.8
91
204
11
28
.4
.3
255
22
Sand
5-26-47
40
18
2.1
.12
13
1.1
6.9
52
4.1
3.2
.1
.3
76
37
6.6
Sand
1-22-54
42
141
9
3.5
122
7.3
Sand
1-22-54
Analyzed by the Quality of Water Branch, U. S. Geological Survey.
Silica (SiO2)
Iron (Fe), total
Iron iFe), in solution
Calcium (Ca)
Magnesium (Mg) ■
Sodium and potassium (Na+K).
Bicarbonate (HCO3)
Sulfate (SO*) •
Chloride (Cl)
Fluoride (F)
Nitrate (NOs)
Dissolved solids
Hardness as CaCCb
Water-bearing material.. -
Date of collection.
44
141
7
4.0
122
7.4
Sand
1-19-54
49
27
3.1
13
2.3
14
74
4.7
4.8
.2
.3
112
42
6.8
7-24-47
Analyzed by the Quality of Water Branch, U. S. Geological Survey.
.15
.04
.3
.3
94
1S1
14
30
.4
.3
243
o
7.8
Sand
9-6-49
13
.12
.08
.2
.2
94
181
15
30
.0
.8
247
2
7.9
Sand
1-4-55
61

Hertford County
(Area 356 square miles, population 21,453)
Hertford County lies in the northern part of the
Greenville area. The county abuts Virginia to thenorth and is bordered by the Chowan River to theeast, Bertie County to the south, and NorthamptonCounty and the Meherrin River to the west. Ahoskieis the largest town in the county; other population
centers include Winton (the county seat), Cofield,Harrellsville, Mapleton, Menola, and Murfreesboro.
The county is drained by the Meherrin River, the
Wiccacon River, and Potecasi Creek, all of which
drain into the Chowan River.
The sale of agricultural products provides the chiefsource of income in the county; tobacco and peanutsare the chief marketable crops. Small local indus
tries are centered, for the most part, in and around
Ahoskie and Murfreesboro.
Geology.—The county is covered by clays, sands,
and gravels of Quaternary age which occur at eleva
tions of from 80 to less than 15 feet above sea level.This material ranges in thickness from a few feet tomore than 60 feet, the thickness generally being
greatest in and adjacent to the Meherrin River and
Chowan River valleys.
Underlying the surficial deposits are blue-gray
clays, sands, marls, and shell beds of late Mioceneage, the Yorktown formation. This formation is ex
posed intermittently along the major streams andoccasionally in marl pits of the interstream areas.
Individual beds in the Yorktown formation are lenticular and cannot be traced for long distances eitherat the surface or in the subsurface. Massive claybeds are predominant in the formation. Lenticular
sand and shell beds, less common than the clays, are
more prominent in the lower third of the formation.
The thickness of the formation is variable and increases progressively from west to east across thecounty. In a well at Murfreesboro total thickness of
the formation was 58 feet, a well at Ahoskie had atotal thickness of 25 feet, and a well at Cofield hada total thickness of 70 feet. Data from adjoiningcounties indicates that the formation attains a thickness of 125 to 150 feet in eastern Hertford County.Underlying the Yorktown formation in eastern andcentral Hertford County are deposits of Paleocene
age, the Beaufort formation. This formation typically is composed of beds of glauconitic sand and calcareous clay containing thin zones of induratedshells. The total thickness of this stratigraphic unitincreases progressively from west to east. The Beau
fort formation is 40 feet thick at Ahoskie and 200
62
feet thick at Colerain. West of a line through Ahoskieand Winton there is apparently an abrupt facieschange in the Beaufort formation. Well cuttings inthe western part of the county, from beneath theYorktown formation and from bove the Tuscaloosaformation, are composed typically of coarse elasticscontaining a large percentage of relatively freshfeldspar grains and variable amounts of light-colored
clays, silts, and lignitized wood fragments. This material is of deltaic origin and contemporaneous with
downdip marine facies of the Beaufort, Peedee, andBlack C^eek formations. The manner or extent bywhich the downdip marine facies interfinger withthe updip deltaic facies cannot be determined fromavailable subsurface data. In a recently drilled wellat Murfreesboro, 230 feet of nonfossiliferous mater
ial of deltaic origin was penetrated beneath theYorktown and above the Tuscaloosa formations. AtWinton, 10 miles downdip from Murfreesboro, a wellpenetrated more than 350 feet of fossiliferous ma
rine strata, representing the Beaufort and Peedee
formations.
Underlying the Beaufort formation in central andeastern Hertford County are sediments of Late Cretaceous age, the Peedee formation. According toLeGrand and Brown (1955, fig. 2) the Peedee formation lies at an elevation of about 150 feet below sealevel in the central part of the county and at an elevation of about 400 feet below sea level in the ex
treme eastern part of the county.
The Black Creek formation or the Tuscaloosa formation underlies the Peedee formation in all partsof the county. The only available well samples fromthe county that indicate the presence of the Tuscaloosa formation are from a well at Murfreesboro. Inthis well 110 feet of the Tuscaioosa formation was
penetrated, and the top of the formation is 255 feetbelow sea level. Deeper wells in the county willprobably penetrate Lower Cretaceous sediments be
neath the Tuscaloosa formation.
Ground water.—All public and private water sup
plies in the county are obtained from wells. Surficialsands and gravels of Quaternary age and near-sur
face sand and shell beds of late Miocene age yield 2to 10 gpm to dug wells and driven wells that range
in depth from 10 to 40 feet in all sections of the
county.
In central and eastern Hertford County open-endand single-screen wells obtain water from sand andshell beds of the Yorktown formation and similarmaterial in the Beaufort and Peedee formations atdepths of from 60 to 300 feet. Inasmuch as no single

water-bearing horizons is recognized in the lenti
cular strata comprising these formations, the depth
of individual wells, even in small localised areas, is
quite variable. The jetted wells, generally 2 to 4
inches in diameter and rarely as much as 6 inches in
diameter, yield 5 to 25 gpm in most localities. In
the western part of the county jetted wells are com
mon and generally average less than 200 feet in
depth. The yield from wells in this area ranges be
tween 10 and 25 gpm.
Several municipalities obtain water from drilled
gravel-wall wells, 8 to 12 inches in diameter, that tap
multiple aquifers of Paleocene and Cretaceous age.
Wells of this type yield 200 to more than 1,000 gpm
and have specific capacities ranging from 6 to 15
gpm per foot of drawdown.
The water level in the surficial material generally
is within 10 to 20 feet of the land surface. Water in
the deeper aquifers is under artesian pressure and
rises in wells to within 30 to 40 feet of the land sur
face. However, flowing wells are common in the
vicinity of Murfreesboro, north of Murfreesboro to
the Virginia State line, and in topographically low
areas bordering the major rivers and streams. Sev
eral wells in the vicinity of Como and Barretts Cross
roads, which had previously flowed, are reported tohave stopped flowing when large-capacity wells at
Franklin, Virginia were placed in production.
The chemical quality of ground water in the boun
ty is adequate for most domestic purposes. However,
water in some of the shallow aquifers may be corros
ive and may contain objectionable amounts of iron.
Water from shell beds of the Yorktown and Beaufort
formations may be objectionably hard. The deeper
"greensand" aquifers contain soft sodium bicarbo
nate waters. Several analyses of ground waters from
aquifers below a depth of 300 feet show a fluoride
concentration in excess of 2.0 ppm. However, the
fluoride concentration, in most waters analyzed to
date, is less than 1.0 ppm through the county. The
depth to brackish waters ranges from more than 500
feet below the surface in the western part of the
county to as little as 400 feet in the extreme eastern
part of the county. j
The following well logs describe the physical
characteristics of the principal aquifers in Hertford
County (see figure 10 for well location).
Hertford County
Well Number 13
Loation: City well at Murfreesboro, North Carolina, located at
the high school athletic field.
Owner: City of Murfreesboro
Date drilled: 1954
Driller: Heater Well Co.
Elevation of well: 64 feet above sea level
Hydrologic Information
Diameter of well: 12 inches
Depth of well: 432 feet
Cased to: 432 feet
Finish: Gravel wall and screens
Static (nonpumping) water level:
(1954)
Yield: 1,000 gallons a minute
62 feet below land surface
Log of Well
Quaternary—surficial sands and clays
Sand and clay, tan; 70 percent fine to very fine-grained
angular quartz sand. 30 percent tan clay matrix, un-
consolidated but compact.
Sand and clay, gray; 55 percent fine to medium-grain
ed angular to subangular quartz sand. 45 percent
gray clay matrix, unconsolidated but compact.
Upper Miocene—Yorktown formation
Clay and sand, gray; 25 percent fine to medium-grain
ed angular quartz sand. 65 percent blue-gray clay
matrix, unconsolidated but very compact. 10 percent
fine broken shell fragments. Trace of fine mica flakes.
Ostracoda and Foraminifera common.
Clay and' sand, gray; Same as 30-40-foot interval.
Ostracoda and Foraminifera common.
Clay and sand, gray; Same as 30-40-foot interval.
Ostracoda and Foraminifera common.
Marl, gray; 30 percent fine to medium-grained angular
quartz sand. 35 percent fresh shell and shell frag
ments. 35 percent blue-gray clay matrix, unconscfli-
dated. Ostracoda and Foraminifera common. ^ ••*•
Marl, gray; Same as 58-62-foot interval. Ostracoda and
Foraminifera common.
Ostracoda from the 30-62-foot intervals include:
GytUerura elongata Edwards
Turiana rugipunctata (Ulrich and Bassler)
Actinocythereis exanthemata (Ulrich and Bassler)
Actinocythereis mundorffi (Swain)
Orionina vaughani (Ulrich and Bassler)
Hemicythere confragosa Edwards
Henvicythere sehmidtae Malkin
Cushmanidea ashermani (Ulrich and Bassler)
Paleocene (?) and TJt>per Cretaceous(f)—undifferentiated
SS-105 Sand and clay, gray; 65 percent medium to fine-grain
ed subroun.ded to angular quartz sand. 35 percent
gray clay matrix, unconsolidated but tight. Trace of
black lignitized wood fragments.
105-11S Sand and clay, gray; Same as 88-105-foot interval.
118-149 Sand and clay, brown; 60 percent medium to fine
grained subangular to angular quartz sand. 30 per
cent reddish-brown clay matrix, unconsolidated but
very compact. 10 percent red hematite aggregates.
Coarse mica flakes prominent.
63
Depth
(feet)
0-6
6-30
30-40
40-50
50-58
58-62
62-8S
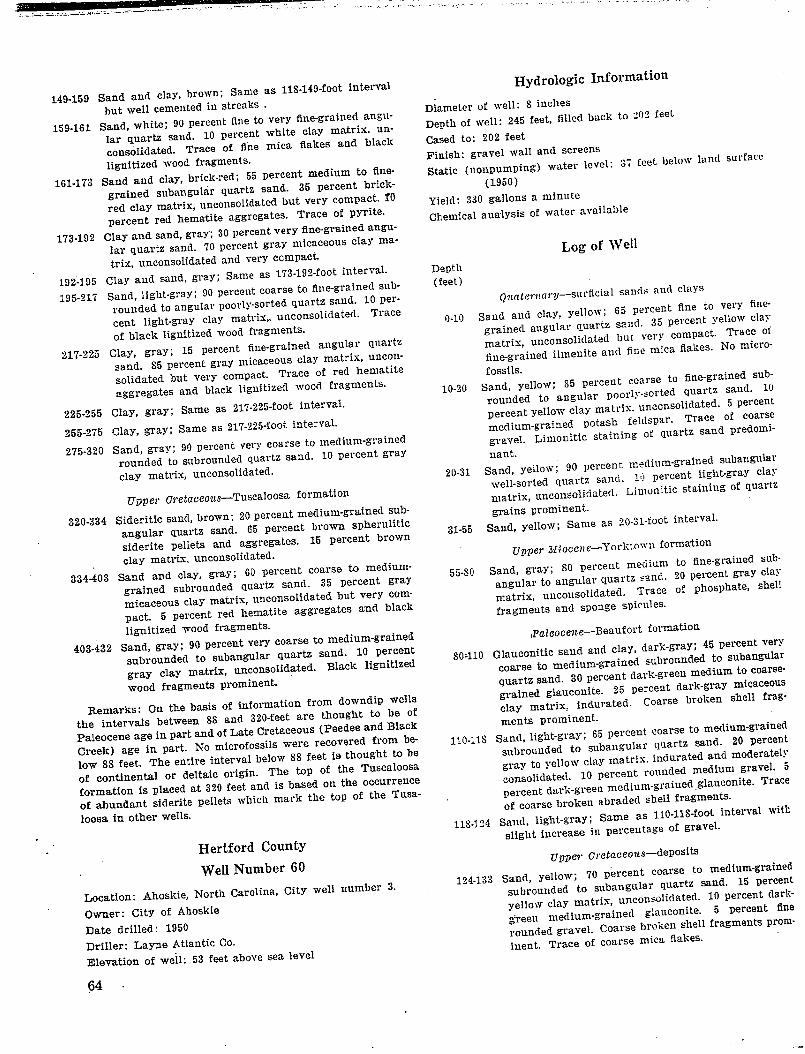
149-159
159-161
161-173
173-192
192-195
195-217
Sand and clay, brown; Same as 118-149-foot interval
but well cemented in streaks .
r• -Tirrr* satsirs;consolidated. Trace of fine mica flakes and blacklignitized wood fragments.
Sand and clay, brick-red; 55 percent media*i to^finegrained subangular quartz sand. 35 percent brickfed clay matrix, unconsolidated but very compact 10percent red hematite aggregates. Trace of pyrite.
day and sand, gray; 30 percent very fine-grained angu-lai quartz sand. 70 percent gray micaceous clay ma
trix, unconsolidated and very compact.
Clay and sand, gray; Same as 173-192-foot interval
Sand, light-gray; 90 percent coarse to **«&«*f »£rounded to angular poorly-sorted Quartz sand. 10 percent light-gray clay matrix,, unconsolidated. Tiace
of black lignitized wood fragments:fine-grained angular quartz
Hydrologic Information
217-225
aggregates and black liguitized wood fragments.
225-255 Clay, gray; Same as 217-225-foot interval.
255-275 Clay, gray; Same as 217-225-foot interval.
clay matrix, unconsolidated.
Upper Cretaceous—Tuscaloosa formation
Sideritic
angular
siderite pou^w %»—. —«— —
clay matrix, unconsolidated.
lignitized wood fragments.
Diameter of well: S inches
Depth of well: 245 feet, filled back to 202 feet
Cased to: 202 feet
Finish: gravel wall and screens
SUtic (nonpumping) water level: 37 feet below land(1950)
Yield: 330 gallons a minute
Chemical analysis of water available
Log of Well
Depth
(feet)
Quaternary—surftcial sands and clayb
0-10 Sand and clay, yellow; 65
10-20
sffiSwood fragments prominent.
loosa in other wells.
Hertford County
Well Number 60
Location: Ahoskie, North Carolina, City well number 3.
Owner: City of Ahoslde
Date drilled: 1950
Driller: Layne Atlantic Co.
Elevation of we'll: 53 feet above sea level
64 .
20-31
grains prominent.
31-55 Sand, yellow; Same as 20-31-foot interval.
Upper JHoce»e-Yorktown formation
55-80
ssrsssfragments and sponge spicules.
.Paleocwe-Beaufort formation
80*110
ments prominent.
-percent darK-greeu mc«^»« o-- ~
of coarse broken abraded shell fragments.
118-124 Sand, light-gray; Same as 110-1-"^ -slight increase in percentage of
Upper Cretaceous—deposits
124-133
inent. Trace of coarse mica flakes.

133-147 Clay and sand, light-gray; 35 percent medium to very
fine-grained suhangular to angular poorly-sorted
quartz sand. 65 percent gray clay matrix, unconsoli-
dated but very compact. Dark-green medium to fine
grained glauconite prominent.
147-1G0 Sand and clay, mottled-pink; 60 percent medium to
fine-grained angular quartz sand. 25 percent mottled-
pink to yellow clay matrix, unconsolidated but very
compact. 15 percent coarse blocky calcic feldspar
grains. Trace of coarse abraded shell fragments fine
gravel and dark-green glauconite.
160-203 Sand, gray; 85 percent very coarse to medium-grained
subangular quartz sand. 5 percent gray clay matrix,
unconsolidated. 10 percent coarse blocky calcic feld
spar grains.
203-223 Sand, pink; 65 percent very coarse to medium-grained
subangular quartz sand. 20 percent pink clay matrix,
unconsolidated but compact. 15 percent coarse blocky
calcic feldspar grains. Trace of dark-green fine-grain
ed glauconite and hematite aggregates.
228-239 Sand, pink; Same as 203-228-foot' interval, but with
medium-grained quartz sand predominant.
239-245 Sand, pink; Same as 22S-239-foot interval.
Remarks: No microfossils were recovered from the intervals
sampled in this well. Correlation is based on stratigraphic
position and lithologic similarity to downdip sections which
carry a diagnostic fauna. The interval designated Upper Cre
taceous in this well is thought to represent a marginal deltaic
deposit of the Peedee formation.
65

VIRGINIA
MAP OF
HERTFORD COUNTY
showing the location of water supplies
Scale ofMiles
12 3 4
• 48
Lloyds
Crossroads
COUNTY/
Figure 10.

TABLE 12. Recouds of Wells in Hertford County
Well
no.
Location
5 miles X \V of Couj :
Ownek
K. \V. Evans
.do..
'JVlH5
of
Well
4 miles N\V of Com-:
3> 4 miles XW of Co-o
...do
do
3»4 mites W of Coir::
:J»4 miles X E of Con*
3 f i mites XE of Co~ >
Como
4 miles NT. of Murfresboro
\}-> miles XE of M.:::-esboro.._
Murfreesboro..
Mrs. A. J. Bryant
Cyrus D. Howell
Mrs. W. L. Britt
...do
Mrs. Zola Drake
J. 11. b'tephenson
....do
Depth
i ft.)
Diam
eter
(in.)
Jones and Raynor
Hotel Court
State Highway Dept..
Open-
end
Screen
...do
...do...
...do...
Dug
Screen
Dug
Open-
end
...do...
i'creen
..do...
Murfreesboro.
15
20
21
22
23
24
25
26
27
28
29
30
31
34
35
36
37
38
39
40
42
43
44
45
46
47
48
49
50
51
52
53
54
55
.do..
.do..
Town of Murfreesboro...
Town of Murfrcesboro...
.do..
.do
.do
.do..
..do..
K mile SE of M
Winton
.do..
.do..
..do..
.do.,
.do..
Gravel-
wall
Gravel-
wall
Open-
end
...do..
0.1,A. Chitty
M. E. Worrell
.do..
.do..
V. T. Underwood
Hertford County Board
of Education
Mrs. H. Carier
E. Dixon
Town of Winton
..do..
Winton
...do
Cofield..
Cofield.
....do...
..do..
.do.,
.do..
..do.
..do...
..do..
..do..
...do..
.do...
.do..
Screen
..do...
Dug
...do...
Gravel-
wall
...do..
...do.,
.do..
100
127
150
120
117
28
140
40
110
175
126
120
432
320
228
228
228
115
225
228
228
228
228
90
Hertford County Board
of Education
Rufus Reynolds
C.L.Everett
A. B. Bazemore
Mr. Delaware
W. E. Perry
H mile N of HarrellrrUle
Harrellsville
VA miles W of Harre*jville
Harrellsville
....do
do
Screen
Dug
...do..
Screen
...do..
...do..
H mile E. of Harrellrrtile
W2 miles E of Harrelisville
5 miles WSW of Haireilsville....
2H miles W of Bethte*m
ZYi miles W of Bethlehem.
Bazemore Bros
Tom Bazemore
N. C. State Highway
Dept!
D. N. Evans
D. N. Evans and Son
J. S. Windborn
A. C. Rountree
Harrellsville Lumber Co-
Bud Gillam
R. C. Mason
W. H. BasniRht
R. F. Wiggins
...do...
...do...
Dug
Screen
...do..
...do..
...do..
...do...
...do..
...do..
...do..
Screen
Willard Earley.
Ahoskie..
....do....
....do...
Barrow Mfg. Co—
II. Sherman Boonc.
J. Roy Parker
170
20
15.1
415
260
'314
180
..do..
..do..
.do.,
.do..
34
36
151
195
160
152
134
12
260
296
288
230
166
257
312
255
182
4-2
2
4-2
4
36
4-2
48
V<
4
Depth
of
casing
(ft.)
100
127
150
120
117
24
140
Water-bearing
material
Sand...
...do..
...do..
...do..
....do..
Blue Clay.
Sand
....do
Water
level
(ft.)
Flows
Yield
(gpm)
4
36
36
24.8
28.8
28.8
6
110 ....do
175 | do126 ...do
120 ....do
+3.8
171
250
54
48
36
4.2
4.2
4
4
4
36
4.2
4.2
4.2
4
4-2
4-2
4
4-2
432
320
228
228
228
115
225
228
228
228
228
93
165
Sand and Gravel
Sand..
....do
...do
...do
Shell limestone
—0.5
+ 10.3
-65.4
" Draw
down
(ft)
1000
Flows
...do...
..do....
...do...
Remarks
Analysis. Temperature 61°F.
Analysis. Temperature 61°F.
Temperature 62°F.
Analysis.
Analysis.
Analysis.
Water level measured, 1956.
415
260
314
180
Sand . ....do
Gravel j do
....do .—do.
...do | do.
...do - I do.
Sand
..do-
Clay..
....do
Sand..
....do..
.do.,
.do.
.do..
4-2
4-2
36
151
195
149
152
118
10
260
296
288
202
162
257
312
244
182
Sand and Clay..
...do
Sand
....do
....do
..do..
Clay..
Sand..
....do
....do
.do
171
65
223
52
....do
....do
..do
.do..
Sand...
....do..
Gravel.
....do..
Sand...
....do..
Sand..
28
Water level measured, 1956
Analysis, Water level mea
sured, 1956.
Analysis. Public supply.
Temperature 63°F.
Analysis. Public supply
Temperature 63°F.
Flow measured.
Flow measured.
-26
-17
-36
-34
-35
-40
—5
-44
-20
Analysis. Public supply
Abandoned.
Abandoned.
Analysis.
Temperature 63°F.
Water level reported by
driller, 1944.
...do
Analysis.
Water level reported by
driller. 1953.
do
....do
Water level reported by
driller, 1944.
Water level reported by
driller, 1944.
Water level reported by
driller, 1954.
Analysis.
Water level reported by
driller, 1944.
67

Well
no.
56
57
5S
59
60
61
62
63
64
65
66
67
6S
69
70
Location
Ahoskic.
do....
do...
-do..
..do..
.do..
.-do
..do
i mile S of Ahoskie-
2 miles SE of Ahoskie..
Earlcy.:
2 miles NW of Earley.
..do..
TABLE 12. RKcoiins ok Wki.ls i.\ Hkutkokij Coi-nty—Continued
2 miles WNW of California
St. Johns
H mile W of St. Johns
2 miles WNW of Menola.
5 miles SE of Mintons Store
ZlA miles SE of Mintons Store-.
VA miles SSW of Mintons Store
Owner
W. H. Basnight..
Ahoskie Ice Co...
Town of Ahoskie .
.do..
..do..
Lewis Barbecoe.
Mrs. A. E. Lewis..
...do
Dick Foreman
State Highway Patrol...
Bertrane Earley..
Mrs. Winbume..
-do..
Beechwood Country Clu
Emma Parker
C.Vaughn
Walter Burkett
H.C. Futrell
H. Hauls
L. T. Odom
of
Well
Depth
(ft.)
Screen j 151
do...j 170
Gravel- j
wall 265
.do.,
.do..
Scieen
Screen
do
do..
Open-
end
Screen
Open-
end
Screen
...do..
...do..
...do.,
."..do...
...do...
...do...
202
128
183
157
Open-
end
42
371
119
131
326
151
166
155
180
152
219
Diam
eter
(in.)
38-13
4-2
Depth
of
casing
(ft.)
4-2
2
4-2
4-2
4-2
3
4-2
4-2
145
170
265
265
202
138
183
157
42
371
119
131
326
151
166
155
180
152
219
Water-bearing
material
Sand
...do
...do
do
...do
...do
...do
...do
...do
Water
level
(ft.)
—26
-25
—26
.do.,
-do..
....do
.do
—do..
...do..
...do..
-37
—13
—21.37
—15
-30.7
Sand..
..do..
-do..
.-do-
Flows
—19
—16
—20
Yield
(gpm)
325
330
Draw
down
(ft.)
Remarks
SO
Water level reported bydriller, 1944
...do
Analysis. Public supply.
Water level reported by
driller. 1927.
Analysis. Public supply.
Analysis. Public supply.
Water level reported by
driller. 1950.
Water level reported by
driller. 1950.
Water level measured, 1957.
Water level reported by
| driller, 1949
j Analysis.
Analysis.
Water level measured, 1957.
j Temperature 61°F.
.! Water level reported by
driller. 1952
Water level reported by
driller, 1953.
Analysis. Water level re
ported by driller, 1947.
Analysis.
Analysis.
Abandoned.
TABLE 13. Chemical Analyses of Ground Water from Hertford Covxty
(Numbers at heads of columns correspond to well numbers in table of well data)
(Parts per million)
Silica (SiO2)
Iron iFe), total
Iron (Fe), in solution
Calcium (Ca)
Magnesium (Mg)
Sodium and potassium (Na+K).
Bicarbonate (HCO3)...
Sulfate (SO*)
Chloride (Cl)
Fluoride (F)
Nitrate (NOa)
Dissolved solids - —
Hardness as CaCO3
pH
Water-bearing material-
Date of collection
204
3.8
4.0
8.1
Sand
8-14-56
20
.26
10
4.8
66
223
3.1
5.0
.6
.1
46
7.6
Sand
8-14-56
29
.30
12
3.9
48
182
2.1
1.5
.4
.3
47
7.5
Sand
8-14-56
239
.9
4.0
.2
1.3
107
8.0
Sand
8-14-56
230
15
47
1.4
7.8
Sand
8-14-56
12
33
.19
.05
.9
.5
51
128
5.2
3.6
.2
.1
15S
4
7.1
Sand
3-29-50
Analyzed by the Quality of Water Branch. U. S. Geological Survey.
68

TABLE 13. CiiKMicAi, Analyses of Ground Watkk fkom Hkutfoud County—Continued
(Numbers at heads of columns correspond to well numbers in table of well data)
"V (Parts per million)
Silica i'iO 2)
Iron (Fe), total
Iron (Fe), in solution
Calcium (Ca) .
Macnesium (Mg)
Sodium and potassium (Na-f-K)
Bicarbonate (HCO3)
Sulfate (SO4)
Chloride (Cl)
Fluoride (F)
Nitrate (NO3)
Dissolved solids .
Hardness as CaCO 3
pH
Water-bearing material
Date of collection
13
15
.17
.01
1.3
.5
74
164
8.6
15
.9
.3
202
5
8.1
Sand and
gravel
3-12-54
14
30
.42
1.8
.8
70
183
4.1
4.0
.3
.4
201
8
7.4
Sand
5-1-4S
2S
12
.34
.8
.9
145
271
1.3
48
1.3
.7
369
6
S.2
Saud
12-28-48
31
13
5.6
3.1
.9
143
278
13
48
1.3
.5
370
11
S.I
Sand
12-28-48
40
23
5.6
.03
160
2.0
23
451
10
55
.2
.2
506
407
6.9
Clay
6-22-49
48
379
.2
7.8
.2
11
7.5
Saud
3-31-54
Analyzed by the Quality of Water Branch, U. S. Geological Survey.
Silica S1O2)
Iron (Ye), total _
Iron 'Ye), in solution
Calcium (Ca) ....
Magnesium (Mg)
ftoditirn and potassium (\'&-}-TC)
Bicarbonate (HCO3)
Sulfate (SO4)
Chloride (Cl)
Fluoride (F) _
Nitrate (NO3)
Dissolved solids _ ' "-
Hardness as CaC03
pH
Water-bearing material
Date of collection
.58
33
.23
7.7
5.9
79
247
3.5
5.2
.4
1.0
261
43
7.2
Sand
5-25-48
59
32
.22
8.7
6.7
86
268
5.2
6.2
.5
1.2
283
49
7.2
Sand
5-25-48
60
33
.43
.02
26
9.5
43
225
3.2
6.0
.2
.4
245
104
7.3
Saud
6-16-54
65
27
6 5
.43
6.8
1.7
6
70
9.8
5.2
.0
.2
121
63
6.5
Sand
11-4-55
66
13
.88
.05
2.2
2.0
184
381
73
14
2.3
.2
515
14
8.1
Sand
10-8-53
72
32
35
18
4.9
69
230
4.4
4.5
1.0
.3
66
8.7
Sand
8-13-56 ,
Analyzed by the Quality of Water Branch, U. S. Geological Survey.
73
Silica (jfiCh)
Iron (Fe>. total
Iron (Fe). in solution
Calcium (Ca)
Magnesium (Mg)
Sodium and potassium (Na-4-K).,
Bicarbonate (HCO3)
Sulfate (C04)
Chloride (Cl)
Fluoride (F)
Nitrate (NO3)
Dissolved solids
Hardness as CaCOs
pH
Water-bearing material.
Date of collection
263
3.5
7.5
47
8.4
Sand
9-20-55
145
2
6.S
25
7.1
Sand
12-54
Analyzed by the Quality of Water Branch, U. S. Geological Survey.

Martin County
(Area 481 square miles, population 27,938)
Martin County, elongated in an east-west direction, lies approximately in the geographical center ofthe Greenville area. The county is bounded by Pitt,Bertie, Washington, Beaufort, Edgecombe, and Halifax Counties. Williamston, the county seat andlargest town in the county, is located on the banksof the Roanoke River, which forms the northernboundary of the county. Other population centers in
clude Bear Grass, Hamilton, Jamesville, Oak City,
and Robersonville.
The entire county is drained by the Roanoke Riverand several of its small tributaries. A high escarp
ment broken by numerous low swampy areas extendsalong the Roanoke River for most of its length.
The county is largely agricultural, tobacco beingthe chief crop. A large pulp mill and a chemicalmanufacturing plant are the major industries in the
county.
Geology.—Surficial clay, sand, and gravel of Quaternary age occur as a thin layer over the entire county Along the Roanoke River and its tributaries thismaterial is as much as 40 feet thick; in the inter-stream areas it is rarely more than 15 feet thick.
The surficial deposits are underlain by the York-town formation of late Miocene age, which consistsof blue clay, marl, and sand. The Yorktown formationis exposed intermittently along the Roanoke River,where the stream has cut down through overlyingmaterial, and is exposed in many shallow marl pitsin the interstream areas. The formation is common
ly less than 80 to 100 feet thick throughout the
county.
The Castle Hayne limestone of Eocene age underlies the Yorktown formation in the eastern part ofMartin County. Wells east of Jamesville and Smith-wick obtain water from the Castle Hayne limestoneformation which in this part of the Greenville area
consists of a very hard shell-limestone. Wells atWilliamston and Bear Grass do not encounter theformation, indicating that the formation pinches outalong a line west of Jamesville and Smithwick. Totalthickness of the formation in the county is unknown.
Glauconitic sands and shell beds of the Beaufortformation of Paleocene age underlie the eastern andcentral thirds of the county. The formation, confined to the subsurface, has not been recognized westof Williamston and Bear Grass. Total thickness ofthis unit in a well at Williamston was 27 feet, wherethe top of the unit was 59 feet below sea level. Its
70
total thickness and its depth below sea level wouldbe expected to increase in an easterly direction
The Upper Cretaceous Pedee and Black Creek formations, composed of dark-colored lenticular sandsand clays, underlie the central and east«*•«*?£of Martin County. The western extent of these formation* has not been determined. It is probable thatmarine sediments of these two formations internnger
with deltaic sediments of comparable age in the western part of the county. The Peedee formation atWilliamston is 129 feet thick and the top of the toi-mation is 86 feet below sea level. The Black Creekformation is 259 feet thick at Williamston.
The basal Upper Cretaceous unit, the Tuscaloosaformation, underlies the Peedee and Black Creek formations in the eastern and central parts of MartmCounty. In western Martin County this formationlies unconformably beneath Paieocene and Miocenesediments. The Tuscaloosa formation, composed oflight-colored lenticular clays and arkosic sands, lieswithin 40 to 50 feet of the land surface in the western part of the county and is buried progressivelydeeper in an easterly direction. Estimated thicknessof the formation in the eastern part of the county is
about 400 feet.
Sediments of Early Cretaceous age probably underlie the Tuscaloosa formation in the eastern andcentral parts of Martin County, whereas m thewestern part of the county the formation is underlain
by crystalline rocks.
Ground water.-All public and private water supplies in Martin County are obtained from wells. Martin Countv is favorably situated as to ground-watersupply. Several millions of gallons per day of groundwater may be obtained at any one place in the county. Larg-diameter gravel-wall wells will yield as
much as 1,000 gpm in most localities.
Surficial sands and gravels of Quaternary age andnear-surface sand and shell beds of the Yorktownformation yield 2 to 10 gpm. Rural supplies m thecounty are obtained largely from dug or driven wellsthat tap the aquifers of Miocene or Quaternary age.
Small-diameter jetted wells in eastern and centralMartin County draw water from sand lenses andshell beds of Miocene age, limestone of Eocene age,and greensand of Paleocene age at depths rangingfrom 60 to 200 feet. These wells, either open-end orsingle-screen, yield as much as 50 gpm. Jetted wellsin western Martin County obtain water from sandlenses and shell beds of Miocene age and from sandsof Cretaceous age. These wells, generally less than
400 feet deep, yield from 10 to 300 gpm.

Large-diameter gravel-wall wells 300 to 500 feet
deep obtain water from lenticular sands of Paleo-
cene and Cretaceous age. They yield asMnuch as 700
gpm, and their specific capacities generally range
from 4 to 10 gpm per foot of drawdown.
All water-bearing strata beneath the surficial de
posits are artesian. Water levels in wells penetrat
ing these strata are generally within 30 to 40 feet
of the land surface throughout the county. Artesian
flows are common along the lowlands bordering the
Roanoke River and its tributaries.
The chemical quality of the ground water in Mar
tin County is not uniform. Surficial sands and gra
vels yield water that is slightly corrosive and that
contains objectionable amounts of iron. Shell beds
and limestones of the deeper formations yield water
of objectionable hardness. Generally, the sand beds
throughout the county at depths greater than 50
feet yield water adequate for most domestic pur
poses, the waters becoming softer with depth at any
one location owing to the base exchange process.
The following log describes the physical composi
tion of some of the principal aquifers in Martin
• County. (See figure 11 for location).
Martin County
Well Number 49
Location: Williamston, North Carolina, corner of Pearl and
Church Streets
Owner: Town of Williamston
Date drilled: 1957
Driller: Heater Well Co.
Elevation of well: 6S.5 feet above sea level
Hydrologic Information
Diameter of well: 12 inches
Depth of well: 702 feet
Cased to: 470 feet, cemented off below 470 feet
Finish: Gravel wall and screens
Static water level: 66.2 feet below land surface (1957)
Yield: 700 gpm
Temperature: 62°F
Depth
(feet)
Log of Well
Quaternary—surficial sand and clay
0-2 No sample.
2-6 Sand, yellow; S5 percent very fine-grained angular
quartz sand. 15 percent yellow clay and silt matrix,
unconsolidated. No microfossils.
6-14 Sand, yellow; Same as 2-6-foot interval.
14-27 Clay and sand, gray; 45 percent very fine to fine-grain
ed angular quartz sand. 55 percent gray clay matrix,
unconsolidated. Fine-grained black opaques promi
nent. No microfossils.
Upper Miocene—Yorktown formation
27-37 Sand and clay, gray: 65 percent very fine to fine
grained angular quartz sand. 30 percent gray clay
matrix, unconsolidated. 5 percent fresh broken shell
fragments. Ostracoda and Foraminifera rare.
37-52 Clay and sand, gray: 40 percent fine to very fine
grained angular quartz sand. 60 percent gray clay
matrix, unconsolidated. Trace of fresh broken shell
fragments. Ostracoda and Foraminifera common.
52-6S Marl, blue-gray; 45 percent fine to medium-grained
angular to subangular quartz sand. 35 percent gray
clay matrix, unconsolidated. 20 percent fresh frag-
ments. Black medium-grained phosphate spherules
prominent. Trace of light-green glaucouite. Ostracoda
and Foraminifera abundant.
68-77 Marl, blue-gray; Same as 52-68-foot interval. Ostm-
coda and Foraminifera abundant.
77-S9 Clay, blue-gray; 20 percent very fine-grained angular
quartz sand. SO percent blue-gray clay matrix, un
consolidated but very compact. Trace of fresh broken
shell fragments and light-green glauconite. Ostracoda
and Foraminifera abundant.
S9-102 Clay, blue-gray; Same as 77-S9-foot interval. Ostra
coda and Foraminifera abundant.
102-115 Marl, blue-gray; 20 percent fine-grained angular to
subangular quartz sand. 55 percent blue-gray clay
matrix, unconsolidated. 25 percent fresh shell frag
ments. Black phosphatic spherules prominent. Trace
of dark-green glauconite. Ostracoda and Foramhii-
fera common.
115-125 Marl, blue-gray; Same as 102-115-foot interval. Ostra
coda and Foraminifera common.
Ostracoda from the 14-125-foot intervals include:
Traehyleberis triplistriata (Edwards)
Leguminocythereis whitei Swain
Actinocytliereis mundorffi (Swain)
Actinocytliereis exanthemata (Ulrich and Bassfer)
Hemicythere schmkltae Malkin ^ ■••*
Hemicythere conradi Howe and McGuirt
Hemicythere confragosa Edwards
Cytheromorpha warneri Howe and Spurgeon
Cytheromorpha curta Edwards
Loxoconcha purisubrhomboidea Edwards
Paleocene—Beaufort formation
125-137 Glauconitic sand, dark-green; 30 percent very fine to
medium-grained angular quartz sand. 55 percent
dark-green to black medium to fine-grained glauco
nite. 15 percent green clay matrix, unconsolidated.
Trace of broken .abraded shell fragments and mica
flakes. Ostracoda and Foraminifera abundant.
137-152 Glauconitic sand, dark-green; Same as 125-137-foot in
terval. Ostracoda and Foraminifera abundant.
Ostracoda from the 125-152-foot intervals include:
Cytheridea (Clitlirocytheridea) ruida Alexander
Traehyleberis midwayensis (Alexander)
Traehyleberis prestwichiana (Jones and Sherborn)
Traehyleberis spiniferrima (Jones and Sherborn)
Traehyleberis bassleri (Ulrich)
Aetinocythereis siegristae (Schmidt)
Cytheromorpha scrobiculata Alexander
Loxoconclia corrugata Alexander
71

Upper Cretaceous—-Peedee formation
152-169 Clay and sand, dark-green; 25 percent very fine to fine
grained angular quartz sand. 60 percent green to
gray clay matrix, unconsolidated. 15 percent dark-
green fine-grained glauconite. Broken and abraded
shell fragments prominent. Trace of fine mica flakes.
Ostracoda and Foraminifera abundant.
169-177 Sand and clay, dark-green; 50 percent very fine to
coarse grained angular to subrounded quartz sand.
35 percent dark-green to gray waxy-clay matrix, un
consolidated but compact. 15 percent dark-green med
ium to fine-grained glauconite. Broken shell frag
ments prominent. Trace of fine mica flakes. Ostra
coda and Foraminifera abundant.
177-190 Clay and sand, dark-green; 30 percent very fine to
medium-grained angular to subangular quartz sand.
60 percent dark-green to gray waxy-clay matrix, un
consolidated but compact. 10 percent dark-green fine
to medium-grained glauconite. Broken shell frag
ments prominent. Trace of mica flakes and marcasite
aggregates. Ostracoda and Foraminifera abundant.
190-202 Clay and sand, dark-green; Same as 177-190-foot in
terval. Ostracoda and Foraminifera abundant.
202-214 Sand and clay, dark-green; 45 percent very fine to
fine-grained angular quartz sand. 40 percent dark-
green to gray clay matrix, unconsolidated. 15 per
cent dark-green fine-grained glauconite. Broken shell
fragments and mica flakes prominent. Ostracoda and
Foraminifera abundant.
214-227 Sand and clay, dark-green; Same as- 202-214-foot in
terval with a slight increase in clay content. Ostra
coda and Foraminifera abundant.
227-239 Sand and clay, dark-green; Same as 214-227-foot in
terval. Ostracoda and Foraminifera abundant.
239-252 Sand and clay, dark-green; Same as 214-227-foot in
terval. Ostracoda and Foraminifera abundant.
252-264 Sand and clay, dark-green; Same as 214-227-foot in
terval. Ostracoda and Foraminifera common.
264-275 Sand and clay, dark-green; Same as 214-227-foot in
terval. Ostracoda and Foraminifera rare.
275-2S1 Sand and clay, dark-green; Same as 214-227-foot in
terval. Ostracoda and Foraminifera rare.
Ostracoda from the 152-281-foot interval include:
Cytherella herricki Brown
Cytherelloidea sohni Brown
Cytheridea (HaplocytJieridea) monmouthensis
(Berry)
Cytheridea (Haplocytheridea) councilli Brown
Brachycythere rhomhoidalis (Berry)
Velarocythere arachoides (Berry)
Velarocythere cacumenata Brown
Trachyleoeris pidgeoni (Berry)
Loxoconcha neusensis Brown
Eucytherura curta (Jennings)
Upi)er Cretaceous—Black Creek formation (lower member)
2S1-297 Sand, gray; 90 percent fine to medium-grained angu
lar to subangular quartz sand. 10 percent gray clay
matrix, unconsolidated. Trace of black lignitized
wood fragments mica flakes and dark-green glauco
nite. Ostracoda and Foraminifera rare.
297-302 Sand and clay, dark-gray; 65 percent fine-grained angular quartz sand. 25 percent gray clay matrix, un
consolidated. 10 percent dark-green fine-grained
glauconite. Black lignitized wood fragments andmica flakes prominent. Trace of broken abraded shellfragments. Ostracoda and Foraminifera rare.
302-314 Sand and clay, dak-gray; Same as 297-302-foot inter
val. Ostracoda and Foraminifera rare.
314-327 Clay and sand, gray; 40 percent fine to very finegrained angular quartz sand. 55 percent gray claymatrix, unconsolidated. 5 percent very fine-grained
dark-green glauconite. Trace of black lignitized wood
fragments. Ostracoda and Foraminifera rare.
327-342 Clay and sand, brown; 35 percent fine to medium-grained angular to subangular quartz sand. 65 per
cent brown clay matrix, unconsolidated but very com
pact. Trace of mica flakes. No microfossils.
342-352 Sand, light-gray; 85 percent fine-grained angularquartz sand. 15 percent light-gray clay matrix, un
consolidated. Trace of light-green glauconite. No
microfossils.
352-366 Sand and clay, brown; 60 percent very fine to finegrained angular quartz sand. 40 percent brown mica
ceous clay matrix, unconsolidated but very compact.
Black lignitized wood fragments prominent. Trace
of red hematite aggregates, pyrite aggregates and
dark-green glauconite. No microfossils.
366-371 Sand and clay, brown; Same as 352-366-foot interval.
No microfossils.
371-379 Sand, white; 95 percent medium-grained subangularto subrounded quartz sand. 5 percent gray clay ma
trix, unconsolidated. Trace of dark-green glauconite
and mica flakes. No microfossils.
379-394 Sand and silt, light-gray; 70 percent fine to coarse
grained angular to subrounded quartz sand. 30 per
cent light-gray silt matrix with some clay, unconsoli
dated. Trace of dark-green glauconite and broken
shell fragments. Ostracoda and Foraminifera very
rare.
394-402 Sand, light-gray; 90 percent very fine to medium-grained, angular to subangular quartz sand. 10 per
cent gray clay and silt matrix, unconsolidated • but
compact. Fine mica flakes prominent. Trace of dark-
green glauconite and pyrite aggregates. Ostracoda
and Foraminifera rare.
402-410 Sand and clay, brown; 70 percent very fine to medium-grained angular to subrounded quartz sand. 30 per
cent brown silty clay matrix, unconsolidated. Mica
flakes and black litgnitized wood fragments promi
nent. Trace of red hematite aggregates, light-green
glauconite and pyrite aggregates. No microfossils.
410-427 Sand, light-gray; 85 percent medium-grained subangular to subrounded quartz sand. 15 percent gray
silt and clay matrix, unconsolidated. Trace of black
lignitized wood fragments. No microfossils.
427-442 Sand, light-gray; Same as 410-427-foot interval. No
microfossils.
442-448 Sand and clay, gray; 55 percent coarse to fine-grained
subrounded to angular quartz sand. 45 percent gray
silty-clay matrix, unconsolidated but compact. Red
72

hematite aggregates and dark-green glauconite promi
nent. Trace of mica flakes, black "Ugnitized wood
fragments and pyrite aggregates. Ostracoda and
Foraminifera rare.
448-462 Sand, gray; 90 percent coarse to medium-grained sub-
rounded to subangular quartz sand. 10 percent gray
clay matrix, unconsolidated. Trace of light-green
glauconite and pyrite aggregates. No microfossils.
462-473 Sand and silt, gray to yellow. 60 percent coarse to
fine-grained subrounded to angular quartz sand. 40
percent gray to mottled-yellow silt matrix, unconsoli
dated. Dark-green glauconite, mica flakes and shell
fragments prominent. Limonitic staining of quartz
and matrix common. Ostracoda and Foraminifera
common.
473-4S7 Sand, gray; 80 percent medium to fine-grained sub
rounded to subangular quartz sand. 20 percent gray
silt matrix, unconsolidated. Dark-green medium-
grained glauconite prominent. Trace of coarse brok
en shell fragments and pyrite aggregates. Ostracoda
and Foraminifera very rare.
4S7-497 No sample.
497-511 Sand, gray; S5 percent medium to fine-grained sub
angular quartz sand. 15 percent gray silt and clay
matrix, unconsolidated. Trace of fine mica flakes
and broken shell fragments. No microfossils.
511-515 Sand and silt, gray; 65 percent fine to medium-grained
angular to subangular quartz sand. 35 percent gray
micaceous clay matrix, unconsolidated. Trace of
dark-green glauconite, pyrite aggregates, and broken
shell fragments. No microfossils.
515-525 Sand and silt, gray; Same as 511-515-foot interval. No
microfossils. —
525-537 Sand and silt, dark-gray; 60 percent fine to medium-
grained subangular quartz sand. 50 percent dark
gray silt matrix, unconsolidated but compact. Mica
flakes and broken shell fragments prominent. Trace
of black lignitized wood fragments. Ostracoda and
Foraminifera rare.
537-552 No sample.
552-562 Sand, gray; 95 percent medium-grained angular to sub-
angular quartz sand.. 5 percent gray clay matrix, un
consolidated. Trace of black lignitized wood frag
ments. Ostrcaoda and Foraminifera rare.
562-573 Sand, gray; Same as 552-562-foot interval. Ostracoda
and Foraminifera rare.
Ostracoda from the 281-573-foot intervals include:
Cytheridea (Hat>locytheridea). monviouthensis
Berry
Cytheridea (Haplocytheridea) terryi Swain
Brathycythere ledaforma (Israelsky)
Brachycythere sphenoides (Reuss)
Brachycythere nausiformis Swain
Upper Creteaceous—Tuscaloosa formation
573-5S2 Sand and silt, brown to pink; 70 percent coarse to
medium-grained subrounded to subangular feldspath-
ic quartz sand. 30 percent brown to pink clay ma
trix, unconsolidated but compact. Soft chloritic-
type mineral prominent. Trace of very fine-grained
glauconite and mica flakes. Hematitic staining of
interstitial material common.
5S2 590- Sand and silt, brown to pink; Same as 573-5S2-foot
interval.
590-602 Sand and silt, brown to pink; 75 percent coarse to
fine-grained subrounded to angular quartz sand. 25
percent reddish-brown silt matrix, unconsolidated
but compact. Black lignitized wood fragments prom
inent. Traces of a soft chloritic-type mineral and
drak-green fine-grained glauconite. Hematitic stain
ing of interstitial material common.
602-605 Sand and silt, brown to pink; Same as 590-602-foot
interval.
605-622 Sand and silt, gray; 75 percent fine to coarse grained
angular to subangular feldspathic quartz sand. 25
percent brown micaceous silt matrix. Dark-green
medium-grained glauconite and broken shell frag
ments prominent. Hematite and pyrite aggregates
common.
622-639 Sand, gray; 85 percent medium to coarse grained
angular to subrounded feldspathic quartz sand. 15
percent gray silt and clay matrix unconsolidated.
Trace of hematite aggregates and dark-green glauco
nite.
639-652 Sand and clay, mottled pink to gray; 65 percent very
coarse to medium-grained rounded to subangular
feldspathic quartz sand. 35 percent pink to gray clay
matrix, unconsolidated but compact. Hematite aggre
gates prominent. Trace of coarse mica flakes and
abraded shell fragments.
/ 652-662 Sand, gray to yellow; 90 percent coarse to medium
grained, subrounded to angular, feldspathic quartz
sand. 10 percent gray to yellow clay matrix, uncon
solidated. Hematite staining of sand grains predomi
nant. Hematite aggregates prominent. Trace of^light-
green very fine-grained glauconite.
662-6S2 Sand and clay, pink. 60 percent medium to very fine
grained subangular to angular feldspathic quartz
sand. 40 percent red to pink micaceous clay matrix,
unconsolidated but very compact. Hematite aggre
gates prominent. Trace of broken shell fragments
and dark-green glauconite.
6S2-692 Sand and clay, pink; Same as 662-682-foot interval.
692-702 Sand, pink; SO percent coarse to fine-grained subrounded to angular feldspathic quartz sand. 20 per
cent pink to red micaceous clay matrix, unconsoli
dated. Hematite staining of sand predominant. Trace
of hematite aggregates and dark-green very fine
grained glauconite.
Remarks: No microfossils were recovered from the 573-702-
foot interval. This interval is placed in the Upper Cretaceous
Tuscaloosa formation on the basis of lithology and strati-
graphic position.
73

MAP OF
MARTIN COUNTY
Showing the location of water supplies
Scale of Miles
0 12 3 4 5
Figure 11.

TABLE 14. Rkcouds of Wkj.i.s i.\ Martin Cointy
Wcll
no.
Lucation*
8
•J
10
11
12
13
14
15
16
17
18
20
21
Z)i mites NW of Oak City
Oak City
....do
....do
.do.
.do..
Owner
Martin Co. Board of
Education
L. J. Davenport
Wersley and Ayers
Martin Co. Board of
Education
....do
Tyjxj
of
Well
Screen
...do...
...do...
.do..
do Town of Oak City
...do
2'4 miles S\V *: Oak City..
Hamilton
...do
.do..
..do.
.do..
E. Hyman
L. Ross
F. Everett
Town of Hamilton..
....do
.do..
..do..
Hamilton
....do
....do
3 miles of Haniilton
23
24
25
20
27
28
29
30
31
32
33
34
35
33 -i miles S of Hamilton
4 miles SE of Hamilton
2 miles E of Gold Point
Gold Point
do
miles S of Oak City.
5 miles S of Oak City
Town of Hamilton
G.Oglesby
W. Beach
Martin Co. Board of
Education
J. H. Lillard
.do..
..do..
Depth
(ft.)
.do.
Gravel-
wall
Screen
...do...
...do...
...do...
...do..
..do..
Taylor's Dairy.
L. Window
J. Everett
E. Vandiford
R. H. Salisbary
W. Purvis
Open-
end
Screen
...do..
...do..
Dug
Point
Open-
end
...do..
mile W of Robersonville C. D. Jenkins
...do
Robersonville
Robersonville..
.do
2»<o miles SE of Robersonville..
....do
l}-2 mile \V. of F.veretts
1 mile \V of Ereretts
Everetts
....do
3J4 miles W of Williamston.
1Yi mile3 S\Y ot Williamston
Grimes Dairy
Town of Robersonville...
Town of Robersonville-..
Robersonville Coal & Ice
Co
S. Cherry
S. Everett
V. Bunton
W.Ausbon
Barnhilland Taylor
Martin Co. Board of
Education
....do
Prison-Camp No. Ill
2 miles W of Williamston County Home..
lile W of Williamston Van Taylor
Williamston.
_..do
...do
...do
Williamston.
....do
....do
.do
.do..
1 mile S of Williamston.
1 mile S.of Williamston..
..do...
...do...
Screen
Point -
Open-
end
...do...
Screen
Screen
...do...
Dug
Open-
end
.. do..
...do..
Screen
..do...
..do...
..do...
..do...
...do...
Town of Williamston..
-do..
...do
Town of Williamston.
...do
....do
.do
Gravel-
wall
Screen
...do...
...do...
Gravel-
wall
.. do...
...do...
do.
Mathieson Chemical Co..
Roanoke Country Club-
Town and Country Res
taurant
J.R.Everett-..-
...do...
Screen
...do...
119
225
100
295
125
374
100
100
218
180
135
150
140
295
100
150
120
29
75
65
68
60
40
165
15
138
121
390
390
300
185
180
236
300
325
112
165
300
280
500
450
440
440
Diam
eter
(in.)
360
460
470
440
420
410
20f>
Depth
of
casing
(ft.)
4
4
4
36
IX
4
2H
IK
4
IX
IX
IX10-8
10-8
40
IX3
4
6
6
4
6-2
6-4
4
18-8
20-8
20-8
Water-bearing
material
Sand..
100
295
120
S4
340
100
100
21S
ISO
135
140
140
255
91
145
116
10
54
60
40
165
15
138
121
390
390
300
185
180
123
300
325
108
165
300
272
..do..
..do..
.do..
.do..
...do..
...do..
...do..
...do..
Sand..
....do..
Sand..
..do.,
.do..
...do..
Marl..
Water
level
(ft/:
Yield
(gpm)
—53.42 400
Draw
down
(ft.)
300
Sand.
Marl
...do
...do
....do
Sand
Sand and Clay-
Sand...
....do..
...do..
Sand...
...do..
Sand and day..
Sand
...do
.do
.do
500
450
440
440
360
360
460
470
440
420
410
200
.do..
...do..
Sand..
....do..
..do..
..do..
..do..
..do..
Sand...
....do..
....do..
....do..
..do..
..do..
..do..
..do..
Flows
Flows
Flows
Flows
Flows
-16.2
Flows
Flows
—35.0
—37.54
450
.700
Remarks
Analysis. Temperature 63°F.
Analysis. Public supply.
Water level and yield
measured.
Analysis. Public supply
Temperature 63°F.
Analysis. Public Supply.
Yield measured.
Water level reported by driller
1953.
Yield measured, 1956.
Analysis.
Analysis.
Analysis. Public supji
Temperature 64°F.
Analysis.
70
Water level measured.
Analysis.
Analysis.
Analysis.
Analysis.
Analysis.
Water level reported by
driller, 1953.
Analysis. Public supply.
Not in use.
Analysis. Public supply.
Yield measured.
Yield and drawdown mea
sured.
Water level measured.
75

TABLE 14. Rkcokus ok Wki.i.s in Mautin Coi'nty—Continued
Well
no.
54
55
55
57
58
59
00
61
62
03
64
65
66
07
73
Location
1*4 miles S of Williamston. -
2 miles S of Williamston
3 miles S of Williamston.
4 miles S of Williamston...
...do
I mile W of Williamston...
Boargrass
OwnKit
A. Boyce
Martin Co. Board of
Education
\V. 0. Corey..
2>-i miles E of Beargrass...
Z)i miles SE of Beargrass..
3 miles E of Smithwick.
....do
....do
5 miles E of Jamesville
Jamesville
J. Hadley
H. Biggs
("5. Harrison
Martin Co. Board of
Education
B. Harrison
H. Teale
J. J. Robinson
F. T. Hardison
M. Gurkin
Martin Co. Board of
Education
H. J. Hardison
..do..
..do..
....do
....do
Jamesville..
3 miles E of Jamesville.
.do..
..do..
C. C. Fleming
H. T. Hardison...
Jamesville School..
W. Cherry..
Typo
of
Well
Dug
Screen
.do..
..do..
..do..
Scrcen
0pen-
end
Point
Dug
Open-
end
Screen
Open-
end
do.
..do.
...do..
...do..
Open-
end
...do.
Depth
(ft.)
14.4
220
423
196
l'JS
400
235
311
110
20
20
110
130
127
130
t)7
100
140
ISO
165
Diam
eter
(in.)
36
4
4-2
4-2
4-2
2
2
36
2
4
Depth
or
casing
(ft.)
4-2
2
10
215
j 423
196
108
I 400
| 235! 311
110
20
18
90
128
127
130
97
100
140
126
165
Water-bearing
material
Sand
...do..
...do..
do..
...do..
do..
Sand..
...do..
...do
Marl
...do
Limestone...
Limestone..
....do
....do
....do
....do
.do
Limestone.
....do
Water
level
Ift)
-10.
-20.0
-29.0
| Draw-
Yield i down
(gpnO ! (ft.)
-34.40 |
-12.7
—35
Flows
—13.0
Flows
Flows
Flows
Flows 35I
Remarks
Water level measured.
Water level reported by
driller, 1952:
Analysis. Water level
measured.
Analysis.
Water level measured.
Water level measured.
Analysis.
Water level reported hy
driller, 1954.
Water level measured, 1956.
Analysis.
Analysis. Flow measured
1956. Temperature 63°F.
Analysis. Flow measured
1956.
Flow measured 1956.
Analysis.
TABLE 15. Chemical Analyses of Ground Water fkom Maktin County—Continued(Numbers at heads of columns correspond to well numbers in table of well wata)
(Parts per million)
Silica iSiOz)
Iron (Fe). total
Iron (.Fe), in solution
Calcium (Ca)
Magnesium (Mg)
Sodium and potassium (Na+K)..
Bicarbonate (HCO3)
Sulfate (SO4)
Chloride (Cl)
Fluoride (F)
Nitrate (NO3) ■
Dissolved solids.-
Hardness as CaCO3
pH
Water-bearing material..
Date of collection.
279
1
4
111
Sand
11-29-43
37
1.1
.04
28
9.0
33
211
.7
4.3
.2
. .0
211
106
7.3
Sand
11-19-56
13 15
. 28
.35
.11
9.6
4.4
99
305
2.0
5.5
.5
1.2
302
42'
7.8
Sand
28
.52
.15
4.9
4.7
98
296
2.1
6.0
.5
1.2
292
37
7.3
Sand
11-20 56 I 11-19-56
252
130
Sand
11-22-43
28
258
1
5
.3
147
Sand
11-22-43
Analyzed by the Quality of Water Branch, U. S. Geological Survey.
76

TABLE 15. Chemical Axalyhk* of Qkocyh Watkh puoji M.uni.v Col-sty(Numbers at heads of cMumns correspond to well numbers in table of well wata)
Silica (S1O2) -
Chloride ("CD
Fluoride (F) --
Nitrate (NO 3) -
pn -
Water-bearing material --
(Parts
29
21
.13
.05
1.3
101
404
7.S
IS
1.1
0
7.9
Sand
9-26-55
ier million)
30
22
.30
1.1
3S6
444
156
235
1017
20
7.8
Sand
2-10-48
33
370
4
3
1.0
18
Sand
11-24-43
34
318
2
2
15
Sand
11-24-43
36
358
30
2.S
16 j
Sand
11-22-43 i
39
.13
.03
8.8
8.2
125
387
.!)
3.2
.9
2.4
356
50
7.8
Sand
Analyzed by the Quality of Water Branch. U. S. Geological Survey.
Silica (SiQz)
Iron (Fe), total
Iron (Fe), in solution
Calcium (Ca)
Magnesium (Mg)
Sodium and potassium (Na+K).
Bicarbonate (HCO3)
Sulfate iSCm). --
Chloride (Cl) -
Fluoride (F)
Nitrate (XOs)
Dissolved solids
Hardness as CaCOs
pH. ■
40
Water-bearing material.
Date of collection.
387
3
Sand
11-24-43
.50
1.8
2.7
326
368
63
250
1.5
1.2
S72
16
7.9
Sand
.0.
10-15-47
1.1
1.2
153
365
4.8
7.5
2.0
1.2
386
Sand
56
10-15-47
14
.53
.34
1.4
1.0
225
392
30
99
1.7
.0
582
8
7.9
Sand
3-9-54
57 00
16 I
.26 ; -
.00 ' -
24 j17 !
67 I
324 275
.5 I 1
4.8 1 3
.4 I .5
3-1 I299 ---.
127 I 1507.4 !
Sand Sand
2-17-55 I 11-22-43
Analyzed by the Quality of Water Branch, U. S. Geological Survey.
Silica (S1O2) -
Iron (Fe), total. -
Iron (Fe), in solution
Calcium (Ca) - ■
Magnesium (Mg)
Sodium and jwtassium (Na+K) -
Bicarbonate (HCO3)...-
Sulfatc (SCm)
Chloride (Cl)... -
Fluoride (F)
Nitrate (NO3)
Dissolved solids
Hardness as CaCO3
Water-bearing material.
Date of collection
65
288
201
Limestone
11-20—1M
67
32
.54
.02
07
8.8
13
265
2.4
7.5
.1
.4
270
203
7.0
Limestone
0.50
258
Limestone
11-29-43
255
2
6.0
186
7.4
Limestone
Analyzed by the Quality of Water Branch, U. S. Geological Survey.
77

Pitt County
(Area 656 square miles, population 63,789)
Pitt County is a roughly rectangular area that lies
in the south-central section of the Greenville area.
It is bounded by Edgecombe, Martin, Beaufort, Cra
ven, Greene, and Lenoir Counties. Greenville, the
county seat, is the largest town in the county as well
as in the area of investigation. Other population
centers in the county include Ayden, Bethel, Falk
land, Farmville, Grifton, and Grimesland.
The central and northern parts of the county are
drained by the Tar River and its tributaries. The
southern part of the county is drained by Contentnea
Creek, Little Contentnea Creek, and Swift Creek; all
of which drain into the Neuse River. The county,
chiefly agricultural, is the largest producer of tobac
co in the State. Most industries are in and near
Greenville.
Geology.—Surficial clays, sands, and gravels of
Quaternary age occur as a thin layer of sediments
over most of Pitt County. They overlie sediments
of Miocene, Eocene, Paleocene, and Cretaceous age.
Only in the major stream valleys and in artificial
excavations are older formations exposed. The sur-
ficial deposits range in thickness from a few feet to
as much as 25 feet. Their greatest thickness is in or
adjacent to the present stream valleys and not in
the interstream areas, suggesting a comparatively
recent fluviatile origin, rather than a marine origin,
for much of the material. Underlying the surficial
deposits are blue clays and marls of the Yorktown
formation of late Miocene age. This unit, like the
overlying surficial material, overlies formations of
Eocene, Paleocene, and Cretaceous age over large
areas of the county. The Yorktown formation in
Pitt County ranges from less than a foot to as much
as 60 feet thick; the greatest thickness is recognized
in the northeastern part of the county. In outcrop,
thickness of less than a foot to as much as 15 feet
have been recognized. Underlying the Yorktown for
mation are impure shell limestones and caleareous
sands and calcareous clays of the Castle Hayne lime
stone of Eocene age. This. formation at one time
probably covered large segments of Pitt County but
is now confined to the southern and eastern segments
of the county. The Castle Hayne limestone is exposed
in several marl pits in the southern part of the coun
ty near Quinerly and is penetrated sporadically in
wells along the eastern county line as far west as
Pactolus. Present information indicates that the for
mation is everywhere less than 30 feet thick in Pitt
County.
78
The Beaufort formation of Paleocene age under
lies the Castle Hayne limestone along the eastern
edge of the county and underlies the Yorktown formation as far west as a line joining Shelmerdine,
Simpson, and Stokes. The presence of the Beaufortformation in Pitt County is based entirely on micro-
faunal analysis of well cuttings. Total thickness ofthe formation in the county is no greater than 60
feet.
The Tertiary sediments in Pitt County are under
lain by lenticular sands and clays that comprise the
Peedee, Black Creek, and Tuscaloosa formations of
Late Cretaceous age. These formations, the younger
being deposited as regressive offlaps on the older, are
exposed along Little Contentnea Creek and the Tar
River. Typical exposures occur along Little Content
nea Creek, north of Scuffleton to the Wilson County
line, and along the Tar River, north of Greenville to
the Edgecombe County line. In the interstream areas
the Cretaceous formations are not exposed, being
covered by younger Miocene and Quaternary mater
ial. The combined thickness of the Upper Cretaceous
sediments in a well at Greenville, the geographic
center of the county, is 570 feet. The Upper Cretac
eous sediments thicken southeastward from Green
ville and thin toward the northwest.
Sediments of Early Cretaceous age were encount
ered beneath Upper Cretaceous strata in a well drilled
for the city of Greenville. This well penetrated 146
feet of Lower Cretaceous clays and sands. The total
thickness of this unit and its areal extent are un
known. It is probable that Lower Cretaceous sedi
ments underlie most of Pitt County.
At Fountain, Pitt County, a granite monadnock of
pre-Cretaceous age is exposed at the surface along
the eastern edge of the town (Mundorff, 1947, p.
103). This body of granite is surrounded by sedi
ments at least 400 feet thick, and is the only body of
igneous or metamorphic rock known to crop out in
the Greenville area.
Ground water.—Except for part of the municipal
water supply for Greenville, all public and private
water supplies in Pitt County are obtained from
wells. Greenville's municipal supply, obtained from
the Tar River for a number of years, is now being
supplemented by ground water. Large ground-wa
ter supplies of several million gallons per day prob
ably could be pumped from wells in any part of Pitt
County. Deep gravel-wall wells in the county are
capable of yielding 400 to 1,000 gpm, with specific
capacities ranging from 4 to 10 gpm per foot of
drawdown or better.

Quaternary sands and gravels, tapped by dug and
driven wells, are the major source of waiter for the
county. Occasionally these wells, which range in
depth from 10 to 30 feet and yield from 1 to 20 gpm,
obtain water from near-surface sand and shell beds
of the Yorktown formation.
Small-diameter jetted wells obtain water from
sands of Paleocene and Cretaceous age. These wells,
either open-end or single-screen, have been drilled as
deep as 400 feet in the county. Their yields range
from 5 gpm to as much as 100 gpm.
The large municipal and industrial wells, as well
as the larger irrigation wells, are usually gravel-wall
wells with multiple screens. Depending on the loca
tion in the county, these wells obtain water from
several sands in two or more of the Cretaceous aqui
fers and yield 400 to 1,000 gpm.
Water-table conditions prevail at shallow depths in
all material from Cretaceous to Recent age through
out the county. The water table fluctuates season
ally in response to variation in the amount of precipi
tation and degree of evapotranspiration. The normal
ground-water cycle observed over a period of several
years indicates that water levels are at a peak in
late winter and early spring, and at their lowest
point in late summer and early fall. Even at its
lowest seasonal point the water level generally is
within 15 to 20 feet of the land surface throughout
the county. Water in all material below a depth of
about 50 feet is under artesian pressure and general
ly rises in wells to within 30 feet of the surface in
interstream areas. Along the major streams and
their tributaries the piezometric surface is very close
to, or above, the land surface, and most of the wells
tapping artesian aquifers flow at the land surface.
At any given locality the pressure head increases
with depth.
The chemical quality of water in the aquifers in
Pitt County is not uniform. The shallow aquifers
usually contain waters that is slightly corrosive and
may contain objectionable amounts of iron, but is
otherwise acceptable. The deep artesian water in
the sands of Cretaceous age generally is soft and of
the sodium bicarbonate type. The water from aqui
fers that contain beds of impure limestone is moder
ately hard but otherwise is of good quality. Water
in the aquifer of Lower Cretaceous age is saline and
unsuitable for domestic purposes.
The following well log describes the physical com
position of the Cretaceous acquifers in Pitt County
(see figure 12 for well location).
Pitt County
Location: Thirteenth and Washington Streets, Greenville,
North Carolina.
Owner: City of Greenville
Date drilled: 1956
Driller: Heater Well Co.
Elevation of well: 59 feet above sea level
Hydrologic Information
The following log is given for the test well (number 26)
that penetrated to a depth of 754 feet. The production well
(number 27) was finished in the same hole to a depth of 460
feet.
Diameter of well: 12-10 inches
Depth of well:460 feet
Cased to: 460 feet, plugged below 460 feet
Finish: Gravel wall and screens
Static (nonpumping) water level: 50 feet below land surface
Yield: 750 gpm with a drawdown of 132 feet, 1956
Temperature: 63°F
Depth
(feet)
0-6
6-9
Log of Well
Quaternary—sand and clay
No sample.
Sand and clay, light-tan. 65 percent fine-grained sub-
angular quartz sand. 35 percent tan clay matrix, un-
consolidated. Trace of black opaques. No microfos-
sils.
9-18 Clay and sand, mottled-yellow; 40 percent fine-grained
angular qurtz sand. 60 percent mottled-yellow clay
matrix, unconsolidated. Limonite staining of sand
and matrix prominent. No microfossils.
Upper Miocene—Yorktown formationX
18-28 Clay, gray; 15 percent fine-grained angular quartz ^
sand. 85 percent gray clay matrix, unconsolidated °but compact. Microfossils very rare.
28-38 Clay, gray; Same as lS-2S-foot interval with the addi
tion of fine mica flakes. Microfossils very rare.
Microfossils from the lS-3S-foot interval consist most
ly of unidentified diatoms. The only ostracode recov
ered was
Actinocytherein mundorffi (Swain)
Upper Cretaceous—Peedee formation
38-53 Sand and clay, gray; 75 percent coarse to medium-
grained rounded to subrounded quartz sand. 25 per
cent gray clay matrix., unconsolidated. Trace of
black phosphate pebbles and gray shell fragments.
Ostracoda and Foraminifera rare.
53-66 Sand and clay, gray; Same as 38-53-foot interval. Os
tracoda and Foraminifera rare.
66-78 Sand, gray; 85 percent fine to coarse-grained angular
to subrounded quartz sand. 15 percent gray clay
matrix, unconsolidated. Trace of dark-green giauco-
nite, black phosphate pebbles, and gray shell frag
ments. Ostracoda and Foraminifera rare.
79

7S-91 Sand, gray; Same as 66-7S-foot interval. Ostracoda
and Foraminifera rare.
91-101 Sand, gray; Same as 66-7S-foot interval. Ostracoda
from the 38-101-foot interval include:
Brachycythere rhomboiclalis (Berry)
Velarocythere cacumenata Brown
Yelarocythere arachokles (Berry)
Trachyleberis communis (Israelsky)
Trachyleberis pidgeoni (Berry
Uiwer Cretaceous—Black Creek formation
(Snow Hill marl member)
101-116 Clay and sand, black: 25 percent very fine to fine
grained angular quartz sand. 75 percent black mica
ceous clay matrix, unconsolidated but very compact.
Trace of glauconite marcasite aggregates, black ligni
tized wood fragments and white chalky shell frag
ments. Ostracoda and Foraminifera common. Inocer-
amiis prisms.
116-128 Clay and sand, black; Same as 101-116-foot interval.
Ostracoda and Foraminifera common. Inoceramus
prisms.
12S-139 Clay and sand, black; Same as 101-116-foot interval
with a slight increase in glauconite content. Ostra
coda and Foraminifera common.
139-163 Sand and clay, dark-gray; 65 percent fine-grained
angular to subrounded quartz sand. 30 percent gray
to black silty-clay matrix, unconsolidated. 5 percent
dark-green fine-grained glauconite. Trace of gray
shell fragments marcasite aggregates and black lig
nitized wood fragments. Ostracoda and Foraminifera
common.
Ostracoda from the 101-153-foot interval include:
Cytheridea (Haplocytliericlea) monviouthensis
Berry
Trachyleberis gapensis (Alexander)
Brachycythere ledaforma (Israelsky
Cytheropteron j)e?iderensis Brown
Orthonotocythere sulcata Brown
Protocythere paratriplicata Swain
Upi)er Cretaceous—Black Creek formation (lower member)
163-178 Sand, light-gray; 85 percent coarse to medium-grained
subrounded to subangular quartz sand. 15 percent
gray clay matrix, unconsolidated. Trace of glauco
nite and black lignitized wood fragments. Ostracoda
and Foraminifera rare.
178-1S7 Sand, gray; Same as 163-178-foot interval. Ostracoda
and Foraminifera rare.
1S7-200 Sand and clay, gray; 60 percent very fine to fine-grain
ed angular quartz sand. 40 percent gray clay matrix,
unconsolidated but very compact. Dark-green fine
grained glauconite prominent. Trace of red hematite
staining. Ostracoda and Foraminifera very rare.
200-212 Sand, gray; 80 percent medium to fine-grained sub-
angular to angular quartz sand. 20 percent gray silt
and clay matrix, unconsolidated. Mica flakes and
dark-green glauconite prominent. Trace of red hema
tite aggregates. Ostracoda and Foraminifera rare.
212-222 Sand and clay, gray; 65 percent very fine to medium-
grained angular quartz sand. 35 percent gray clay
matrix, unconsolidated but compact. Trace of dark-
green glauconite and black lignitized wood frag
ments. No microfossils.
222-241 Clay and sand, brown; 40 percent very fine to fine
grained angular quartz sand. 60 percent mottled-
brown to gray clay matrix, unconsolidated. Dark-
green glauconite and black lignitized wood fragments
prominent. Trace of marcasite aggregates and mica
flakes. Ostracoda and Foraminifera rare.
241-253 Sand and silt, tan; 65 percent fine-grained angular
quartz sand. 30 percent tan silt matrix, unconsoli
dated. 5 percent light-green fine-grained glauconite.
Trace of mica flakes. Ostracoda and Foraminifera
very rare.
253-263 Sand, tan: S5 percent medium to fine-grained angular
quartz sand. 15 percent tan clay matrix, unconsoli
dated. Trace of black lignitized wood fragments. No
microfossils.
263-275 Sand and silt, brown; 70 percent fine to medium-
grained angular to subangular quartz sand. 30 per
cent brown silt matrix, unconsolidated. Trace of
marcasite and hematite aggregates. Ostracoda and
Foraminifera rare.
275-278 Sand, light-gray; 85 percent very coarse to medium-
grained subrounded to subangular quartz sand. 15
percent gray silt and clay matrix, unconsolidated.
Trace of glauconite and black lignitized wood frag
ments. Ostracoda and Foraminifera rare.
278-295 Sand and clay, brown; 70 percent coarse to fine
grained subrounded to angular quartz sand. 30 per
cent brown clay matrix, unconsolidated. Trace of
glauconite marcasite and hematite aggregates. No
microfossils.
295-309 Sand, tan: SO percent medium to fine-grained sub
angular to angular quartz sand. 20 percent tan silt
and clay matrix, unconsolidated. Marcasite aggre
gates and black lignitized wood fragments promi
nent. Trace of light-green glauconite.
309-328 Sand and clay, tan; 65 percent coarse to fine-grained
subrounded to angular quartz sand. 35 percent tan
clay matrix, unconsolidated. Marcasite aggregates
prominent. Trace of black, lignitized wood frag
ments. No microfossils.
32S-338 Sand, tan: 90 percent coarse to medium-grained sub
rounded to subangular feldspathic quartz sand. 10
percent tan silt and clay matrix, unconsolidated.
Trace of dark-green glauconite, shell fragments, and
black lignitized wood. Ostracoda and Foraminifera
very rare. /
33S-365 Sand, tan; Same as 32S-33S-foot interval. No micro
fossils.
365-377 Sand, tan; Same as 328-33S-foot interval. No micro
fossils.
377-390 Sand and silt, tan; 70 percent medium to fine-grained
angular quartz sand. 30 percent tan silt matrix,
unconsolidated. Dark-green fine-grained glauconite
prominent. Trace of chalky shell fragments black
lignitized wood and mica flakes. Ostracoda and
Foraminifera rare.
390-403 Sand and silt, tan; Same as 377-390-foot interval.
Ostracoda and Foraminifera very rare.
80

403-423 Sand and silt, tan; Same as 377-390-foot interval.
Ostracoda and Foraminifera very rare.
423-442 Sand, white; 95 percent very coarse to medium-grain
ed rounded to subrounded quartz sand. 5 percent
gray clay matrix, unconsolidated. Trace of marcasite
aggregates. No microfossils.
Ostracoda from the 163-442-foot interval include:
CytJieridea (Haplocytheridea) monmoutliensis.
Bsrry
Brachycythere cf. B. nausiformis Swain
BracJiycythere sphenoides Reuss
Cythere-is quadrialira Swain
Upper Cretaceous—Tuscaloosa formation
442-453 Sand and clay, pink to red; 70 percent coarse to med
ium-grained subangular feldspathic quartz sand. 30
percent red clay matrix, unconsolidated but very
compact. Dark-red hematite aggregates prominent.
Staining of quartz grains SO-90 percent. No micro-
fossils.
453-463 Sand, pink; 85 percent medium to fine-grained sub-
angular to angular quartz sand. 15 percent pink clay
matrix, unconsolidated. Trace of coarse mica flakes
hematite aggregates and dark-green very fine-grained
glauconite. No microfossils.
463-47S Sand, pink; Same as 453-463-foot interval. No micro
fossils.
47S-492 Sand, light-brown; SO percent coarse to fine-grained
angular and abraded feldspathic quartz sand. 20
percent brown silt and clay matrix, unconsolidated.
Dark-green glauconite prominent. Trace of coarse
mica flakes and hematite aggregates. No microfos
sils.
492-510 Sand, light-brawn; Same as 478-492-foot interval. No
microfossils.
510-518 Sand, light-brown; Same as 478-492-foot interval. No
microfossils.
518-538 Sand, light-brown; Same as 478492-foot interval. No
microfossils.
538-558 Sand, light-brown; Same as 478-492-foot interval. No
microfossils.
55S-5S3 Sand, light-brown; Same as 47S-492-foot interval. No
microfossils.
583-592 Sand, light-brown; Same as 478-492-foot interval. No
microfossils.
592-608 Sand and clay, light-gray; 75 percent medium to fine
grained subangular feldspathic quartz sand. 25 per
cent gray clay matrix, unconsolidated but very com
pact. Dark-green glauconite mica flakes and hema
tite aggregates prominent. No microfossils.
Lower Cretaceous—undifferentiated
60S-63S Sand, gray; 85 percent very coarse to medium-grained
subrounded quartz sand. 10 percent gray clay ma
trix unconsolidated. 5 percent coarse blocky grains
of green feldspar. Trace of marcasite aggregates and
black lignitized wood fragments exhibiting partial
filling and replacement by marcasite. Ostracoda
rare.
63S-650 Sand, gray; Same as 60S-63S-foot interval. Ostracoda
rare.
650-662 Sand, gray; Same as 60S-63S-foot interval. Ostracoda
rare.
662-6S5 Clay and sand, green; 40 percent very fine to fine
grained angular quartz sand. 60 percent green clay
matrix, unconsolidated but very compact. Broken
shell fragments and dark-green glauconite promi
nent. Trace of black lignitized wood fragments.
Ostracoda abundant.
6S5-710 Clay and sand, green; Same as 662-685-foot interval.
Ostracoda abundant.
710-735 Sand and clay, green; 70 percent fine to very-fine
grained angular feldspathic quartz sand. 30 percent
green clay matrix, unconsolidated to indurated in
streaks. Broken shell fragments and dark-green
glauconite prominent. Ostracoda abundant.
735-754 Sand and silt, reddish-brown; 70 percent coarse to
fine-grained subangular feldspathic quartz sand. 30,
percent reddish-brown silt and clay matrix, uflc*on-
solidated to indurated in streaks. Coarse broken shell
fragments and dark-green glauconite prominent.
Trace of hematite aggregates. Ostracoda common.
81

00to
^rS/tV
MAP OF
PITT COUNTY
showing the locotion of wat«r supplies
Scole of Miles
0 1 2 3 4 5
FlOUKE 12.

TABLE lfi. Rkcokds of Wki.i.s in Pitt Cocxty
Well
no.
9
10
11
12
13
14
15
16
17
18
19
20
21
22
23
24
25
20
28
29
30
31
32
33
34
35
36
37
33
39
40
41
42
43
44
45
46
47
48
49
50
51
52
53
54
55
56
57
58
59
Location
Bethel.
...do..
...do
I mile S of Bethel
12 mile NT. of Conzleion..
Stokes
1>> miles fc'E uf Stokes...
5 miles NE of Greenville.
of
Well
Town of Bethel.
....do
....do
J. Ourganus
J. Taylor
M. Whichard...
H. Woolaud
Mrs. Brewer
W. Rawls
Falkland
K> mile NW of Falkland.
Fountain
}4 mile S of Fountain
Farmville
—do
Farmville -
...do
Farmville.
.do..
...do
...do
IK miles XNE of Farmville..
3} •> miles ESE of Farmviiie..
Greenville..
...do
....do
.do.,
.do..
....do
....do
....do
.do
....do
....do
Greenville
2 miles NE of Greenville
Pactolus
Pactolus
1 mile NW of Grimesland
Gfimesland
....do
—do
\M miles SE of Grimesland..
2 miles W of Grimesland
VA miles NW of Black Jack..
.do.,
-do..
2 miles E of Winterville..
1 mile E of Winterville...
IK miles N of Winterville-.
1 mile W of Winterville
VA miles W of WinterviUe..
Winterville
...do
Winterville.
...do..;
...do
Ayden
MorrilL
[. Wooden
'own of Fountain.
Screen
Gravel-
wall
...do...
Screen
Open-
end
...do..
..do.
..do...
..do
R. Bell
Town of Farmville
...do
.do
.do..
.do..
Farmville Oil & Fertilizer
Co.
..do
A. C. Monk Co
E.W.May
W.Barrett
[,. B. Johnson
Open-
end
Dug
Screen
...do...
...do
Screen
Screen
...do..
Pepsi Cola Bottling Plant
City of Greenville.,
do
American Tobacco Co..
Honeycutt
.v.do._
...do...
...do...
Gravel-
wall
...do...
Test
Gravel-
wall
Screen
...do...
S. Crisp
W. Hoilowell
B. Whitley
C. Sheppard
H. T. Brown
J. Smith
Xorthside Lumber Co...
H.Forbes
C. Satherwaite
Pitt County Board of
Education
H. Edwards
L. Edwards
A. Hudson
M. Griffin
J.Winfield
J. L.Edwards
L.Buck
..do...
..do...
..do..
..do..
...do..
...do-
Screen
—do._
do-
.do.
.do..
Pitt County Home..
G. Worthington
D. Langston
W. Moye
G. Dail
Town of Winterville .
...do
Screen
...do-
-do...
—do-
Driven
Open-
end
Screen
Open-
end
...do-
Winterville School...
J. E.Jones
Mrs. J. Cox
Cory Stokes
...do
Screen
Open-
end
Screen
...do-
Screen
...do—
Gravel-
wall
Screen
...do—
.do—
do...
Depth
at.)
445
376
383
192
97
225
250
200
350
ISO
195
194
13
480
472
503
500
435
140
100
87
57
211
37C
373
460
71
100
92
77
9S
100
70
98
128
116
293
164
60
190
125
17
165
ISO
93
85
320
45
378
S6
86
157
306
S7
87
112
51
Diam
eter
(in.)
4.5
IK
IK
IK2
4
4
48
10-8
8
18-8
8
8
4
3
0
4
2
10
4.5
4
4
4
4
4
4
4
6
4
IK
3
4
6
4-2
IK
IK
2
4-
2
IK12
4
4
24-8
6
8
4
4
)cpth
of
casing
(ft.)
445
376
97
195
100
200
350
180
195
190
Waler-bearim:
material
Sand.
..do..
..do..
..do..
480
472
503
500
435
140
100
85
53
211
370
373
Marl...
Sand...
...do.,
—do..
....do..
—do.,
—do..
Flov*
Flow*
.do..
..do..
—do.,
—do..
Sand...
—do..
....do..
460
73
75
91
87
68
96
128
111
293
164
55
190
125
17
165
180
93
85
320
45
65
378
84
85
157
300
87
83
105
51
Sand...
—do.,
—do.,
—do..
....do..
.do..
..do..
..do..
..do..
..do..
.do.,
.do..
..do..
..do..
..do..
..do..
.-.do..
Sand._.
—do.,
—do..
..do..
...do..
...do..
...do..
Marl-
Sand...
—do..
....do
....do
.do
.do..
—do
..do
.do.,
-do.,
-do.
....do..
Sand..
—do..
-do.,
.do..
Flo*-*
FIott;
Yield
Draw
down
(ft.)
Remarks
Analysis. Public supply,
.do
-do..
'emperature 61°F.
.nalysis.
Analysis,
nalysis. Temperature 61°F.
'emperature 61°F.
Analysis. Public supply.
Dug in 1850 and still in use.
.nalysis. Public supply.
Public supply.
Analysis. Public supply.
Used for irrigation only.
Analysis.
Analysis, Drill stem test.
Public supply. Temperature
63°F.
Analysis.
Used for irrigation.
Analysis. Public supply.
Temperature 63°F.
Analysis. Public supply.
83

Well
no.
60
61
62
03
65
66
67
68
69
70
71
72
73
74
75
76
77
78
79
SO
81
82
S3
84
85
86
87
Location
Ayden
....do
do
do
2 miles E of Ayden
2\£ miles E of Ayden
3 miles E of Ayden
3K miles E of Ayden
4 miles E of Ayden
...do
K mile S of Ayden
H mile S of Ayden
2 miles S of Ayden
2H miles SSW of Ayden
3K miles SW of Ayden
4 miles SW of Ayden
..-do
Griftou
do
....do
4K miles E of Grifton
1H miles E of Stokestown
2 miles SE of Calico
2K miles ESE of Calico
. do
—do
TABLE 16
Owner
Town of Ayden
....do
....do
....do
do
J. H.Sutton
T. J. Cannon
R. Wilkcrson
R.L.Cox
R. Harris
...do
Jenkins Motor Co
Fred Little
J.C.Jackson
W.C.Gaspins
J. Turnage
J.B.Patrick
L. Gaspins
....do
....do
....do
J. Quinerly
A. Haddock
0. James
R. Adams
F. Lancaster
....do
. Records of
Type
of
Well
Gravel-
wall
...do...
Screen
Gravel-
wall
_..do...
Screen
—do.—
Open-
end
Point
Open-
end
Screen
...do.-
Screen
...do..
Dug
Open-
end
Screen
—do-
Gravel
wall
Screen
Open-
end
Point
Open-
end
—do-
Depth
(ft.)
152
155
600
436
505
123
57
110
15
ill
105
165
240
134
134
65
14
130
°80
135
135
150
137
57
18
90
60
100
Wells
Diam
eter
(in.)
8
8
10-0
8
10-8
4
Di
IK2
4-2
4
4
4
48
4
IK
3
8-6
s
IK
IK
IK
2
2
ix Pitt County—Continued
Depth
of
casing
fft.)
152
153
600
395
500
121
M
110
15
135
105
165
240
S3
100
65
6
90
280
120
135
135
137
57
18
57
50
50
Water-bearing
material
Sand
...do
...do
...do
...do
do
...do
...do
do
...do
.-do
...do
Sand
—do
—do
do
....do
....do -
do
....do
Sand
—do
....do
Marl
do -
....do
Water
level
tft.)
i
Flows
Yield
(gpm)
!
i
t
Draw
down
(ft.)
Flows 8.0.
; !
1
: l
1 1
Remarks
Analysis. Public supply.
Public supply.
Public supply.
Analysis. Public supply.
Analysis.
Yield measured, 1943. Public
supply. Temperature 65°F
Public supply.
Analysis. Public supply.
TABLE 17. Chemical Analyses of Ground Water from Pitt County
(Numbers at heads of columns correspond to well numbers in table of well data)
(Parts per million)
Silica (S1O2)
Iron (Fe), total
Iron (Fe), in solution
Calcium (Ca)
Magnesium (Mg) —
SocEsm and potassium (Na+K).
Bicarbonate (HCOs)
Sulate (S04)
Chloride (CI)
Fluoride (F)
Nitrate (NOa) -
Dissolved solids
Hardness as CaCO3
pH
Wawr-bearing material.
Date of collection ..
26
.18
1.8
3.2
301
354
129
172
1.3
1.2
826
18
7.8
Sand
4-28-47
.30
3.6
1.1
13
4
7.5
19
.1
4.6
68
14
5.4
Sand
7-11-49
13
.38
.22
7.5
1.0
13
34
7.0
9.8
.1
2.6
77
23
7.7
Sand
4-29-53
3SS
12
14
1.1
Sand
11-17-43
18
.07
.00
1.0
.8
88
172
8.6
32
.4
.3
244
f>
7.4
Sand
2-17-55
13
.02
.00
.4
.4
118
234
15
32
2.0
.5
312
3 .
8.1
Saud
2-17-55
Analyzed by the Quality of Water Branch, U. S. Geological Survey.
84

TABLE 17. Chemical Analyses of Guood Water from Pitt County—Continued
(Numbers at heads of columns correspond to well numbers in table of well data)
(Parts per million)
12 14 16 25 28 45
Silica (SiOz)
Iron (Fe), total
Iron CFe), in solution
Calcium (Ca)
Magnesium (Mg)
Sodium and potassium (Na-J-K)..
Bicarbonate (HCO3)
Sulfate (S04)
Chloride (01)
Fluoride (F)
Nitrate ^NOa)
Dissolved solids
Hardness as CaCO 3
pH
20
.It)
36
57
137
86
Water-bearing material..
285
118
Sand
Date of collection. 1-12-48
I
6.1
.20
.11
1.2
.8
143
227
27
72
1.0
1.2
379
6
7.5
Sand
16
.13
.05
2.0
156
238
30
85
1.0
1.0
410
6
7.5
Sand
9-28-56 9-2S-5o
.13
2.3
.7
S9
224
6.7
S.3
1.3
.0
9
S.O
Sand
10
.14
.03
3.0
3.3
603
711
217
320
1.6
.4
1520
21
•5.4
Sand
2-27-56 7-2-56
2
8
1.3
88
Sand
11-17-43
Analyzed by the Quality of Water Branch, U. S. Geological Survey.
54 55 60
Silica (S1O2)
Iron (Fe), total
Iron (Fe}, in solution
Calcium (Ca)
Magnesium (Mg)
Sodium and potassium (Na+K).
Bicarbonate (HCO3)
Sulfate (SO4)
Chloride (Cl)
Fluoride (F)
Nitrate (NO3)
Dissolved solids
Hardness as CaCO3
pH ... .......
31
1.5
28
2.3 .63
Water-bearing material..
2.9
8.2
227
2.4
9.2
.1
.1
237
1S4
7.2
Sand
73
1.7
8.7
213
8.9
17
.1
.2
249
189
7.3
Sand
42
2.9
9.2
155
4.5
3.4
.1
.0
157
117
7.5
Sand
16
.20
.01
9.1
.9
So
219
7.1
15
249
26
Sand
Date of collection. 7-11-49 7-11-49 2-9-45 5-3-55
.47
.05
6.8
4.1
US
298
14
22
1.1
.5
326
34
S.I
Sand
2-2-54
20
.23
.09
40
6.3
17
186
2.6
5.0
.3
.2
186
126
7.5
Sand
12-18-52
Analyzed by the Quality of Water Brauch, U. S. Geological Survey.
85

SELECTED BIBLIOGRAPHY
Berry, B. W., 1947, Marls and limestones of easternNorth Carolina: North Carolina Dept. Conserv.
and Devel. Bull. 54, 16 p.
Brown, P. M., 1957, Upper Cretaceous Ostracodafrom North Carolina: North Carolina Dept.
Conserv. and Devel. Bull. 70, 28 p.
1958, The relation of phosphorites to
ground water in Beaufort County, North Caro
lina: Econ. Geology, v. 53, p. 85-101.
1958, Well logs from the Coastal PlainofVorth Carolina: North Carolina Dept. Con
serv. and Devel. Bull. 72, 100 p.
Canu, Ferdinand, and Bassler, R. S., 1920, NorthAmerican early Tertiary Bryozoa: U. S. Nat.
Mus. Bull. 106, 879 p.
Cederstrom, D. J., 1945, Structural geology of southeastern Virginia: Am. Assoc. Petroleum Geolog
ists Bull., v. 29, no. I, p. 71-95.
Clark, W. B., Miller, B. L., Stephenson, L. W., Johnson, B. L., and Parker, H .N., 1912, The CoastalPlain of North Carolina: North Carolina Geol.
and Econ. Survey, v. 3, 552 p.
Cooke, C. W., and MacNeil, F. S., 1952, Tertiary stra-tigraphy of South Carolina: U. S. Geol. Survey
Prof. Paper 243-B, p. 19-29.
Dean, H. T., 1936, Chronic endemic dental .fluorosto:Jour. Am. Med. Assoc, v. 107, p. 1269-1272.
Drennen, C. W., 1953, Rectification of outcrop
ping Tuscaloosa group in Alabama: Am. Assoc.Petroleum Geologists Bull., v. 37, no. 3, p. 5^-
538.
Edwards, R. A., 1944, Ostracoda from the Duplinmarl (upper Miocene) of North Carolina: Jour.
Paleontology, v. 18, no. 6, p. 505-528.
Ferris, J. G., 1949, Ground water, in Wisler, C. O.,and Brater, E. F., Hydrology, p. 198-269: New
York, John Wiley and Sons.
_ _ 1950, A quantitative method for deter-
""mln~ing~ground-water characteristics for drain-
age design: Agr. Eng., v. 31, no. 6, p. 285-291.
Gardner, J. A., 1943, Mollusca from the Miocene andlower Pliocene of Virginia and North Carolina,pt. 1: U. S. Geol. Survey Prof. Paper 199-A, p.
1-178.
1948, Mollusca from the Miocene and"'"tower Piiocene of Virginia and North Carolina,
pt. 2: U. S. Geol. Survey Prof. Paper 199-B,
p. 179-310.
Kellum L B., 1926, Paleontology and stratigraphyKel oT'the Castle Hayne and Trent -arls-J0^
Carolina: U. S. Geol. Survey Prof.
56 p.
LiMoreaux, P. E., 1946, Geology and ground-waterLa sl-ces of the Coastal Plain of east-central
Georgia: Georgia Geol. Survey Bull. 52, 173 p.
LeGrand H E., and Brown, P. VL, 1955, Guidebookof excursion in the Coastal Plain of North Caro
lina: Carolina Geol. Soc, 43 p.
t i n« r V Berrv E. W., and Cushman, J. A.,L°Uf21, Sme'sto^nd marls of North Carolina:
North Carolina Geol. and Econ. Survey Bull. 28,
211 p.
Mansfield W. C, 1936, Stratigraphic significance ofMScene. Pliocene, and Pleistocene Pectmidae,nthe southeastern United States: Jour. Paleon
tology, v. 10, no. 3, p. 168-192.
McLean J D., Jr., 1951, Paleocene ForaminiferaMC from the Atlantic Coastal Plain: Cushma*i L£
Foram. Research Contrib., v. 2, pt. 1, p. 20-2J.
Meinzer O. E. (ed.), 1942, Hydrology: New York,McGraw-Hill Book Co. Reprinted by Dover Pub
lications, 1949.
Mundorff M. J., 1945, Ground-water problems inNorth Carolina: Am. Water Works Assoc. Jour.,
v. 37, no. 2, p. 155-160.
Murray G. E., 1955, Midway stage, Sabine stage,and Wilcox group: Am. Assoc Petroleum Geo
logists Bull., v. 30, no. 5, p. 671-696.
Fskell 1951, Water treatment for industrialotter uses: New York, Reinhold Publishing
Corp., 526 p.
Richards H G., 1945, Subsurface stratigraphy of* AttantTc Coital Plain between New Jersey and
Georgia: Am. Assoc Petroleum Geologists Bull.,
v. 29, no. 7, p. 885-955.
_ 1950 Geology of the Coastal Plain of""North"Carolina: Am. Philos. Soc. Trans., n. s.,
v. 40, pt. 1, 83 p.
86
Ruffin, Edmund, 1843, Report of the commencementand progress of the agricultural survey of SouthCarolina: South Carolina Dept. Agriculture, 56
P-
Sloan, Earle, 1907, A summary of the mineral resources of South Carolina: South Carolina Dept.
Agriculture, 66 p.
Smith E. A., and Johnson, L. C, 1887, Tertiary andCretaceous strata of the Tuscaloosa, Tombigbee,
and Alabama Rivers: U. S. Geol. Survey Bull.
43, 189 p.
Spanker W. B., 1950, Subsurface geology of theAtlantic Coastal Plain of North Carolina: Am.Assoc. Petroleum Geologists Bull., v. 34, no. 1,
p. 100-132.
Stephens6n, L. W., 1907, Some facts relating to theMesozoic deposits of The Coastal Plain of NorthCarolina: John Hopkins Univ. Cir., n. s., no. 7,
p. 93-99.
1923, The Cretaceous formations of
~~~North~Carolina, pt. 1, Invertebrate fossils of theUpper Cretaceous formations: North Carolina
Geol. Survey, v. 5, 604 p.
Swain F. M., 1951, Ostracoda from wells in NorthCarolina, pt. 1, Cenozoic Ostracoda: U. S. Geol.
Survey Prof. Paper 234-A, 58 p.
1952, Ostracoda from wells in North
Carolina" pt. 2, Mesozoic Ostracoda: U. S. Geol.Survey Prof. Paper 234-B, p. 59-93.
87