Embed Size (px)
Citation preview
Biological Journal of the Linnean Society
, 2007,
90
, 551–570. With 8 figures
© 2007 The Linnean Society of London,
Biological Journal of the Linnean Society,
2007,
90
, 551–570
551
Blackwell Publishing LtdOxford, UKBIJBiological Journal of the Linnean Society0024-40662007 The Linnean Society of London? 2007903551570Original Article
ARTHROPOD COMMUNITIES ON A GEOLOGICAL AGE GRADIENTD. S. GRUNER
*Current address: Bodega Marine Laboratory, University of California-Davis, PO Box 247, Bodega Bay, CA 94923-0247, USA. E-mail: [email protected]
Geological age, ecosystem development, and local resource constraints on arthropod community structure in the Hawaiian Islands
DANIEL S. GRUNER*
Department of Zoology and Ecology, Evolution and Conservation Biology Program, University of Hawai‘i at M
5
noa, Honolulu, Hawai‘i, USA
Received 22 August 2005; accepted for publication 20 June 2006
An ongoing debate in evolutionary ecology concerns the relative role of contemporary vs. historical processes in deter-mining local species richness and community structure. At sites along a 4 Mya geological chronosequence on Hawai‘i,Moloka‘i and Kaua‘i, numerous extrinsic factors can be held constant, but ecosystem fertility and nutrient avail-ability are low, both very young and very old sites, peaking at intermediate geological age across islands. Thus, con-temporary resource traits are similar among sites with different biogeographical legacies, and these opposinggradients allowed a test of their relative importance for arboreal arthropod community structure. Pyrethrum knock-down was used to sample arboreal arthropods from
Metrosideros polymorpha
(Myrtaceae), the dominant treethroughout the Hawaiian Islands. Arthropod abundances and sample-based species richness peaked at more pro-ductive, intermediate-aged sites, but did not correlate with geological age. The proportions of individuals and bio-mass in trophic groups and in different taxonomic orders differed widely across sites, but proportions of species introphic groups were more regular than the chance expectation. Species richness in local communities did not accu-mulate or pack more tightly with increasing geological age to the oldest island. Intermediate-aged islands may becontemporary peaks of richness, mediated by ecosystem development and senescence. Although historical and evo-lutionary processes generate diversity at broad scales, local communities converged in trophic structure and com-position, and ecosystem resource availability constrained arthropod numbers and richness at local scales. © 2007The Linnean Society of London,
Biological Journal of the Linnean Society
, 2007,
90
, 551–570.
ADDITIONAL KEYWORDS:
canopy arthropod community structure – evolutionary lineage – geologicalchronosequence – mesic forest ecosystems –
Metrosideros polymorpha
– nutrient availability – productivity –
species diversity and richness – trophic structure.
INTRODUCTION
The richness of regional species pools can constrainspecies diversity and community structure observedat local scales (Cornell & Lawton, 1992; Ricklefs &Schluter, 1993; Hillebrand & Blenckner, 2002).Species-rich tropical arthropod communities, oftenshowing high proportions of unique species and non-asymptotic species accumulation curves (Novotn
y
&Basset, 2000; Stirling & Wilsey, 2001; Basset
et al
.,2003), appear to exemplify the case for the contin-
gency of local biotic diversity on extrinsic biogeo-graphical, historical, and evolutionary processes.Although intrinsic biotic interactions and abiotic per-turbations are thought to limit or reduce the diver-sity of local communities, local richness can increaseonly by speciation and dispersal occurring on theselarger scales of time and space. Long temporal andspatial scales pose particularly difficult obstacles forstudying local communities in a historical context(Pickett, 1989). Thus, there have been few studies ofthe relative influence of intrinsic ecological andextrinsic historical or evolutionary processes in shap-ing contemporary community structure, most ofwhich have examined restricted clades withindiverse larger communities (McPeek & Brown, 2000;
552
D. S. GRUNER
© 2007 The Linnean Society of London,
Biological Journal of the Linnean Society,
2007,
90
, 551–570
Pärtel, 2002; Stephens & Wiens, 2003; Gillespie,2004).
Early studies proposed that the geological age of aregion may be a major determinant of species richness(Wallace, 1878; Willis, 1922; Fischer, 1960). The fossilrecord generally indicates positive trends of speciesaccumulation over millennial scales, interrupted onlyperiodically by sudden extinction events (Signor,1990). On remote oceanic islands, most of the diversityis generated
in situ
, a result of local diversificationfrom a small pool of colonist taxa (Zimmerman, 1970;Cowie, 1995; Whittaker, 1998). Thus, the time avail-able for speciation may impose controls on speciesrichness comparable to the size of islands or their dis-tance from source pools (Wagner, 1991; Paulay, 1994;Price, 2004), and this pattern is supported by macro-ecological data for insect communities over Quater-nary time scales (Birks, 1980; Leather, 1986). Withinlocal communities, colonizing or evolving speciesmight fill previously ‘vacant’ niches (Compton, Lawton& Rashbrook, 1989), or niches may contract, thusexpanding deterministic limits on local diversity overtime (May, 2001). However, host range expansion andspeciation of arthropods on islands can be extremelyrapid (Strong, 1974; Mendelson & Shaw, 2005). Tobetter test the influence of geological time, well-constrained gradients of ecosystem age over long geo-logical timeframes are needed in community-levelstudies (Borges & Brown, 1999).
At local scales, the quality (e.g. nutrients) and quan-tity of resources (e.g. productivity) are thought toinfluence species richness patterns (Huston, 1994).Although decades of intensive research have yieldedno consensus, studies of terrestrial animal richnesshave shown more monotonic positive relationshipswith productivity than any other single pattern(Rosenzweig & Abramsky, 1993; Abrams, 1995; Waide
et al
., 1999; Mittelbach
et al
., 2001). However, thisgeneralization is cast into doubt by differing scales,taxonomic emphasis and resolution, and varyingdirectness of productivity measures or surrogateindices (Groner & Novoplansky, 2003; Whittaker &Heegaard, 2003). Controlled, comparative studies ofterrestrial invertebrate diversity, using direct mea-sures of mass production or nutrient availability atlocal scales, are notably rare.
The Hawaiian archipelago generates as the Pacificplate passes north-westerly over a stationary hot-spotof upwelling basaltic lava (Carson & Clague, 1995);thus, the main high islands represent a discrete geo-logical time series from older, northernmost Kaua‘i tothe southernmost, volcanically active Hawai‘i. Previ-ous teams have identified sites on different islandssharing similar climatic, geochemical, and organismicfeatures, and have used these sites to understandecosystem development over geological time scales
(Vitousek, 2004). These ‘natural experiments’ can alsobe used to disentangle historical and evolutionaryeffects on local community structure from those occur-ring in response to contemporary ecosystem fluxes andspecies interactions (Price & Elliot-Fisk, 2004).
The present study used five sites from a well-constrained chronosequence in montane mesic forest(Fig. 1; Crews
et al
., 1995). These sites share the samedominant canopy species [
Metrosideros polymorpha
Gaudichaud-Beaupré (Myrtaceae)], and similar topo-graphic position, elevation, average annual tempera-ture and precipitation, land use history (Crews
et al
.,1995; Gruner & Polhemus, 2003), and soils werederived from volcanic ash (tephra) on the originalshield surface (Lockwood
et al
., 1988). Sites vary in twomajor, contrasting ways. First, the sites span fourorders of magnitude in age of the surficial substrate(300–4.1 Mya). Ecosystems and communities on oldersites have had more time for development, coloniza-tion, speciation, and niche partitioning, which togethermay explain the increasing floristic richness on olderislands at biogeographical scales (Price, 2004). Second,recently formed soils are deficient in fixed, biologicallyavailable nitrogen, whereas the oldest soils on Kaua‘iare leached and deficient in mobile phosphorus. Thus,net primary productivity, soil and foliar nutrient levels,and rates of nutrient cycling follow unimodal patternson a semilog scale, peaking at sites of intermediate ageon Hawai‘i and Moloka‘i (Vitousek, 2004).
A standardized sampling regime of canopy arthro-pod communities from the same tree species along theage gradient allowed a test of two alternative hypoth-eses: (1) if local resources constrain community struc-ture, then arthropod abundance, biomass,
α
-richness,and diversity should correlate with nutrient availabil-ity and net primary productivity, revealing a humpedrelationship with log substrate age (‘resource hypoth-esis’). Alternatively, (2) if accumulated speciation andbiogeographical effects determine community struc-ture, then local arthropod variables (particularly,
α
-richness) should increase with geological age (‘timehypothesis’), as observed for the Hawaiian flora (Wag-ner, 1991; Price, 2004). Another prediction of the timehypothesis is that local communities should be moresimilar within islands than among islands, regardlessof differences in resource availability (Crews
et al
.,1995). The present study provides uncommonly well-resolved quantitative analyses of local community-wide invertebrate diversity in a standardized protocolacross a geological chronosequence.
MATERIAL AND METHODS
A
RTHROPOD
SAMPLING
Arthropods were sampled from
M. polymorpha
at fivesites in June, October, and November of 1997 using

ARTHROPOD COMMUNITIES ON A GEOLOGICAL AGE GRADIENT
553
© 2007 The Linnean Society of London,
Biological Journal of the Linnean Society,
2007,
90
, 551–570
pyrethrum knockdown (Fig. 1). Pyrethrum knock-down fogging is a promising technique for comparativeecological studies (Stork & Hammond, 1997; Gering,Crist & Veech, 2003). The method is underutilized incommunity ecology, most likely stymied by the daunt-ing magnitude and taxonomic complexity of samplesand datasets. However, the arthropod fauna fromHawaiian
Metrosideros
is well characterized (Swezey,1954; Gagné, 1979; Stein, 1983; Gruner, 2004a) com-pared to continental tropical forests at similar lati-tudes, and perhaps an order of magnitude less rich.Although fogging has been criticized for undersam-pling fauna from epiphytes (Yanoviak, Nadkarni &Gering, 2003), bromeliads and araceous epiphytes arenaturally absent in the Hawaiian Islands and epi-phytic bryophytes and pterophytes were locallyuncommon in these mesic forests.
Individual trees were fogged with a Curtis Dyna-Fog Golden Eagle fogger with pyrenone 100 (1% pyre-thrins, 5% piperonyl butoxide, and 94% isoparafinnicpetroleum) until the entire crown was saturated for10 s. Flowering trees or those growing on slopes wereavoided, and selected trees, generally of modal sizewithin habitats, were dispersed spatially to eliminatecarryover effects of the fog. Trees were sampled duringdaylight hours in good weather conditions only (noprecipitation or wind). On average, we obtained sam-ples from ten
M
.
polymorpha
trees at each of four
sites, with one individual of
Metrosideros waialealae
(Rock) Rock from Moloka‘i later excluded. Weatherconditions restricted sample size at the Laup
5
hoehoesite (
N
=
8), and most of these trees were located adja-cent to the chronosequence site on thin tephra over ‘a‘
5
basalt. However, foliar nutrients (Vitousek, Turner &Kitayama, 1995), tree stature and forest structure(D. S. Gruner, personal observ.) were very similaramong these adjacent sites.
Arthropods were allowed to drop for one hour onto3–6 collection trays (1.5 m
2
) arrayed to subsample allhorizontal canopy zones (e.g. near bole) and cardinaldirections. The number of sampling trays, consistingof white sheets suspended 0.75 m above the forestfloor on polyvinyl chloride frames, varied in proportionto crown spread (
r
=
0.667, d.f.
=
42,
P
<
0.0005).Arthropods were collected immediately into 70% eth-anol and later sorted, counted, and identified to taxo-nomic species or morphospecies (Gruner, 2004a).Length was measured with an ocular micrometer onalcohol-preserved specimens to the nearest millimeterclass. Dry biomass estimates were calculated withtaxon-specific regression equations on length (Gruner,2003).
Arthropods were assigned to feeding guilds andaggregated into one of five trophic groups: carnivores,detritivores, herbivores, and tourists, or undeter-mined. Feeding guilds were assigned based on
Figure 1.
Location and surficial substrate age of the five arthropod sampling sites along a Hawaiian mesic chronose-quence. From youngest to oldest, the sites are Volcano (H1, Hawaii Volcanoes National Park, Hawai‘i Island); LaupâhoehoeFlow (H2, Laup
5
hoehoe Forest Reserve, Hawai‘i Island); Kohala (H3, Kohala Forest Reserve, Hawai‘i Island); Moloka‘i(M, Kamakou Preserve); and Kaua‘i (K, N
5
pali-Kona Forest Reserve). Coordinates, descriptions and site-level data areprovided elsewhere (Crews
et al
., 1995; Vitousek
et al.
, 1995; Vitousek
et al
., 1997; Herbert & Fownes, 1999; Gruner &Polhemus, 2003; Gruner, 2004a).

554
D. S. GRUNER
© 2007 The Linnean Society of London,
Biological Journal of the Linnean Society,
2007,
90
, 551–570
personal observation and morphological evidence, lit-erature review, and communication with system-atists. Carnivores included all parasitoids, spiders,and other predators; detritivores comprised saproph-agous arthropods, dead-wood borers, and grazers oflitter, fungi, and microbes; herbivores consisted of sapfeeders, foliage chewers, and adult gall-formers; tour-ists included species known to be incidental or non-feeding on
Metrosideros
, or with highly omnivorousfeeding habits. Known tourists were excluded fromanalyses, whereas species with undetermined func-tional roles (mostly mites) were retained as separatefrom tourists and included in analyses of aggregatearthropod variables. Specimens data were managedusing the
Biota
database software (Colwell, 1997),and vouchers reside at the Bernicre P. BishopMuseum, Honolulu and the Smithsonian, Washing-ton, DC.
A
BUNDANCE
AND
BIOMASS
Arthropod abundance and biomass variables wereaveraged over all trays for each tree expressed relativeto total tray area. Site comparisons were made withintaxonomic orders, trophic groups, and for all arthro-pods combined. To examine among-site differences inarthropod numbers, one-way analysis of variance withmultiple comparisons was used (Tukey’s HSD, joint
α=
0.05; all
F
-test d.f.
=
4,43). Both abundance andbiomass variables were natural log-transformed tomeet statistical assumptions.
Pearson correlations of site means of arthropodtrophic level abundance and biomass were testedagainst the log
10
of substrate age and selected ecosys-tem resource and habitat variables reported previ-ously from these sites. Variables were selected tominimize collinearity and were hypothesized to influ-ence arthropod population dynamics or diversity.From Herbert & Fownes (1999), total NPP, the inputrate of
N
in leaf litter (both in units g
1
m
−
2
years
−
1
),and leaf area index (LAI, m
2
m
−
2
), were used. Foliarphosphorus concentrations (%P per g
−
1
dry mass) weretaken from Vitousek
et al.
(1995), and mean treeheight (m), stem basal area (m
2
), and canopy volume(m
3
) from Gruner & Polhemus (2003). The simulta-neous error rate of these 144 tests was not controlled,but it was assumed that 5–10% of individual testsyielded spurious results. Variables were classified intoresource variables (NPP, N litterfall rate, foliar P) andhabitat variables (LAI, tree height, basal area, canopyvolume), and these general categories were inspectedfor patterns of correlations at
α=
0.10. The arcsinesquare root transformation was used to normalize per-centage canopy cover before averaging, and naturallog transformations for tree height, basal area, andcanopy volume.
S
PECIES
RICHNESS
AND
DIVERSITY
Several studies have suggested a nonrandom con-stancy for predator–prey species ratios and guild pro-portionality across sites or through time (Evans &Murdoch, 1968; Moran & Southwood, 1982; Jeffries &Lawton, 1985; but see Wilson, 1996). Thus, the pro-portionality of species richness was examined withintaxonomic orders and trophic groups across chronose-quence sites. Orders with few species or with spottydistributions across sites were aggregated into moreinclusive categories for analysis (Class Malacostraca:Isopoda and Amphipoda; all others: Orders Blattodea,Collembola, Neuroptera, Thysanoptera, and all ClassMyriapoda). Contingency table analyses tested thenull hypotheses of no differences among sites in theproportions of species in the different orders andtrophic groups. Because of the possibility that propor-tions might differ less among sites than expectedunder the null hypothesis (Fisher, 1936; Edwards,1986), two-sided alternative hypotheses were tested.Unusually small values of the
χ
2
statistic (i.e.
P
>
0.95)were taken as evidence against the null hypothesis,and indicated community structure more similar thanexpected by chance.
Direct comparison of observed richness among siteswas not appropriate because sampling effort (the totalnumber of trees and trays) differed among sites, andspecies number per unit effort is expected to be non-linear (Gotelli & Colwell, 2001). Because the observedspecies richness usually underestimates true richness,richness for each site was estimated by extrapolation(Colwell & Coddington, 1994). The second-order jack-knife, which is a robust nonparametric, incidence-based estimator, was used following the selection cri-teria of Brose, Martinez & Williams (2003). Individualtray samples for each site were shuffled and sampledrandomly 100 times without replacement to producedsmoothed species accumulation curves. Fisher’s
α
, ascalar diversity index that controls for abundance andsampling effects (Magurran, 1988; Rosenzweig, 1995;Hubbell, 2001), was also calculated using the Esti-mateS software package (Colwell, 2004). Jackknife andFisher’s
α
estimates from each site were rarified to thesmallest shared sample size of total trays at all sites(i.e. sample-based rarefaction; Gotelli & Colwell, 2001),and also compared with curves rescaled to total arthro-pod abundance (i.e. individual-based rarefaction).
As with abundance and biomass variables, sitemeans of richness and diversity were analysed for cor-relations with substrate age, resource and habitatvariables.
To assess the contribution of evolutionary accumu-lation to species composition, the species-genus ratiowas calculated for native arthropods at each site(Simberloff, 1970). Genera are a reasonable proxy for

ARTHROPOD COMMUNITIES ON A GEOLOGICAL AGE GRADIENT
555
© 2007 The Linnean Society of London,
Biological Journal of the Linnean Society,
2007,
90
, 551–570
unique lineages and colonization events in Hawaiianarthropods (Zimmerman, 1948; J. P. Price and D. S.Gruner, unpubl. data), so these ratios assess the aver-age extent that coexisting evolutionary lineages havediversified or persisted within, or invaded, local com-munities. This measure does not rely on diversifica-tion
in situ
, but examines the extent that relatedspecies within lineages
accumulate
at sites over time.To control for sampling effort and to generate esti-mates of variability, rarefaction curves were calcu-lated for 100 randomly selected native species withingenera for each site. Monte Carlo simulations wererun for 1000 iterations using EcoSim software (Gotelli& Entsminger, 2002).
D
IVERSITY
PARTITIONS
The sampling design at multiple, nested spatial scalesallowed analysis of the
α
,
β
, and
γ
components of spe-cies diversity (Lande, 1996; Loreau, 2000; Crist
et al
.,2003). The additive model of diversity partitioningtreats the sum of
α
and
β
diversities at any scale as the
α
diversity of the next larger scale (Lande, 1996; Crist
et al
., 2003). In the knockdown sampling design, aver-age within-sample diversity of collection trays repre-sented point diversity: the spatial scale most likely tocapture individual biotic interactions and the physicalconstraints of the habitat (Whittaker, Willis & Field,2001). The average
β
diversity was quantified at threescales: (1) within trees; (2) among trees; and (3) amongsites across the region (i.e.
γ
diversity,
sensu
Cody,1975). Within- and among-tree
β
diversity depictedcommunity-level patterns, whereas γ diversity mea-sured broad-scale, evolutionary, biogeographical andhistorical effects (Gering, Crist & Veech, 2003).
Diversity partitions were calculated using the pro-gram PARTITION, which used an individual-basedMonte Carlo randomization procedure and two-tailedtest to distinguish patterns from null expectations(Crist et al., 2003; Veech & Crist, 2003); in each anal-ysis, 1000 iterations were used. Partitions were calcu-lated separately on the basis of individual sites usingtwo levels of β diversity (β diversity within and amongtrees), and for the region as a whole adding a thirdlevel of β diversity (among sites = β3 = γ diversity). Toisolate potential evolutionary explanations, nativeand introduced species also were analysed separately.In addition, the relative contributions of common andrare species, defined as > 0.5% of total abundance and< 0.05%, respectively (Gering, Crist & Veech, 2003),and individual trophic levels (detritivores, herbivoresand carnivores), were analysed.
COMPOSITIONAL COMPARISONS
The compositional similarity of sites was examinedwith hierarchical clustering in PC-ORD (McCune &
Mefford, 1999). Pairwise distances were calculatedusing the Sørensen index, relativized to site totals tocontrol for sampling intensity and to focus the analy-sis on proportions of species rather than absoluteabundance. The group average linkage method wasused and the resulting dendrogram was scaled usingWishart’s objective function (McCune & Grace, 2002).Separate analyses examined the total community(excluding tourists) and native species only (excludingtourists and introduced species).
RESULTS
ARTHROPOD ABUNDANCE AND BIOMASS
In total, 17 029 arthropods in 612 species, 119 fami-lies, and 19 orders were collected in samples fromM. polymorpha canopies at the five sites. Known inci-dentals and nonfeeding or nectarivorous species (e.g.bees, adult moths) were excluded from this analysis,leaving 16 635 individuals from 574 species. Of the574 species retained, 423 species were considerednative to the Hawaiian Islands (all but one endemic),89 species were introduced historically, and 62 specieswere of obscure origin (including 22 mite morphospe-cies). The complete taxonomic list is provided else-where (Gruner, 2004a).
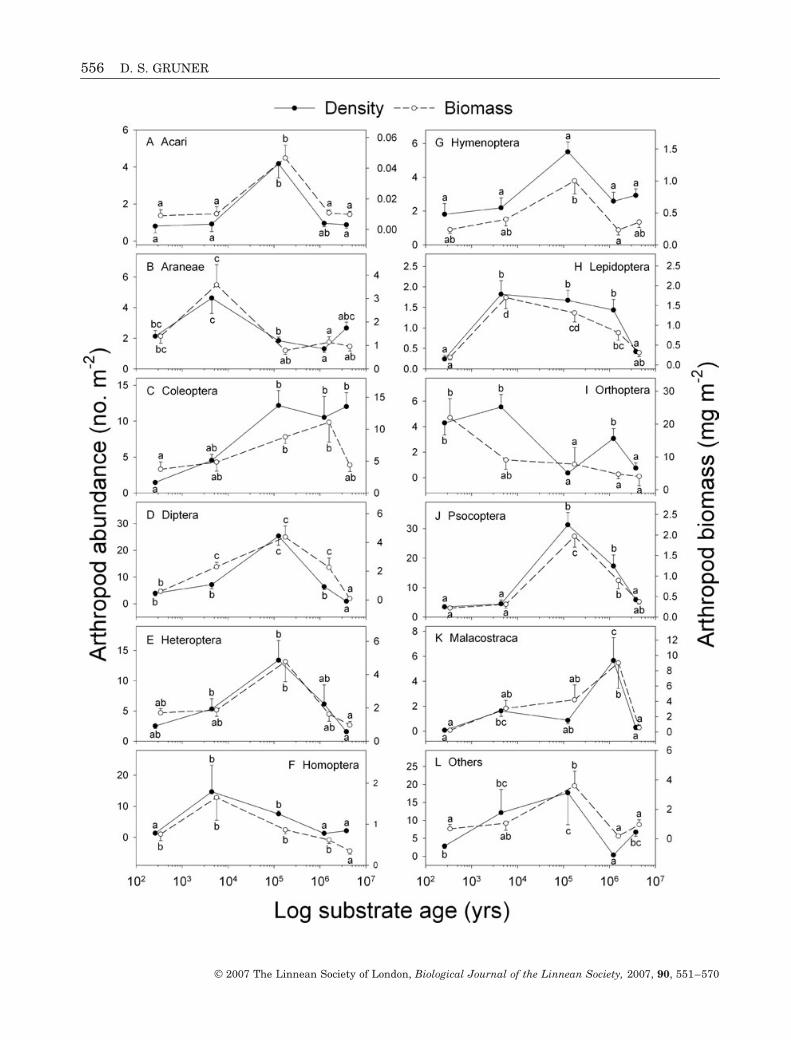
Abundance and biomass differed among sites for allanalysed orders, although not all in the same way(Fig. 2). Diptera, Heteroptera, Homoptera, Lepi-doptera, and Psocoptera abundance and biomass werehigh at two or more intermediate-aged sites, withlower numbers at the age gradient endpoints. Severalorders had high values only at one intermediate-agedsite: Araneae at Laup5hoehoe (H2: 5000 years ago),Acari and Hymenoptera at Kohala (H3: 150 000 yearsago), and Malacostraca at Moloka‘i (M: 1.4 Mya) [thelatter reflecting a large population of Platorchestia nr.lanipo (Amphipoda)]. Coleoptera biomass also washighest on Moloka‘i and much lower at the oldest site,Kaua‘i (K: 4.1 Mya), but Coleoptera abundance washigh on Kaua‘i, Kohala, and Moloka‘i. Orthopterashowed a very different pattern, especially in biomass,with levels generally decreasing from Volcano, theyoungest site (H1: 300 years ago).
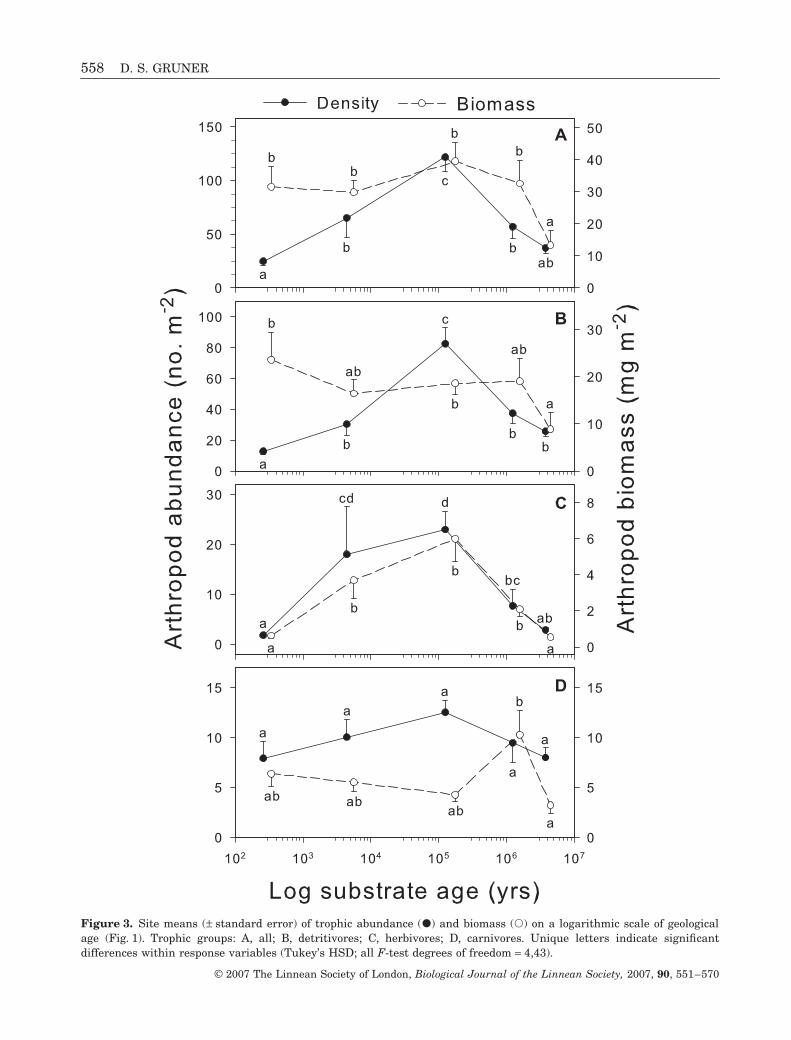
Arthropod abundance and biomass, in total andwithin different trophic levels, differed widely acrosssites, but in no case were they linearly related to logsubstrate age (Fig. 3, Table 1). Total arthropod abun-dance followed a unimodal pattern along the mesicchronosequence, peaking at H3, whereas total biom-ass was similar across sites, but was lower only at theoldest site. Detritivores accounted for the largesttrophic fraction, measured both by abundance and bio-mass, and their trends were similar to those for allarthropods. Herbivores showed a unimodal relation-ship with geological age for both abundance and
556 D. S. GRUNER
© 2007 The Linnean Society of London, Biological Journal of the Linnean Society, 2007, 90, 551–570

ARTHROPOD COMMUNITIES ON A GEOLOGICAL AGE GRADIENT 557
© 2007 The Linnean Society of London, Biological Journal of the Linnean Society, 2007, 90, 551–570
biomass. Carnivore biomass was higher on Moloka‘ithan elsewhere; carnivores were more abundant atintermediate-aged sites, but this difference was notstatistically significant (F4,43 = 2.07, P = 0.105).
Most correlations of arthropod variables withresource and habitat variables across the five siteswere not significant (Table 1). Arthropod abundanceswere strongly, positively related to nutrient statusvariables, with all trophic levels correlated with per-cent foliar P and the input rate of N in leaf litter
(except detritivores with N litter rate, r = 0.741,P = 0.152). Biomass was unrelated to all habitat andmost resource variables, with only herbivore biomasscorrelated to N cycling and foliar P, and detritivorebiomass weakly related to LAI.
ARTHROPOD SPECIES DIVERSITY
Proportions of species in different orders did not dif-fer significantly among sites (Fig. 4; χ2 = 34.566,
Figure 2. Site means (± standard error) of ordinal arthropod abundance (�) and biomass (�) on a logarithmic scale ofgeological age (Fig. 1). Orders: A, Acari; B, Araneae; C, Coleoptera; D, Diptera; E, Heteroptera; F, Homoptera; G,Hymenoptera; H, Lepidoptera (larvae only; I, Orthoptera; J, Psocoptera; K, Malacostraca (Isopoda + Amphipoda); L, allothers (Blattodea, Collembola, Neuroptera, Thysanoptera, and all Myriapoda). Unique letters indicate significant differ-ences within response variables (Tukey’s HSD; all F-test degrees of freedom = 4,43).
Table 1. Pearson correlation statistics (r) among site-level means of ecological and arthropod community variables
Time Resources Habitat
Parental materialage (log) NPP†
LitterN†
FoliarP‡ LAI† Height§
Basalarea§
Crownvolume§
AbundanceTotal 0.209 0.470 0.863* 0.916** −0.221 −0.305 −0.028 −0.260Detritivores 0.332 0.486 0.741 0.815* −0.311 −0.360 −0.164 −0.454Herbivores −0.016 0.353 0.966** 0.979** −0.074 −0.181 0.204 0.103Carnivores 0.107 0.515 0.920** 0.952** −0.096 −0.256 0.064 −0.139
BiomassTotal −0.401 0.713 0.753 0.676 0.594 0.143 0.211 0.230Detritivores −0.704 0.486 0.271 0.132 0.875* 0.504 0.143 0.437Herbivores 0.013 0.444 0.955** 0.972** −0.061 −0.184 0.113 −0.012Carnivores −0.016 0.776 0.050 0.005 0.737 −0.302 0.675 0.189
RichnessTotal 0.291 0.763 0.860* 0.910** 0.004 −0.511 0.271 −0.223Detritivores −0.141 0.804 0.846* 0.804 0.551 −0.276 0.704 0.354Herbivores 0.653 0.742 0.618 0.725 −0.207 −0.829* 0.326 −0.452Carnivores 0.328 0.517 0.774 0.846* −0.28 −0.384 −0.102 −0.418
DiversityTotal 0.323 0.951** 0.688 0.726 0.246 −0.620 0.493 −0.179Detritivores 0.197 0.857* 0.769 0.783 0.334 −0.587 0.733 0.111Herbivores 0.544 0.859* 0.170 0.244 0.083 −0.633 0.120 −0.595Carnivores 0.389 0.764 0.830* 0.894** −0.037 −0.629 0.367 −0.230
Abundance and biomass values were standardized by capture tray area (m2); species richness values are nonparametricsecond-order jackknife estimators rarified to the smallest shared sample size of total trays at all sites; species diversityestimates are the Fisher’s α index rarified to the smallest shared sample size of total trays at all sites.†Data from Herbert & Fownes (1999); NPP, net primary productivity (g1 m−2 years−1); Litter N, annual flux of mass nitrogenin litterfall (g1 m−2 years−1); LAI, leaf area index (m2 m−2).‡Data from Vitousek et al. (1995); foliar P, percent phosphorus by dry mass.§Data from Gruner & Polhemus (2003); average tree height (m); average tree basal area (m2); average crown volume (m3).*P = 0.10; **P = 0.05.
558 D. S. GRUNER
© 2007 The Linnean Society of London, Biological Journal of the Linnean Society, 2007, 90, 551–570
Figure 3. Site means (± standard error) of trophic abundance (�) and biomass (�) on a logarithmic scale of geologicalage (Fig. 1). Trophic groups: A, all; B, detritivores; C, herbivores; D, carnivores. Unique letters indicate significantdifferences within response variables (Tukey’s HSD; all F-test degrees of freedom = 4,43).
ARTHROPOD COMMUNITIES ON A GEOLOGICAL AGE GRADIENT 559
© 2007 The Linnean Society of London, Biological Journal of the Linnean Society, 2007, 90, 551–570
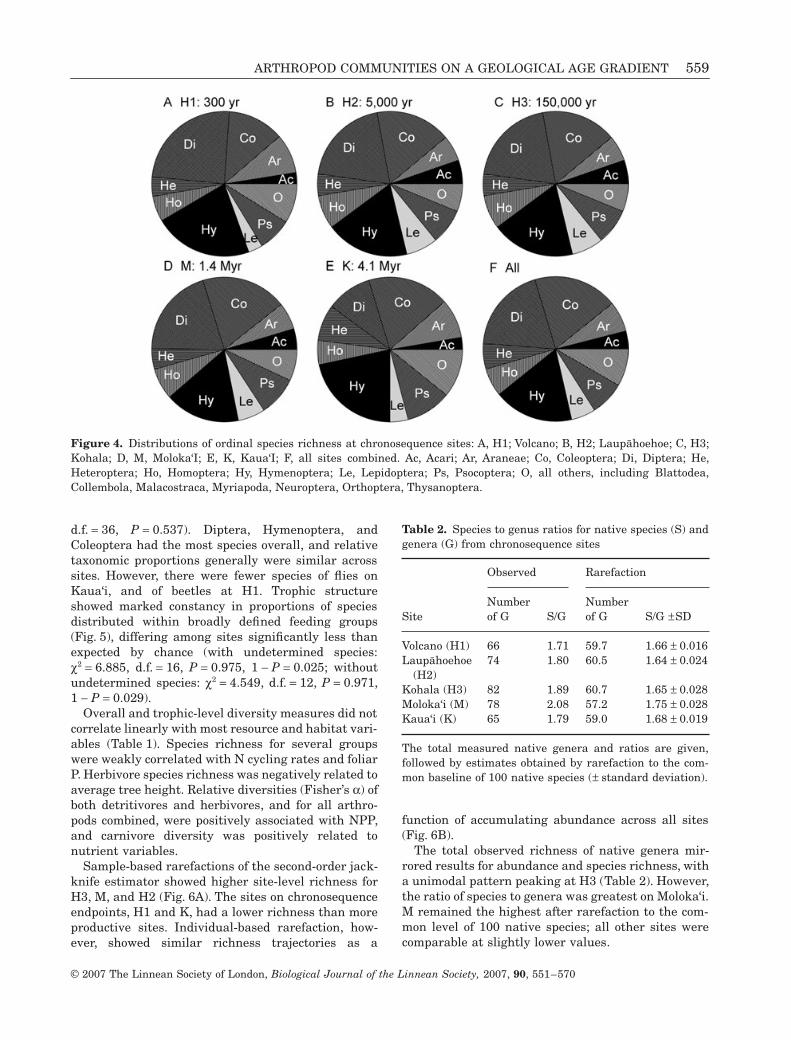
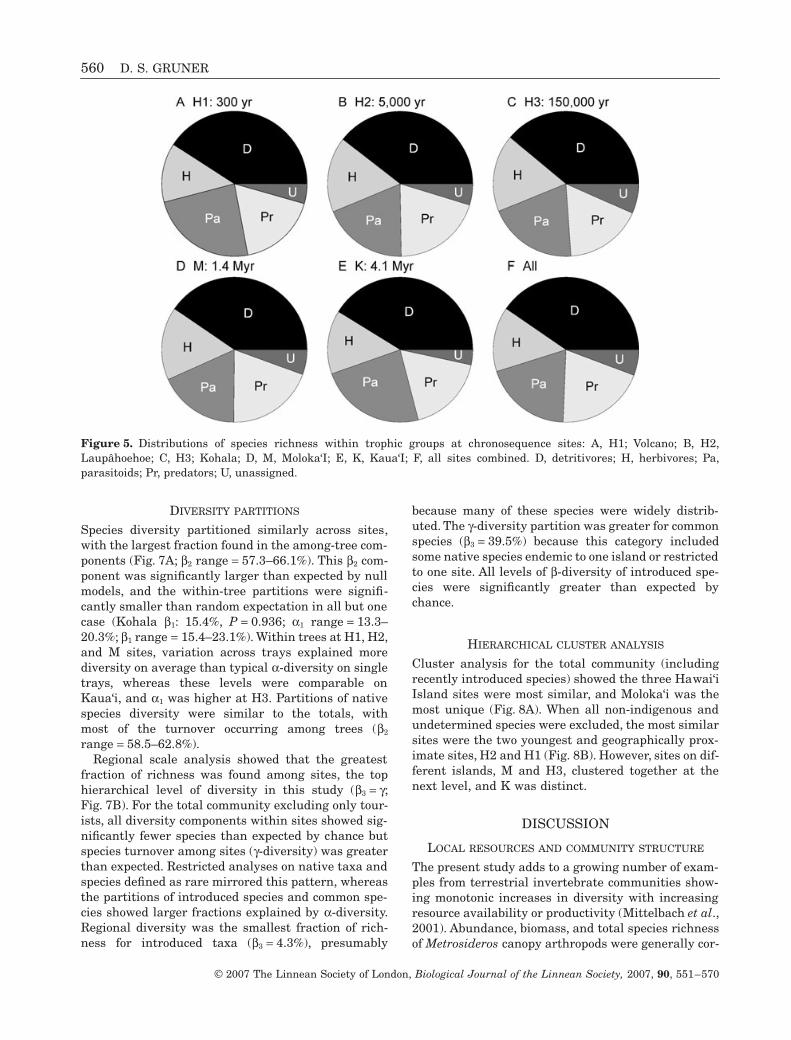
d.f. = 36, P = 0.537). Diptera, Hymenoptera, andColeoptera had the most species overall, and relativetaxonomic proportions generally were similar acrosssites. However, there were fewer species of flies onKaua‘i, and of beetles at H1. Trophic structureshowed marked constancy in proportions of speciesdistributed within broadly defined feeding groups(Fig. 5), differing among sites significantly less thanexpected by chance (with undetermined species:χ2 = 6.885, d.f. = 16, P = 0.975, 1 − P = 0.025; withoutundetermined species: χ2 = 4.549, d.f. = 12, P = 0.971,1 − P = 0.029).
Overall and trophic-level diversity measures did notcorrelate linearly with most resource and habitat vari-ables (Table 1). Species richness for several groupswere weakly correlated with N cycling rates and foliarP. Herbivore species richness was negatively related toaverage tree height. Relative diversities (Fisher’s α) ofboth detritivores and herbivores, and for all arthro-pods combined, were positively associated with NPP,and carnivore diversity was positively related tonutrient variables.
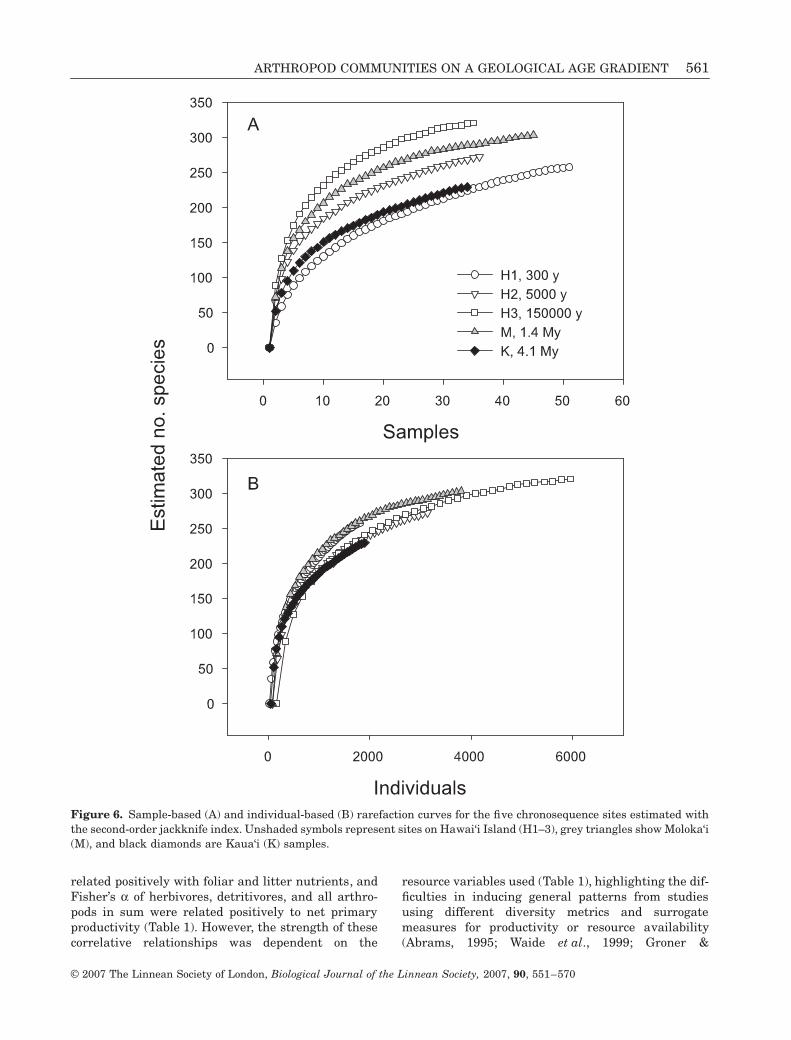
Sample-based rarefactions of the second-order jack-knife estimator showed higher site-level richness forH3, M, and H2 (Fig. 6A). The sites on chronosequenceendpoints, H1 and K, had a lower richness than moreproductive sites. Individual-based rarefaction, how-ever, showed similar richness trajectories as a
function of accumulating abundance across all sites(Fig. 6B).
The total observed richness of native genera mir-rored results for abundance and species richness, witha unimodal pattern peaking at H3 (Table 2). However,the ratio of species to genera was greatest on Moloka‘i.M remained the highest after rarefaction to the com-mon level of 100 native species; all other sites werecomparable at slightly lower values.
Figure 4. Distributions of ordinal species richness at chronosequence sites: A, H1; Volcano; B, H2; Laup5hoehoe; C, H3;Kohala; D, M, Moloka‘I; E, K, Kaua‘I; F, all sites combined. Ac, Acari; Ar, Araneae; Co, Coleoptera; Di, Diptera; He,Heteroptera; Ho, Homoptera; Hy, Hymenoptera; Le, Lepidoptera; Ps, Psocoptera; O, all others, including Blattodea,Collembola, Malacostraca, Myriapoda, Neuroptera, Orthoptera, Thysanoptera.
Table 2. Species to genus ratios for native species (S) andgenera (G) from chronosequence sites
Site
Observed Rarefaction
Numberof G S/G
Numberof G S/G ±SD
Volcano (H1) 66 1.71 59.7 1.66 ± 0.016Laup5hoehoe
(H2)74 1.80 60.5 1.64 ± 0.024
Kohala (H3) 82 1.89 60.7 1.65 ± 0.028Moloka‘i (M) 78 2.08 57.2 1.75 ± 0.028Kaua‘i (K) 65 1.79 59.0 1.68 ± 0.019
The total measured native genera and ratios are given,followed by estimates obtained by rarefaction to the com-mon baseline of 100 native species (± standard deviation).
560 D. S. GRUNER
© 2007 The Linnean Society of London, Biological Journal of the Linnean Society, 2007, 90, 551–570
DIVERSITY PARTITIONS
Species diversity partitioned similarly across sites,with the largest fraction found in the among-tree com-ponents (Fig. 7A; β2 range = 57.3–66.1%). This β2 com-ponent was significantly larger than expected by nullmodels, and the within-tree partitions were signifi-cantly smaller than random expectation in all but onecase (Kohala β1: 15.4%, P = 0.936; α1 range = 13.3–20.3%; β1 range = 15.4–23.1%). Within trees at H1, H2,and M sites, variation across trays explained morediversity on average than typical α-diversity on singletrays, whereas these levels were comparable onKaua‘i, and α1 was higher at H3. Partitions of nativespecies diversity were similar to the totals, withmost of the turnover occurring among trees (β2
range = 58.5–62.8%).Regional scale analysis showed that the greatest
fraction of richness was found among sites, the tophierarchical level of diversity in this study (β3 = γ;Fig. 7B). For the total community excluding only tour-ists, all diversity components within sites showed sig-nificantly fewer species than expected by chance butspecies turnover among sites (γ-diversity) was greaterthan expected. Restricted analyses on native taxa andspecies defined as rare mirrored this pattern, whereasthe partitions of introduced species and common spe-cies showed larger fractions explained by α-diversity.Regional diversity was the smallest fraction of rich-ness for introduced taxa (β3 = 4.3%), presumably
because many of these species were widely distrib-uted. The γ-diversity partition was greater for commonspecies (β3 = 39.5%) because this category includedsome native species endemic to one island or restrictedto one site. All levels of β-diversity of introduced spe-cies were significantly greater than expected bychance.
HIERARCHICAL CLUSTER ANALYSIS
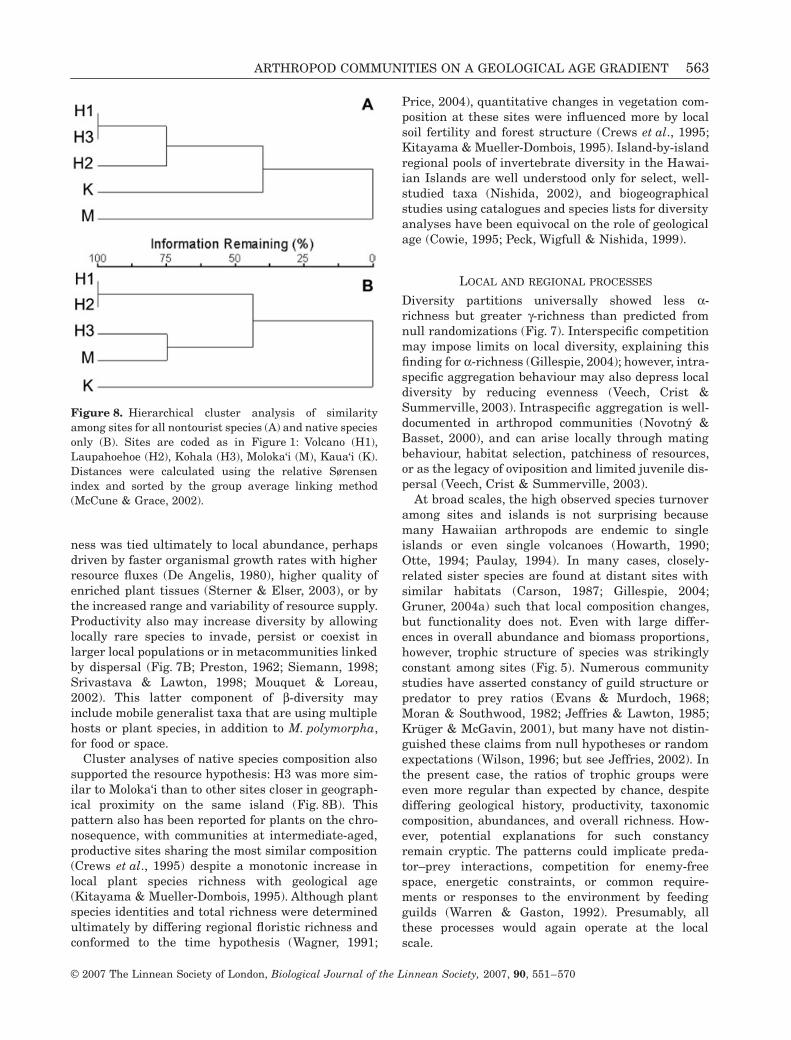
Cluster analysis for the total community (includingrecently introduced species) showed the three Hawai‘iIsland sites were most similar, and Moloka‘i was themost unique (Fig. 8A). When all non-indigenous andundetermined species were excluded, the most similarsites were the two youngest and geographically prox-imate sites, H2 and H1 (Fig. 8B). However, sites on dif-ferent islands, M and H3, clustered together at thenext level, and K was distinct.
DISCUSSION
LOCAL RESOURCES AND COMMUNITY STRUCTURE
The present study adds to a growing number of exam-ples from terrestrial invertebrate communities show-ing monotonic increases in diversity with increasingresource availability or productivity (Mittelbach et al.,2001). Abundance, biomass, and total species richnessof Metrosideros canopy arthropods were generally cor-
Figure 5. Distributions of species richness within trophic groups at chronosequence sites: A, H1; Volcano; B, H2,Laupâhoehoe; C, H3; Kohala; D, M, Moloka‘I; E, K, Kaua‘I; F, all sites combined. D, detritivores; H, herbivores; Pa,parasitoids; Pr, predators; U, unassigned.
ARTHROPOD COMMUNITIES ON A GEOLOGICAL AGE GRADIENT 561
© 2007 The Linnean Society of London, Biological Journal of the Linnean Society, 2007, 90, 551–570
related positively with foliar and litter nutrients, andFisher’s α of herbivores, detritivores, and all arthro-pods in sum were related positively to net primaryproductivity (Table 1). However, the strength of thesecorrelative relationships was dependent on the
resource variables used (Table 1), highlighting the dif-ficulties in inducing general patterns from studiesusing different diversity metrics and surrogatemeasures for productivity or resource availability(Abrams, 1995; Waide et al., 1999; Groner &
Figure 6. Sample-based (A) and individual-based (B) rarefaction curves for the five chronosequence sites estimated withthe second-order jackknife index. Unshaded symbols represent sites on Hawai‘i Island (H1–3), grey triangles show Moloka‘i(M), and black diamonds are Kaua‘i (K) samples.

562 D. S. GRUNER
© 2007 The Linnean Society of London, Biological Journal of the Linnean Society, 2007, 90, 551–570
Novoplansky, 2003). Moreover, elevated abundancesat more productive sites (Fig. 3) appeared to drive theincreased richness on a sample-standardized basis(Fig. 6A). Site differences in richness disappearedwhen samples were re-scaled to total abundancesusing individual-based rarefaction (Fig. 6B). In an
experimental companion study in low productivity vol-canic savannah, fertilization increased arthropodabundance and species density on M. polymorpha, butabundance-corrected richness did not change or evendecreased (Gruner, 2004b; Gruner, Taylor & Forkner,2005; Gruner & Taylor, 2006). In both studies, rich-
Figure 7. A, total observed richness of all nontourist arthropods in additive partitions of α and β components at twospatial scales (samples and trees) within the five chronosequence sites. B, percentage of total observed arthropod speciesin additive partitions of α and β components at three spatial scales: samples, trees, and sites. Symbols within plots indicatediversity components larger (+), smaller (–), or not different (n.s.) than null expectations. Partitions in (B) also are shownfor native and introduced community subsets, and for all rare (< 0.05% of absolute abundance) and common species(> 0.5%). Numbers above bars indicate the total species count for each comparison.
ARTHROPOD COMMUNITIES ON A GEOLOGICAL AGE GRADIENT 563
© 2007 The Linnean Society of London, Biological Journal of the Linnean Society, 2007, 90, 551–570
ness was tied ultimately to local abundance, perhapsdriven by faster organismal growth rates with higherresource fluxes (De Angelis, 1980), higher quality ofenriched plant tissues (Sterner & Elser, 2003), or bythe increased range and variability of resource supply.Productivity also may increase diversity by allowinglocally rare species to invade, persist or coexist inlarger local populations or in metacommunities linkedby dispersal (Fig. 7B; Preston, 1962; Siemann, 1998;Srivastava & Lawton, 1998; Mouquet & Loreau,2002). This latter component of β-diversity mayinclude mobile generalist taxa that are using multiplehosts or plant species, in addition to M. polymorpha,for food or space.
Cluster analyses of native species composition alsosupported the resource hypothesis: H3 was more sim-ilar to Moloka‘i than to other sites closer in geograph-ical proximity on the same island (Fig. 8B). Thispattern also has been reported for plants on the chro-nosequence, with communities at intermediate-aged,productive sites sharing the most similar composition(Crews et al., 1995) despite a monotonic increase inlocal plant species richness with geological age(Kitayama & Mueller-Dombois, 1995). Although plantspecies identities and total richness were determinedultimately by differing regional floristic richness andconformed to the time hypothesis (Wagner, 1991;
Price, 2004), quantitative changes in vegetation com-position at these sites were influenced more by localsoil fertility and forest structure (Crews et al., 1995;Kitayama & Mueller-Dombois, 1995). Island-by-islandregional pools of invertebrate diversity in the Hawai-ian Islands are well understood only for select, well-studied taxa (Nishida, 2002), and biogeographicalstudies using catalogues and species lists for diversityanalyses have been equivocal on the role of geologicalage (Cowie, 1995; Peck, Wigfull & Nishida, 1999).
LOCAL AND REGIONAL PROCESSES
Diversity partitions universally showed less α-richness but greater γ-richness than predicted fromnull randomizations (Fig. 7). Interspecific competitionmay impose limits on local diversity, explaining thisfinding for α-richness (Gillespie, 2004); however, intra-specific aggregation behaviour may also depress localdiversity by reducing evenness (Veech, Crist &Summerville, 2003). Intraspecific aggregation is well-documented in arthropod communities (Novotny &Basset, 2000), and can arise locally through matingbehaviour, habitat selection, patchiness of resources,or as the legacy of oviposition and limited juvenile dis-persal (Veech, Crist & Summerville, 2003).
At broad scales, the high observed species turnoveramong sites and islands is not surprising becausemany Hawaiian arthropods are endemic to singleislands or even single volcanoes (Howarth, 1990;Otte, 1994; Paulay, 1994). In many cases, closely-related sister species are found at distant sites withsimilar habitats (Carson, 1987; Gillespie, 2004;Gruner, 2004a) such that local composition changes,but functionality does not. Even with large differ-ences in overall abundance and biomass proportions,however, trophic structure of species was strikinglyconstant among sites (Fig. 5). Numerous communitystudies have asserted constancy of guild structure orpredator to prey ratios (Evans & Murdoch, 1968;Moran & Southwood, 1982; Jeffries & Lawton, 1985;Krüger & McGavin, 2001), but many have not distin-guished these claims from null hypotheses or randomexpectations (Wilson, 1996; but see Jeffries, 2002). Inthe present case, the ratios of trophic groups wereeven more regular than expected by chance, despitediffering geological history, productivity, taxonomiccomposition, abundances, and overall richness. How-ever, potential explanations for such constancyremain cryptic. The patterns could implicate preda-tor–prey interactions, competition for enemy-freespace, energetic constraints, or common require-ments or responses to the environment by feedingguilds (Warren & Gaston, 1992). Presumably, allthese processes would again operate at the localscale.
Figure 8. Hierarchical cluster analysis of similarityamong sites for all nontourist species (A) and native speciesonly (B). Sites are coded as in Figure 1: Volcano (H1),Laupahoehoe (H2), Kohala (H3), Moloka‘i (M), Kaua‘i (K).Distances were calculated using the relative Sørensenindex and sorted by the group average linking method(McCune & Grace, 2002).

564 D. S. GRUNER
© 2007 The Linnean Society of London, Biological Journal of the Linnean Society, 2007, 90, 551–570
Even with the large contribution of total richnessarising at regional scales (Fig. 7B), local α and β com-ponents of diversity and the total site-level richnesscorrelated most strongly to resource variables, ratherthan to habitat structural variables or the underlyingage of the landmass (Fig. 7A, Table 1). However, thespecies to genus ratio within native genera onM. polymorpha, an index of native species accumula-tion, was elevated only on Moloka‘i, but not at produc-tive sites on Hawai‘i where richness and diversitywere also high (Table 2). Speciation apparently did notcontinue to expand coexistence of arthropod speciesover four million years, and was not the sole force gen-erating higher richness at intermediate-aged sites.
GEOLOGICAL AGE, SPECIATION, AND SPECIES ACCUMULATION
Although few molecular clock estimates exist forHawaiian arthropod lineages (Price & Clague, 2002),most of the analysed lineages were present on the cur-rent oldest island, Kaua‘i (4.0–5.1 Mya) at least aslong, often much longer, than on the other islands, andthus have had more opportunity to accumulate specieson older islands (Asquith, 1995; Russo, Takezaki &Nei, 1995; Hormiga, Arnedo & Gillespie, 2003; Jordan,Simon & Polhemus, 2003). The predominant diversifi-cation pattern empirically identified within lineagesfollows a stepwise progression from Kaua‘i to youngerislands (Carson, 1983; Wagner & Funk, 1995; Shaw,1996; Liebherr & Zimmerman, 2000; Hormiga, Arnedo& Gillespie, 2003; Jordan, Simon & Polhemus, 2003;Gillespie, 2004; Hoch, 2006).
Why then did the time hypothesis fail to describethe patterns in local diversity seen in onM. polymorpha? First, lineage age may be linked onlyloosely to speciation and α-diversity. Individual lin-eages may vary in their underlying diversificationrates (Sanderson & Donoghue, 1994; Buzas, Collins &Culver, 2002) and in their capacity to diversify byadaptive or non-adaptive mechanisms (Paulay, 1994).The modal diversity of all arthropod lineages in theHawaiian Islands is only one species per lineage,many of which are widespread species (Zimmerman,1948; Roderick & Gillespie, 1998; J. P. Price, unpubl.data). Second, physical environmental characteristicsmay alter speciation rates or catalyse speciationevents (Losos & Schluter, 2000). Volcanic activity hasalways been most vigorous on the youngest, growingislands of the Hawaiian chain (Carson & Clague,1995). Frequent volcanism destroyed local popula-tions, forcing repeated recolonization, founder epi-sodes, and genetic drift, and possibly acceleratingspeciation rates relative to older, dormant islands(Carson et al., 1990; Vandergast, Gillespie & Roderick,2004). A similar scenario of diversification without
adaptation has been proposed for Enallagma damself-lies on the margins of retreating glaciers in NorthAmerica (McPeek & Brown, 2000).
Moreover, the balance between speciation andextinction on islands may differ systematically in con-cordance with ecosystem development over time(Gillespie, 2004). On older islands, erosion and subsid-ence reduce island area and elevational range even astopographic diversity increases (Price & Elliot-Fisk,2004). This phase of forest ecosystem decline has beenassociated with reduction of tree basal area, increas-ing phosphorus limitation, and decreased litterdecomposition rates and activity of microbes(Vitousek, 2004; Wardle, Walker & Bardgett, 2004).The taxon cycle and taxon pulse hypotheses assumeirreversible habitat specialization and range restric-tion over time within diversifying lineages (Wilson,1961; Erwin, 1981; Liebherr & Hajek, 1990), whichmay increase vulnerability to extinction in this chang-ing environment. Indeed, the deeply eroded, oldesthigh island of Kaua‘i may be a ‘graveyard’ for inverte-brate diversity (Asquith, 1995), where examples ofrelictual, presumably ancient endemic lineagessurvive but are found nowhere else. For example,two monotypic spiders, Doryonychus raptor Simon(Tetragnathidae) and Adelocosa anops Gertsch(Lycosidae), exhibit bizarre behavioural, ecologicaland morphological shifts that are unlike any otherextant species (Howarth, 1987; Gillespie, 1992), sug-gesting that the bulk of diversity in these clades, inthe form of intermediates and sibling species, has goneextinct (Asquith, 1995; Roderick & Gillespie, 1998).
Community-wide species to genus ratios, adjustedfor effort and sample size, suggests Moloka‘i had thehighest level of species accumulation per lineage (asapproximated by genera; Table 2). An elevated ratiocould arise from a combination of lower extinctionrates and disproportionately high speciation or coloni-zation. A clade of Tetragnatha spiders showed a simi-lar unimodal relationship of richness with geologicalage across the Hawaiian archipelago, with peaks inlocal richness on Maui, Moloka‘I, and O‘ahu (Gillespie,2004). This was interpreted as evidence for a dynamicequilibrium of community assembly, with build-upthrough speciation and subsequent decline throughextinction on older islands. The island group ofMoloka‘i, Maui, Lana‘i, and Kaho‘olawe were coa-lesced for much of their history into one land mass(‘Maui Nui’), which once was larger than the currentlargest island of Hawai‘i (Price & Elliot-Fisk, 2004).Repeated sea level fluctuations over the millenniamay have periodically isolated and rejoined popula-tions in a similar manner to that proposed for activevolcanics on the youngest island (Carson, Lockwood &Craddock, 1990). Volcanism and sea level changes sug-gest mechanisms for young and intermediate aged

ARTHROPOD COMMUNITIES ON A GEOLOGICAL AGE GRADIENT 565
© 2007 The Linnean Society of London, Biological Journal of the Linnean Society, 2007, 90, 551–570
islands to generate diversity, acting as ‘cradles’(Chown & Gaston, 2000) or ‘crucibles’ (Carson et al.,1990) of evolutionary change. Thus, the regional poolsof species available to Moloka‘i and other islands inthe Maui Nui complex are potentially larger than pre-dictable by their current sizes (Price, 2004).
ALTERNATIVE HYPOTHESES
The present study provides rare quantitative analysesof local community-wide invertebrate structure anddiversity across a well-resolved and tightly con-strained geological chronosequence. An alternateapproach would be to sample numerous sites frommultiple islands, and necessarily sample each site lessintensively, with lower taxonomic resolution andnon-asymptotic species accumulation curves. Thisapproach would increase site and intraisland replica-tion, but would invite confounding variation inelevation, rainfall, parental substrate chemistry,topography, vegetative structure, and land use history.Sites on standard substrate on the original volcanicshield surface are extremely rare on the eroded highislands of Kaua‘i and Moloka‘i (Porder, Asner &Vitousek, 2005), and a tephra site at comparable ele-vation on O‘ahu does not exist (Juvik & Juvik, 1998).The present study opted for high precision and taxo-nomic resolution, on well-characterized sites withtight constraint over extrinsic factors, vs. more exten-sive sampling on sites that could sacrifice control overthese potentially confounding variables.
It remains possible that the diversity patterns ofarthropods on M. polymorpha are not general to allhost plants or habitats across islands. Several spec-tacular examples of species-rich radiations of arthro-pods in the Hawaiian Islands have diversified inconcert with unrelated host plant lineages (Montgom-ery, 1975; Gagné, 1997; Polhemus, 2004). If nativeplant richness is higher within local sites on oldermain islands (Wagner, 1991; Kitayama & Mueller-Dombois, 1995), it follows that a similar pattern couldbe expected for phytophagous arthropods associatedwith these hosts. Thus, a profitable approach to fur-ther test the geological time hypothesis would involvesampling fixed areas of representative habitat, irre-spective of plant composition, from these sites or onother gradients. However, M. polymorpha is the mostabundant, widespread, and locally dominant tree spe-cies in the islands (Dawson & Stemmerman, 1999).This species hosts the most diverse assemblage ofassociated arthropods among native plants (Swezey,1954; Gruner, 2004a), and is also the largest bioticstructural resource within local habitats. Althoughlineages specialized on other host plant taxa wereneglected by this study, generalist feeders (e.g. somedetritivores and predators) undoubtedly use multiple
plant species and microhabitats within local sites.Thus, the objective of the present study, to detect acommunity-wide pattern insensitive to individualisticsignals of arthropod clades (Gruner & Polhemus,2003), was well served by using this model system.
A difficulty for interpretation of space-for-time chro-nosequences is that the prevailing local conditions atsites probably differed over time (Pickett, 1989). Geo-logical and palynological evidence suggest the vegeta-tion of Hawaiian montane forests differed underprevious climatic regimes (Gavenda, 1992; Hotchkisset al., 2000). However, the great elevational range inthe main Hawaiian Islands probably allowed gradualaltitudinal migration, rather than elimination, ofecotypes within each region. Metrosideros polymorphais the dominant tree in a wide variety of ecosystems inHawai‘i (Dawson & Stemmerman, 1999), and its pres-ence in the islands dates to the early Pleistocene(Wright et al., 2000). Although its distribution mayhave shifted, this morphologically and physiologicallyplastic and variable tree probably persisted in compa-rable abundances under differing climatic regimes.
The observed positive correlations of arthropodabundance and diversity with resource variables sug-gest causal effects of productivity, but there are sev-eral alternative explanations that must be considered.First, these canopy knockdown samples report abun-dances per unit tray area, when in reality three-dimensional volumes above trays were sampled. Thus,larger or denser crowns may hold higher arthropodnumbers. However, only two of 64 correlations ofarthropod variables with leaf area index (Herbert &Fownes, 1999), tree basal area, canopy cover, andcrown volume were significant at the P = 0.10 level(Table 1). This suggests that sampling difficultiesassociated with site differences in physical habitatand tree architecture were minor.
Another alternative interpretation is that the differ-ences in arthropod abundance or diversity werecaused by differences in predation intensity becausepasserine birds were less abundant at more produc-tive, intermediate-aged sites (D. S. Gruner, unpubl.observations). Anthropogenic disturbances andrelated indirect effects have caused the extinction ofmore than half of the native forest bird fauna in theHawaiian Islands (Scott, Conant & van Riper, 2001).The Moloka‘i and H3 sites, which showed the highestarthropod abundance and total richness in the presentstudy, have sustained the most local bird extinctionsin historical times and currently have the lowest pop-ulation densities of all the compared sites (Scott et al.,1986). Insectivorous birds can depress the abundanceand biomass of forest arthropods (Van Bael, Brawn &Robinson, 2003) and, more generally, top predatorscan change the diversity of prey (Paine, 1966; Schoe-ner & Spiller, 1996). It follows that the decreased
566 D. S. GRUNER
© 2007 The Linnean Society of London, Biological Journal of the Linnean Society, 2007, 90, 551–570
abundance of insectivorous birds could be responsiblefor higher arthropod numbers and diversity. However,a multiyear field experiment comparing the effects ofbirds and nutrient resources on Metrosideros arthro-pods at a single site on Hawai‘i island found that thequantitative impacts of birds were restricted toarthropod carnivores, especially spiders (Gruner,2004b; Gruner, 2005). Fertilization broadly increasedarthropod numbers and diversity in a manner analo-gous to the present study (Gruner, Taylor & Forkner,2005; Gruner & Taylor, 2006); thus, the resourcehypothesis is more consistent with experimental data.
CONCLUSIONS
Arthropod abundance and diversity patterns withinindividual lineages were idiosyncratic, but contempo-rary diversity on balance was not a monotonic functionof geological time for the accumulation of species.Arthropod richness and diversity instead were relatedto local ecosystem resource variables and mediated byarthropod abundance. Although historical and evolu-tionary processes generate diversity at broad scales,local communities were convergent in coarse structureand composition, and ecosystem resource availabilitywas predictive of arthropod numbers and richness atlocal scales. However, the effects of geological age onecosystem productivity and evolutionary change maybe tightly linked (Gillespie, 2004). As ecosystemssenesce and productivity declines, specialized speciesmay become restricted to narrow ranges in smallerlocal populations, and become more susceptible todemographic and environmental stochasticity. Assuch, ecosystem development and resulting local eco-logical conditions may constrain the balance of speci-ation and extinction, and thus the emergentevolutionary patterns, in Hawaiian arthropods.
ACKNOWLEDGEMENTS
This study would not have been possible withoutDan Polhemus, who provided many hours in thefield, equipment, and taxonomic expertise. I thankthe Division of Forestry and Wildlife of the State ofHawai‘i, Hawaii Volcanoes National Park, the JosephSouza Center at Koke‘e State Park, Parker Ranch,and the Nature Conservancy of Hawai‘i for legal per-mits and access to field sites; S. Fretz, L. Santiago,C. Ewing, and J. Liebherr for assistance with fieldcollections; K. Heckmann, L. Wilson, S. McDaniel,and E. McDaniels for laboratory assistance; D. Foote,H. Farrington, and P. Vitousek for logistical assis-tance; and the Bernice P. Bishop Museum for provid-ing laboratory space, access to collections, andhousing of vouchers. I am grateful to K. Arakaki, M.Arnedo, M. Asche, J. Beatty, T. Blackledge, N. Even-
huis, C. Ewing, J. Garb, M. Gates, G. Gibson, R.Gillespie, J. Huber, K. Kaneshiro, B. Kumashiro, J.Liebherr, E. Mockford, S. Montgomery, J. Noyes, D.Percy, D. Polhemus, D. Preston, A. Richardson, G. A.Samuelson, M. Schauff, C. Tauber, and A. Vandergastfor providing or verifying arthropod identifications.D. Herbert kindly provided detailed NPP data, J.Veech shared the PARTITION software, and A. Tay-lor, J. Ewel, J. Chase, R. Kinzie, T. Miller, D. Strong,and an anonymous reviewer improved the manu-script with critical comments. I acknowledge fund-ing from NSF training grants DGE-9355055 andDUE-9979656 and the John D and Catherine T. Mac-Arthur Foundation to the Center for ConservationResearch and Training at the University of Hawai‘iat M5noa, the STAR program of the US Environmen-tal Protection Agency, and NSF doctoral dissertationimprovement grant DEB-0073055.
REFERENCES
Abrams PA. 1995. Monotonic or unimodal diversity − productivity gradients: what does competition theory pre-dict? Ecology 76: 2019–2027.
Asquith A. 1995. Evolution of Sarona (Heteroptera, Miridae):speciation on geographic and ecological islands. In: WagnerWL, Funk VA, eds. Hawaiian biogeography: evolution on ahot spot archipelago. Washington, DC: Smithsonian Institu-tion Press, 90–120.
Basset Y, Novotnyyyy V, Miller SE, Kitching RL. 2003.Arthropods of tropical forests: spatio-temporal dynamics andresource use in the canopy. London: Cambridge UniversityPress.
Birks HJB. 1980. British trees and insects: a test of the timehypothesis over the last 13,000 years. American Naturalist115: 600–605.
Borges PAV, Brown VK. 1999. Effect of island geological ageon the arthropod species richness of Azorean pastures. Bio-logical Journal of the Linnean Society 66: 373–410.
Brose U, Martinez ND, Williams RJ. 2003. Estimating spe-cies richness: sensitivity to sample coverage and insensitiv-ity to spatial patterns. Ecology 84: 2364–2377.
Buzas MA, Collins LS, Culver SJ. 2002. Latitudinal differ-ence in biodiversity caused by higher tropical rate ofincrease. Proceedings of the National Academy of Sciences ofthe United States of America 99: 7841–7843.
Carson HL. 1983. Chromosomal sequences and interislandcolonizations in Hawaiian Drosophila. Genetics 103: 465–482.
Carson HL. 1987. Colonization and speciation. In: Gray, AJ,Crawley, MJ, Edwards, PJ, eds. Colonization, successionand stability. Oxford: Blackwell Scientific Publications, 187–206.
Carson HL, Clague DA. 1995. Geology and biogeography ofthe Hawaiian islands. In: Wagner WL, Funk VA, eds. Hawai-ian biogeography: evolution on a hot spot archipelago. Wash-ington, DC: Smithsonian Institution Press, 14–29.

ARTHROPOD COMMUNITIES ON A GEOLOGICAL AGE GRADIENT 567
© 2007 The Linnean Society of London, Biological Journal of the Linnean Society, 2007, 90, 551–570
Carson HL, Lockwood JP, Craddock EM. 1990. Extinctionand recolonisation of local populations on a growing shieldvolcano. Proceedings of the National Academy of Sciences ofthe United States of America 87: 7055–7057.
Chown SL, Gaston KJ. 2000. Areas, cradles and museums:the latitudinal gradient in species richness. Trends in Ecol-ogy and Evolution 15: 311–315.
Cody ML. 1975. Towards a theory of continental species diver-sities. In: Cody ML, Diamond JM, eds. Ecology and evolutionof communities. Cambridge, MA: Belknap Press of HarvardUniversity, 214–257.
Colwell RK. 1997. Biota: the biodiversity database manager,Version 1.0. Sunderland, MA: Sinauer Associates.
Colwell RK. 2004. Estimates: statistical estimation of speciesrichness and shared species from samples, Version 7.5. Avail-able at http://purl.oclc.org/estimates.
Colwell RK, Coddington JA. 1994. Estimating terrestrialbiodiversity through extrapolation. Philosophical Transac-tions of the Royal Society of London Series B, BiologocalSciences 345: 101–118.
Compton SG, Lawton JH, Rashbrook VK. 1989. Regionaldiversity, local community structure and vacant niches: theherbivorous arthropods of bracken in South Africa. Ecologi-cal Entomology 14: 365–373.
Cornell HV, Lawton JH. 1992. Species interactions, localand regional processes, and limits to the richness of ecolog-ical communities: a theoretical perspective. Journal ofAnimal Ecology 61: 1–12.
Cowie RH. 1995. Variation in species diversity and shellshape in Hawaiian land snails: in situ speciation and ecolog-ical relationships. Evolution 49: 1191–1202.
Crews TE, Kitayama K, Fownes JH, Riley RH, HerbertDA, Mueller-Dombois D, Vitousek PM. 1995. Changes insoil phosphorus fractions and ecosystem dynamics across along chronosequence in Hawaii. Ecology 76: 1407–1424.
Crist TO, Veech JA, Gering JC, Summerville KS. 2003.Partitioning species diversity across landscapes and regions:a hierarchical analysis of α, β, and γ diversity. AmericanNaturalist 162: 734–743.
Dawson JW, Stemmerman L. 1999. Metrosideros Banks exGaertn. In: Wagner WL, Herbst DR, Sohmer SH, eds. Man-ual of the flowering plants of Hawai‘i, 2nd edn. Honolulu:Bernice P. Bishop Museum Press. 964–970.
De Angelis DL. 1980. Energy flow, nutrient cycling, and eco-system resilience. Ecology 61: 764–771.
Edwards AWF. 1986. Are Mendel’s results really too close?Biological Reviews 61: 295–312.
Erwin TL. 1981. Taxon pulses, vicariance, and dispersal: anevolutionary synthesis illustrated by carabid beetles. In:Nelson G, Rosen DE, eds. Vicariance biogeography: a cri-tique. New York, NY: Columbia University Press, 159–196.
Evans FC, Murdoch WW. 1968. Taxonomic composition,trophic structure and seasonal occurrence in a grasslandinsect community. Journal of Animal Ecology 37: 259–273.
Fischer AG. 1960. Latitudinal variations in organic diversity.Evolution 14: 64–81.
Fisher RA. 1936. Has Mendel’s work been rediscovered?Annals of Science 1: 115–137.
Gagné WC. 1979. Canopy-associated arthropods in Acacia koaand Metrosideros tree communities along an altitudinaltransect on Hawaii island. Pacific Insects 21: 56–82.
Gagné WC. 1997. Insular evolution, speciation, and revision ofthe Hawaiian genus Nesiomiris (Hemiptera: Miridae).Bishop Museum Bulletin in Entomology, Vol. 7. Honolulu:Bishop Museum Press.
Gavenda RT. 1992. Hawaiian quaternary paleoenviron-ments: a review of geological, pedological, and botanical evi-dence. Pacific Science 46: 295–307.
Gering JC, Crist TO, Veech JA. 2003. Additive partitioningof species diversity across multiple spatial scales: implica-tions for regional conservation of biodiversity. ConservationBiology 17: 488–499.
Gillespie RG. 1992. Impaled prey. Nature 355: 212–213.Gillespie RG. 2004. Community assembly through adaptive
radiation in Hawaiian spiders. Science 303: 356–359.Gotelli NJ, Colwell RK. 2001. Quantifying biodiversity: pro-
cedures and pitfalls in the measurement and comparison ofspecies richness. Ecology Letters 4: 379–391.
Gotelli NJ, Entsminger GL. 2002. Ecosim: null models soft-ware for ecology, Version 7. Burlington, VT: Acquired Intel-ligence Inc. & Kesey-Bear.
Groner E, Novoplansky A. 2003. Reconsidering diversity-productivity relationships: directness of productivity esti-mates matters. Ecology Letters 6: 695–699.
Gruner DS. 2003. Regressions of length and width to predictarthropod biomass in the Hawaiian Islands. Pacific Science57: 325–336.
Gruner DS. 2004a. Arthropods from ‘ hi‘a lehua (Myrtaceae:Metrosideros polymorpha), with new records for theHawaiian Islands. Bishop Museum Occasional Papers 78:33–52.
Gruner DS. 2004b. Attenuation of top-down and bottom-upforces in a complex terrestrial community. Ecology 85: 3010–3022.
Gruner DS. 2005. Biotic resistance to an invasive spider con-ferred by generalist insectivorous birds on the island ofHawai‘i. Biological Invasions 7: 541–546.
Gruner DS, Polhemus DA. 2003. Arthropod communitiesacross a long chronosequence in the Hawaiian Islands. In:Basset Y, Novotny V, Miller SE, Kitching RL, eds. Arthro-pods of tropical forests: spatio-temporal dynamics andresource use in the canopy. London: Cambridge UniversityPress, 135–145.
Gruner DS, Taylor AD. 2006. Richness and species composi-tion of arboreal arthropods affected by nutrients and preda-tors: a press experiment. Oecologia 147: 714–724.
Gruner DS, Taylor AD, Forkner RE. 2005. The effects offoliar pubescence and nutrient enrichment on arthropodcommunities of Metrosideros polymorpha (Myrtaceae). Eco-logical Entomology 30: 428–443.
Herbert DA, Fownes JH. 1999. Forest productivity and effi-ciency of resource use across a chronosequence of tropicalmontane soils. Ecosystems 2: 242–254.
Hillebrand H, Blenckner T. 2002. Regional and local impacton species diversity − from pattern to processes. Oecologia132: 479–491.
o
568 D. S. GRUNER
© 2007 The Linnean Society of London, Biological Journal of the Linnean Society, 2007, 90, 551–570
Hoch H. 2006. Systematics and evolution of Iolania (Hemi-ptera: Fulgomorpha: Cixiidae) from Hawai‘i. SystematicEntomology 31: 302–320.
Hormiga G, Arnedo M, Gillespie RG. 2003. Speciation on aconveyer belt: sequential colonization of the HawaiianIslands by Orsonwelles spiders (Araneae, Linyphiidae). Sys-tematic Biology 52: 70–88.
Hotchkiss S, Vitousek PM, Chadwick OA, Price J. 2000.Climate cycles, geomorphological change, and the interpre-tation of soil and ecosystem development. Ecosystems 3: 522–534.
Howarth FG. 1987. Evolutionary ecology of aeolian and sub-terranean habitats in Hawaii. Trends in Ecology and Evolu-tion 2: 220–223.
Howarth FG. 1990. Hawaiian terrestrial arthropods: an over-view. Bishop Museum Occasional Papers 30: 4–26.
Hubbell SP. 2001. The unified neutral theory of biodiversityand biogeography. Princeton, NJ: Princeton UniversityPress.
Huston MA. 1994. Biological diversity: the coexistence of spe-cies on changing landscapes. Cambridge: Cambridge Univer-sity Press.
Jeffries MJ. 2002. Evidence for individualistic species assem-bly creating convergent predator: prey ratios among pondinvertebrate communities. Journal of Animal Ecology 71:173–184.
Jeffries MJ, Lawton JH. 1985. Predator-prey ratios in com-munities of freshwater invertebrates: the role of enemy freespace. Freshwater Biology 15: 105–112.
Jordan S, Simon C, Polhemus DA. 2003. Molecular system-atics and adaptive radiation of Hawaii’s endemic damselflygenus Megalagrion (Odonata: Coenagrionidae). SystematicBiology 52: 89–109.
Juvik SP, Juvik JO. 1998. Atlas of Hawai‘i, 3rd edn. ednHonolulu: University of Hawai‘i Press.
Kitayama K, Mueller-Dombois D. 1995. Vegetation changesalong gradients of long-term soil development in the Hawai-ian montane rainforest zone. Vegetatio 120: 1–20.
Krüger O, McGavin GC. 2001. Predator-prey ratio and guildconstancy in a tropical insect community. Journal of Zoology253: 265–273.
Lande R. 1996. Statistics and partitioning of species diversity,and similarity among communities. Oikos 76: 5–13.
Leather SR. 1986. Insect species richness of the BritishRosaceae: the importance of host range, plant architec-ture, age of establishment, taxonomic isolation and spe-cies-area relationships. Journal of Animal Ecology 55:841–860.
Liebherr JK, Hajek AE. 1990. A cladistic test of the taxoncycle and taxon pulse hypotheses. Cladistics 6: 39–59.
Liebherr JK, Zimmerman EC. 2000. Hawaiian Carabidae(Coleoptera), part 1: introduction and tribe Platynini. Insectsof Hawaii, Vol. 16. Honolulu, HI: University of HawaiiPress.
Lockwood JP, Lipman PW, Peterson LD, Warshauer FR.1988. Generalized ages of surface flows of Mauna Loa Vol-cano, Hawaii, Map I-1908. Washington, DC: US Departmentof the Interior.
Loreau M. 2000. Are communities saturated? On the relation-ship between α, β and γ diversity. Ecology Letters 3: 73–76.
Losos J, Schluter D. 2000. Analysis of an evolutionaryspecies–area relationship. Nature 408: 847–850.
Magurran AE. 1988. Ecological diversity and its measure-ment. Princeton, NJ: Princeton University Press.
May RM. 2001. Stability and complexity in model ecosystems,2nd edn. Princeton, NJ: Princeton University Press.
McCune B, Grace JB. 2002. Analysis of ecological communi-ties. Gleneden Beach, OR: MJM Software Design.
McCune B, Mefford MJ. 1999. PC-ORD: multivariate anal-ysis of community structure, Version 4.0. Gleneden Beach,OR: MJM Software.
McPeek MA, Brown JM. 2000. Building a regional speciespool: diversification of the Enallagma damselflies in easternNorth American waters. Ecology 81: 904–920.
Mendelson TC, Shaw KL. 2005. Rapid speciation in anarthropod. Nature 433: 375–376.
Mittelbach GG, Steiner CF, Scheiner SM, Gross KL,Reynolds HL, Waide RB, Willig MR, Dodson SI,Gough L. 2001. What is the observed relationshipbetween species richness and productivity? Ecology 82:2381–2396.
Montgomery SL. 1975. Comparative breeding site ecologyand the adaptive radiation of picture-winged Drosophila(Diptera: Drosophilidae) in Hawaii. Proceedings of theHawaiian Entomological Society 22: 65–103.
Moran VC, Southwood TRE. 1982. The guild composition ofarthropod communities in trees. Journal of Animal Ecology51: 289–306.
Mouquet N, Loreau M. 2002. Coexistence in metacommuni-ties: the regional similarity hypothesis. American Naturalist159: 420–426.
Nishida GM, ed. 2002. Hawaiian terrestrial arthropod check-list. Honolulu: Bishop Museum Press.
Novotnyyyy V, Basset Y. 2000. Rare species in communities oftropical insect herbivores: pondering the mystery of single-tons. Oikos 89: 564–572.
Otte D. 1994. The crickets of Hawaii. Philadelphia, PA: TheOrthopterists’ Society.
Paine RT. 1966. Food web complexity and species diversity.American Naturalist 100: 65–75.
Pärtel M. 2002. Local plant diversity patterns and evolution-ary history at the regional scale. Ecology 83: 2361–2366.
Paulay G. 1994. Biodiversity on oceanic islands: its origin andextinction. American Zoologist 34: 134–144.
Peck SB, Wigfull P, Nishida G. 1999. Physical correlates ofinsular species diversity: the insects of the HawaiianIslands. Annals of the Entomological Society of America 92:529–536.
Pickett STA. 1989. Space-for-time substitution as an alterna-tive to long-term studies. In: Likens GE, ed. Long-term stud-ies in ecology: approaches and alternatives. Berlin: Springer-Verlag, 110–135.
Polhemus DA. 2004. Further studies on the genus Orthotylus(Heteroptera: Miridae) in the Hawaiian Islands, withdescriptions of thirty-four new species. Journal of the NewYork Entomological Society 112: 227–333.
ARTHROPOD COMMUNITIES ON A GEOLOGICAL AGE GRADIENT 569
© 2007 The Linnean Society of London, Biological Journal of the Linnean Society, 2007, 90, 551–570
Porder S, Asner GP, Vitousek PM. 2005. Ground-basedand remotely sensed nutrient availability across a tropi-cal landscape. Proceedings of the National Academy ofSciences of the United States of America 102: 10909–10912.
Preston FW. 1962. The canonical distribution of commonnessand rarity. Ecology 43: 410–432.
Price JP. 2004. Floristic biogeography of the HawaiianIslands: influences of area, environment and paleogeogra-phy. Journal of Biogeography 31: 1–14.
Price JP, Clague DA. 2002. How old is the Hawaiian biota?Geology and phylogeny suggest recent divergence. Proceed-ings of the Royal Society of London Series B, Biological Sci-ences 269: 2429–2435.
Price JP, Elliot-Fisk D. 2004. Topographic history of theMaui Nui complex, Hawai‘i, and its implications for biogeog-raphy. Pacific Science 58: 27–45.
Ricklefs RE, Schluter D, eds. 1993. Species diversity in eco-logical communities. Historical and geographical perspec-tives. Chicago, IL: University of Chicago Press.
Roderick GK, Gillespie RG. 1998. Speciation and phylo-geography of Hawaiian terrestrial arthropods. MolecularEcology 7: 519–531.
Rosenzweig ML. 1995. Species diversity in space and time.Cambridge: Cambridge University Press.
Rosenzweig ML, Abramsky Z. 1993. How are diversity andproductivity related? In: Ricklefs RE, Schluter D, eds. Spe-cies diversity in ecological communities: historical and geo-graphical perspectives. Chicago, IL: University of ChicagoPress, 52–65.
Russo CAM, Takezaki N, Nei M. 1995. Molecular phylogenyand divergence times of drosophilid species. Molecular Biol-ogy and Evolution 12: 391–404.
Sanderson MJ, Donoghue MJ. 1994. Shifts in diversifica-tion rate with the origin of angiosperms. Science 264: 1590–1593.
Schoener TW, Spiller DA. 1996. Devastation of prey diver-sity by experimentally introduced predators in the field.Nature 381: 691–694.
Scott JM, Conant S, van Riper C III, eds. 2001. Evolution,ecology, conservation, and management of Hawaiian birds: avanishing avifauna. Lawrence, KS: Cooper OrnithologicalSociety.
Scott JM, Mountainspring S, Ramsey FL, Kepler CB.1986. Forest bird communities of the Hawaiian Islands: theirdynamics, ecology, and conservation. Studies in Avian Biol-ogy, 9. Los Angeles, CA: Cooper Ornithological Society.
Shaw KL. 1996. Sequential radiations and patterns of speci-ation in the Hawaiian cricket genus Laupala inferred fromDNA sequences. Evolution 50: 237–255.
Siemann E. 1998. Experimental tests of effects of plant pro-ductivity and diversity on grassland arthropod diversity.Ecology 79: 2057–2070.
Signor PW. 1990. The geologic history of diversity. AnnualReview of Ecology and Systematics 21: 509–539.
Simberloff DS. 1970. Taxonomic diversity of island biotas.Evolution 24: 23–47.
Srivastava DS, Lawton JH. 1998. Why more productive
sites have more species: an experimental test of theoryusing tree-hole communities. American Naturalist 152:510–529.
Stein JD. 1983. Insects infesting Acacia koa (Legumosae) andMetrosideros polymorpha (Myrtaceae) in Hawaii: an anno-tated list. Proceedings of the Hawaiian Entomological Soci-ety 24: 305–316.
Stephens PR, Wiens JA. 2003. Explaining species richnessfrom continents to communities: the time-for-speciationeffect in emydid turtles. American Naturalist 161: 112–128.
Sterner RW, Elser JJ. 2003. Ecological stoichiometry: thebiology of elements from molecules to the biosphere. Prince-ton, NJ: Princeton University Press.
Stirling G, Wilsey B. 2001. Empirical relationships betweenspecies richness, evenness, and proportional diversity. Amer-ican Naturalist 158: 286–299.
Stork NE, Hammond PM. 1997. Sampling arthropods fromtree-crowns by fogging with knockdown insecticides: lessonsfrom studies of oak tree beetle assemblages in RichmondPark (UK). In: Stork NE, Adis J, Didham RK, eds. Canopyarthropods. London: Chapman & Hall, 3–26.
Strong DR. 1974. Rapid asymptotic species accumulation inphytophagous insect communities: the pests of cacao. Science185: 1064–1066.
Swezey OH. 1954. Forest entomology in Hawaii. Honolulu:Special Publication 76 of the Bishop Museum.
Van Bael SA, Brawn JD, Robinson SK. 2003. Birds defendtrees from herbivores in a Neotropical forest canopy. Pro-ceedings of the National Academy of Sciences of the UnitedStates of America 100: 8304–8307.
Vandergast AG, Gillespie RG, Roderick GK. 2004. Influ-ence of volcanic activity on the population genetic structureof Hawaiian Tetragnatha spiders: fragmentation, rapid pop-ulation growth and the potential for accelerated evolution.Molecular Ecology 13: 1729–1743.
Veech JA, Crist TO. 2003. PARTITION, software for parti-tioning species diversity, Version 1.0. http://www.unco.edu/nhs/biology/facultystaff/Veech/software_page.htm
Veech JA, Crist TO, Summerville KS. 2003. Intraspecificaggregation decreases local species diversity of arthropods.Ecology 84: 3376–3383.
Vitousek PM. 2004. Nutrient cycling and limitation: Hawai‘ias a model system. Princeton, NJ: Princeton University Press.
Vitousek PM, Chadwick OA, Crews TE, Fownes JH, Hen-dricks DM, Herbert D. 1997. Soil and ecosystem develop-ment across the Hawaiian Islands. GSA Today 7: 1–8.
Vitousek PM, Turner DR, Kitayama K. 1995. Foliar nutri-ents during long-term soil development in Hawaiian mon-tane rain forest. Ecology 76: 712–720.
Wagner WL. 1991. Evolution of waif floras: a comparison ofthe Hawaiian and Marquesan archipelagoes. In: Dudley EC,ed. The unity of evolutionary biology. Portland, OR:Dioscorides Press, 267–284.
Wagner WL, Funk VA, eds. 1995. Hawaiian biogeography:evolution on a hot spot archipelago. Washington, DC: Smith-sonian Institution Press.
Waide RB, Willig MR, Steiner CF, Mittelbach G, Gough L,Dodson SI, Juday GP, Parmenter R. 1999. The relation-
570 D. S. GRUNER
© 2007 The Linnean Society of London, Biological Journal of the Linnean Society, 2007, 90, 551–570
ship between productivity and species richness. AnnualReview of Ecology and Systematics 30: 257–300.
Wallace AR. 1878. Tropical nature and other essays. NewYork, NY: Macmillan.
Wardle DA, Walker LR, Bardgett RD. 2004. Ecosystemproperties and forest decline in contrasting long-term chro-nosequences. Science 305: 509–513.
Warren PH, Gaston KJ. 1992. Predator-prey ratios: a specialcase of a general pattern? Philosophical Transactions of theRoyal Society of London Series B, Biological Sciences 338:113–130.
Whittaker RJ. 1998. Island biogeography: ecology, evolutionand conservation. Oxford: Oxford University Press.
Whittaker RJ, Heegaard E. 2003. What is the observed rela-tionship between species richness and productivity? Ecology84: 3384–3390.
Whittaker RJ, Willis KJ, Field R. 2001. Scale and speciesrichness: towards a general, hierarchical theory of speciesdiversity. Journal of Biogeography 28: 453–470.
Willis JC. 1922. Age and area: a study in the geographical
distribution and origin of species. Cambridge: CambridgeUniversity Press.
Wilson EO. 1961. The nature of the taxon cycle in the Melane-sian ant fauna. American Naturalist 95: 169–193.
Wilson JB. 1996. The myth of constant predator: prey ratios.Oecologia 106: 272–276.
Wright SD, Yong CG, Dawson JW, Whittaker DJ, Gard-ner RC. 2000. Riding the ice age El Niño? Pacific biogeog-raphy and evolution of Metrosideros subg. Metrosideros(Myrtaceae) inferred from nuclear ribosomal DNA. Proceed-ings of the National Academy of Sciences of the United Statesof America 97: 4118–4123.
Yanoviak SP, Nadkarni NM, Gering JC. 2003. Arthropodsin epiphytes: a diversity component that is not effectivelysampled by canopy fogging. Biodiversity and Conservation12: 731–741.
Zimmerman EC. 1948. Introduction. Insects of Hawaii, Vol. 1.Honolulu: University of Hawaii Press.
Zimmerman EC. 1970. Adaptive radiation in Hawaii withspecial reference to insects. Biotropica 2: 32–38.