Embed Size (px)
Citation preview

Geographic Information Systems (GIS)
Use Cases

Introducing the GIS Use Cases
Why use cases?
Over the past four years the American Red Cross International Services Department (ISD) has piloted and refined applications of Geographic Information Systems (GIS) to its core programming and response activities. In this time, we’ve found that the best tools and the most effcetive approaches meant little without strong relationships with our program staff rooted in their day-to-day realities of program management and national society engagement.
Our staff are passionate, talented and frequently quite interested in using technology to improve their programs. Many believe technology and GIS in particular could improve their projects’ impact on beneficiaries and build technical skills within Red Cross National Societies. They and their national society counterparts are excited by GIS’s ability to deliver compelling, accessible products using relatively advanced technology.
But translating this enthusiasm to concrete, manageable elements of project design was difficult. Enthusiastic program staff often couldn’t see exactly how GIS integrates with our work and what it can do for projects. During conversations with program staff, certain questions came up again and again. What exactly could GIS mean for my project? What will it take to make it happen? How will it work for my national society? We realized we had to better communicate and explain GIS’s promise to improve Red Cross work.
What is a use case?
So we went back to the keyboard, did some hard thinking, and pulled together these use cases. The use cases that follow capture our thoughts on some of the most common or important ways GIS can help our work. Each use case shows how a specific application of GIS can assist a given program or national society and what the ideal process is to make it happen. Some of these use cases overlap or integrate with one another; others are standalone.
More than anything, the use cases aim to start conversations. Read them, think about what they could mean for your work, and then schedule a time to talk to the GIS team about making one or many of these use cases a reality for your project(s). They’re idealized applications; exact budget numbers, processes and outputs will vary from project to project. It’s our job to adapt the approaches within these pages to your project’s context and deliver something that works well for you, your team or your national society.
Finally, we must emphasize that these are works in progress. They are about serving your needs, not ours, so feel free to suggest edits and clarifications or ask for additional use cases that interest you.

ContentsLong Term Planning Use Cases
Community Selection 3
Terrain Analysis 5
Base Mapping 7
Participatory Mapping 9
Technical Collaboration 11
Project Indicator Visualization 13
Managing Equipment 15
Public Engagement 17
Historical Trend Analysis 19
Disaster Use CsesReference
Base Camp 21
Field Navigation 22
Crowd Sourced Mapping 23
Assesment
Resource Mapping 24
Scenario Mapping 25
Imagery Analyses 26
Damage 27
Coordination
Operational (by sector) 28
3W (Who, What, Where) 29
Planning
Relief Distribution 30
Beneficiary Targeting 31
Leadership Reporting 32GIS USE CASES | 3

• $0-3,000 research and assessment (dependent on data costs)
• 2 weeks GIS team time for mapping and analysis
• Program Officers• Delegates• Regional Directors• National Society Staff
Who it’s useful for
Approximate Cost
Community Selection
Problem
Selecting communities for projects is difficult and prone to political influence
American Red Cross may have a partial or poor understanding of actual needs in some areas
Delegates and project staff have little means of, or evidence for, double-checking and pushing back on selections
Solution
Map communities’ known potential hazards
Research and map additional secondary data for provinces and communities in question
Research and locate activities by partners, peers, and communities in areas under consideration
Map historical Red Cross programming in relation to proposed communities
Value Add
Help American Red Cross target the most at-risk, least covered communities
Improve the quality of community selection and targeting
Better awareness of overlap with peers and previous programs
Make project setup choices based on demonstrable evidence
| GIS USE CASES4

Steps
Key Questions
Staff Involvement
National Society Senior StaffProgram Officers
Country Delegate/Regional Rep.Technical Advisors
GIS Team
1 Do you have existing contacts for secondary data?
2 Are these activities in the budget and project logframe?
3 Is there a plan for managing data during or after the project?
4 Is there a strategy to keep data and analysis up to date?
5
4
3
2
1 Create a list of target areas, needed data inputs, and key questions to answer
Conduct a secondary data review to gather appropriate datasets
Create maps responding to key questions and exploring new insights
Contribute feedback
Create additional maps as necessary to further explore new insights
GIS USE CASESPROJECT
SETUP
GIS USE CASES | 5
• $250 per GPS• 1 week for GIS Analysis• 2-3 weeks for staff to collect
locations
• National Society Staff• National Society Managers• Program Officers
Who it’s useful for
Approximate Cost
Problem
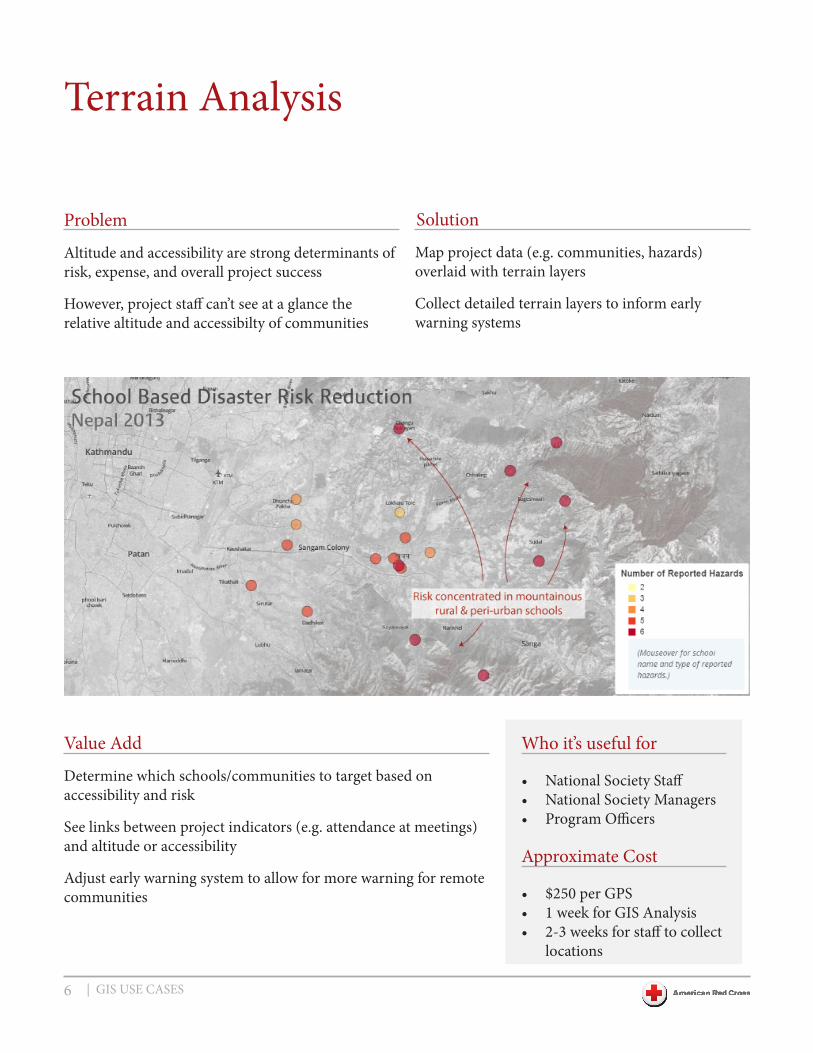
Altitude and accessibility are strong determinants of risk, expense, and overall project success
However, project staff can’t see at a glance the relative altitude and accessibilty of communities
Solution
Map project data (e.g. communities, hazards) overlaid with terrain layers
Collect detailed terrain layers to inform early warning systems
Value Add
Determine which schools/communities to target based on accessibility and risk
See links between project indicators (e.g. attendance at meetings) and altitude or accessibility
Adjust early warning system to allow for more warning for remote communities
Terrain Analysis
| GIS USE CASES6

7
6
5
4
3
2
1
GIS USE CASESPROJECT
IMPLEMENTATION
Steps
Key Questions
National Society StaffProgram Officers
Country Delegate/Regional Rep.Technical Advisors
GIS TeamDelegation/NS GIS Staff
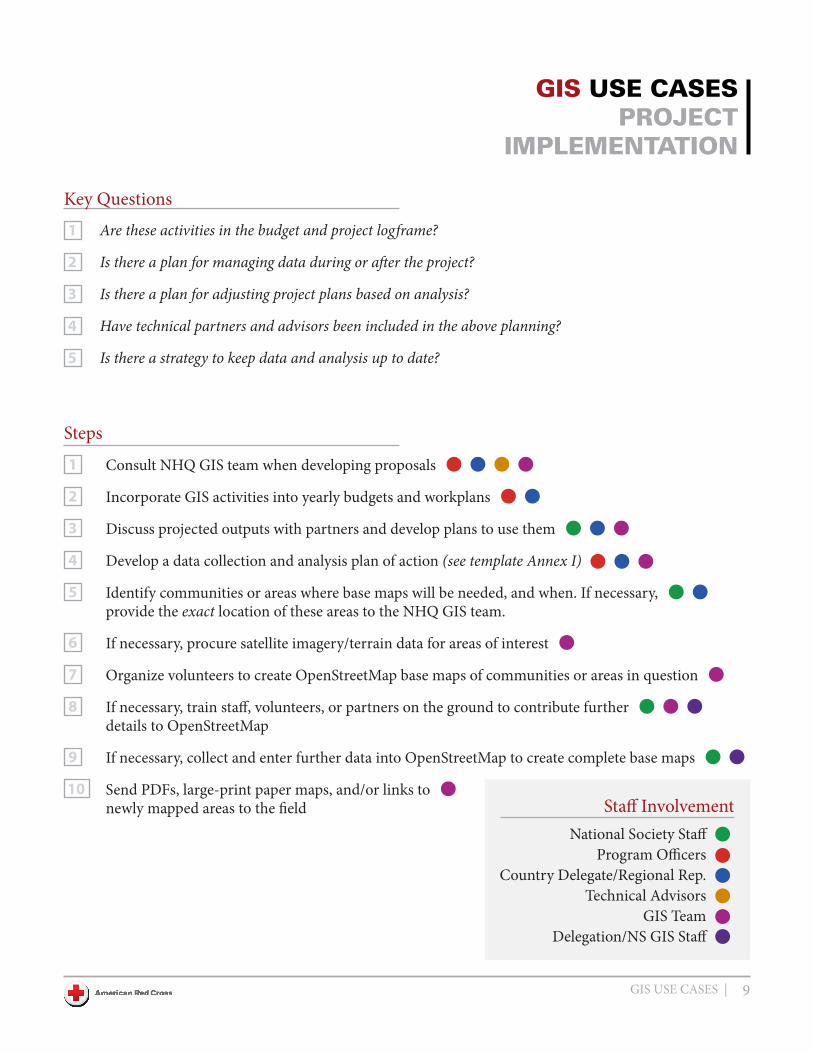
1 Are these activities in the budget and project logframe?
2 Is there a plan for managing data during or after the project?
3 Is there a plan for adjusting project plans based on analysis?
4 Have technical partners and advisors been included in the above planning?
5 Is there a strategy to keep data and analysis up to date?
Consult NHQ GIS team when developing proposals
Incorporate GIS activities into yearly budgets and workplans
Discuss projected outputs with partners and develop plans to use them
Develop a data collection and analysis plan of action (see template Annex I)
Collect data identified for analysis
If necessary, collect a higher resolution terrain layer (Digital Elevation Model)
Create maps visualizing data overlaid with terrain
Staff Involvement
GIS USE CASES | 7

• National Society Staff• Program Officers• Delegates• Regional Managers• Regional Directors
• GPS training costs (by Q&L) • $250 per GPS• 2 weeks GIS team (field) • 4 weeks advance time to
engage remote volunteers
The city of Gulu, Uganda pre-base mapping The city of Gulu, Uganda post-base mapping
Who it’s useful for
Approximate Cost
Problem
Many communities are “off the map” and hence can’t be seen or understood spatially
Program managers can’t compare the scale or location of communities and plan activities accordingly
Geographic risk, project, and secondary data cannot be overlaid onto communities
Solution
Create a detailed, building-by-building base map of each community in OpenStreetMap
Collect detailed information about building and land uses during assessment activities to complete the base map
Value Add
Better ability to see individual communities and compare communities at a project scale
Base maps available for day-to-day activities
Base map is a foundation for maps and analysis throughout the project lifecycle
Base map is useful for community, NS, and peers after project completion
Base Mapping
| GIS USE CASES8
10
9
8
7
6
5
4
3
2
1
Staff Involvement
Steps
Key Questions
National Society StaffProgram Officers
Country Delegate/Regional Rep.Technical Advisors
GIS TeamDelegation/NS GIS Staff
1 Are these activities in the budget and project logframe?
2 Is there a plan for managing data during or after the project?
3 Is there a plan for adjusting project plans based on analysis?
4 Have technical partners and advisors been included in the above planning?
5 Is there a strategy to keep data and analysis up to date?
Consult NHQ GIS team when developing proposals
Incorporate GIS activities into yearly budgets and workplans
Discuss projected outputs with partners and develop plans to use them
Identify communities or areas where base maps will be needed, and when. If necessary, provide the exact location of these areas to the NHQ GIS team.
If necessary, procure satellite imagery/terrain data for areas of interest
Organize volunteers to create OpenStreetMap base maps of communities or areas in question
If necessary, train staff, volunteers, or partners on the ground to contribute further details to OpenStreetMap
If necessary, collect and enter further data into OpenStreetMap to create complete base maps
Send PDFs, large-print paper maps, and/or links to newly mapped areas to the field
GIS USE CASESPROJECT
IMPLEMENTATION
Develop a data collection and analysis plan of action (see template Annex I)
GIS USE CASES | 9

Value Add
Better analysis of hazards, mitigations, and response capacity in communities
Advocate community needs to local government
Data has long lasting effects after programming is complete
Incorporation of community action plans into local disaster management plans
Solution
Base map communites in OpenStreetMap, then use OSM printouts to collect community data in GIS-compatible formats
Map communities, community risk data, and known secondary data in a GIS and analyze locally
Distribute contingency planning maps for likely disaster scenarios
Share data with technical partners in government, the private sector or other NGOs
Problem
Data collected from Red Cross participatory tools is difficult to analyze and plan activities from
Difficult to compare participatory and secondary data
Community data is collected in formats incompatible with standard paper analysis tools used by partners
Participatory data isn’t used beyond the project lifecycle
Participatory Mapping
• $250 per GPS• $3000 training cost (depending on
travel costs)• 1-2 day pre-VCA base mapping exercise• Normal VCA costs
• Community Members• National Society Staff• National Society Managers• Program Officers• Country Delegates
Who it’s useful for
Approximate Cost
| GIS USE CASES10
National Society Senior StaffNational Society Staff
Program OfficersCountry Delegate/Regional Rep.
Technical AdvisorsGIS Team
Delegation/NS GIS Staff
Steps
Key Questions
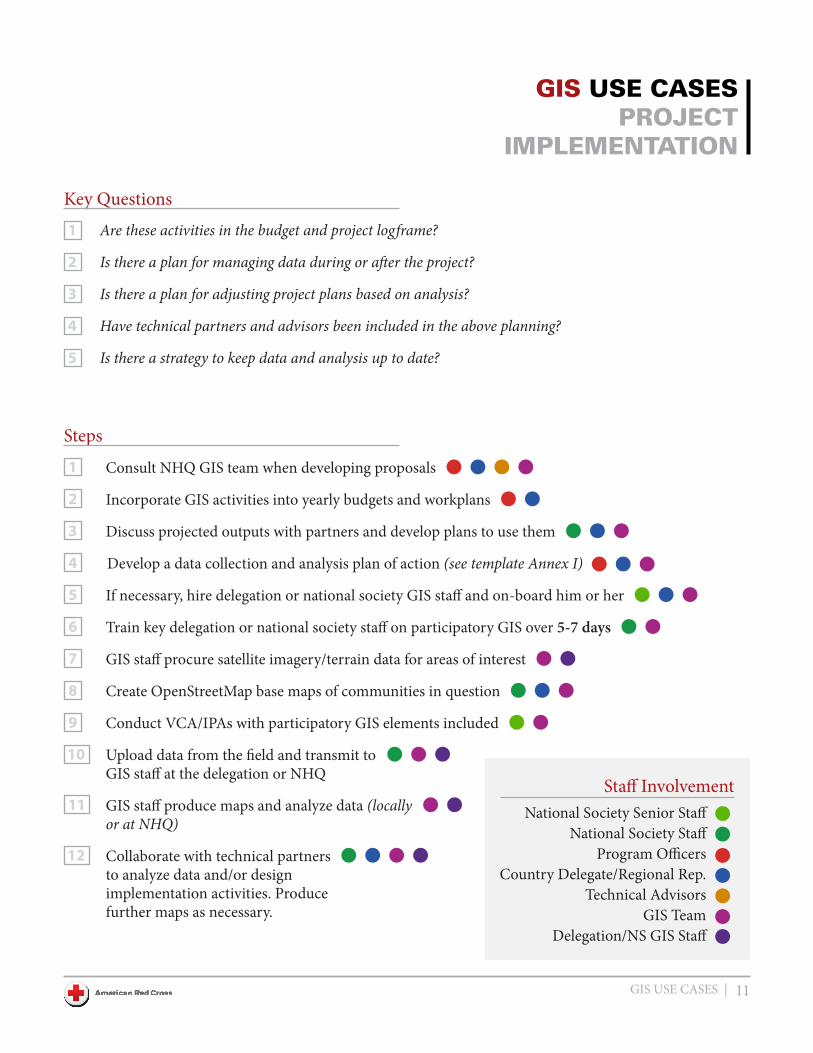
1 Are these activities in the budget and project logframe?
2 Is there a plan for managing data during or after the project?
3 Is there a plan for adjusting project plans based on analysis?
4 Have technical partners and advisors been included in the above planning?
5 Is there a strategy to keep data and analysis up to date?
Collaborate with technical partners to analyze data and/or design implementation activities. Produce further maps as necessary.
GIS staff produce maps and analyze data (locally or at NHQ)
Upload data from the field and transmit to GIS staff at the delegation or NHQ
Conduct VCA/IPAs with participatory GIS elements included
Create OpenStreetMap base maps of communities in question
GIS staff procure satellite imagery/terrain data for areas of interest
Train key delegation or national society staff on participatory GIS over 5-7 days
If necessary, hire delegation or national society GIS staff and on-board him or her
Discuss projected outputs with partners and develop plans to use them
Incorporate GIS activities into yearly budgets and workplans
Consult NHQ GIS team when developing proposals
11
12
10
9
8
7
6
5
4
3
2
1
GIS USE CASESPROJECT
IMPLEMENTATION
Staff Involvement
Develop a data collection and analysis plan of action (see template Annex I)
GIS USE CASES | 11

Problem
Technical partners’ project plans (e.g. micro-mitigation) may not adequately capture Red Cross or community inputs because Red Cross tools don’t package community data (e.g. VCA, baseline) in reusable formats
Project staff challenged by preserving, analyzing, or reusing data from technical partners
Solution
Georeference and preserve project data in accessible, standardized data formats (csv, shapefile, Access database)
Adopt tools that ease data storage, analysis & transfer (e.g. IFRC Resource Management System)
Coordinate data formats and exchange within partnership agreements
Build Red Cross national society capacity to store and manage data
Value Add
Enhanced responsiveness to community concerns in techni-cal project planning
More detailed, responsive activity planning
Ability to reuse and recycle valuable data from technical partners
Improved information management
Technical Collaboration
• Technical Partners• National Society Staff• National Society Managers• Country Delegates• Responders
Who it’s useful for
• $250 per GPS• Normal project data collection costs• IM Training Costs: TBD
Approximate Cost
| GIS USE CASES12
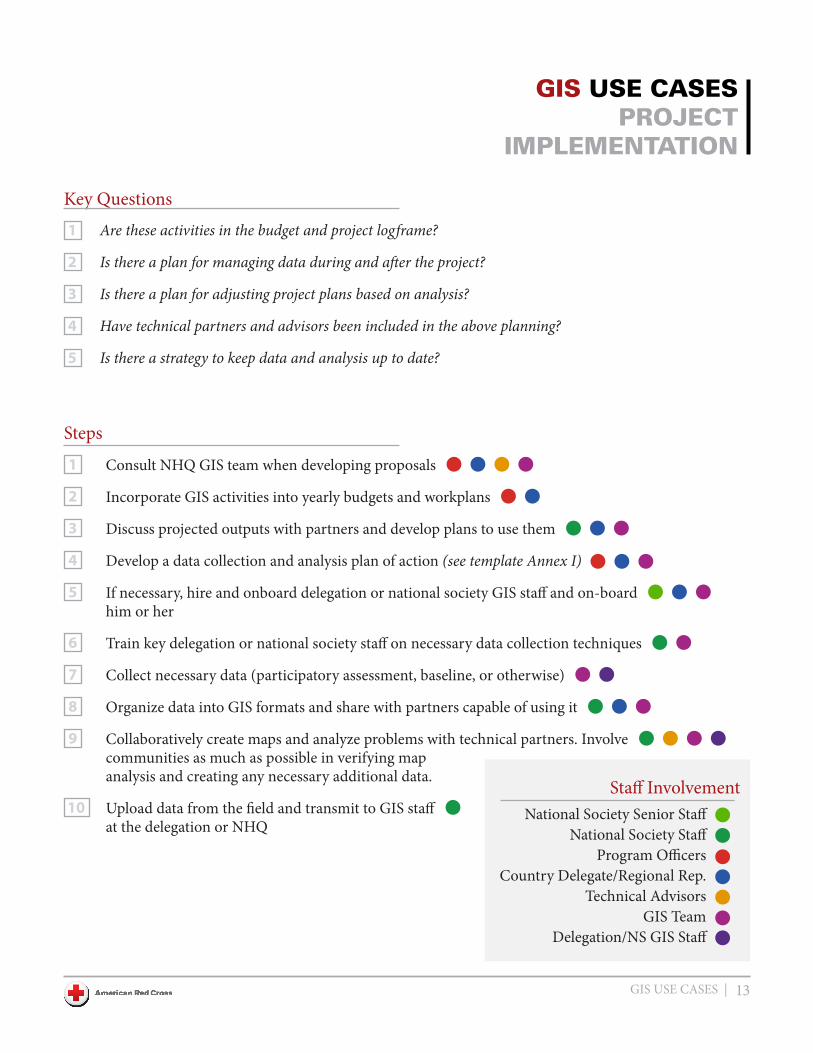
Collaboratively create maps and analyze problems with technical partners. Involve communities as much as possible in verifying map analysis and creating any necessary additional data. Staff Involvement
Steps
Key Questions
National Society Senior StaffNational Society Staff
Program OfficersCountry Delegate/Regional Rep.
Technical AdvisorsGIS Team
Delegation/NS GIS Staff
1 Are these activities in the budget and project logframe?
2 Is there a plan for managing data during and after the project?
3 Is there a plan for adjusting project plans based on analysis?
4 Have technical partners and advisors been included in the above planning?
5 Is there a strategy to keep data and analysis up to date?
Consult NHQ GIS team when developing proposals
Incorporate GIS activities into yearly budgets and workplans
Discuss projected outputs with partners and develop plans to use them
If necessary, hire and onboard delegation or national society GIS staff and on-board him or her
Train key delegation or national society staff on necessary data collection techniques
Collect necessary data (participatory assessment, baseline, or otherwise)
Organize data into GIS formats and share with partners capable of using it
Upload data from the field and transmit to GIS staff at the delegation or NHQ
10
9
8
7
6
5
4
3
2
1
GIS USE CASESPROJECT
IMPLEMENTATION
Develop a data collection and analysis plan of action (see template Annex I)
GIS USE CASES | 13

• Community Members• National Society Staff• Program Officers• Delegates
• No additional cost to standard monitoring
• $250 x 1 GPS per chapter
Who it’s useful for
Approximate Cost
Problem
Project Indicator Tracking Tables (ITTs) are very difficult to analyze, visualize, and share
ITTs give no indication of geographic trends in project data
No intuitive means of comparing ITTs between projects
Impossible to analyze the relationship between proj-ect indicators and outside determinants of success
Solution
Collect points/areas for communities and then organize indicators at the community level
Create thematic maps showing trends in indicators within and between projects
Create maps comparing key indicators to project outputs
Map key indicators vs. key secondary data (e.g. de-mographics)
Value Add
Make reporting more accessible and actionable
Highlight problem areas and suggest possible corrections
Correlate project success to geographic factors
Show clustering of results or trends over time
Compare indicators with baseline or secondary data
Demonstrate progress to donors or partners
Project Indicator Visualization
| GIS USE CASES14

Steps
Key Questions
National Society Senior StaffNational Society Staff
Program OfficersCountry Delegate/Regional Rep.
Technical AdvisorsGIS Team
1 Are these activities in the budget and project logframe?
2 Is there a plan for managing data during or after the project?
3 Is there a plan for adjusting project plans based on analysis?
4 Have technical partners and advisors been included in the above planning?
5 Is there a strategy to keep data and analysis up to date?
Consult NHQ GIS team when developing proposals
Incorporate GIS activities into yearly budgets and workplans
Discuss projected outputs with partners and develop a plan of action
Collect identified data
Produce maps and conduct analysis at identified intervals6
5
4
3
2
1
GIS USE CASESPROJECT
IMPLEMENTATION
Staff Involvement
Develop a data collection and analysis plan of action (see template Annex I)
GIS USE CASES | 15

Value Add
Replace aging or inadequate equipment quickly
Match distribution of equipment with assessed vulnerabilities
Ensure adequate distribution of equipment within congested urban areas
Enhanced readiness to respond at the community level
Problem
Difficult to track the location, status, and upkeep of safety and response equipment (e.g. LSAR kits)
No way of assessing over-saturation or gaps in cov-erage of equipment
No means of visualizing the relationship between community readiness to respond and distribution of materials
Solution
Design IM tools to capture the location, status, coverage of response equipment and capture community capacity to utilize said equipment
Map the locations of gear
Highlight status, upkeep, and anticipated coverage areas of gear
Map gear locations/status vs. overall community readiness to respond
• • Community Members• National Society Staff• Program Officers
Who it’s useful for
• GPS costs• 1 day of GIS team time
Approximate Cost
Managing Equipment
| GIS USE CASES16

Steps
Key Questions
National Society Senior StaffNational Society Staff
Program OfficersCountry Delegate/Regional Rep.
Technical AdvisorsGIS Team
Delegation/NS GIS Staff
1 Are these activities in the budget and project logframe?
2 Is there a plan for managing data during and after the project?
3 Is there a plan for adjusting project plans based on analysis?
4 Have external technical partners and advisors been included in the above planning?
5 Is there a strategy to keep data and analysis up to date?
Consult NHQ GIS team when developing proposals
Incorporate GIS activities into yearly budgets and workplans
Discuss projected outputs with partners and develop plans to use them
Collect required data during the course of project activities
If possible, upload data to regional IFRC Resource Management System and analyze locally
Create static maps of relevant equipment status at intervals specified in analysis plan
Update data and maps during the course of project activities, at intervals specified in data collection plan
8
7
6
5
4
3
2
1
GIS USE CASESPROJECT
IMPLEMENTATION
Staff Involvement
Develop a data collection and analysis plan of action (see template Annex I)
GIS USE CASES | 17

• Donors• Communications Staff
• GPS costs• 3 days per interactive map• Normal project data col-
Who it’s useful for
Approximate Cost
Problem
The public and donors want to see details about program locations and successes
Current tools for relaying project information and locations aren’t meeting outside expectations
Other organizations are ramping up their GIS efforts to meet heightened public and donor expectations
Solution
Track all project locations and map base infrastructure for relevant and high profile communities
Create interactive maps for RCO to accompany communications stories
Georeference and map photos taken in the field
Create maps of individual project locations for do-nors and the general public
Value Add
Greater accountability to donors
Forum for demonstrating our technological sophistication to donors
Ability to leverage new funding streams, particularly those centered on technology
Interactive content: stories incorporate maps; maps incorporate stories
Targeted fundraising campaigns for specific areas and groups
Public Engagement
| GIS USE CASES18

Steps
Key Questions
Communications StaffNational Society Staff
Program OfficersCountry Delegate/Regional Rep.
GIS Team
1 Are these activities in the budget and project logframe?
2 Where will the end product be hosted?
3 Is this integrated into a larger communications strategy?
Consult NHQ GIS team when developing communications strategy
Develop a data collection and mapping plan for needed data
Collect identified data during the course of project activities and/or comms visits
Create interactive maps
Host maps on standalone websites or redcross.org as appropriate5
4
3
2
1
GIS USE CASESOTHER
Staff Involvement
GIS USE CASES | 19

• GPS costs• 1 day per project to
georeference past projects
• Delegates• Regional Managers• Regional Directors• Senior/Executive Directors
Who it’s useful for
Approximate Cost
Problem
Cannot visualize historical data and analyze long-term progress towards strategic goals
Reliance on narrative reports to understanding the evolution of projects in countries
Institutional knowledge is based on personal memory
Solution
Record the geography of all data from current projects
Record the geography of all relevant data from past projects
Map the locations of past and current projects, overlaying indicators, and/or assessment data that illustrate key points
Value Add
Long-term perspective on programming improves evidence-based decision-making to increase program sustainability
Evidence-based decision-making for portfolio management
Improved, data-driven knowledge management
High-level decision-making and visualization for leadership and public engangment
Historical Trend Analysis
| GIS USE CASES20

Steps
Key Questions
Senior ManagementNational Society Staff
Program OfficersCountry Delegate/Regional Rep.
Technical AdvisorsGIS Team
Delegation/NS GIS Staff
1 Was data well gathered and organized during prior phases of the project?
2 Is there a plan for managing data during or after the project?
3 Is there a plan for adjusting project plans based on analysis?
4 Is there a strategy to keep data and analysis up to date?
Consult NHQ GIS team when developing proposals
Incorporate GIS activities into yearly budgets and workplans
Discuss projected outputs with partners and develop plans to use them
Collect necessary data
Consult NHQ GIS team regarding historical analysis needs
Create maps or series of maps comparing old and new data7
6
5
4
3
2
1
GIS USE CASESOTHER
Staff Involvement
Develop a data collection and analysis plan of action (see template Annex I)
GIS USE CASES | 21

Problem
Enviroments can be complex and difficult to visualize
Camp environments often go unmapped, making them difficult to navigate, manage and expand in an orderly fashion memory
Solution
Maps can be used to make sense of complex environments at a very fine scale, including transitory environments like refugee camps.
Maps help orient camp staff and residents alike and allows for analysis of service delivery practices and general layout.
Base Camp
• 1 day
• Deployed staff• Decision makers• Service delivery providers
Who it’s useful for
Turn Around Time
GIS USE CASESREFERENCE
| GIS USE CASES22
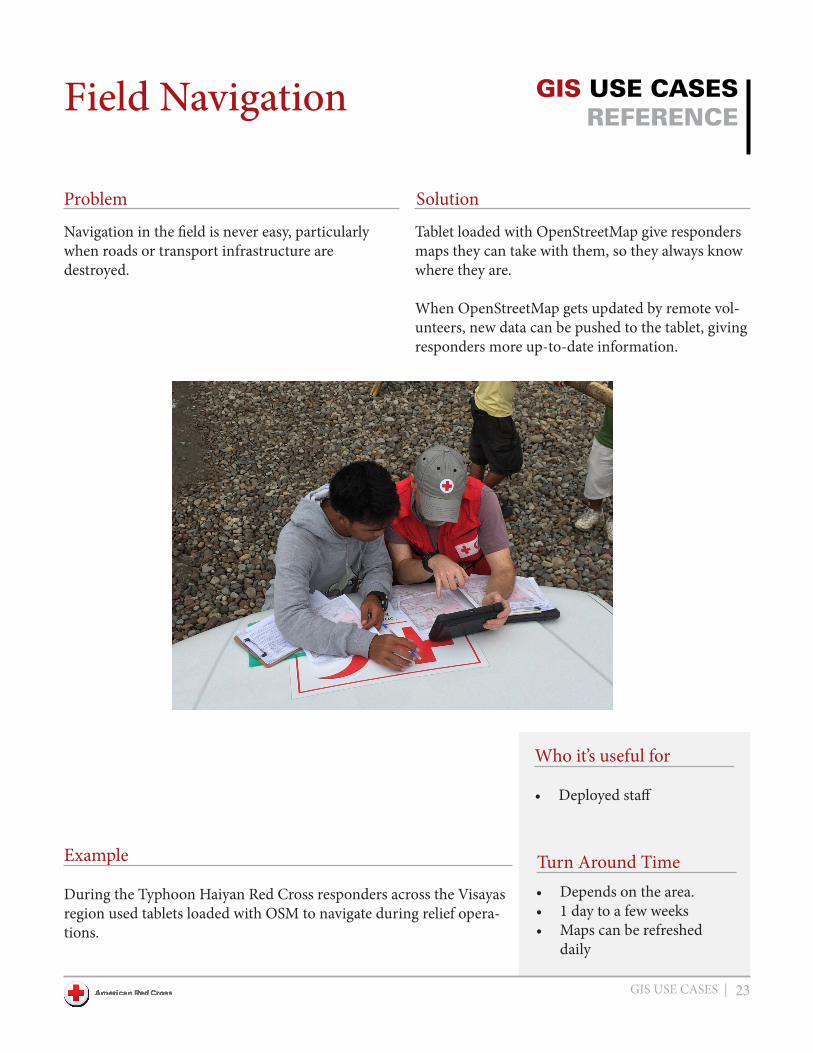
Problem
Navigation in the field is never easy, particularly when roads or transport infrastructure are destroyed.
Solution
Tablet loaded with OpenStreetMap give responders maps they can take with them, so they always know where they are.
When OpenStreetMap gets updated by remote vol-unteers, new data can be pushed to the tablet, giving responders more up-to-date information.
Example
During the Typhoon Haiyan Red Cross responders across the Visayas region used tablets loaded with OSM to navigate during relief opera-tions.
Field Navigation
• Depends on the area.• 1 day to a few weeks• Maps can be refreshed
daily
• Deployed staff
Who it’s useful for
Turn Around Time
GIS USE CASESREFERENCE
GIS USE CASES | 23

Problem
Good base maps are key to any response operation: without some sense of where they are, responders have little means of navigating or understanding the scale of a place. Unfortunately, maps of response sites are often out-of-date, undetailed or non-existent, particularly at city scale.
Solution
Crowdsourcing the creation of new maps in Open-StreetMap using digital volunteers and satellite im-agery allows us to rapidly create up-to-date, highly accurate base maps of any location on earth in a matter of days or even hours.
Example
This map of southeastern Gueckedou, a city heavily affected by the 2014 West Africa ebola outbreak, was produced by volunteers in under two days by remote volunteers and rapidly repackaged for responders in the field. It was used for day-to-date coordination and navigation.
Crowd Sourced Mapping
• Deployed staff
Who it’s useful for
Turn Around Time
• 24 houe lead• Constantly Updating
GIS USE CASESREFERENCE
| GIS USE CASES24

Problem
During disaters infotmation comes from a various sources in all different formats making it difficult to grasp the full picture and gain information in a timeley manner.
Solution
Maps are a powerful, commonly understood tool of analysis for organizing and presenting piecemeal bits of information from various sources.
Example
This map combined cholera case study manually extracted from WHO PDFs and Sierra Leone Red Cross data on health-trained volunteers from 6 Excel Worksheets into one cohesive product.
It helped the IFRC, SLRC and the government of Sierra Leone understand where response volunteers were well positioned to deal with the emerging crisis (as in Kakua) and where resources needed to be shifted (as in Kaiyamba). It was also a powerful advocacy tool for the Sierra Leone Red Cross Society to communicate its reach and potential impact.
Resource Mapping
• 1 day
• Communications• Decision makers• Assessment teams
Who it’s useful for
Turn Around Time
GIS USE CASESASSESMENT
GIS USE CASES | 25
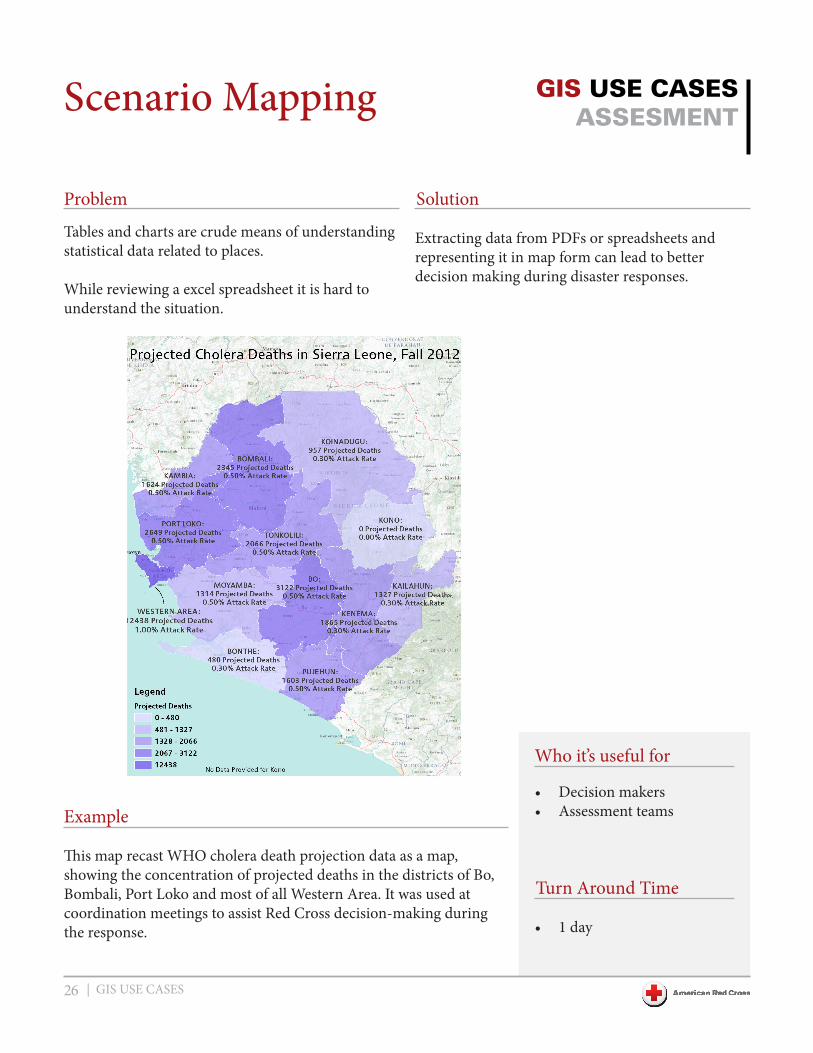
Problem
Tables and charts are crude means of understanding statistical data related to places.
While reviewing a excel spreadsheet it is hard to understand the situation.
Solution
Extracting data from PDFs or spreadsheets and representing it in map form can lead to better decision making during disaster responses.
Example
This map recast WHO cholera death projection data as a map, showing the concentration of projected deaths in the districts of Bo, Bombali, Port Loko and most of all Western Area. It was used at coordination meetings to assist Red Cross decision-making during the response.
Scenario Mapping
• 1 day
• Decision makers• Assessment teams
Who it’s useful for
Turn Around Time
GIS USE CASESASSESMENT
| GIS USE CASES26

Problem
In a response it is easy to focus on the current situation and needs. Sometimes there are future problems that are hard to anticipate when you don’t know the scale of the disaster.
Solution
Satellite imagery helps responders to understand emerging risks in near real time.
Example
During the Nigerian floods of 2012 satellite imagery from NASA successfully helped the Nigerian Red Cross and Nigerian government to understand the scale of upstream flooding and the impending impact on downstream communities with this knowledge evacuations, public awareness campaigns, pre-positioning of supplies and other preventative measures can be appropriately targeted.
Imagery Analyses
• 1 -3 days
• Response Decision Makers• Deployed staff• Assessment Teams
Who it’s useful for
Turn Around Time
GIS USE CASESASSESMENT
GIS USE CASES | 27
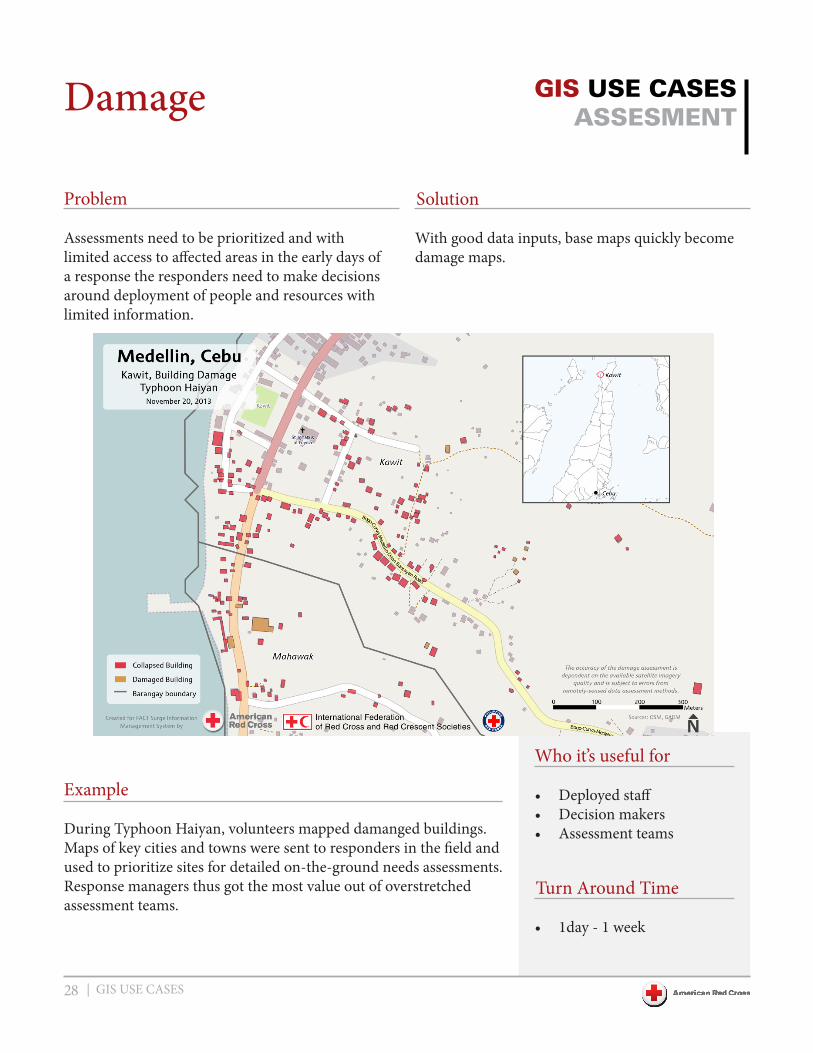
Problem
Assessments need to be prioritized and with limited access to affected areas in the early days of a response the responders need to make decisions around deployment of people and resources with limited information.
Solution
With good data inputs, base maps quickly become damage maps.
Damage
Example
During Typhoon Haiyan, volunteers mapped damanged buildings. Maps of key cities and towns were sent to responders in the field and used to prioritize sites for detailed on-the-ground needs assessments. Response managers thus got the most value out of overstretched assessment teams.
• 1day - 1 week
• Deployed staff• Decision makers• Assessment teams
Who it’s useful for
Turn Around Time
GIS USE CASESASSESMENT
| GIS USE CASES28

Problem
Response operations traditionally struggle to optimize the delivery of limited services to the maximum number of beneficiaries during crisis events.
Solution
Coordination maps overlaying deployed resources with high level known needs help operations stay on the same page from the field to HQ level and highlight areas of additional need.
Example
This map helped the Red Cross see the extent of the Ebola outbreak in West Africa in 2014, the coverage of IFRC health specialists and the possible need to deploy specialists to emerging centers of Ebola activity in Liberia.
Operational
• Half a day
• Deployed Staff• Decision makers• Roster Officer
Who it’s useful for
Turn Around Time
GIS USE CASESCOORDINATION
GIS USE CASES | 29

Problem
Coordination is a challenge in all responses and is much more complex in large-scale response operations.
Solution
Maps help to quicky identify issues, different groups invloved which help coordinate activities and plan interventions.
Example
This map was used to track the distribution and activities of Red Cross Red Crescent National Societies deploying under the Red Cross banner during the Typhoon Haiyan response. Philippine Red Cross staff, IFRC responders and managers at all levels used it to track deployments, coordinate activities, and plan interventions.
3W (Who, What, Where)
• Half a day
• IFRC responders• Decision makers• Response lead
Who it’s useful for
Turn Around Time
GIS USE CASESCOORDINATION
| GIS USE CASES30

Problem
Relief distribution planning is a complicated process involving logistics, relief teams and the community. Planning needs to be coordinated and well communicated.
Solution
This map showed Typhoon Haiyan Relief ERU delegates at a glance the location, boundaries and probable beneficiaries of priority barangays (local government units) within their area of operations, all on top of an OpenStreetMap basemap.
Example
Delegates used these maps to develop efficient multi-day distribution plans and identify important logistical considerations (routing, land features, etc.). These maps constituted a massive improvement on the previous spreadsheet-based model of distribution planning, which took no account of routes, boundaries or underlying landforms.
Relief Distribution
• 1 day
• Decision makers• Deployed staff
Who it’s useful for
Turn Around Time
GIS USE CASESPLANNING
GIS USE CASES | 31
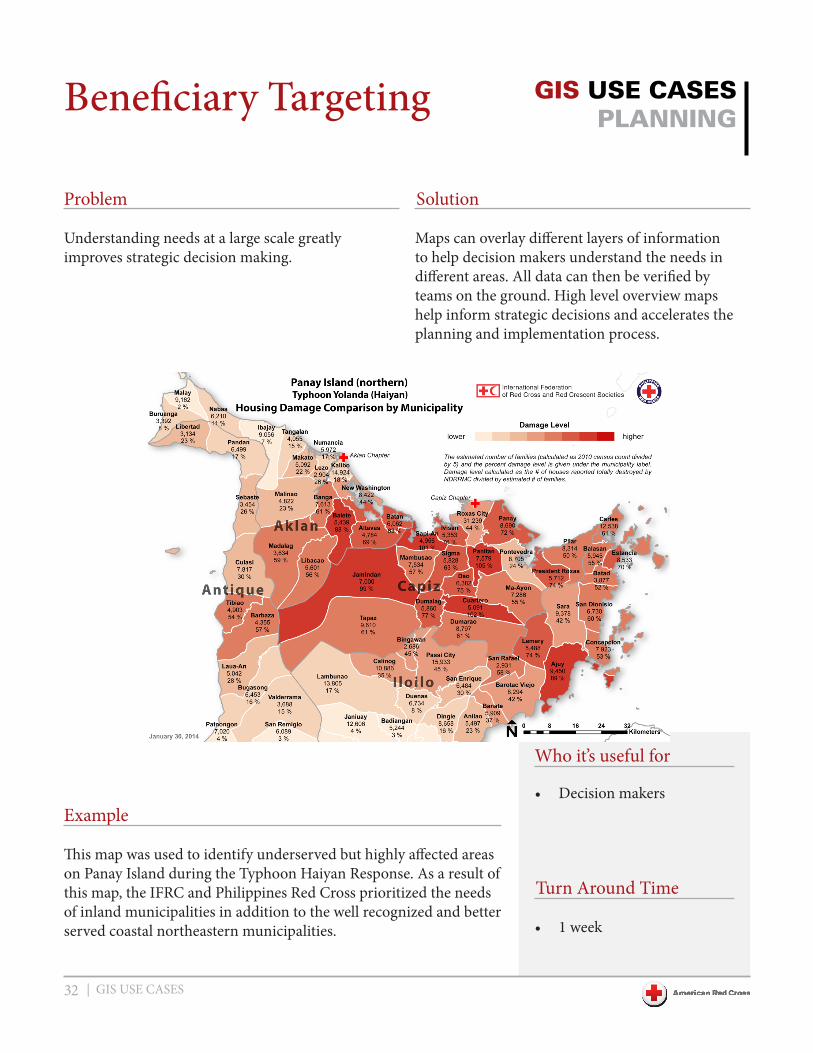
Problem
Understanding needs at a large scale greatly improves strategic decision making.
Solution
Maps can overlay different layers of information to help decision makers understand the needs in different areas. All data can then be verified by teams on the ground. High level overview maps help inform strategic decisions and accelerates the planning and implementation process.
Beneficiary Targeting
Example
This map was used to identify underserved but highly affected areas on Panay Island during the Typhoon Haiyan Response. As a result of this map, the IFRC and Philippines Red Cross prioritized the needs of inland municipalities in addition to the well recognized and better served coastal northeastern municipalities. • 1 week
• Decision makers
Who it’s useful for
Turn Around Time
GIS USE CASESPLANNING
| GIS USE CASES32

Problem
Leadership have limited time to read long reports and digest information for strategic decision making.
Solution
Infographics and data visualization are key analysis tools for responders. During complex relief and recovery operations smart design can make key information digestible and encourage informed strategic decision-making.
Example
This infographic helped the senior leadership of the American Red Cross visualize the extent of activities and financial commitments made during the Typhoon Haiyan relief operation and plan for the long-term recovery. This map was used to prioritize recovery activities, decide on timeframes and allocated resources.
Leadership Reporting
• Leadership
Who it’s useful for
Turn Around Time
• 1 week
GIS USE CASES | 33