Embed Size (px)
Citation preview


Geographic Information Systems and Remote Sensing for
Sustainable Forest Management: Challenge and Innovation
in the 21 st Century
ABSTRACTS AND WORKSHOP PROGRAM
R.I. Hall, A.L. Storrier, G.A. Sanchez-Azo(ei(a, B.A. Rivard, R. W. Wein, I.L. Henry, C.I. Brodie, and B.L. Laishley, editors
Workshop held February 23-25, 2000
Edmonton, Alberta, Canada
Canadian Forestry Service Northern Forestry Centre
Tlw N""I0!,� rOf""Y en.I'< ;. .... of pI>< ,,,, , ... of ,lot Gt_� r""" s.m.:. . • .1""" "'" ",� .. ,,.,., .. 01_. ""_
u Sm!ic< ,.,..."" ... foJ.-e.. c"",. "" fo«>t<rit d. No<tI.. �. It goo_"""'" "",,.J. '" Au..., .. '" -''-n .•• Mot"i""," d ""., Ito T.....,..,.., •• NNd..o..... '" U 'Pi • , .. � . ... . -._ ,.,... ........ OK ,""'*', II< _�. C<I_ ....... ";"irtm ........ , � " _ .... ..... d·."", ....... r __ ", f-ttit • .,.. '''' -.105 "'_,..- '" �'" •• r ,..,. .. lit "'" _irlw . • ,d.J " ..,..;'"" ....... '"'.
u c..., ..... "...,1<rit d. NQn!. """,ij"" 1"". do «''''1-_"'' •• s.m.:. " ... IId"" m Iotfu. """ r _""',..;", """wi .. " d 01_ J""_I.
Cove" Aug .... t 29. 1998 Loondsat 5 Thematic Mappc. false color compo$lte near Whi\KQurt Alberta depicting forested or ...... harvuted arUs In varying stages 0/ regrowth, and extoonslve geophysical activity.

© Her Majesty the Queen in Right of Canada, 2000 Catalogue no. Fo42·305/2000E ISBN 0·662-28586·7
This publication is available at no charge from:
Natural Resources Canada Canadian Forest Service Northern forestry Centre 5320 - 122 Street Edmonton, Alberta T6H 3S5
CANADIAN CATALOGUING IN PUBLICATION DATA
Geographic Information Systems and Remote Sensing for Sustainable Forest Management (1 st: 2000 : Edmonton, Alberta, Canada)
Geographic information systems and remote sensing for sustainable forest management: challenge and innovation in the 21 st century: abstracts and workshop program
"Workshop held February 23-25, 2000, Edmonton, Alberta, Canada" ISBN 0·662·28586· 7 Catalogue no. Fo42·305/2000E
1. Forests and forestry - Remote sensing - Congresses. 2. Geographic information systems - Congresses. 3. Remote sensing - Congresses. 4. Forest management - Congresses. 5. Sustainable forestry - Congresses. I. Hall, R.J. II. Northern Forestry Centre (Canada). Ill. Title.
SD387.R4G46 2000 634.9'2 COO·980085-9
* This report has been printed on Canadian recycled paper.
ii
Hall, R.J.; Storrier, A.L.; Sanchez-Azofeifa, G.A.; Rivard, B.A.; Wein. R.W.; Henry, J.L. Brodie, C.J.; Laishley. B.L., editors. Geographic information systems and remote sensing for sustainable forest management: challenge and innovation in the 21st century. Abstracts and workshop program of a workshop held February 23-25, in Edmonton, Alberta. Nat. Resour. Can., Can. For. Serv., North. For. Cent., Edmonton, Alberta.
ABSTRACT
A" workshop entitled, Geographic Information Systems and Remote Sensing for Sustainable Forest Management: Challenge and Innovation in the 21" Cen
tury was held February 23 to 25, 2000, in Edmonton, Alberta, with participants from seven countries. Over 50 papers and posters were presented on the application of geographic information systems and remote sensing technologies to the study of land use and cover change, biodiversity monitoring, spatial data integration and management, as well as on the advances of technological tools for supporting forest management decisions, and forest management.
an atelier intitule « Geographic Information Systems and Remote Sensing for Sustainable Forest Management: Challenge and Innovation in the 21"
Century n (Systemes d'information geographique et teiedetection au service de la gestion des farets: detis et innovations pour Ie 21e siecle) slest tenu du 23 au 25 fevrier 2000 a Edmonton (Alberta). Les participants venaient de sept pays differents et plus de 50 presentations et posters ont ete presentes d'une part sur l'application des systemes d'information geographique et des techniques de teledetection it l'etude des changements affectant I I utilisation des terres et la couverture vegetale, it la surveillance de la biadiversite, a II integration et it la gestian de donnees spatiales et d'autre part sur les progres accomplis dans Ie domaine des outils technologiques utilises pour la prise de decisions en matiere de gestion forestiere.
iii

iv
j
j
j
j
j
j
j
j
j
I, j
j
j
j
j
j
j
j
j
j
j

Prciace
On ""half of the University of Alberta Earttl Ol>scrv�tion System' u.b (D ... G. Arturo s",'d>el.-Nofeifa and Benoit Rivard), the D<>parunent ofEMlh and
Atmo.phenc Sciences, the N�work of Cent ..... 01 Excellence-Sustainable Fore.t Management, Canadian Forest Service, and oyr spen..,.,. we would like 10 welcome )'<>Ill0 the Geographic Inklfmalion System' (GIS) and RerroQU! Sen,In.g for SuSl"'Mble Forest Management: ChloUenge aM' Innovation In \he 21" Ceotury workshop. Over rile """I century. OUr challenge Is 10 idenlify nnovative approaches to the inlegralion of GIS and .... mote som";ng fe>r .ustai ..... ble loreSI m3nage�nt. There i. a need to identify how these technologle. may be best uriUzed In managing out forest reSOUrces, and how to c� the 9"P between syo/em de""lopcrs, re""archers, lind u""l$.
Thl. workshop wll! promote \he e><<:hange oIldeas "bour, and p<esent Inform .. tion on, "pplication. 01 GIS and .... mote sensing as tOOl. for .upportlng .ustalMble forest management dec;'ions. The worluhop wlll be concIucred over 2.5 days with the firsl lwo day. dedicated to u""r <lppiication. followed hy a haU day on vendor workshop •. A keynote p.--ntatlon will t>e gIve<> In ellch moming followed by concurrent ""Mien. for "II l'l'P'!r pre""ntation • . Concur""'I """H>ns will t>e held in the lire"" of IIMld use and land Cover change. biodiversity, ."",Iia\ dal" integration and m�nage""'nt, technical tool. 10 .upport forest m"nagement decisions, and bppllcations of GIS Bnd remote sensing to f"""""y. An exciting program hu been assembled from over � p"per. and �\ers that have!>foen <...;elved from aurhors In Canada, United States 01 America. India, Cost" Ric", Belgium. and Japan.
Thl. workshop wos inkiBted thrOUgh funding from the Su�toinable Forest M<>nagemenl Nelwork (SFMN) al rile Unive<sity of Alb(:rta along with corporate sponsorship frorn those Itsred In the wor1<�hop "f'Oflsor page. The contribution. from these organlzation< we.e key in bringing the work.!hop Ide" to r"'itlon. "nd thei' support is gralefulty lICkoow!cdged.
ThIs wor1<shop would nee be possible without thoe ""<ist"""" of many individ""ls. Staff and graduate suxlcnl$ frQffi the Sustal""b\e Forest Managemenl Network 9nd the University 01 Alberta are lICknowledged for their contributions prior to and during the �hop. M •. Elaine 5dliewt and Debo<ah Klito of \he CIMladlan Forest Service are also gr/llefuHy a�knowledged foJ Ihelr .»i.tan<:e In production 01 this booklet.
We thank you for )'<>Il' "",.tlcip,"1on and w�h you the vcry be.t foJ a succMSfuI workshop.
R,J. Hall
•
Workshop Sponsors
The following sponsors are gratefully acknowledged for their contrirution$ and support to thl� workshop.
"'bert. .... ..;'onm""t hnp:llwww'!JO" . • b.<aI K"" [)utcmt.JBob ��p 12th flOOt. 98<0 - 106 Street Edmon."". AlbeN 151( 216 18(1.422.(1218
Sl)'dun (;c<>motK. J«' �nl)' 80x 1920 wt>ke<oun. AlbeN T7S IP6 78(1.718--3730
Canadi.n f<I,..,., So,vi«> httpilwww.nok'o .... 'ry.<aI Ron Han _,n For .. try ""'". 5320_ 122 SU_ fd"""'tor'I . .... _ T6H J\5 18O-"15·72O'l
Duck> Unlim� '.n.odo httpjlwww .du<"�ca/ .... Ri<h.ord 2� 10720 _ 178 s"._ Edmor>ton. ,,1_ T5S III 78(1.48�2OW
E.rth Ob< .",�i<>n �j">tem< Wi><>< �'Ory (E�1.j http:.llwww.uall>orta.uf_gi •• 1 G. "rturo \.;o_,·Arof.�, Dopa",...,nl of Eorth �'1d Atmo<pho<k I<:i.,r.<e< U";v."ity 01 Albert. Edmon."". Al� 1\% 2E3 180-"92-8051
Earth Re<o<J,,,, (ER) M.ppo, http://www .... map.-.coml SI..,....nl., Prior S,,� Uoo.o42' -1 Aven ... SW "'gM)'. Alberta 1<P 4K9 401-';08·1711
,., - --
---
- - ---- --
ER Mapper ''''''-'J''''''''�''' .. .. ·L_
Envi'Ofl.-ntal s-,.. •• "" lIe<oarch 'n<tl."", (Hili) Conad. l.im�od ht ... oJIwww.O>rk.n.od..coml o ... id P.,fJ' Sui .. m, 9940 - .Q6Slrefl Edmonlon, AI"..". T5K 2N2 7�24-1774
.,

Intergraph Canada ltd. http://www.intergraph.com/ Terry Grant #700, 10123 - 99 Street Edmonton, Alberta T5J 3H 1 780-424-7431
Integrated Mapping Technologies Ian Grady #1800, 1 188 West Georgia Street Vancouver, British Columbia V6E 4A2 604-682-7376
International Geosphere·Siosphere Programme -Land Use and Cover Change (lGBp·LUCC)
http://www.icc.esllucd G. Arturo Sanchez·Azofeifa Department of Earth and Atmospheric Sciences University of Alberta Edmonton, Alberta T6G 2E3 780-492-8051
Network of Centres of Excellence -Sustainable Forest Management Network
http://www.biology.ualberta.ca/sfm Christine Brodie University of Alberta Edmonton, Alberta T6G 2E9 780-492-9834
PCI Geomatics http://www.pcigeomatics.com/ Allison Malis 480 B. Tennyson Place Victoria, British Columbia V8Z 6S8 250-382-5800
Silicon Graphics Inc. (SGJ) http://www.sgi.com/global/canada/ Marc Nolte Suite 1430, 335 -� 8 Avenue SW Calgary, Alberta T2P 1 C9 403-269-5844
Space Imaging http:ltwww.spaceimaging.com/ David Ward 3 1 7 Cave Avenue Bainbridge Island, Washington 981 10 206-780-4281
Spatial Geo·Link Limited [ERDAS products1 http://www.spatialgeolink.com Toni Sani Suite 224. 3075 - 14 Avenue Markham, Ontario l3R OG9 905-470-5990
INTE��H'
IMT Integrated Mapping
Technologies Inc.
PCI Geomatics
CommJtlf!d 10 CEO·lntelllgence-SoI",Honi
vii
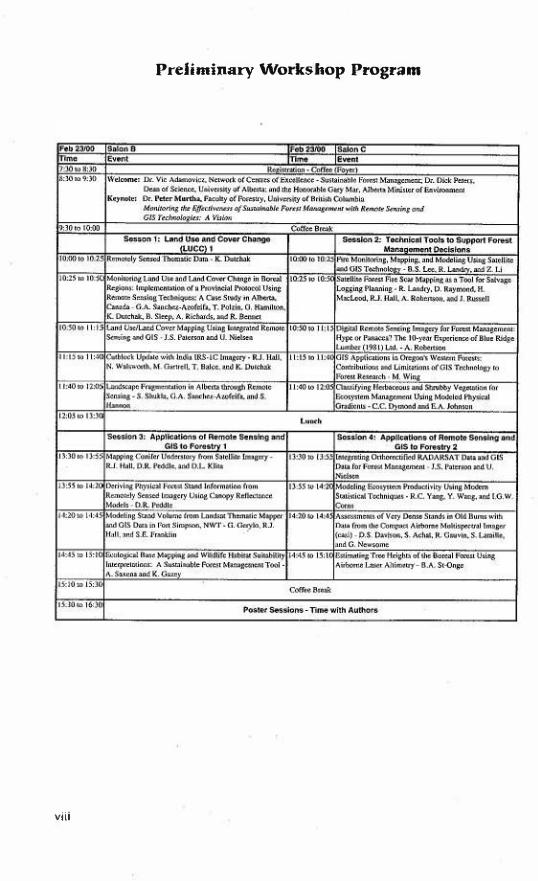
Preliminary Workshop Program
v;;;


x

Contents
ABSTRACTS OF PRESENTATIONS
Session 1: Land ase and Cover Change (LaCC) 1 Remotely sensed thematic data-Alberta Environment
K. Dutchak . . . . . . . . . . . . . . . . . Monitoring land use and land cover change in boreal regions:
implementation of a provincial protocol using remote sensing techniques: a case study in Alberta, Canada G.A. Sanchez-Azofeifa, T. Polzin, G. Hamilton, K. Dutchak, B. Sleep,
1
3
4
A. Richards, and R Bennet . . . . . . . . . . . . . . . . . _ . . 5
Land use/land cover mapping using integrated remote sensing and geographic information systems J.S. Paterson and U. Nielsen . . . . . . . . . _ . . . . . . 6
Cutblock update with India IRS-l C imagery RJ. Hall, N. Walsworth, M. Gartrell, T. Balee, and K. Dutchak . . . . . 7
Landscape fragmentation in Alberta through remote sensing S. Sh ukla, G.A. Sanchez-Azofeifa, and S. Hannon . . . . . . 8
Session 2: Technical Tools to Support Forest Management Decisions 9 Fire monitoring, mapping, and modeling using satellite and
geographic information system technology B.S. Lee, R Landry, and Z. Li . . . . . . . . . . . . . . .
Satellite forest fire scar mapping as a tool for salvage logging planning R Landry, D. Raymond, H. MacLeod, RJ. Hall, A. Robertson,
10
and J. Russell . _ . . . . . . . . . . . . . . . . . . . . . . _ . . 11 Digital remote sensing imagery for forest management: hype or
panacea? The l O-year experience of Blue Ridge Lumber (1981) Ltd. A. Robertson. . . . . . . . . . . . . . . . . . . . . . . . . . . . 12
Geographic information system (GIS) applications in Oregon's western forests: contributions and limitations of GIS technology to forest research M. Wing . . . . . . . . . . . . . . . . . . . . . . . . . . . 13
Classifying herbaceous and shrubby vegetation for ecosystem management using modeled physical gradients c.c. Dymond and E.A. Johnson . . . . . . . . . . . . . . . 14
Session 3: Applications of Remote Sensing and GIS to Forestry 1 15 Mapping conifer understory from satellite imagery
RJ. Hall, DR. Peddle, and D.L. Klita . . . . . . . . . . . . . . 16 Deriving physical forest stand information from remotely sensed
imagery using canopy reflectance models DR. Peddle . . . . . . . . . . . . . . . . . . . . . . . . . . 17
xi

Modeling stand volume from Landsat Thematic Mapper and geographic information system data in Fort Simpson, NWT G. Gery 10, RJ. Hall, and S.E. Franklin . . . . . . . . . . . .
Ecological base mapping and wildlife habitat suitability interpretations: a sustainable forest management tool
18
A Saxena and K. Gazey. . . . . . . . . . . . . . . . . . . . . 19
Session 4: Applications of Remote Sensing and GIS to Forestry 2 21
Integrating orthorectified RADARSAT data and geographic information system data for forest management J.s. Paterson and U. Nielsen . . . . . . . . . . . . . . . . . . . . . 22
Modeling ecosystem productivity using modem statistical techniques R.C. Yang, Y. Wang, and I.G. W. Corns . . . . . . . . . . . . . . 23
Assessments of very dense stands in old burns with data from the Compact Airborne Multispectral Imager (casi) D.S. Davison, S. Achal, R Gauvin, S. Latail/e, .and G. Newsome . 24
Estimating tree heights of the boreal forest using airborne laser altimetry B.A St-Onge . _ _ 25
Session 5: Biodiversity 27
Spatial dimensions of conservation: concepts supporting conservation nets R W. Wein, AK. Franke, and N.L. Salamon . . . . . . . . . . . . . . 28
Remote sensing and forest biodiversity monitoring in Alberta E.E. Dickson, L.M. Moskal, S.E. Franklin, R.J. Hall, and D. Farr 29
Land cover mapping and landscape fragmentation analysis in support of grizzly bear habitat management J. Dechka. S. Franklin, D. Peddle, and G. Stenhouse . . . . . . . . . . 30
Anthropogenic factors shaping the structure of a tropical forest: a study at Biligiri Rangaswamy Temple sanctuary, Western Ghats, India M.e. Kiran, N. Barve, J. Poulsen, RU. Shaanker, and K.N. Ganeshalah 31
Session 6: Spatial Data Integration and Management . . . . . . 33
xii
Information models: a tool for optimizing spatial data for forest management AG. Levinsohn . . . . . . . . . . _ . . . . . . . . . . . . . 34
Geographic information system-based heritage potential modeling and heritage management in the forest industry T.H. Gibson and J. Finnigan . . . . . . . . . . . . . . . . . . . . 35
Geodatabase Data Model-its impact on data management in forest information systems, an ESRI Canada perspective D. Parry and L. Dmitruk . . . . . . . . . _ . . . . . . . . . 36
The transition from timber supply to resource supply analysis DR. Webb . . . . . . . . . . . . . . . . . . . . . . . . . 37
.... sslon 7: Land ase end Co>oer Ch�ng� (UJee) 2
Pellcrns of fofeot cover d'1I.nge �t regionel �r.d ecosys.tcm Ie",,'s In tke Western Ghats, Indio: enessing the role of development and socloewnomic fectOfs \Ising geogrllPhk InfOlmation �Y"em tools f{ B.otve; M.e Kllan, R.U. ShMnker. K.s, Ilo..,.., IJIId K.N. G.mesMIIr/t 4(l
Propc!rty·b�sed en�lys.ls or wood supply and biodiversity on private woodlots in New BNnswlck II. ;\m<>ld . . . . . . . . . . . 41
Survey of for.,.t co""r In C<»ta Rica u.'ng Land,...t Ima�. 1966/87-1996/97 J.e. OIluo. G.A 5tJnd>.u-Azo(d{a, Y. W .. I$OtI. R. 8oLttIos. p. ao.u.;/ez, J. &bono. C � .."d /of. ffitml"" . . 42
Session 8: Applications of Remote Sensing and <lIS to Fousll)' J . �3
[),enning" monilOJ'lng syw:m for tropical dry forest In Costa Rica; implementation or algorfthms using remOle sen.lng and g�raphkallnformatlon sys""". P.;\m>yo. GA 5anch�l{a . .. ndJ. u.luo . . . . . . oU
Counting individual .... m. In /orest plantations and thinned regions using images from tho Compa'" Airbornf.: Spoo.rogri>phic tma!l"l (C.,$I) D.s' o..'>/son. oS. IAWlle. and S. Aels.. • . . • • . • 45
Improved forestry information In mountainous lerraln using a modified canopy "'"""'tance model and alrbQme COIl imagery R.L. ,.\:IIIn""" DR. Ptddu: . .. nd RJ Nail . . . . . . . . . "'"
The elf"",u or oIope on optical methods and allometric equation. for estimating <:O<Ilfer leef area Index D.P. o.ou;d$on, R.J. fMlI. D.R. PMdle.lJJld RL.JoII"1lOII . 47
BSTRACTS OF POSTERS .
Note
'�lelL>l'. condusklns. and rec:omm<.'ndalklns publWled In Ihl. book "I"( those o(lhe lion< and do Ml rte<:essarlly imply endorsem""t by the OIMdian fOrest Strulce.
. e..:luskIo1 0{ cerrain m/Jnuf�Clu"'" produc/$ does 1101 n�d!l imply dlsap
",I....,.. doe>; fhe mmtlOtl 0/ 0lil..,. products n<"«S&1flly imply ctr</otSmtO'l/ by the adian Foresl Some<!.

xiv

ABSTRACTS
OF PRESENTATIONS

1
1
1
1
1
1
1
1
2
1
1
1
1
1
1
1
1
1

Session I
Lnnd Usc and Cover Change (LUCC) I
,

Remotely sensed thematic data-Alberta Environment
K. Dutchak
The Resource Data Division of Alberta Environment has maintained a long history in the development, procurement, and maintenance of thematic
resource data. Four of these data sets have particular relevance to achieving sustainable forest management using a geographic information system (GIS). The Alberta Vegetation Inventory (AVI) is the most detailed of the thematic coverages and is based on interpretation of aerial photography. The other three include the Alberta Woodlot Inventory (AWl), the Alberta Ground Cover Classification (AGCe) inventory and Access Update for Base-features. These three are built upon remotely sensed satellite imagery. The AWl and the Alberta Ground Cover Classification use 30 m Landsat 5 Thematic Mapper data. The Access Update data is built upon 5 m Indian Remote Sensing Satellite data. Each data set was built to suit a specific client need. The scale of the product, resolution of information, the quality and means of presentation were all defined to meet those specific needs. Each data set stands on its own. Together they work to build a data framework upon which the Department works to manage the provincial forest resources. Increased computer processing speeds and the development of integrated software applications have provided us the opportunity to meld these individual data into a formidable suite of information products. The presentation will provide a brief overview of each of the thematic coverages. It will also discuss how they can be integrated through the use of GIS applications into furthering resource management within the province of Alberta.
Contact:
Ken Dutchak Alberta Environment 12th Floor, 9820 -106 Street Edmonton, Alberta, Canada T5K 2J6 780-422·0669 780-427·1215 [email protected]
4

Monitoring land use and land cover change in boreal regions: implementation of a provincial protocol using remote sensing
techniques: a case study in Alberta, Canada
G.A. Sanchez-Azofeifa. T. Polzin. G. Hamilton. K. Dutchak. B. Sleep. A. Richards. and R. Bennet
-- la---
There is increasing pressure to evaluate and approve industrial development projects primarily dealing with oil sand and heavy oil extraction in the
northeastern boreal region of Alberta. The cumulative impacts of multiple and massive industrial development within the region is still not well understood. Baseline inventories of current resource information are a key component in supporting a regional model designed to better understand the impact of cumulative effects on landscape structure. This paper describes the main achievements related to the development of a remote sensing and geographic information systems protocol aimed at monitoring land use and land cover change (LUCC) in boreal regions. The proposed protocol uses medium-resolution satellite images (Landsat Thematic Mapper) as a standard to map land cover under the Alberta Ground Cover Classification. The main goal of this research is to seek the most appropriate, and the most current, methodologies for multi-temporal and multiyear analysis of landscape structure and LUCC trends. It is expected that this joint initiative between academia, provincial and federal agencies, and non-governmental organizations will promote the development of standards for image interpretation at the provincial level using emerging satellite platforms and information already created by the province of Alberta. This paper presents a case study for the Fort McMurray region.
Contact:
G. Arturo Sanchez-Azofeifa Earth and Atmospheric Sciences Department University of Alberta Edmonton, Alberta, Canada T6G 2E3 780·492·1822 780·492·2030 [email protected]
5

Land useJIand cover mapping using integrated remote sensing and geographic information systems
/.S. Paterson and U. Nielsen
--- � --
ThiS paper reviews the methodology and results of two operational remote sensing geographic information system (GIS) land use and land cover map
ping projects. The first is the Alberta Ground Cover Classification (AGCC) project, developed and funded by Alberta Environmental Protection. The AGCC project uses classified Landsat Thematic Mapper data, inventory data (Alberta Vegetation Inventory and Woodlot Inventory, where available) and field data to produce 1:50 000 scale ground cover maps of northeastern and west-central Alberta. The area mapped to date is significant, covering more than 200 1 :50 000 National Topographic System (NTS) map sheets. The remote sensing and GIS techniques used to generate the GIS thematic map products are described. The second project is British Columbia's Large Scale Baseline Thematic Mapping (LSBTM) program. It is a project initiated by B.C.'s Ministry of Environment, Lands and Parks and builds upon the success of the 1 :250 000 scale BTM project. The LSBTM is mapped at 1:20 000 scale and is compatible with B.C.'s Terrain Resource Information Management (TRIM) topographic base. The LSBTM uses an integrated mapping approach, with both digital and manual classification of fused Landsat and India Remote Sensing (IRS) Panchromatic data, air photo interpretation, field survey and ancillary data (e.g., TRIM, municipal zoning) . This paper presents a review of the methodology and a comparison of information content between fused Landsat TM with IRS Panchromatic and fused Landsat 7 with the 15-m Panchromatic band.
Contact:
Scott Paterson Dendron Resource Surveys Inc. 880 Lady Ellen Place Ottawa, Ontario, Canada K1Z 5L9 613-725-2971 613-725-1716 [email protected]
6

Cutblock update with India IRS-IC imagery
R.I. Hall, N. Walsworth, M. Gartrell, T. Balce, and K. Dutchak
--- la. ---
Increasing demands on the forest resource and the high costs of the inventory process is driving the need for methods by which cost-effective update can be
accomplished. Cutblock information is currently derived from aerial photographs, but an be expensive when large areas need to be updated. The India IRS-l C panchromatic sensor with 5.8-m spatial resolution has been the satellite with the highest spatial resolution prior to the recent launch ofthe IKON OS remote sensing satellite, The objective of this study is to compare photogrammetrically derived cutblock boundaries and areas with those interpreted from orthorectified and geometrically corrected IRS-l C panchromatic images. Aerial photographs at a scale of 1 :20 000 were aero-triangulated digitally and displayed on a stereo photogrammetric workstation (DiAP viewer) from which cutblock information was derived, These cutblocks were spatially overlaid and statistically compared to those mapped from on-screen digitization of orthorectified and geometrically corrected India IRS-1 C panchromatic images. Regardless of rectification methods, mapping accuracies will vary with factors such as cutblock size, shape, and topography.
Contact:
Ron Hall Natural Resources Canada Canadian Forest Service 5320 - 122 Street Edmonton, Alberta, Canada T6H 355 780-435-7209 780-435-7359 [email protected]
7

Landscape fragmentation in Alberta through remote sensing
S. Shukla, G.A. SancheZ-Azoreira, and S. Hannon
-- � --
The boreal forest, or taiga, is one of the largest terrestrial ecosystems on earth and covers a large area in Canada, Russia, and the Nordic countries. Growing
concerns over the loss of boreal forest has promoted the development of methods, using remote sensing and geographic information systems (GIS). to provide estimates of forest loss and the level of forest fragmentation of this fragile ecosystem. This paper is an attempt to study fragmentation of the boreal mixed-wood forest and intensity of land use in the agricultural area surrounding the Meanook Biological Station in central Alberta, Canada. This paper presents our efforts to measure major indicators of forest fragmentation using satellite images (Landsat Multispectral Scanner MSS, Landsat TM 5 and 7, and IRS IC and 1 D) in conjunction with existing 1 :20 000 vector coverages of access features in the landscape. Additionally, this paper explores the method of fusion between medium- to high-resolution remote sensing platforms such as Landsat 7 and IRS 1 C and 1 D to increase the spatial resolution of extracted landscape features. Final results are integrated into landscape metrics developed to quantify the pattern, structure, and fragmentation in the study area. These metrics will be used to explain variation in bird community structure across the landscape. The results of this study can also be applied to other studies involving habitat fragmentation, land use and land cover changes, wildlife movement, forest fire suppression, and forest management programs. Additionally, we expect that methods developed by this research project will contribute to current international efforts aimed to understand land use/cover change processes worldwide.
Contact:
G. Arturo Sanchez-Azofeifa Earth and Atmospheric Sciences Department University of Alberta Edmonton, Alberta, Canada T6G 2E3 780-492-1822 780·492-2030 [email protected]
8

Session 2
Technical Tools to Support Forest Management Decisions
9

Fire monlt .... lng, m"pplng, lind modcllng using ptcllilc .. nd I.'COV.phlc l"formlltiOfl syslem I�chnology
8.S. t .... II. l.<lndry. and z. tl
-- � -
'"f""he FIre Monitoring ........ wing . • nd Mo<if,IIIIg Syuem (F .... Jo\3) is a joint 1 inili<o� of the C .... dII CenlfOl lot Remote Senslng..-.d the Cem>dian fOl"<:St
Servke. Fire M3 IISH ru,\Ion.a1 Oceanic: .1Id At�ric Admlnl.u.llon I\d'vlllflCed Very HigtI Resolution Radiometef satellite � 10 n>e>nilor..cti .... large firM on a dII�y bools in CItMdo during the nr.. season. I..andoat Thematic ....... pper "nd Syoteme Po<.- l'Ob$e,vation de 10 Terre (SPOT) Vcget<Otion _e!I� imagery is used lor end-of·season fire mapping 01 all large lires (greate< II--. 200 hal in Cen;od�. f;,-" behavior and ImpKI modeling .. �ed on .11 n.e. using dalll from the ClUIOdian Wildlond Fire Infcmwotlon System. These dat .. ..... used for ""Iional ... po<ting on Are activity. MethodologIe. �y W1def de�1opmenI 10 "",ilTl<lie ",.<t>cw> "UX" "nd grft<IhcoJ'IC " •• emlHions from Iorest fires in Ca""da on .n anllUliI bow "';11 ,,110 be de,..;:.!bcd.
,�
..... . � ",,, .. at IIetOutUI C_ c.no6 ... f<>t.-.._ SllO_1l1_ (_...-u. c.-:Io --, �)5·1JOl �JH _ _ a
"
S .. ldlit ... foresl flr ... un m .. pplng as aI_I for s ....... ge logging p ... nnlnt:
R. Landry, D. R<lynwnd. II. A/ucLtud, R.J. lIull, A Roocrl$On. ami I. RUS$4!11
- � -
F I'''' bu,n IOn �""' .. ge 01 736 000 h� 01 <:Ommerci�IIOf"'1 annually (74% 01 the a, .. o harvested), ,esultlng In a loss of 70 million cubi<: metre, of wood.
with a v<llve 01 �bout $1 billion. In corrune,d�1 IOfestry. on<Oe a fi,e is controlled .. nd eXlinet, the lorest prodlK:t5 Industry gets acllvely involved In plMning salvage logging op<orations. Inlorm .. U on .. nd lImelinen are the key challenge when n major r. .... event strikes, such .. s the Virginia Hills lire that burned O""r 154 000 ha of the northern region of Whitecoutt ( .... Ib<:rta) in May 1998. The presentation wHi locus on the eu,....,nt resun.. of .. joint project between the Canada Centre lOt Remote Sensing and the Canadian Forest $ervi<:e to a.sess the use of Land .... t 11Iemalic Mapp<or 10< burn scar mapping . .... review of the pilot 2 yea .. of ",ork with the Canadian forest produCl$ industry to promote �nd secure the potential of apaceborne remote sensjng a. n tool lor planning ... Ivage logging ",ill be discussed. The end·to·end processes lor fire scar mapping using satellite data will b<: presented and comp"red with convent"""l alrbom� method,. Re<:ent work to assess the mapping of partial burns will also be brtefly discussed.
�obet1 La...:!!)' <:.",."" Cent .. for �e.note �n.lng o;as Booth 5tr .. � Room 119 Ottaw.o. On .. rio. c.� K1A0Y7 61l4<7-1141 �1l·947·l.l115 �obet1.La...:!.yO«".nOUl!.g, ....

Digital remote sensing imagery for forest management: hype or panacea? The lO-year experience of Blue Ridge Lumber (1981) Ltd.
A. Robertson
-->a.--
The Woodlands Division of Blue Ridge Lumber has been working with digital remote sensing data for the past 1 0 years. The products that we have used
include Landsat MSS, Landsat TM, IRS 1 C Panchromatic, airborne GPS, digital orthophoto mosaics, and ertha-rectified individual air-photo frames. These products are stored within our Ardnfo-based Woodlands Information System and are accessed by Woodlands staff using desktop tools such as ArcView and Arc Explorer. As a result of our experience using digital remote sensing imagery, we are well aware of the promise that such data sources hold for decision support related to sustainable forest management. We are also very aware of the reality of trying to make leading edge data products, such as satellite imagery, work in a production environment. Through this paper I will share the knowledge gained through 1 0 years of experience in the use of these products to support the activities of a typical forest products company. We will explore such questions as: how have the various products been used; which applications have been successful and which haven't; are these products cost effective; are they manageable within the context of a production geographic information system (GIS); and what resources are required (both human and technical) to make effective use ofthese data products? Finally, we will take a look at some of the new remote sensing products that will be available in the very near future and discuss the potential for applying them to sustainable forest management. These products will include l-m resolution satellite imagery, airborne laser sensors, and off-the-shelf image classification tools. All of these products will be discussed within the framework of Blue Ridge Lumber's production GIS.
Contact:
Andy Robertson Blue Ridge Lumber Ltd. Box 1 079 Whitecourt. Alberta. Canada T7S lP9 780-648-6298 780-648-6396 [email protected]
12

Geographic information system (GIS) applications in Oregon's western forests: cQntributions and
limitations of GIS technology to forest research
M. Wing
--,.,--
Organizations are increasingly using geographic information systems (GIS) to help manage forest resources. This paper examines several studies of
forested ecosystems conducted by Oregon State University's Forest Engineering Department. Each study utilized spatial data and relied on GIS technology for analyzing the data. Study objectives included analyzing aquatic habitat, mapping slope stability, quantifying large woody debris distribution, and calculating visual sensitivity of a forest. Output and findings from each study are examined and critiqued in light of the role GIS played. Based on these findings, the contributions, limitations, and practicality of using a GIS to assist forest resource research are discussed. The GIS strengths included an ability to integrate data sources, reorganize and restructure data, and present visual or mapped results. Limitations to using a GIS included integrating different data structures, data availability and quality, and a lack of statistical tools within common GIS software.
Contact:
Michael Wing Forest Engineering Department Oregon State University Peavy Hall 215 Corvallis, Oregon, USA 97331 541-737-4009 541-737-4316 [email protected]
13

Classifying herbaceous and shrubby vegetation for ecosystem management using modeled physical gradients
c.c. Dymond and E.A. Johnson
--->a.---
Current remote sensing methods are generally unable to detect herbaceous or shrub vegetation types beneath forest cover. This may be one factor that has
slowed the implementation of herbs and shrubs into new forestry management plans. There has been some success at predicting vegetation distributions using correlations to physical gradients. Our objective was to develop a method to classify the spatial distribution of common herbs and shrubs using a digital elevation model of the Kananaskis watershed in southern Alberta. The first step was to input weather station data and a Digital Elevation Model to simple models of precipitation, drainage, radiation, and temperature. The next step was to classify the modeled gradients according to herb or shrub species abundance using ground truth data. The last step was to use independent ground truth data to assess the accuracy of the classification. Accuracy varied between 34 and 63%, depending on the species. The lowest accuracies were for rare species. OUf conclusion is that simple ecological models can reduce the time and money required to map herbaceous and shrubby vegetation on the ground. Further development of these methods will help make ecosystem management of these species more effective.
Contact:
Caren C. Dymond Department of Forest Ecology and Management University of Wisconsin - Madison 1630 Linden Drive, #1 1 0 Madison, Wisconsin, USA 53705 608-265-6321 608-262-9922 [email protected]
14

Session 3
Applications of Remote Sensing and GIS to Forestry 1
15

Mapping conifer understory from satellite imagery
R.I. Hall, D.R. Peddle, and D.L. K/ita
-- 1&. --
Information about the presence and spatial distribution of white spruce conifer understory within deciduous and deciduous-dominated mixed-wood. stands is
required for boreal mixed-wood management in Alberta. A method involving satellite data can provide useful information at the planning level by providing an initial stratification of the forest landscape for understory location, distribution, and amount. This study compared understory maps produced with an iterative supervised classification algorithm and a knowledge-based evidential reasoning classifier. Understory information from interpretation of leaf-off aerial photographs was overlaid onto two-date, leaf-off and leaf-on, Landsat Thematic Mapper images from which random pixel samples were extracted for classification. Variables used in classification included digital Landsat Thematic Mapper image data and stand structure information available from the Alberta Vegetation Inventory. Similar classification accuracy results were obtained from the two classifiers with spectral data alone, but accuracy increased significantly using the evidential reasoning classifier when information about stand structure was added to the classification exercise. Image maps were produced at a scale of I :20 000 and are being evaluated for their informational value.
Contact:
Ron Hall Natural Resources Canada Canadian Forest Service 5320 - 122 Street Edmonton, Alberta, Canada T6H 355 780-435-7209 780-435-7359 [email protected]
16

Deriving physical forest stand information from remotely sensed imagery using canopy reflectance models
D.R. Peddle
--- �---
Forest canopy reflectance models provide a powerful link between physical attributes of a forest stand and the reflected energy from these stands recorded
as spectral response patterns by airborne and satellite remote sensors. This is of importance to forestry studies because these remote sensing methods provide information such as stand density. tree height and canopy dimension, and volume based on a physical understanding of the interaction of solar radiation with forest canopies and stand geometry. This provision of physical and structural information is of greater relevance to foresters compared to the generally statistical outputs of conventional remote sensing image analysis. The principles of canopy reflectance models are first outlined, together with the concept of sub-pixel scale information extraction and the theoretical advantages of these approaches compared to previous methods. Results from a variety of global change and forestry remote sensing studies such as the NASA COVER Project, BOREAS, and the International Satellite Land Surface Climatology Project will be highlighted. These studies encompassed boreal and mountainous terrain at local to regional scales, and involved different forest attributes, species, image spatial and spectral resolutions, sensor types, and forestry information applications.
Contact:
Derek Peddle University of Lethbridge 4401 University Drive West Lethbridge, Alberta, Canada T 1 K 3M4 403-329-2524 403-329-2016 [email protected]
17

Modeling stand volume from Landsat Thematic Mapper and geographic information system data in Fort Simpson, NWT
G. Geryla, R.I. Hall, and S.E. Franklin
--- � --
The potential integration of satellite data into Northwest Territory (NWT) inventory surveys may help to meet increasing �emands for information
about timber supply and its sustainability for forest development. The objective of this study is to determine the extent that stand volume could be estimated from Landsat Thematic Mapper (TM) and geographic information system (GIS) data. The study area was located in the Fort Simpson Region, NWT, where field plots were' established in aspen, white spruce, jack pine, and mixed-species forested stands. In each plot, tree height, diameter at breast height, and species composition information were collected. These measurements we�e used to calculate the total volume of each plot within the study area (cubic metres per hectare). The extent to which stand volume may be derived from Landsat TM data was determined by using statistical models that estimated volume as a function of a) Landsat TM spectral and transformed data, b) GIS inventory, and c) combined remote sensing/GIS data. Preliminary results suggest that remote sensing data alone cannot provide detailed volume information; however, it can be used to model volume within a broad-level stratification, which may be valuable for forest management in remote regions where no pre-existing forestry information exists. Integration of remote sensing data and GIS data should improve the strength of these volume predictions.
Contact:
Graham Gerylo Department of Geography University of Calgary Earth Science 356 2500 University Drive NW Calgary, Alberta. Canada T2N 1N4 403-701-3278 403-282-6561 [email protected]
18
E<;ologlCllI b .... " mapping and wildlife habitat sui'ablllly interpRlalions: a sustainable forest management tool
A. Sax�nu uoo K. C"-,,,,},
- � -
Ter�SU"lal Ec�ystem M;.pping (TEl'll hu been developed joimly by the British Columbi� Ministries of F"",s," �nd Envlronm""t, Land. �nd Parks �s a
standardized ba�ine e<:<>logkal mapping process. It .. nows the compil�tion of ba.k inf<XTTlalion on the distribution of ecosyste ..... from which management interpretations can be developed, induding broad-scale landscape plans and .ite·.pedro<: pres<oriptions. In British Columbia, gove,nmentll9endes and forestry c""'l'anles have been mandated to use this product as a base f<>I wildlife ""bitat .uitability evalu�tions, particularly fo< sen.ltive species. Through the implementation of thl. habitat ra�ng tool for sensitive or significant specie •. the habitat need. for each of these spedes can be met "'lthln the context of a .ustainable, "",nll9ed fo",". Through use of a case study. thi� p",.entation will describe: I ) the method u� In completing e<:oIogical ba"" m .. p products: 2) Ih� methods � in determining habitat values for individual <:cosy.tem units �nd In overlioy· ing hablt"t ratings for sensitive .peci"�; and 3) the real·world application of this information in a forest development plM.
Go.".." Errviron�.t CoonIultonu Ud. 5<rite 103. 420'1 _ '1'1 Street Edmon.on. AII>r"., Canorl.o T6E SVI 7B(}-4/il·5000 7M-4/il·�l6 ..... ....oge<>wfll.<orn
"

20
, ..

Session 4
Applications of Remote Sensing and GIS to Forestry 2
2 1
Integrating orthorectified RADARSAT data and geographic information system data for forest management
I.S. Paterson and U. Nielsen
-- ,., --
Forest updating is the detection and recording of recent manmade or natural changes. The most common, currently accepted approach for forest updating
is airphoto interpretation and subsequent updates using a geographic information system (GIS). This approach is well understood and accepted by the forestry community. Benefits include wide spread operational use of photography for additional forestry tasks, while limitations include cost, update ability, and weather dependence. This paper reviews how RADARSAT data can monitor forestry activity in several operational test sites in Canada and Ecuador. The methodology of processing, integrating, and analyzing multi-data sources, such as satellite data, GIS data, global positioning system (GPS) data, and aerial photography, can produce acceptable results for forestry management. Results show that the boundaries of high contrast forest c1earcuts in RADARSAT fine mode data had a total root-mean-squared (RMS) error of 12.5 m compared to differentially corrected GPS data.
Contact:
Scott Paterson Dendron Resource Surveys Inc. 808 Lady Ellen Place, Suite 206 Ottawa, Ontario, Canada K1Z 5L9 61 3-725-2971 61 3-725-1716 [email protected]
22
Modeling ecosystem productivity using modern statistical techniques
R.C. Yang, Y. Wang, and I.G.W. Corns
--- >a. ---
The ability to identify sites and manipulate productivity variables for conservation and improvement of productivity is the basis of sustainable forest
management. Productivity is influenced by climatic, topographical, geological, and soil factors. These factors are constituents of the ecosystem that can be assessed by numerical (quantitative and continuous) and categorical (qualitative. ordinal, or nominal) measures. Modeling ecosystem productivity, consequently, requires methods capable of handling both numerical and categorical variables. Neural network, generalized additive regression, and tree-based regression were used to model productivity of a forest management area in the central Alberta using site index as a productivity indicator. Results indicated that neural network and tree-based models were more realistic than others. With a mean squared error of 0.74 m, neural network method outperformed other techniques and was potent in modeling ecosystem productivity.
Contact:
Richard Yang Natural Resources Canada Canadian Forest Service 5320 - 122 Street Edmonton, Alberta, Canada T6H 355 780-435-7247 780-435-7359 [email protected]
23

Assessments of very dense stands in old burns with data from the Compact Airborne Multispectral Imager (casi)
D.S. Davison, S. Achal, R. Gauvin, S. Lalaille, and G. Newsome
--- 1&0 ---
This paper will provide an overview of analysis results using Compact Airborne Spectrographic Imager (casi) imagery in areas with high stem counts with
the objective of identifying candidate areas for remedial thinning. The casi imagery was collected at the beginning of October 1999 over an old burn site near Bidwell Creek in the Chilcotin area of central B.C., using 1 0 spectral bands and GO-cm pixels. During a field inspection of the site, the key parameters identified for making a thinning decision were the stem densities and the presence of healthy dominant stems of sufficient size. For most ITRES forestry programs, individual stems can be detected with 60-em pixel imagery; however, for areas with high stem densities, individual trees often cannot be resolved reliably. Hence, a combination of spectral and textural methods was used. The analysis algorithms needed to be trained on ground-based observations and were then applied to map out the variabilities in stand structure over large areas. This general approach of an algorithm that needs to be trained was used previously for stem counting for dense stands in the Chetwynd area in northeastern B.C. The new elements in the present method are the integration of the variations in stand stress to generate an information product more tightly linked to the thinning decision.
Contact:
Douglas Davison ITRES Research ltd. #1 55, 2635 - 37 Avenue NE Calgary, Alberta, Canada T1Y 5Z6 403-250-9944 403-250-991 6 [email protected]
24
Estimating tree heights of the boreal forest using airborne laser altimetry
B.A. St-Onge
--- la- ---
Estimation of tree heights is either expensive if done in the field or imprecise when accomplished through photogrammetry. Scanning laser altimetry offers
the possibility of separating the altitude of the forest canopy surface from the altitude of the underlying terrain, thus allowing for the quick estimation of canopy heights. However, estimating the height on an individual tree requires that the laser spot fall on the point of maximum height, an event that cannot normally be verified unless ancillary data is available. Two distinct aerial surveys yielded respectively 50-cm resolution multispectral imagery and a laser altimetry digital terrain model (about 1 point per 1 .5 m'). Pre-processing consisted in subtracting the interpolated terrain altitudes from the interpolated canopy altitudes to create a 50-cm resolution image of canopy heights. It was followed by the rectification of the corresponding multispectral imagery. The height of trees could then be extracted by obtaining the heights of X, Y, and Z laser points, overlaid on the rectified imagery, that appear to fall on the center part of the crown. A field survey was carried Qut to determine the heights of trees in order to validate laser heights. Actual tree heights measured in the field and laser estimated heights were regressed, yielding a high R'.
Contact:
Benoit St-Onge Department of Geography Universite Quebec a Montreal CP 8888, suce. Centre-Ville Montreal. Quebec, Canada H3C 3P8 514-987-3000 Ext. 0280 514-987-6784 [email protected]
25

26

Session 5
Biodiversity
27
Spatial dimensions of conservation: concepts supporting conservation nets
R. W. Wein, A.K. Franke, and N.L. Salamon
--- 1&- ---
OUf federal government, in response to the environmental pressures, has committed to rare and endangered species legislation, conserving more
conservation areas, and promoting a better balance of greenhouse gases input and output. At the provincial level there are additional pressures, with the government committing to protecting more representative landscapes and a new Natural Heritage Act. We suggest that conservation within land controlled by resource industries should consider the concept of Conservation Nets (CN), which consist of recognized conservation areas connected by multiple corridors. These will ensure greater potential for species daily movements, seasonal migration, and longer-term movements caused by environmental stress. We present some of the principles of conservation that are necessary to consider in building and maintaining eNs in landscapes that are already heavily fragmented. Our working hypothesis is that most rare and endangered species are located in the waterways and other less intensively managed parts of the landscapes thus CNs are still a viable option. We will also address the issue of land ownership and economiC incentives that could foster the development of CNs.
Contact:
Ross W. Wein University of Alberta 442 Earth Science Building Edmonton, Alberta, Canada T6G 2E3 780-492·2038 780-492-1767 [email protected]
28
Remote sensing and forest biodiversity monitoring in Alberta
E.E. Dickson, L.M. Moskal, S.E. Franklin, R.I. Hall, and D. Farr
Protocols for the long-term monitoring of forest biodiversity are being developed and tested by the Alberta Forest Biodiversity Monitoring Program in sites
within the foothills near Hinton and the boreal forest near Lac La Biche. As part of this effort. satellite and airborne remotely sensed data are being used to extract and analyze biodiversity elements at the levels of the landscape and forest stand. For both pilot sites, data from Landsat Thematic Mapper (30 m spatial resolution) and Compact Airborne Spectrographic Imager (casi) (60 cm and 2 m) have been classified based on spectral information and/or the relationships between ground and remotely sensed measures derived from multivariate analyses and spatial statistics (Le., crown closure, stem count density) . The pattern and complexity of image based classes (patches) at various spatial scales have been quantified using measures of size, shape, connectivity, mean nearest neighbor, and so 00.
Examples and measures of forest biodiversity elements derived from imagery at multiple spatial scales will be presented. The use of remote sensing for monitoring, detecting change, and predicting change affecting landscape and forest stand levels of biodiversity will be discussed. Examples of landscape fragmentation resulting from forest practices will be illustrated. Focus will be given to cases with potential to alter the habitat availability for certain plant and animal species, to decrease patch size, to increase distance between patches, and to decrease the connectivity between patches.
Contact:
Elizabeth E. Dickson Department of Geography University of Calgary 2500 University Drive NW Calgary, Alberta, Canada T2N 1 N4 403-220-7718 403-282-6561 [email protected]
29

Land cover mapping and landscape fragmentation analysis in support of grizzly bear habitat management
1- Dechka, S, Franklin, D. Peddle, and G. Stenhouse
-- /a. --
A comprehensive grizzly bear research program is underway to develop an integrated and regional approach to address concerns over grizzly bear
conservation in Alberta. This practical demonstration project is being conducted in a large area (5350 km2) south of Hinton, Alberta, and includes a portion of Jasper National Park. This practical demonstration program is to use satellite imagery and ancillary data for land cover classification of a complex ecosystem comprising foothills and montane environments. Two approaches to image classification are evaluated in this project-namely, a maximum likelihood and evidential reasoning classifier. Maximum likelihood classifiers are limited to a smaller number of normally distributed, ratio-level data while evidential reasoning can process data at any level (e.g., image data, thematic geographic information system (GIS) data, rank-order information), and it is not restricted by data distribution or data volume. It can also incorporate other data types sucl:t as attribute tables, topographical descriptors, field observations and inventory information (e.g., Alberta Vegetation Inventory). By integrating image and GIS data, it is possible to obtain land cover classification products at higher accuracies using evidential reasoning compared to maximum likelihood. These products will provide suitable information to assist in assessing grizzly bear management issues related to landscape fragmentation.
Contact:
Jeff Dechka GeoAnalytic Inc. 1 1 50, 633 - 6th Avenue SW Calgary, Alberta, Canada T2P 2YS 403-213-2700 403-213-2707 [email protected]
30

Anthropogenk factors shaping the structure of a tropical forest: a study at Biligiri Rangaswamy
Temple sanctuary, Western Ghats, India
M.e. Kiran, N. Barve, J. Poulsen, R.U. Shaanker, and K.N. Ganeshaiah
--- la. ---
B iligiri Rangaswamy Temple wild life sanctuary is subjected to four different kinds of human pressures: a) the indigenous people living in and off the
forest, b) the developmental activities from the state and public sectors, c) the plantations inside the sanctuary, and d) the extraction pressures from private and public groups, at the peripheries of the sanctuary. Based on these information layers, and using geographic information system tools, we have developed a map depicting the disturbance regimes that represent gradients of the anthropogenic pressures in the forest ecosystem of the sanctuary at a scale of 30-ha grids. Using the imageries of the sanctuary, we have computed the Normalized Difference Vegetation Index (NDVI) values for the corresponding 30-ha grids and have assessed the macro-level influence of the anthropogenic pressures on the forest vegetation. At a micro-level, we have assessed the spatial heterogeneity patterns created in the forest productivity and structure when human activities are grained into an otherwise homogenous forest ecosystem. We discuss the possible methods of linking the micro-level processes to understand the macro-level landscape patterns created due to human activities.
Contact:
M.e. Kiran Ashoka Trust for Research in Ecology and the Environment No. 17, 2nd Cross, Amarjyothi Layout, Cholanagar Bangalore, Karnataka, India 560 032 91-80-353-3942 91-80-353-0070 [email protected]
31

32
j
j
j
j
j
j
j
j
j
j
j
j
j
j
j
j
j
j
j
j
j
j
j
j
j
j
j
j
j
j
j
j
j
j

Session 6
Spatial Data Integration and Management
33

Information models: a tool for optimizing spatial data for forest management
A.G. Levinsohn
--- >a- --
The forest sector in Canada adopted geographic information systems (GIS) about 1 5 years ago. Efforts to date by government agencies and forest
products companies have largely focused on system implementation, data base creation, and automated cartography. The emphasis has been on producing the conventional information products faster and better. However, if GlS is to fully justify its cost and provide meaningful benefits to forest management, it must be more tightly integrated with forest management decision making. A comprehensive understanding of the relationships among key data is fundamental to better data integration and alignment with forest management. Information models provide a diagnostic and prescriptive tool for data planning, administration, integration, and management. This paper will review relevant information modeling principles and apply them to forestry data to demonstrate how information models can be used as tools for optimizing data usage in forest management.
Contact:
Allan Levinsohn A G Levinsohn Consulting, Inc. 3 Woodside Lane Canmore, Alberta, Canada nw 1T1 403-678-4591 403-678-4597 [email protected]
34

Geographic information system-based heritage potential modeling and heritage management in the forest industry
T.H. Gibson and f. Finnigan
--- ,., ---
One of the issues that modern forestry planning must address is cultural heritage. Heritage resources, especially archaeological sites, are particularly
difficult for large-scale land managers to deal with because their locations are rarely known and are difficult to predict without expert assistance of trained archaeologists. Even then, it is inevitable that forestry operations will affect heritage sites, and it is the legal responsibility of the forestry developer to take due diligence in minimizing potential for resource damage and also to provide contingency plans to deal with any cultural resources that are affected by forestry practices. The problem is twofold: How can forest planners know where heritage resource sites are located, and how should they manage them once locations are know? With the advent of desktop geographic information systems (GIS), archaeologists and foresters have begun to solve this problem by developing heritage potential models and GIS-based management procedures that can be integrated into modern forest management approaches. This paper wi1l review the state of heritage potential modeling and identify some of the key methodological issues that must be addressed by forest planners to ensure that the models they use provide an accurate reflection of the heritage potential in their management area. It will also provide examples of how to use models to avoid affects on heritage caused by forestry practices. It will conclude by showing a working example of how heritage potential modeling and management is implemented in a GIS-based forestry management system.
Contact:
T.H. Gibson Western Heritage Services Inc. 1 10 Lancaster Crescent St. Albert, Alberta. Canada T8N 2N8 780-458-5698 780-458-6923 [email protected]
35

Geodatabase Data Model-its impact on data management in forest information systems, an ESRI Canada perspective
D. Parry and L. Dmitruk
-- 1&> --
Sharing spatially related data within and between enterprises is of vital importance to stewards of our natural resources. Improving access to re
source information in terms that professional foresters, biologists, and environmental scientists can relate has long been the desire of ESRL With the introduction of the Geodatabase, geographic information systems (GIS) will become easier for non-GIS professionals to utilize and integrate with what traditionally have been disparate data sources. The Geodatabase will allow users to think of objects instead of traditional point, line, and polygon features. For example, a forester will be able to model a forest stand based on its interaction with other objects within its environment. This model is a radically different way of thinking about spatial information.
Contact:
David Parry ESRI Canada Box 1 1 Sterling Place Suite 200, 9940 - 106 Street Edmonton, Alberta, Canada T5K 2N2 780-424-3774, Ext. 14 780-424-61 10 [email protected]
36

The transition from timber supply to resource supply analysis
D.R. Webb
-- 1&- --
Timber supply analysis has been carried out in some form for a very long time. For the most part, the approach to timber supply analysis has not changed.
Computers have allowed us to look at the problem in far greater detail, but the general process has remained constant. [t is difficult to identify the exact time when this changed, but timber supply analysis has now become resource supply analysis, and we are interested in far more than just how much volume the forest can supply. Habitat, biodiversity, landscape structure, and water quality are just some of the other resources that must be considered in conjunction with the timber. In order to deal with these issues, new tools have been required. These include spatially explicit forest planning models that have an ability to model more than just volume and tools to help evaluate results in terms of the other non-timber resources. The challenge with these other resources is to be able to quantify and measure them in a manner that can be easily understood and accepted by the public at large. A case study from Alberta is used as the basis for this discussion.
Contact:
David Webb Olympic Resource Management 300, 475 West Georgia Street Vancouver, British Columbia, Canada V68 4M9 04-806-3725 604-806-3701 [email protected]
37

38
1 1 1 1 1 1 1 1 1 1 1 1 1 1 1 1 1 1 1 1 1 1 1 1 1 1 1 1 1 1 1 1 1 1 1 1 1 1

Session 7
Land Use and Cover Change (LUCC) 2
39

Patterns of forest cover change at regional and ecosystem levels in the Western Ghats, India: assessing the role of development and socioeconomic factors using geographic information system tools
N. Barve, M.e. Kiran, R.U. Shaanker, K.S. Bawa, and K.N. Ganeshaiah
-->a.--
We have traced the spatial and temporal patterns of land cover change from the early part of this century to the present in the central Western Ghats,
India. Based on the archive maps and recent satellite imageries, we have documented the quantitative changes in the forest cover during three time periods at a regional level involving several districts of Karnataka State. Using geographic information system tools, we have attempted to relate the spatial and temporal patterns of forest cover changes at the district level to the expansion of plantations, agriculture and other development and socio-economic drivers. At the ecosystem level we have analyzed the spatial dynamics of forest cover change in and around Biligiri Rangaswamy Temple. a well-known wildlife sanctuary. We specifically compared the area that enjoys the protection as wildlife sanctuary with those in the neighborhood and assess the role of such policy decisions in the conservation of the forest areas. Further at the ecosystem level, we also analyzed the role of economic developments and agricultural activities in impacting the health of the forest.
Contact:
Narayani Barve Ashoka Trust for Research in Ecology and the Environment No. 17, 2nd Cross, Amarjyothi Layout, Cholanagar Bangalore, Karnataka, India 560032 91-80-353-3942 91-80-353-0070 [email protected]
40

Property-based analysis of wood supply and biodiversity on private woodlots in New Brunswick
H. Arnold
-- >a. --
Private woodlots cover 3 1 % of the forested landbase in New Brunswick ( 1 .9 million hal. Current estimates indicate that private woodlots are being
overharvested by 20-40%. The impacts of overharvesting on wood supply and forest biodiversity are unknown. In order to sustain these forest values, we need to understand how the forest will change over time as well as the impacts of the thousands of owners who are managing these forests. A project is underway to gather information on the management behavior of woodlot owners. The first step is to set up a geographic information system (GIS) that integrates forest inventory data with property data. The second step is to incorporate owner objectives (e.g., timber production, conservation) from a survey into the GIS. This inventory will be the starting point for a forecast of wood supply and biodiversity (of forest communities) on private woodlots that will track these vafues in response to current and alternative management strategies. The results will indicate if and when a wood supply shortage occurs, the impacts on forest biodiversity, and the sustainable harvest level or annual allowable cut. This information will be used to help make policy and management decisions for the sustainable management of private woodlots.
Contact:
Holly Arnold Faculty of Forestry and Environmental Management University of New Brunswick P.O. Box 4400 Fredericton, New Brunswick, Canada E3B 5A3 506-447-3469 506-453-481 7 [email protected]
41

Survey of forest cover in Costa Rica using Landsat images 1986/87-1996/97
J.C. Calvo, G.A. Sanchez-Azofeifa, V. Watson, R. Bolanos, P. Gonzalez, f. Saborio, C. Quesada, and M. Ramirez
-- /&0 --
ThiS study seeks to generate information that would enable researchers to analyze and value the degree and extent of fragmentation of forest cover in
Costa Rica, and to quantify the rate of deforestation and forest regeneration. This information would be greatly useful for future studies concerning biodiversity conservation and the analysis of possibilities for different environmental services related to the current state of forest cover. For purposes of this study, seven satellite images were analyzed. Criteria for selection established that the images should not have more than 20% cloud cover. These images date from the end of 1996 and the beginning of 1997. Standard procedures established by the NASA Landsat Pathfinder project were used in the automated classification of satellite images of different types of forest cover and other land uses. Analysis of satellite-image interpretation for 1 996(97 indicate that Costa Rica has about 40% of total forest cover, which includes primary forests, secondary-growth forests, mangroves, palm forest swamps, and tree plantations. Due to cloud cover and shadows on the images, 8.7% of national territory could not be clearly interpreted. About 10% of forest cover was lost during the IO-year period from 1986(87 to 1997. However, 7.9% of total forest cover present in 1 986(87 was recovered through plantations and secondary-growth forest. During this period the mangrove deforestation rate was low, calculated at 500 ha or 1 % of the total area of mangroves.
Contact:
G. Arturo Sanchez-Azofeifa Earth and Atmospheric Sciences Department University of Alberta Edmonton, Alberta, Canada T6G 2E3 780-492-1822 780·492-2030 [email protected]
42
Session 8
Applkations of Remote Sensing and GIS to Forestry 3
43
Defining a monitoring system for tropical dry forest in Costa Rica: implementation of algorithms using remote
sensing and geographical information systems
P. Arroyo, G.A. Sanchez-Azofeifa, and J. Calvo
-- � ---
It is estimated that less than 2% of the tropical dry forest remains as relatively undisturbed wildlands in Mesoamerica, and only 0.08% of it lies within national
parks or other kinds of protected areas, mainly in the province of Guanacaste, Costa Rica. Until 1998, when the most recent remote sensing based forest cover assessment of Costa Rica was carried Qut, some issues could not be resolved using available remote sensing techniques. One of the most Significant limitations was the inability to identify different types of land cover in the Tropical Dry Forest life zone (Le., pasture lands, wood plantations, pristine forests, secondary forests. etc.). A Landsat Thematic Mapper (TM) image from the dry season had been" used unsuccessfully because the deciduous forests and the pasture land had very similar spectral responses. Because of the importance of accurately identifying tropical dry forests, as opposed to other land cover, this study is developing a methodology that helps to identify different land cover characteristics of the Tropical Dry Forest life zone using a new set of Landsat 5 and 7 TM images and high-resolution images from the IKONOSTMsateliite. These images represent the rainy season (including a unique Landsat TM image without clouds from October 1987) and the dry season (January, February, March, and April) . By analyzing the seasonal response of the vegetation, it is possible to get an average spectral response that can be applied to the 1999/2000 Landsat TM images. With the help of this methodology, information on land cover and land use for the province of Guanacaste can be provided to government agencies and other organizations, assisting them in the analysiS and prioritization of forested areas or conservation, research, and management. Furthermore, this study is fundamental to integrate Costa Rica's tropical dry forest formations into the Mesoamerican Corridor, which is an international proposal that strives to conserve forest areas in all countries between Mexico and EI Darien in Panama.
Contact:
G. Arturo Sanchez-Azofeifa Earth and Atmospheric Sciences Department University of Alberta Edmonton, Alberta, Canada T6G 2E3 780-492-i 822 780-492-2030 [email protected]
44

Counting individual stems in forest plantations and thinned regions using images from the
Compact Airborne Spectrographic Imager (casi)
D.S. Davison, S. Latail/e, and S. Preiss
Compact Airborne Spectrographic Imager (casi) imagery was collected over a number of different sites that had either been planted in a reasonably regular
grid or that had been thinned to a nominal density. These types of sites can represent differing forest management concerns and often require different casi analysis methodologies. This paper provides an outline of some of the practical concerns in generating the appropriate information product. This paper first outlines the results from a demonstration project in Ontario boreal forests where the planted species was jack pine (Pinus banksiana Lamb.) . The planted trees were typically 2 to 3 m tall and had a nominal separation of 2 m. In this case, both the stem counts and health of the desired (planted) species and the invasion of less desirable species were important. The stems were counted using a combined spectral and spatial technique and were compared to ground�based counts. The test areas included areas of partial cloud shadow demonstrating the illumination-independence of the analysis methodology. The major non-desired invasive species was larch (Larix faridna [Du RoiJ K. Koch). The spectral characteristics of the jack pine changed dramatically, as the planted area became less fertile or more waterlogged. Spectral masks can then be used to include only the healthy jack pines for stem statistics. Thinned stands can have a similar type of regular spacing as plantations but often require modified techniques depending upon the tree size and the type of ground cover. The operational objectives for these areas are usually related to monitoring the success of the thinning and generating new stem density estimates. A comparison of the methods and results will be shown from a partial cut region in an area of large Douglas-fir (Psuedotsuga menziesii Mirb.) on Vancouver Island and from a thinned area of lodgepole pine (Pinus contorta Doug!. ex. Loud. var. fatifolia Engelm.), having typical DBHs of 6-10 cm, in the Chilcotin area of central B.C.
Contact:
Douglas Davison JTRES Research ltd. #155, 2635 - 37 Avenue NE Calgary, Alberta, Canada T1Y 5Z6 403-250-9944 403-250-991 6 [email protected]
45

Improved forestry information in mountainous terrain using a modified canopy reflectance model and airborne casi imagery
R.L. Johnson, D.R. Peddle, and R.J. Hall
Obtaining quality forest information over mountainous areas is important for forest management in western Canada. The effects of terrain and forest
structure on the radiometric properties of multispectral casi imagery were examined in the context of remote sensing ground-based optical measurements of leaf area index (LAI). To account for these variations, a new modified approach using the Li and Strahler Geometric Optical Mutual Shadowing (GOMS) model in 'multiple forward mode' (MFM) has been developed. The MFM approach relaxes the rigorous requirements for actual measurements of stand attributes compared to standard modeling cases. This is because the MFM approach requires only a range of stand attributes typically available in base line inventory data (e.g., Alberta Vegetation Inventory). As output, the MFM approach produces a series of graphical tables providing forest managers with an easy-ta-understand representation of the complex relationships between forest structure, terrain, and stand reflectance. Using this method, significant improvements in the estimation of forest information such as LAI has been realized compared to four other conventional, statistically based approaches. The main advantage to forest managers using this approach is the introduction of a physical basis that is related directly to forest structure, as an improvement on previous approaches, which provide general statistical information only.
Contact:
Derek Peddle University of Lethbridge 4401 University Drive lethbridge, Alberta, Canada T1K 3M4 403-329-2524 [email protected]
46

The effe�ts of slope on optical methods and allometric equations for estimating �onifer leaf area index
D.P. Davidson, R./. Hall, D,R. Peddle, and RL. Johnson
--- � --
Leaf Area Index (LAI) is a measure of vegetation structure that is related to biomass, carbon and energy exchange and is an important input to ecological
and climate change models. It can be estimated using algorithms applied to airborne and satellite images, but it requires reliable ground-based measurements of LAL In this paper, LAI estimates from four optical ground-based methods, a set of allometric equations, and high resolution remote sensing images were compared from lodgepole pine, white spruce, and mixed conifer stands located on two slope classes (0_200 and greater than 200) in the Kananaskis area, Canadian Rocky Mountains. Optical LAI measurements were made using a U-COR LAI-2000 instrument, a hemispherical camera system, a Tracing Radiation and Architecture of Canopies (TRAC) system, and an integrated method, which combines LAI-2000 and TRAC measurements. Allometric equations have been constructed to relate individual tree LAI to species-specific cross-sectional sapwood basal area. These measurements were compared to LAI estimates obtained from Normalized Difference Vegetation Index (NDVI), spectral mixture analysis, and optical modeling of Compact Airborne Spectrographic Imager (casi) images. An understanding of the influence of terrain on the variability of field-based optical LA! measurements and remote sensing LAI estimates will give researchers a tool for field instrument selection for remote sensing field validation and image analysis.
Contact:
Diedre Davidson University of Lethbridge 4401 University Drive Lethbridge, Alberta, Canada T1 K 3M4 403-381-7129 [email protected]
47

1
1
1
1
1
1
1
1
1
1
1
1
1
1
1
1
1
1
1
1
1
1
1
1
1
1
1
1
1
1
1
1
1
1
48

ABSTRACTS OF
POSTERS
49

An analysis of geographic information system-based habitat modeling for the Canada Lynx in west-central Alberta
A. Doucette
--- la. --
Research to be presented on the poster relates to biodiversity and forest management on Millar Western Forest Management Area lands (Whitecourt,
Alberta) . A geographic information system-based habitat model has been developed for the Canada Lynx (Lynx canadensis Kerr) and is specific to this area. The purpose of the model is to assess habitat changes through space and time as environmental conditions transform based on timber harvesting practices. In assessing lynx habitat response to harvest operations, it will be determined if biodiversity is being conserved and if not, sound research and monitoring for forest biodiversity will be implemented. This model requires explicit testing to ensure a high level of performance and reliability for future planning studies. The research I am conducting will validate whether the model is sufficiently robust as a projection tool. The poster will briefly outline the purpose of the research project, the lynx ecology/biology, the general structure of the model via a flow chart, and results of the sensitivity analysis. At the time of the conference I will be snowtracking lynx in Whitecourt to test projected uncertainties discovered during the sensitivity analysis. Preliminary results of my field work may also be presented at that time.
Contact:
Andrea Doucette School for Resource and Environmental Dalhousie University 1 3 1 2 Robie Street Halifax,. Nova Scotia, Canada B3H 3E2 902-423-5468 902-494-3728 [email protected]
50
Creation of distribution map and estimation of available stand volume of Hiba in Japan
E. Nakazono, H. Sawada, K. Kawabata, M. Anazawa, I. Nagatani, and N. Mituduka
--- >a- ---
To ensure sustainable wood supply, it is necessary to estimate the distribution of stand volume of Hiba ( Thujopsis dolabrata S.et Z) in the natural forests of
Shimokita Peninsula in Japan. For this purpose, it is necessary to find the index that corresponds to the basal area of Hiba. We applied the pattern decomposition method, one of the methods for overcoming mixed problem, which decomposite thematic mapper data to water (W), soil (S), and vegetation (V) patterns. This method reduces the topographical effect of remote sensing data. It is found that the relation between W pattern value and basal area is useful to estimate the stand volume. Then we produced the distribution map of the Hiba stand volume. Using the distribution map, we analyzed the relationship between stand volume of Hiba and two geographical conditions, the inclination angle, and the distance from roads. We assumed that the location where indination angle is less than 25° and distance from road is 200 m is suitable for felling, and estimated available volume of Hiba. Finally, we found that less than 20% of the stand volume is available for wood supply.
Contact:
Etsuko Nakazono Forestry and Forest Products Research Institute (FFPRI) 1, Matsunosato, Kukizaki-cho Inashiki-gun, Ibaragi prefecture, Japan 305-8687 81-298-73-321 1 81-298-74-3720 [email protected]
51
Cutblock update with India IRS-IC imagery
R.I. Hall, N. Walsworth, M. Gartrell, T. Balee, and K. Dutchak
-- 1&- ---
Increasing demands on the forest resource and the high costs of the inventory process is driving the need for methods by which cost-effective update can be
accomplished. Cutblock information is currently derived from aerial photographs, but an be expensive when large areas need to be updated. The India IRS-I C panchromatic sensor with 5.B-m spatial resolution has been the satellite with the highest spatial resolution prior to the recent launch of the IKONOS remote sensing satellite. The objective of this study is to compare photogrammetrically derived cutblock boundaries and areas with those interpreted from orthorectified and geometrically corrected IRS-I C panchromatic images. Aerial photographs at a scale of 1 :20 000 were aero-triangulated digitally and displayed on a stereo photogrammetric workstation (DiAP viewer) from which cutblock information was derived. These cutblocks were spatially overlaid and statistically compared to those mapped from on-screen digitization of orthorectified and geometrically corrected India IRS-I C panchromatic images. Regardless of rectification methodS, mapping accuracies will vary with factors such as cutblock size, shape, and topography.
Contact:
Ron Hall Natural Resources Canada Canadian Forest Service 5320 - 122 Street Edmonton, Alberta, Canada T6H 355 780-435-7209 780-435-7359 [email protected]
52

Development of a decision support system for management of roadside trees
E. Ducheyne and R. De WUlf
-- ;a, --�
Management of roadside trees has often been neglected over the last four decades, notwithstanding their considerable ecological, social, and produc
tive functions in rural areas. Decision Support Systems (DSS) have been created mainly for harvest scheduling in forestry, but these DSSs have rarely been implemented outside the forestry sector. In Flanders, Belgium, roadside trees are usually owned by a public agency. Often, these public owners lack tree management skills. In the experimental region (province of West-Flanders) the OCMW (English equivalent: Public Centre for Social Welfare) owns 2500 roadside trees (Populus and Quercus spp.) . There was no evidence of management in the past. The study's objective was to design a decision support tool to assist the'owner in making decisions concerning pruning. felling, and restocking. To achieve this a full inventory was performed. Different tree parameters were measured and linked to their spatial position in a geographic information system in order to create a visual representation. In the modeling phase, several pruning and felling scenarios were developed and evaluated. AU scenarios were retained in the final product, together with a ranking of their applicability. This final DSS will be implemented shortly and will be closely adhered to over the next years for future validation purposes.
Contact:
R. De Wulf University of Gent Coupure Links 653 Gent, East-Flanders, Belgium 9000 32-9-264-61-10 32-9-264-62-40 [email protected]
53

Eco-distribution mapping of medicinal plants of conservation concern in southern India
D.K. Ved. V. Barve, and S.N. Begum
-- � --
The Indian sub-continent is one of the most distinct bie-geographic regions of the world, with a rich repository of medicinal plant species. As a consequence
of unregulated use, the plant populations are heading towards alarming depletion, coupled with fragmentation of natural habitats. More than 2000 medicinal plants are estimated to be present in the southern Indian states of Kerala, Karnataka, and Tamilnadu. These are distributed across the different forest types ofthe region ranging from wet evergreen to dry deciduous forest. Understanding of natural distribution pattern and eco-climatic limits of these taxa helps in formulation of their conservation strategies. Identification of zones of speciation and -demarcation of hotspots of biological diversity, covering all kinds of habitats that are rich in biological diversity also aid in the conservation measures. The conservation efforts are best aided by vegetation and land-use maps. Systematic mapping of the occurrence of the species in an area provides distribution patterns related to the ecological parameters. It gives an insight into the region where the conservation has to be initiated and the extent of protection required. In this paper we are presenting how FRLHT, Foundation for Revitilization of Local Health Traditions, is using GIS for eco-distribution mapping of prioritizes medicinal plants of southern India.
Contact:
Vijay Vasant Barve FRLHT 50 MSH Layout, Anand Nagar Bangalore, Karnataka, India 560024 91 -80-3336909 91-80-3334167 [email protected]
54

Forest fuel classification in Yukon using remotely sensed land cover of Canada
S.R. Francis, N. Flynn, O.B. Armitage, and B.D. Lawson
--- la. ---
Yukon is predominantly a forested landscape; over 60% of the territory is covered by coniferous forests. An important component of forest manage
ment in Yukon and all of northern Canada is fire suppression and fire risk reduction around the widely dispersed communities. Like many other jurisdictions, Yukon is moving from a phase of fire suppression to fire management. The implementation of effective fire management requires an accurate forest fuel classification and risk assessment. Until recently. this information was generally lacking in the territory as forest cover mapping only covers southern Yukon. In an effort to provide cost-effective fire management information for large geographic areas, a forest fuel classification was produced for all of Yukon using the 1 km National Oceanic and Atmospheric Administration Advanced Very High Resolution Radiometer land cover of Canada (ver. 1 . 1 ) classification produced by the Northern BIOsphere and Modeling Experiment project. Forest fuel typing algorithms generated through two seasons of ground and aerial surveys in southern Yukon were used to assign Fire Behavior Prediction fuel types to each land cover class from the satellite imagery. This was an exploratory exercise designed to provide a comparison between the accuracy of 1:50 000 scale forest cover mapping and 1 km land cover of Canada. Forest fuel type verification and accuracy assessment is ongoing.
Contact:
Shawn Francis Applied Ecosystem Management Ltd. Suite 1 00, 2 1 1 Hawkins Street Whitehorse, Yukon, Canada Y1A lX3 867-393-3793 867-393-2247 [email protected]
55

Geographi<: information systems and remote sensing: tools for assessing responses of mountain caribou to different
types of linear developments in west-central Alberta
P. Oberg, C. Rohner, and F. Schmiege/ow
-- /&. --
S ince 1985, woodland caribou (Rangifer tarandus caribou [Gmelin]) have been designated as an endangered species in Alberta, under the Wildlife Act.
Human developments resulting in linear features (roads, pipeline right-of-ways (ROWs), seismic lines, and powerline ROWs), and associated increases in access, have been implicated as one of the primary conservation concerns for caribou. This study investigates the movement and distribution of migratory mountain caribou to different types of linear developments, with variable internal attributes, in west-central Alberta. Prior to assessing the distribution of caribou with respect to linear features, an accurate and current base map coverage of linear developments was required. The base map coverage was developed by digitizing 1998 Indian Resource Satellite (IRS) imagery (5 m x 5 m pixels). The IRS imagery, aerial photographs, and available development maps were interpreted for vegetation, type of development, and width attributes. These attributes were verified through ground-truthing. Caribou were fitted with automatic global positioning system (GPS) transmitters, and location data has been collected over the winters of 1998/99 and 1999/00. The GPS data have been intersected with the base map, and caribou locations are being analyzed with respect to linear developments, using a buffer analysis. Both the accuracy and timeliness of the base map and caribou location data offer a unique fine-scale investigation into the potential impacts of different types of linear developments, with variable attributes, on mountain caribou.
Contact:
Paula Oberg Department of Renewable Resources, GSB 7-51 University of Alberta Edmonton, Alberta. Canada T6G 2Hl 780-492-9240 780-492-4323 [email protected]
56

How landscape characterization may affect the interpretation of woodland caribou habitat selection in southeast Yukon:
implications for forest management
N. Flynn, R. Florkiewicz, S. Francis, and N. MacLean
--- >a- ---
Liard Basin, in southeast Yukon Territory has come under increased forestharvesting pressures. Some areas targeted for harvesting are in direct conflict
with an important wintering range of Little Rancheria caribou herd. To manage this area for both forestry and protection of caribou habitat, it is important to understand the resources required to sustain a viable caribou winter range. Four systems of landscape classification were examined in order to identify habitat selection by caribou within their winter range. Three seasons of very high frequency (VHF) telemetry collar data for 27 caribou (Rangifer tarandus caribou
[GmelinJ) were collected by biologists from 1996 to 1999. The four systems of habitat characterization used in the analysis were 1 ) Broad Ecosystem Mapping (BEl), 2) sOil/surficial geology, 3) modified ecosystem classification vegetation types (V-types) . and 4) Yukon forest cover. Telemetry locations were combined with each of the four landscape representations within a geographic information system environment. It was found that each method had limitations. These limitations included how well the understory component of the forest structure was described; the scale at which the information was collected; and extent of the area covered. Overall the BEl, soil, and forest cover mapping were found to be of limited use. To make operational-level forest management decisions it is suggested that ecologically based habitat classes, which incorporate soil and vegetation community associations, be developed at a scale of 1:50 000. Currently, digital forest cover mapping is the most readily available source of habitat characterization for forest management planning.
Contact:
Nadele Flynn Applied Ecosystem Management ltd. Suite 100, 2 1 1 Hawkins Street Whitehorse, Yukon, Canada Y1A lX3 867-393-3793 867-393-2247 [email protected]
57

Implementation of a countrywide tropical deforestation monitoring system in Costa Rica: quantification
of tropical rainforest fragmentation
G.A. Sanchez-Azo{ei{a, f. Calvo, P. Arroyo, and P. Van Laake
--- /a. ---
The transformation and degradation of tropical forests represents the primary driving force in the loss of biological diversity worldwide. The challenge of
seeking balance between undisturbed nature and the human domination of ecosystems in tropical regions will be increasingly contentious in the next few decades due to population growth and the need for improved socioeconomic welfare phenomena that will be coupled with internationalization and globalization of national economies. Environmental degradation of tropical environments is a major concern for developing countries in the Central American region. Deforestation and its impact on biodiversity loss, soil erosion, water pollution, and the degradation of scenic values influences the economic productivity and quality of life in this region, and is, therefore, considered to represent one of the most pressing environmental issues in the region. Despite growing public concern, and increasing political rhetoric, actions have been relatively ineffective in managing this problem. Tropical forests in the Central American region are being destroyed and degraded in critical ecosystems, and tropical forests suitable for timber production are being lost at rates exceeding reforestation efforts. This paper presents major research efforts by the Earth Observation Systems Laboratory (EOSL) at the University of Alberta and the Tropical Science Center to develop and implement a monitoring system using remote sensing techniques. The main goal is the development of protocols aimed to quantify the extent of forest loss, the dynamics of deforestation rates and the level of forest fragmentation in Costa Rica, Central America. This paper reports results from a first wall-ta-wall assessment of forest cover that was implemented for three epochs: 1970s, 1980s, and 1990s for this tropical country. Results indicate that even though the country has a total of 40.3% of forest cover, the level of forest loss and fragmentation has affected crucial ecological zones. In a country that holds about 5% of all tropical biodiversity, these results provide important information for the definition of conservation policies and carbon sequestration initiatives under the Biodiversity Convention and the Kyoto Protocol, respectively.
Contact:
G. Arturo Sanchez-Azofeifa Earth and Atmospheric Sciences Department University of Alberta Edmonton, Alberta, Canada T6G 2E3 780-492-1822 780-492-2030 [email protected]
58
Incorporating woodland caribou habitat into forest management planning in northwestern Alberta
R.B. Anderson and D. Kme!
--- >&. --
A lberta's boreal woodland caribou (Rangifer tarandus caribou) are listed as a threatened species and are considered to be at risk of declining to non-viable
population levels if limiting factors are not reduced. Research conducted by the Boreal Caribou Research Program indicates that caribou avoid some types of industrial activity, thereby effectively reducing the amount of available habitat. Natural resource companies may be able to reduce their impact on woodland caribou by planning activity on caribou range to coincide with areas that are naturally avoided by caribou. The purpose of this project was to develop models for predicting caribou distribution over a large land base. The ultimate objective was to use this information to aid in forest management planning for the Daishowa-Marubeni International Ltd. (DMI) Peace River Forest Management Area (FMA). Models were developed from Alberta Vegetation Inventory data and caribou radio-telemetry data using ArcView and Arclnfo. Model predictions were verified using additional caribou location data. Maps of potential caribou distri,bution were then produced for the DMI Peace River FMA. These maps have been incorporated into the DMI Forest Management Plan and will aid planners in decision making for areas of potential conflict between woodland caribou and industrial activity.
Contact:
Robert Anderson Applied Ecosystem Management Ltd. Suite C. 1 1301 - 89th Avenue Grande Prairie, Alberta, Canada T8V SX3 780-831-7331 780-831-7331 [email protected]
59
Landscape controls on the loading of phosphorus to boreal lakes following timber harvest: a physical
basis for adaptive buffer strip strategies
K.J. Devito, I.F. Creed, R.L. Rothwell, and E.E. Prepas
-- ,., --
This paper considers the influence of upland-riparian-Iake hydrologic linkages on the potential impacts of timber harvesting and the potential effectiveness
of buffer strips on the phosphorus chemistry of lakes in the western boreal forest. We hypothesize that landscape properties will influence the potential susceptibility of a lake to a disturbance. To test this hypothesis, we examine relationships between indexes of landscape properties and changes in the concentration and mass of total phosphorus (TP) in headwater lakes following a timber harvest. Among the lakes, a large portion of the variation in changes in TP could be explained by: 1 ) an index of the hydrogeologic setting of the lake, which influences the degree of interaction of the lake with the regional, intermediate, and/or local groundwater flow system; 2) the size and organization of saturated source areas ofTP (wetlands and ephemeral draws), that influences the potential for hydrologic flushing of TP through surface hydrologic connections to the lake; and 3) the curvature of the shoreline of the lake, that influences the pathway of water moving through the riparian forest to the lake. We synthesize our landscape indexes into a conceptual hierarchy of processes to provide a physical basis for generating adaptive buffer strip strategies for lakes overlying complex hydrogeology.
Contact:
I.E Creed University of Western Ontario Biology and Geology Building London, Ontarlo, Canada N6A 587 5 19-661-4265 519-661-3935 [email protected]
60

Mapping conifer understory from satellite imagery
R.J. Hall. D.R. Peddle, and D.L. K/ita
--- M. ---
Information about the presence and spatial distribution of white spruce conifer understory within deciduous and deciduous-d�minated mixed-wood stands is
required for boreal mixed-wood management in Alberta. A method involving satellite data can provide useful information at the planning level by providing an initial stratification of the forest landscape for understory location, distribution, and amount. This study compared understory maps produced with an iterative supervised classification algorithm and a knowledge-based evidential reasoning classifier. Understory information from interpretation of leaf-off aerial photographs was overlaid onto two-date, leaf-off and leaf-on, Landsat Thematic Mapper images from which random pixel samples were extracted for classification. Variables used in classification included digital Landsat Thematic Mapper image data and stand structure information available from the Alberta Vegetation Inventory. Similar classification accuracy results were obtained from the two classifiers with spectral data alone, but accuracy increased significantly using the evidential reasoning classifier when information about stand structure was added to the classification exercise. Image maps were produced at a scale of 1 :20 000 and are being evaluated for their informational value.
Contact:
Ron Hall Natural Resources Canada Canadian Forest Service 5320 - 122 Street Edmonton, Alberta, Canada T6H 355 780-435·7209 780·435·7359 [email protected]
61

Polygon decomposition: a procedure for using remotely sensed data to add new information and update existing information in
geographic information system databases of forest inventories
M.A. Wulder, S.E. Franklin, L.M. Moskal, and M.B. Lavigne
--- 1&- --
Polygon decomposition refers to the process of analyzing previously delineated polygon areas using ancillary digital information acquired from an inde
pendent source, such as remotely sensed data. The polygon data are used as the context for the analysis of the remotely sensed data. The polygonal data represent areas of generalization and the remotely sensed data can be used to make measurements or aggregate information in a meaningful way within those generalized areas. The fusion of the raster and vector data allows for the augmentation of current information in the previously delineated polygon areas. The· current information available from the remotely sensed data may be physical properties, such as spectral reflectance values, or categorical properties, such as the result of an image classification or change detection procedure. This poster will illustrate the process for undertaking polygon decomposition procedures in research and application contexts. Specifically, we provide examples of polygon decomposition in the update of forest stand polygon labels and in the identification of forest cover and structural change.
Contact:
Mike Wulder Natural Resources Canada Canadian Forest Service 506 West Burnside Road Victoria, British Columbia, Canada V8Z l M 5 250-363-6090 250-363-0775 [email protected]
62
Geographic information system (GIS) applications in Oregon's western forests: contributions and
limitations of GIS technology to forest research
M. Wing
-- 1&- --
Organizations are increasingly using a geographic information system (GIS) to help manage forest resources. This paper examines several studies of
forested ecosystems conducted by Oregon State University's Forest Engineering Department. Each study utilized spatial data and relied on GIS technology for analyzing the data. Study objectives included analyzing aquatic habitat, mapping slope stability, quantifying large woody debris distribution, and calculating visual sensitivity of a forest. Output and findings from each study are examined and critiqued in light ofthe role GIS played. Based on these findings, the contributions, limitations, and practicality of using a GIS to assist forest resource research are discussed. The GIS strengths included an ability to integrate data sources, reorganize and restructure data, and to present visual or mapped results. Limita� tions to using a GIS included integrating different data structures, data availability and quality, and a lack of statistical tools within common GIS software.
Contact:
Michael Wing Forest Engineering Department Oregon State University Peavy Hall 2 1 5 Corvallis, Oregon, USA 97331 541-737-4009 541-737-4316 [email protected]
63

Quantification of animal movement in the Amboseli-Tsavo region of Kenya
A. Franke, R.W. Wein, G.A. Sanchez-Azofeifa, and R. Hudson
-- /a, --
ThiS research proposes a multi-phase approach to quantifying animal movement within spatially explicit landscapes and has broad implications to
conservation and management of biodiversity using remote sensing techniques. A corridor shall be identified by combining satellite image data with least-cost path analysis and hierarchical scaling of friction indexes. An individual based movement model will describe how virtual individuals move through spatially explicit least-cost paths. Finally, actual individuals shall be tracked remotely and their movement compared to that of virtual individuals. The objectives are to map the landscape and identify a least-cost path, determine and prioritize the variables associated with animal movement, model the movement of virtual individuals through a least cost path and compare the movement of virtual individuals to actual individuals. Remote sensing (RS) and geographic information system (GIS) technology is potentially the most accurate way to prepare the synoptic view required to characterize the landscape, and, in addition, is integral to development of the spatially explicit movement modeL Gap analysis using RS and GIS technology could potentially identify current land use, land cover conversion, and ideal location of conservation networks-a strategy that may facilitate recolonization, counter species extinction, and increase carbon sequestration and gene flow.
Contact:
Alastair Franke University of Alberta 1 1 1 18 - 71 Avenue Edmonton, Alberta, Canada T6G OA4 780-435-9499 780-435-9499 [email protected]
64

Quantifying tree encroachment in rangelands using image classification and pattern detection
Y. Bai, N. Walsworth, B. Roddan, D.A. Hill, K. Broersma, and D. Thompson
�- ,., --�
Tree encroachment has reduced grasslands in British Columbia. Recent developments in remote sensing focus on high resolution, multi-spectral digital
imageries and often overlook the 'old', black-and-white aerial photos. In addition, most tree delineation techniques are better for dense forests than for scattered trees. We tested the usefulness of black-and-white aerial photos in image analysis for studying tree encroachment using commercially available remote sensing and geographic information system software. Aerial photos from 1 966 and 1995 were scanned at 0.5 m resolution, covering 100 ha of grasslands and forests. The maximum likelihood classifier was used to separate tree, shadow, and grassland pixels. Tree-shadow contacts were used to model circular crown masks. A moving sample window was applied to calculate tree coverage and the imagery was classified into open grassland (0-4.9% tree cover), treed grassland (5-14.9%), open forest ( 1 5-34.9%), and closed forest (greater than 35%). Results showed that about 27% open grassland was lost to tree encroachment between 1966 and 1995 within the test area. Compared to field measurements, tree coverage from image analysis was 0.8, 2.6, and 1 .0% lower for open and treed grasslands, and open forests, but the error increased significantly when trees were dense ( 1 2.4% lower for closed forests) . The under-estimation of tree coverage was possibly caused by I ) limited information in the black-and-white photos, and 2) omission of small trees and generalization of tree groups, which are also problems with high resolution, multi-spectral imageries. The accuracy was reasonable for the concerned grasslands, but improvement is needed for areas with high tree density.
Contact:
Nick Walsworth Natural Resources Canada Canadian Forest Service 5320 - 122 Street Edmonton, Alberta, Canada T6H 355 780-435-7384 780-435-7359 [email protected]
65

- � -
The but ...... nag� planning p«><;eu In Ontario requl..,. that � monitor the """tilll and temporal � in rw:t p<lmary ptOductlvity (NPP)
IICfOIS marwogemenl un�s and plaMIng regions. In suppon 0( Ihla �ul�t. � Implemoented an Molylk: .. 1 ptO« .. to dt.1ve monthly mean provlnelal,sc&le NPf> lu.f.ocel 10. each 01 3 ye .... using geographic information Iy,tems and ... m.otely Hnsed dat •. The analy'" ..... III� .. number of dala 00lJr<;Q and mo6els: tho: N .. t� Oceanic aod Atmospheric: AdrninWtatlon AdYan«d Very High Resolution RadiometH monthly compc»iIes .... ef,. used to predict normalited diffewoce ....... Iion inck.o (!'IDYl) 01 "" 8 km � lot \he fl'IUre province. The NOV! '"u ... ·se.1<><! to yldel !he haction ol lnle<C<!pled pho&osynthetically � , ..... Uon (FPAR). PhotooynU>dkally ..:tNt radiation (PAR) wnestirNted uaing mountain mlcroclimate simulator end calibrated with Geoatatlonary Opera· tIonal Envifo:>nmft\lOI SatcU�e <ioU!. Ught use offlc;ifonq (WE) "'a' rnodf:led as II function ol climate using the Reoglonol Hydro-Ecological Simullliion System al lout study site •. Climate dala from "veral hundred """lithe< OIatlons wu "'Jrttapo. lated to an 8·km prov!nc;'l grld and UIed to derive PAR. APAR (obtofbed PAR). and WE .... '1,..," •. (Jltimately. NPP surface. """ ... deri_ ... a lunc1lon of WE IIndAPAR. 1or otI>Ch month In the year. 1992. 1993. lInd 1994. �tll � lind proceuing were C .. frled out uoJng Minto and the Oeog .. phk ResourcK Analysis Support System.
�
" ..... l<hnoI:;_get _".01 No ........ Iton<>ur, ... InS � Strftt [ .... Soul! S ... �. o....no. ConI<I. _us -�, 1OS+loIi-lOJIO 'f .... _� .. """.IIO".on ....
"

AI.V. c ... t,,, ,,nd M. ""pp<lk
0"" "f the main problems for !he conservation and the intelligent u"" Into pe,petu�y of the bIoIogicel rlchne •• In the tropics i. the leek of updftted
inl"'mlllIon Ifll dec;;.ion making. Looking to solve thl. pn>bIem In COlta Rica, the ECOMAP"S (ColI""tion 01 ecoIogicel dete end mapping of """'y.tem distribution in live Conse,vation "",eo) Project hes booen implemented. Thi. proJect i. I><>sed on the gathering 01 ecologic .. 1 d�1<I and in mappi<lg 01 the ecosystem'. dlsulbution in fIVe Conservation .... relll. dslng "eflat photograph. ( ] :40 0(0) an<! an uhau.· live gmund.truthlng 1\ ",as possible to recogni.e, classify. map . .. nd describe a eonsider/Oble number of ""osystem.and vegetation types. Thoo fi<1t Conse,vation .... rea In the ECOMAP,o,S project th'" \OIU \OIorhd on was the 0 ... Conservat"", Ar« (ACOSA). one of tht rr>O$t importllnt for it. ricl\nesl in biodiversity and endemism. The ACOSA II also one of those areal wl,h .. very sirong pressure on It!! nalur"al resou,..,.... Thl. press"", ;, highly noticeable In the Dell P"nll\$ul". mainly through the tlmbe' .. ctivities. a. well a. the e'pan,ion of the egricuhural fronUer. It has reached a tevel of substantiaf concern because of the fore.l and landsca"" fr .. g ...... nt .. tfon. Using the fnformation g<!nerated by ECOMAPA.$. among otl>er sou,'''''". _ h .. "" been abfe to make on u ..... ......,"", of the p<>ssit>lfi· lie. of creating .. bi<>Iogieat corrido< between the two biggest ro.<!st m ... "". In the ,egion: the COICOVl>"" Natl"""f 1',,01< .. "" the Piedras Blanca. NMional Park. Uk"wise, some items a'e sugg�ted th�l should be llIken int" .. ccoont fe< the eOl"l$Olidahon of the bIoIogl�81 corridor.
Contact:
MarmCMtro (f"ttuto NA<ioMI � Biodive"idod J\pdo II S.n.o Domi. Ii.tedi •• CosIO �iu "00 �,� 506-l44-2Ilt6 m< .. troII'inbio.-.u

Trail network realignment model
A. Hebb and M. Lindberg
-- la. ---
Forested areas with mountainous topography often have naturally fragmented landscapes. These areas are usually home to populations of large bodied
animals, and they also attract a high amount of recreational use. The highly fragmented landscape of the Bow Valley, resulting from both development and topography, has had serious implications for wildlife persistence and ecological function potentially leading to a loss of local biodiversity. Historically no tool was available to recreation planners to assess ecological, wildlife, and recreation criteria for the realignment of existing trail networks or the design of new trail segments. We developed a geographic information system (GIS) application in ArcInfo that assesses an existing trail network and produces an optimal trail alignment. Optimal trail alignments provide a basis for consolidating the existing network trails by assigning ecological. wildlife, and recreation suitability scores to landscape features. The optimal trail alignment therefore minimizes ecological impacts while providing the highest quality recreational trail experience to the public. Our preliminary results for the Bow Valley show how a complex trail system could be aligned within a wildlife corridor system in a highly developed montane valley.
Contact:
Mark Lindberg Alberta Environment 3rd floor, 2938 - 1 1 Street NE Calgary, Alberta, Canada T2N lT7 403-297-5369 403-297-6069 [email protected]
68

Use of geographic information systems to supplement high resolution imagery: combining India Remote Sensing
satellite images with provincial base data
S. Hamilton
In response to a request from the Lac La Biche Fire Centre, India Remote Sensing orthorectified satellite imagery was used to build a 1 : 150 000 scale wall map
covering most of the forest area's fire protection zone, detailing pertinent boundaries, roads, streams, and settlements. This 4.6 million ha subset was constructed from mosaicked east-west strips, and then decimated and tone· matched in PC! prior to the final assembly of the map in ArcView. Arclnfo was used to prepare the vector overlays for the mosaic. The resulting image was then plotted to fit a 6 x 3 ft wall map for strategic planning in the Fire Centre. Of particular interest is the process used to minimize the file size of individual strips. Each strip was loaded into ImageWorks at 50% resolution, and then saved as such, thus quartering the number of pixels and, consequently, the size of the file. While a resampling operation would have been a more accurate account of the ground surface, this method was thought to be adequate since the product was for display purposes only. In a similar project, IRS imagery was used as the base for a geographic information system designed in ArcView for Alberta Agriculture. In this venture, a 1 :20 000 scale map was created for the Connor Creek Grazing Reserve, complete with vector overlays including access, boundaries, ownership, soil types (from Agricultural Region of Alberta Soil Inventory Database [AGRASID]) and the Alberta Woodlot Inventory data.
Contact:
Stephen Hamilton University of Alberta 1 1 1 18 - 76 Avenue Edmonton, Alberta, Canada T6G OJ8 780·439·7452 [email protected]
69

Operational aspects of the Compact Airborne Spectrographic Imager data collection in providing
inventory tools for the operational forester
D. Trudeau, S. Mah, f. Aitken, f. Howse, and M. Kerr
-- ... ---
S ince 1995, ITRES Research Limited has worked closely with the Ministry of Forests in British Columbia and various commercial forestry companies to
develop and validate efficient, accurate, and cost-effective softwood inventory tools derived from the casi (Compact Airborne Spectrographic Imager) remote sensing instrument. The success realized from these early programs drove the refinement of the data acquisition and analysis methodologies since used by ITRES to produce useful end-products over large areas for operational forest managers. To date, ITRES has flown over 120 000 forested ha and generated products to assist operational foresters in their decision making. Past programs have focused on stem counting to assess the stems per hectare distribution of small conifer trees ( 1 m tall) for regeneration and for selection of candidated areas for thinning. The flexibility of the instrument to collect useful data in partly cloudy and low illumination conditions, as well as its high spatial and spectral resolution, extends its usef!Jlness past most other types of remote sensing instruments, including air photography and satellites. The ability to cover difficult-to-access regions efficiently from the air also allows the casi to complement existing ground sampling inventory programs. An overview of the salient components of typical casi forest inventory programs conducted by ITRES for commercial clients is discussed. Issues related to casi-derived products, costs, scheduling, data acquisition rates, and typical acquisition parameters are presented.
Contact:
Daren Trudeau ITRES Research Ltd. #155, 2635 - 37 Avenue NE Calgary, Alberta, Canada TlY 5Z6 403-250-9944 403-250-9916 [email protected]
70
Spatial and topologi�al refinement <If f<ll"eSt polyg<>ns using Comp;a" Alr .... rne SpC!�trog ... phi' Imager image analysis
S. !.ol(lrlk, D. VClvbon, T. Wlt/ebrood, and R. C.auv;n
- � -
The use of ne .... ElIrth observ�lion Ie.:hnologies for building foresl man�ge""'nt
geogl"l'lphic inlormation system (GIS) I<lyer. can lead to considerable !ldWIn' tages. ,o,mong Ih�se .... e can consider .""ti�1 continully. high discriminntion and surfa� ch�l"l'Iclemation (lond cover. tree species. elc.), and the �$sura""e 01 consistently reprodudhle Inlerpretallon. In the lasl decade. Compoct ,o,irborne Spe.:trog rophi<: imoger hu �n used lor conile, slem density estlm�tion, coniler .. nd de.:iduous species dlscrimlnntion, .tre ... identlncallon, and other inlomlation for forest management. The pruent ch .. lleoge is to use there detailed Information ond eJCpJoit thei' full poteolllli to renne .""lIIllly and topologically the lorest unit
polygons at an appropriate sc�le for forest m"""gement. Differenl pml-annly.rs gener�Iiu>Uon methods "'ere eJCplored in order to observe their capacity to automatkally redef,ne the polygons "nd add the topology of tllt!OO! newly created GIS polygons I<> tilt! GIS data""se. I'-. case 01 conder slem map rennement '" p",sented and shows the promising .. ,.ults of some 01 these methods I<> oen"",te end upd"te polygons for density and ""rU,,1 cuts eSlimotion.
�t.ph.n la .. itI. JTRE� ll<->NI,ch ltd. IISS. 26lS -37 A""""" Nf 01ga'14 Alberto, OnO<l, T1V�� �,� 403·2';0-9')16 1 ... iIIeOi!rft.c"",
"

Applying conservation nets to agricultural landscapes
N.L. Salamon and R.W. Wein
--- la- --
A lbertans are very much aware that conservation islands surrounded by agricultural lands are susceptible to species diversity loss and invasion by
non-native species when disrupted by forces such as grazing, drought, and fire and even fertilizers and pesticides. There are emerging political developments to expand conservation areas, and Alberta agriculture will be susceptible to fallout from these issues. Alberta and Canadian agriculture need to quantify the degree to which their waterways and roughland landscapes still conserve biodiversity. We believe that conservation within agriculture land can come into fo�l.,Is using the concept of Conservation Nets (CN), which are essentially biodiversity hotspots that are connected by corridors. These ensure greater potential for species daily movements and seasonal migration. In accordance with conservation discussions, landowners will continue to be stewards (with compensation) to ensure long-term sustainability of waterways and roughland areas on agricultural lands. It should be noted that if CN were allowed to regenerate their native plant biodiversity, the land should store carbon for carbon tax credits as well. The study area in eastern Alberta is the Wainwright Dunes Ecological Reserve, which consists of approximately 2800 ha of native grassland within a much larger area (30 x 120 km) of similar habitat from Kinsella to Sounding Lake. We will report on our progress to identify, using remote sensing data and geographic information systems, eNs (nodes and corridors) over this larger area.
Contact:
Ross W. Wein University of Alberta 442 Earth Sciences Building Edmonton, Alberta, Canada T6G 2E3 780·492-2038 780-492-1767 [email protected]
72

The Gulf Canada and Alberta Pacific pilot integration plan
f. O'Neill, P. Koning, and S. Wasel
--- /&. --
Gulf Canada Resources (Gulf) and Alberta Pacific (AI-Pac) Forest Industries have undertaken a pilot project to investigate the feasibility of coordinating
their plans for the Surmont area. Gulf has plans for a multi-phase SAGO (Steam Assisted Gravity Drained) bitumen project, while AI-Pac holds the timber rights for the area. A geographic information system has been used to view the areas of overlap and to calculate the human footprint and costs associated with an integrated design. At this stage, the sharing of a road network has been used as an indicator of the potential benefits of integration. Recognition of the overlapping interests and potential benefits at the planning stages, instead of during development, will ensure that fragmentation is kept to a minimum, well pads occupy harvested cut blocks, and that roads are built in a time sequence that coincides with both parties' interests.
Contact:
Jack O'Neill J. O'Neill GIS Consulting #1 14 3210 Cornwall Drive Athabasca. Alberta, Canada T9S 1 P4 780-525-8418 780-525-8097 [email protected]
73

�ti .. lng phy.k.1 fO�1 stand b.fo ...... llon fro .. �molC'ly · »e .. »ed I .... gery IIsl"lI: �.nopy �nC'�I.ncC' ... oddS
-�-
FOffIlt cOtlOPy �fleetance m<><IeIs provide a powerlul link beI_ physic-al aUributu oi. foreSl.uond and the r<rl\eded .nergy from ll'Iete lland. r«o<ded
as opearal le� patterns by airborne and salellile .emotC' $<!tISOI"I. ThIs ;, of ImportMc, to forestry studies becau"" these remote ato.lfIg method. provide Information ouch as .caRd deoslty. tree height aM canopy dlmenllon. and volume based on • physical undo!Btanding 01 the Interaction 01 ooIar r/ldl.ation with forell ClInopiel and atand geornMry. This provision 01 phylleal and W\ldural informa. tlon is 01 g«i:ate< ,elf'>oDnCe to forell<:<l compared to the lIenenolly sl1Jtistical outputs 01 <:OI'"rItiltional re<nOCe HnSinliJ Image analysit. The principles 01 canopy ....aec:u.r>« modeb .,, rut outlined. togetIwe< with the _pi 01 MJb.pIuI scale Infonnortlon , .. tr.ctlcn and the tl>eo<e6<:01 advantages of the .. approad"leo compal"1!d to prev;ous methods. RflUIls from a .. ariety of gleNl dlanye and � ,t_ KMInliJ otudieI such a. the f1II.SA CO'/ER �. BOREAS. and the inte<natlQnal s.te�ite Land &.face Ci;maotology Propect .... 111 be highlighted. "These lIudiei �.oed bore<tl and ..-.nl1Jinous I ....... ln at 1oc.1 to �lonal llC"ales. and in� different Ioftlt attributes. species. Image tpallal .-.<I spectnli rnoIuUonl. $<!tI_ typel. and forestry Infor"",tion applkatlonl.
00,0\ _. UnI-.ity of l�",," ...ot Un"",""lt)I Ortw_, ... tllbrldgo, ,,1"-<1 •• C • .-.d_ T1�l� 4OHlt-2Sl. 4OJ.llt-20Ii do<ot.�.<a
"

Satellite forest fire scar mapping as a tool for salvage logging planning
R. Landry, D. Raymond, H. MacLeod, R.f. Hall, A. Robertson, and f. Russell
--- ... ---
Fires burn an average of 736 000 ha of commercial forest annually (74% of the area harvested) . resulting in a loss of 70 million cubic metres of wood,
with a value of about $1 billion. In commercial forestry, once a fire is controlled and extinct, the forest products industry gets actively involved in planning salvage logging operations. Information and timeliness are the key challenge when a major fire event strikes, such as the Virginia Hills fire that burned over 154 000 ha of the northern region of White court (Alberta) in May 1998. The presentation will focus on the current results of a joint project between the Canada Centre for Remote Sensing and the Canadian Forest Service to assess the use of Landsat Thematic Mapper for bum scar mapping. A review of the past 2 years of work with the Canadian forest products industry to promote and secure the potential of spaceborne remote sensing as a tool for planning salvage logging will be discussed. The end-ta-end processes for fire scar mapping using satellite data will be presented and compared with conventional airborne methods. Recent work to assess the mapping of partial burns will also be briefly discussed.
Contact:
Robert Landry Canada Centre for Remote Sensing 588 Booth Street. Room 339 Ottawa, Ontario, Canada K1A OY7 613-947-1241 61 3-947-1385 [email protected]
75

Moniloring land Ulie and land (OvC'r change In borelll "'tIons: Impl�menlllllon of. provincial pf(ltocol using remOle sensing
I«hnl'lu",,: a use study In Alhna, f;:anada
G,". Sanc�:-Mnfdfa, T. I'oizln. G. HamliIOil. K. VUlchak. 8. SI« p . ..t. Rlclranh, and R. &"1><:1
Tf>e'� is in<;,..,aslng p ..... sure to eval ..... t� and approve Industrial develop..-t 1 projects primarily �Iing w�h 011 sand and heavy oil ext<&ction In the
nQrtheMt�rn bor�al '�gion of Alberta. The curnulative irnpacts of rnultlpl� ar>d rnassive induSUi"l dev�lopment within th� region Is still not well understood. �seji"'" Inv�nlor"s of current reSOUrce information are a key component in supporting a regional rnOOel ""'signed to betlef unde .. lllr>d the Impact 0/" cum..lali"� air ects on Jandsca pe structure. This paper describe$ Ih� "..."i n ach"'v�ments relato!d ta Ihe d<;veloprncnl of a remoto! se"sing ar>d geographic information Iystems protocol aimed at n'H)(IilOfing Idnd u.e and land covar chang<: (WCC) in �al regio .... The propou<i prctacol uSH medium_resolulion satellit� Irnages (lIIndsal1hematlc Mtlpper) n " standard to rnap !and cover under the Albena G1OUr>d Cover Cla .. il\cation. The main goal of this 'esearch Is to _k th� most appropriate. and the mosl C'lK",n!. m�OOdoIogies for multi'lemporal ""d multi_ yu. analysis of landscape .truetu • ., and lOCC tr�nd •. It II �xpected Ihal this joint Initiative bet""� ac"d�ml", prcvlncial and federal agende •. and non_governmental .... g"nl ... tion. will pi<l<'flOte the dev�t of standards for I"..."ge interprl!tatlon at the prcvln<:ial level u.lng emerging satellite platforms and Informal"'" already created by the province of Alberta. This paper preaents a ca ... study for tke FQ<t McMurt�y 'eglon.
, ..... .ad:
G. Mum S-..... ·Arol�if. Eatll> .nd AtmoIptoo,j{ S<ient'" tk�n1 U ........ "" of Alben.a [d"""" <>n, Albe<"lo, (.nod.> f6G 2El 11M)..t92·1122
71M)..t92·ZOlO
.rtum._"".'berU.c.o
"

Landscape fragmentation in Alberta through remote sensing
S. Shukla, G.A. Sanchez-Azofeifa, and S. Hannon
--- ... ---
The boreal forest, or taiga, is one of the largest terrestrial ecosystems on earth and covers a large area in Canada, Russia, and the Nordic countries. Growing
concerns over the loss of boreal forest has promoted the development of methods, using remote sensing and geographic information systems (GIS), to provide estimates of forest loss and the level of forest fragmentation of this fragile ecosystem. This paper is an attempt to study fragmentation of the boreal mixed-wood forest and intensity of land use in the agricultural area surrounding the Meanook Biological Station in central Alberta, Canada. This paper presents our efforts to measure major indicators of forest fragmentation using satellite images (Landsat Multispectral Scanner MSS, Landsat TM 5 and 7, and IRS 1 C and 1 D) in conjunction with existing 1 :20 000 vector coverages of access features in the landscape. Additionally, this paper explores the method of fusion between medium- to high-resolution remote sensing platforms such as Landsat 7 and IRS 1 C and 1 D to increase the spatial resolution of extracted landscape features. Final results are integrated into landscape metrics developed to quantify the pattern, structure, and- fragmentation in the study area. These metrics will be used to explain variation in bird community structure across the landscape. The results of this study can also be applied to other studies involving habitat fragmentation, land use and land cover changes, wildlife movement, forest fire suppression. and forest management programs. Additionally, we expect that methods developed by this research project will contribute to current international efforts aimed to understand land use/cover change processes worldwide.
Contact:
G. Arturo Sanchez-Azofeifa Earth and Atmospheric Sciences Department University of Alberta Edmonton, Alberta, Canada T6G 2E3 780-492-1822 780·492-2030 [email protected]
77
Use of geographic information systems in explaining avian responses to landscape structure and composition
s. Hannon and B. Olsen
--- /a. --
Geographic information systems (GIS) are useful tools for exploring birdhabitat relationships at different scales. We present information on the use
of GIS in two projects examining bird responses to logging. Raptors have large home ranges and hence may integrate patterns of habitat fragmentation over large scales (i.e., 1000s hal in choosing their home ranges and foraging sites, but they may also choose habitat on a small scale for nesting. We looked at three orders of habitat selection of the barred owl (Strix varia Barton) by plotting radio telemetry locations of tagged owls on GIS maps produced from digital Alberta Vegetation Inventory data using ArcInfo. Landscape structure and composition were determined using a spatial pattern analysis program for quantifying landscape structure (FRAGSTATS). We found that owls chose old forest at the home range and nest site scales but not at the foraging location scale, indicating that habitat selection varies by scale and behavior of the animal. Second, using a similar GIS platform, we quantified the response of songbirds (abundance, pr�sence/absence) to variation in landscape structure and composition and in response to different landscape disturbances (fire, logging) and land uses (e.g., agriculture). Birds were surveyed using point counts on four landscapes. Generalized linear models were run to characterize variables at the stand and landscape scale (within 100-, 250-, 500-, and 1000-m radii circles around points). Responses to landscape composition were species specific in terms of the scale of response and landscape configuration (or heterogeneity) did not explain much of the variation in species' responses. These results will help forest company planners to determine whether landscape level variables are important in planning for sustainable biodiversity in the forest.
Contact:
Susan Hannon Department of Biological Sciences University of Alberta Edmonton, Alberta, Canada T6G 2E9 780-492-7544 780-491-9234 [email protected]
78

La"d 111M' ."d owlOCrahLp Lnflu,""cC'$ 0" ." ... nc h"bLl"1 c .... dllLons
M. Win,
- .-
Tile declining .talu.oI P"dllc ... Imen popu"'tioru in the Pocllle f'Io<thweot has r�lylOd slgn!fkant ottention In recent )'Mrs. P"dflc ... lmon can no IorIgH be
found in about 40% d their hlSl<lfical b<ftding .. ""'" in the Pac!fk Northwest. In .� • .....- Inventofy Mill Ia bIOIng collected In "" .... tempt to capt....,. aq.,a llc habitat COfIditions "" ... lmonId popuI�tion. and tolncreaoe �nding d the proce$U>I and fDC:tOB that InfluMce habitDt qIIOIilY. With oubsI"ntlal rifort,
_ apotiolly ..,!ereneed " I"rge dolabase olaq""ti<; habi\.ot condJUonI fo< _.tern Oregon (7.6 million h,,) using .. geographic infonnallon Iystem (GIS). The database waS originally collected by Held survey c..,ws who �sed a proto<;ol deyeloped by the Oregon Departm<:nt of Fish .. nd Wildlife and wu origin .. lly in a tabular fonn .. l. Our Ift<! .. rch obj«tives Included "'�"Ing the abllily 01 the dalllbase 10 I) .elillbly describe aquatic hat>itat condi tions throughout ... .,.,l"m � . .. nd 2) dete"""'" the inHuen<:e 01 land ow....,""'", and land UK patterns on key lndlcDlors 01 """"tic habitat quallty. 0..... GIS dalllbase contains <111111 "" 3193 strum react>eo l(IIa�ng !1600 km in iHIgIh and .ep<esents one 01 the most cotTIpI"ehenaift. _tlaUyac<:u .. le rep<eoe .... tlon. of habitIIt condklons lor _st· em Oregon. "The _tial r"flHHlCIng enDbied us to add 1eYet" •• u""ble. to the datbbase that were critlc"l for our "".Iylll obI...:tiveo: geofogy. Weam ordM. and ownership. w., used lWO multiva"ate 'talistieal technlq ....... regrestbl tree .. naly . • Is and g"n" ... l lIn ..... model •. to tett tho InHuene" ot geomorphic. physical. and -o<:!eUl1 fac:1On on a set 01 key hablt .. t Indicators. Key habitat vart .. b�. Induded alream channel structu.e. pOOIl. lorjJfl woody debtl •. • Ipartan vegetation. and subst.ate composition. Our .esults found ihetgcomo<phic and land$ca"" qualrties d st..,,,mt ....,..., genera"y the rrmt influential fDClOfs In desc:.ibing k�y habit�t lndiulDrJ.. We found LIttI� support lor signifICant impacu on key IIabitlIt indica",,,, f""" IDnd owne<ship """ forested Iond tJSe patterns. Sireams that _� '-dered by lands \h.et f�fttured Dg.kulture. g •• zing. or ""al .... idenUat uses. however ... �re correla� with decreDsed DqU<ll'" hablUII conditions.
_lWlng _I � Pepotl"-' Ot-von St .. ,. U.w-..ity -.y_2U eor...II!t. 0._ I15A nUl SoII-1J1_
5<11-1)7")16
mkIIMI.wIr.g ...... ed"

Integrating remote sensing and geographic information systems for wetland and waterbird conservation in the western boreal
forest: Ducks Unlimited's Western Boreal Forest Initiative
AI. Richard, M. Gendron, S.A. Smyth, G.R. Stewart, and I.B. Pollard
--- la- ---
Western Boreal Forest (WBF) fens, marshes, riparian wetlands, shallow lakes, floodplains and deltas are among the most productive ecosystems on the
continent. In Canada, this 2.6 million km' ecosystem is second only to the Prairie Pothole Region in terms of waterfowluse. Millions of ducks, geese and other waterbirds, comprising approximately 40% of the waterfowl annually surveyed, are found breeding in boreal and taiga habitats of Alaska, the Canadian territories and the western Canadian provinces. Ducks Unlimited recognized the importance of the WBF in 1994 when it ranked this region number three in priority of the 26 most important, limiting and threatened habitat areas on the continent. In recent years, increased activity by forestry. oil and gas, hydroelectric, mining, agricultural and recreational interests has greatly expanded the potential for impacts on this forest ecosystem, the consequences of which remain largely unknown. Cumulative impacts also include regional climate change scenarios, altered fire frequency, and atmospheric deposition of pollutants. The WBF Initiative was established in 1997 to proactively build partnerships with industry, government agencies, universities, foundations, native groups, and others that share Ducks Unlimited's goal of protecting and sustaining these important boreal wetland ecosystems. This paper will present an overview of the WBF Initiative and the initial partnerships formed to carry out Thematic Mapper satellite imagery landcover mapping, water�bird survey inventories, water chemistry sampling, and integrating these and other datasets for analysis and modeling purposes throughout the western Canadian boreal forest ecosystem.
Contact:
AI Richard Ducks Unlimited Canada 200,1 0720 - 178 Street Edmonton, Alberta, Canada TSS 1J3 780·489-2002 780·489·1856 [email protected]
80

Ie hydrologic effects of geographic context
1. Sawatsky, and M. Bender
- >a- ---
lissioned to perform a review of the current )logic data for a Forest Management Area :I recommend an approach for estimating ring for the purpose of long-term harvest act were identified and modeling tools were ity to the specific FMA. Finally, an approach lning tools to be developed during future 'droiogic assessment framework, which had )hase of the study, Golder was tasked with trategic harvesting plans on an FMA basis. evaluates the forest management plan and
or harvesting to mitigate potential impacts, of harvesting. The assessment is based on
les and environmental endpoints. Hydrologic en generated for a river basin.