Embed Size (px)
Citation preview
University of VermontScholarWorks @ UVM
Graduate College Dissertations and Theses Dissertations and Theses
2018
Geochronological Constraints On The Timing OfDeformation: An Examination Of The ProspectRock Fault Footwall In North-Central VermontEvan TamUniversity of Vermont
Follow this and additional works at: https://scholarworks.uvm.edu/graddis
Part of the Geology Commons
This Thesis is brought to you for free and open access by the Dissertations and Theses at ScholarWorks @ UVM. It has been accepted for inclusion inGraduate College Dissertations and Theses by an authorized administrator of ScholarWorks @ UVM. For more information, please [email protected].
Recommended CitationTam, Evan, "Geochronological Constraints On The Timing Of Deformation: An Examination Of The Prospect Rock Fault Footwall InNorth-Central Vermont" (2018). Graduate College Dissertations and Theses. 940.https://scholarworks.uvm.edu/graddis/940
GEOCHRONOLOGICAL CONSTRAINTS ON THE TIMING OF DEFORMATION:
AN EXAMINATION OF THE PROSPECT ROCK FAULT FOOTWALL IN NORTH-
CENTRAL VERMONT
A Thesis Presented
by
Evan Tam
to
The Faculty of the Graduate College
of
The University of Vermont
In Partial Fulfillment of the Requirements
for the Degree of Master of Science
Specializing in Geology
October, 2018
Defense Date: June 14, 2018
Thesis Examination Committee:
Laura E. Webb, Ph.D., Advisor
Ehsan Ghazanfari, Ph.D., Chairperson
Keith A. Klepeis, Ph.D.
Cynthia J. Forehand, Ph.D., Dean of the Graduate College
ABSTRACT
The Prospect Rock Fault (PRF) is key to our understanding of the regional
tectonic evolution of Vermont during the Taconic, Salinic, and Acadian Orogenies, and
may have played an important role in the exhumation of blueschist and eclogite-facies
rocks in the Tillotson Peak Complex (TPC) during the Taconic Orogeny. The TPC is in
the footwall of the PRF in the eastern limb of the Green Mountain Anticlinorium. In the
TPC, the dominant foliation is S2 and E-W trending F2 folds parallel L2 stretching
lineations, which trend orthogonal to regional N-S trending folds associated with the
Taconic Orogeny. The PRF itself is folded by F2 folds. Presently, there is a lack of
consensus about the role of the PRF in the exhumation of the TPC, and studies have not
reconciled the formation of the E-W folds and lineations to a regional model.
Oriented samples and structural data were collected from the footwall of the
PRF over several transects. Samples were processed into orthogonal thin sections for
microstructural analyses and for 40Ar/39Ar step heating of white mica. The dominant
foliations in the PRF samples were identified through microstructural analysis and
correlating the age of deformation as S2 and S3. These were defined in thin section by
mica and quartz microlithons, and oriented mica grains. S1, and in some samples S2, are
locally preserved in some mica domains and albite/garnet inclusion trails. S4 appears as
crenulations of S3, with no significant new mineral crystallization. In the field, L2 and
L3 lineations are defined by mineral and quartz rods, and L4 lineations are defined as
intersection lineations on S2 surfaces.
40Ar/39Ar analyses yielded plateau ages ranging from 458.6 ± 2.0 Ma to 419.0 ±
2.4 Ma (1σ). The oldest plateau ages are just slightly younger, yet concordant, with
published and new 40Ar/39Ar ages from the TPC and come from the structurally highest
portions of the footwall in the northern part of the study area. Virtually all apparent age
spectra show age gradients. Results from this study suggest the PRF played a role in
exhumation of the TPC and ages obtained are closely aligned with deformation ages
constrained from 40Ar/39Ar dating in southern Quebec for the Taconic D2 and Salinian
D3 deformation. These dates may aid correlatation of ages and structures regionally and
further refining of tectonostratigraphic models describing southern Quebec and New
England.
ii
ACKNOWLEDGEMENTS
The completion of this thesis document is certainly the apex of my academic
career, but I would nowhere without the help and support of my mentors, friends, and
family. First, I wish to thank my advisor Dr. Laura Webb; I always felt encouraged to ask
more questions, and to come to you for help when I needed it. Your advice was always
encouraging, practical, and never stress-inducing in the least. I learnt many skills from
you in the lab, field, and at my desk. I am also thankful to my committee members Keith
Klepeis and Ehsan Ghazanfari for offering advice, helping my thesis evolve past my own
limits. I must also thank my mentors, Timothy Byrne and Will Ouimet, from my alma
matter at the University of Connecticut. Without your inspiration, I would no doubt be
elsewhere working on who knows what.
I also extend my thanks to members of our UVM geology department. I am proud
to have had such a reliable, and wisecracking lab partner in Cheyne Aiken. Your
thoughts, insights, and jokes have kept me safe and sane, in the field and the lab. Dan
Jones, thank you for teaching me new skills and offering a refreshing break when needed.
Keith Klepeis, Jon Kim, and Stephen Wright; thank you for teaching me new field skills
and about Vermont’s complex geology. Furthermore, many people traveled into the field
with Cheyne and I, including Hannah Blatchford, Beth Pidgeon, John Mark Brigham, Joe
Gonzales, and Suzanne Baldwin. Thank you for your support and insight from within the
wilderness of Vermont!
My experience would be completely different without my graduate peers from
the UVM geology department. I will miss working, grading, and complaining with you

iii
all. Special thanks go to Meagan Leduc, for your friend and for keeping me sane. Go buy
yourself some Monk of Underhill.
I also would like to thank my friends at Burlington Taiko and UVM Taiko. You
all gave me a space to be myself outside of the classroom, and it was fun to grow with
you and watch you all grow. I wish I had infinitely more time to spend with you all.
Special thanks to Stuart Paton – you taught me many skills that encompassed much more
than just playing a drum. I hope to see you all in the future.
Finally, and certainly not least, I would be nowhere without my family. I thank
my parents, William and Sandra, and my sister Karmen for being never-endingly
supporting. Finally, I owe an enormous amount of gratitude to Christine – thank you for
always pushing me to be my best self, even when I didn’t want to be. I cannot wait to see
what the future holds.
iv
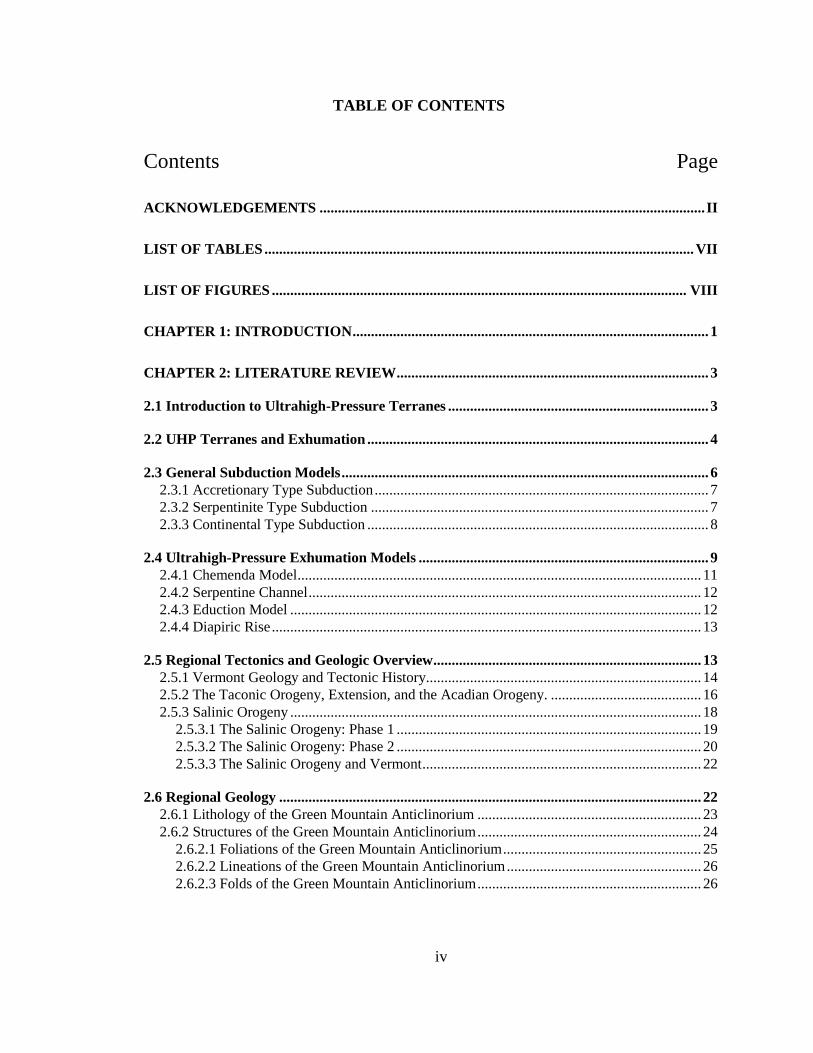
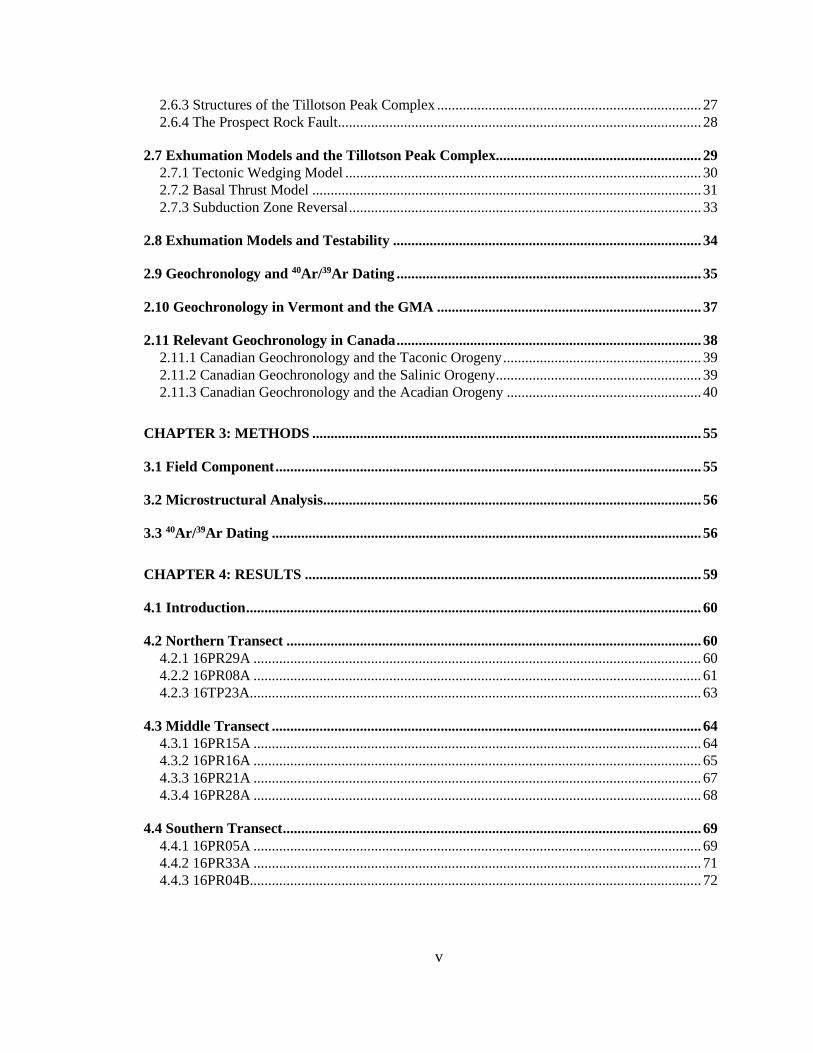
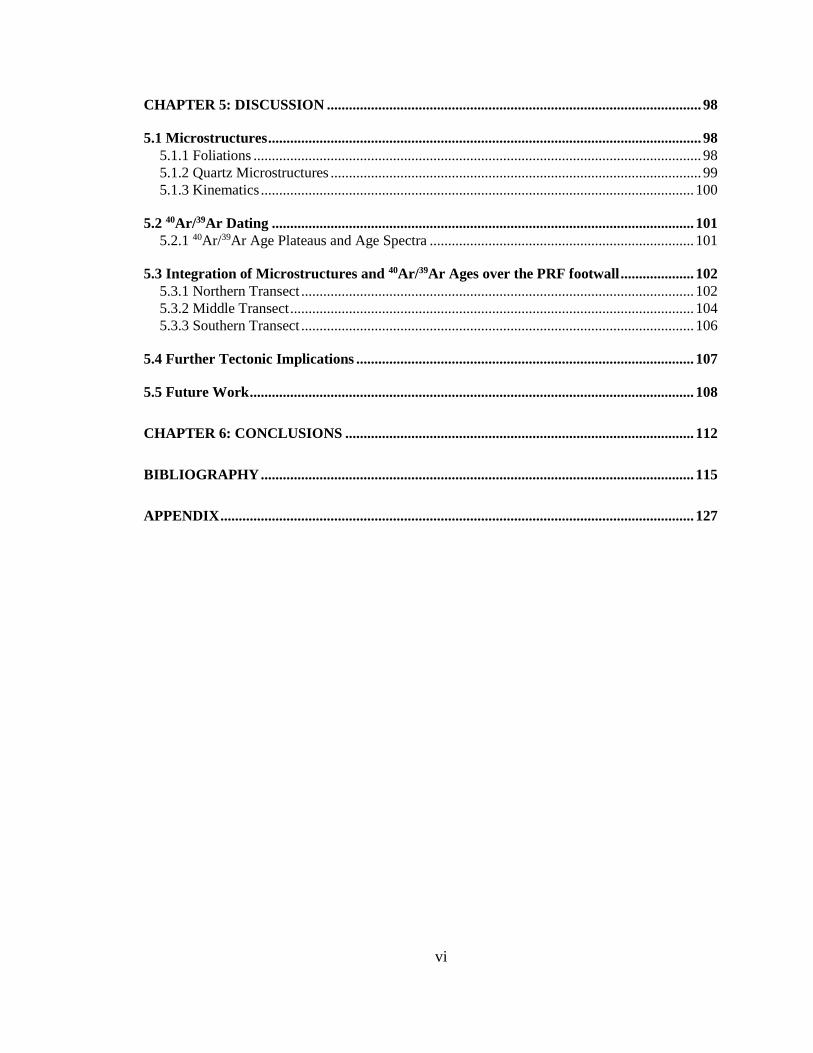
TABLE OF CONTENTS
Contents Page
ACKNOWLEDGEMENTS ......................................................................................................... II
LIST OF TABLES ..................................................................................................................... VII
LIST OF FIGURES ................................................................................................................. VIII
CHAPTER 1: INTRODUCTION ................................................................................................. 1
CHAPTER 2: LITERATURE REVIEW ..................................................................................... 3
2.1 Introduction to Ultrahigh-Pressure Terranes ....................................................................... 3
2.2 UHP Terranes and Exhumation ............................................................................................. 4
2.3 General Subduction Models .................................................................................................... 6
2.3.1 Accretionary Type Subduction ........................................................................................... 7
2.3.2 Serpentinite Type Subduction ............................................................................................ 7
2.3.3 Continental Type Subduction ............................................................................................. 8
2.4 Ultrahigh-Pressure Exhumation Models ............................................................................... 9
2.4.1 Chemenda Model .............................................................................................................. 11
2.4.2 Serpentine Channel ........................................................................................................... 12
2.4.3 Eduction Model ................................................................................................................ 12
2.4.4 Diapiric Rise ..................................................................................................................... 13
2.5 Regional Tectonics and Geologic Overview ......................................................................... 13
2.5.1 Vermont Geology and Tectonic History ........................................................................... 14
2.5.2 The Taconic Orogeny, Extension, and the Acadian Orogeny. ......................................... 16
2.5.3 Salinic Orogeny ................................................................................................................ 18
2.5.3.1 The Salinic Orogeny: Phase 1 ................................................................................... 19
2.5.3.2 The Salinic Orogeny: Phase 2 ................................................................................... 20
2.5.3.3 The Salinic Orogeny and Vermont ............................................................................ 22
2.6 Regional Geology ................................................................................................................... 22
2.6.1 Lithology of the Green Mountain Anticlinorium ............................................................. 23
2.6.2 Structures of the Green Mountain Anticlinorium ............................................................. 24
2.6.2.1 Foliations of the Green Mountain Anticlinorium ...................................................... 25
2.6.2.2 Lineations of the Green Mountain Anticlinorium ..................................................... 26
2.6.2.3 Folds of the Green Mountain Anticlinorium ............................................................. 26
v
2.6.3 Structures of the Tillotson Peak Complex ........................................................................ 27
2.6.4 The Prospect Rock Fault ................................................................................................... 28
2.7 Exhumation Models and the Tillotson Peak Complex........................................................ 29
2.7.1 Tectonic Wedging Model ................................................................................................. 30
2.7.2 Basal Thrust Model .......................................................................................................... 31
2.7.3 Subduction Zone Reversal ................................................................................................ 33
2.8 Exhumation Models and Testability .................................................................................... 34
2.9 Geochronology and 40Ar/39Ar Dating ................................................................................... 35
2.10 Geochronology in Vermont and the GMA ........................................................................ 37
2.11 Relevant Geochronology in Canada ................................................................................... 38
2.11.1 Canadian Geochronology and the Taconic Orogeny ...................................................... 39
2.11.2 Canadian Geochronology and the Salinic Orogeny ........................................................ 39
2.11.3 Canadian Geochronology and the Acadian Orogeny ..................................................... 40
CHAPTER 3: METHODS .......................................................................................................... 55
3.1 Field Component .................................................................................................................... 55
3.2 Microstructural Analysis ....................................................................................................... 56
3.3 40Ar/39Ar Dating ..................................................................................................................... 56
CHAPTER 4: RESULTS ............................................................................................................ 59
4.1 Introduction ............................................................................................................................ 60
4.2 Northern Transect ................................................................................................................. 60
4.2.1 16PR29A .......................................................................................................................... 60
4.2.2 16PR08A .......................................................................................................................... 61
4.2.3 16TP23A ........................................................................................................................... 63
4.3 Middle Transect ..................................................................................................................... 64
4.3.1 16PR15A .......................................................................................................................... 64
4.3.2 16PR16A .......................................................................................................................... 65
4.3.3 16PR21A .......................................................................................................................... 67
4.3.4 16PR28A .......................................................................................................................... 68
4.4 Southern Transect .................................................................................................................. 69
4.4.1 16PR05A .......................................................................................................................... 69
4.4.2 16PR33A .......................................................................................................................... 71
4.4.3 16PR04B ........................................................................................................................... 72
vi
CHAPTER 5: DISCUSSION ...................................................................................................... 98
5.1 Microstructures ...................................................................................................................... 98
5.1.1 Foliations .......................................................................................................................... 98
5.1.2 Quartz Microstructures ..................................................................................................... 99
5.1.3 Kinematics ...................................................................................................................... 100
5.2 40Ar/39Ar Dating ................................................................................................................... 101
5.2.1 40Ar/39Ar Age Plateaus and Age Spectra ........................................................................ 101
5.3 Integration of Microstructures and 40Ar/39Ar Ages over the PRF footwall .................... 102
5.3.1 Northern Transect ........................................................................................................... 102
5.3.2 Middle Transect .............................................................................................................. 104
5.3.3 Southern Transect ........................................................................................................... 106
5.4 Further Tectonic Implications ............................................................................................ 107
5.5 Future Work ......................................................................................................................... 108
CHAPTER 6: CONCLUSIONS ............................................................................................... 112
BIBLIOGRAPHY ...................................................................................................................... 115
APPENDIX ................................................................................................................................. 127
vii
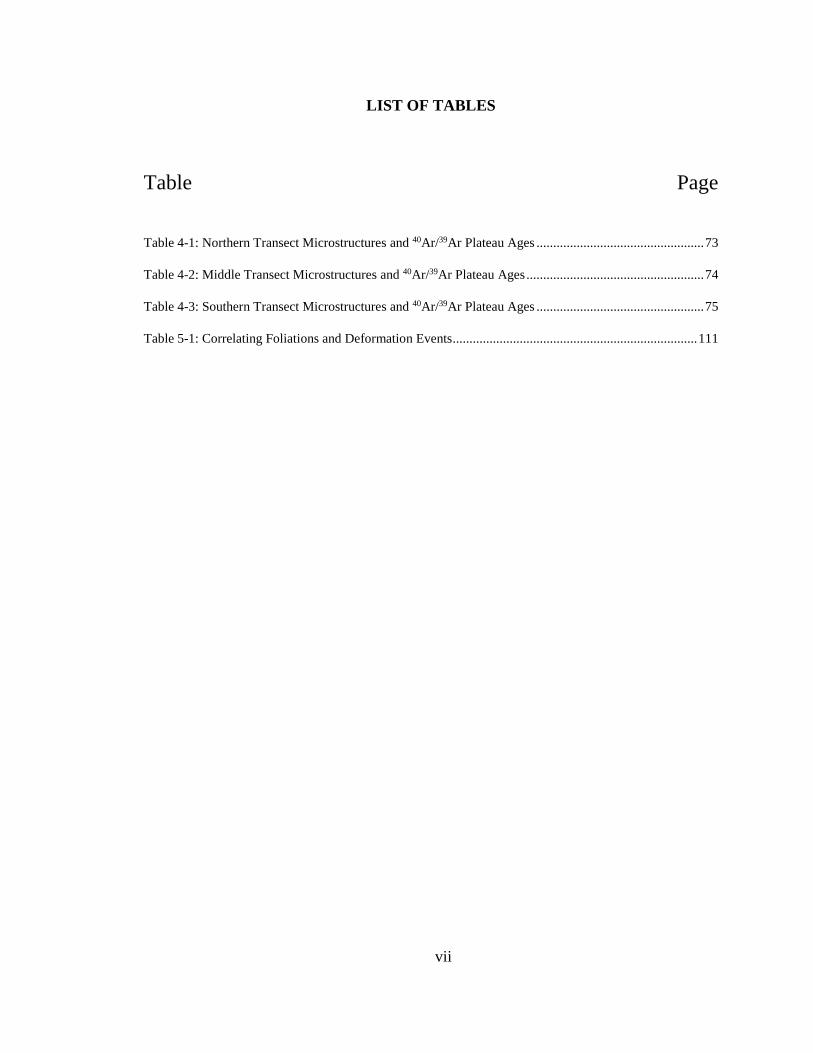
LIST OF TABLES
Table Page
Table 4-1: Northern Transect Microstructures and 40Ar/39Ar Plateau Ages .................................................. 73
Table 4-2: Middle Transect Microstructures and 40Ar/39Ar Plateau Ages ..................................................... 74
Table 4-3: Southern Transect Microstructures and 40Ar/39Ar Plateau Ages .................................................. 75
Table 5-1: Correlating Foliations and Deformation Events......................................................................... 111
viii
LIST OF FIGURES
Figure Page Figure 2-1: Context Map of Vermont, and Lithotectonic Slices ................................................................... 42 Figure 2-2: Geologic Map of the Prospect Rock Fault and Surrounding Areas ............................................ 43 Figure 2-3: Mineral Forms and Temperature, Depth, and Pressure. ............................................................. 44 Figure 2-4: Chemenda Model Exhumation ................................................................................................... 45 Figure 2-5: Serpentinite Model Exhumation. ................................................................................................ 46 Figure 2-6: Eduction Exhumation ................................................................................................................. 47 Figure 2-7: Diapir Rise Exhumation. ............................................................................................................ 47 Figure 2-8: Laurentian Rifting and the Iapetus Ocean .................................................................................. 48 Figure 2-9: The Taconic Orogeny ................................................................................................................. 48 Figure 2-10: The Salinic Orogeny ................................................................................................................. 49 Figure 2-11: Salinic Extension and the Acadian Orogeny. ........................................................................... 49 Figure 2-12: Cross Section of the Prospect Rock Fault and Surrounding Structures .................................... 50 Figure 2-13: Tectonic Wedging Model (Lamon, 2001) ................................................................................ 51 Figure 2-14: Basal Thrust Model (Thompson and Thompson, 2003) ........................................................... 51 Figure 2-15: Eduction and the Prospect Rock Fault. ..................................................................................... 52 Figure 2-16: 40Ar/39Ar Dating Spectra ........................................................................................................... 53
Figure 2-17: Geologic Map of New England and the Gaspe Peninsula ........................................................ 54
Figure 3-1: Strain Ellipsoids .......................................................................................................................... 60
Figure 4-1: Photomicrograph of Sample 16PR29A....................................................................................... 76 Figure 4-2: 40Ar/39Ar Apparent Age Spectra of Sample 16PR29A ............................................................... 77 Figure 4-3: Photomicrographs of Sample 16PR08A ..................................................................................... 78 Figure 4-4 : 40Ar/39Ar apparent age spectra of sample 16PR08A. ................................................................. 79 Figure 4-5: Photomicrographs of Sample 16TP23A.. ............................................................................. 80, 81 Figure 4-6: 40Ar/39Ar apparent age spectra of sample 16TP23A ................................................................... 82 Figure 4-7: Photomicrographs of Sample 16PR15A.. ................................................................................... 83 Figure 4-8: Apparent 40Ar/39Ar apparent age spectra of sample 16PR15A ................................................... 84 Figure 4-9: Photomicrographs of Sample 16PR16A ..................................................................................... 85 Figure 4-10: Apparent 40Ar/39Ar apparent age spectra of sample 16PR16A ................................................. 86 Figure 4-11: Photomicrographs of Sample 16PR21A ................................................................................... 87 Figure 4-12: Apparent 40Ar/39Ar apparent age spectra of sample 16PR21A ................................................. 88 Figure 4-13: Photomicrographs of Sample 16PR28A. .................................................................................. 89 Figure 4-14: Apparent 40Ar/39Ar apparent age spectra of sample 16PR28A ................................................. 90 Figure 4-15: Photomicrographs of Sample 16PR05A. .................................................................................. 91 Figure 4-16: 40Ar/39Ar apparent age spectra of sample 16PR05A, aliquot 1 ................................................. 92 Figure 4-17: 40Ar/39Ar apparent age spectra of sample 16PR05A, aliquot 2 ................................................. 93 Figure 4-18: Photomicrographs of Sample 16PR33A. .................................................................................. 94 Figure 4-19: Apparent 40Ar/39Ar apparent age spectra of sample 16PR33A ................................................. 95 Figure 4-20: Photomicrographs of Sample 16PR04B ................................................................................... 96 Figure 4-21: An apparent 40Ar/39Ar apparent age spectra of sample 16PR04B ............................................ 97
1
Chapter 1: Introduction
This study examines rocks of northern Vermont (Figure 2-1), specifically the
footwall of the Prospect Rock Fault, which are within the Green Mountain Anticlinorium
(GMA, Figure 2-2). Rocks exposed in the GMA were deformed and metamorphosed
during the Taconic Orogeny, which lasted from ~470–460 Ma (Stanley and Ratcliffe,
1985; Karabinos et al, 1998). East-dipping subduction (present-day coordinates) of
oceanic lithosphere in the Iapetus Ocean formed a series of island arcs which ultimately
collided with the proto-North American continent, accreting basin and rift sediments,
ophiolites, and the island arcs themselves were accreted onto the continental margin as
tectonic slices (Stanley and Ratcliffe, 1985; Karabinos et al., 1998).
The Tillotson Peak Complex (TPC) is juxtaposed with the eastern limb of the
GMA and is known to preserve blueschist and eclogite-facies rocks that record high-
pressure (HP) metamorphism in a subduction zone setting (Laird and Albee, 1981).
Recent studies on the TPC in northern Vermont have suggested peak metamorphic
pressures of 2.5 GPa, approaching ultrahigh-pressure (UHP) metamorphic conditions
(Honsberger, 2015). UHP terranes are subducted to and exhumed from depths of 90–150
km or more (Ernst, 1997; Dobrzhinetskaya, 2011). Over 20 locales have been recognized
globally since the discovery of UHP terranes in 1984 (Chopin, 1984; Hacker et al., 2013).
Rapid exhumation of HP–UHP terranes must occur, or retrograde deformation and
metamorphic reactions may obscure earlier signs of the subduction-exhumation history
(Hacker, 2013). Though structural mapping and limited dating studies have been
performed on the TPC (Laird et al., 1984; Bothner and Laird, 1999), the timing of peak
2
metamorphism, exhumation, and kinematics for the TPC have not been examined in
depth. However, several studies have examined the Prospect Rock Fault (PRF) (Lamon,
2001; Thompson and Thompson, 2003; Castonguay et al., 2011), which contains the TPC
in its footwall.
Interpreting data from 40Ar/39Ar dating and microstructural analysis for the PRF
and the TPC may impact our current understanding of exhumation models for the TPC,
and for the broader local tectonic setting. Contrasting models detailing the evolution of
the PRF have been proposed (Lamon 2001; Thompson and Thompson 2003), suggesting
different methods of exhumation for the TPC. The presence of the TPC in Vermont
affects local tectonic models, as they must account for the conditions needed to produce
and preserve a (U)HP terrane. Breakthroughs on an exhumation model may have
implications for regional tectonics, as studies have shown that the geology of Vermont,
southern Quebec, and other regions of New England represent different structural levels
of the Taconic orogeny (Castonaguay et al., 2011).
This study integrates microstructural analysis and 40Ar/39Ar geochronology with
the goal of constraining the timing of deformation in the footwall of the PRF. It is a
companion project with a coeval study of the TPC (Aiken, MS thesis in preparation).
Together, these data provide new findings that must be taken into account by exhumation
models and provide new insights into the local tectonic history. The following literature
review will introduce topics relevant to (U)HP exhumation, the geologic setting of the
Green Mountain Anticlinorium, proposed exhumation models utilizing the PRF, and the
use of geochronology in Vermont and Canada.
3
Chapter 2: Literature Review
2.1 Introduction to Ultrahigh-Pressure Terranes
Ultrahigh-pressure (UHP) rocks are formed when continental crust is subducted to
depths of 90 km and deeper (Ernst, 1997; Dobrzhinetskaya, 2011), bearing minerals such
as coesite and microdiamond formed under these conditions (Chopin, 1984; Smith,
1984). Exhumation of these rocks from depth must occur at tectonic rates, or overprinting
of UHP indicator minerals and structures occur (Hacker, 2013). Over 20 UHP terranes
have been identified globally (Liou et al., 2004), and many models, both hypothetical and
confirmed, have been created to delineate the rapid exhumation of these unique terranes
(Hacker et al., 2013 a; Hacker et al., 2013 b; Guilot et al 2009).
Recent studies on the Tillotson Peak Complex (TPC) in north central Vermont
(Figure 2-1, 2-2) have suggested peak metamorphic pressures of 2.5 GPa, approaching
UHP metamorphic conditions (Honsberger, 2015). Though structural mapping and
limited dating studies have been performed on the TPC (Laird and Albee, 1981; Bothner
and Laird, 1999), timing of peak metamorphism, exhumation, and kinematics for the TPC
have not been examined in depth. However, several studies have examined the Prospect
Rock Fault (PRF) (Lamon, 2001; Thompson and Thompson, 2003; Castonguay et al.,
2011), which contains the TPC in its footwall as a part of the Green Mountain
Anticlinorium (GMA).
The PRF has been described as both the western limit of the Taconic accretionary
complex (Thompson and Thompson, 2003), and as a roof-thrust during tectonic wedging
4
(Lamon, 2001), but studies have not investigated the PRF’s role specifically in the
exhumation of the TPC, nor have they placed direct quantitative constraints on the timing
of deformation. High-strain folds in the TPC are oriented E-W and parallel stretching
lineations, which all run orthogonal to regional N-S trending folds associated with the
Taconic and Acadian Orogeny (Thompson et al., 1999; Thompson and Thompson, 2003,
Figure 2-2). Features found in the footwall of the PRF, and in some locations even the
PRF itself, also exhibit E-W trending folds (Thompson et al., 1999; Thompson and
Thompson, 2003; Lamon, 2001).
This study aims to constrain the tectonic significance of the PRF and its role in
the exhumation of high-pressure rocks of the TPC. Results of this study will aid in
constraining an appropriate exhumation model through its investigation of structural
features as observed in the field, microstructural indicators of kinematics and
temperatures of cooling and deformation, and 40Ar/39Ar dating to aid in determining a P-
T-t-D gradient along the footwall. This literature review will cover topics integral to this
study, including 1) current understanding of UHP exhumation 2) the geologic and
tectonic evolution of the GMA, which includes the PRF and the TPC, 3) exhumation
models, and their relevance to this study, and 4) a summary of geochronology and its use
in this study.
2.2 HP–UHP Terranes and Exhumation
Eclogite facies rocks have been reported since 1822 (Hauy, 1822), and were
thought to have undergone subduction to great depths prior to exhumation (Compagnoni
5
and Maeffo, 1973; Carswell, 1990). With the discovery of coesite in metamorphic rocks
by Smith (1984) and Chopin (1984), UHP metamorphism was introduced to the scientific
community, demonstrating that continental crust could be subducted to depths of 90km
and greater (Figure 2-3). This unusual discovery also lead to the prevailing assumption
that UHP rocks must be exhumed at plate tectonic rates in order to avoid metamorphic
overprinting, which would erase evidence of minerals formed by metamorphism at these
depths (Guillot et al., 2009). Pelitic rocks metamorphosed under eclogite conditions have
also been discovered (Compagnoni and Maeffo, 1973; Carswell, 1990). Since the
discovery of coesite and microdiamond, over UHP 20 terranes have been identified
worldwide (Liou et al., 2004). As of 2009, the oldest UHP unit has been dated at 620 Ma
(Caby, 1994; Jahn et al., 2001), and the youngest at ~7 Ma (Monteleone et al., 2007).
UHP metamorphism is associated with subduction zones, as they provide a
pathway for exhumation through which rock units can return to the surface without
exceeding the temperatures (<800⁰) associated with UHP terranes (Hacker et al., 2013a).
Studies have been hampered by common overprinting that erase structures and minerals
formed at depth by UHP metamorphism. As a result, many numerical and theoretical
models have been examined to better understand the implications of different exhumation
pathways.
Pressure-temperature-time-depth (P-T-t-D) paths are used to investigate
conditions experienced by UHP terranes during subduction and exhumation (Duchene et
al., 1997). Kinematic analysis and metamorphic dating of HP–UHP rock units help to
more precisely constrain the mechanisms of exhumation. Numerical modeling has also
6
been used to simulate exhumation under specific conditions, creating models that
correlate to real world UHP terranes (Hacker et al., 2013a).
Analysis of HP–UHP terranes is hindered by complications inherent to the
terranes. Metamorphic rocks frequently have undergone multiple deformational events,
making it difficult to date minerals without producing mixed ages. Additionally, isotopic
systems are often used to date rock terranes, but these dates record the time of isotopic
closure rather than the timing of formation (Rubatto and Hermann, 2001). These
problems must be kept in mind while examining terranes.
2.3 General Subduction Models
Guillot et al. (2009) suggest that exhumation events occur during a perturbation to
a subduction zone. Disturbances such as a change in subduction velocity, change in
subduction angle, or docking of a seamount, arc, or continental block may result in UHP
exhumation. As such, UHP exhumation models are dependent on the variables introduced
by a given subduction zone. Differences in the subducting protolith, boundary
mechanisms, flow pathways, and overall subduction geometry can in turn influence the
exhumation velocity, rock buoyancy, boundary forces, and return flow (Guillot et al.,
2009).
Based on the examination of more than 60 HP–UHP units, Guillot et al. (2009)
has described three different subduction models which are summarized below:
accretionary-type subduction, serpentinite-type subduction, and continental-type
subduction. The listed subduction types can coexist within a single subduction zone, and
7
examples of this have been found globally. Type of subduction zone(s) imply different
settings that may influence how HP–UHP terrane exhumation occurs.
2.3.1 Accretionary Type Subduction
Accretionary-type subduction zones develop in convergent margins, between
intra-oceanic arcs or oceanic-continental convergent. As an oceanic arc subducts beneath
a second plate, oceanic sediments are stacked as they are scraped off the subducting plate,
forming an accretionary wedge. Accretionary wedges can reach 40–60 km in thickness in
extreme cases, though are more typically found to be around 20 km.
The geometry of the accretionary wedge itself depends heavily on the geometry of
the non-subducting plate, which acts as a backstop against which the wedge pushes
against and forms. Numerical models have shown how the wedge shape and
metamorphic pressures within it are altered depending on the shape of the backstop
(Beaumont et al., 1999; Yamato et al., 2007). This geometry affects how deeply
sediments can be subducted, and how likely subducted sediments could return to the
surface to be exhumed. More than 20 HP–UHP massifs globally have been identified as
having formed through this style of subduction (Tsujimori et al., 2006; Agard et al.,
2008). Accretionary type subduction is more heavily associated with HP exhumation
(Guillot et al., 2009).
2.3.2 Serpentinite-Type Subduction Complexes
Serpentinites are frequently found with HP-LT rocks, and have been interpreted
as parts of oceanic lithosphere. Examinations from 18 serpentinite–type subduction
8
complexes suggest origins from subducted oceanic plates, though an exception exists as a
serpentinite diapir found in the Izu-Bonin Arc (Ueda et al., 2004). Initial geometries of
serpentinite-type subduction complexes are difficult to understand, as contacts between
serpentinized units are generally unrecognizable. However, serpentine mineral properties
cause them to be highly ductile, and act as lubricants on subduction planes.
Serpentine minerals can contain up to 13 wt% water, and host fluid mobile
elements in deep subduction zones (Schmidt and Poli, 1998; Hattori and Guillot, 2007).
They are stable down to depths of 150–170km (Ulmer and Trommsdorf), and have low
density (2600 kg/m3) and low viscosity (4.1019 Pas), a high poisson ratio, and a low shear
modulus (Moore and Lockner, 2007; Reynard et al., 2007; Hilariret et al., 2007). With
these properties serpentines are highly ductile at shallow depths, allowing easier
exhumation by acting as a lubricant between the two subduction planes (Guillot et al,
2001).
Calculated exhumation velocities in serpentinite-type subduction complexes
have varied between 3 to 10 mm yr-1. Exhumed units are highly dominated by sheared
serpentinites, with additional rock units contained within. Deformed units can vary from
kilometers to centimeters in size. Studies on exhumed eclogite blocks in these types of
subduction complexes have shown pressures of between 1.8–2.5 GPa, with a few locales
with higher pressures of 3.2 and 4.0 GPa.
2.3.3 Continental Type Subduction
Continental type subduction occurs with the subduction of continental crust
down to depths of over 90 km. The discovery of coesite indicated to the scientific
9
community that subduction of continental crust was a possibility (Chopin, 1984; Smith,
1984). During subduction of continental crust, positive buoyancy and thickness prevent
the entirety of the lithosphere from entering the subduction zone. Buoyancy of subducted
continental crust relative to the mantle when subducted also aids in the terrane’s
exhumation from depth (Chemenda et al., 1995; Ernst, 2006).
In the Himalayas, subducting continental lithosphere has been shown to separate
from itself and stack as nappes, building the high topography of the Himalayas (Guillot et
al., 2003). UHP rocks from continental style subduction are mostly granite gneiss and
metasedimentary rocks in origins, with some mafic plutons from intrusions prior to
subduction. Exhumed terrane sizes vary wildly in size, ranging from 25km2 to over
50,000km2. Exhumation velocities are estimated to be faster than 6 mm yr-1.
UHP minerals are only locally preserved in continental type subduction, and
evidence of these conditions are found locally in lenses or as relics in other minerals.
Regardless, their presence indicates that rapid exhumation, rapid cooling during
decompression, and little deformation must have occurred during exhumation, in addition
to fluid absent conditions.
2.4 Ultrahigh-Pressure Exhumation Models
As noted above, the formation of UHP terranes require the subduction of a
protolith to great depths in a subduction zone, and rapid return of the terrane back to the
surface. Various UHP terrane exhumation models have been proposed, but can vary
10
greatly due to the variables that control exhumation details, such as tectonic settings and
buoyancy.
Plate tectonics lay a foundation for each exhumation model, creating collisional
regimes, subducting proto-UHP terranes, and creating a geometric framework utilized
during exhumation. Colliding plates allow for the proto-UHP terranes to be subducted
down to depths sufficient for UHP metamorphism. Once there, the geometry of the
subduction zone can influence material flow and flow pathways within the subduction
channel. Steep subduction angles are also necessary to subduct and exhume terranes to
depths necessary for their formation (Guillot et al., 2009). Exhumation can be greatly
enhanced by initial geometry (Guillot et al., 2009), as gentle subduction angles may
prevent subduction and exhumation to and from appropriate depths (Guillot et al., 2008),
whereas steeper angles may allow for subduction to depths of 200–300 km (Negredo et
al., 2007).
Buoyancy is also a driving force in exhumation, as it brings subducted terranes
back to the surface through the subduction channel. Buoyancy can be determined by the
lithology of the subducted terrane, when compared to its surrounding materials. Phase
transformations due to pressure and temperature changes attending subduction and
exhumation impact buoyancy (Hacker et al., 2013b).
A weak subduction channel may also be necessary in some models to aid for
exhumation. Models examining the exhumation of continental rocks rely less heavily on
a weak subduction channel, as buoyancy of continental rocks can be considered sufficient
for their exhumation (Chemenda et al., 1995, Ernst 2006). Subducting slabs during
11
progressive metamorphism can release fluids, facilitating the lubrication of subduction
planes. Release of fluids can also aid in the formation of weak metamorphic minerals,
such as lawsonite and phengite (Stockert and Renner, 1998). High strain shear zones can
form using these weak minerals, and can surround and preserve pockets of HP/UHP
mineral assemblages during exhumation. Models by Gorczyk et al. (2007) indicate that
hydration of the mantle wedge can ultimately lead to slab retreat and exhumation of UHP
mafic rocks subducted to depths of 100-150kms.
Comparison of different exhumation models can aid in evaluating the
exhumational and tectonic history of a given terrane. P-T-t-D paths within a model imply
patterns that should appear in the structural geology, petrology, and geochronology of an
exhumed rock terrane. Field structures, microstructures, bulk composition, and ages for a
given terrane can help in understanding a locale’s tectonic history.
2.4.1 Chemenda Model
The Chemenda Model, from Chemenda et al. (1995) demonstrates the subduction
and exhumation of a large, coherent crustal slice, and remains a frequently utilized
exhumation model for UHP terranes (Hacker et al., 2013; Figure 2-4). Continental
lithosphere is subducted to depth in the subduction zone, where its buoyancy creates large
deviatoric stresses that causes brittle or plastic failure. The continental slab detaches from
the subducting lithosphere, where it is bound by a thrust fault below and a normal fault
above it. The slab is thrust towards the surface along a shear zone. The exhumation of
this slice can be extremely rapid, within 0.2 My (Sizova et al., 2012).
12
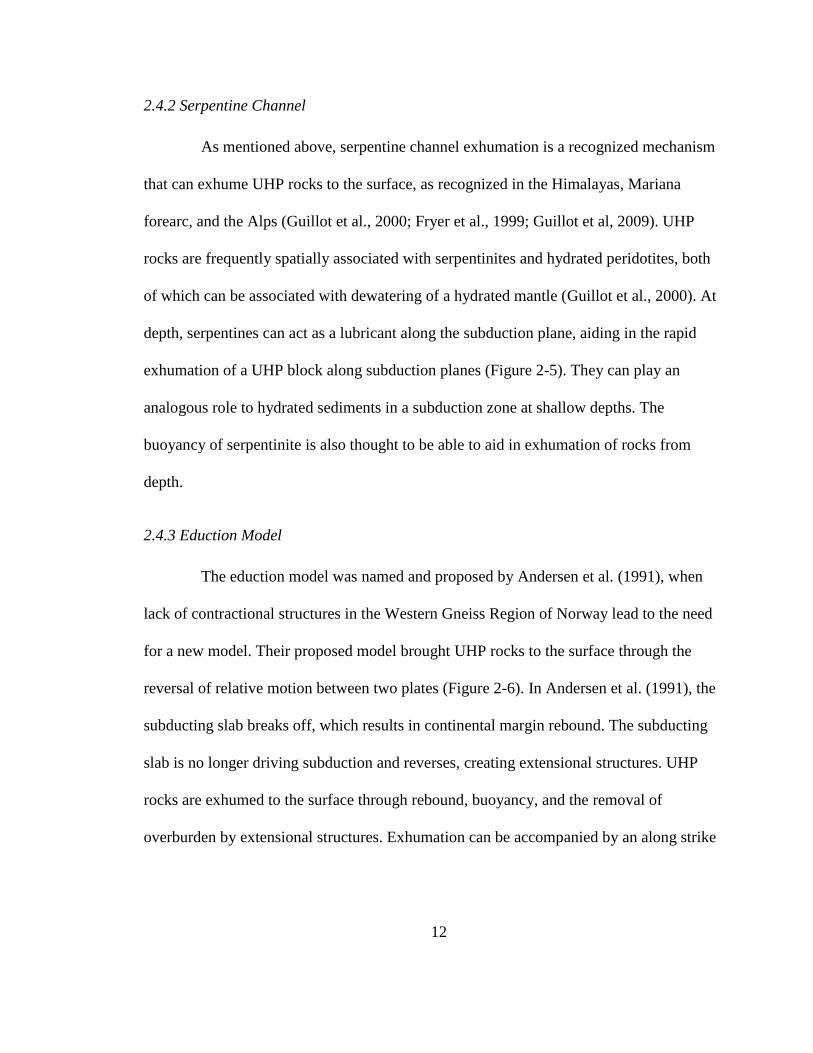
2.4.2 Serpentine Channel
As mentioned above, serpentine channel exhumation is a recognized mechanism
that can exhume UHP rocks to the surface, as recognized in the Himalayas, Mariana
forearc, and the Alps (Guillot et al., 2000; Fryer et al., 1999; Guillot et al, 2009). UHP
rocks are frequently spatially associated with serpentinites and hydrated peridotites, both
of which can be associated with dewatering of a hydrated mantle (Guillot et al., 2000). At
depth, serpentines can act as a lubricant along the subduction plane, aiding in the rapid
exhumation of a UHP block along subduction planes (Figure 2-5). They can play an
analogous role to hydrated sediments in a subduction zone at shallow depths. The
buoyancy of serpentinite is also thought to be able to aid in exhumation of rocks from
depth.
2.4.3 Eduction Model
The eduction model was named and proposed by Andersen et al. (1991), when
lack of contractional structures in the Western Gneiss Region of Norway lead to the need
for a new model. Their proposed model brought UHP rocks to the surface through the
reversal of relative motion between two plates (Figure 2-6). In Andersen et al. (1991), the
subducting slab breaks off, which results in continental margin rebound. The subducting
slab is no longer driving subduction and reverses, creating extensional structures. UHP
rocks are exhumed to the surface through rebound, buoyancy, and the removal of
overburden by extensional structures. Exhumation can be accompanied by an along strike
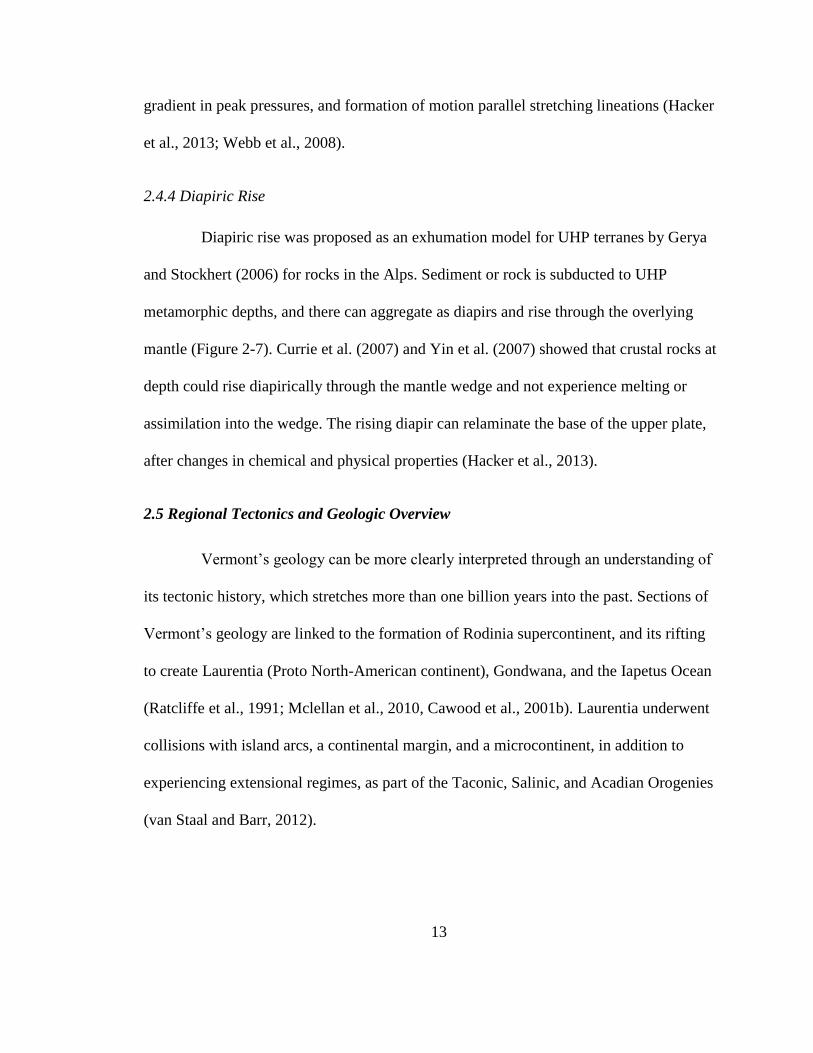
13
gradient in peak pressures, and formation of motion parallel stretching lineations (Hacker
et al., 2013; Webb et al., 2008).
2.4.4 Diapiric Rise
Diapiric rise was proposed as an exhumation model for UHP terranes by Gerya
and Stockhert (2006) for rocks in the Alps. Sediment or rock is subducted to UHP
metamorphic depths, and there can aggregate as diapirs and rise through the overlying
mantle (Figure 2-7). Currie et al. (2007) and Yin et al. (2007) showed that crustal rocks at
depth could rise diapirically through the mantle wedge and not experience melting or
assimilation into the wedge. The rising diapir can relaminate the base of the upper plate,
after changes in chemical and physical properties (Hacker et al., 2013).
2.5 Regional Tectonics and Geologic Overview
Vermont’s geology can be more clearly interpreted through an understanding of
its tectonic history, which stretches more than one billion years into the past. Sections of
Vermont’s geology are linked to the formation of Rodinia supercontinent, and its rifting
to create Laurentia (Proto North-American continent), Gondwana, and the Iapetus Ocean
(Ratcliffe et al., 1991; Mclellan et al., 2010, Cawood et al., 2001b). Laurentia underwent
collisions with island arcs, a continental margin, and a microcontinent, in addition to
experiencing extensional regimes, as part of the Taconic, Salinic, and Acadian Orogenies
(van Staal and Barr, 2012).
14
2.5.1 Vermont Geology and Tectonic History
The geology of Vermont can be subdivided in six lithotectonic slices, with each
slice representing a different period in Vermont’s tectonic history (Stanley and Ratcliffe,
1985). These slices include the Grenvillian Basement, the Carbonate Platform, the
Taconic Allochthon, the Green Mountain Slice, the Rowe Hawley Belt, and the
Connecticut Valley Gaspé Trough (Figure 2-2). Everything from the rock types found in
each province to the smallest microstructures found in in samples has been influenced by
its tectonic history.
Rocks associated with the Grenvillian Basement can be found in southern
Vermont. Rocks within this province are interpreted as exposures of North American
continental crust (representing Rodinia), which are much older than the rocks of the
Green Mountains. Sections of Vermont’s basement rocks are dated to have formed at
ages up to 1.35 Ga as a part of the Grenville orogeny (Ratcliffe et al., 1991; Mclellan et
al., 2010). Mineral and whole-rock dates of these basement rocks exceed 900 Ma.
Basement rocks are typically granitic gneiss, and are unconformably overlain by clastic
sequences. (Naylor, 1976; Stanley and Ratcliffe, 1985).
Rocks found in Vermont’s Carbonate Platform are related to early rifting of
Rodinia. Iapetan rifting commenced ca. 570 with separation of Rodinia into Gondwana
and Laurentia. A second rifting phase of further blocks off Laurentia occurred from ca.
540–535 Ma, establishing a passive margin sequence that can be recognized throughout
the Appalachians. Extension and rifting was also accompanied by magmatic activity,
manifest in dikes and plutons (Cawood et al., 2001 a). The creation of a passive margin,
15
followed by a foreland basin allowed for the accumulation of carbonate sediments. These
sediments would the marbles and dolomites of the carbonate platform (Cawood et al.,
2001 b; Rodgers 1968).
Rocks associated with the Taconic Allochthons, the Green Mountain Slice, and
the Rowe-Hawley Belt are interpreted to have been deformed during the Taconic
Orogeny. During this event, oceanic sediments were scraped up and accreted onto the
Laurentian Margin due to the collision between the Laurentian Continent and an
incoming island arc, lasting from between ~470–460 Ma (Stanley and Ratcliffe, 1985;
Karabinos et al, 1998).
Rocks in the Connecticut Valley Gaspé Trough (CVGT) are associated with a
period of extensional tectonics that occurred after the Taconic orogeny. Like with the
formation of the Carbonate Platform, extension lead to thinning of the lithosphere,
subsidence, and the formation of basins. These factors encouraged the flow of sediments
into the low basin areas during rifting, eventually lithifying into sedimentary and meta-
sedimentary rocks (Hepburn, 1991; Slack, 1994; Karabinos, 1998; Karabinos and others,
1998; Slack and others, 2001).
The rocks in Vermont are also affected by a later mountain building event called
the Acadian orogeny. Evidence of volcanic activity is present in eastern Vermont and
New Hampshire suggesting that subduction after the Taconic orogeny had continued to
the east (Rankin et al., 2007). After the oceanic crust of the Iapetus ocean was consumed
by subduction, the Laurentian continent collided with the Avalonian microcontinent (van
Staal and Barr, 2012). This collision is interpreted to have deformed and/or reactivated
16
pre-existing structures, such as the folding of the Burgess Branch Fault Zone (Kim et al.,
2003). This event is associated with much of the north-south trending structures in
Vermont.
2.5.2 The Taconic Orogeny, Extension, and the Acadian Orogeny.
One of Vermont’s defining features, its multitude of mountains, are attributed to
the Taconic Orogeny and the Acadian Orogeny as mentioned above. The first of the two
orogenies is documented as a collision between the Laurentian continent and the
Shelburne Falls island arc (Karabinos et al., 1998).
Off the coast of Laurentia, the formation of an east dipping subduction zone
(relative to present day coordinates) began the closure of the Iapetus ocean (Figure 2-8).
Lithosphere consumed by the subduction zone was subducted to depth, generating
magma that would create both the Shelburne Falls island arc and ophiolites on the
overriding plate (Karabinos et al.,1998). As subduction continued, the Shelburne Falls
island arc would ultimately collide with the Laurentian continent, thrusting oceanic
terranes, ophiolites, and island arc sediments onto the continent (Kim et al., 2003, Figure
2-9). 40Ar/39Ar ages from rocks on the Laurentian margin related to Taconian
metamorphism in southern Quebec, Vermont, and western Massachusetts have been
dated from 470 to 460 Ma (Laird et al 1984; Sutter et al., 1985; Hames and Hodges,
1993; Castonguay et al., 1997).
After the Taconic collision, the Laurentian margin experienced a period of
extension. Listric block faulting and normal faulting, along with eustatic sea-level fall,
created basins where sediments could accumulate (Bourque et al., 2001; William et al.,
17
1988, Figure 2-11). The Connecticut Valley Gaspé Trough (CVGT) is one of many
Silurian basins formed during this period of extension (Tremblay and Pinet, 2005).
Sediments in the CVGT are thought to be eroded remnants of the Shelburne Falls arc and
the Bronson Hill arc, which were located to the west and east of the trough respectively
(Karabinos et al 1998; Stanley and Ratcliffe, 1985). Detrital zircon ages from
McWilliams et al. (2010) suggest that depositional environments existed near the CVGT
from before 423 Ma to at least 409 ± 5 Ma. Igneous rocks associated with Silurian
extension can also be found in and around the CVGT trough (Rankin et al 2007).
Several models have been created to explain the period of extension following the
Taconic Orogeny. Kim et al. (2003) summarizes several of these models, and posits that
models must have a mechanism for the emplacement of boninites onto the Laurentian
Continent, and the creation of an extensional regime before collision with an island arc.
In Kim et al.’s (2003) preferred model, ophiolites were obducted onto the Laurentian
margin before extension begins. Subduction of continental crust down the east dipping
subduction zone effectively ”jammed” the pathway, causing thrusting and collisional
delamination of the subducted lithosphere. Breakthrough of a new west-dipping
subduction zone then occurred, transforming the forearc into a backarc.
After a period of extension and sediment deposition, the CVGT experienced
loading and metamorphism during the Acadian orogeny. The collision of Laurentia and
the microcontinent Avalonia causes the emplacement of westward thrust sheets from
Bronson Hill Arc and central Maine over the CVGT (McWilliams et al., 2010).
18
Subduction of the oceanic crust between Laurentia and Avalonia ultimately consumed the
Iapetus Ocean (Doolan, 1996, Figure 2-11).
2.5.3 Salinic Orogeny
The Salinic Orogeny, an event still debated in New England, is thought to have
occurred between the Taconic Orogeny and the Acadian Orogeny. Evidence for this
tectonic event has been recognized in parts of the northern Appalachians, including in
Newfoundland (van Staal et al., 2009), New Brunswick (van Staal and de Roo, 1995),
and Maine (West et al., 1992; Hibbard 1994). Studies in central New England have
shown little to no evidence for a Salinic age collisional event thus far (Rankin et al.,
2007). 40Ar/39Ar ages from southern Quebec range between 433 to 405 Ma (Castonguay
et al., 2001, 2007), but early Salinic deformation is thought to have begun from 440-435
Ma in southern Quebec (Castonguay et al., 2001, 2007; Tremblay and Pinet 2016). These
dates overlap with ages for the formation of the CVGT (see subsection below).
The most widely accepted model for the Salinic Orogeny continues from the
events of the Taconic Orogeny with the closure of the Iapetus Ocean. The east-dipping
subduction zone (southeast-dipping in literature from southern Quebec) experienced slab
breakoff beneath a collision thickened arc. Further to the east of Laurentia, a west
(northwest in southern Quebec) dipping subduction zone formed, continuing to consume
the Iapetus Ocean (van Staal et al., 2007). Ultimately, the collision between Laurentia
and the Gander Margin lead to the mid-Silurian Salinic Orogeny (430–422 Ma, van Staal
and Barr, 2012, Figure 2-10). Post collision, crustal scale extension from asthenospheric
upwelling caused the formation of normal faults and troughs (Tremblay and Pinet, 2016).
19
Many of the papers detailing the Salinic Orogeny have described it in terms of
events as documented in the Quebec Appalachians, and denote it as a D3 tectonic event
(Kim et al., 2011). More recent papers have recognized two phases of to the Salinic
Orogeny, denoted as D3a and D3b (Tremblay and Pinet, 2016). This paper will denote
these two phases simply as phase 1 and phase 2, as the tectonometamorphic events are
recorded differently between southern Quebec and Vermont.
2.5.3.1 The Salinic Orogeny: Phase 1
Phase 1, as documented in Quebec, is not linked to intense metamorphism and
regional deformation. Rather, phase 1 is a compressional deformational event
characterized by hinterland directed structures that are younger than deformation features
found in the Taconic Orogeny (Tremblay and Pinet, 2016, Figure 2-10).
Northwest directed hinterland folds, backthrusts, and retrograde metamorphism
recorded in southern Quebec stand as evidence to the Salinic Orogeny. These structures
may be kinematically linked to the west dipping subduction zone formed east of
Laurentia (Oldow et al., 1990; Mazotti and Hyndman, 2002). Southeast directed
retroshears and backfolds are proposed to be associated with thick skin thrusting of
tectonic slices of Grenvillian basement rocks (Pinet et al., 1996), deformed in the Middle
to Late Ordivician and exposed at Green Mountain Anticlinorium of northern Vermont.
The Sutton - Notre Dame Mountains in southern Quebec anticlinorium represents an up-
plunge version of the GMA. Continental and oceanic material subducted and accreted in
Taconic orogeny were transported to the southeast in the hanging wall of backthrusts,
locally exhuming to the surface. This may account for Ordovician eclogite and blueschist
20
facies found at the Tillotson Peak Complex in northern Vermont (Tremblay and Pinet,
2016).
Timing constraints for phase 1 from 40Ar/39Ar dating are abundant in southern
Quebec. Low temperature steps of apparent-age spectra of retrograde amphiboles and
biotites range from 429–424 Ma and 420–411 Ma respectively. Muscovite plateau ages
range from 433–405 Ma, reflecting presence of mixed mineral phases from progressive
deformation. These muscovite age spectra show an irregular younging from northwest to
southeast across Sutton-Notre Dame Mountain anticlinorium (Castonguay et al., 2001,
2007). Tremblay and Pinet (2016) suggest that early Salinic deformation started around
440–435 Ma. Dates in southern Quebec are thought to be younger than those of
correlative structures in western New England, based on muscovite ages yielded from
correlative structures (Castonguay et al., 2012).
2.5.3.2 The Salinic Orogeny: Phase 2
Phase 2 of the Salinic Orogeny is associated with extensional tectonics. After the
collision between Laurentia and Ganderia, asthenospheric upwelling due to slab
delamination and/or trench retreat of the subduction zone is thought to have created
crustal-scale extension (Tremblay and Pinet, 2016, Figure 2-11). This extension lead to
the formation of normal faults, half-grabens, and graben and horst formations (Tremblay
and Pinet, 2005).
Extension during the Salinic Orogeny has been documented along the whole
length of the Quebec Appalachians, and is linked to the formation of the Connecticut
Valley-Gaspé Trough and the Merrimack Valley Trough in Quebec and New England.

21
South and southeast dipping normal faults in Quebec are correlated to phase 2, though
poorly documented in some areas due to reactivation of normal faults during the Acadian
Orogeny (Tremblay and Pinet, 2016). Studies have showed conclusive evidence for
extensional movement during the Silurian, as seismic data from Pinet (2013) reveals a 3.8
km normal sense vertical separation between Silurian units on both sides of a fault.
In southern Quebec, phase 2 structures correspond to structures in the Gaspé
Peninsula, western New England, and northwest Maine (Kim et al., 1999; Tremblay and
Pinet, 2005). Correlative normal faults found in these regions are characterized by
moderately to steeply dipping shear bands, and brittle–ductile normal sense shear zones,
pointing to a top to the east sense of motion (Pinet et al., 1996; Tremblay and Pinet, 2005;
Perrot, 2014). The amount of displacement along these structures is not constrained, but
correlative faults separate high to medium grade rocks in the hanging wall from less
metamorphosed rocks in the footwall (Castonguay and Tremblay, 2003; Tremblay and
Pinet, 2005).
Much of the timing constraints for phase 2 extensional events involve the
interpretation of 2D seismic lines. Growth strata indicate that syn-sedimentary normal
faulting or transtensional faulting mainly occurred during the late Silurian to early
Devonian in the Gaspé Peninsula (Pinet, 2013). 40Ar/39Ar data from hanging wall of the
St. Joseph fault in southern Quebec (420-410 Ma) is contemporaneous with brittle fault
activity in Gaspé Peninsula, and likely records progressive exhumation in response to
extension (Castonguay et al., 2007).
22
2.5.3.3 The Salinic Orogeny and Vermont
Some authors have found evidence for a mountain building event in between the
Taconic and Acadian, (Castonguay et al., 2011), whereas others have explicitly noted a
lack of intervening compressional regimes (Rankin et al., 2007). Castonguay et al. (2011)
utilized 40Ar/39Ar dates to correlate a third tectonic event in the GMA to Silurian
deformation, in the same time frame as the Salinic Orogeny. Rankin et al. (2007) argues
that despite Silurian metamorphism and compressional regimes found in Newfoundland,
New Brunswick, Cape Breton Islands, there is no evidence for Silurian compression in
CVGT, making it hard to reconcile compression with extension. The existence of a
period of extension (phase two as described above) between the Taconic and Acadian
Orogenies is widely accepted in Vermont. Detrital zircon ages from the CVGT in
Vermont (McWilliams et al., 2010) and late Silurian normal faulting are associated
extension must have occurred to create the CVGT and other correlative structures in New
England and Quebec.
2.6 Regional Geology
The collision between the island arcs with the Laurentian continent, or the
Taconic Orogeny, lasted from about 470 to 460 Ma (Castonguay et al., 2011), and
accreted rift and basin sediments, ophiolites, and island arcs onto Laurentia as slices.
These units were thrust onto Laurentia as part of a foreland-propagating thrust system
(St-Julien and Hubert, 1975; Sasseville et al., 2008; van Staal et al., 2009). Evidence of
Taconic Orogeny can be found in N–S trending metamorphic slices recognized in modern
23
day Vermont and Quebec. Several of these slices are included within the Green Mountain
Anticlinorium, which is a part of the Green Mountain Slice and borders the Rowe
Hawley Belt.
2.6.1 Lithology of the Green Mountain Anticlinorium
The Prospect Rock Fault (PRF) is mapped within the Green Mountain
Anticlinorium (GMA, Figure 2-2). Rocks in the footwall are noted as part of the Green
Mountain Slice, and are composed internally of the Fayston Formation and the Hazens
Notch Formation. These formations have been interpreted to represent metamorphosed
rift clastics and slope-rise deposits from the rift-drift transition prior to the Taconic
orogeny (Thompson and Thompson, 2003). The Fayston Formation consists of schist
with high mica and chlorite content, with garnet, magnetite, and albite porphyroblasts
(Cady et al., 1963). The Hazens Notch Formation contains graphitic schist with albite,
with or without chlorite, garnet, and pyrite. It also contains discontinuous quartzites,
greenstones, and localized bodies of ultramafics and talc-carbonate bodies (Cady et al.,
1963). Rocks in the hanging wall of the PRF have been noted to contain more albite than
those found in the footwall (Lamon, 2003).
Rocks in the hanging wall of the PRF are a part of the Prospect Rock Slice,
mapped as the Jay Peak and Ottauquechee Formations. The Jay Peak Formation contains
includes phyllite and schist, with or without magnetite, garnet, chloritoid, and albite.
White quartzite and rare greenstone can also be found in the unit. The Ottauquechee
Formation contains non-albitic, graphitic quartzose phyllite and schist, discontinuous
quartzite beds, and local lenses of non-graphitic phyllite (Cady et al., 1963).
24
On the eastern limb of the GMA, the Tillotson Peak Complex is surrounded core
rocks of the Hazens Notch Formation, and contains blueschist, eclogite, and small
ultramafic lenses within the Haystack Tillotson Slice (Laird and Albee, 1981; Bothner
and Laird, 1999, 1987). The surrounding Hazens Notch Formation is split into two
regions of mafic schist and felsic gneiss. Isolated serpentine lenses are found along the
contact of the Hazens Notch Formation, and contain strongly sheared serpentinite.
Blueschist and eclogite of the TPC are fine to medium grained (Laird and Albee, 1981).
2.6.2 Structures of the Green Mountain Anticlinorium
Structures in the GMA have been linked to the two dominant orogenies of
Vermont: the Taconic and the Acadian orogenies. Three stages of deformation have been
identified in the GMA, with D1 and D2 associated with the Taconic Orogeny, and D3
linked to the Acadian. A study by Castonguay et al. (2011) has suggested that the D3
phase could possibly be instead attributed to Salinic deformation, but most other
literature has described D3 as Acadian. Foliations, lineations, and folds of the GMA have
been well documented and described, though vary by location due to a
multideformational history. Recent studies in the Tillotson Peak Complex, found on the
eastern limb of the GMA, recognize four deformational events (Aiken, MS thesis, in
prep.) which may aid in reconciling the discrepancies between southern Quebec and
Vermont structures, as noted above. Structures will be described in terms of these four
deformational events, though previous studies have utilized three.
25
2.6.2.1 Foliations of the Green Mountain Anticlinorium
Three sets of foliation are present in the GMA, not including bedding (S0).
Occurrences of S0 are rare, and typically appear transposed by later foliations (Kim et al.,
1999). Distinguishing between foliations in the field can be challenging, as different
combinations of foliations can be found as composite foliations. Nonetheless, general
trends in the foliations can be described and recognized.
In the GMA, S1 foliations are generally not well preserved, and are most easily
observed in quartzite beds. S1 can be found locally as compositional layering, axial planar
to rootless isoclinal F1 folds (Castonguay et al., 2011). S1 is often found parallel to S2,
and is difficult to distinguish from S2 other than in D2 fold hinges (Thompson et al.,
1999). In other areas, S1 is folded by a second generation of transposed isoclinal folds
with an axial planar spaced cleavage, representing S2 (Castonguay et al., 2011). S1 is
associated with the Taconic Orogeny (Thompson and Thompson, 2003).
S2 foliations are associated with peak metamorphism during the Taconic
orogeny (Thompson et al., 1999). S2 foliations are defined by axial planar spaced
cleavage (Castonguay et al., 2011). Dip direction of S2 varies over the GMA, dipping
southeast on the eastern limb of the GMA and curving towards the southwest traveling
west over the GMA (Thompson and Thomspon, 2003).
S3 foliations have been interpreted to be associated with the Acadian orogeny and
the folding of the GMA. The overall trend of the anticlinorium is 015⁰ (Thompson et al.,
1999). Foliations are generally defined as spaced cleavage or a crenulation cleavage, and
26
are parallel to axial planes of F3 folds. In some areas, such as east of the Burgess Branch
Fault Zone, S2 and S3 can form a composite foliation (Kim et al., 1999).
2.6.2.2 Lineations of the Green Mountain Anticlinorium
Lineations in the GMA are grouped into L2 or L3. L2 lineations are defined by the
long axes of minerals, stretching lineations or quartz rods, and plunge parallel to F2 fold
axes. Near the Lamoille River, L2 structures trend roughly east and west across the
anticlinorium. South of the Lamoille river, older quartz lineations remain east-west,
whereas younger structures gradually shift in orientation. Stretching lineations have been
interpreted as parallel to transport direction during deformation (Thompson and
Thompson, 2003; Thompson et al., 1999).
L3 lineations are found as intersection or crenulation lineations. These may
overprint L2 quartz rod lineations (Kim et al., 1999). L3 lineations run parallel to F3 fold
hinges, and plunge gently north or south (Thompson, et al., 1999).
2.6.2.3 Folds of the Green Mountain Anticlinorium
Structures associated with D1 are generally poorly preserved and hard to find. F1
and F2 folds are often difficult to distinguish, especially when axial planes and fold axes
are sub-parallel. F1 folds are generally isoclinal, with fold axes trending east-west. Folds
are observed with disarticulated hinges and sheared out limbs (Thompson et al., 1999).
Despite S1 and S2 commonly appearing parallel, F1 and F2 fold axes are not coaxial (Kim
et al., 1999).
27
F2 folds are tight, isoclinal, and fold an earlier foliation (S1). Fold axial planes
parallel the dominant S2 foliation. Close to the Lamoille River, F2 fold hinges trend
roughly E–W across the anticlinorium, though trending more towards NE–SW on the
eastern side of the GMA, and more northwest-southeast on the western side (Thompson
et al., 1999; Thompson and Thompson, 2003). Due to the rarity of F1 folds, and the
subparallel nature between F1 and F2, folds are generally assumed to be F2 when a clear
distinction cannot be made.
F3 folds have been linked in the literature with the folding of the GMA and the
Acadian Orogeny. The fold axis trends about 015⁰ (NNE), though it varies between
locations. F3 folds are generally open and upright, asymmetric (Kim et al., 2003), and
fold the dominant foliation (S2). Axial planes are steeply dipping. F3 folds are common
throughout the GMA, and can plunge gently north to gently south (Thompson et al.,
1999).
2.6.3 Structures of the Tillotson Peak Complex
Previous studies have also identified three distinct deformational events
(Bothner and Laird, 1987). S1 is the dominant foliation in the field, and is axial planar to
isoclinal folds preserved in mafic schist. It is primarily defined by minerals associated
with blueschist and greenschist facies mineral assemblages. S1 has also been refolded,
creating approximately E–W F2 folds that can be seen on map scale. S2 appears as a
spaced crenulation cleavage best developed in the mafic schist, though it also appears in
the felsic gneiss (Bothner and Laird, 1987). The S3 foliation is approximately axial planar
to F3 folding.
28
Three generations of folds have been identified in the field or from field
samples. F1 folds are small, isoclinal, recumbent folds axial planar to S1. F2 folds are
gentle to open folds, nearly reclined, and generally E-W trending. These folds can be
identified on map view of the Tillotson Peak Complex. F3 are inferred to be represented
by the Gilmore Antiform, and is a broad, open macroscopic antiform that can be noted on
map scale (Figure 2-2). Earlier studies (Bothner and Laird, 1987) noted that no
mesoscopic structures have been tied to F2 folding, but trends of plunges of F2 fold axes
over the TPC appear to be altered by F3.
A recent study by Aiken (MS thesis, in prep) on the TPC identified four
generations of foliations and folds. S1 foliations are documented in microstructural
examinations, and are preserved locally in garnet and albite porphyroblasts, as well as in
F2 fold hinges. S2, S3, and S4 correspond to foliations from prior studies (S1-3). The study
also identifies four generations of folds, with F1 folds inferred to be locally absent or
transposed and axial planar to F2 in the field area. F2-4 correspond to F1-3 as noted above.
Furthermore, F3 and F4 folds have been identified in hand samples from this study.
2.6.4 The Prospect Rock Fault
The Prospect Rock Fault was discovered by mapping rock units near the Prospect
Rock in Jeffersonville, Vermont (Thompson, 1998). Phyllites of Ottauquechee and Jay
Peak Formation were identified as units of the hanging wall, which overlay coarse albitic
schists of the Hazens Notch and Fayston formation in the footwall. One exception exists
in a small overturned limb of a fold west of the prospect rock. The Prospect Rock Fault is
folded by the GMA, matching F4 folds identified in the region (Figure 2-12). The PRF
29
generally dips towards the east, except where it passes through fold hinges. The fault also
dipps more steeply to the southeast on the short F3 limb than on the long limb.
Sense of motion of the Prospect Rock Fault is debated. Lamon (2001) suggested
transport of the hanging wall to the east, based on microstructural kinematic and strain
indicators. Thompson and Thompson (2003) suggest that initial fault movement was
directed westward, and later eastward normal reactivation may have occurred during the
Acadian. Different models discussing the movement of the Prospect Rock Fault, and its
role in the exhumation of the Tillotson Peak Complex are further discussed below.
2.7 Exhumation Models and the Tillotson Peak Complex
The presence of the Tillotson Peak Complex (TPC) in Vermont has had a strong
effect on regional tectonic models, as new models must have an explanation for how this
high-pressure metamorphic terrane was exhumed to the surface. Studies have utilized
data from the PRF and the associated core and cover rocks to analyze the fault’s role in
the obduction of Taconian orogenic rocks and the TPC with varying interpretations.
The TPC has several structural features that must be reconciled within an
exhumational model. First, previous studies have suggested peak metamorphic pressures
of 2.5 GPa, approaching UHP metamorphic conditions (Honsberger, 2015). Rapid
exhumation of the terrane must have occurred, or retrograde deformation would have
obscured pre-existing high-pressure assemblages (Hacker, 2013). Second, high-strain
folds in the TPC are oriented E-W and parallel stretching lineations, which all run
orthogonal to regional N-S trending folds associated with the Taconic Orogeny
30
(Thompson et al., 1999; Thompson and Thompson, 2003). These features are also found
in the footwall of the PRF, and in some locations even the PRF itself, also exhibit E-W
trending folds (Thompson et al., 1999; Thompson and Thompson, 2003; Lamon, 2001,
Figure 2-2). Finally, Lamon (2001) suggested an overall top-to-the-east sense of
movement of the PRF, based on microstructural kinematic indicators from near the
Prospect Rock area.
Two models have been proposed for the evolution of the PRF, and its role in the
exhumation of the TPC. Lamon (2001) suggested that the PRF was formed as an east
directed roof thrust during tectonic wedging, and that the TPC was a part of the westward
thrust slice thrust onto the Laurentia (Figure 2-13). Thompson and Thompson (2003)
suggested that the PRF represents the basal thrust of the Taconic accretionary prism,
which was thrust west onto the Laurentian continent (Figure 2-14). This chapter will also
examine the eduction model and its possible application to the PRF and the TPC. Details
on this model are informed by Webb et al. (2008, Figure 2-15).
2.7.1 Tectonic Wedging Model
Lamon (2001) describes the PRF as a roof thrust formed as a part of tectonic
wedging during orogenesis (Figure 2-13). Petrologic analysis of rock in the foot wall
revealed a metamorphic gradient along the footwall, increasing from west to east. Thin
section observations of the albitic foot wall rock also showed a top-to-the-east shear
sense. Fine-grained cover rocks (PRF hanging wall) were interpreted as having
undergone low-grade metamorphism, as opposed to the core rocks (PRF foot wall) which
underwent higher grade metamorphism. The metamorphic gradient, combined with the-
31
top-to-the-east shear sense, were interpreted by Lamon to support emplacement of a
wedge, where the “inserted” rocks of the PRF footwall were thrust to the west under the
low grade hanging wall rocks which moved eastward. These wedge rocks represent fault
bounded slices assembled prior or during wedging within the subduction zone. Under this
model, the PRF represents the roof thrust of the emplaced wedge of high-grade rocks.
The addition of the TPC to the wedge is addressed by underplating, combined
with normal faulting to later expose the terrane. Rocks of the TPC were added to the base
of the wedge through underplating, while the wedge was actively thrust towards the
surface. The Burgess Branch Fault Zone is interpreted in this case to be a steep extension
of the PRF in this model, which aided in the rapid ascent of the TPC to the surface.
Foreland directed normal faulting above the TPC helped to exhume the complex by
removing overburden and exposing higher grade rocks. This E–W oriented extension
could be linked to the creation of extension parallel structures, such as lineations and
folds.
2.7.2 Basal Thrust Model
Studies have utilized data from the PRF and the associated core and cover rocks
to analyze the fault’s role in the obduction of Taconian orogenic rocks with varying
interpretations. Thompson and Thompson (2003) interpreted the PRF as the basal thrust
of the Taconian accretionary prism (Figure 2-14). Under their description, east-directed
subduction along the Laurentian Margin basin created an accretionary prism, which rode
up onto the Laurentian continent. Thrusting along the PRF emplaced the prism above the
autochthonous footwall rocks. The accretionary prism, which includes the Stowe and
32
Ottauquechee Formations of the hanging wall, grew through underplating as it was thrust
to the west.
As thicker, buoyant Laurentian crust was pulled towards the east dipping
subduction zone by subduction, the rate of subduction decreased and material was ejected
from the accretionary prism. Aided by deformation of weak serpentinized ultramafics
along their boundaries, exhumed blocks could move rapidly over a significant distance.
In this manner, the TPC could have been rapidly exhumed and avoid overprinting of
UHP structures.
In this model, E–W verging folds and structures formed during a later
deformational event during the Taconic Orogeny. The Champlain Thrust Slice, an
underlying slice stratigraphically far below the GMS, is described to have moved
westward during this later event. Thrusting may have passed over the Grenvillian
basement, causing the slices to encounter ancient normal faults at rift basin margins. As
the slices moved, material above them splayed out in two directions, forming west
verging folds in western Vermont, and east verging folds and back thrusts above and east
of the deep ancient faults.
The results of Lamon’s study (2001) recognizing eastward motion along the
PRF is recognized by Thompson and Thompson (2003), though their model argues for
overall westward motion along the PRF. They attribute eastward motion noted by Lamon
(2001) to later fault reactivation during a later deformation stage.
33
2.7.3 Subduction Zone Reversal
Exhumation models for the TPC must be reconciled with rapid exhumation of
the terrane, E–W trending structural features orthogonal to dominant Taconic structures,
and top-to-the-east motion along the PRF as observed through kinematics. UHP terranes
in Papua New Guinea and China have been recognized with similar characteristics: rapid
exhumation of an ~8 Ma HP–UHP terrane (Baldwin et al., 2008), and structural features
that are non-parallel to the direction of convergence (Hacker et al., 2000, Little et al.,
2007, Daczko et al., 2011). Webb and al. (2008) proposed a model for UHP exhumation
in Papua New Guinea that utilizes eduction to reconcile rapid exhumation with the local
structures non-parallel to collision. In this section, we apply the model to the PRF and the
TPC (Figure 2-15).
In our applied model, the PRF initially represents a thrust fault in a convergent
tectonic zone. The Taconic orogeny has at least partially occurred, with the incoming
island arc colliding to the west into Laurentia. Rocks and sediments are subducted down
the east dipping subduction zone, and HP–UHP terranes are being formed at depth.
The reversal of tectonic forces, possible through methods such as microplate
rotation as noted in Webb et al. (2008), shifts convergence into divergence. The PRF is
reactivated as a normal fault, pulling rocks of the hanging wall to the east. Continued
extension removes the overlying rocks, allowing deeply subducted rocks such as the TPC
to be uncovered and rapidly exhumed. Buoyancy of subducted rocks may also aid in
exhumation to the surface.
34
East-directed normal sense movement along the PRF is consistent with the E–W
trending lineations and folds present in the GMA. Exhumation of UHP terrane at the
Woodlark Basin in Papua New Guinea and the Dabie Hong’an area in China have been
linked to stretching lineations that parallel the hinges of high-strain folds, and normal
faulting associated with extensional regimes (Hacker et al., 2000, Little et al., 2007,
Daczko et al., 2011). This narrative reconciles the presence of E–W folds in the GMA
which run counter to north-south trending structures associated with the Taconic and
Acadian orogenies.
2.8 Exhumation Models and Testability
Microstructures, age gradients, and transport direction identified in the footwall
of the PRF have implications on the likeliness of modes of exhumation utilizing the PRF.
This study examines patterns identified in these categories, which may aid in constraining
possible exhumation models.
Patterns in strain gradients along the footwall can speak to the tectonic history of
the terrane. Activation of the PRF utilizing eduction would likely result in a smooth strain
gradient increasing from west to east, with rocks buried deeper along the fault experience
more strain (Webb et al., 2008). In models for tectonic wedging and basal thrust
exhumation, smaller thrust faults are active in the westward moving wedge (Thompson
and Thompson, 2003; Lamon, 2001). Additional faults can alter the strain experienced
over an area, so the strain gradient over the PRF under these conditions would not look as
35
smooth as under the eduction model. Increasing strain along the footwall can be
identified by comparing microstructures between samples.
Age gradients observed under these different exhumation models would likely
produce a similar pattern to strain gradients as described above. Smooth exhumation of
rocks through eduction result in an age gradient from west to east, with younger ages
towards the east (Webb et al., 2008). The presence of faults within the wedge in tectonic
wedging and basal thrust models would likely alter age gradients, due to heat produced
due to faulting that could alter or reset ages identified through 40Ar/39Ar dating.
Kinematics of deformation as correlated to fault motion along the PRF can also
aid in constraining possible exhumation models. Both the eduction and tectonic wedging
models argue for top-to-the-east motion of the PRF (Lamon, 2001; Webb et al., 2008).
The basal thrust model suggests top-to-the-west motion along the fault, with possibility
for local fault reactivation showing top-to-the-east senses of motion (Thompson and
Thompson, 2003). Past studies conducted utilizing kinematic indicators have
concentrated on select areas of the PRF, so more thorough kinematic studies of the PRF
are necessary to accurately constrain fault movement.
2.9 Geochronology and 40Ar/39Ar Dating
This study utilizes the 40Ar/39Ar dating technique to obtain ages from collected
field samples, as summarized by Mcdougall and Harrison (1999). The 40Ar/39Ar dating
method is an evolution of the K/Ar dating method, both of which are based on the
radioactive decay of 40K. 40K can break down into 40Ca and 40Ar, and has a half-life of

36
1250 My. Measuring concentrations of 40K and radiogenic 40Ar can delineate the amount
of radioactive decay, and the amount of time passed since system closure. Minerals rich
in K are targeted for techniques utilizing K and Ar, including muscovite, biotite, and
amphibole.
Concentrations of 40K and radiogenic 40Ar can be used to measure the passage of
time. When temperatures are sufficiently high within a rock, argon concentrations
equilibrate with the ambient gas phase equal or close to that of the Earth’s surface. Once
a mineral system is closed, concentrations of 40Ar in minerals increase over time, barring
resetting by metamorphism or deformation. Concentrations of radiogenic 40Ar can be
calculated, with argon concentrations correlating with the passage of time. Previously
formed systems can be “reset”, when rocks are subjected to high temperatures long
enough for the argon to equilibrate again. Systems can also undergo a partial resetting,
which occurs when conditions do not allow for complete equilibration of the system, and
result in argon concentrations (and thus calculated ages) that fall between equilibrium and
concentrations in the system before reheating.
In 40Ar/39Ar dating, collected samples are irradiated to turn 39K into 39Ar.
Concentrations of 40Ar/39Ar are measured, which are proportional to 40Ar/40K
concentrations and thus work as a proxy. Samples can also be heated in increments to
release gas to be analyzed, which provides more information about gas released from
different parts of the grain, and about the precision of ages obtained. K/Ar dating utilizes
fusion heating, which releases all the Ar from a sample at once.
37
40Ar/39Ar dating utilizes step heating, which releases gas from a sample
incrementally and allows for the dating of multiple aliquots of gas from an individual
sample. This allows for the analysis of reheating events and diffusion of argon from
sample grain boundaries, which may result in lower 40Ar/39Ar ages when gas from these
spots are released. Plateau ages–concordant ages between multiple steps–can give a
representative age of initial cooling, though may be changed by later tectonic events that
would have altered the system (Figure 2-16).
2.10 Geochronologal studies in Vermont and the GMA
Laird et al. (1984, 1993) analyzed from rocks in the GMA using the 40Ar/39Ar
technique, reporting 40Ar/39Ar total fusion ages and plateau ages of amphibole and
muscovite ranging from 471 to 439 Ma. Ages between 386 to 355 Ma were also reported
on muscovite, biotite, and amphiboles to the east and west of the GMA axis, suggesting
that metamorphic overprinting occurred during the Devonian. These ages were
interpreted to represent the Taconic and Acadian orogenies, respectively.
Laird et al.’s 1993 study further refined Ordovician metamorphic ages to 471–
460 Ma based on total fusion and amphibolite ages, interpreting the Silurian total fusion
age from the previous study (439 Ma) as due to inseparable biotite intergrowths because
of high K/Ca. These ages were interpreted to represent Taconian metamorphism ranges,
and included a total fusion age of 468 ± 6 Ma on glaucophane from HP rocks of the TPC.
Both studies provided 40Ar/39Ar ages on amphiboles from the Belvidere Mountain
Complex (Figure 2-2), reporting a range between 504–490 Ma. Ages determined in Laird
38
et al. (1984, 1993) have been later interpreted to represent the first pulse of Taconic
metamorphism (470–460 Ma, in Lamon, 2001; Thompson and Thompson, 2003) and
Acadian metamorphic overprinting (386–355 Ma, in Laird et al., 1984, 1993).
Castonguay et al. (2011) also conducted 40Ar/39Ar analyses of rocks in and near
the GMA, examining rocks from the PRF hanging wall and footwall (including the
Belvidere Mountain Complex), and the westward neighboring Underhill slice. Analysis
of these 40Ar/39Ar ages from the GMA helped to further refine the timing of
deformational events, denoted in their paper as early (De), middle (Dm), and late (Dl). De,
with ages obtained from mafic schist amphiboles, ranges from 471–460 Ma, and is linked
to Taconic deformation. This postdates the deformation of the Belvidere Complex, at
505–473 Ma. Dm is associated with Silurian and early Devonian fabrics and southeast
directed structures. Ages from Dm are from between 446–415Ma, and foliations defining
Dm are associated with synkinematic mica crystallization and recrystallization of
inherited muscovite. Dl deformation dates range from 386 to 355 Ma, providing a
maximum age for Acadian deformation in northern Vermont. Dates obtained in this study
are correlative with dates from Quebec, but give evidence for diachronism along strike.
2.11 Relevant Geochronology in Canada
Geological structures in Vermont are key to a full tectonic understanding of the
northern Appalachians because they link correlative ophiolite and accretionary prism
sequences found in southern Quebec and New England (Kim et al, 2003). For example,
the St-Joseph/Bai Verte-Brompton Line correlates to the Burgess Branch Fault Zone
39
(Figure 2-17), juxtaposing different metamorphic domains with contrasting isotopic ages
(Tremblay and Pinet, 2016). As such, dates chronicling metamorphism and tectonic
activity in southern Quebec are vital for a complete tectonic understanding for the region.
Apparent along-strike diachronism is attributed in part to different structural levels
between features found in southern Quebec and western New England (i.e. younger
cooling ages from deeper structural levels compared to older ages from higher structural
levels), adding further complexity.
2.11.1 Canadian Geochronology and the Taconic Orogeny
Taconic metamorphism in the northern Appalachians is interpreted to include
ophiolitic metamorphic soles, which are in fault contact with lower grade metamorphic
rocks of the Humber Zone. 40Ar/39 ages from amphibole and muscovite from amphibolite
soles and ophiolites fall between 456-470 Ma in southern Quebec (Tremblay et al., 2011;
de Souza et al., 2012) and between 456-470 in the Gaspe Peninsula (Pincivy et al., 2003;
Malo et al., 2008, de Souza et al., 2012), chronicling metamorphism during Taconic
Orogeny. Older ages have been obtained, including 491 ± 11 Ma by Whitehead et al.
(1996) from an amphibolite from the ultramafic Pennington Sheet, and a U-Pb
crystallization age of 480 Ma for the Thetford Mines and Asbestos Ophiolitic Complexes
(Dunning et al., 1986; Whitehead et al., 2000; Tremblay et al., 2011).
2.11.2 Canadian Geochronology and the Salinic Orogeny
Data from Castonguay et al. (1997, 2001, 2007) have produced dates from 40Ar/39
dating linked to phase 1 of the Salinic Orogeny. Plateau and apparent low temperature
40
step ages of retrograded amphiboles from southern Quebec generated ages from 429–424
Ma, and biotite plateau ages ranged between 420–411 Ma. Plateau ages from muscovite
grains ranged from 433–405 Ma, which have been interpreted to reflect the presence of
mixed mineral phases during progressive deformation and metamorphism (Castonguay et
al., 2001, 2007). An irregular younging of weighted apparent age maxima is documented
from northwest to southeast over the Sutton-Notre Dame Mountains anticlinorium, which
is considered a continuation of the Green Mountain anticlinorium (Castonguay et al.,
2001 2007). 40Ar/39Ar ages within the Salinic Orogeny are generally absent in samples
from the internal Humber Zone of the Gaspe Peninsula, but one date from a mica schist
sample from the Shickshock-Sud fault (correlative to the St. Josephs Fault) yielded a low
temperature step age of 417.8 ± 3.7 Ma (2σ).
40Ar/39 data also records the timing of phase 2 of the Salinic Orogeny. Dates from
the hanging wall of the St. Joseph fault range from 420–410 Ma, and match brittle
faulting in the Gaspe Peninsula, recording progressive deform that occurred in response
to extension. (Castonguay et al., 2007). Constraints for phase 2 faulting events are also
recorded through 2D seismic lines and sedimentary growth strata, which indicate a period
of syn-depositional normal or transtensional faulting during the late Silurian to Early
Devonian (Pinet, 2013).
2.11.3 Canadian Geochronology and the Acadian Orogeny
Dates chronicling the Acadian Orogeny in the Northern Appalachians, including
Canada, Maine, and New England show evidence for northwest migration of the
deformation front towards Quebec over a 40 My period (Bradley et al., 2000). In Quebec
41
and the Gaspe Peninsula, the age of Acadian Deformation has been constrained using
several methods, including dating of late to post-tectonic magmatic rocks, and dating the
age of metamorphism (Tremblay and Pinet, 2016).
Granitic plutons from along the La Guadeloupe fault and the Gaspe Belt in
southern Quebec were dated between 384–374 Ma (Simonetti and Doig, 1990). The
Gaspe Peninsula itself has granitic intrusions found in the north side of the peninsula
dated at 391 ± 3.4 Ma (Whalen et al., 1991). Plutons here are not affected by Acadian
deformation.
Regional metamorphism in southern Quebec and western New England recording
the Acadian Orogeny range from 395–375 Ma (Armstrong et al., 1992; Tremblay et al.,
2000). Acadian overprints are observed in several 40Ar/39 age spectra from the Sutton-
Notre Dame Mountains anticlinorium (Castonguay et al., 2001, 2007). Acadian
overprinting is not observable in some regions of southern Quebec, due to higher
structural levels and low-grade Acadian deformation (Hesse and Dalton, 1991; Bertrand
and Malo, 2001).
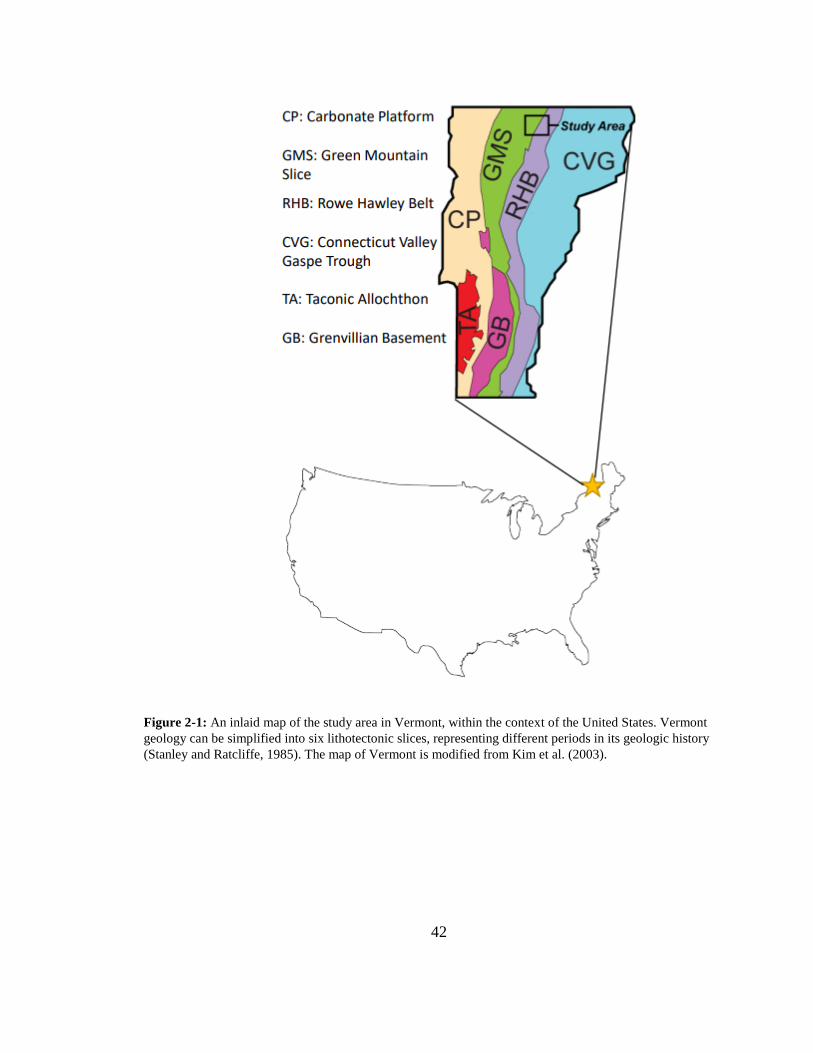
42
Figure 2-1: An inlaid map of the study area in Vermont, within the context of the United States. Vermont
geology can be simplified into six lithotectonic slices, representing different periods in its geologic history
(Stanley and Ratcliffe, 1985). The map of Vermont is modified from Kim et al. (2003).
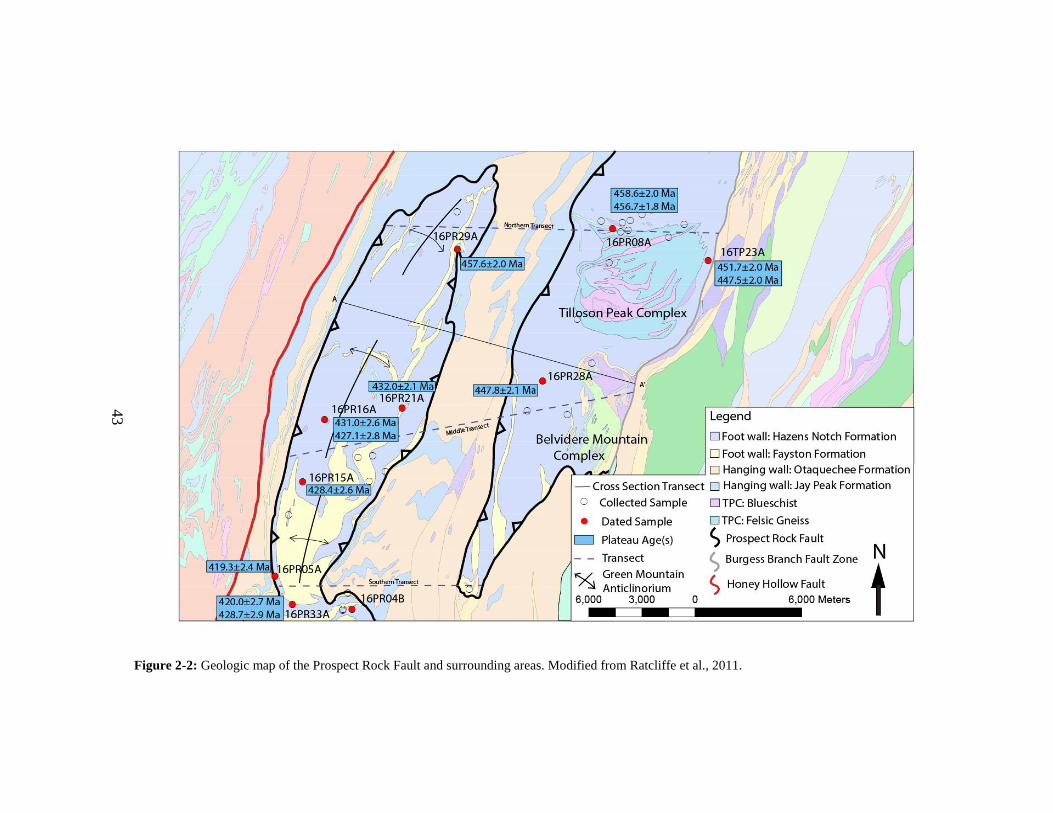
43
Figure 2-2: Geologic map of the Prospect Rock Fault and surrounding areas. Modified from Ratcliffe et al., 2011.
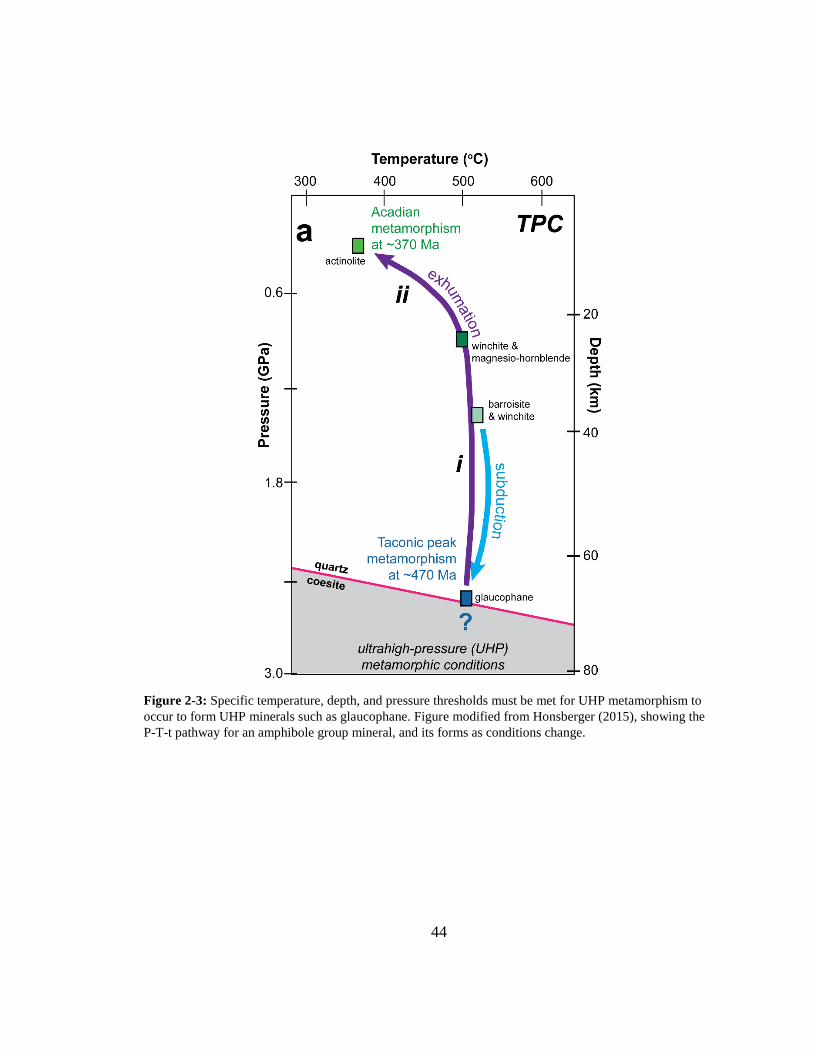
44
Figure 2-3: Specific temperature, depth, and pressure thresholds must be met for UHP metamorphism to
occur to form UHP minerals such as glaucophane. Figure modified from Honsberger (2015), showing the
P-T-t pathway for an amphibole group mineral, and its forms as conditions change.
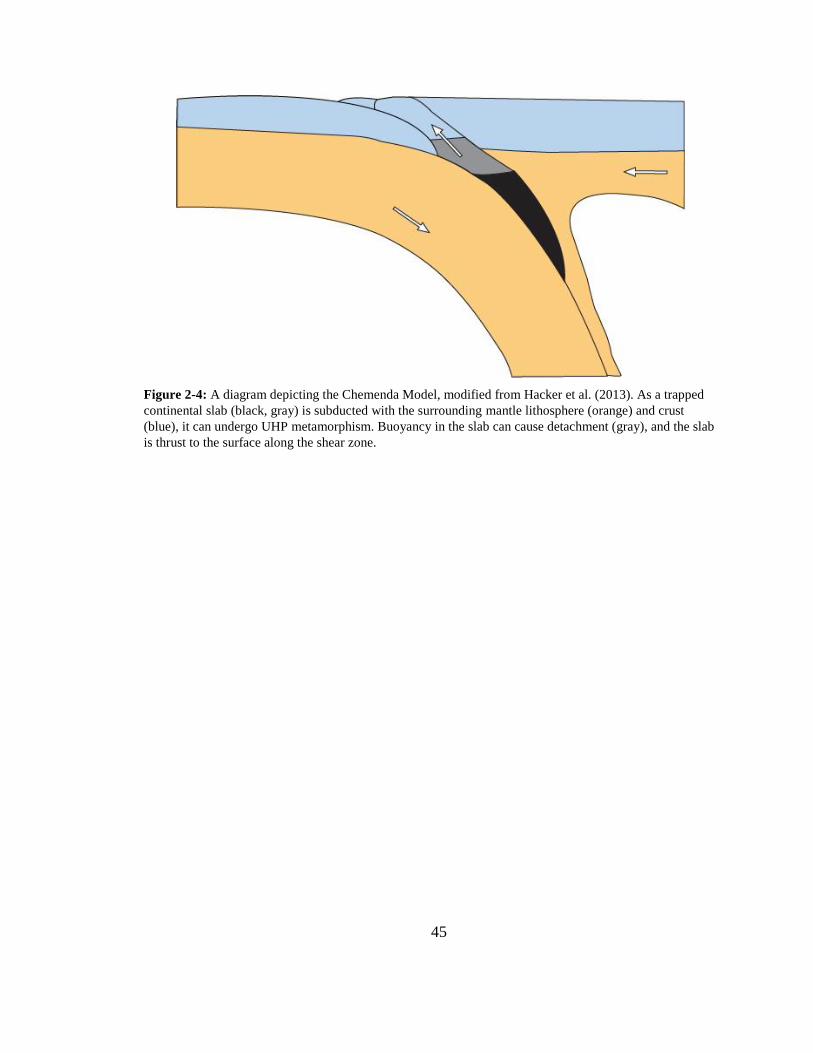
45
Figure 2-4: A diagram depicting the Chemenda Model, modified from Hacker et al. (2013). As a trapped
continental slab (black, gray) is subducted with the surrounding mantle lithosphere (orange) and crust
(blue), it can undergo UHP metamorphism. Buoyancy in the slab can cause detachment (gray), and the slab
is thrust to the surface along the shear zone.
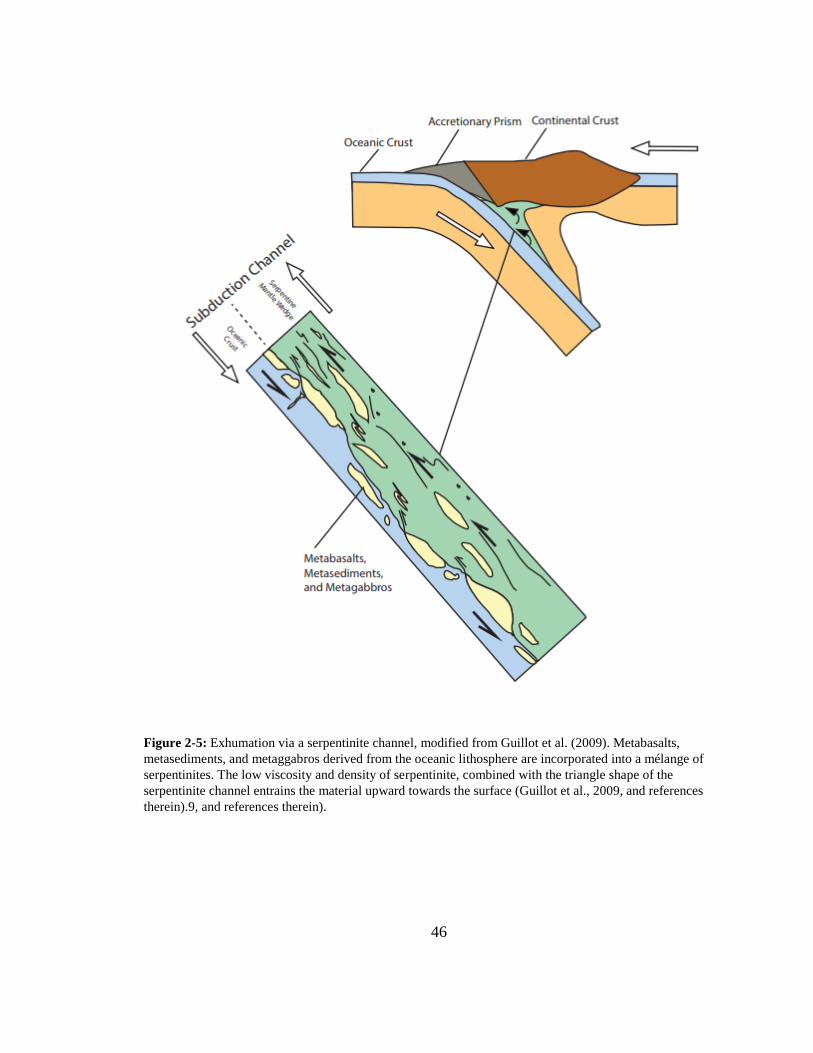
46
Figure 2-5: Exhumation via a serpentinite channel, modified from Guillot et al. (2009). Metabasalts,
metasediments, and metaggabros derived from the oceanic lithosphere are incorporated into a mélange of
serpentinites. The low viscosity and density of serpentinite, combined with the triangle shape of the
serpentinite channel entrains the material upward towards the surface (Guillot et al., 2009, and references
therein).9, and references therein).
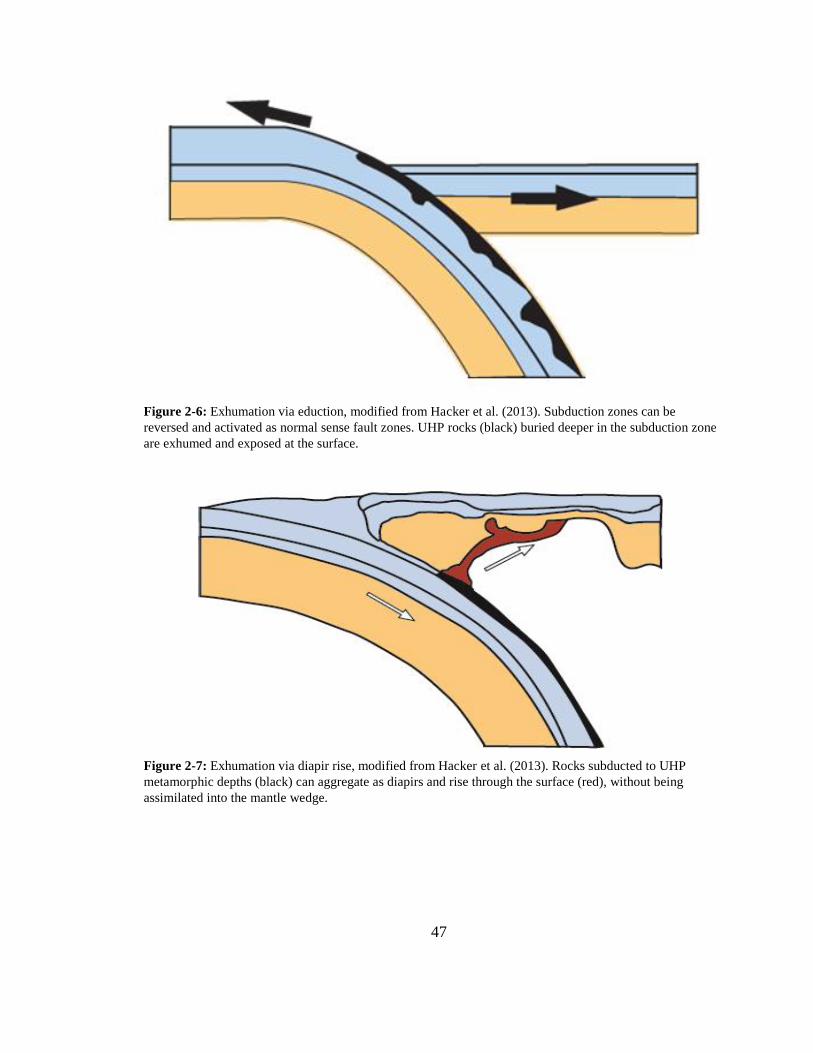
47
Figure 2-6: Exhumation via eduction, modified from Hacker et al. (2013). Subduction zones can be
reversed and activated as normal sense fault zones. UHP rocks (black) buried deeper in the subduction zone
are exhumed and exposed at the surface.
Figure 2-7: Exhumation via diapir rise, modified from Hacker et al. (2013). Rocks subducted to UHP
metamorphic depths (black) can aggregate as diapirs and rise through the surface (red), without being
assimilated into the mantle wedge.
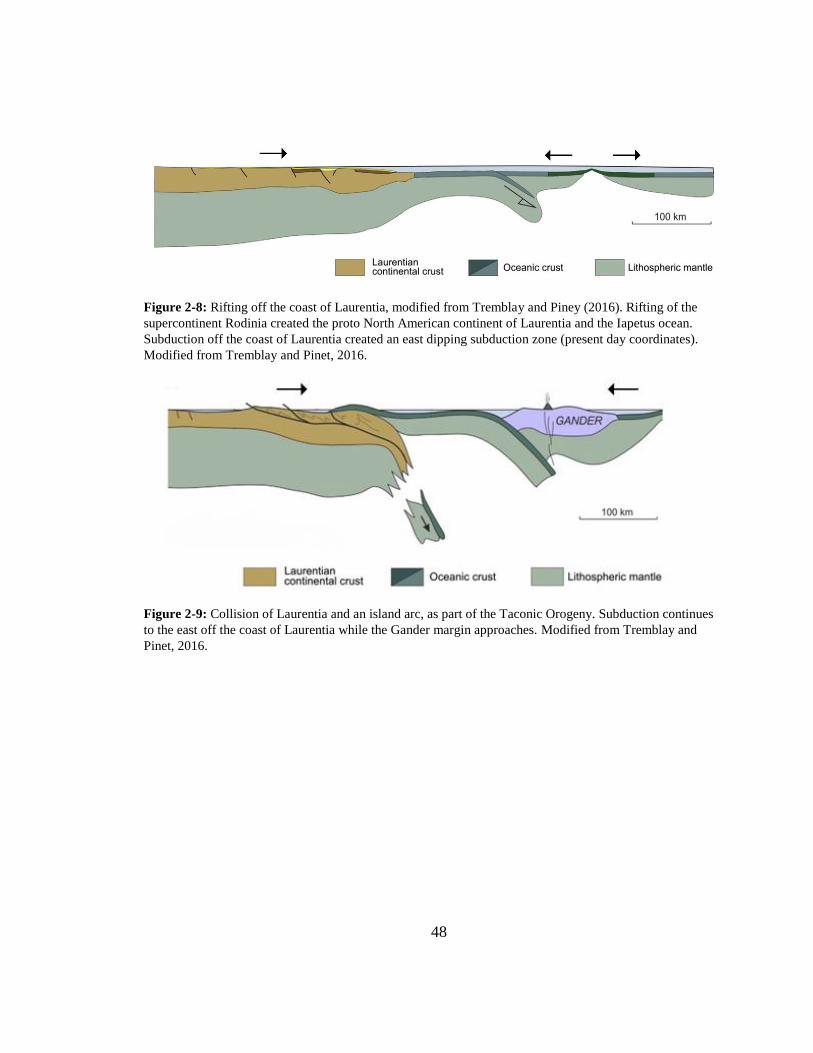
48
Figure 2-8: Rifting off the coast of Laurentia, modified from Tremblay and Piney (2016). Rifting of the
supercontinent Rodinia created the proto North American continent of Laurentia and the Iapetus ocean.
Subduction off the coast of Laurentia created an east dipping subduction zone (present day coordinates).
Modified from Tremblay and Pinet, 2016.
Figure 2-9: Collision of Laurentia and an island arc, as part of the Taconic Orogeny. Subduction continues
to the east off the coast of Laurentia while the Gander margin approaches. Modified from Tremblay and
Pinet, 2016.
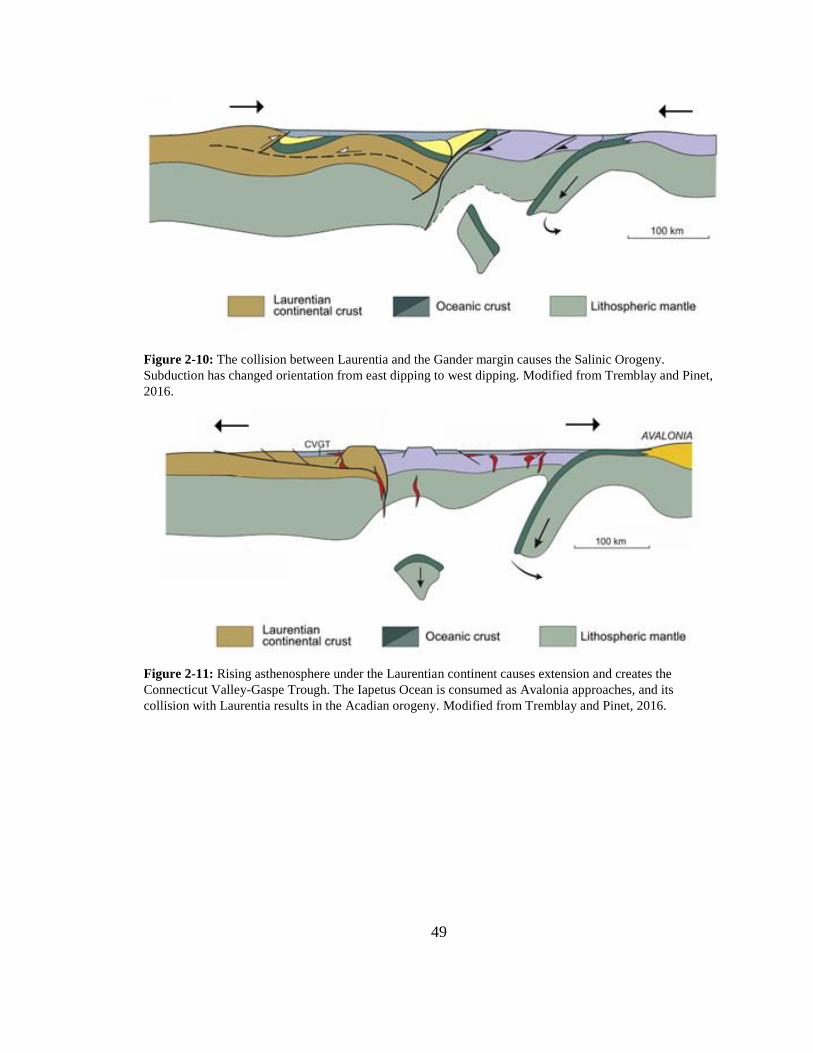
49
Figure 2-10: The collision between Laurentia and the Gander margin causes the Salinic Orogeny.
Subduction has changed orientation from east dipping to west dipping. Modified from Tremblay and Pinet,
2016.
Figure 2-11: Rising asthenosphere under the Laurentian continent causes extension and creates the
Connecticut Valley-Gaspe Trough. The Iapetus Ocean is consumed as Avalonia approaches, and its
collision with Laurentia results in the Acadian orogeny. Modified from Tremblay and Pinet, 2016.
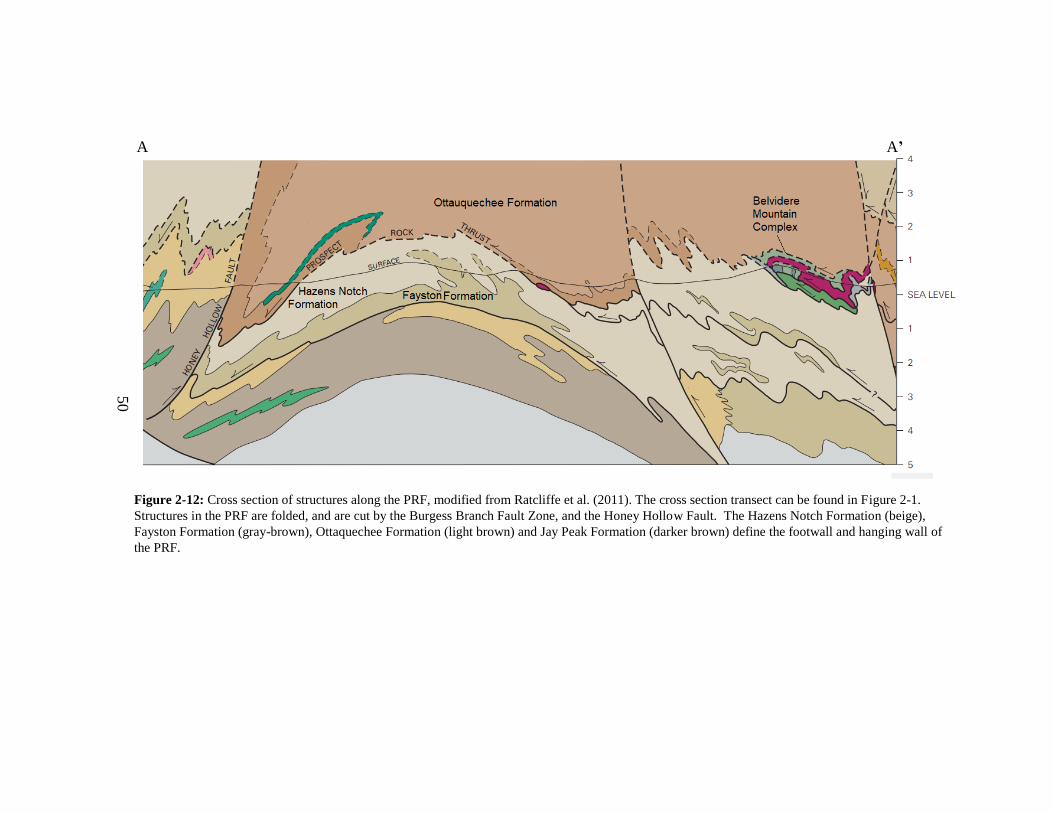
50
Figure 2-12: Cross section of structures along the PRF, modified from Ratcliffe et al. (2011). The cross section transect can be found in Figure 2-1.
Structures in the PRF are folded, and are cut by the Burgess Branch Fault Zone, and the Honey Hollow Fault. The Hazens Notch Formation (beige),
Fayston Formation (gray-brown), Ottaquechee Formation (light brown) and Jay Peak Formation (darker brown) define the footwall and hanging wall of
the PRF.
A
A’
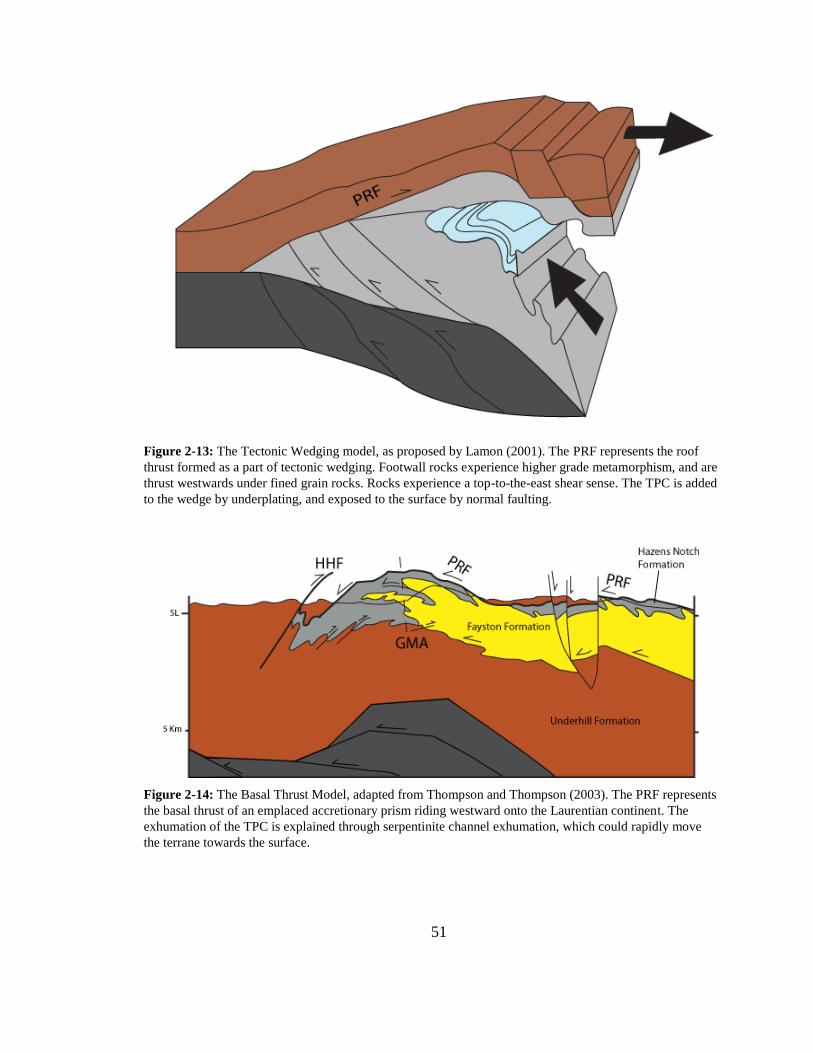
51
Figure 2-13: The Tectonic Wedging model, as proposed by Lamon (2001). The PRF represents the roof
thrust formed as a part of tectonic wedging. Footwall rocks experience higher grade metamorphism, and are
thrust westwards under fined grain rocks. Rocks experience a top-to-the-east shear sense. The TPC is added
to the wedge by underplating, and exposed to the surface by normal faulting.
Figure 2-14: The Basal Thrust Model, adapted from Thompson and Thompson (2003). The PRF represents
the basal thrust of an emplaced accretionary prism riding westward onto the Laurentian continent. The
exhumation of the TPC is explained through serpentinite channel exhumation, which could rapidly move
the terrane towards the surface.
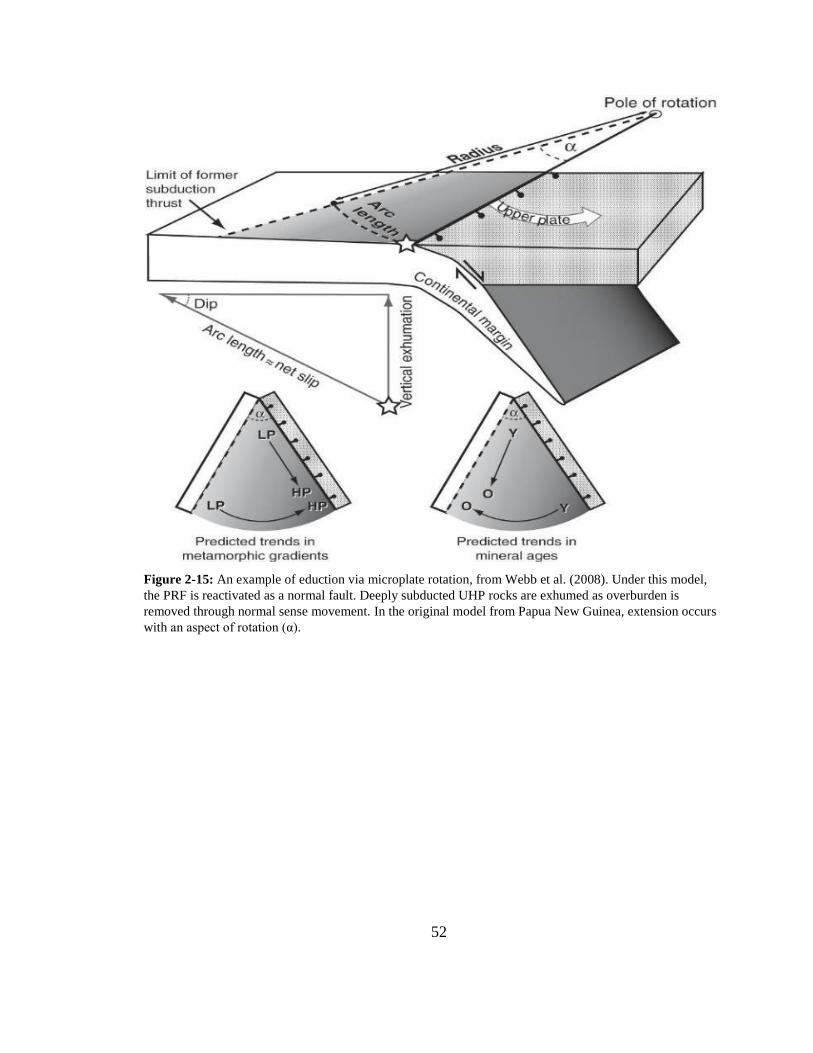
52
Figure 2-15: An example of eduction via microplate rotation, from Webb et al. (2008). Under this model,
the PRF is reactivated as a normal fault. Deeply subducted UHP rocks are exhumed as overburden is
removed through normal sense movement. In the original model from Papua New Guinea, extension occurs
with an aspect of rotation (α).
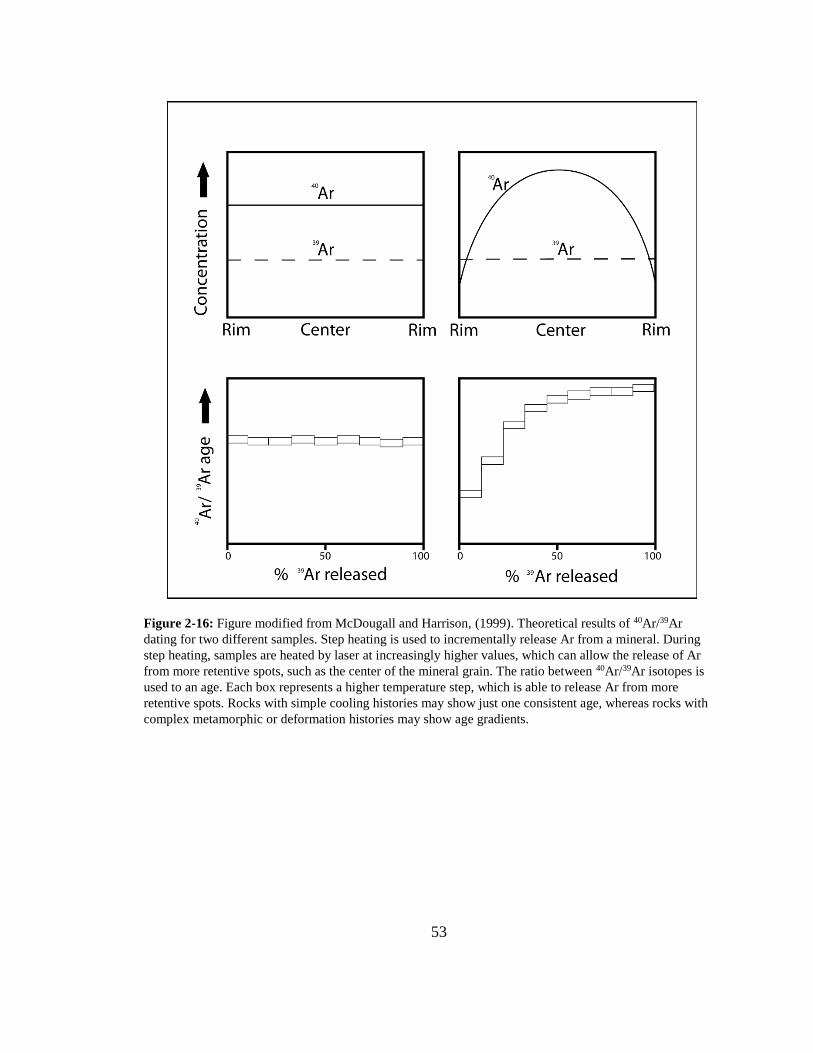
53
Figure 2-16: Figure modified from McDougall and Harrison, (1999). Theoretical results of 40Ar/39Ar
dating for two different samples. Step heating is used to incrementally release Ar from a mineral. During
step heating, samples are heated by laser at increasingly higher values, which can allow the release of Ar
from more retentive spots, such as the center of the mineral grain. The ratio between 40Ar/39Ar isotopes is
used to an age. Each box represents a higher temperature step, which is able to release Ar from more
retentive spots. Rocks with simple cooling histories may show just one consistent age, whereas rocks with
complex metamorphic or deformation histories may show age gradients.
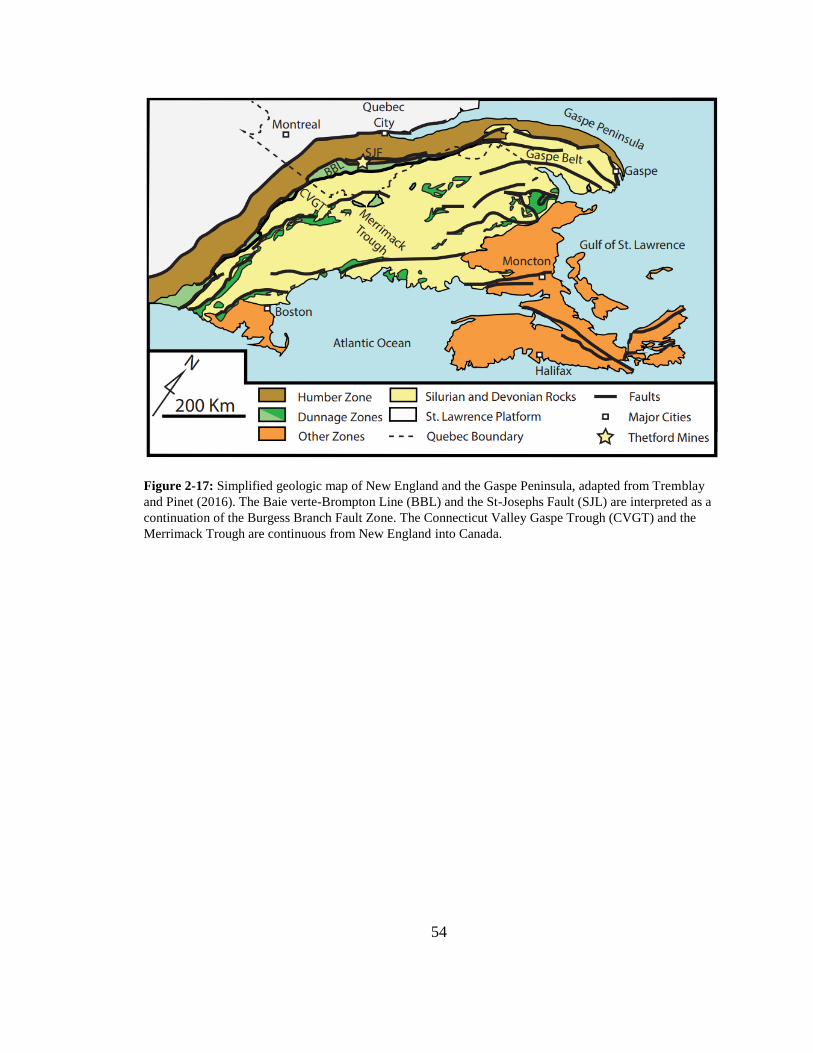
54
Figure 2-17: Simplified geologic map of New England and the Gaspe Peninsula, adapted from Tremblay
and Pinet (2016). The Baie verte-Brompton Line (BBL) and the St-Josephs Fault (SJL) are interpreted as a
continuation of the Burgess Branch Fault Zone. The Connecticut Valley Gaspe Trough (CVGT) and the
Merrimack Trough are continuous from New England into Canada.
55
Chapter 3: Methods
Modes of exhumation utilizing the PRF to exhume the TPC have varying
implications for the resulting microstructures, strain, transport direction, and P-T-t-D
histories along and around the fault. To understand the tectonic significance of the PRF,
microstructural analysis, geochronology and P-T-t-D analysis were employed constrain
its history. This study examines new geochronological dates from the PRF footwall, and
interprets the results within the context of microstructural data, and existing mapping and
structural frameworks.
3.1 Field Component
The field component of this study was conducted during the summer of 2016. The
area was surveyed through five transects that spanned over the footwall of the Prospect
Rock Fault. Transects were oriented E–W and N–S along the footwall of the PRF,
between the Vermont towns of Johnson, Cambridge, Montgomery, and Westfield. Three
major transects were utilized, and are denoted as the northern, middle, and southern
transects (See Figure 2-1 in Chapter 2).
The area was surveyed with three goals: documentation of field structures across
the PRF footwall, identifying lithologies and minerals within the study area, and
collection of oriented samples for use in microstructural, kinematic, and 40Ar/39Ar
analyses. Structural data was utilized from previous studies, including Kim et al., (1999),
Thompson et al., (1999), and Bothner and Laird (1999). Forty oriented samples were
collected during the field study, in addition to structural and lithological observations
56
recorded for over 100 sites in the PRF footwall. Structural data was used to orient hand
samples and thin sections.
3.2 Microstructural Analysis
Orthogonal thin section billets were cut to capture the X-Z and Y-Z sections of
the finite strain ellipse. The X-Z section is parallel to the stretching L2 lineation and
perpendicular to the dominant S2 foliation, and the Y-Z section perpendicular to both the
lineation and foliation. In the absence of L2 lineation, the ‘X-Z’ section was cut parallel
to the dip direction (Figure 3-1). Thin sections were examined with a petrographic
microscope. Analysis of thin sections allowed for selection of target minerals for
40Ar/39Ar dating. Thin sections were described according to microstructural elements as
detailed in Passchier and Trouw (2005). Samples were analyzed to examine potential
kinematic indicators, relationships between foliation generations, and mineral growth in
respect to P-T-t-D changes. Minerals defining foliation, and the relationship between
foliations were utilized to interpret 40Ar/39Ar ages in the context of tectonic events.
Quartz microstructures were used to qualitatively infer temperatures of deformation,
investigating if samples experienced elevated temperatures following deformation or
cooled rapidly. Details on microstructures can be found in the results and discussion
chapters.
3.3 40Ar/39Ar Dating
Samples for 40Ar/39Ar dating were selected after analyzing thin sections for
presence of K-bearing minerals and associated foliations, bearing in mind sample
57
location. White mica and tourmaline were identified in thin section as potential targets,
though only white mica samples were utilized in 40Ar/39Ar dating. Samples were crushed
to 125-500 µm fraction, washed, sonified, and dried to remove lose dust and particulates.
Inclusion free target minerals were handpicked from crushed samples under a bioptic
microscope. Picked minerals were loaded into packets of aluminum foil, which were
inserted into suprasil vials. Vials were placed within an aluminum canister for irradiation.
Samples were irradiated alongside aliquots of Fish Canyon Tuff Sanidine for use as an
apparent flux monitor (age = 28.03 Ma; Renne et al., 1998). Samples were sent to Oregon
State University (Corvallis, Oregon, USA), and were irradiated for 14 hours at the
Cadminum-Lined In-Core Irradiation Tube (CLICIT) reactor.
40Ar/39Ar dating analysis was conducted at University of Vermont Noble Gas
Geochronology Laboratory. Laser step hearting utilized a Santa Cruz Laser Microfurnace
75 W diode laser system. Muscovite samples were loaded into a copper planchet with
1.5mm wells. A Nu Instruments Noblesse magnetic sector noble gas mass spectrometer
was used to analyze argon isotopes released during step-heating. Step-heating analyses
were performed predominantly on single grain samples, but also included multigrain
aliquots. Data corrections were performed to account for mass discrimination,
atmospheric argon, neutron-induced interfering isotopes, and decay of 37Ar and 39Ar.
Mass discrimination was calculated by analyzing known aliquots of atmospheric
argon, with a mass discrimination of 296.8, an error percentage of 0.35, and an assumed
atmospheric value of 298.56 (Lee et al., 2006). Correction factors were calculated to
account for interfering nuclear reactions for irradiated samples by analyzing argon
58
extracted from irradiated samples of CaF2 and K glass. These correction factors are as
follows: (40Ar/39Ar)K = 5.40 x 10⁻⁴ ± 1.35 x 10⁻⁴, (36Ar/37Ar)Ca = 2.65 x 10⁻⁴ ± 2.20 x 10⁻⁵,
(39Ar/37Ar)Ca = 6.95 x 10-04 ± 8.97 x 10⁻⁶ (Jicha and Brown, 2014; Renne et al., 2013)
J factors were calculated for samples through a linear interpolation of sample
positions between flux monitor packets within the irradiation tube. Isotope decay
constants from Steiger and Jäger (1977) and Stoenner et al. (1965) were utilized to
calculate ages. An in-house data reduction program and Isoplot 3.0 were used in age
calculations for both inverse isochron and apparent age data (Ludwig, 2003).
Plateau ages for sample spectra are reported at the 1σ level if the criteria is met to
calculate one (at least three concordant contiguous steps comprising a minimum of 50%
of the 39Ar released; see McDougall and Harrison, 1999). In the absence of plateau ages,
weighted mean averages are reported at the 2σ level. Complete data tables, including J-
factors and errors, can be found in the Appendix.
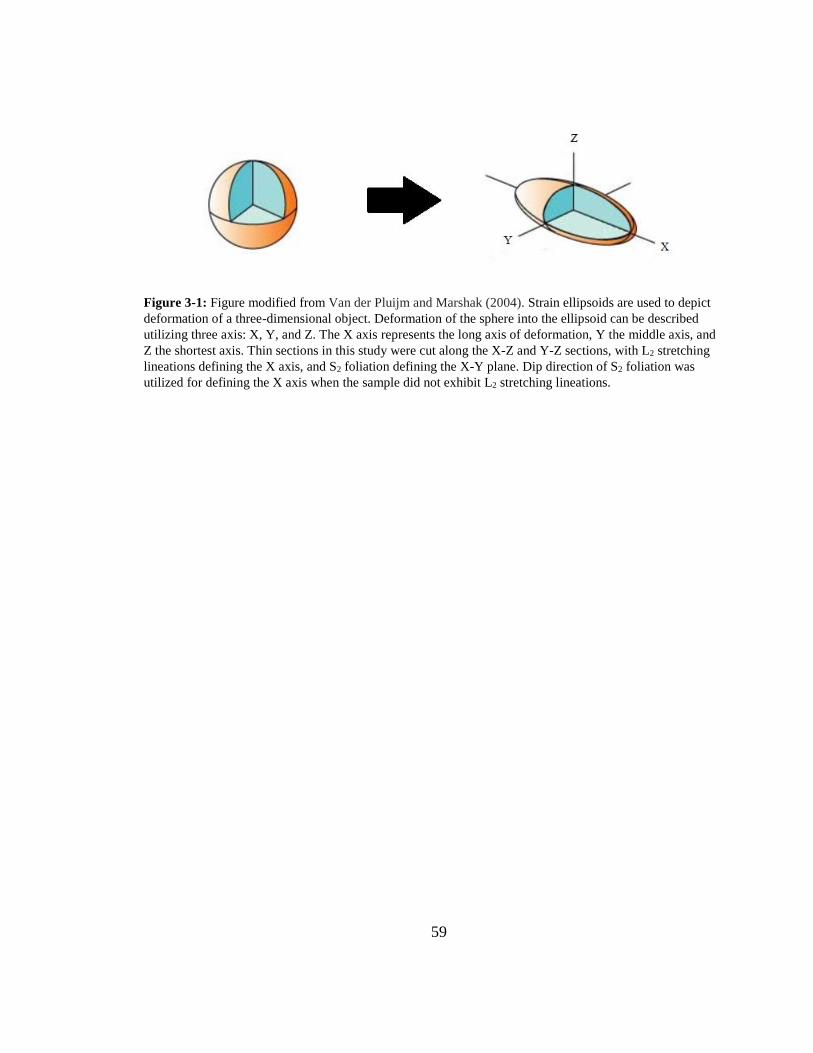
59
Figure 3-1: Figure modified from Van der Pluijm and Marshak (2004). Strain ellipsoids are used to depict
deformation of a three-dimensional object. Deformation of the sphere into the ellipsoid can be described
utilizing three axis: X, Y, and Z. The X axis represents the long axis of deformation, Y the middle axis, and
Z the shortest axis. Thin sections in this study were cut along the X-Z and Y-Z sections, with L2 stretching
lineations defining the X axis, and S2 foliation defining the X-Y plane. Dip direction of S2 foliation was
utilized for defining the X axis when the sample did not exhibit L2 stretching lineations.
60
Chapter 4: Results
4.1 Introduction
This chapter describes the results from both microstructural and 40Ar/39Ar analysis
for samples of interest. Results will be described by transect order, examining the
northern, middle, and southern transects from west to east. Sample locations can be found
in figure 2-1 in Chapter 2. Patterns from sample analysis results, and their implications
for the PRF will be discussed in Chapter 5. Microstructure descriptions will cover several
topics, including mineral assemblage, features that define foliations, kinematic indicators,
and quartz and albite microstructures. The dominant foliation for the thin section is
denoted as Sn, with foliations pre-dating Sn denoted as Sn-1, and foliations post-dating Sn
denoted as Sn+1.
40Ar/39Ar spectra analyses will examine calculated plateau ages, weighted mean
averages, and the age ranges of individual steps when of interest. Major microstructures
per sample, and also 40Ar/39Ar plateau ages are summarized in Tables 4-1 through 4-5.
4.2 Northern Transect
4.2.1 16PR29A
Microstructures
Sample 16PR29A is a schist from the Hazens Notch Formation, obtained on the
western side of the Prospect Rock Fault foot wall. Thin sections exhibit spaced foliation
(Sn), largely defined by quartz microlithons and mica cleavage domains. Mica domains
61
contain white mica and chlorite, with small amounts of biotite. Titanite, albite, and calcite
grains are found sporadically as accessory minerals.
Outcrop foliation was measured as 358⁰/40⁰ (Az), and lineation as 080⁰/40⁰. Mica
and quartz that define the dominant Sn foliation are found truncated by C’ shear bands,
indicating a top-to-the-northwest sense of movement (Figure 4-1). In this sample both the
dominant foliation and lineation dip towards the east, thus top-to-the-northwest shear
aligns with apparent reverse motion. Quartz grain sizes can vary, with some microlithons
containing larger grains than others. Quartz grains shapes are amoeboid, suggesting grain
boundary migration as the predominant deformation mechanism. Grains preserve
evidence of subgrain rotation and limited bulging. Locally, some mica grains are highly
oblique to the Sn foliation, and appear to be truncated by cleavage domains. This could be
evidence of an older foliation (Sn-1).
40Ar/39Ar Step-Heating Results
Two aliquots of single white mica were analyzed from sample 16PR29A (Figure
4-2). Aliquot #1 yielded a reasonably flat spectrum with a plateau age of 457.6 ± 2.0 Ma
(1σ). Steps not included in the plateau age (blue steps) ranged from c. 442–490 Ma. In
comparison, the spectrum obtained from Aliquot #2 displays an age spectrum of c. 479–
431 Ma, with ages decreasing of the course of the experiment. While aliquot #2 did not
yield a plateau age, a weighted mean age of 449.7 ± 4.3 Ma (1σ) is obtained from the
plateau-like segment and is concordant with the plateau age of aliquot #1 at the 2σ level.
4.2.2 16PR08A
Microstructures

62
Sample 16PR08A is from the Hazens Notch Formation, located just north of the
Tillotson Peak Complex. In thin section, the sample is composed of quartz and mica.
Mica domains are predominantly white mica, but also contain chlorite and small amounts
of biotite. Medium sized garnet porphyrobasts are relatively abundant, in addition to
titanite and tourmaline accessory minerals.
An anastomosing spaced foliation (Sn)is defined by mica cleavage domains and
quartz microlithons (Figure 4-3a). Individual mica grains diagonal to Sn appear locally in
thin section, and may represent Sn-1 when truncated by mica grains oriented along Sn, and
potentially Sn-2 when orthogonally oriented micas. However, diagonal mica grains and
anastomosing micas are hard to differentiate. Garnets are idiomorphic, and exhibit
fractures perpendicular to foliation (Figure 4-3b).
Quartz grains are amoeboid and display subgrains within individual quartz grains,
suggesting grain boundary migration and subgrain rotation were active in this sample.
Some grains preserve limited evidence of grain boundary area reduction, bulging, and
undulose extinction.
40Ar/39Ar Step-Heating Results
Two aliquots of single grains of white mica were analyzed from sample 16PR08A
(Figure 4-4). Both aliquot #1 and #2 yielded plateau ages of 458.6 ± 2.0 Ma (1σ) and
456.7 ± 1.8 Ma (1σ), respectively. These ages are concordant and both are composed of
steps comprising 100% of the Ar released.
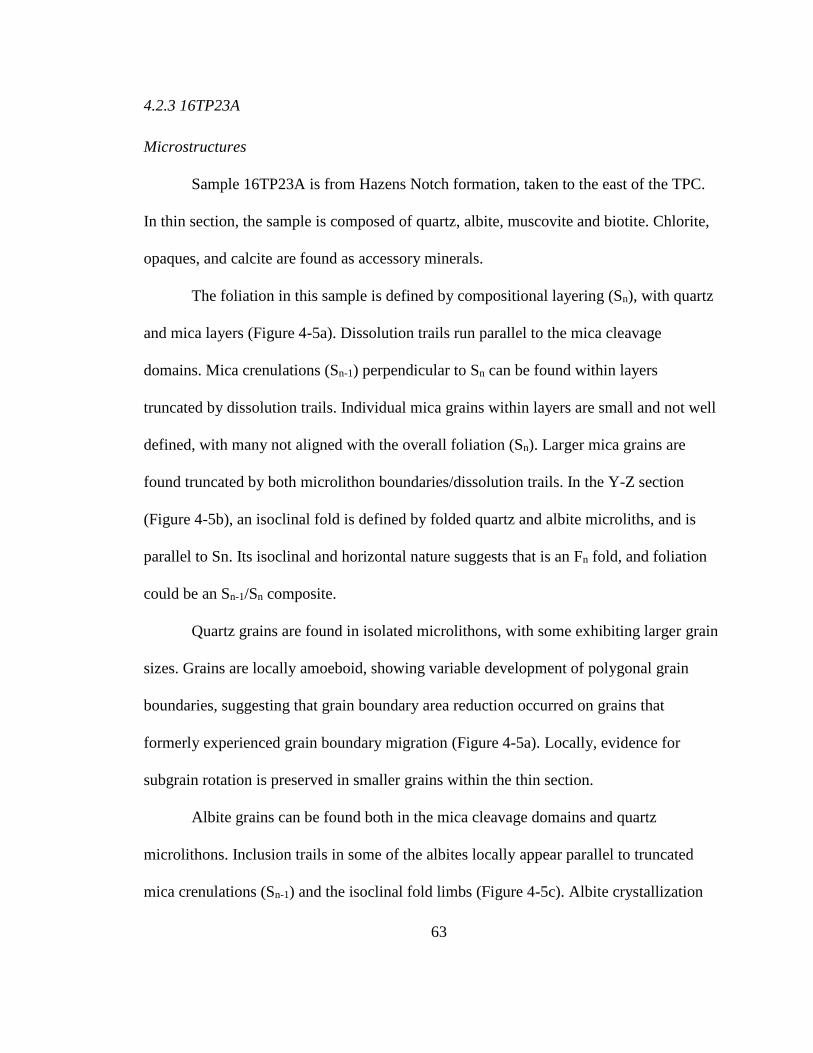
63
4.2.3 16TP23A
Microstructures
Sample 16TP23A is from Hazens Notch formation, taken to the east of the TPC.
In thin section, the sample is composed of quartz, albite, muscovite and biotite. Chlorite,
opaques, and calcite are found as accessory minerals.
The foliation in this sample is defined by compositional layering (Sn), with quartz
and mica layers (Figure 4-5a). Dissolution trails run parallel to the mica cleavage
domains. Mica crenulations (Sn-1) perpendicular to Sn can be found within layers
truncated by dissolution trails. Individual mica grains within layers are small and not well
defined, with many not aligned with the overall foliation (Sn). Larger mica grains are
found truncated by both microlithon boundaries/dissolution trails. In the Y-Z section
(Figure 4-5b), an isoclinal fold is defined by folded quartz and albite microliths, and is
parallel to Sn. Its isoclinal and horizontal nature suggests that is an Fn fold, and foliation
could be an Sn-1/Sn composite.
Quartz grains are found in isolated microlithons, with some exhibiting larger grain
sizes. Grains are locally amoeboid, showing variable development of polygonal grain
boundaries, suggesting that grain boundary area reduction occurred on grains that
formerly experienced grain boundary migration (Figure 4-5a). Locally, evidence for
subgrain rotation is preserved in smaller grains within the thin section.
Albite grains can be found both in the mica cleavage domains and quartz
microlithons. Inclusion trails in some of the albites locally appear parallel to truncated
mica crenulations (Sn-1) and the isoclinal fold limbs (Figure 4-5c). Albite crystallization
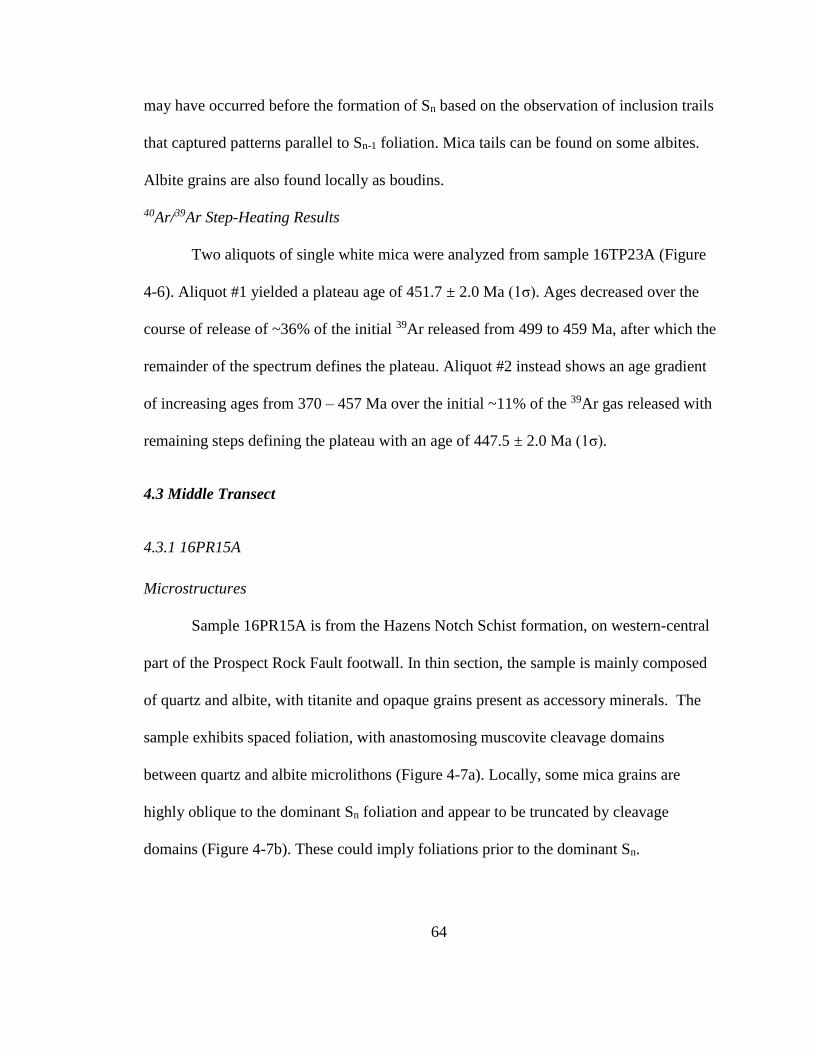
64
may have occurred before the formation of Sn based on the observation of inclusion trails
that captured patterns parallel to Sn-1 foliation. Mica tails can be found on some albites.
Albite grains are also found locally as boudins.
40Ar/39Ar Step-Heating Results
Two aliquots of single white mica were analyzed from sample 16TP23A (Figure
4-6). Aliquot #1 yielded a plateau age of 451.7 ± 2.0 Ma (1σ). Ages decreased over the
course of release of ~36% of the initial 39Ar released from 499 to 459 Ma, after which the
remainder of the spectrum defines the plateau. Aliquot #2 instead shows an age gradient
of increasing ages from 370 – 457 Ma over the initial ~11% of the 39Ar gas released with
remaining steps defining the plateau with an age of 447.5 ± 2.0 Ma (1σ).
4.3 Middle Transect
4.3.1 16PR15A
Microstructures
Sample 16PR15A is from the Hazens Notch Schist formation, on western-central
part of the Prospect Rock Fault footwall. In thin section, the sample is mainly composed
of quartz and albite, with titanite and opaque grains present as accessory minerals. The
sample exhibits spaced foliation, with anastomosing muscovite cleavage domains
between quartz and albite microlithons (Figure 4-7a). Locally, some mica grains are
highly oblique to the dominant Sn foliation and appear to be truncated by cleavage
domains (Figure 4-7b). These could imply foliations prior to the dominant Sn.
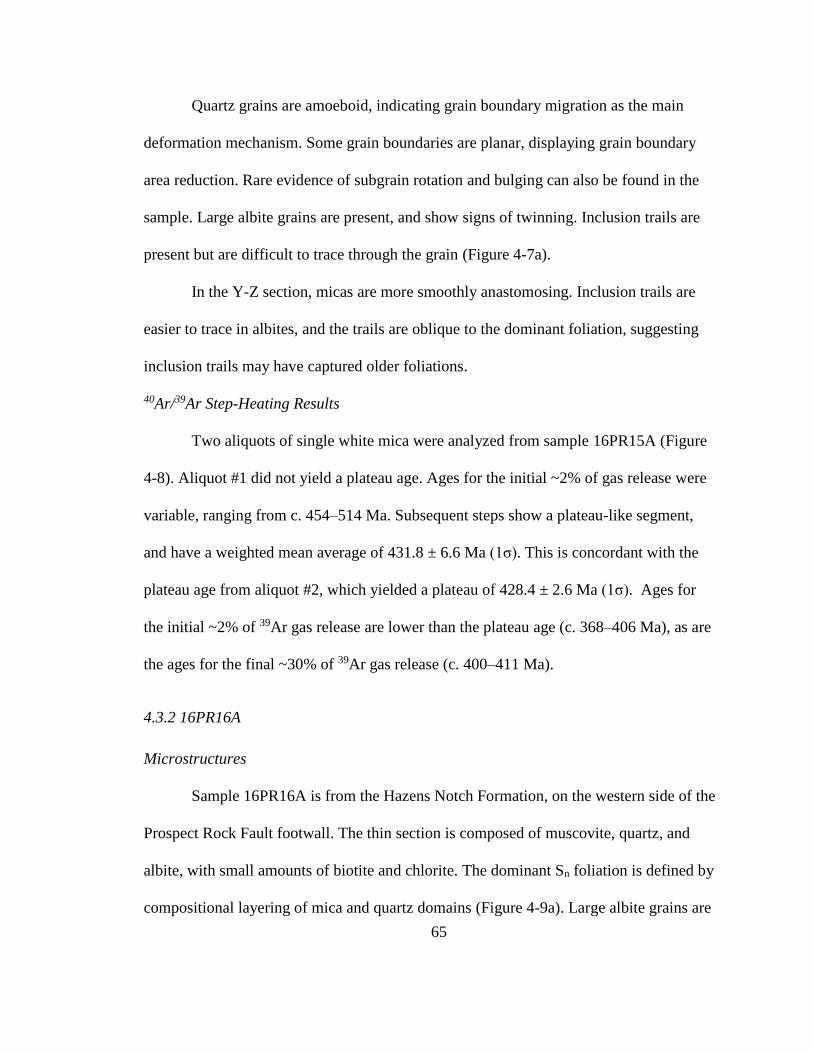
65
Quartz grains are amoeboid, indicating grain boundary migration as the main
deformation mechanism. Some grain boundaries are planar, displaying grain boundary
area reduction. Rare evidence of subgrain rotation and bulging can also be found in the
sample. Large albite grains are present, and show signs of twinning. Inclusion trails are
present but are difficult to trace through the grain (Figure 4-7a).
In the Y-Z section, micas are more smoothly anastomosing. Inclusion trails are
easier to trace in albites, and the trails are oblique to the dominant foliation, suggesting
inclusion trails may have captured older foliations.
40Ar/39Ar Step-Heating Results
Two aliquots of single white mica were analyzed from sample 16PR15A (Figure
4-8). Aliquot #1 did not yield a plateau age. Ages for the initial ~2% of gas release were
variable, ranging from c. 454–514 Ma. Subsequent steps show a plateau-like segment,
and have a weighted mean average of 431.8 ± 6.6 Ma (1σ). This is concordant with the
plateau age from aliquot #2, which yielded a plateau of 428.4 ± 2.6 Ma (1σ). Ages for
the initial ~2% of 39Ar gas release are lower than the plateau age (c. 368–406 Ma), as are
the ages for the final ~30% of 39Ar gas release (c. 400–411 Ma).
4.3.2 16PR16A
Microstructures
Sample 16PR16A is from the Hazens Notch Formation, on the western side of the
Prospect Rock Fault footwall. The thin section is composed of muscovite, quartz, and
albite, with small amounts of biotite and chlorite. The dominant Sn foliation is defined by
compositional layering of mica and quartz domains (Figure 4-9a). Large albite grains are
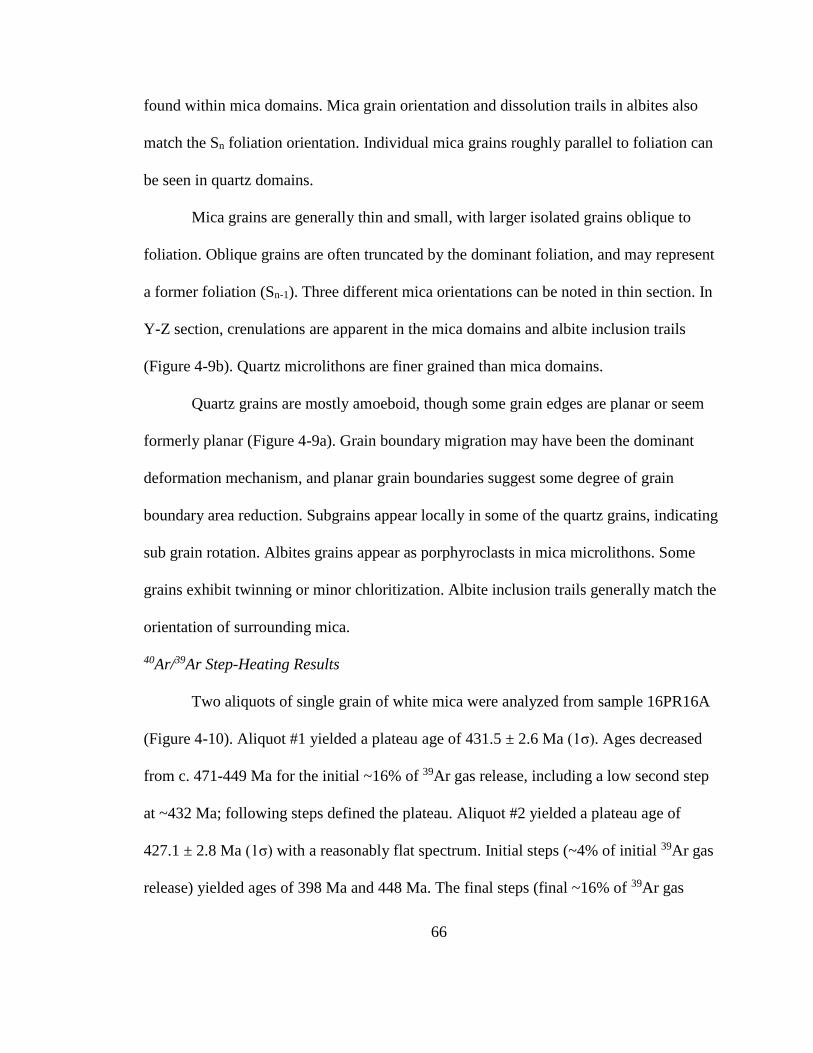
66
found within mica domains. Mica grain orientation and dissolution trails in albites also
match the Sn foliation orientation. Individual mica grains roughly parallel to foliation can
be seen in quartz domains.
Mica grains are generally thin and small, with larger isolated grains oblique to
foliation. Oblique grains are often truncated by the dominant foliation, and may represent
a former foliation (Sn-1). Three different mica orientations can be noted in thin section. In
Y-Z section, crenulations are apparent in the mica domains and albite inclusion trails
(Figure 4-9b). Quartz microlithons are finer grained than mica domains.
Quartz grains are mostly amoeboid, though some grain edges are planar or seem
formerly planar (Figure 4-9a). Grain boundary migration may have been the dominant
deformation mechanism, and planar grain boundaries suggest some degree of grain
boundary area reduction. Subgrains appear locally in some of the quartz grains, indicating
sub grain rotation. Albites grains appear as porphyroclasts in mica microlithons. Some
grains exhibit twinning or minor chloritization. Albite inclusion trails generally match the
orientation of surrounding mica.
40Ar/39Ar Step-Heating Results
Two aliquots of single grain of white mica were analyzed from sample 16PR16A
(Figure 4-10). Aliquot #1 yielded a plateau age of 431.5 ± 2.6 Ma (1σ). Ages decreased
from c. 471-449 Ma for the initial ~16% of 39Ar gas release, including a low second step
at ~432 Ma; following steps defined the plateau. Aliquot #2 yielded a plateau age of
427.1 ± 2.8 Ma (1σ) with a reasonably flat spectrum. Initial steps (~4% of initial 39Ar gas
release) yielded ages of 398 Ma and 448 Ma. The final steps (final ~16% of 39Ar gas
67
release) were not included in the plateau age calculation, and had ages of 398 Ma and 421
Ma.
4.3.3 16PR21A
Microstructures
Sample 16PR21A is from the Fayston Formation, taken from the middle transect
of the PRF footwall. The thin section is largely composed of quartz, muscovite, and
biotite, and exhibits anastomosing spaced foliation (Sn). Dissolution trails also help to
define Sn (Figure 4-11a). Quartz and mica microlithons are separated by mica cleavage
domains. Medium to large sized albite grains are found locally in quartz microlithons.
Mica grains are very fine grained.
In the X-Z section, crenulations can be found within smaller truncated
microlithons and cleavage domains, defining Sn-1 (Figure 4-6A). In Y-Z section, a
crenulation cleavage is apparent in mica microlithons, defining Sn+1 (Figure 4-11b).
Quartz grains are small to medium sized within microlithons. Quartz grains are generally
amoeboid but occasionally exhibit planar edges, indicating deformation via grain
boundary migration deformation and later grain boundary area reduction.
Large albite grains are present locally in quartz microlithons. Inclusion trails
within the albite parallel Sn, and in Y-Z section capture crenulations. Albite grains also
appear bent, and match the anastomosing foliation with its geometry.
40Ar/39Ar Step-Heating Results
Two aliquots of single white mica grains were analyzed from sample 16PR21A
(Figure 4-12). Aliquot #1 yielded a plateau age of 432.0 ± 2.1 Ma (1σ). Ages for the
68
initial ~65% of 39Ar gas release defined the plateau. The following 14% of 39Ar gas
release (next two steps) were not included in the plateau calculations, and had ages of 411
Ma and 410 Ma. The final step had an age concordant with the plateau age (429 Ma), but
was not included in the plateau calculation. Aliquot #2 did not yield a plateau age. Step
ages generally fluctuated between ~439–416 Ma, with a weighted mean average of 426.9
± 5.8 (1σ). Two steps at 467 Ma and at 387 Ma were excluded from the calculation.
4.3.4 16PR28A
Microstructures
Sample 16PR28A is from the Hazens Notch formation, on the eastern side of the
Prospect Rock Fault footwall. The thin section is largely dominated by quartz
microlithons, with mica cleavage domains containing both biotite and white mica. The
dominant foliation appears as spaced foliation (Sn). Albite appears as large grains and
boudins. Opaque minerals, potentially magnetite, are present as accessory minerals.
Spaced foliation (Sn) is defined by dissolution seams and mica cleavage domains,
and is generally anastomosing (Figure 4-13a). Sn-1 foliation appears as crenulated mica
domains trapped between the main foliation. Axial planes to crenulations appear parallel
to Sn. In the Y-Z section (Figure 4-13b), mica cleavage domains are bent into
crenulations (Sn+1), trending differently than those found in the X-Z section.
Mica grains are generally small and thin. Quartz grains are small to medium
sized, and appear either amoeboid or polygonal, recording evidence for both grain
boundary migration and local grain boundary area reduction. Albite grains are present in
the quartz domains, exhibit deformation twinning, and can be locally found as boudin
69
chains (Figure 4-13a). Inclusion trails within albite grains define an internal foliation
locally perpendicular to the dominant external Sn, suggesting preservation of Sn-1. In the
Y-Z section, crenulations parallel to Sn+1 are captured in the inclusion trails.
40Ar/39Ar Step-Heating Results
Two aliquots of white mica were analyzed from sample 16P28A, with aliquot #1
utilizing a single grain and aliquot #2 utilizing two grains (Figure 4-14). Aliquot #1 did
not yield a plateau age. Ages increased from ~339 to 440 Ma in 5-72% of the initial 39Ar
gas release, and then decreased to ~375 Ma over the rest of the gas release. A large
percentage of steps fell between 400-440 Ma. A weighted mean average of those steps
was calculated at 416.6 ± 8.0 Ma (1σ). Aliquot #2 yielded with a plateau age of 447.8 ±
2.1 Ma (1σ). Steps within the plateau fluctuated between ~432–464 Ma. The initial step
(~2% of initial 39Ar gas release) was not included in the plateau, and had an age of ~424
Ma.
4.4 Southern Transect
4.4.1 16PR05A
Microstructures
Sample 16PR05A is from the Hazens Notch formation, on the western limits of
the Prospect Rock Fault footwall. In thin section, the sample is composed of quartz,
muscovite and biotite, with small undeformed garnet porphyroclasts and rare large albite
grains. The sample exhibits spaced foliation, with mica and quartz microlithons and
cleavage domains defined by parallel mica and pressure solution seams (Figure 4-15). An
70
S-C’ fabric is apparent from the anastomosing and truncated foliations in the X-Z section.
The sample foliation was recorded as 176⁰/23⁰ (Az), with lineations as 266⁰/23⁰. S-C’
fabric is consistent with a top-to-the-east sense of movement. In this sample the dominant
foliation and lineation dip towards the west, thus top-to-the-east shear aligns with
apparent reverse motion.
Mica grains are thin and small, though chlorite grains are larger. Local large mica
grains appear oblique to the foliation, and are truncated by dissolution seams. Grains
could represent an older foliation, but are not frequent enough to be conclusive.
Quartz grains appear either polygonal or amoeboid, suggesting the occurrence of
grain boundary area reduction and grain boundary migration (Figure 4-15). Few grains
exhibit subgrains and small protrusions on their edges, suggesting that subgrain rotation
and bulging also occurred as a part of deformation. Most grains are small to medium in
size. Albite grains appear elongated, and are bound by dissolution seams.
40Ar/39Ar Step-Heating Results
Two aliquots of white mica were analyzed from sample 16PR05A. Aliquot #1 did
not yield a plateau age, and produced large range of ages, from between 30 and 405 Ma
(Figure 4-16). Ages mostly fell between three age brackets: 352–405 Ma, 197–245 Ma,
and 28–89 Ma. A weighted mean average of 383 ± 100 Ma (1σ) was calculated. Aliquot
#2 yielded a reasonably flat spectrum, with a plateau age of 419.3 ± 2.4 Ma (1σ, Figure 4-
17). The first two steps (~3% of the initial 39Ar gas released) decreased from ~509–456
Ma, after which the remainder of the spectrum defines the plateau.
71
4.4.2 16PR33A
Microstructures
Sample 16PR33A is from the Hazens Notch Formation, from the southern section
of the Prospect Rock Fault footwall. The sample is largely composed of quartz, mica, and
albite, with very small amounts of garnet. The spaced foliation (Sn) in the sample is
slightly anastomosing, and composed of quartz + albite domains, separated by mica
microlithons and cleavage domains (Figure 4-18). Mica microlithons are composed of
muscovite and biotite.
Mica grains are predominantly thin and small, with locally large mica grains in
mica microlithons often appearing oblique to the foliation. These either represent static
recrystallization or an older foliation. In the Y-Z section, mica microlithons and cleavage
domains are more anastomosing. Quartz microlithons are thin, from 1–4 grains thick.
Quartz grains are medium to large in size, and generally amoeboid, suggesting grain
boundary migration as the main deformation mechanism. Polygonal quartz grains are also
not uncommon, implying the occurrence of grain boundary area reduction.
Albite grains are large, and generally sigmoidal in shape. Some grains are show
deformational twinning, and are pinned between mica and quartz microlithons. Inclusion
trails internal to albites are locally continuous with the external Sn. Wing-like muscovite
and biotite structures can be found on the edges of albite grains (Figure 4-18).
40Ar/39Ar Step-Heating Results
Two aliquots of single white mica were analyzed from sample 16PR33A (Figure
4-19). Aliquot #1 yielded a plateau of 420.0 ± 2.7 Ma (1σ), with ages decreasing from
72
~433–408 Ma over the plateau. The final step was not included in the plateau, and had an
age of ~395 Ma. Aliquot #2 yielded a plateau of 428.7 ± 2.9 Ma (1σ), with ages
increasing from 440-465 Ma over the first four steps (initial ~18% of 39Ar gas release,
steps not included in plateau). The remainder of the steps in the spectrum defined the
plateau.
4.4.3 16PR04B
Microstructures
Sample 16PR04B is a quartzite member of the Hazens Notch formation, taken
from the southern part of the Prospect Rock Fault footwall. The sample is almost entirely
composed of quartz, with small grains of biotite and white mica. Foliation in the X-Z
section is defined by mica orientation (Figure 4-20). In the Y-Z section, there is no
semblance of foliation.
Quartz grains are small and appear with small bulged edges, suggesting bulging
as the main deformation mechanism (Figure 4-20). Some subgrains and polygonal edges
can be found on some quartz grain, indicating some subgrain rotation and grain boundary
area reduction has occurred. A band of highly deformed quartz cuts the thin section
oblique to foliation.
40Ar/39Ar Step-Heating Results
Two aliquots of white mica were analyzed from sample 16PR04B (Figure 4-21).
Aliquot #1 did not yield a plateau. Ages decreased from 427 to 382 Ma. A weighted
mean average of steps with ages older than 400 Ma yielded an age of 422 ± 8.6 Ma (1σ).
Aliquot #2 utilized three grains, but did not yield enough Ar gas to generate an age.
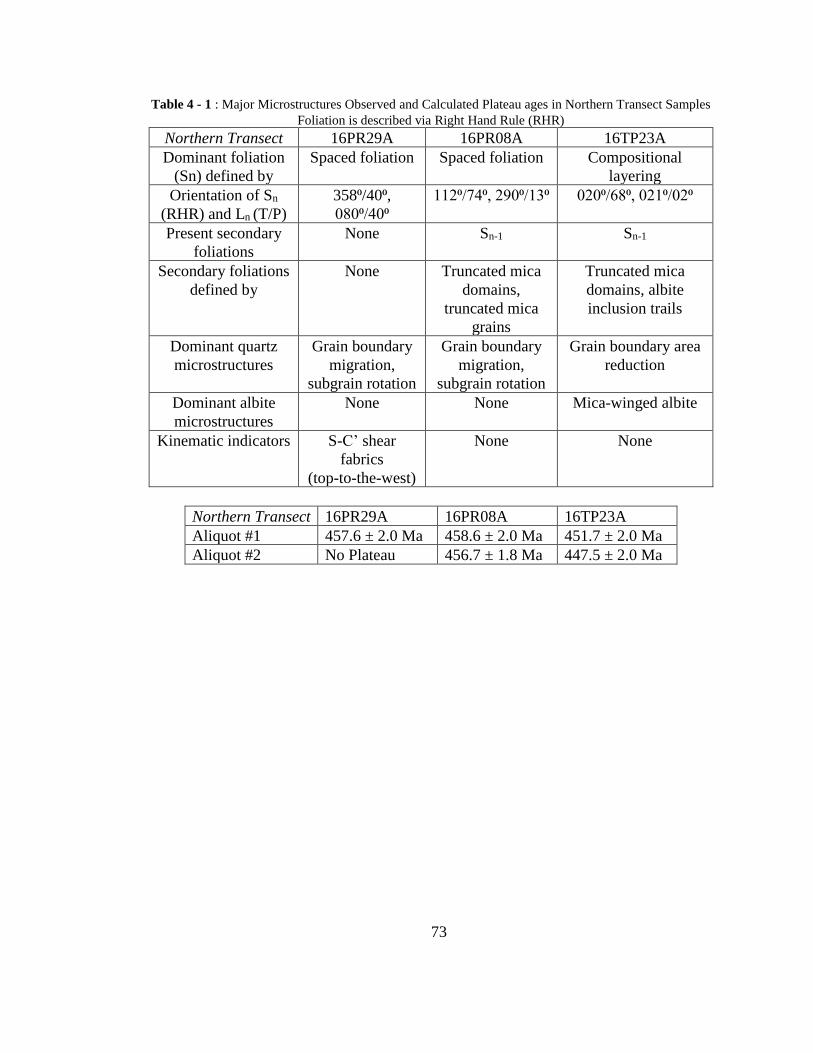
73
Table 4 - 1 : Major Microstructures Observed and Calculated Plateau ages in Northern Transect Samples
Foliation is described via Right Hand Rule (RHR)
Northern Transect 16PR29A 16PR08A 16TP23A
Dominant foliation
(Sn) defined by
Spaced foliation Spaced foliation Compositional
layering
Orientation of Sn
(RHR) and Ln (T/P)
358⁰/40⁰,
080⁰/40⁰
112⁰/74⁰, 290⁰/13⁰ 020⁰/68⁰, 021⁰/02⁰
Present secondary
foliations
None Sn-1 Sn-1
Secondary foliations
defined by
None Truncated mica
domains,
truncated mica
grains
Truncated mica
domains, albite
inclusion trails
Dominant quartz
microstructures
Grain boundary
migration,
subgrain rotation
Grain boundary
migration,
subgrain rotation
Grain boundary area
reduction
Dominant albite
microstructures
None None Mica-winged albite
Kinematic indicators S-C’ shear
fabrics
(top-to-the-west)
None None
Northern Transect 16PR29A 16PR08A 16TP23A
Aliquot #1 457.6 ± 2.0 Ma 458.6 ± 2.0 Ma 451.7 ± 2.0 Ma
Aliquot #2 No Plateau 456.7 ± 1.8 Ma 447.5 ± 2.0 Ma
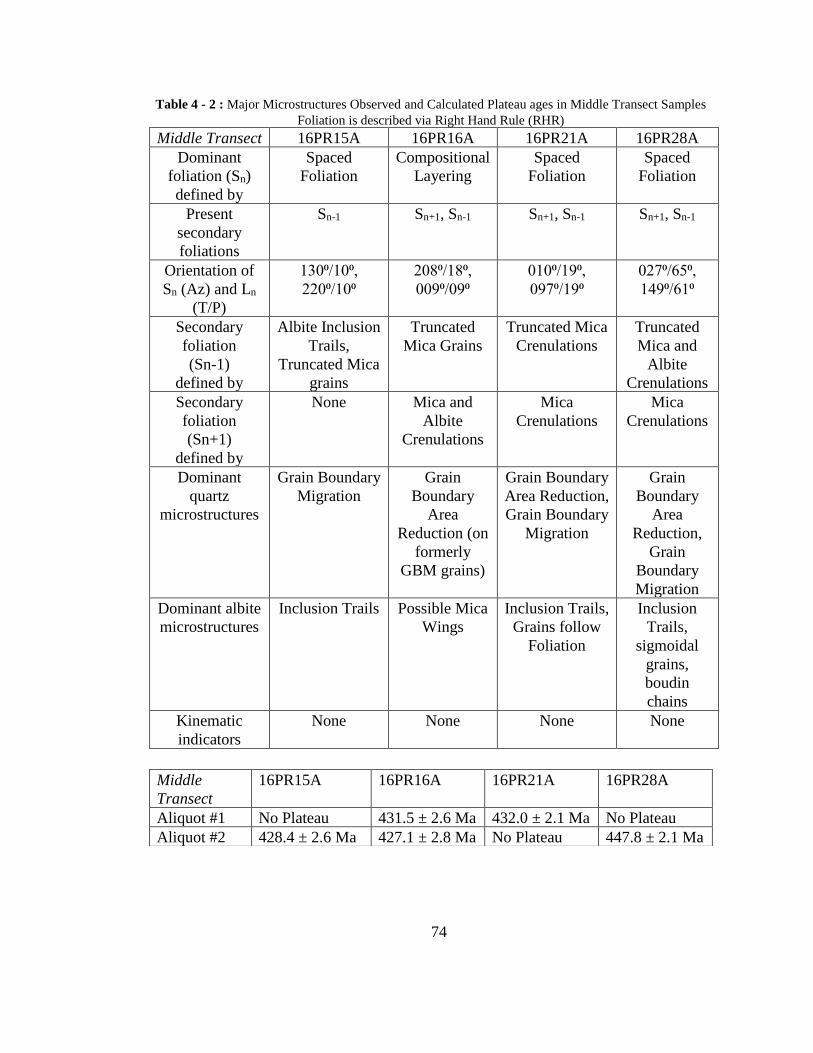
74
Table 4 - 2 : Major Microstructures Observed and Calculated Plateau ages in Middle Transect Samples
Foliation is described via Right Hand Rule (RHR)
Middle Transect 16PR15A 16PR16A 16PR21A 16PR28A
Dominant
foliation (Sn)
defined by
Spaced
Foliation
Compositional
Layering
Spaced
Foliation
Spaced
Foliation
Present
secondary
foliations
Sn-1 Sn+1, Sn-1 Sn+1, Sn-1 Sn+1, Sn-1
Orientation of
Sn (Az) and Ln
(T/P)
130⁰/10⁰,
220⁰/10⁰
208⁰/18⁰,
009⁰/09⁰
010⁰/19⁰,
097⁰/19⁰
027⁰/65⁰,
149⁰/61⁰
Secondary
foliation
(Sn-1)
defined by
Albite Inclusion
Trails,
Truncated Mica
grains
Truncated
Mica Grains
Truncated Mica
Crenulations
Truncated
Mica and
Albite
Crenulations
Secondary
foliation
(Sn+1)
defined by
None Mica and
Albite
Crenulations
Mica
Crenulations
Mica
Crenulations
Dominant
quartz
microstructures
Grain Boundary
Migration
Grain
Boundary
Area
Reduction (on
formerly
GBM grains)
Grain Boundary
Area Reduction,
Grain Boundary
Migration
Grain
Boundary
Area
Reduction,
Grain
Boundary
Migration
Dominant albite
microstructures
Inclusion Trails Possible Mica
Wings
Inclusion Trails,
Grains follow
Foliation
Inclusion
Trails,
sigmoidal
grains,
boudin
chains
Kinematic
indicators
None None None None
Middle
Transect
16PR15A 16PR16A 16PR21A 16PR28A
Aliquot #1 No Plateau 431.5 ± 2.6 Ma 432.0 ± 2.1 Ma No Plateau
Aliquot #2 428.4 ± 2.6 Ma 427.1 ± 2.8 Ma No Plateau 447.8 ± 2.1 Ma
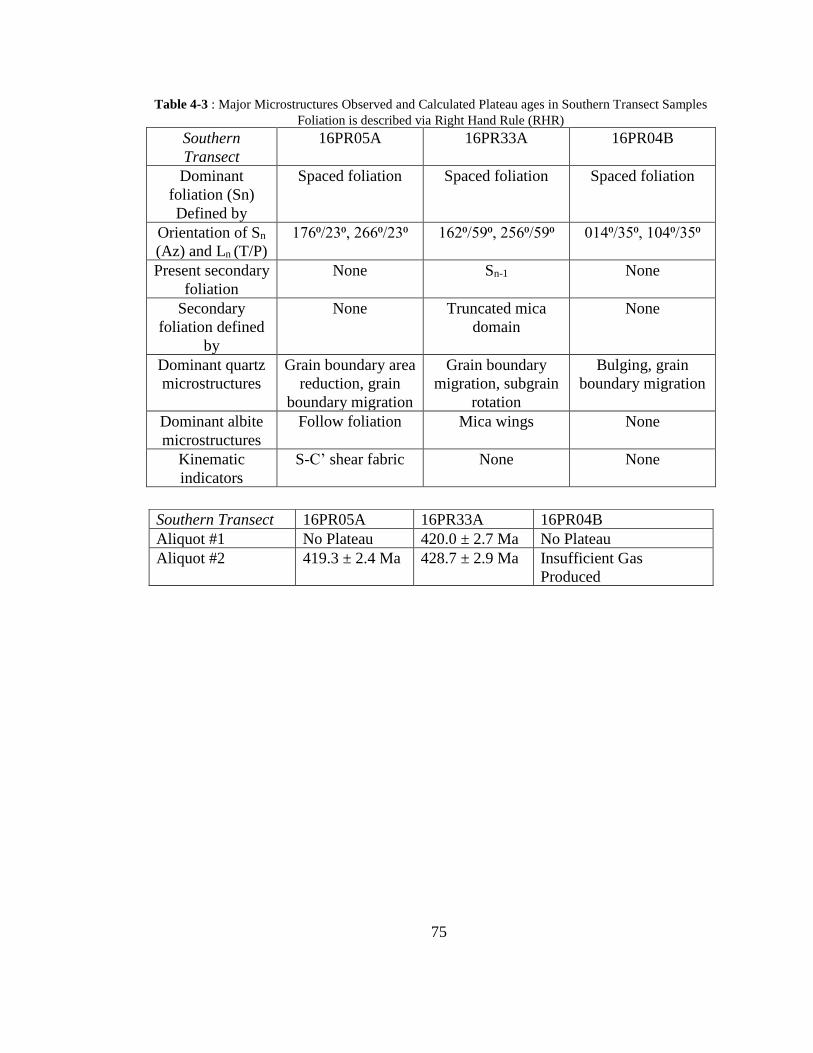
75
Table 4-3 : Major Microstructures Observed and Calculated Plateau ages in Southern Transect Samples
Foliation is described via Right Hand Rule (RHR)
Southern
Transect
16PR05A 16PR33A 16PR04B
Dominant
foliation (Sn)
Defined by
Spaced foliation Spaced foliation Spaced foliation
Orientation of Sn
(Az) and Ln (T/P)
176⁰/23⁰, 266⁰/23⁰ 162⁰/59⁰, 256⁰/59⁰ 014⁰/35⁰, 104⁰/35⁰
Present secondary
foliation
None Sn-1 None
Secondary
foliation defined
by
None Truncated mica
domain
None
Dominant quartz
microstructures
Grain boundary area
reduction, grain
boundary migration
Grain boundary
migration, subgrain
rotation
Bulging, grain
boundary migration
Dominant albite
microstructures
Follow foliation Mica wings None
Kinematic
indicators
S-C’ shear fabric None None
Southern Transect 16PR05A 16PR33A 16PR04B
Aliquot #1 No Plateau 420.0 ± 2.7 Ma No Plateau
Aliquot #2 419.3 ± 2.4 Ma 428.7 ± 2.9 Ma Insufficient Gas
Produced
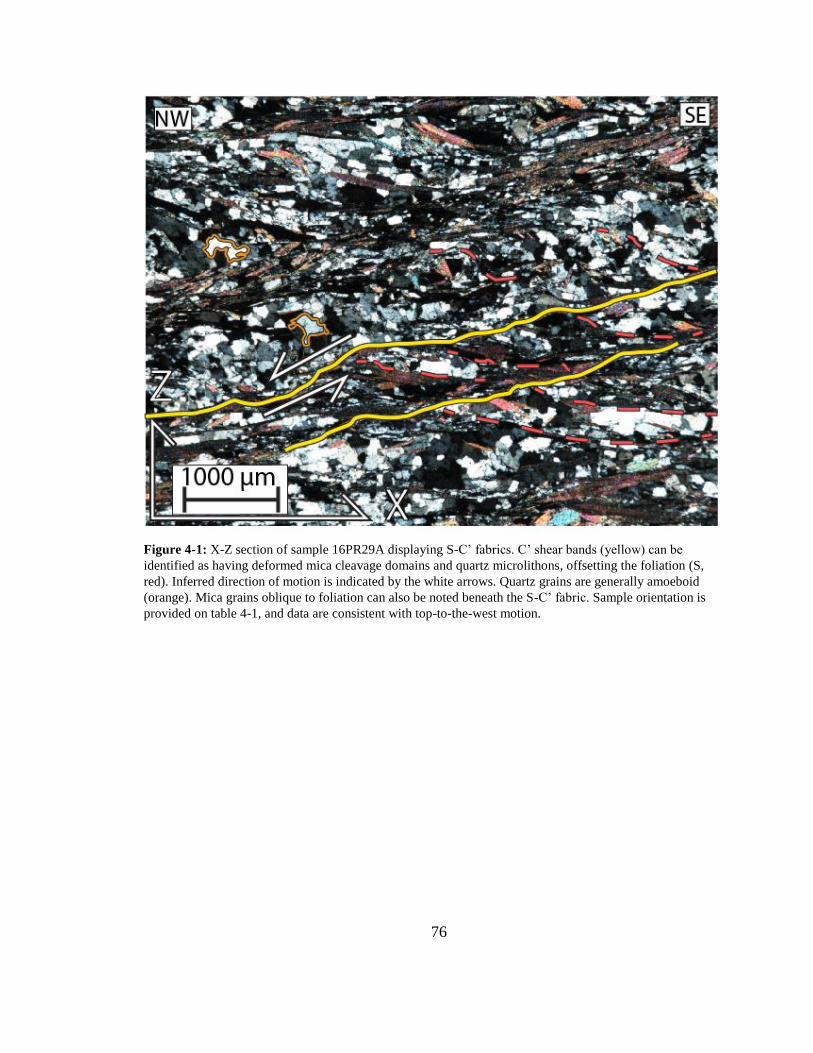
76
Figure 4-1: X-Z section of sample 16PR29A displaying S-C’ fabrics. C’ shear bands (yellow) can be
identified as having deformed mica cleavage domains and quartz microlithons, offsetting the foliation (S,
red). Inferred direction of motion is indicated by the white arrows. Quartz grains are generally amoeboid
(orange). Mica grains oblique to foliation can also be noted beneath the S-C’ fabric. Sample orientation is
provided on table 4-1, and data are consistent with top-to-the-west motion.
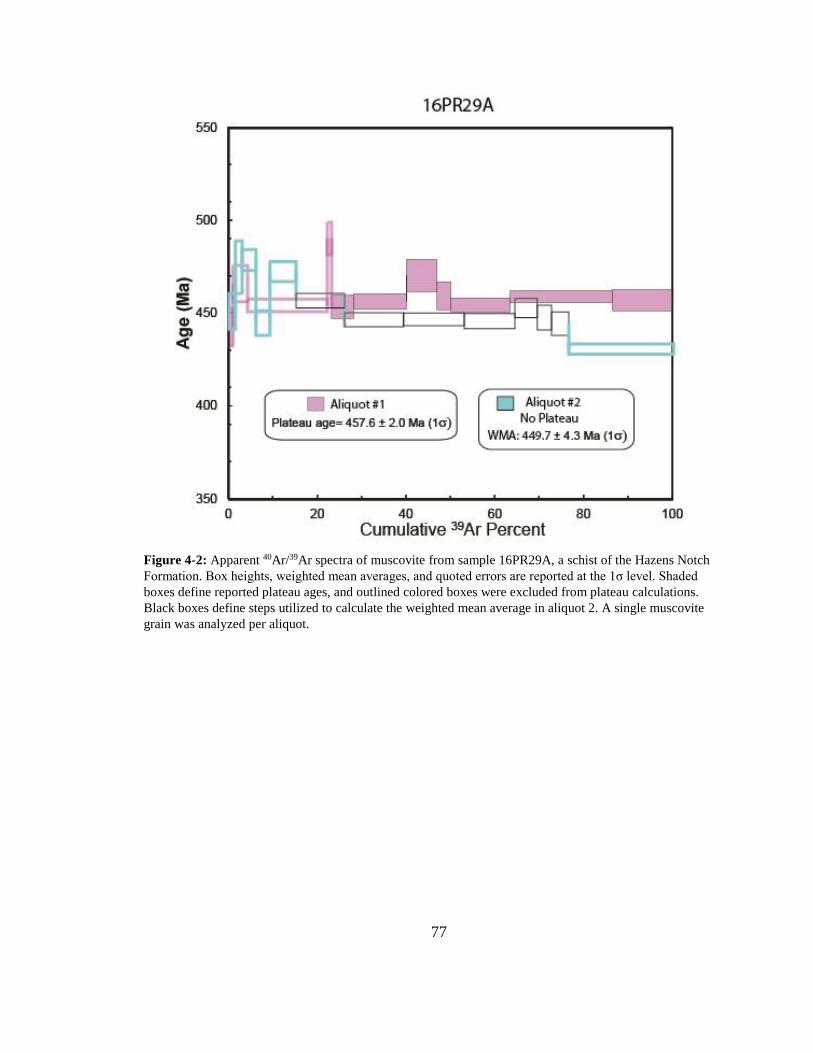
77
Figure 4-2: Apparent 40Ar/39Ar spectra of muscovite from sample 16PR29A, a schist of the Hazens Notch
Formation. Box heights, weighted mean averages, and quoted errors are reported at the 1σ level. Shaded
boxes define reported plateau ages, and outlined colored boxes were excluded from plateau calculations.
Black boxes define steps utilized to calculate the weighted mean average in aliquot 2. A single muscovite
grain was analyzed per aliquot.
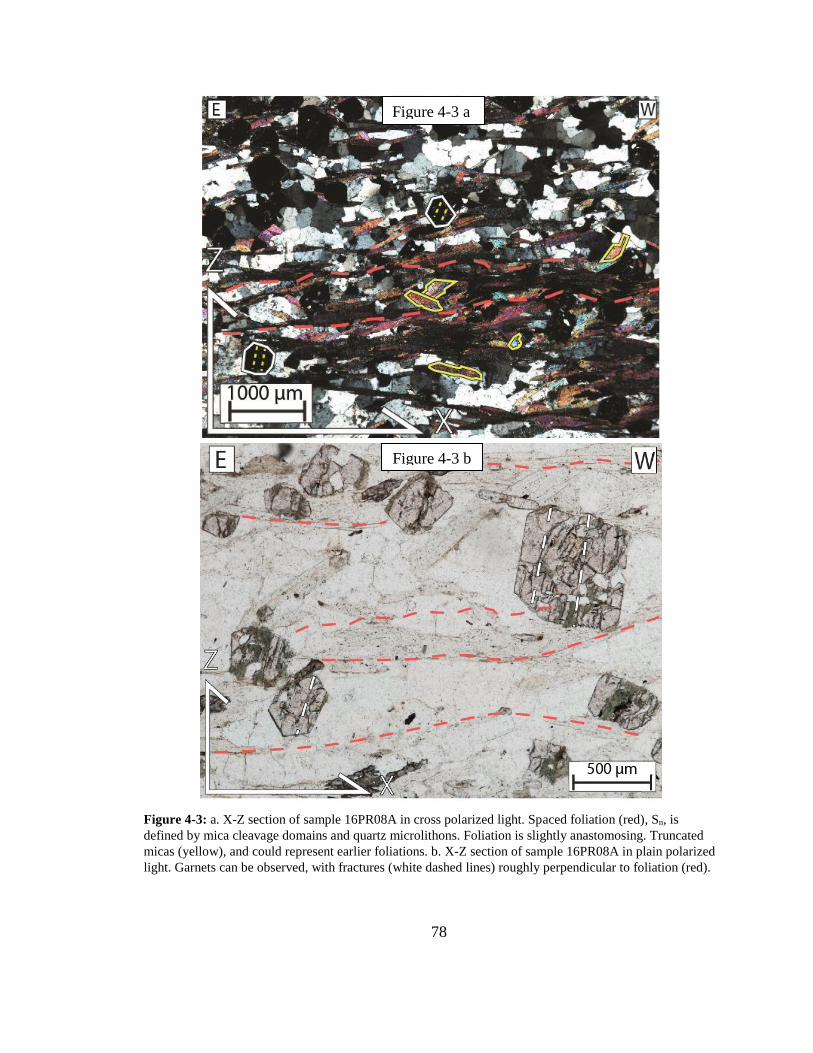
78
Figure 4-3: a. X-Z section of sample 16PR08A in cross polarized light. Spaced foliation (red), Sn, is
defined by mica cleavage domains and quartz microlithons. Foliation is slightly anastomosing. Truncated
micas (yellow), and could represent earlier foliations. b. X-Z section of sample 16PR08A in plain polarized
light. Garnets can be observed, with fractures (white dashed lines) roughly perpendicular to foliation (red).
Figure 4-3 a
Figure 4-3 b
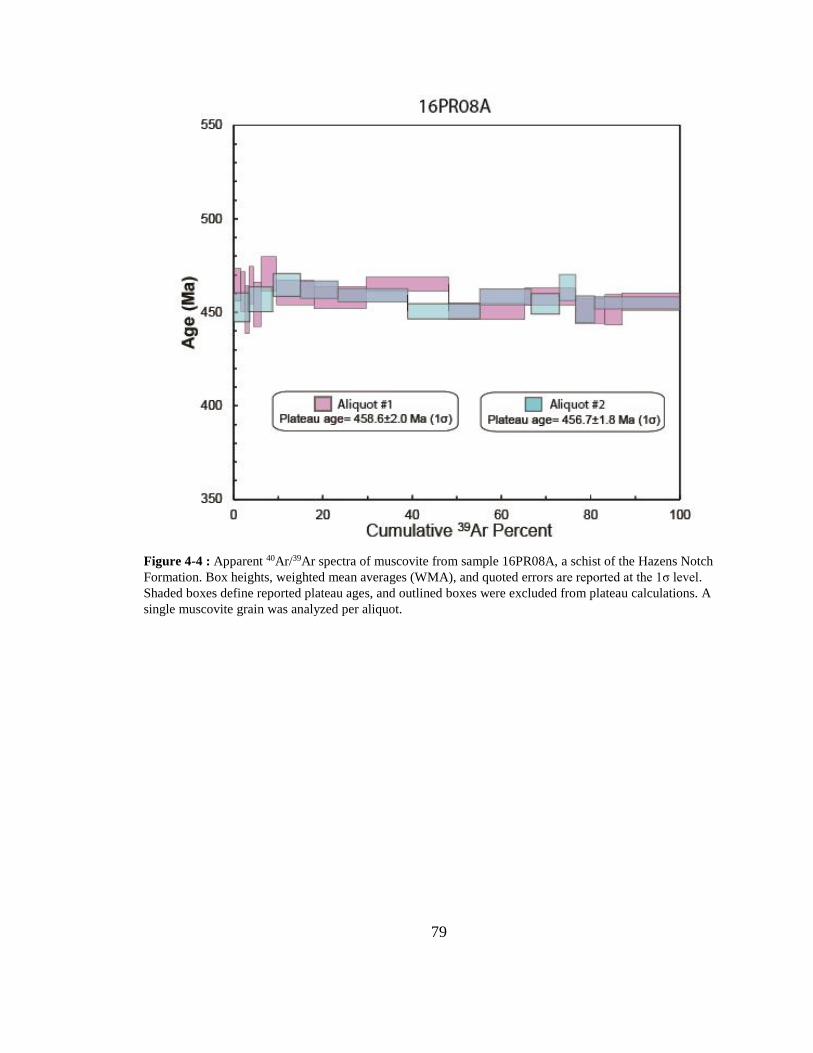
79
Figure 4-4 : Apparent 40Ar/39Ar spectra of muscovite from sample 16PR08A, a schist of the Hazens Notch
Formation. Box heights, weighted mean averages (WMA), and quoted errors are reported at the 1σ level.
Shaded boxes define reported plateau ages, and outlined boxes were excluded from plateau calculations. A
single muscovite grain was analyzed per aliquot.
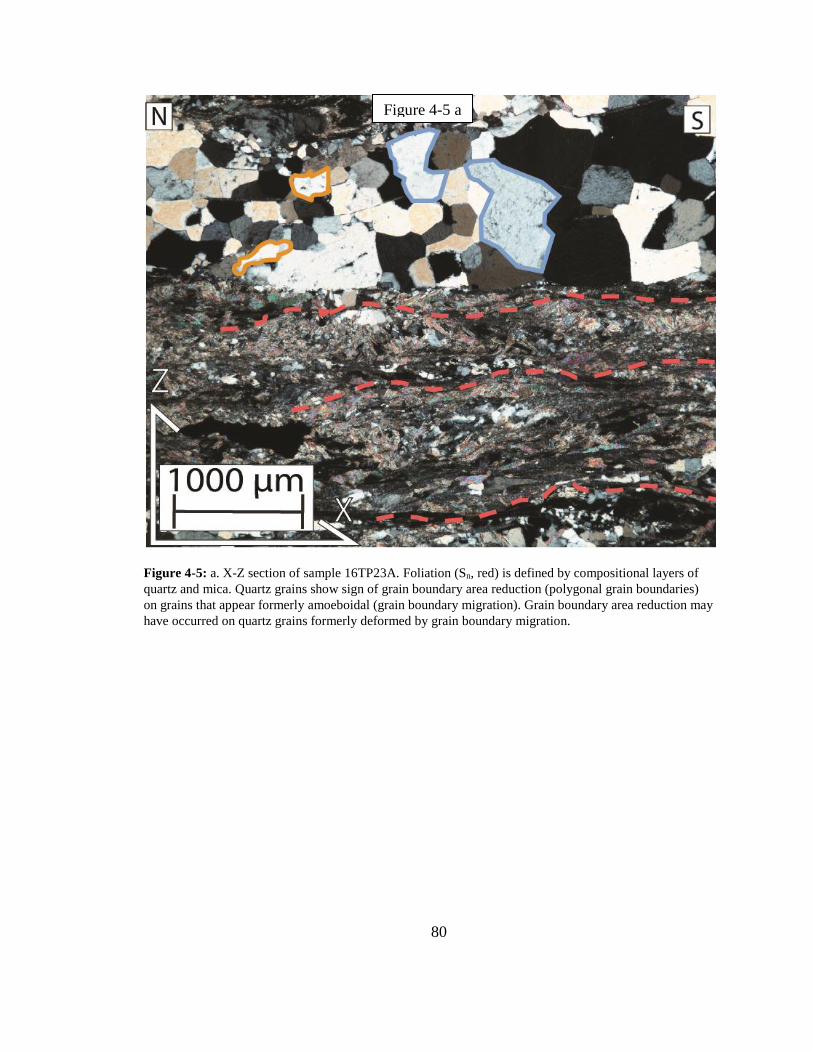
80
Figure 4-5: a. X-Z section of sample 16TP23A. Foliation (Sn, red) is defined by compositional layers of
quartz and mica. Quartz grains show sign of grain boundary area reduction (polygonal grain boundaries)
on grains that appear formerly amoeboidal (grain boundary migration). Grain boundary area reduction may
have occurred on quartz grains formerly deformed by grain boundary migration.
Figure 4-5 a
a0000
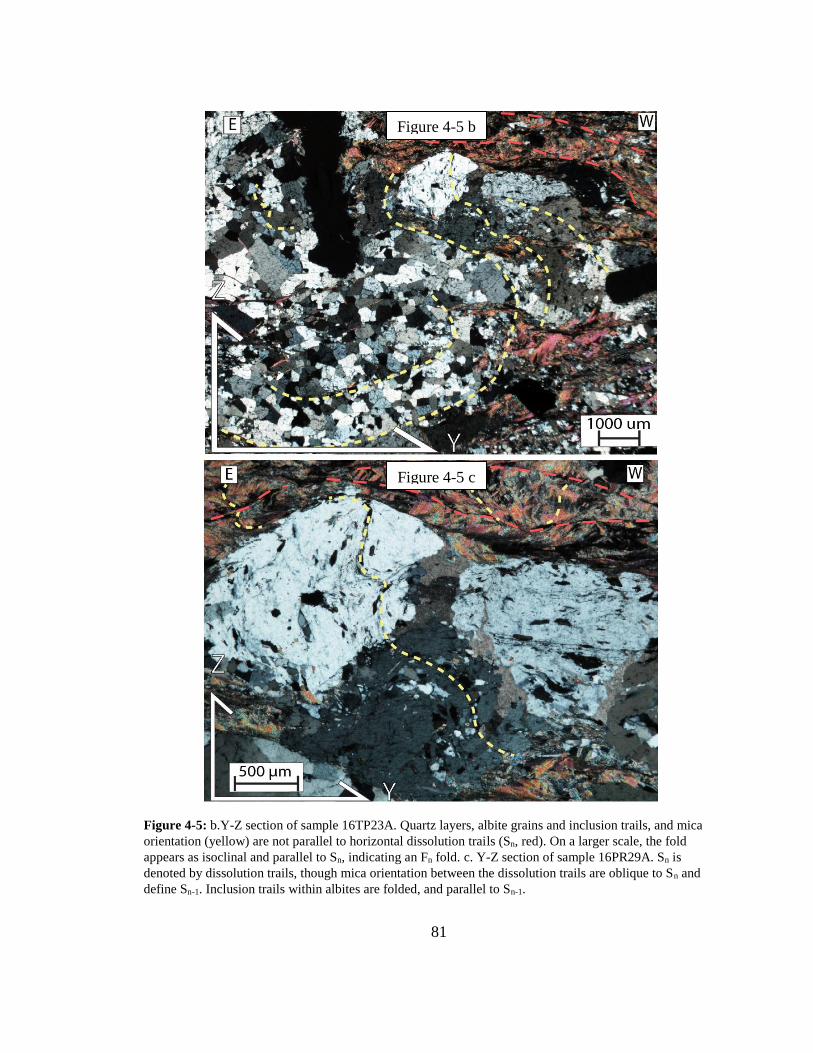
81
Figure 4-5: b.Y-Z section of sample 16TP23A. Quartz layers, albite grains and inclusion trails, and mica
orientation (yellow) are not parallel to horizontal dissolution trails (Sn, red). On a larger scale, the fold
appears as isoclinal and parallel to Sn, indicating an Fn fold. c. Y-Z section of sample 16PR29A. Sn is
denoted by dissolution trails, though mica orientation between the dissolution trails are oblique to Sn and
define Sn-1. Inclusion trails within albites are folded, and parallel to Sn-1.
Figure 4-5 b
a0000
Figure 4-5 c
a0000
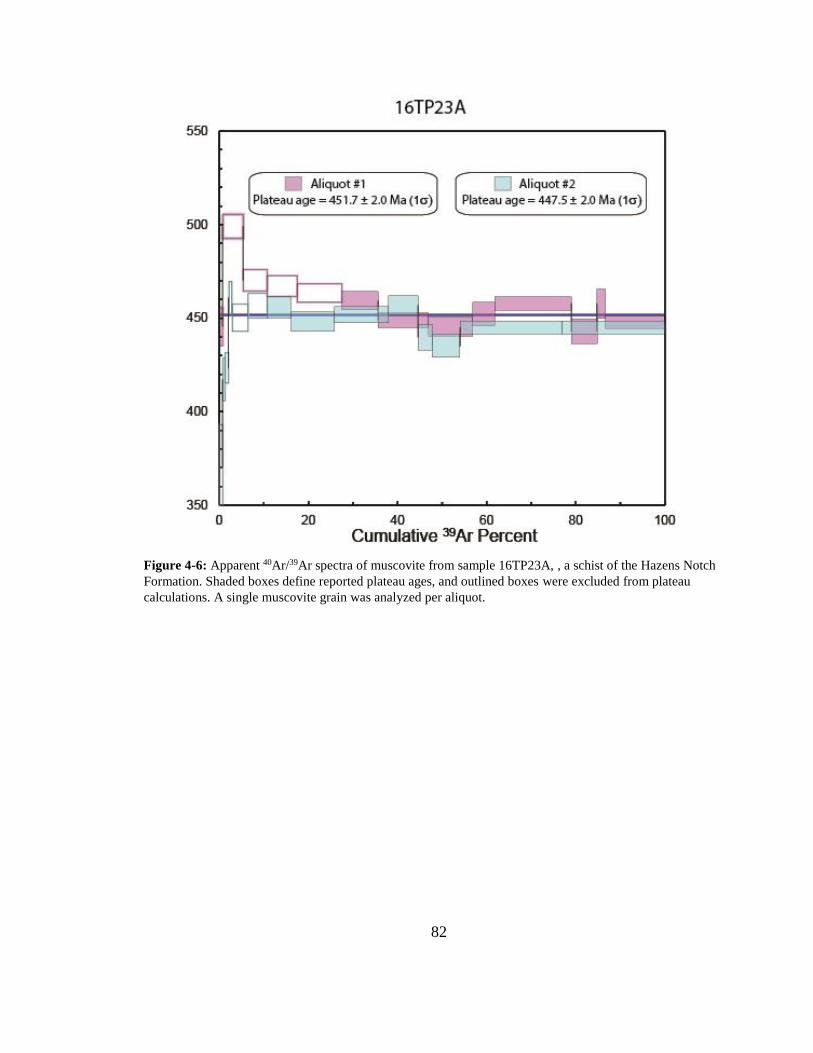
82
Figure 4-6: Apparent 40Ar/39Ar spectra of muscovite from sample 16TP23A, , a schist of the Hazens Notch
Formation. Shaded boxes define reported plateau ages, and outlined boxes were excluded from plateau
calculations. A single muscovite grain was analyzed per aliquot.
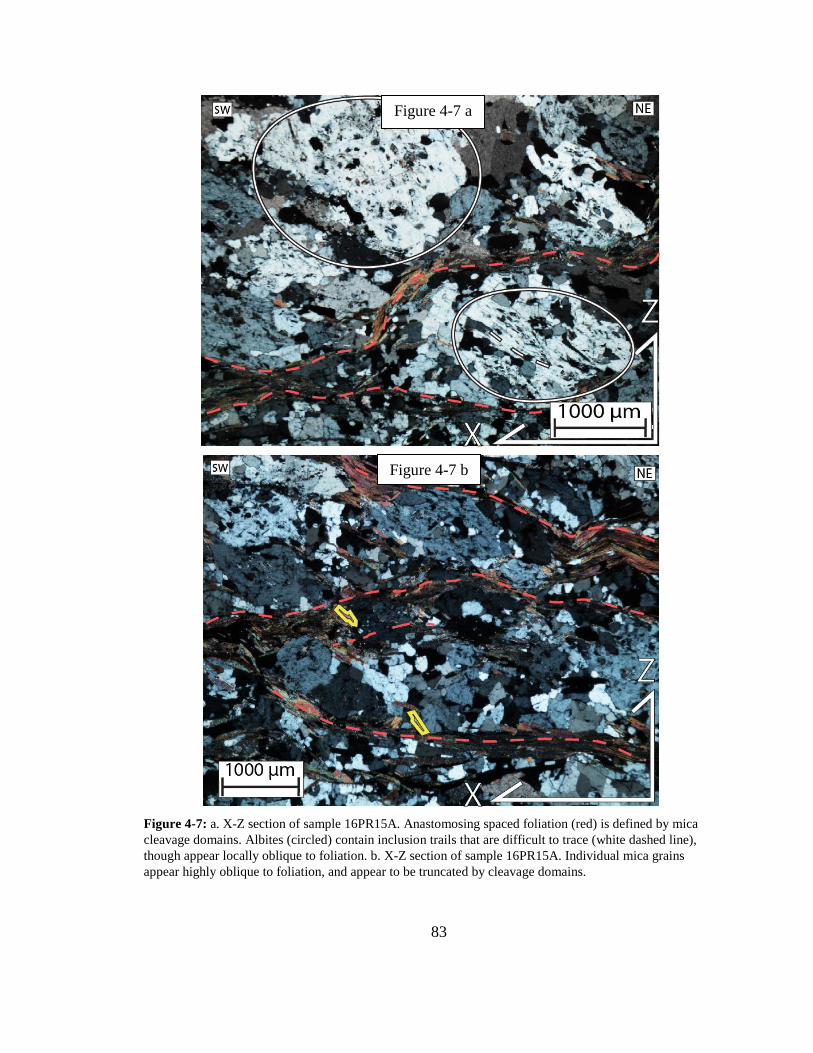
83
Figure 4-7: a. X-Z section of sample 16PR15A. Anastomosing spaced foliation (red) is defined by mica
cleavage domains. Albites (circled) contain inclusion trails that are difficult to trace (white dashed line),
though appear locally oblique to foliation. b. X-Z section of sample 16PR15A. Individual mica grains
appear highly oblique to foliation, and appear to be truncated by cleavage domains.
Figure 4-7 a
a0000
Figure 4-7 b
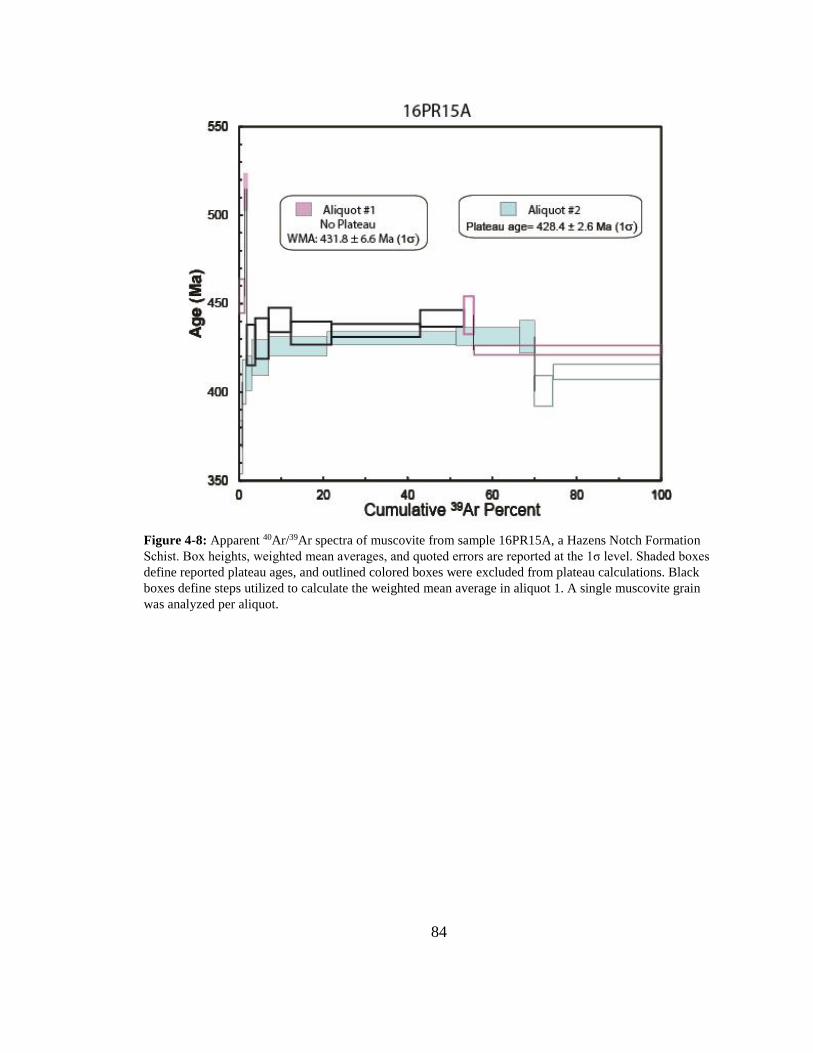
84
Figure 4-8: Apparent 40Ar/39Ar spectra of muscovite from sample 16PR15A, a Hazens Notch Formation
Schist. Box heights, weighted mean averages, and quoted errors are reported at the 1σ level. Shaded boxes
define reported plateau ages, and outlined colored boxes were excluded from plateau calculations. Black
boxes define steps utilized to calculate the weighted mean average in aliquot 1. A single muscovite grain
was analyzed per aliquot.
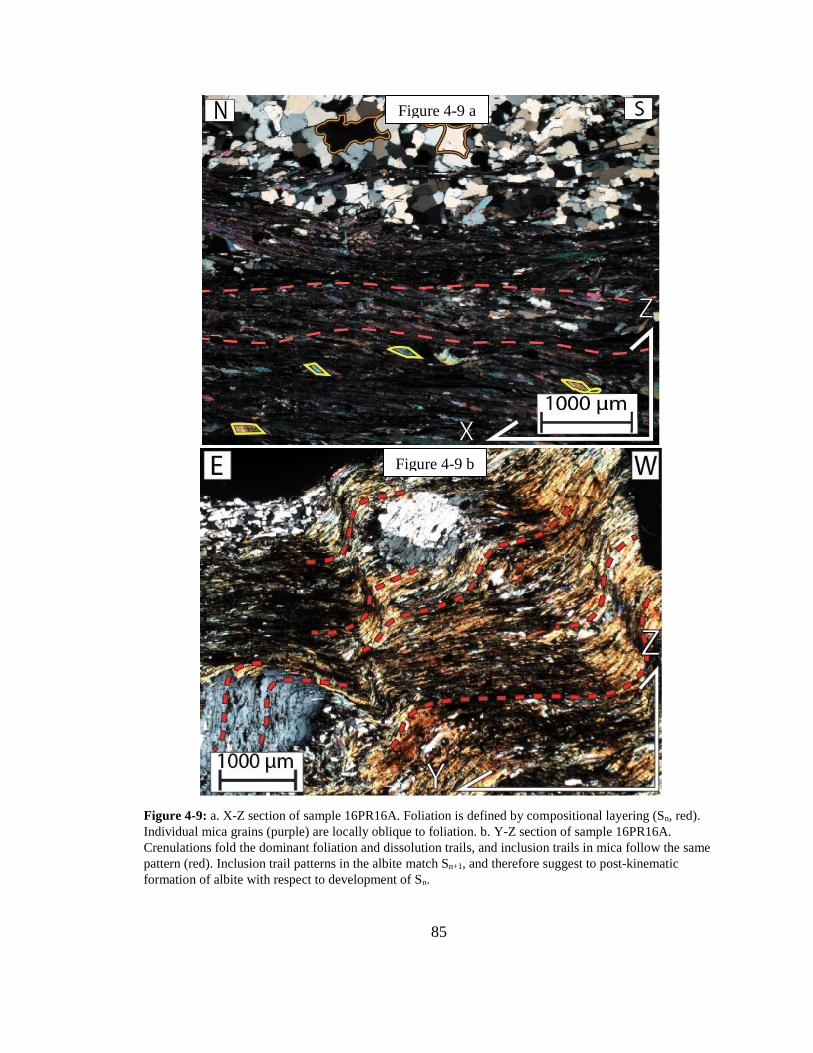
85
Figure 4-9: a. X-Z section of sample 16PR16A. Foliation is defined by compositional layering (Sn, red).
Individual mica grains (purple) are locally oblique to foliation. b. Y-Z section of sample 16PR16A.
Crenulations fold the dominant foliation and dissolution trails, and inclusion trails in mica follow the same
pattern (red). Inclusion trail patterns in the albite match Sn+1, and therefore suggest to post-kinematic
formation of albite with respect to development of Sn.
Figure 4-9 a
a0000
Figure 4-9 b
a0000
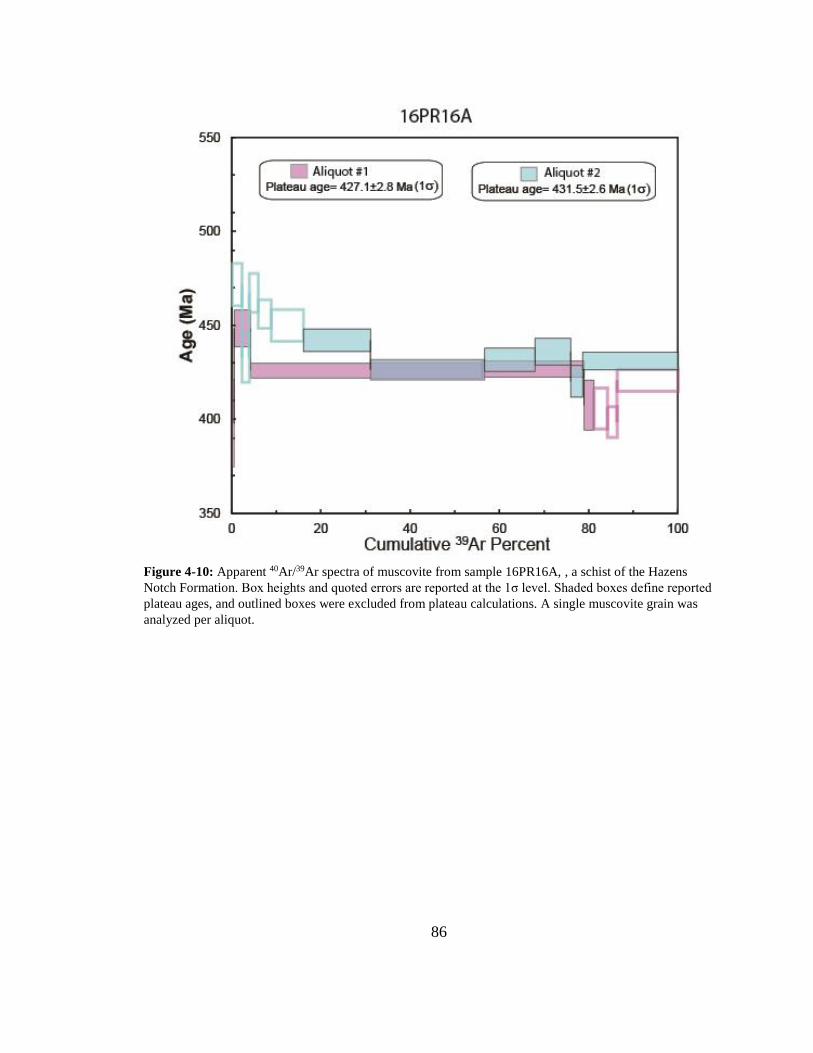
86
Figure 4-10: Apparent 40Ar/39Ar spectra of muscovite from sample 16PR16A, , a schist of the Hazens
Notch Formation. Box heights and quoted errors are reported at the 1σ level. Shaded boxes define reported
plateau ages, and outlined boxes were excluded from plateau calculations. A single muscovite grain was
analyzed per aliquot.
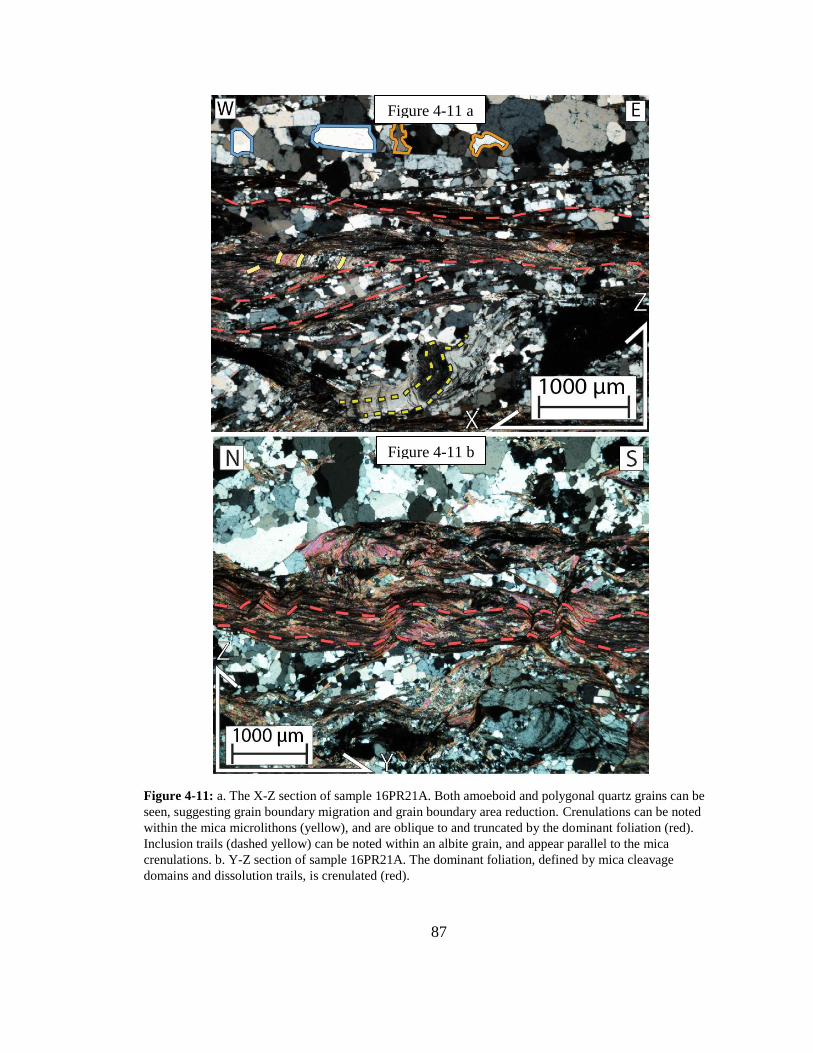
87
Figure 4-11: a. The X-Z section of sample 16PR21A. Both amoeboid and polygonal quartz grains can be
seen, suggesting grain boundary migration and grain boundary area reduction. Crenulations can be noted
within the mica microlithons (yellow), and are oblique to and truncated by the dominant foliation (red).
Inclusion trails (dashed yellow) can be noted within an albite grain, and appear parallel to the mica
crenulations. b. Y-Z section of sample 16PR21A. The dominant foliation, defined by mica cleavage
domains and dissolution trails, is crenulated (red).
Figure 4-11 a
a0000
Figure 4-11 b
a0000
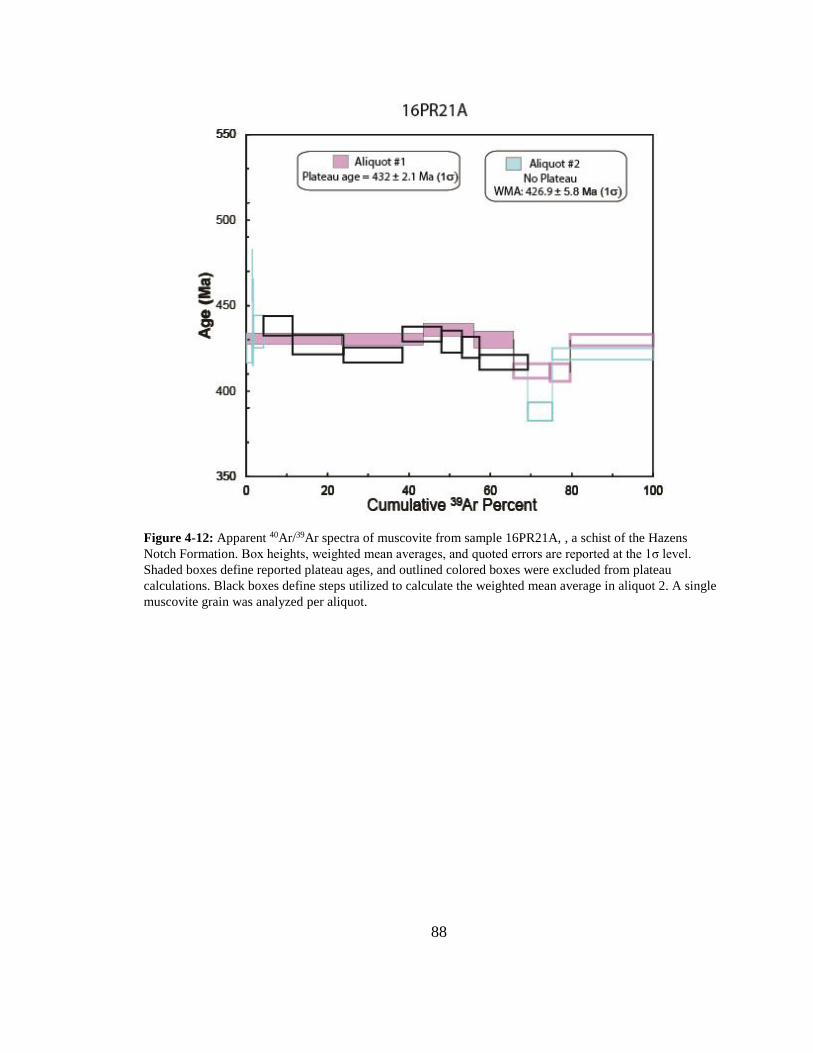
88
Figure 4-12: Apparent 40Ar/39Ar spectra of muscovite from sample 16PR21A, , a schist of the Hazens
Notch Formation. Box heights, weighted mean averages, and quoted errors are reported at the 1σ level.
Shaded boxes define reported plateau ages, and outlined colored boxes were excluded from plateau
calculations. Black boxes define steps utilized to calculate the weighted mean average in aliquot 2. A single
muscovite grain was analyzed per aliquot.
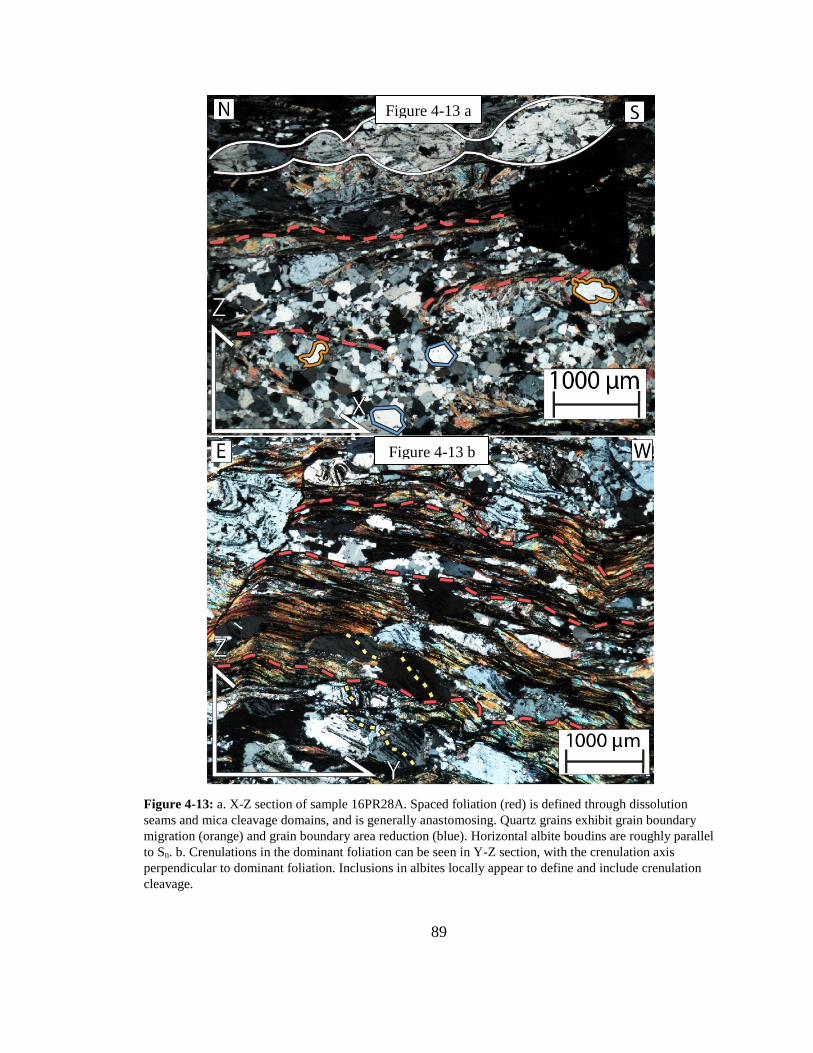
89
Figure 4-13: a. X-Z section of sample 16PR28A. Spaced foliation (red) is defined through dissolution
seams and mica cleavage domains, and is generally anastomosing. Quartz grains exhibit grain boundary
migration (orange) and grain boundary area reduction (blue). Horizontal albite boudins are roughly parallel
to Sn. b. Crenulations in the dominant foliation can be seen in Y-Z section, with the crenulation axis
perpendicular to dominant foliation. Inclusions in albites locally appear to define and include crenulation
cleavage.
Figure 4-13 a
a0000
Figure 4-13 b
a0000
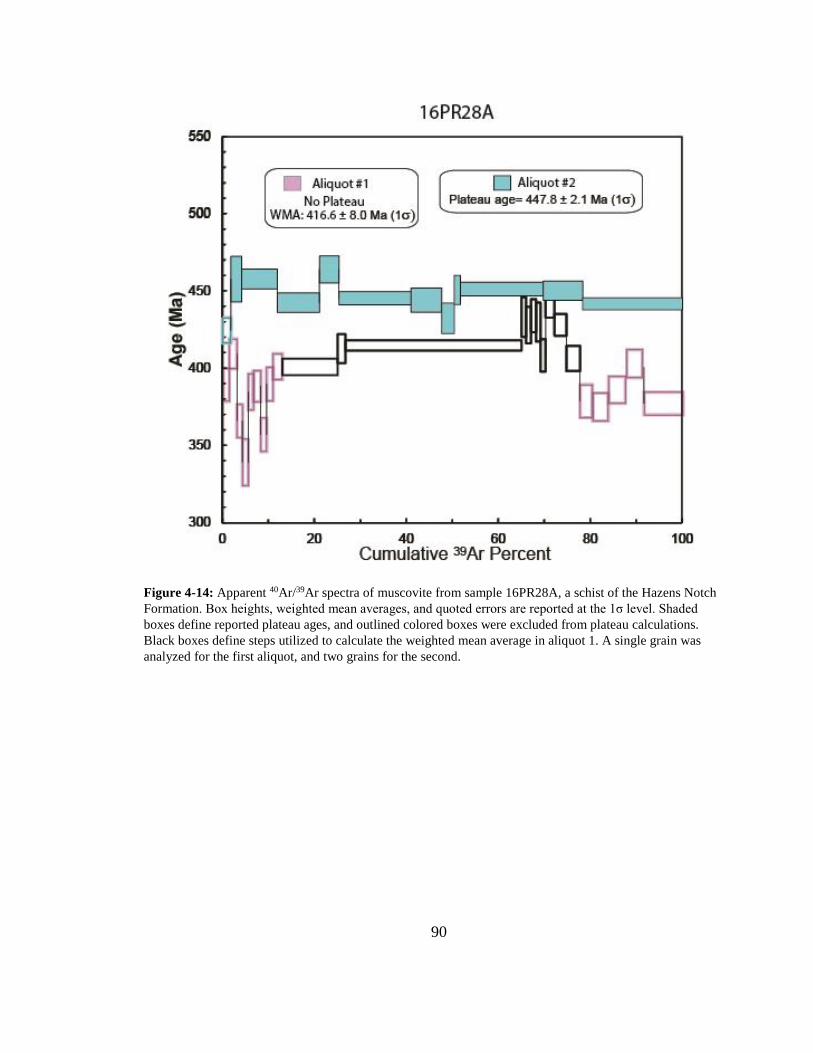
90
Figure 4-14: Apparent 40Ar/39Ar spectra of muscovite from sample 16PR28A, a schist of the Hazens Notch
Formation. Box heights, weighted mean averages, and quoted errors are reported at the 1σ level. Shaded
boxes define reported plateau ages, and outlined colored boxes were excluded from plateau calculations.
Black boxes define steps utilized to calculate the weighted mean average in aliquot 1. A single grain was
analyzed for the first aliquot, and two grains for the second.
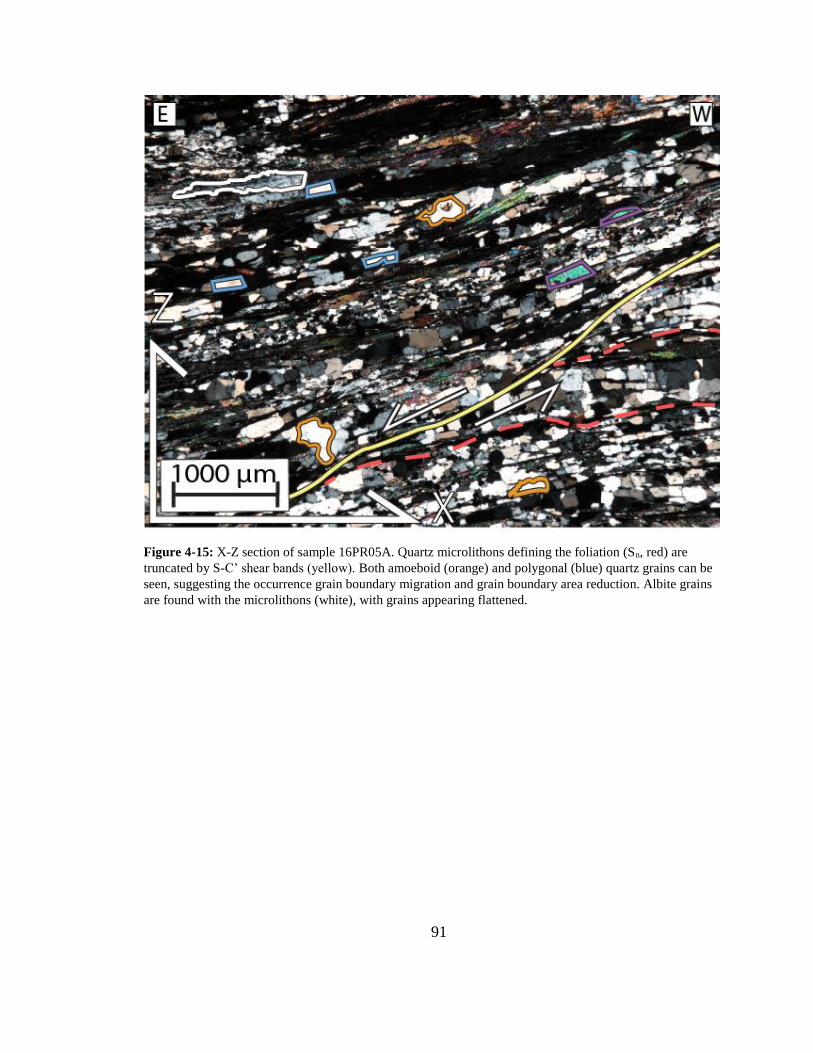
91
Figure 4-15: X-Z section of sample 16PR05A. Quartz microlithons defining the foliation (Sn, red) are
truncated by S-C’ shear bands (yellow). Both amoeboid (orange) and polygonal (blue) quartz grains can be
seen, suggesting the occurrence grain boundary migration and grain boundary area reduction. Albite grains
are found with the microlithons (white), with grains appearing flattened.
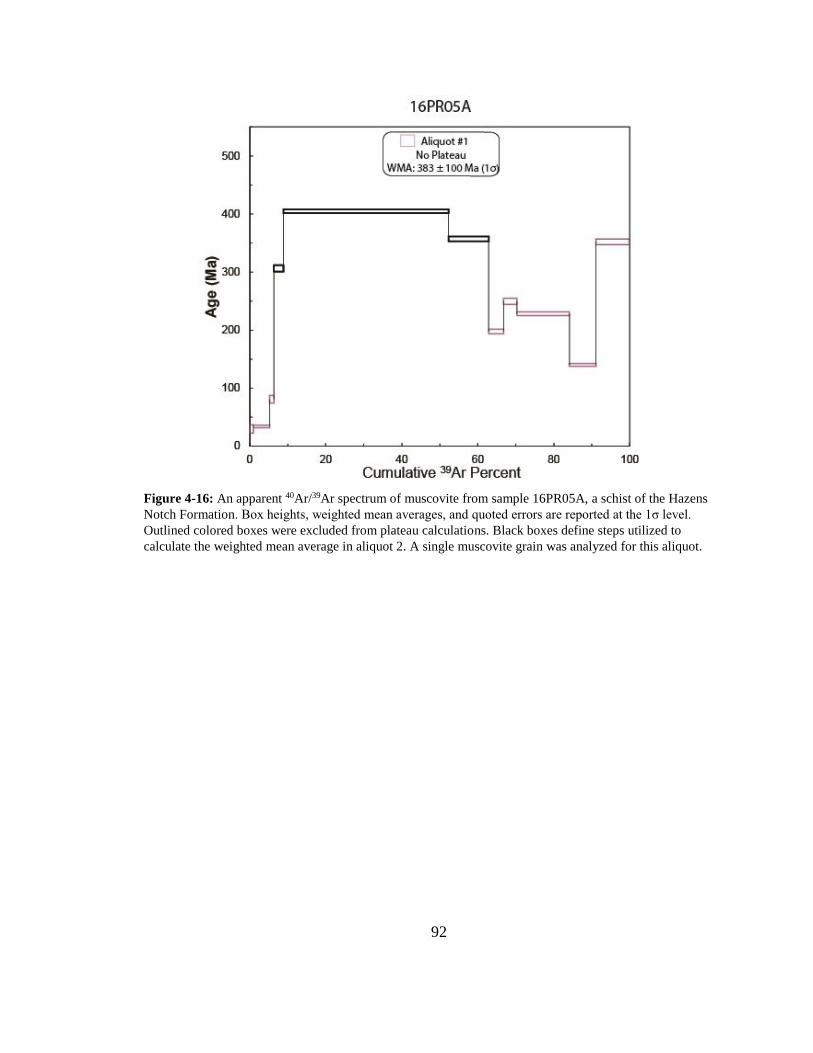
92
Figure 4-16: An apparent 40Ar/39Ar spectrum of muscovite from sample 16PR05A, a schist of the Hazens
Notch Formation. Box heights, weighted mean averages, and quoted errors are reported at the 1σ level.
Outlined colored boxes were excluded from plateau calculations. Black boxes define steps utilized to
calculate the weighted mean average in aliquot 2. A single muscovite grain was analyzed for this aliquot.
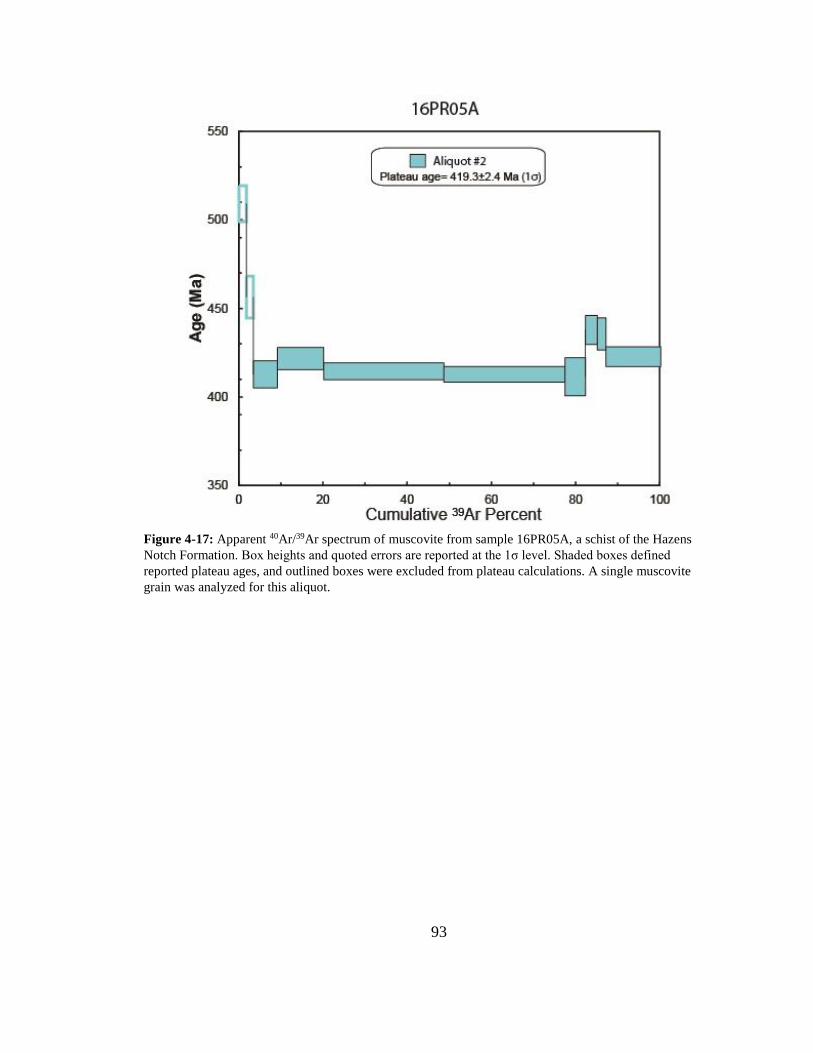
93
Figure 4-17: Apparent 40Ar/39Ar spectrum of muscovite from sample 16PR05A, a schist of the Hazens
Notch Formation. Box heights and quoted errors are reported at the 1σ level. Shaded boxes defined
reported plateau ages, and outlined boxes were excluded from plateau calculations. A single muscovite
grain was analyzed for this aliquot.
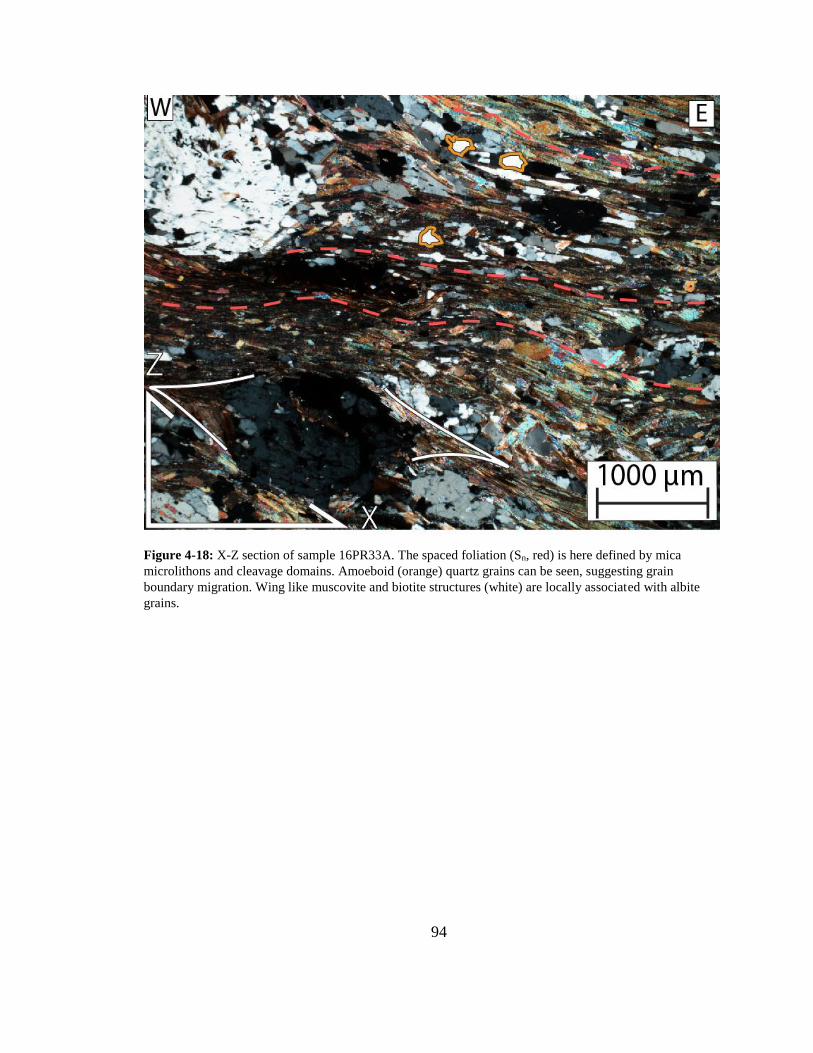
94
Figure 4-18: X-Z section of sample 16PR33A. The spaced foliation (Sn, red) is here defined by mica
microlithons and cleavage domains. Amoeboid (orange) quartz grains can be seen, suggesting grain
boundary migration. Wing like muscovite and biotite structures (white) are locally associated with albite
grains.
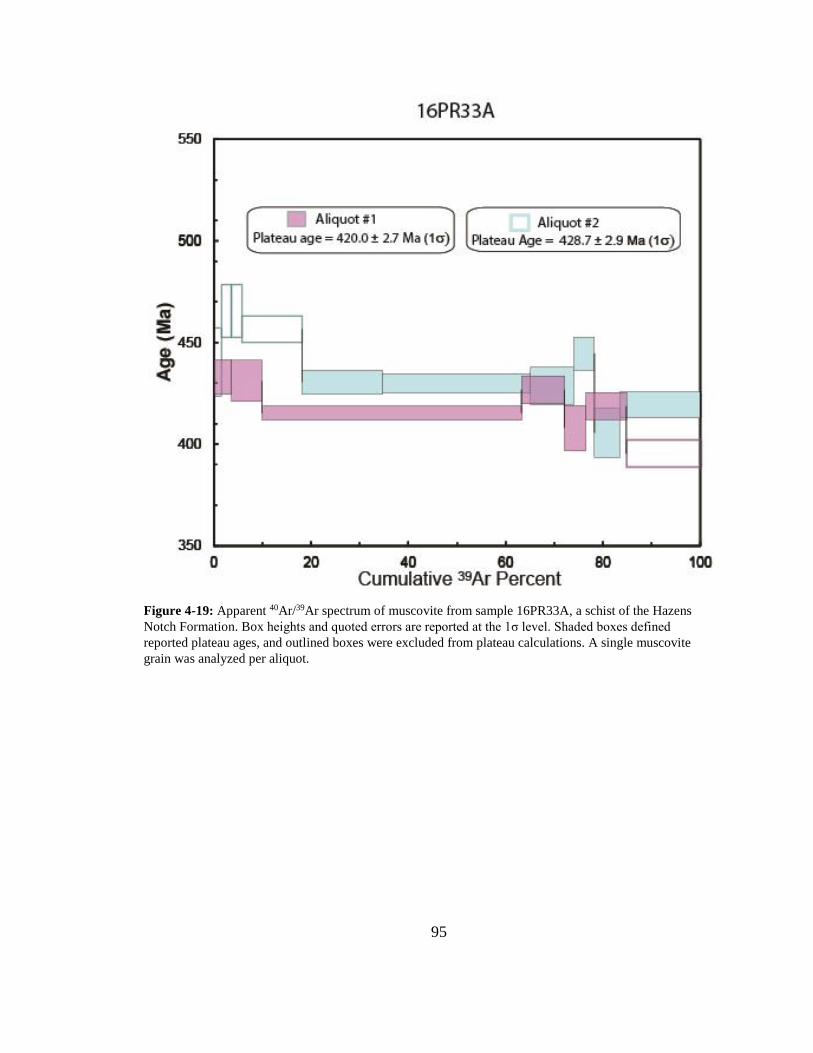
95
Figure 4-19: Apparent 40Ar/39Ar spectrum of muscovite from sample 16PR33A, a schist of the Hazens
Notch Formation. Box heights and quoted errors are reported at the 1σ level. Shaded boxes defined
reported plateau ages, and outlined boxes were excluded from plateau calculations. A single muscovite
grain was analyzed per aliquot.
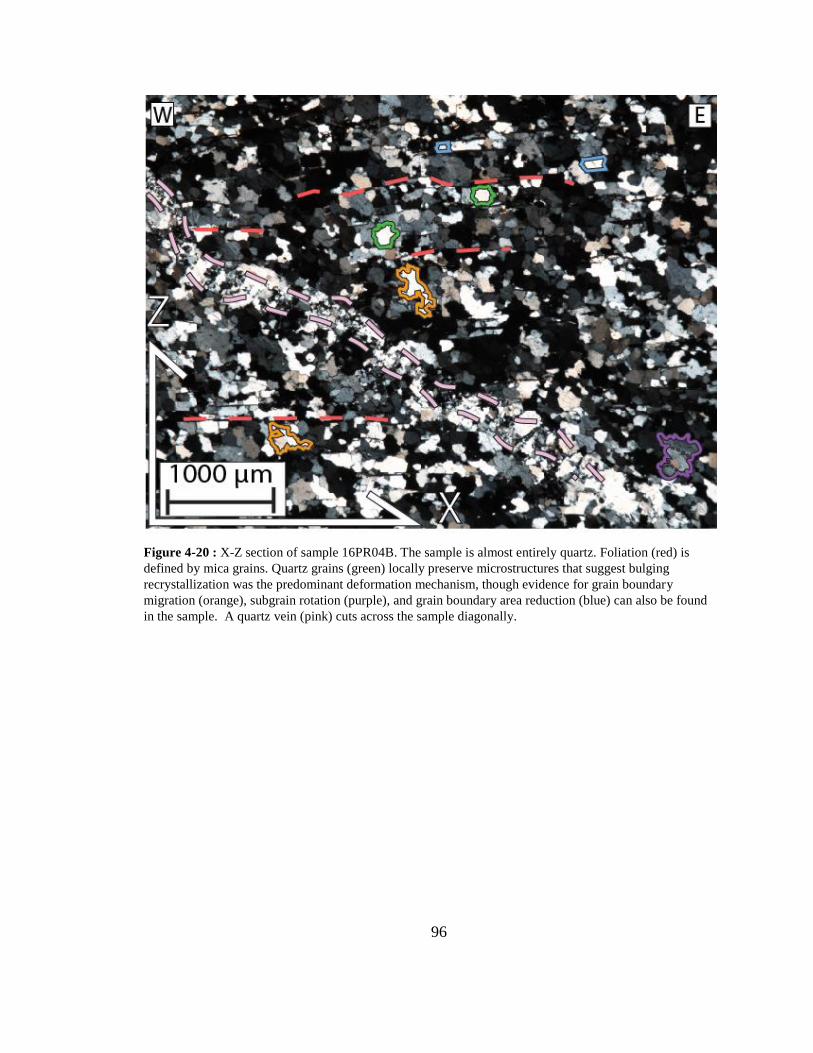
96
Figure 4-20 : X-Z section of sample 16PR04B. The sample is almost entirely quartz. Foliation (red) is
defined by mica grains. Quartz grains (green) locally preserve microstructures that suggest bulging
recrystallization was the predominant deformation mechanism, though evidence for grain boundary
migration (orange), subgrain rotation (purple), and grain boundary area reduction (blue) can also be found
in the sample. A quartz vein (pink) cuts across the sample diagonally.
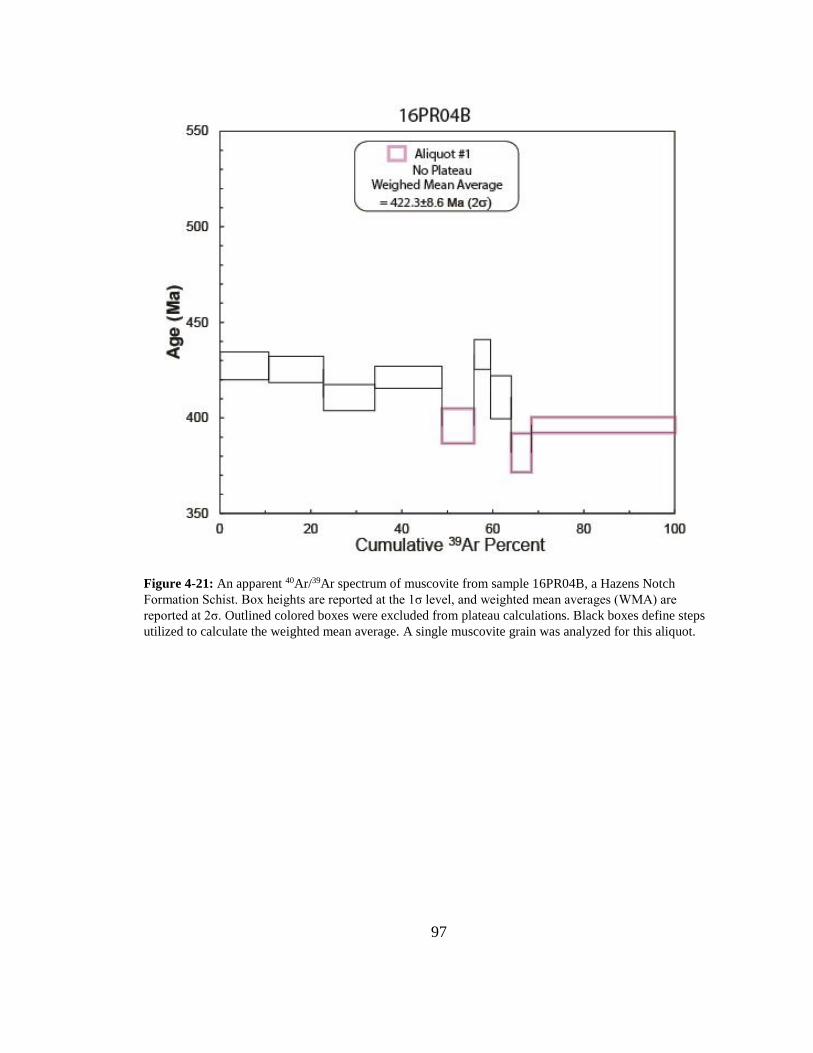
97
Figure 4-21: An apparent 40Ar/39Ar spectrum of muscovite from sample 16PR04B, a Hazens Notch
Formation Schist. Box heights are reported at the 1σ level, and weighted mean averages (WMA) are
reported at 2σ. Outlined colored boxes were excluded from plateau calculations. Black boxes define steps
utilized to calculate the weighted mean average. A single muscovite grain was analyzed for this aliquot.
98
Chapter 5: Discussion
Microstructures from thin section and 40Ar/39Ar spectra, when analyzed spatially
over the PRF footwall, can provide insight into the P-T-t-D path experienced by terranes
around the TPC during exhumation. These results may aid in constraining possible
exhumation models of the TPC. The following sections discusses spatially observed
patterns of different microstructures, including foliation, quartz microstructures,
kinematics, and their significance with regard to interpreting 40Ar/39Ar spectra.
5.1 Microstructures
5.1.1 Foliations
Foliations in this section are initially described in terms of Sn, Sn+1, Sn-1.
Foliations in this field area are difficult to concretely define in terms of foliation event
(i.e, S1, S2), as foliations are often composite. Kim et al. (2003) notes that S1/S2
composite foliation has been identified west of the Burgess Branch Fault Zone, and S2/S3
composite foliation has been identified to the east. As such, Sn in different samples may
not always define the same foliation. Integration of microstructural data with 40Ar/39Ar
dates to define foliations is discussed in section 5.3 below.
The dominant foliations (Sn) as they appear in thin sections from samples of the
PRF footwall are predominantly spaced foliations, defined by mica microlithons and
dissolution seams. Sn in some samples is defined by compositional layering of quartz,
mica, and albite. Foliations younger than the dominant foliation (Sn+1) are found as
crenulations in mica and albite porphyroblast inclusion trails. Foliations that predate- or
99
postdate the dominant foliation Sn are found in truncated mica domains and crenulations
in mica domains. Additionally, some inclusion trails found within porphyroclastic albite
do not align with Sn, suggesting that the albite captured an older foliation.
Spatial analysis of sample microstructures shows a pattern in the different
foliation generations over the PRF footwall. Samples from the middle transect exhibit Sn,
Sn-1 and Sn+1, except for sample 16PR15A which lacks Sn+1. The high transect has Sn-1 in
two samples, and the other sample (16PR29A) is located on the PRF and defined by S-C’
shear fabric. The southern transect exhibits Sn predominantly in samples 16PR04B and
16PR05A. Sample 16PR05A exhibits S-C’ shear fabrics and is located on the PRF.
Sample 16PR33A is found in the southern transect and exhibits both Sn and Sn-1
foliations.
5.1.2 Quartz Microstructures
Quartz microstructures can be utilized for constraining the temperatures
experienced during deformation (Passchier and Trouw, 2005, and references therein).
Bulging (BLG) forms under low grade metamorphic conditions (300–400⁰ C), subgrain
rotation (SGR) forms under medium temperatures (400–500⁰C), and grain boundary
migration (GBM) forms under conditions of (500–700⁰C). These temperature ranges may
differ depending on stain rate, differential stress, and presence of water in the lattice or
around grain boundaries (Passchier and Trouw, 2005). Grain boundary area reduction
(GBAR) microstructures result from continued recovery if elevated temperatures outlast
deformation. The dominant quartz microstructures have been identified for each sample
in the results section above (Chapter 4).
100
Quartz grains in sample thin sections predominantly display either GBM or
GBAR, with SGR and BLG only locally preserved. Some samples showed evidence for
both medium metamorphic grade deformation structures (SGR) and high metamorphic
grade structures (GBM) in similar amounts (samples 16PR08A, 16PR29A, 16PR33A).
The presence of lower metamorphic grade quartz microstructures with higher grade
structures may be indicative of multiple deformational events where the conditions in the
second event were not intense enough to overprint structures from a prior event. Samples
that exhibited GBAR as a major quartz microstructure were predominantly in the middle
transect (samples 16PR16A, 16PR21A, 16PR28A, 16TP23A). Samples with GBM as the
dominant quartz microstructure were more frequent in the northern and southern
transects.
5.1.3 Kinematics
Kinematic indicators have been utilized in prior studies of the PRF to constrain
movement history for the fault. Lamon (2001) utilized albite microstructures and shear
band development to determine a top-to-the-east motion along the PRF, though later
papers have questioned the application of those results for the entire PRF (Thompson and
Thompson, 2003).
Only two samples from this study showed kinematic indicators in any thin
sections. Samples 16PR05A and 16PR29A exhibit S-C’ shear fabrics, and both are
located along the mapped trace of the PRF. The sense of movement from the two samples
101
differ, with the northernmost sample (16PR29A) showing a top-to-the-west sense of
motion, and the southernmost sample 16PR05A with a top-to-the-east sense of motion.
Differing directions of motion from the two samples could support Thompson and
Thompson (2003)’s theory regarding motion along the PRF—overall westward motion
with later east directed local reactivation near the Prospect Rock (close to sample
16PR05A, and Lamon (2001)’s field sites. However, two samples with a sense of motion
is insufficient evidence for overall kinematic movement along the PRF, so these points
only offer speculation and highlight the need for more studies along the PRF.
5.2 40Ar/39Ar Dating
5.2.1 40Ar/39Ar Age Plateaus and Age Spectra
Results from 40Ar/39Ar dating have also produced patterns when examined across
the PRF footwall. Plateau ages of samples fall into three categories: between 458.6 ± 2.0
Ma and 447.5 ± 2.0 Ma, between 432.0 ± 2.1 Ma to 427.1 ± 2.6 Ma, and between 419.3 ±
2.4 Ma to 420.0 ± 2.7 Ma. These date brackets generally correspond with the northern,
middle, and southern transects, respectively. Two samples have ages that correspond with
another age bracket outside of their transect (see samples 16PR28A, 16PR33A). In the
PRF footwall, older ages appear to the north, and seem to become younger moving south.
Ages on the eastern side of the footwall (samples 16TP23A, 16PR28A) seem younger
than other ages from the northern transect (samples 16PT29A, 16PR08A), but still fall
within a similar age bracket. Samples with younger ages in this bracket (between 447.5
Ma and 451.7 Ma) are located closer to the BBFZ, which suggests that ages from these
samples could have been altered by faulting associated with the BBFZ.
102
Apparent age spectra also follow a pattern when examined spatially. Age spectra
for the northern transect were mostly flat, with most steps matching the plateaus and the
age brackets for the high transect. Samples from the middle transect had a larger number
of steps (both in cumulative 39Ar percentage and actual number of steps) that deviated
from plateaus and the middle transect age bracket. Deviant steps fluctuated from over 500
Ma to under 350 Ma. Age spectra for the southern transect were mostly consistent with
the plateaus for each given graph. Two of the age spectra did not produce plateaus, and
had a large range in step ages (Figure 4-16, Figure 4-21).
5.3 Integration of Microstructures and 40Ar/39Ar Ages over the PRF footwall
5.3.1 Northern Transect
Samples in the northern transect (and sample 16PR28A) have plateau dates that
range from between 458.6 ± 2.0 Ma and 447.5 ± 2.0 Ma. Within this range, plateau dates
can be further divided, with one set between 458.6 ± 2.0Ma and 456 ± 1.8 Ma, and
another between 451.7 ± 2.0 Ma and 447.5 ± 2.0 Ma.
Samples 16PR29 and 16PR08 have older dates have dates of 457.6 ± 2.0, and
458.6 ± 2.0Ma and 456 ± 1.8 Ma respectively. These dates fall close to the age range of
the Taconic Orogeny (470–460), and are from the northern section of the PRF footwall,
with 16PR08 located close to the TPC. In thin section, sample 16PR08A preserves
evidence for Sn-1 in Sn microlithons, indicating that deformation forming Sn could have
occurred during D2, which has been associated with the Taconic Orogeny. 16PR29A
exhibits S-C’ fabrics, which suggests that movement along the PRF occurred during this
period as well. GBAR does not strongly occur in these samples, but rather GBM is the
103
dominant quartz microstructure. This may indicate that the sample cooled during
deformation or soon thereafter, and suggests limited recovery occurred after formation of
the S-C’ fabric. Under these conditions, micas may have capture the development of S-C’
shear fabrics in sample 16PR29A during westward transport of the upper plate, which
runs contrary to results regarding PRF motion from Lamon (2001).
Samples 16TP23A and 16PR28A have similar ages, with 451.7 ± 2.0 Ma and
447.5 ± 2.0 Ma, and 447.8 ± 2.1 Ma respectively. These samples are from the eastern side
of the PRF footwall, and have plateau dates that are somewhat close to the Taconic
Orogeny. Thin sections from both samples show evidence of an Sn-1 foliation through
mica domains and crenulations truncated by Sn. 16PR28A shows evidence of Sn+1
through non-truncated mica crenulations. Age spectra for both samples produce plateaus,
though sample 16PR28A exhibits a much larger range in step ages (between ~340 to 460
Ma). Ages from these samples could have sampled micas formed from events in the
Taconic and the Salinic Orogenies, though the ages better align with the Taconic
Orogeny. Sn+1 could represent a third or fourth stage deformation. GBAR structures in
both samples suggest sustained temperatures after deformation effectively ceased, which
may contribute to variation in step ages.
Age spectra for samples from the northern transect are concordant with plateau
dates, which suggests that plateau ages reliably date the dominant foliation. Based on the
presence of both Sn and Sn-1 in microstructures and the plateau ages that fall within the
Taconic Orogeny, Sn in the northern transect aligns with S2, and Sn-1 with S1 (See table 5-
1).
104
5.3.2 Middle Transect
Samples 16PR15A, 16PR16A, and 16PR21A from the middle transect have
plateau ages that fall within a similar range. Sample 16PR15 has a plateau age of 428.4 ±
2.6 Ma, sample 16PR16A has plateau ages of 431.5 ± 2.6 Ma and 427.1 ± 2.8 Ma, and
sample 16PR21A has a plateau age of 432.0 ± 2.1 Ma. One plateau age from sample
16PR33A falls in a similar age range as samples from the middle transect (428.7 ± 2.9
MA).
Samples 16PR16A, 16PR21A, and PR28A exhibit three generations of foliation
and similar quartz microstructures. Sn+1 appears in thin sections as mica crenulations in
all three samples, and additionally as crenulations captured in albite in sample 16PR16A.
Sn-1 appear as mica crenulations truncated by Sn in all samples, and is also found as
crenulations captured as albite inclusion trail crenulations in samples 16PR15A and
16PR28A. All samples in the middle transect exhibit polygonal quartz grains, suggesting
either formation during sustained higher temperatures outlasting deformation (or through
grain boundary area reduction) or dissolution precipitation creep that occurred during
crenulation cleavage development (cf. Ashley et al., 2013). The processes that formed
these microstructures may have altered Ar concentrations in samples, resulting in a larger
range in the apparent age spectra. The formation of Sn+1 may be associated with
deformation during the late Salinic Orogeny to early Acadian Orogeny, as samples in the
middle transect exhibit minimum steps approaching Acadian ages. Minimum ages could
represent subsequent activity post formation of the dominant foliation (Sn), such as the
reactivation of the PRF, or movement along the nearby BBFZ or the Honey Hollow Fault
105
(Figure 2-1). Sn in the middle transect may represent a deformational period distinct from
Sn in the northern transect based on plateau ages, though these ages may be altered by
later processes that formed Sn+1. Overall, individual step heat ages for samples 16PR15A,
16PR16A, 16PR21A, and 16PR28A are varied and have steps that fall in both the range
of Taconic, Salinic, and Acadian Orogenies.
Age spectra for samples from the middle transect are concordant with plateau
dates, though they contain a larger number of steps that vary from plateau dates. Plateau
ages reliably date the dominant foliation, but may have been influenced by subsequent
deformational events. Samples exhibit 16PR16A, and 16PR21A exhibit three foliation
generations, and plateau ages between 16PR15A, 16PR16A, and 16PR21A fall within a
similar range (between ~427–432 Ma). Plateau ages for these samples match those of the
Salinic Orogeny, suggesting that the dominant foliation in these three samples (Sn) is
distinct from that of samples in the northern transect, and was formed during the Salinic.
The dominant foliation for these samples thus is S3 based on plateau ages and
microstructures, with Sn-1 and Sn+1 aligning with S2 and S4 respectively. S4 may represent
deformation during phase 2 of the Salinic Orogeny, or potentially Acadian deformation,
based on the range of minimum age steps from these samples (See table 5-1).
Samples 16PR28A also exhibits three foliation generations (Sn, Sn-1, Sn+1), with a
single plateau age from aliquot #2 that falls within the range of the Taconic Orogeny
(447.8 ± 2.1 Ma, 1σ). Aliquot #1 had a weighted mass average of 416.6 ± 8.0 Ma, with
most steps falling within the Salinic Orogeny, and several steps falling within the
Acadian Orogeny. Based on the variation of dates obtained from the spectra, it is difficult
106
to determine the structural generation for foliations. The dominant foliation (Sn) could be
considered as S2 through ages from Aliquot #1, or as S3 with ages from aliquot #2.
Likewise, interpretations of foliation generations for Sn-1 and Sn+1 are variable.
5.3.3 Southern Transect
Samples in the southern transect (16PR05A, 16PR33A, and 16PR04B) are located
near the Lamoille River along the footwall of the PRF. Sample 16PR05A has one plateau
age of 419.3 ± 2.4 Ma, and PR33A has plateau ages of 420.0 ± 2.7 Ma and 428.7 ± 2.9
Ma, which fall within the age range of the Salinic Orogeny. Step heat spectra from
16PR05 (aliquot #2) and 16PR33A (aliquot #1) show a consistent plateau near 420 Ma,
with a small percentage of deviating steps. Smaller numbers of steps deviating from the
plateau suggest that plateau dates are more likely aligned with formation of the dominant
foliation (Sn). Mica winged albite parallel to Sn in 16PR33A also suggest that mica was
formed during the dominant deformation phase and may be accurate for dating the
formation of Sn. Plateau ages associated with Sn may represent Salinic deformation
associated with reactivation of the PRF or activity along the nearby Honey Hollow Fault.
Based on plateau ages, Sn in the southern transect may represent the same or a similar
different deformational period to Sn in the middle transect, and may be distinct from Sn in
the northern transect, despite the similarity in Sn structures in all samples.
Age spectra for samples from the southern transect are concordant with plateau
dates, which suggests that plateau ages reliably date the dominant foliation. Plateau ages
range from ~419–428, with two plateau dates closer to 420 Ma. These ages align with the
Salinic Orogeny, and may date deformation simultaneous to/post-dating deformational
107
events associated with samples of the middle transect. The dominant foliation for these
samples thus is S3 based on plateau ages and microstructures, with Sn-1 aligning with S2
(See table 5-1)
Sample 16PR04B shows that there may be influence from other younger events,
ranging from about 427 Ma to 380 Ma which includes dates from the Taconic up to the
Acadian Orogeny. 16PR05A (aliquot #1) also has a large range in step ages, including
steps ( ~81 Ma, ~30 Ma) that resemble pulses of exhumation noted in the neighboring
White Mountains of New Hampshire, from ~65–85 Ma (Amidon et al, 2016) and ~20–0
Ma (Barr et al., 2017). These spectra may be indicative of other orogenic events that
occurred after deformation associated with the formation of S3 and S4.
5.4 Further Tectonic Implications
Plateau ages from 40Ar/39Ar step heating demonstrate a range of ages, reaching
from the Taconic to the Salinic Orogenies. These dates are correlative to ages from
40Ar/39Ar studies in the Quebec Appalachian regions of Canada. Plateau ages from the
northern transect of this study both overlap with, and reach ages that are slightly younger
than 40Ar/39Ar ages associated with the Taconic Orogeny in southern Quebec (Tremblay
and Pinet, 2016, and references therein). Younger Taconic ages are expected south of
Quebec, as along strike diachronism during deformation has been demonstrated between
Quebec and New England. Plateau ages from the middle and southern transects of this
study also fall within the range of ages dating phase 1 of the Salinic Orogeny in southern
Quebec (Tremblay and Pinet, 2016, and references therein).
108
Examination of tectonic models detailing the Salinic Orogeny from southern
Quebec will aid in developing a more complete geologic history in Vermont. The
geology of Vermont plays a role in linking the geology of Quebec and the rest of New
England, as ophiolite and accretionary wedge sequences in Vermont have been correlated
between both locations (Kim et al., 2003). Further studies are needed to examine the
spatial extent of the Salinic Orogeny into New England, and to correlate structures to
observations noted in Quebec.
5.5 Future Work
More work is necessary to fully understand the role to fully understand the role
the PRF played in the exhumation of the TPC. Results from this study have identified that
ages from PRF footwall samples that correlate to the Taconic and Salinic orogenies, but
more work is necessary to have a complete understanding of the PRF’s geologic history.
Results from this study have used ages from 40Ar/39Ar analysis to correlate
foliation generations in thin sections. Work has not been done to correlate foliations
found in thin section (S1-S4) to foliation generations where they were observed in the
field (Previously S1 to S3). Further examination of field structures and microstructures
would aid in further matching structures to the new foliation schema. Additionally,
studies have not yet found kinematic data that spans the entirety of the PRF footwall.
Results from Lamon (2001) indicate top to the east movement of the PRF, but Thompson
and Thompson (2003) argue that results from this study are too geographically limited,
and push for a model utilizing westward motion with local fault reactivation of the PRF

109
towards the east. Results from this study show kinematic indicators both top to the west
and east, but are insufficient to draw firm conclusions. Samples with kinematic indicators
were identified as being located on the PRF. Studies utilizing more samples from along
the PRF itself may lead to more kinematic indicators that further address the PRF’s role
in the exhumation of the TPC.
Further complicating this issue is the mapping of the PRF itself. The placement of
the PRF is at certain points inferred (P. Thompson, 2018, personal communication), as
the difference between the footwall and the hanging wall is determined by compositional
differences (specifically by the lack or presence of albitic minerals), and the fault is
difficult to identify in the field.
More research in this study area is also needed to fully understand the formation
of the GMA. Past studies have associated the formation of the GMA with the Acadian
Orogeny (Castonguay et al., 2011; Laird et al., 1984), but dates from this study have few
steps that fall within the Acadian. Other studies examining the Acadian Orogeny in
Vermont utilize 40Ar/39Ar Biotite dating (Webb et al., 2018; Lagor, 2016), whereas our
samples from the PRF footwall utilized mainly muscovite. Closure temperatures between
the two minerals are different as well as their stability under different conditions (P, T, D,
fluid), so utilizing biotite to date rocks from the PRF footwall may aid in accurately
comparing PRF footwall dates to those areas associated with the Acadian orogeny.
Examining other local faults besides the PRF may also be critical in having a full
understanding of the PRF’s history. The PRF is bounded on both sides by faults, the
Burgess Branch Fault as a normal fault to its east, and the Honey Hollow Fault as a thrust

110
fault to its west. Movement along these faults could have impacted 40Ar/39Ar ages from
rocks within the footwall, but the exact timing of fault movement is not yet understood
for these faults either.
All aforementioned studies would be aided by further analysis of more samples
from in and around the PRF. The scope of this study allowed for the examination of 45
thin sections and the dating of ten samples through 40Ar/39Ar analysis. A larger scope
examination in and around the PRF footwall would no doubt aid in further constraining
patterns in age and microstructures.
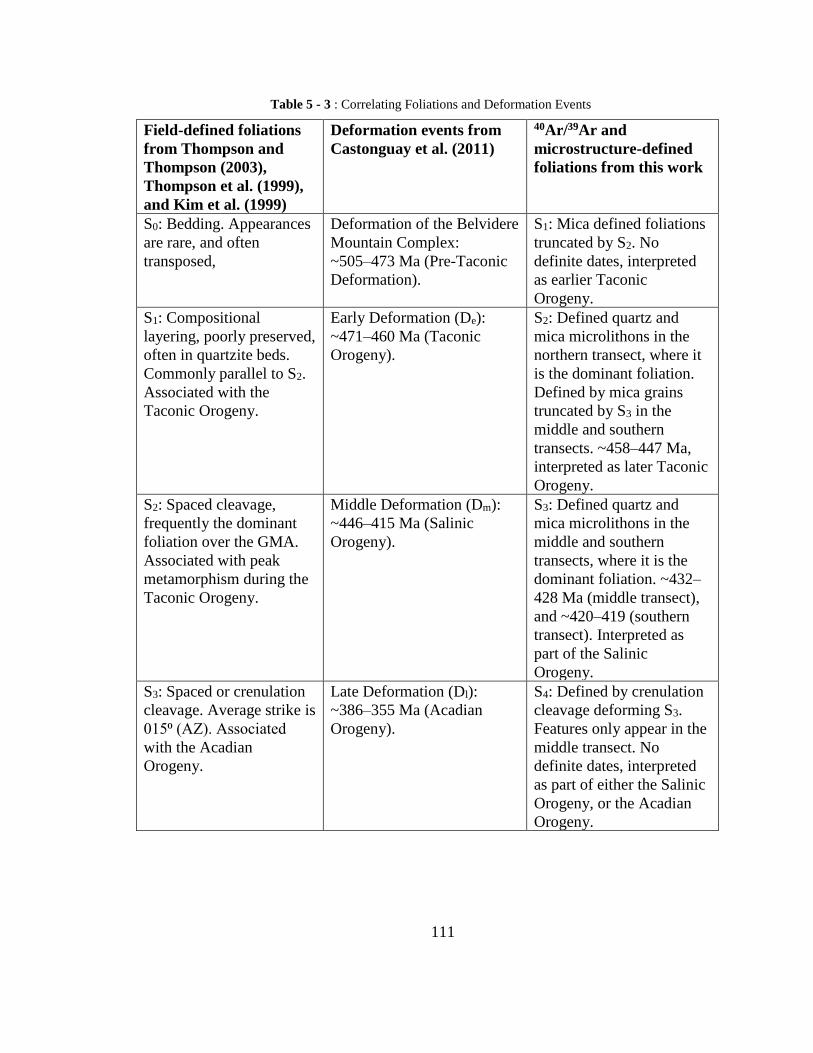
111
Table 5 - 3 : Correlating Foliations and Deformation Events
Field-defined foliations
from Thompson and
Thompson (2003),
Thompson et al. (1999),
and Kim et al. (1999)
Deformation events from
Castonguay et al. (2011)
40Ar/39Ar and
microstructure-defined
foliations from this work
S0: Bedding. Appearances
are rare, and often
transposed,
Deformation of the Belvidere
Mountain Complex:
~505–473 Ma (Pre-Taconic
Deformation).
S1: Mica defined foliations
truncated by S2. No
definite dates, interpreted
as earlier Taconic
Orogeny.
S1: Compositional
layering, poorly preserved,
often in quartzite beds.
Commonly parallel to S2.
Associated with the
Taconic Orogeny.
Early Deformation (De):
~471–460 Ma (Taconic
Orogeny).
S2: Defined quartz and
mica microlithons in the
northern transect, where it
is the dominant foliation.
Defined by mica grains
truncated by S3 in the
middle and southern
transects. ~458–447 Ma,
interpreted as later Taconic
Orogeny.
S2: Spaced cleavage,
frequently the dominant
foliation over the GMA.
Associated with peak
metamorphism during the
Taconic Orogeny.
Middle Deformation (Dm):
~446–415 Ma (Salinic
Orogeny).
S3: Defined quartz and
mica microlithons in the
middle and southern
transects, where it is the
dominant foliation. ~432–
428 Ma (middle transect),
and ~420–419 (southern
transect). Interpreted as
part of the Salinic
Orogeny.
S3: Spaced or crenulation
cleavage. Average strike is
015⁰ (AZ). Associated
with the Acadian
Orogeny.
Late Deformation (Dl):
~386–355 Ma (Acadian
Orogeny).
S4: Defined by crenulation
cleavage deforming S3.
Features only appear in the
middle transect. No
definite dates, interpreted
as part of either the Salinic
Orogeny, or the Acadian
Orogeny.
112
Chapter 6: Conclusions
40Ar/39Ar plateau ages from this study have demonstrated that samples ages from
the footwall of the Prospect Rock Fault range between 460–420 Ma (Figure 2-1).
40Ar/39Ar age spectra demonstrate that these ages are reliable. Plateau ages from these
samples correspond to both the Taconic Orogeny (470–460 Ma) and the Salinic Orogeny
(440–410 Ma, Castonguay et al., 2011; Tremblay and Pinet, 2016). 40Ar/39Ar plateau ages
vary spatially over the PRF footwall, with Taconic plateau ages in the northern transect
and Salinic plateau ages in the southern transect. Plateau ages did not correlate with the
Acadian Orogeny (395–375 Ma), though minimum ages of age spectra from the middle
transect fell within this range.
Patterns in microstructural features and in 40Ar/39Ar age spectra also correspond
spatially to the PRF footwall. Based on microstructural observations and intergration with
40Ar/39Ar plateau ages, four foliation generations were identified. S1 and S2 were
identified in samples from the northern transect, S3 from samples from the middle and
southern transect, and S4 in the middle transect. Quartz microstructures patterns were also
observed spacially, with grain boundary migration as the dominant quartz microstructure
in the northern and southern transects (associated with metamorphic temperatures
between 500–700⁰C). Grain boundary area reduction (GBAR) appears with grain
boundary migration (GBM) as the dominant quartz structures in the middle transect.
GBAR may result from dissolution precipitation creep during crenulation cleavage
(Ashley et al., 2013), or from sustained higher temperatures post metamorphism
(Passchier and Trouw, 2005).
113
The range in 40Ar/39Ar spectra steps exhibited variations across the PRF
footwall. Overall, steps in 40Ar/39Ar age spectra were overall concordant with plateaus.
Spectra from the northern and southern transects exhibited step age range within Taconic
(470–460 Ma) and Salinic Orogenies (440–410 Ma). Formation of the S2 foliation
associated with age plateaus for northern transect, and S3 in the middle and southern
transects, may be distinct based on plateau ages. Formation of S3 in the middle and
southern transects during the Salinic Orogeny could be related to deformation due to the
reactivation of the PRF, or motion along the Honey Hollow Fault.
Spectra from the middle transect showed a larger variation in step age range, with
steps ages ranging from the Taconic Orogeny through the Acadian Orogeny (395–375
Ma). The higher variation in ages in the middle transect could correlate with the
formation of crenulations or sustained temperatures post metamorphism, both of which
could have altered Ar concentrations within muscovite.
Results from the two kinematic indicators were not conclusive enough to draw
substantial conclusions. However, the presence of top-to-the-west movement from S-C’
shear bands stands contrary to Lamon’s (2001) proposal for complete top-to-the-east
movement of the PRF. More studies are necessary to verify direction of kinematic
movement and draw further conclusions.
Overall, 40Ar/39Ar plateau ages from this study demonstrates that rocks from the
Prospect Rock Fault footwall are more strongly associated with ages of the Taconic and
Salinic Orogenies, though some samples show minimum ages that align with the Acadian
Orogeny. These results align with results from Quebec that record evidence of the Salinic

114
Orogeny, and may aid in furthering Vermont’s tectonic understanding of its geologic
past.
115
BIBLIOGRAPHY
Agard, P., Yamato, P., Jolivet, L., & Burov, E., 2008, Discontinuous exhumation of
oceanic crust: insights from blueschists and eclogites into the subduction channel, Earth
Science Review, p. 10.
Andersen, T. B., Jamtveit, B., Dewey, J. F., & Swensson, E., 1991, Subduction and
eduction of continental crust: major mechanisms during continent‐continent collision and
orogenic extensional collapse, a model based on the south Norwegian Caledonides, Terra
Nova 3(3), p. 303-310.
Amidon, W. H., Roden-Tice, M., Anderson, A. J., McKeon, R. E., & Shuster, D. L.,
2016, Late Cretaceous unroofing of the White Mountains, New Hampshire, USA: An
episode of passive margin rejuvenation?, Geology 44 (6), p. 415-418.
Armstrong, T. R., Tracy, R. J., & Hames, W. E., 1992, Contrasting styles of Taconian,
eastern Acadian and western Acadian metamorphism, central and western New
England, Journal of Metamorphic Geology 10(3), 415-426.
Ashley, K. T., Webb, L. E., Spear, F. S., & Thomas, J. B., 2013, P‐T‐D histories from
quartz: A case study of the application of the TitaniQ thermobarometer to progressive
fabric development in metapelites, Geochemistry, Geophysics, Geosystems 14(9), p.
3821-3843.
Baldwin, S. L., Webb, L. E., & Monteleone, B. D., 2008, Late Miocene coesite-eclogite
exhumed in the Woodlark Rift, Geology 36 (9), p. 735-738.
Barr, M., Amidon, W., “U-Pb dating of calcite veins in the Champlain Valley: constraints
on post-Paleozoic rejuvenation in the eastern North American margin”, the Vermont
Geological Socienty Annual Spring Student Presentation Meeting, April 29, 2017,
University of Vermont, Trinity Campus, Burlington, VT, Conference Presentation.
Beaumont, C., Ellis, S., & Pfiffner, A., 1999, Dynamics of sediment subduction‐accretion
at convergent margins: Short‐term modes, long‐term deformation, and tectonic
implications, Journal of Geophysical Research: Solid Earth 104(B8), p. 17573-17601.
Bertrand, R., & Malo, M., 2001, Source rock analysis, thermal maturation and
hydrocarbon generation in Siluro-Devonian rocks of the Gaspe Belt basin, Canada,
Bulletin of Canadian Petroleum Geology 49(2), p. 238-261.
Bourque, P. A., 2001, Sea level, synsedimentary tectonics, and reefs: implications for
hydrocarbon exploration in the Silurian–lowermost Devonian Gaspé Belt, Québec
Appalachians, Bulletin of Canadian Petroleum Geology 49(2), p. 217-237.
116
Bothner, W. A., & Laird, J., 1987, Structure and metamorphism at Tillotson Peak, North-
Central Vermont, Guidebook for field trips in Vermont (2), p. 383-405.
Bothner, W. A., and Laird, J., 1999, Geologic Map of the Tillotson – Haystack Area,
Hazens Notch and Parts of the Lowell 7.5 Minute Quadranges, Vermont, Vermont
Geological Survey.
Bradley, D. C., 2000, Migration of the Acadian orogen and foreland basin across the
northern Appalachians of Maine and adjacent areas (No. 1624), US Department of the
Interior, US Geological Survey.
Caby, R., 1994, Precambrian coesite from northern Mali: first record and implications for
plate tectonics in the trans-Saharan segment of the Pan-African belt, European Journal of
Mineralogy, p. 235-244.
Cady, W. M., Albee, A. L., & Chidester, A. H., 1963, Bedrock geology and asbestos
deposits of the upper Missisquoi Valley and vicinity, Vermont (No. 1122-B), US
Geological Survey.
Carswell, DA., 1990, Eclogite facies rocks, Blackie, Glasgow and London, p. 396.
Castonguay, S., Tremblay, A., Ruffet, G., Feraud, G., Pinet, N., & Sosson, M., 1997,
Ordovician and Silurian metamorphic cooling ages along the Laurentian margin of the
Quebec Appalachians: Bridging the gap between New England and
Newfoundland, Geology 25(7), p. 583-586.
Castonguay, S., Ruffet, G., Tremblay, A., & Féraud, G., 2001, Tectonometamorphic
evolution of the southern Québec Appalachians: 40Ar/39Ar evidence for Middle
Ordovician crustal thickening and Silurian–Early Devonian exhumation of the internal
Humber zone, Geological Society of America Bulletin 113(1), p. 144-160.
Castonguay, S., & Tremblay, A., 2003, Tectonic evolution and significance of Silurian
Early Devonian hinterland-directed deformation in the internal Humber zone of the
southern Quebec Appalachians, Canadian Journal of Earth Sciences 40(2), p. 255-268.
Castonguay, S., Ruffet, G., & Tremblay, A, 2007, Dating polyphase deformation across
low-grade metamorphic belts: An example based on 40Ar/39Ar muscovite age
constraints from the southern Quebec Appalachians, Canada, Geological Society of
America Bulletin 119(7-8), p. 978-992.
Castonguay, S., Kim, J., Thompson, P. J., Gale, M. H., Joyce, N., Laird, J., & Doolan, B.
L., 2012, Timing of tectonometamorphism across the Green Mountain anticlinorium,
117
northern Vermont Appalachians: 40Ar/39Ar data and correlations with southern
Quebec, Bulletin 124(3-4), p. 352-367.
Cawood, P. A., McCausland, P. J., & Dunning, G. R., 2001, Opening Iapetus: constraints
from the Laurentian margin in Newfoundland, Geological Society of America
Bulletin 113(4), p. 443-453.
Cawood, P. A., & Nemchin, A. A., 2001 b, Paleogeographic development of the east
Laurentian margin: Constraints from U-Pb dating of detrital zircons in the Newfoundland
Appalachians, Geological Society of America Bulletin 113(9), p. 1234-1246.
Chemenda, A. I., Mattauer, M., Malavieille, J., & Bokun, A. N., 1995, A mechanism for
syn-collisional rock exhumation and associated normal faulting: results from physical
modelling, Earth and Planetary Science Letters 132(1-4), p. 225-232.
Chopin, C., 1984, Coesite and Pure Pyrope in High-grade Blueschists of the Western
Alps: A First Record and Some Consequences, Contributions to Mineralogy and
Petrology 86.2, p. 107-118.
Coish, R. A., Fleming, F. S., Larsen, M., Poyner, R., & Seibert, J., 1985, Early rift history
of the proto-Atlantic Ocean; geochemical evidence from metavolcanic rocks in
Vermont, American Journal of Science 285(4), p. 351-378.
Coish, R. A., Perry, D. A., Anderson, C. D., & Bailey, D., 1986, Metavolcanic rocks
from the Stowe Formation, Vermont; remnants of ridge and intraplate volcanism in the
Iapetus ocean, American Journal of Science 286(1), p. 1-28.
Coish, R. A., Bramley, A., Gavigan, T., & Masinter, R., 1991, Progressive changes in
volcanism during lapetan rifting: Comparisons with the East African Rift-Red Sea
system, Geology 19(10), p. 1021-1024.
Compagnoni, R., and Maffeo, B., 1973, Jadeite-bearing metagranite l.s. and related rocks
in the Monte Mucrone Area (Siesa Lanzo zone, Western Italian Alps), Schweiz Mineral
Petrog Mitt 53, p. 355-377.
Currie, C. A., Beaumont, C., & Huismans, R. S., 2007, The fate of subducted sediments:
A case for backarc intrusion and underplating, Geology 35(12), p. 1111-1114.
Daczko, N. R., Caffi, P., and Mann, P., 2011, Structural Evolution of the Dayman Dome
Metamorphic Core Complex, Eastern Papua New Guinea, Bulletin 123(11-12), p. 2335-
2351.
118
De Souza, S., Tremblay, A., Ruffet, G., & Pinet, N., 2012, Ophiolite obduction in the
Quebec Appalachians, Canada—40Ar/39Ar age constraints and evidence for syn-tectonic
erosion and sedimentation, Canadian journal of earth sciences 49(1), p. 91-110.
Dobrzhinetskaya, L. F, 2012, Microdiamonds — Frontier of Ultrahigh-pressure
Metamorphism: A Review, Gondwana Research 21.1, p. 207-223
Ducheˆne, S., Lardeaux, J. M., & Albarède, F., 1997, Exhumation of eclogites: insights
from depth-time path analysis, Tectonophysics 280(1-2), p. 125-140.
Dunning, G. R., Krogh, T. E., & Pederson, R. B., 1986, U–Pb zircon ages of
Appalachian–Caledonian ophiolites, Terra Cognita 6, L51.
Ernst, W. G., Maruyama, S., & Wallis, S., 1997, Buoyancy-driven, rapid exhumation of
ultrahigh-pressure metamorphosed continental crust, Proceedings of the National
Academy of Sciences 94(18), p. 9532-9537.
Ernst, W. G., 2006, Preservation/exhumation of ultrahigh-pressure subduction
complexes, Lithos 92(3-4), p. 321-335.
Fryer, P., Wheat, C. G., & Mottl, M. J., 1999, Mariana blueschist mud volcanism:
Implications for conditions within the subduction zone, Geology 27(2), p. 103-106.
Gerya, T., & Stöckhert, B., 2006, Two-dimensional numerical modeling of tectonic and
metamorphic histories at active continental margins, International Journal of Earth
Sciences 95(2), p. 250-274.
Gorczyk, W., Guillot, S., Gerya, T. V., & Hattori, K., 2007, Asthenospheric upwelling,
oceanic slab retreat, and exhumation of UHP mantle rocks: Insights from Greater
Antilles, Geophysical Research Letters 34(21).
Guillot, S., Hattori, K. H., & de Sigoyer, J., 2000, Mantle wedge serpentinization and
exhumation of eclogites: insights from eastern Ladakh, northwest
Himalaya, Geology 28(3), p. 199-202.
Guillot, S., Hattori, K. H., de Sigoyer, J., Nägler, T., & Auzende, A. L., 2001, Evidence
of hydration of the mantle wedge and its role in the exhumation of eclogites, Earth and
Planetary Science Letters 193(1-2), p. 115-127.
Guillot, S., Garzanti, E., Baratoux, D., Marquer, D., Mahéo, G., & De Sigoyer, J., 2003,
Reconstructing the total shortening history of the NW Himalaya, Geochemistry,
Geophysics, Geosystems, 4(7).
119
Guillot, S., Mahéo, G., De Sigoyer, J., Hattori, K. H., & Pecher, A., 2008, Tethyan and
Indian subduction viewed from the Himalayan high-to ultrahigh-pressure metamorphic
rocks, Tectonophysics 451(1-4), p. 225-241.
Guillot, S., Hattori, K., Agard, P., Schwartz, S., & Vidal, O., 2009, Exhumation processes
in oceanic and continental subduction contexts: a review, Subduction zone geodynamics,
Springer, Berlin, Heidelberg, pp. 175-205.
Hacker, B. R., Ratschbacher, L., Webb, L., Mcwilliams, M. O., Ireland, T., Calvert, A.,
Dong, S., Wenk, H., and Chateigner, D., 2000, Exhumation of Ultrahigh-pressure
Continental Crust in East Central China: Late Triassic-Early Jurassic Tectonic
Unroofing, Journal of Geophysical Research: Solid Earth 105.B6, p. 13339-13364.
Hacker, B. R., & Gerya, T. V., 2013a, Paradigms, new and old, for ultrahigh-pressure
tectonism, Tectonophysics 603, p. 79-88.
Hacker, B. R., Gerya, T. V., and Gilotti, J. A., 2013b, Formation and Exhumation of
Ultrahigh-Pressure Terranes, Elements 9.4, p. 289-93.
Hames, W. E., & Hodges, K. V., 1993, Laser 40Ar/39Ar evaluation of slow cooling and
episodic loss of 40Ar from a sample of polymetamorphic muscovite, Science 261(5129),
p. 1721-1723.
Hattori, K. H., & Guillot, S., 2007, Geochemical character of serpentinites associated
with high‐to ultrahigh‐pressure metamorphic rocks in the Alps, Cuba, and the Himalayas:
Recycling of elements in subduction zones, Geochemistry, Geophysics, Geosystems 8(9).
Haüy, R. J., 1822, Traité de minéralogie 2nd éd, Bachelier et Huzard, Paris.
Hepburn, J. C., Trask, N. J., Rosenfeld, J. L., & Thompson Jr, J. B., 1984, Bedrock
geology of the Brattleboro quadrangle, Vermont-New Hampshire, Vermont Agency of
Environmental Conservation.
Hesse, R., & Dalton, E., 1991, Diagenetic and low‐grade metamorphic terranes of Gaspe
Peninsula related to the geological structure of the Taconian and Acadian orogenic belts,
Quebec Appalachians. Journal of Metamorphic Geology, 9(6), p. 775-790.
Hibbard, J., 1994, Kinematics of Acadian deformation in the northern and Newfoundland
Appalachians, The Journal of Geology 102(2), p. 215-228.
Hilairet, N., Reynard, B., Wang, Y., Daniel, I., Merkel, S., Nishiyama, N., & Petitgirard,
S., 2007, High-pressure creep of serpentine, interseismic deformation, and initiation of
subduction, Science 318(5858), p. 1910-1913.
120
Honsberger, I. W., 2015, Metamorphism, Deformation, Geochemistry, and Tectonics of
Exhumed Ultramafic and Mafic Rocks in the Central and North-Central Vermont
Appalacians, Doctoral Dissertation, University of New Hampshire.
Jahn, B. M., Caby, R., & Monie, P., 2001, The oldest UHP eclogites of the world: age of
UHP metamorphism, nature of protoliths and tectonic implications, Chemical
Geology 178(1-4), p. 143-158.
Jicha, B. R., & Brown, F. H., 2014, An age for the Korath Range, Ethiopia and the
viability of 40Ar/39Ar dating of kaersutite in Late Pleistocene volcanics, Quaternary
Geochronology 21, p. 53-57.
Julien, P. S., & Hubert, C., 1975, Evolution of the Taconian orogen in the Quebec
Appalachians, American Journal of Science 275, p. 337-362.
Karabinos, P., 1998, Tectonic and stratigraphic development of the Connecticut Valley
Trough in the New England Appalachians., In Geological Society of America Abstracts
with Programs Vol. 30 No. 7, p. 191.
Karabinos, P., Samson, S. D., Hepburn, J. C., & Stoll, H. M., 1998, Taconian orogeny in
the New England Appalachians: collision between Laurentia and the Shelburne Falls
arc, Geology 26(3), p. 215-218.
Kim, J., Gale, M., Laird, J., Stanley, R., & Wright, S. F., 1999, Lamoille River valley
bedrock transect # 2. In Guidebook to field trips in Vermont and adjacent regions of New
Hampshire and New York: New England Intercollegiate Geological Conference Vol. 91,
pp. 213-250.
Kim, J., Coish, R., Evans, M., & Dick, G., 2003, Supra–subduction zone extensional
magmatism in Vermont and adjacent Quebec: Implications for early Paleozoic
Appalachian tectonics, Geological Society of America Bulletin 115(12), p. 1552-1569.
Laird, J., and Albee, A. L., 1981, High-pressure Metamorphism in Mafic Schist from
Northern Vermont, American Journal of Science 281.2 p. 97-126.
Laird, J., Lanphere, M. A., and Albee, A. L., 1984, Distribution of Ordovician and
Devonian Metamorphism in Mafic and Pelitic Schists from Northern Vermont, American
Journal of Science 284.4-5, p. 376-413.
Laird, J., Trzcienski, W. E., Bothner, W. A., Cheney, J. T., & Hepburn, J. C., 1993, High-
pressure, Taconian, and subsequent polymetamorphism of southern Quebec and northern
Vermont. in Field Trip Guidebook for the Northeastern United States: 1993 Boston GSA,
v. 2, p 1-32. In 1993 Geological Society of America Annual Meeng and 85th Annual
New England Intercollegiate Geological Conference Meeting, Boston, MA.
121
Lagor, S. W., 2016, The relationship between magmatism and deformation during the
Acadian orogeny: A case study from eastern-central Vermont, Doctoral dissertation,
University of Vermont.
Lamon, T. C., 2001, Tectonic Wedging in the Northern Vermont Appalachians: an
Emplacement Model for the Albitic Core Rocks of the Green Mountain Anticlinorium,
Masters Dissertation, University of Vermont.
Lee, J. Y., Marti, K., Severinghaus, J. P., Kawamura, K., Yoo, H. S., Lee, J. B., & Kim, J.
S., 2006, A redetermination of the isotopic abundances of atmospheric Ar, Ceochimica et
Cosmochimica Acta v. 70, p. 4507–4512.
Liou, J. G., Tsujimori, T., Zhang, R. Y., Katayama, I., & Maruyama, S., 2004, Global
UHP metamorphism and continental subduction/collision: the Himalayan
model, International Geology Review 46, p. 1-27.
Little, T. A., Baldwin, S. L., Fitzgerald, P. G., and Monteleone, B., 2007, Continental
Rifting and Metamorphic Core Complex Formation Ahead of the Woodlark Spreading
Ridge, D'Entrecasteaux Islands, Papua New Guinea, Tectonics 26.1.
Ludwig, K.R., 2003., Isoplot/EX, rev. 3.00, a Geochronological Toolkit for Microsoft
Excel: Berkeley Geochronology Center Special Publication v. 4, 71 pp.
Malo, M., Ruffet, G., Pincivy, A., & Tremblay, A., 2008, A 40Ar/39Ar study of oceanic
and continental deformation processes during an oblique collision: Taconian orogeny in
the Quebec reentrant of the Canadian Appalachians, Tectonics 27(4).
Mazzotti, S., & Hyndman, R. D, 2002, Yakutat collision and strain transfer across the
northern Canadian Cordillera, Geology 30(6), p. 495-498.
McDougall, I., & Harrison, T. M., 1999, Geochronology and Thermochronology by the 40Ar/39Ar Method, Oxford University Press on Demand.
McLelland, J. M., Selleck, B. W., Bickford, M. E., Tollo, R. P., Bartholomew, M. J.,
Hibbard, J. P., & Karabinos, P. M., 2010, Review of the Proterozoic evolution of the
Grenville Province, its Adirondack outlier, and the Mesoproterozoic inliers of the
Appalachians, From Rodinia to Pangea: The Lithotectonic Record of the Appalachian
Region: Geological Society of America Memoir 206, p. 21-49.
McWilliams, C. K., Walsh, G. J., & Wintsch, R. P., 2010, Silurian-Devonian age and
tectonic setting of the Connecticut Valley-Gaspe trough in Vermont based on U-Pb
SHRIMP analyses of detrital zircons, American Journal of Science 310(5), p. 325-363.
122
Monteleone, B. D., Baldwin, S. L., Webb, L. E., Fitzgerald, P. G., Grove, M., & Schmitt,
A. K., 2007, Late Miocene–Pliocene eclogite facies metamorphism, D'Entrecasteaux
Islands, SE Papua New Guinea, Journal of Metamorphic Geology 25(2), p. 245-265.
Moore, D. E., & Lockner, D. A., 2007, Comparative deformation behavior of minerals in
serpentinized ultramafic rock: Application to the slab-mantle interface in subduction
zones, International Geology Review 49(5), p. 401-415.
Naylor, R. S., 1976, Isotopic dating and New England stratigraphy, Contributions to the
stratigraphy of New England: Geological Society of America Memoir 148, p. 419-425.
Negredo, A. M., Replumaz, A., Villaseñor, A., & Guillot, S., 2007, Modeling the
evolution of continental subduction processes in the Pamir–Hindu Kush region, Earth and
Planetary Science Letters 259(1-2), p. 212-225.
Oldow, J. S., Bally, A. W., & Ave Lallemant, H. G., 1990, Transpression, orogenic float,
and lithospheric balance, Geology 18(10), p. 991-994.
Passchier, C. W., & Trouw, R. A., 2005, Microtectonics (Vol. 1), Springer Science &
Business Media.
Perrot, M., 2014, Étude structurale et microstructurale de la faille St-Joseph et de la ligne
Baie Verte-Brompton dans les Appalaches du sud du Québec.
Pinet, N., Castonguay, S., & Tremblay, A., 1996, Thrusting and back thrusting in the
Taconian internal zone, southern Quebec Appalachians, Canadian Journal of Earth
Sciences 33(9), p. 1283-1293.
Pinet, N., 2013, Gaspé Belt subsurface geometry in the northern Québec Appalachians as
revealed by an integrated geophysical and geological study: 2—Seismic interpretation
and potential field modelling results, Tectonophysics 588, p. 100-117.
Pincivy, A., Malo, M., Ruffet, G., Tremblay, A., & Sacks, P. E., 2003, Regional
metamorphism of the Appalachian Humber zone of Gaspé Peninsula: 40Ar/39Ar evidence
for crustal thickening during the Taconian orogeny, Canadian Journal of Earth
Sciences 40(2), p. 301-315.
Rankin, D. W., Coish, R. A., Tucker, R. D., Peng, Z. X., Wilson, S. A., & Rouff, A. A.,
2007, Silurian extension in the Upper Connecticut Valley, United States and the origin of
middle Paleozoic basins in the Quebec embayment, American Journal of Science 307(1),
p. 216-264.
Ratcliffe, N. M., Aleinikoff, J. N., Burton, W. C., & Karabinos, P., 1991, Trondhjemitic,
1.35–1.31 Ga gneisses of the Mount Holly Complex of Vermont: evidence for an
123
Elzevirian event in the Grenville basement of the United States Appalachians, Canadian
Journal of Earth Sciences 28(1), p. 77-93.
Renne, P. R., Swisher, C. C., Deino, A. L., Karner, D. B., Owens, T. L., & DePaolo, D.
J., 1998, Intercalibration of standards, absolute ages and uncertainties in 40Ar/39Ar dating,
Chemical Geology, v. 145, p. 117–152
Renne, P. R., Deino, A. L., Hilgen, F. J., Kuiper, K. F., Mark, D. F., Mitchell, W. S.,
Morgan, L. E., Mundil, R., and Smit, J., 2013, Time scales of critical events around the
Cretaceous-Paleogene boundary, Science 339 (6120), p. 684-687.
Reynard, B., Hilairet, N., Balan, E., & Lazzeri, M., 2007, Elasticity of serpentines and
extensive serpentinization in subduction zones, Geophysical Research Letters 34(13).
Rodgers, J., 1968, The eastern edge of the North American continent during the
Cambrian and Early Ordovician, Studies of Appalachian geology: northern and maritime,
p. 141-149.
Rubatto, D., & Hermann, J., 2001, Exhumation as fast as subduction?, Geology 29(1), p.
3-6.
Sasseville, C., Tremblay, A., Clauer, N., & Liewig, N., 2008, K–Ar age constraints on the
evolution of polydeformed fold–thrust belts: The case of the Northern Appalachians
(southern Quebec), Journal of Geodynamics 45(2-3), p. 99-119.
Schmidt, M. W., & Poli, S., 1998, Experimentally based water budgets for dehydrating
slabs and consequences for arc magma generation, Earth and Planetary Science
Letters 163(1-4), p. 361-379.
Simonetti, A., & Doig, R., 1990, U–Pb and Rb–Sr geochronology of Acadian plutonism
in the Dunnage zone of the southeastern Quebec Appalachians, Canadian Journal of
Earth Sciences 27(7), p. 881-892.
Sizova, E., Gerya, T., & Brown, M., 2012, Exhumation mechanisms of melt‐bearing
ultrahigh pressure crustal rocks during collision of spontaneously moving plates, Journal
of Metamorphic Geology 30(9), p. 927-955.
Slack, J. F., 1994, Geochemical constraints on the evolution of the Connecticut Valley
Trough, east-central Vermont, In Geological Society of America Abstracts with
Programs Vol. 26, p. 73.
Slack, J. F., Offield, T. W., Woodruff, L. G., & Shanks III, W. C., 2001, Geology and
geochemistry of Besshi-type massive sulfide deposits of the Vermont copper belt. Part II.
Environmental Geochemistry and Mining History of Massive Sulfide Deposits in the
124
Vermont Copper Belt: Society of Economic Geologists Guidebook Series, 35, p. 193-
211.
Smith, D. C., 1984, Coesite in clinopyroxene in the Caledonides and its implications for
geodynamics, Nature 310, p. 641.
Steiger, R. H., & Jäger, E., 1977, Subcommission on geochronology: convention on the
use of decay constants in geo- and cosmochronology: Earth and Planetary Science Letters
v. 36, p. 359–362.
Stoenner, R. W., Schaeffer, O. A., & Katcoff, S., 1965, Half-lives of argon-37, argon-39,
and argon-42, Science 148(3675), p. 1325-1328.
Stanley, R. S., and Ratcliffe, N. M., 1985, Tectonic Synthesis of the Taconian Orogeny in
Western New England, Geological Society of America Bulletin 96(10), 1227-1250.
Stöckhert, B., & Renner, J., 1998, Rheology of crustal rocks at ultrahigh pressure.
In When continents collide: geodynamics and geochemistry of ultrahigh-pressure rocks
(pp. 57-95). Springer, Dordrecht.
Sutter, J. F., Ratcliffe, N. M., & Mukasa, S. B., 1985, 40Ar/39Ar and K-Ar data bearing on
the metamorphic and tectonic history of western New England, Geological Society of
America Bulletin 96(1), p. 123-136.
Tremblay, A., & Pinet, N., 2005, Diachronous supracrustal extension in an intraplate
setting and the origin of the Connecticut Valley–Gaspé and Merrimack troughs, northern
Appalachians, Geological magazine 142(1), p. 7-22.
Tremblay, A., & Pinet, N., 2016, Late Neoproterozoic to Permian tectonic evolution of
the Quebec Appalachians, Canada, Earth-science reviews 160, p. 131-170.
Tremblay, A., Ruffet, G., & Castonguay, S., 2000, Acadian metamorphism in the
Dunnage zone of southern Quebec, northern Appalachians: 40Ar/39Ar evidence for
collision diachronism, Geological Society of America Bulletin 112(1), p. 136-146.
Tremblay, A., Ruffet, G., & Bédard, J. H., 2011, Obduction of Tethyan-type ophiolites—
A case-study from the Thetford-Mines ophiolitic Complex, Quebec Appalachians,
Canada, Lithos 125(1-2), p. 10-26.
Thompson, P.J., and Thompson, T.B., 1998, Digital bedrock geologic map of the Johnson
quadrangle, Vermont. Vermont Geological Survey Open-File Report VG 98-2A, scale
1:24000.
Thompson, P. J., Thompson, T. B., Doolan, B. L., & Wright, S. F., 1999, Lithotectonic
packages and tectonic boundaries across the Lamoille River transect in northern
125
Vermont. In Guidebook to Field Trips in Vermont and adjacent regions of New
Hampshire and New York: New England Intercollegiate Geological Conference Vol. 91,
pp. 51-94.
Thompson, P. J., and Thompson, T. B., 2003, The Prospect Rock Thrust: Western Limit
of the Taconian Accretionary Prism in the Northern Green Mountain Anticlinorium,
Vermont, Canadian Journal of Earth Sciences 40(2), p. 269-284.
Tsujimori, T., Sisson, V. B., Liou, J. G., Harlow, G. E., & Sorensen, S. S., 2006, Very-
low-temperature record of the subduction process: A review of worldwide lawsonite
eclogites, Lithos 92(3-4), p. 609-624.
Ueda, H., Usuki, T., & Kuramoto, Y., 2004, Intraoceanic unroofing of eclogite facies
rocks in the Omachi Seamount, Izu-Bonin frontal arc, Geology 32(10), p. 849-852.
Ulmer, P., & Trommsdorff, V., 1995, Serpentine stability to mantle depths and
subduction-related magmatism, Science 268(5212), p. 858-861.
van Staal, C. R., Barr, S. M., & Percival, J. A., 2012, Lithospheric architecture and
tectonic evolution of the Canadian Appalachians and associated Atlantic
margin, Tectonic styles in Canada: the LITHOPROBE perspective, Edited by JA
Percival, FA Cook, and RM Clowes, Geological Association of Canada Special
Paper, 49.
Van der Pluijm, B. A., & Marshak, S., 2004. Earth structure: An introduction to structural
geology and tectonics. WW Norton and Company. Inc, New York.
van Staal, C. R., & De Roo, J. A., 1995, Mid-Paleozoic tectonic evolution of the
Appalachian Central Mobile Belt in northern New Brunswick, Canada: collision,
extensional collapse and dextral transpression, Current perspectives in the Appalachian–
Caledonian Orogen, Edited by JP Hibbard, CR van Staal, and PA Cawood, Geological
Association of Canada, Special Paper, 41, p. 367-389.
van Staal, C. R., Whalen, J. B., McNicoll, V. J., Pehrsson, S., Lissenberg, C. J.,
Zagorevski, A., & Jenner, G. A, 2007, The Notre Dame arc and the Taconic orogeny in
Newfoundland, Geological Society of America Memoirs 200, p. 511-552.
van Staal, C. R., Whalen, J. B., Valverde-Vaquero, P., Zagorevski, A., & Rogers, N,
2009, Pre-Carboniferous, episodic accretion-related, orogenesis along the Laurentian
margin of the northern Appalachians, Geological Society, London, Special
Publications 327(1), p. 271-316.
Webb, L. E., Baldwin, S. L., Little, T. A., & Fitzgerald, P. G., 2008, Can microplate
rotation drive subduction inversion?, Geology 36(10), p. 823-826.
126
Webb, L. W., Klepeis, K. A., Kim, J. J., New Insights on Acadian Deformation and
Reactivation in Northern Vermont from Integrated Structural and Geochronological
Studies, In North East Geological Society of America, March 18-20, Burlington, VT.
West, D. P., Ludman, A., & Lux, D. R., 1992, Silurian age for the Pocomoonshine
Gabbro-Diorite, southeastern Maine and its regional tectonic implications, American
Journal of Science 292(4), p. 253-273.
Whalen, J. B., Mortensen, J. K., & Roddick, J. C., 1991, Implications of U–Pb and K–Ar
geochronology for petrogenesis and cooling history of the McGerrigle Mountains
plutonic complex, Gaspé, Quebec, Canadian Journal of Earth Sciences 28(5), p. 754-761.
Whitehead, J., Reynolds, P. H., & Spray, J. G., 1996, 40Ar/39Ar age constraints on
Taconian and Acadian events in the Quebec Appalachians, Geology 24(4), p. 359-362.
Whitehead, J., Dunning, G. R., & Spray, J. G., 2000, U-Pb geochronology and origin of
granitoid rocks in the Thetford Mines ophiolite, Canadian Appalachians, Geological
Society of America Bulletin 112(6), p. 915-928.
Williams, H., Colman-Sadd, S. P., & Swinden, H. S., 1988, Tectonic-stratigraphic
subdivisions of central Newfoundland, Current Research, Part B, Geological Survey of
Canada, Paper 88, p. 91-98.
Yamato, P., Agard, P., Burov, E., Le Pourhiet, L., Jolivet, L., & Tiberi, C., 2007, Burial
and exhumation in a subduction wedge: Mutual constraints from thermomechanical
modeling and natural P‐T‐t data (Schistes Lustres, western Alps), Journal of Geophysical
Research: Solid Earth, 112(B7).
Yin, A., Manning, C. E., Lovera, O., Menold, C. A., Chen, X., & Gehrels, G. E., 2007,
Early Paleozoic tectonic and thermomechanical evolution of ultrahigh-pressure (UHP)
metamorphic rocks in the northern Tibetan Plateau, northwest China, International
Geology Review 49(8), p. 681-716.
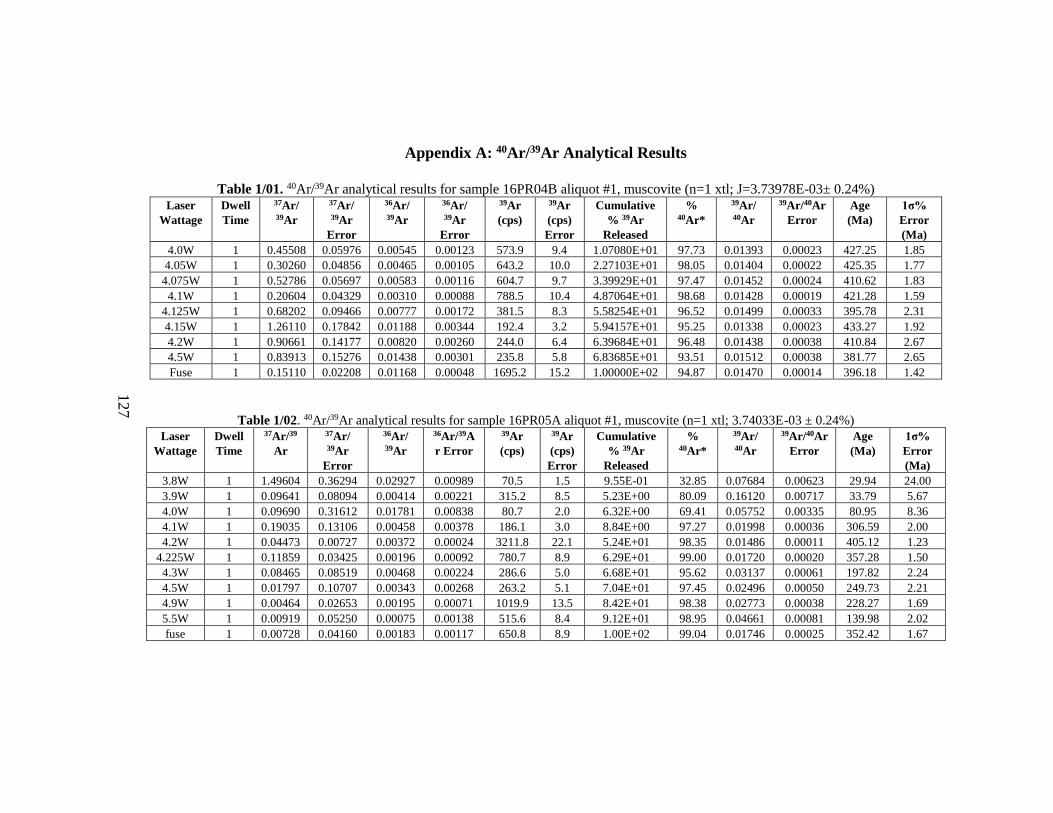
127
Appendix A: 40Ar/39Ar Analytical Results
Table 1/01. 40Ar/39Ar analytical results for sample 16PR04B aliquot #1, muscovite (n=1 xtl; J=3.73978E-03± 0.24%) Laser
Wattage
Dwell
Time
37Ar/ 39Ar
37Ar/ 39Ar
Error
36Ar/ 39Ar
36Ar/ 39Ar
Error
39Ar
(cps)
39Ar
(cps)
Error
Cumulative
% 39Ar
Released
% 40Ar*
39Ar/ 40Ar
39Ar/40Ar
Error
Age
(Ma)
1σ%
Error
(Ma)
4.0W 1 0.45508 0.05976 0.00545 0.00123 573.9 9.4 1.07080E+01 97.73 0.01393 0.00023 427.25 1.85
4.05W 1 0.30260 0.04856 0.00465 0.00105 643.2 10.0 2.27103E+01 98.05 0.01404 0.00022 425.35 1.77
4.075W 1 0.52786 0.05697 0.00583 0.00116 604.7 9.7 3.39929E+01 97.47 0.01452 0.00024 410.62 1.83
4.1W 1 0.20604 0.04329 0.00310 0.00088 788.5 10.4 4.87064E+01 98.68 0.01428 0.00019 421.28 1.59
4.125W 1 0.68202 0.09466 0.00777 0.00172 381.5 8.3 5.58254E+01 96.52 0.01499 0.00033 395.78 2.31
4.15W 1 1.26110 0.17842 0.01188 0.00344 192.4 3.2 5.94157E+01 95.25 0.01338 0.00023 433.27 1.92
4.2W 1 0.90661 0.14177 0.00820 0.00260 244.0 6.4 6.39684E+01 96.48 0.01438 0.00038 410.84 2.67
4.5W 1 0.83913 0.15276 0.01438 0.00301 235.8 5.8 6.83685E+01 93.51 0.01512 0.00038 381.77 2.65
Fuse 1 0.15110 0.02208 0.01168 0.00048 1695.2 15.2 1.00000E+02 94.87 0.01470 0.00014 396.18 1.42
Table 1/02. 40Ar/39Ar analytical results for sample 16PR05A aliquot #1, muscovite (n=1 xtl; 3.74033E-03 ± 0.24%)
Laser
Wattage
Dwell
Time
37Ar/39
Ar
37Ar/ 39Ar
Error
36Ar/ 39Ar
36Ar/39A
r Error
39Ar
(cps)
39Ar
(cps)
Error
Cumulative
% 39Ar
Released
% 40Ar*
39Ar/ 40Ar
39Ar/40Ar
Error
Age
(Ma)
1σ%
Error
(Ma)
3.8W 1 1.49604 0.36294 0.02927 0.00989 70.5 1.5 9.55E-01 32.85 0.07684 0.00623 29.94 24.00
3.9W 1 0.09641 0.08094 0.00414 0.00221 315.2 8.5 5.23E+00 80.09 0.16120 0.00717 33.79 5.67
4.0W 1 0.09690 0.31612 0.01781 0.00838 80.7 2.0 6.32E+00 69.41 0.05752 0.00335 80.95 8.36
4.1W 1 0.19035 0.13106 0.00458 0.00378 186.1 3.0 8.84E+00 97.27 0.01998 0.00036 306.59 2.00
4.2W 1 0.04473 0.00727 0.00372 0.00024 3211.8 22.1 5.24E+01 98.35 0.01486 0.00011 405.12 1.23
4.225W 1 0.11859 0.03425 0.00196 0.00092 780.7 8.9 6.29E+01 99.00 0.01720 0.00020 357.28 1.50
4.3W 1 0.08465 0.08519 0.00468 0.00224 286.6 5.0 6.68E+01 95.62 0.03137 0.00061 197.82 2.24
4.5W 1 0.01797 0.10707 0.00343 0.00268 263.2 5.1 7.04E+01 97.45 0.02496 0.00050 249.73 2.21
4.9W 1 0.00464 0.02653 0.00195 0.00071 1019.9 13.5 8.42E+01 98.38 0.02773 0.00038 228.27 1.69
5.5W 1 0.00919 0.05250 0.00075 0.00138 515.6 8.4 9.12E+01 98.95 0.04661 0.00081 139.98 2.02
fuse 1 0.00728 0.04160 0.00183 0.00117 650.8 8.9 1.00E+02 99.04 0.01746 0.00025 352.42 1.67
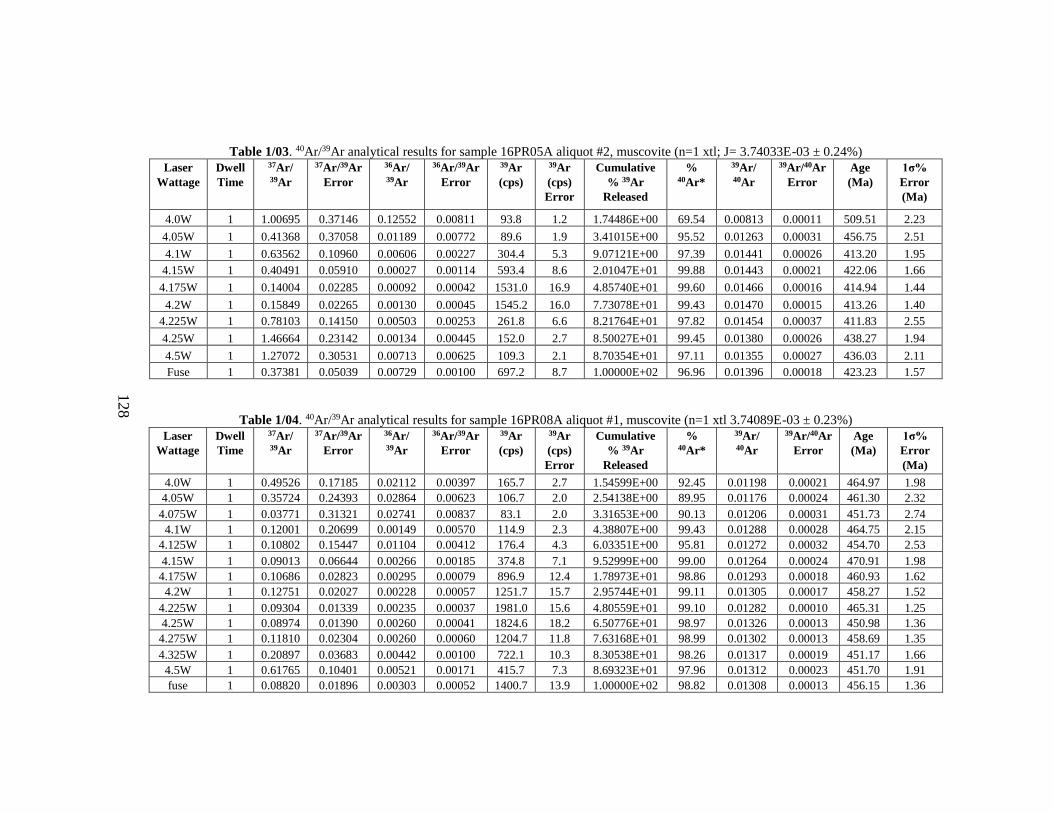
128
Table 1/03. 40Ar/39Ar analytical results for sample 16PR05A aliquot #2, muscovite (n=1 xtl; J= 3.74033E-03 ± 0.24%)
Laser
Wattage
Dwell
Time
37Ar/ 39Ar
37Ar/39Ar
Error
36Ar/ 39Ar
36Ar/39Ar
Error
39Ar
(cps)
39Ar
(cps)
Error
Cumulative
% 39Ar
Released
% 40Ar*
39Ar/ 40Ar
39Ar/40Ar
Error
Age
(Ma)
1σ%
Error
(Ma)
4.0W 1 1.00695 0.37146 0.12552 0.00811 93.8 1.2 1.74486E+00 69.54 0.00813 0.00011 509.51 2.23
4.05W 1 0.41368 0.37058 0.01189 0.00772 89.6 1.9 3.41015E+00 95.52 0.01263 0.00031 456.75 2.51
4.1W 1 0.63562 0.10960 0.00606 0.00227 304.4 5.3 9.07121E+00 97.39 0.01441 0.00026 413.20 1.95
4.15W 1 0.40491 0.05910 0.00027 0.00114 593.4 8.6 2.01047E+01 99.88 0.01443 0.00021 422.06 1.66
4.175W 1 0.14004 0.02285 0.00092 0.00042 1531.0 16.9 4.85740E+01 99.60 0.01466 0.00016 414.94 1.44
4.2W 1 0.15849 0.02265 0.00130 0.00045 1545.2 16.0 7.73078E+01 99.43 0.01470 0.00015 413.26 1.40
4.225W 1 0.78103 0.14150 0.00503 0.00253 261.8 6.6 8.21764E+01 97.82 0.01454 0.00037 411.83 2.55
4.25W 1 1.46664 0.23142 0.00134 0.00445 152.0 2.7 8.50027E+01 99.45 0.01380 0.00026 438.27 1.94
4.5W 1 1.27072 0.30531 0.00713 0.00625 109.3 2.1 8.70354E+01 97.11 0.01355 0.00027 436.03 2.11
Fuse 1 0.37381 0.05039 0.00729 0.00100 697.2 8.7 1.00000E+02 96.96 0.01396 0.00018 423.23 1.57
Table 1/04. 40Ar/39Ar analytical results for sample 16PR08A aliquot #1, muscovite (n=1 xtl 3.74089E-03 ± 0.23%)
Laser
Wattage
Dwell
Time
37Ar/ 39Ar
37Ar/39Ar
Error
36Ar/ 39Ar
36Ar/39Ar
Error
39Ar
(cps)
39Ar
(cps)
Error
Cumulative
% 39Ar
Released
% 40Ar*
39Ar/ 40Ar
39Ar/40Ar
Error
Age
(Ma)
1σ%
Error
(Ma)
4.0W 1 0.49526 0.17185 0.02112 0.00397 165.7 2.7 1.54599E+00 92.45 0.01198 0.00021 464.97 1.98
4.05W 1 0.35724 0.24393 0.02864 0.00623 106.7 2.0 2.54138E+00 89.95 0.01176 0.00024 461.30 2.32
4.075W 1 0.03771 0.31321 0.02741 0.00837 83.1 2.0 3.31653E+00 90.13 0.01206 0.00031 451.73 2.74
4.1W 1 0.12001 0.20699 0.00149 0.00570 114.9 2.3 4.38807E+00 99.43 0.01288 0.00028 464.75 2.15
4.125W 1 0.10802 0.15447 0.01104 0.00412 176.4 4.3 6.03351E+00 95.81 0.01272 0.00032 454.70 2.53
4.15W 1 0.09013 0.06644 0.00266 0.00185 374.8 7.1 9.52999E+00 99.00 0.01264 0.00024 470.91 1.98
4.175W 1 0.10686 0.02823 0.00295 0.00079 896.9 12.4 1.78973E+01 98.86 0.01293 0.00018 460.93 1.62
4.2W 1 0.12751 0.02027 0.00228 0.00057 1251.7 15.7 2.95744E+01 99.11 0.01305 0.00017 458.27 1.52
4.225W 1 0.09304 0.01339 0.00235 0.00037 1981.0 15.6 4.80559E+01 99.10 0.01282 0.00010 465.31 1.25
4.25W 1 0.08974 0.01390 0.00260 0.00041 1824.6 18.2 6.50776E+01 98.97 0.01326 0.00013 450.98 1.36
4.275W 1 0.11810 0.02304 0.00260 0.00060 1204.7 11.8 7.63168E+01 98.99 0.01302 0.00013 458.69 1.35
4.325W 1 0.20897 0.03683 0.00442 0.00100 722.1 10.3 8.30538E+01 98.26 0.01317 0.00019 451.17 1.66
4.5W 1 0.61765 0.10401 0.00521 0.00171 415.7 7.3 8.69323E+01 97.96 0.01312 0.00023 451.70 1.91
fuse 1 0.08820 0.01896 0.00303 0.00052 1400.7 13.9 1.00000E+02 98.82 0.01308 0.00013 456.15 1.36
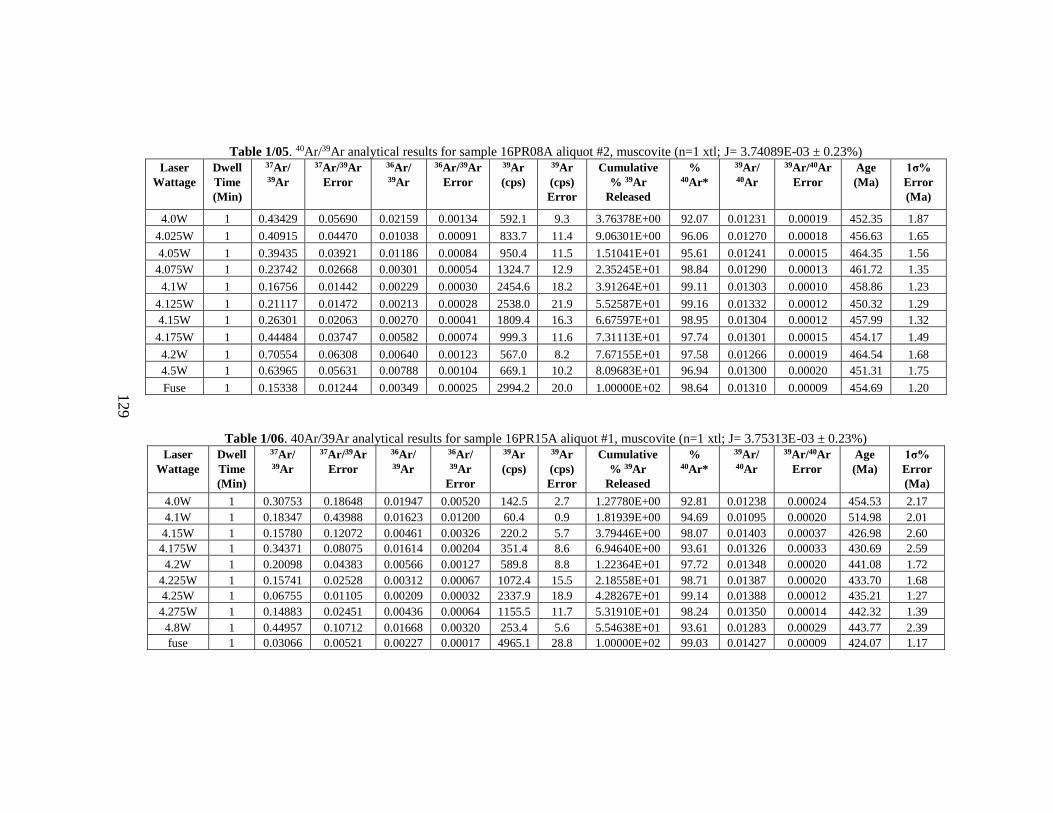
129
Table 1/05. 40Ar/39Ar analytical results for sample 16PR08A aliquot #2, muscovite (n=1 xtl; J= 3.74089E-03 ± 0.23%)
Laser
Wattage
Dwell
Time
(Min)
37Ar/ 39Ar
37Ar/39Ar
Error
36Ar/ 39Ar
36Ar/39Ar
Error
39Ar
(cps)
39Ar
(cps)
Error
Cumulative
% 39Ar
Released
% 40Ar*
39Ar/ 40Ar
39Ar/40Ar
Error
Age
(Ma)
1σ%
Error
(Ma)
4.0W 1 0.43429 0.05690 0.02159 0.00134 592.1 9.3 3.76378E+00 92.07 0.01231 0.00019 452.35 1.87
4.025W 1 0.40915 0.04470 0.01038 0.00091 833.7 11.4 9.06301E+00 96.06 0.01270 0.00018 456.63 1.65
4.05W 1 0.39435 0.03921 0.01186 0.00084 950.4 11.5 1.51041E+01 95.61 0.01241 0.00015 464.35 1.56
4.075W 1 0.23742 0.02668 0.00301 0.00054 1324.7 12.9 2.35245E+01 98.84 0.01290 0.00013 461.72 1.35
4.1W 1 0.16756 0.01442 0.00229 0.00030 2454.6 18.2 3.91264E+01 99.11 0.01303 0.00010 458.86 1.23
4.125W 1 0.21117 0.01472 0.00213 0.00028 2538.0 21.9 5.52587E+01 99.16 0.01332 0.00012 450.32 1.29
4.15W 1 0.26301 0.02063 0.00270 0.00041 1809.4 16.3 6.67597E+01 98.95 0.01304 0.00012 457.99 1.32
4.175W 1 0.44484 0.03747 0.00582 0.00074 999.3 11.6 7.31113E+01 97.74 0.01301 0.00015 454.17 1.49
4.2W 1 0.70554 0.06308 0.00640 0.00123 567.0 8.2 7.67155E+01 97.58 0.01266 0.00019 464.54 1.68
4.5W 1 0.63965 0.05631 0.00788 0.00104 669.1 10.2 8.09683E+01 96.94 0.01300 0.00020 451.31 1.75
Fuse 1 0.15338 0.01244 0.00349 0.00025 2994.2 20.0 1.00000E+02 98.64 0.01310 0.00009 454.69 1.20
Table 1/06. 40Ar/39Ar analytical results for sample 16PR15A aliquot #1, muscovite (n=1 xtl; J= 3.75313E-03 ± 0.23%)
Laser
Wattage
Dwell
Time
(Min)
37Ar/ 39Ar
37Ar/39Ar
Error
36Ar/ 39Ar
36Ar/ 39Ar
Error
39Ar
(cps)
39Ar
(cps)
Error
Cumulative
% 39Ar
Released
% 40Ar*
39Ar/ 40Ar
39Ar/40Ar
Error
Age
(Ma)
1σ%
Error
(Ma)
4.0W 1 0.30753 0.18648 0.01947 0.00520 142.5 2.7 1.27780E+00 92.81 0.01238 0.00024 454.53 2.17
4.1W 1 0.18347 0.43988 0.01623 0.01200 60.4 0.9 1.81939E+00 94.69 0.01095 0.00020 514.98 2.01
4.15W 1 0.15780 0.12072 0.00461 0.00326 220.2 5.7 3.79446E+00 98.07 0.01403 0.00037 426.98 2.60
4.175W 1 0.34371 0.08075 0.01614 0.00204 351.4 8.6 6.94640E+00 93.61 0.01326 0.00033 430.69 2.59
4.2W 1 0.20098 0.04383 0.00566 0.00127 589.8 8.8 1.22364E+01 97.72 0.01348 0.00020 441.08 1.72
4.225W 1 0.15741 0.02528 0.00312 0.00067 1072.4 15.5 2.18558E+01 98.71 0.01387 0.00020 433.70 1.68
4.25W 1 0.06755 0.01105 0.00209 0.00032 2337.9 18.9 4.28267E+01 99.14 0.01388 0.00012 435.21 1.27
4.275W 1 0.14883 0.02451 0.00436 0.00064 1155.5 11.7 5.31910E+01 98.24 0.01350 0.00014 442.32 1.39
4.8W 1 0.44957 0.10712 0.01668 0.00320 253.4 5.6 5.54638E+01 93.61 0.01283 0.00029 443.77 2.39
fuse 1 0.03066 0.00521 0.00227 0.00017 4965.1 28.8 1.00000E+02 99.03 0.01427 0.00009 424.07 1.17
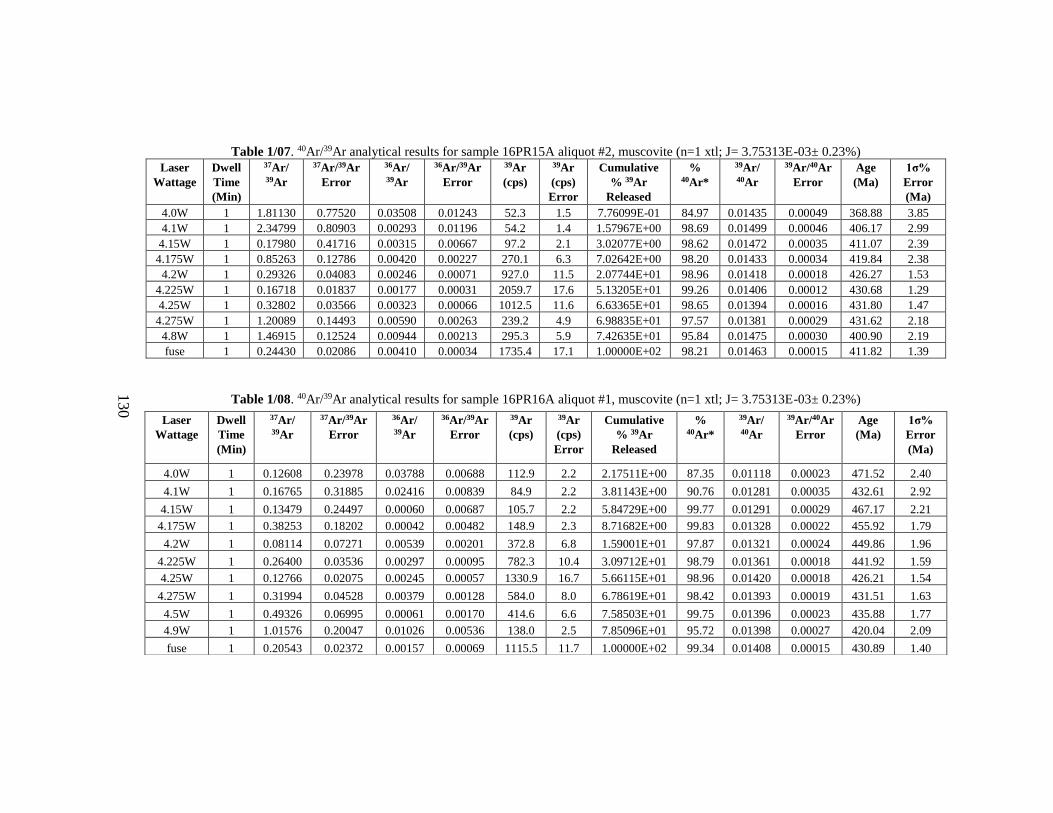
130
Table 1/07. 40Ar/39Ar analytical results for sample 16PR15A aliquot #2, muscovite (n=1 xtl; J= 3.75313E-03± 0.23%)
Laser
Wattage
Dwell
Time
(Min)
37Ar/ 39Ar
37Ar/39Ar
Error
36Ar/ 39Ar
36Ar/39Ar
Error
39Ar
(cps)
39Ar
(cps)
Error
Cumulative
% 39Ar
Released
% 40Ar*
39Ar/ 40Ar
39Ar/40Ar
Error
Age
(Ma)
1σ%
Error
(Ma)
4.0W 1 1.81130 0.77520 0.03508 0.01243 52.3 1.5 7.76099E-01 84.97 0.01435 0.00049 368.88 3.85
4.1W 1 2.34799 0.80903 0.00293 0.01196 54.2 1.4 1.57967E+00 98.69 0.01499 0.00046 406.17 2.99
4.15W 1 0.17980 0.41716 0.00315 0.00667 97.2 2.1 3.02077E+00 98.62 0.01472 0.00035 411.07 2.39
4.175W 1 0.85263 0.12786 0.00420 0.00227 270.1 6.3 7.02642E+00 98.20 0.01433 0.00034 419.84 2.38
4.2W 1 0.29326 0.04083 0.00246 0.00071 927.0 11.5 2.07744E+01 98.96 0.01418 0.00018 426.27 1.53
4.225W 1 0.16718 0.01837 0.00177 0.00031 2059.7 17.6 5.13205E+01 99.26 0.01406 0.00012 430.68 1.29
4.25W 1 0.32802 0.03566 0.00323 0.00066 1012.5 11.6 6.63365E+01 98.65 0.01394 0.00016 431.80 1.47
4.275W 1 1.20089 0.14493 0.00590 0.00263 239.2 4.9 6.98835E+01 97.57 0.01381 0.00029 431.62 2.18
4.8W 1 1.46915 0.12524 0.00944 0.00213 295.3 5.9 7.42635E+01 95.84 0.01475 0.00030 400.90 2.19
fuse 1 0.24430 0.02086 0.00410 0.00034 1735.4 17.1 1.00000E+02 98.21 0.01463 0.00015 411.82 1.39
Table 1/08. 40Ar/39Ar analytical results for sample 16PR16A aliquot #1, muscovite (n=1 xtl; J= 3.75313E-03± 0.23%)
Laser
Wattage
Dwell
Time
(Min)
37Ar/ 39Ar
37Ar/39Ar
Error
36Ar/ 39Ar
36Ar/39Ar
Error
39Ar
(cps)
39Ar
(cps)
Error
Cumulative
% 39Ar
Released
% 40Ar*
39Ar/ 40Ar
39Ar/40Ar
Error
Age
(Ma)
1σ%
Error
(Ma)
4.0W 1 0.12608 0.23978 0.03788 0.00688 112.9 2.2 2.17511E+00 87.35 0.01118 0.00023 471.52 2.40
4.1W 1 0.16765 0.31885 0.02416 0.00839 84.9 2.2 3.81143E+00 90.76 0.01281 0.00035 432.61 2.92
4.15W 1 0.13479 0.24497 0.00060 0.00687 105.7 2.2 5.84729E+00 99.77 0.01291 0.00029 467.17 2.21
4.175W 1 0.38253 0.18202 0.00042 0.00482 148.9 2.3 8.71682E+00 99.83 0.01328 0.00022 455.92 1.79
4.2W 1 0.08114 0.07271 0.00539 0.00201 372.8 6.8 1.59001E+01 97.87 0.01321 0.00024 449.86 1.96
4.225W 1 0.26400 0.03536 0.00297 0.00095 782.3 10.4 3.09712E+01 98.79 0.01361 0.00018 441.92 1.59
4.25W 1 0.12766 0.02075 0.00245 0.00057 1330.9 16.7 5.66115E+01 98.96 0.01420 0.00018 426.21 1.54
4.275W 1 0.31994 0.04528 0.00379 0.00128 584.0 8.0 6.78619E+01 98.42 0.01393 0.00019 431.51 1.63
4.5W 1 0.49326 0.06995 0.00061 0.00170 414.6 6.6 7.58503E+01 99.75 0.01396 0.00023 435.88 1.77
4.9W 1 1.01576 0.20047 0.01026 0.00536 138.0 2.5 7.85096E+01 95.72 0.01398 0.00027 420.04 2.09
fuse 1 0.20543 0.02372 0.00157 0.00069 1115.5 11.7 1.00000E+02 99.34 0.01408 0.00015 430.89 1.40
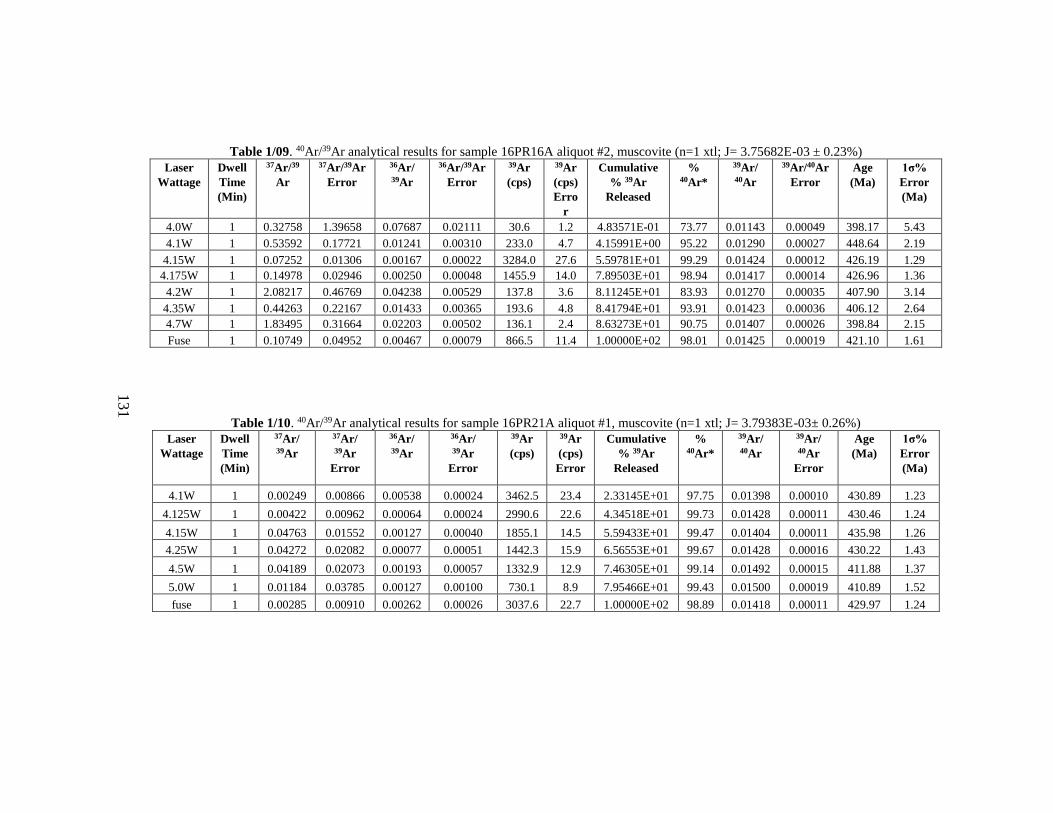
131
Table 1/09. 40Ar/39Ar analytical results for sample 16PR16A aliquot #2, muscovite (n=1 xtl; J= 3.75682E-03 ± 0.23%)
Laser
Wattage
Dwell
Time
(Min)
37Ar/39
Ar
37Ar/39Ar
Error
36Ar/ 39Ar
36Ar/39Ar
Error
39Ar
(cps)
39Ar
(cps)
Erro
r
Cumulative
% 39Ar
Released
% 40Ar*
39Ar/ 40Ar
39Ar/40Ar
Error
Age
(Ma)
1σ%
Error
(Ma)
4.0W 1 0.32758 1.39658 0.07687 0.02111 30.6 1.2 4.83571E-01 73.77 0.01143 0.00049 398.17 5.43
4.1W 1 0.53592 0.17721 0.01241 0.00310 233.0 4.7 4.15991E+00 95.22 0.01290 0.00027 448.64 2.19
4.15W 1 0.07252 0.01306 0.00167 0.00022 3284.0 27.6 5.59781E+01 99.29 0.01424 0.00012 426.19 1.29
4.175W 1 0.14978 0.02946 0.00250 0.00048 1455.9 14.0 7.89503E+01 98.94 0.01417 0.00014 426.96 1.36
4.2W 1 2.08217 0.46769 0.04238 0.00529 137.8 3.6 8.11245E+01 83.93 0.01270 0.00035 407.90 3.14
4.35W 1 0.44263 0.22167 0.01433 0.00365 193.6 4.8 8.41794E+01 93.91 0.01423 0.00036 406.12 2.64
4.7W 1 1.83495 0.31664 0.02203 0.00502 136.1 2.4 8.63273E+01 90.75 0.01407 0.00026 398.84 2.15
Fuse 1 0.10749 0.04952 0.00467 0.00079 866.5 11.4 1.00000E+02 98.01 0.01425 0.00019 421.10 1.61
Table 1/10. 40Ar/39Ar analytical results for sample 16PR21A aliquot #1, muscovite (n=1 xtl; J= 3.79383E-03± 0.26%)
Laser
Wattage
Dwell
Time
(Min)
37Ar/ 39Ar
37Ar/ 39Ar
Error
36Ar/ 39Ar
36Ar/ 39Ar
Error
39Ar
(cps)
39Ar
(cps)
Error
Cumulative
% 39Ar
Released
% 40Ar*
39Ar/ 40Ar
39Ar/ 40Ar
Error
Age
(Ma)
1σ%
Error
(Ma)
4.1W 1 0.00249 0.00866 0.00538 0.00024 3462.5 23.4 2.33145E+01 97.75 0.01398 0.00010 430.89 1.23
4.125W 1 0.00422 0.00962 0.00064 0.00024 2990.6 22.6 4.34518E+01 99.73 0.01428 0.00011 430.46 1.24
4.15W 1 0.04763 0.01552 0.00127 0.00040 1855.1 14.5 5.59433E+01 99.47 0.01404 0.00011 435.98 1.26
4.25W 1 0.04272 0.02082 0.00077 0.00051 1442.3 15.9 6.56553E+01 99.67 0.01428 0.00016 430.22 1.43
4.5W 1 0.04189 0.02073 0.00193 0.00057 1332.9 12.9 7.46305E+01 99.14 0.01492 0.00015 411.88 1.37
5.0W 1 0.01184 0.03785 0.00127 0.00100 730.1 8.9 7.95466E+01 99.43 0.01500 0.00019 410.89 1.52
fuse 1 0.00285 0.00910 0.00262 0.00026 3037.6 22.7 1.00000E+02 98.89 0.01418 0.00011 429.97 1.24
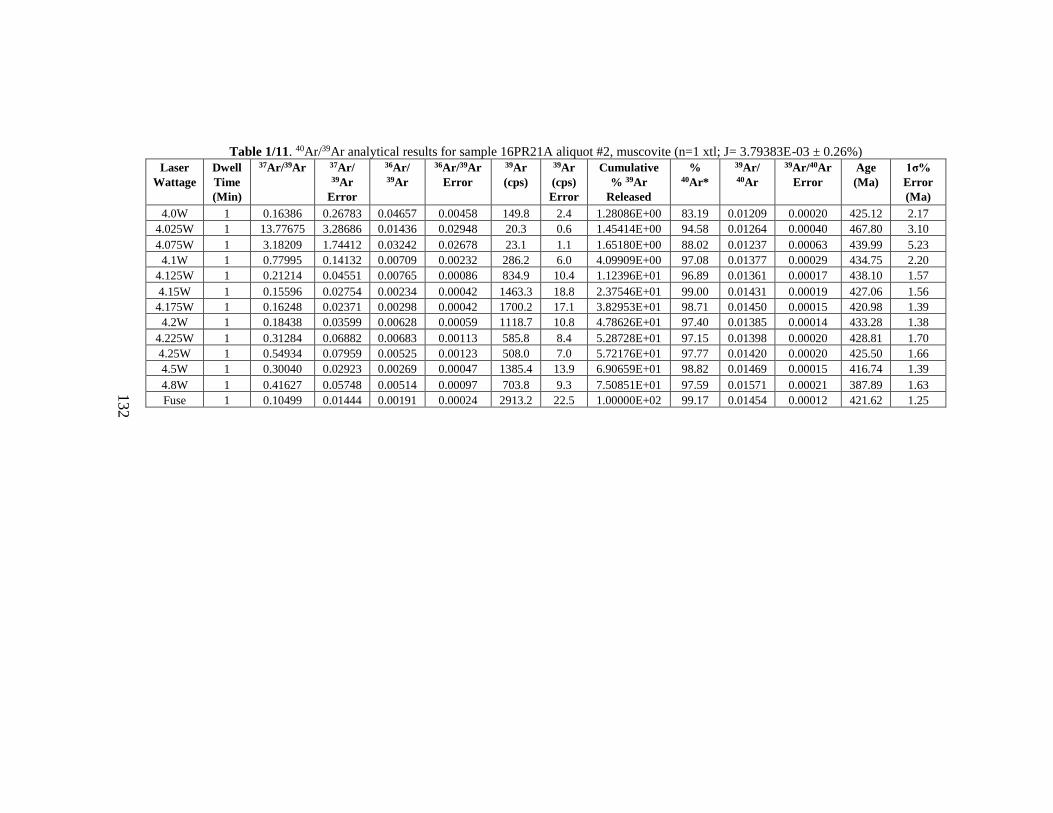
132
Table 1/11. 40Ar/39Ar analytical results for sample 16PR21A aliquot #2, muscovite (n=1 xtl; J= 3.79383E-03 ± 0.26%)
Laser
Wattage
Dwell
Time
(Min)
37Ar/39Ar 37Ar/ 39Ar
Error
36Ar/ 39Ar
36Ar/39Ar
Error
39Ar
(cps)
39Ar
(cps)
Error
Cumulative
% 39Ar
Released
% 40Ar*
39Ar/ 40Ar
39Ar/40Ar
Error
Age
(Ma)
1σ%
Error
(Ma)
4.0W 1 0.16386 0.26783 0.04657 0.00458 149.8 2.4 1.28086E+00 83.19 0.01209 0.00020 425.12 2.17
4.025W 1 13.77675 3.28686 0.01436 0.02948 20.3 0.6 1.45414E+00 94.58 0.01264 0.00040 467.80 3.10
4.075W 1 3.18209 1.74412 0.03242 0.02678 23.1 1.1 1.65180E+00 88.02 0.01237 0.00063 439.99 5.23
4.1W 1 0.77995 0.14132 0.00709 0.00232 286.2 6.0 4.09909E+00 97.08 0.01377 0.00029 434.75 2.20
4.125W 1 0.21214 0.04551 0.00765 0.00086 834.9 10.4 1.12396E+01 96.89 0.01361 0.00017 438.10 1.57
4.15W 1 0.15596 0.02754 0.00234 0.00042 1463.3 18.8 2.37546E+01 99.00 0.01431 0.00019 427.06 1.56
4.175W 1 0.16248 0.02371 0.00298 0.00042 1700.2 17.1 3.82953E+01 98.71 0.01450 0.00015 420.98 1.39
4.2W 1 0.18438 0.03599 0.00628 0.00059 1118.7 10.8 4.78626E+01 97.40 0.01385 0.00014 433.28 1.38
4.225W 1 0.31284 0.06882 0.00683 0.00113 585.8 8.4 5.28728E+01 97.15 0.01398 0.00020 428.81 1.70
4.25W 1 0.54934 0.07959 0.00525 0.00123 508.0 7.0 5.72176E+01 97.77 0.01420 0.00020 425.50 1.66
4.5W 1 0.30040 0.02923 0.00269 0.00047 1385.4 13.9 6.90659E+01 98.82 0.01469 0.00015 416.74 1.39
4.8W 1 0.41627 0.05748 0.00514 0.00097 703.8 9.3 7.50851E+01 97.59 0.01571 0.00021 387.89 1.63
Fuse 1 0.10499 0.01444 0.00191 0.00024 2913.2 22.5 1.00000E+02 99.17 0.01454 0.00012 421.62 1.25
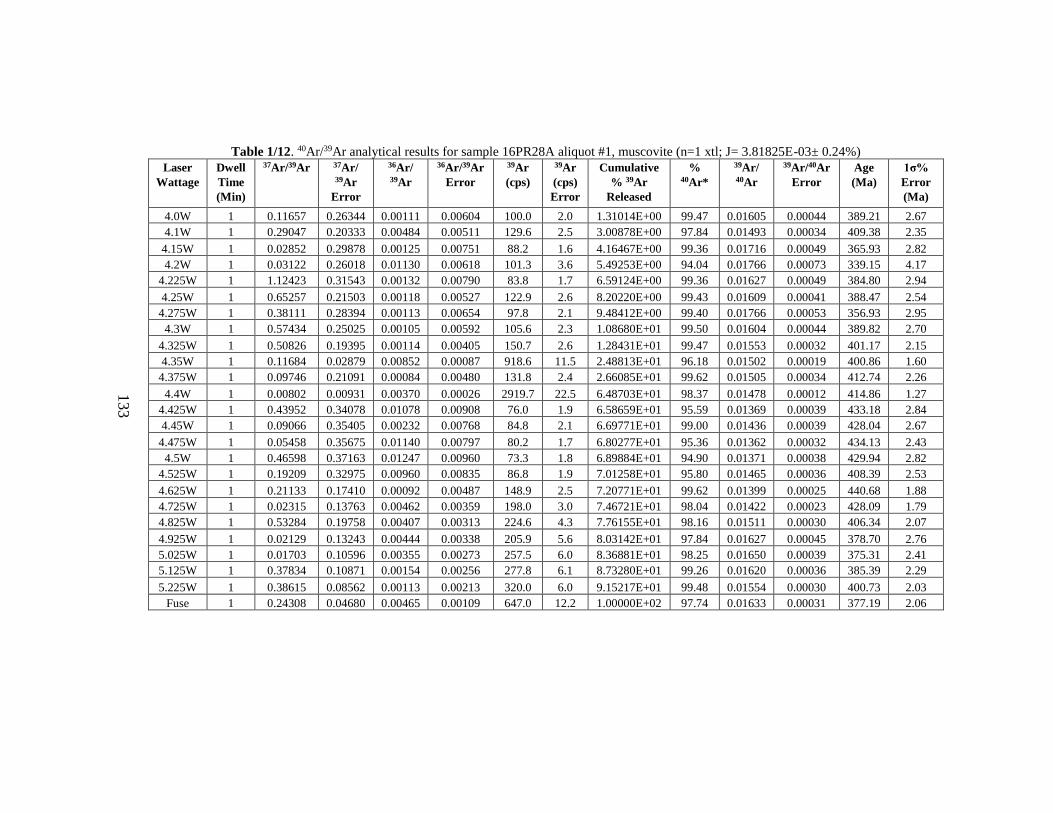
133
Table 1/12. 40Ar/39Ar analytical results for sample 16PR28A aliquot #1, muscovite (n=1 xtl; J= 3.81825E-03± 0.24%)
Laser
Wattage
Dwell
Time
(Min)
37Ar/39Ar 37Ar/ 39Ar
Error
36Ar/ 39Ar
36Ar/39Ar
Error
39Ar
(cps)
39Ar
(cps)
Error
Cumulative
% 39Ar
Released
% 40Ar*
39Ar/ 40Ar
39Ar/40Ar
Error
Age
(Ma)
1σ%
Error
(Ma)
4.0W 1 0.11657 0.26344 0.00111 0.00604 100.0 2.0 1.31014E+00 99.47 0.01605 0.00044 389.21 2.67
4.1W 1 0.29047 0.20333 0.00484 0.00511 129.6 2.5 3.00878E+00 97.84 0.01493 0.00034 409.38 2.35
4.15W 1 0.02852 0.29878 0.00125 0.00751 88.2 1.6 4.16467E+00 99.36 0.01716 0.00049 365.93 2.82
4.2W 1 0.03122 0.26018 0.01130 0.00618 101.3 3.6 5.49253E+00 94.04 0.01766 0.00073 339.15 4.17
4.225W 1 1.12423 0.31543 0.00132 0.00790 83.8 1.7 6.59124E+00 99.36 0.01627 0.00049 384.80 2.94
4.25W 1 0.65257 0.21503 0.00118 0.00527 122.9 2.6 8.20220E+00 99.43 0.01609 0.00041 388.47 2.54
4.275W 1 0.38111 0.28394 0.00113 0.00654 97.8 2.1 9.48412E+00 99.40 0.01766 0.00053 356.93 2.95
4.3W 1 0.57434 0.25025 0.00105 0.00592 105.6 2.3 1.08680E+01 99.50 0.01604 0.00044 389.82 2.70
4.325W 1 0.50826 0.19395 0.00114 0.00405 150.7 2.6 1.28431E+01 99.47 0.01553 0.00032 401.17 2.15
4.35W 1 0.11684 0.02879 0.00852 0.00087 918.6 11.5 2.48813E+01 96.18 0.01502 0.00019 400.86 1.60
4.375W 1 0.09746 0.21091 0.00084 0.00480 131.8 2.4 2.66085E+01 99.62 0.01505 0.00034 412.74 2.26
4.4W 1 0.00802 0.00931 0.00370 0.00026 2919.7 22.5 6.48703E+01 98.37 0.01478 0.00012 414.86 1.27
4.425W 1 0.43952 0.34078 0.01078 0.00908 76.0 1.9 6.58659E+01 95.59 0.01369 0.00039 433.18 2.84
4.45W 1 0.09066 0.35405 0.00232 0.00768 84.8 2.1 6.69771E+01 99.00 0.01436 0.00039 428.04 2.67
4.475W 1 0.05458 0.35675 0.01140 0.00797 80.2 1.7 6.80277E+01 95.36 0.01362 0.00032 434.13 2.43
4.5W 1 0.46598 0.37163 0.01247 0.00960 73.3 1.8 6.89884E+01 94.90 0.01371 0.00038 429.94 2.82
4.525W 1 0.19209 0.32975 0.00960 0.00835 86.8 1.9 7.01258E+01 95.80 0.01465 0.00036 408.39 2.53
4.625W 1 0.21133 0.17410 0.00092 0.00487 148.9 2.5 7.20771E+01 99.62 0.01399 0.00025 440.68 1.88
4.725W 1 0.02315 0.13763 0.00462 0.00359 198.0 3.0 7.46721E+01 98.04 0.01422 0.00023 428.09 1.79
4.825W 1 0.53284 0.19758 0.00407 0.00313 224.6 4.3 7.76155E+01 98.16 0.01511 0.00030 406.34 2.07
4.925W 1 0.02129 0.13243 0.00444 0.00338 205.9 5.6 8.03142E+01 97.84 0.01627 0.00045 378.70 2.76
5.025W 1 0.01703 0.10596 0.00355 0.00273 257.5 6.0 8.36881E+01 98.25 0.01650 0.00039 375.31 2.41
5.125W 1 0.37834 0.10871 0.00154 0.00256 277.8 6.1 8.73280E+01 99.26 0.01620 0.00036 385.39 2.29
5.225W 1 0.38615 0.08562 0.00113 0.00213 320.0 6.0 9.15217E+01 99.48 0.01554 0.00030 400.73 2.03
Fuse 1 0.24308 0.04680 0.00465 0.00109 647.0 12.2 1.00000E+02 97.74 0.01633 0.00031 377.19 2.06
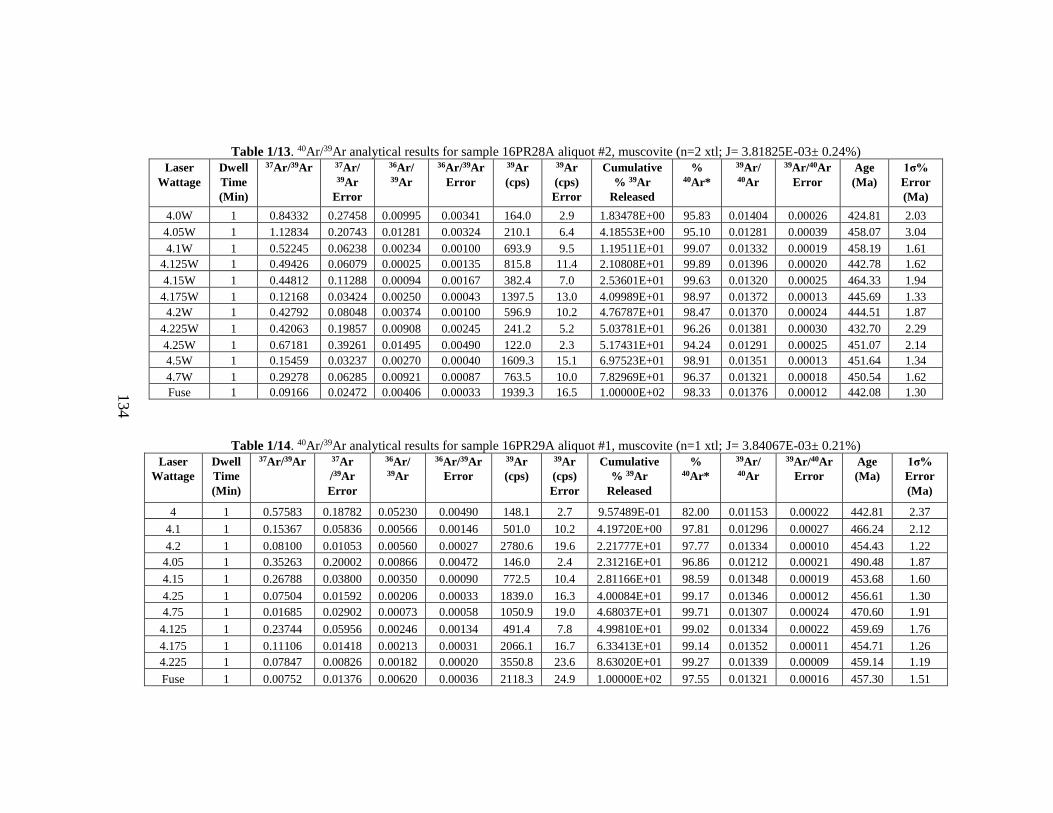
134
Table 1/13. 40Ar/39Ar analytical results for sample 16PR28A aliquot #2, muscovite (n=2 xtl; J= 3.81825E-03± 0.24%)
Laser
Wattage
Dwell
Time
(Min)
37Ar/39Ar 37Ar/ 39Ar
Error
36Ar/ 39Ar
36Ar/39Ar
Error
39Ar
(cps)
39Ar
(cps)
Error
Cumulative
% 39Ar
Released
% 40Ar*
39Ar/ 40Ar
39Ar/40Ar
Error
Age
(Ma)
1σ%
Error
(Ma)
4.0W 1 0.84332 0.27458 0.00995 0.00341 164.0 2.9 1.83478E+00 95.83 0.01404 0.00026 424.81 2.03
4.05W 1 1.12834 0.20743 0.01281 0.00324 210.1 6.4 4.18553E+00 95.10 0.01281 0.00039 458.07 3.04
4.1W 1 0.52245 0.06238 0.00234 0.00100 693.9 9.5 1.19511E+01 99.07 0.01332 0.00019 458.19 1.61
4.125W 1 0.49426 0.06079 0.00025 0.00135 815.8 11.4 2.10808E+01 99.89 0.01396 0.00020 442.78 1.62
4.15W 1 0.44812 0.11288 0.00094 0.00167 382.4 7.0 2.53601E+01 99.63 0.01320 0.00025 464.33 1.94
4.175W 1 0.12168 0.03424 0.00250 0.00043 1397.5 13.0 4.09989E+01 98.97 0.01372 0.00013 445.69 1.33
4.2W 1 0.42792 0.08048 0.00374 0.00100 596.9 10.2 4.76787E+01 98.47 0.01370 0.00024 444.51 1.87
4.225W 1 0.42063 0.19857 0.00908 0.00245 241.2 5.2 5.03781E+01 96.26 0.01381 0.00030 432.70 2.29
4.25W 1 0.67181 0.39261 0.01495 0.00490 122.0 2.3 5.17431E+01 94.24 0.01291 0.00025 451.07 2.14
4.5W 1 0.15459 0.03237 0.00270 0.00040 1609.3 15.1 6.97523E+01 98.91 0.01351 0.00013 451.64 1.34
4.7W 1 0.29278 0.06285 0.00921 0.00087 763.5 10.0 7.82969E+01 96.37 0.01321 0.00018 450.54 1.62
Fuse 1 0.09166 0.02472 0.00406 0.00033 1939.3 16.5 1.00000E+02 98.33 0.01376 0.00012 442.08 1.30
Table 1/14. 40Ar/39Ar analytical results for sample 16PR29A aliquot #1, muscovite (n=1 xtl; J= 3.84067E-03± 0.21%)
Laser
Wattage
Dwell
Time
(Min)
37Ar/39Ar 37Ar
/39Ar
Error
36Ar/ 39Ar
36Ar/39Ar
Error
39Ar
(cps)
39Ar
(cps)
Error
Cumulative
% 39Ar
Released
% 40Ar*
39Ar/ 40Ar
39Ar/40Ar
Error
Age
(Ma)
1σ%
Error
(Ma)
4 1 0.57583 0.18782 0.05230 0.00490 148.1 2.7 9.57489E-01 82.00 0.01153 0.00022 442.81 2.37
4.1 1 0.15367 0.05836 0.00566 0.00146 501.0 10.2 4.19720E+00 97.81 0.01296 0.00027 466.24 2.12
4.2 1 0.08100 0.01053 0.00560 0.00027 2780.6 19.6 2.21777E+01 97.77 0.01334 0.00010 454.43 1.22
4.05 1 0.35263 0.20002 0.00866 0.00472 146.0 2.4 2.31216E+01 96.86 0.01212 0.00021 490.48 1.87
4.15 1 0.26788 0.03800 0.00350 0.00090 772.5 10.4 2.81166E+01 98.59 0.01348 0.00019 453.68 1.60
4.25 1 0.07504 0.01592 0.00206 0.00033 1839.0 16.3 4.00084E+01 99.17 0.01346 0.00012 456.61 1.30
4.75 1 0.01685 0.02902 0.00073 0.00058 1050.9 19.0 4.68037E+01 99.71 0.01307 0.00024 470.60 1.91
4.125 1 0.23744 0.05956 0.00246 0.00134 491.4 7.8 4.99810E+01 99.02 0.01334 0.00022 459.69 1.76
4.175 1 0.11106 0.01418 0.00213 0.00031 2066.1 16.7 6.33413E+01 99.14 0.01352 0.00011 454.71 1.26
4.225 1 0.07847 0.00826 0.00182 0.00020 3550.8 23.6 8.63020E+01 99.27 0.01339 0.00009 459.14 1.19
Fuse 1 0.00752 0.01376 0.00620 0.00036 2118.3 24.9 1.00000E+02 97.55 0.01321 0.00016 457.30 1.51
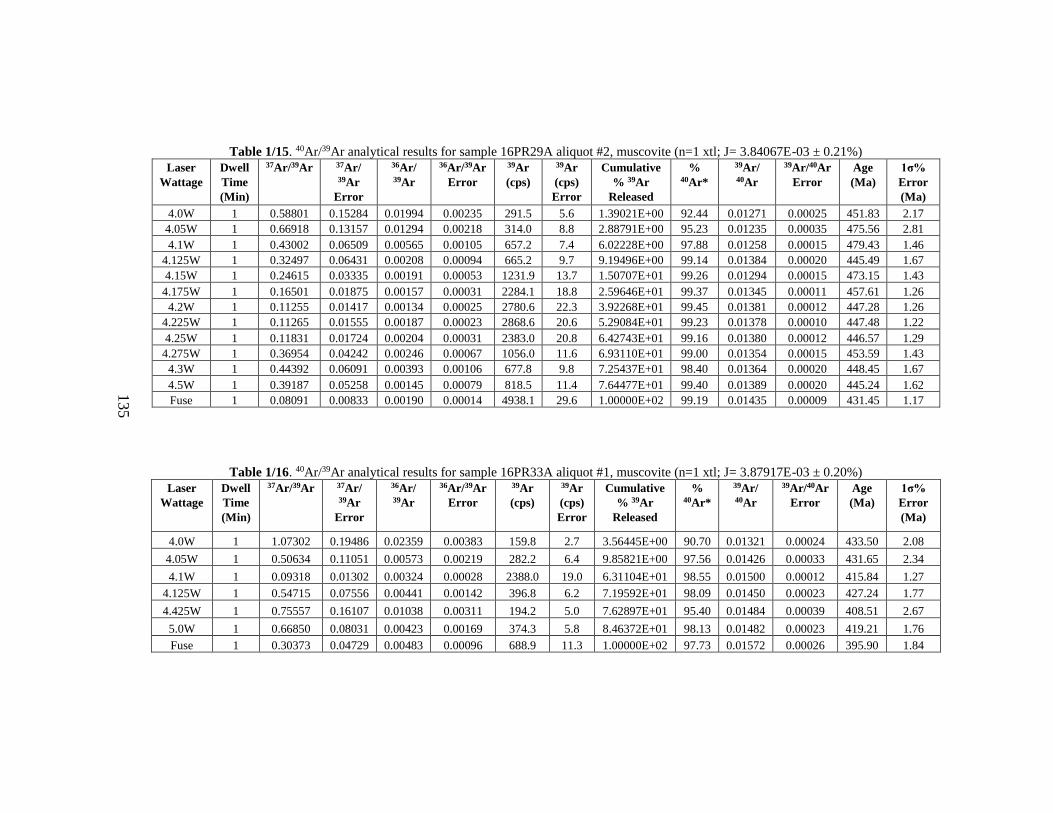
135
Table 1/15. 40Ar/39Ar analytical results for sample 16PR29A aliquot #2, muscovite (n=1 xtl; J= 3.84067E-03 ± 0.21%)
Laser
Wattage
Dwell
Time
(Min)
37Ar/39Ar 37Ar/ 39Ar
Error
36Ar/ 39Ar
36Ar/39Ar
Error
39Ar
(cps)
39Ar
(cps)
Error
Cumulative
% 39Ar
Released
% 40Ar*
39Ar/ 40Ar
39Ar/40Ar
Error
Age
(Ma)
1σ%
Error
(Ma)
4.0W 1 0.58801 0.15284 0.01994 0.00235 291.5 5.6 1.39021E+00 92.44 0.01271 0.00025 451.83 2.17
4.05W 1 0.66918 0.13157 0.01294 0.00218 314.0 8.8 2.88791E+00 95.23 0.01235 0.00035 475.56 2.81
4.1W 1 0.43002 0.06509 0.00565 0.00105 657.2 7.4 6.02228E+00 97.88 0.01258 0.00015 479.43 1.46
4.125W 1 0.32497 0.06431 0.00208 0.00094 665.2 9.7 9.19496E+00 99.14 0.01384 0.00020 445.49 1.67
4.15W 1 0.24615 0.03335 0.00191 0.00053 1231.9 13.7 1.50707E+01 99.26 0.01294 0.00015 473.15 1.43
4.175W 1 0.16501 0.01875 0.00157 0.00031 2284.1 18.8 2.59646E+01 99.37 0.01345 0.00011 457.61 1.26
4.2W 1 0.11255 0.01417 0.00134 0.00025 2780.6 22.3 3.92268E+01 99.45 0.01381 0.00012 447.28 1.26
4.225W 1 0.11265 0.01555 0.00187 0.00023 2868.6 20.6 5.29084E+01 99.23 0.01378 0.00010 447.48 1.22
4.25W 1 0.11831 0.01724 0.00204 0.00031 2383.0 20.8 6.42743E+01 99.16 0.01380 0.00012 446.57 1.29
4.275W 1 0.36954 0.04242 0.00246 0.00067 1056.0 11.6 6.93110E+01 99.00 0.01354 0.00015 453.59 1.43
4.3W 1 0.44392 0.06091 0.00393 0.00106 677.8 9.8 7.25437E+01 98.40 0.01364 0.00020 448.45 1.67
4.5W 1 0.39187 0.05258 0.00145 0.00079 818.5 11.4 7.64477E+01 99.40 0.01389 0.00020 445.24 1.62
Fuse 1 0.08091 0.00833 0.00190 0.00014 4938.1 29.6 1.00000E+02 99.19 0.01435 0.00009 431.45 1.17
Table 1/16. 40Ar/39Ar analytical results for sample 16PR33A aliquot #1, muscovite (n=1 xtl; J= 3.87917E-03 ± 0.20%)
Laser
Wattage
Dwell
Time
(Min)
37Ar/39Ar 37Ar/ 39Ar
Error
36Ar/ 39Ar
36Ar/39Ar
Error
39Ar
(cps)
39Ar
(cps)
Error
Cumulative
% 39Ar
Released
% 40Ar*
39Ar/ 40Ar
39Ar/40Ar
Error
Age
(Ma)
1σ%
Error
(Ma)
4.0W 1 1.07302 0.19486 0.02359 0.00383 159.8 2.7 3.56445E+00 90.70 0.01321 0.00024 433.50 2.08
4.05W 1 0.50634 0.11051 0.00573 0.00219 282.2 6.4 9.85821E+00 97.56 0.01426 0.00033 431.65 2.34
4.1W 1 0.09318 0.01302 0.00324 0.00028 2388.0 19.0 6.31104E+01 98.55 0.01500 0.00012 415.84 1.27
4.125W 1 0.54715 0.07556 0.00441 0.00142 396.8 6.2 7.19592E+01 98.09 0.01450 0.00023 427.24 1.77
4.425W 1 0.75557 0.16107 0.01038 0.00311 194.2 5.0 7.62897E+01 95.40 0.01484 0.00039 408.51 2.67
5.0W 1 0.66850 0.08031 0.00423 0.00169 374.3 5.8 8.46372E+01 98.13 0.01482 0.00023 419.21 1.76
Fuse 1 0.30373 0.04729 0.00483 0.00096 688.9 11.3 1.00000E+02 97.73 0.01572 0.00026 395.90 1.84
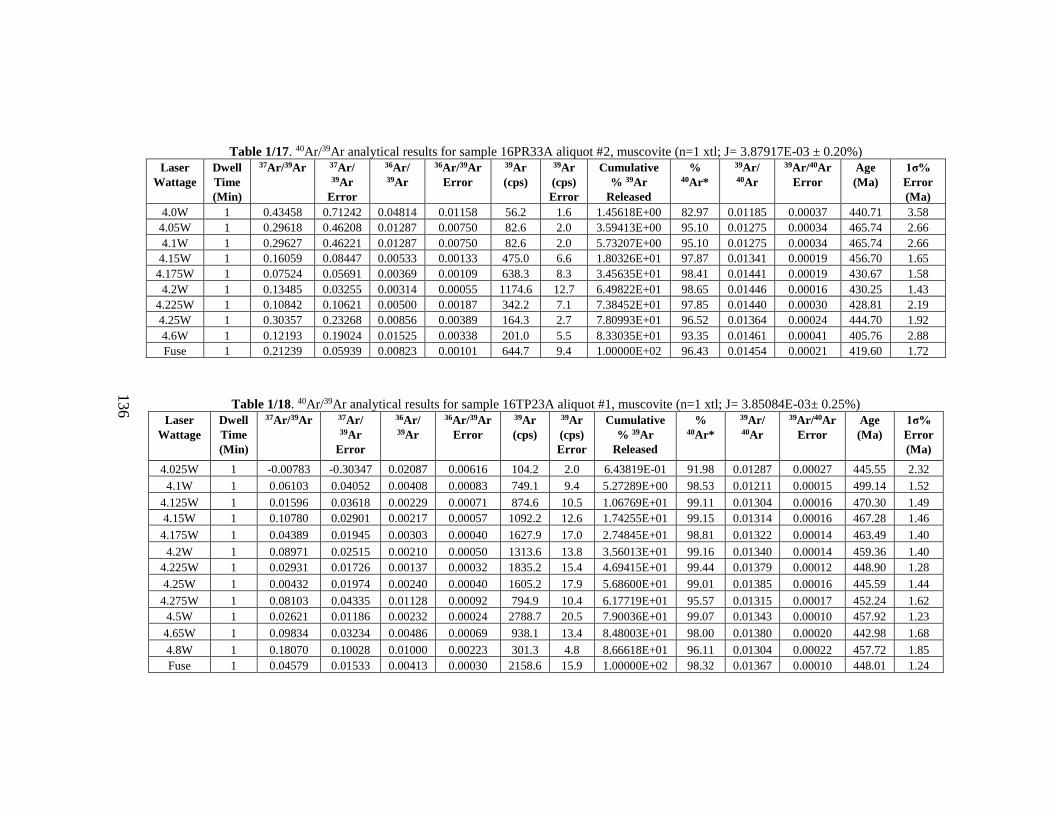
136
Table 1/17. 40Ar/39Ar analytical results for sample 16PR33A aliquot #2, muscovite (n=1 xtl; J= 3.87917E-03 ± 0.20%)
Laser
Wattage
Dwell
Time
(Min)
37Ar/39Ar 37Ar/ 39Ar
Error
36Ar/ 39Ar
36Ar/39Ar
Error
39Ar
(cps)
39Ar
(cps)
Error
Cumulative
% 39Ar
Released
% 40Ar*
39Ar/ 40Ar
39Ar/40Ar
Error
Age
(Ma)
1σ%
Error
(Ma)
4.0W 1 0.43458 0.71242 0.04814 0.01158 56.2 1.6 1.45618E+00 82.97 0.01185 0.00037 440.71 3.58
4.05W 1 0.29618 0.46208 0.01287 0.00750 82.6 2.0 3.59413E+00 95.10 0.01275 0.00034 465.74 2.66
4.1W 1 0.29627 0.46221 0.01287 0.00750 82.6 2.0 5.73207E+00 95.10 0.01275 0.00034 465.74 2.66
4.15W 1 0.16059 0.08447 0.00533 0.00133 475.0 6.6 1.80326E+01 97.87 0.01341 0.00019 456.70 1.65
4.175W 1 0.07524 0.05691 0.00369 0.00109 638.3 8.3 3.45635E+01 98.41 0.01441 0.00019 430.67 1.58
4.2W 1 0.13485 0.03255 0.00314 0.00055 1174.6 12.7 6.49822E+01 98.65 0.01446 0.00016 430.25 1.43
4.225W 1 0.10842 0.10621 0.00500 0.00187 342.2 7.1 7.38452E+01 97.85 0.01440 0.00030 428.81 2.19
4.25W 1 0.30357 0.23268 0.00856 0.00389 164.3 2.7 7.80993E+01 96.52 0.01364 0.00024 444.70 1.92
4.6W 1 0.12193 0.19024 0.01525 0.00338 201.0 5.5 8.33035E+01 93.35 0.01461 0.00041 405.76 2.88
Fuse 1 0.21239 0.05939 0.00823 0.00101 644.7 9.4 1.00000E+02 96.43 0.01454 0.00021 419.60 1.72
Table 1/18. 40Ar/39Ar analytical results for sample 16TP23A aliquot #1, muscovite (n=1 xtl; J= 3.85084E-03± 0.25%)
Laser
Wattage
Dwell
Time
(Min)
37Ar/39Ar 37Ar/ 39Ar
Error
36Ar/ 39Ar
36Ar/39Ar
Error
39Ar
(cps)
39Ar
(cps)
Error
Cumulative
% 39Ar
Released
% 40Ar*
39Ar/ 40Ar
39Ar/40Ar
Error
Age
(Ma)
1σ%
Error
(Ma)
4.025W 1 -0.00783 -0.30347 0.02087 0.00616 104.2 2.0 6.43819E-01 91.98 0.01287 0.00027 445.55 2.32
4.1W 1 0.06103 0.04052 0.00408 0.00083 749.1 9.4 5.27289E+00 98.53 0.01211 0.00015 499.14 1.52
4.125W 1 0.01596 0.03618 0.00229 0.00071 874.6 10.5 1.06769E+01 99.11 0.01304 0.00016 470.30 1.49
4.15W 1 0.10780 0.02901 0.00217 0.00057 1092.2 12.6 1.74255E+01 99.15 0.01314 0.00016 467.28 1.46
4.175W 1 0.04389 0.01945 0.00303 0.00040 1627.9 17.0 2.74845E+01 98.81 0.01322 0.00014 463.49 1.40
4.2W 1 0.08971 0.02515 0.00210 0.00050 1313.6 13.8 3.56013E+01 99.16 0.01340 0.00014 459.36 1.40
4.225W 1 0.02931 0.01726 0.00137 0.00032 1835.2 15.4 4.69415E+01 99.44 0.01379 0.00012 448.90 1.28
4.25W 1 0.00432 0.01974 0.00240 0.00040 1605.2 17.9 5.68600E+01 99.01 0.01385 0.00016 445.59 1.44
4.275W 1 0.08103 0.04335 0.01128 0.00092 794.9 10.4 6.17719E+01 95.57 0.01315 0.00017 452.24 1.62
4.5W 1 0.02621 0.01186 0.00232 0.00024 2788.7 20.5 7.90036E+01 99.07 0.01343 0.00010 457.92 1.23
4.65W 1 0.09834 0.03234 0.00486 0.00069 938.1 13.4 8.48003E+01 98.00 0.01380 0.00020 442.98 1.68
4.8W 1 0.18070 0.10028 0.01000 0.00223 301.3 4.8 8.66618E+01 96.11 0.01304 0.00022 457.72 1.85
Fuse 1 0.04579 0.01533 0.00413 0.00030 2158.6 15.9 1.00000E+02 98.32 0.01367 0.00010 448.01 1.24
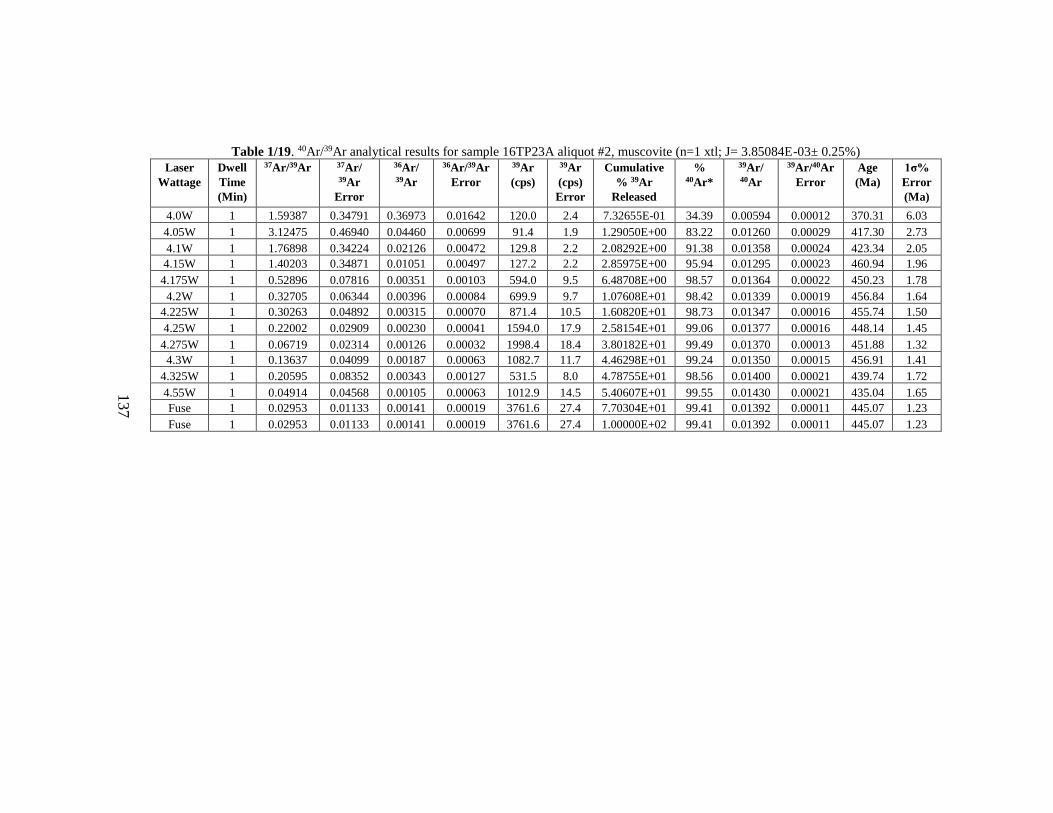
137
Table 1/19. 40Ar/39Ar analytical results for sample 16TP23A aliquot #2, muscovite (n=1 xtl; J= 3.85084E-03± 0.25%)
Laser
Wattage
Dwell
Time
(Min)
37Ar/39Ar 37Ar/ 39Ar
Error
36Ar/ 39Ar
36Ar/39Ar
Error
39Ar
(cps)
39Ar
(cps)
Error
Cumulative
% 39Ar
Released
% 40Ar*
39Ar/ 40Ar
39Ar/40Ar
Error
Age
(Ma)
1σ%
Error
(Ma)
4.0W 1 1.59387 0.34791 0.36973 0.01642 120.0 2.4 7.32655E-01 34.39 0.00594 0.00012 370.31 6.03
4.05W 1 3.12475 0.46940 0.04460 0.00699 91.4 1.9 1.29050E+00 83.22 0.01260 0.00029 417.30 2.73
4.1W 1 1.76898 0.34224 0.02126 0.00472 129.8 2.2 2.08292E+00 91.38 0.01358 0.00024 423.34 2.05
4.15W 1 1.40203 0.34871 0.01051 0.00497 127.2 2.2 2.85975E+00 95.94 0.01295 0.00023 460.94 1.96
4.175W 1 0.52896 0.07816 0.00351 0.00103 594.0 9.5 6.48708E+00 98.57 0.01364 0.00022 450.23 1.78
4.2W 1 0.32705 0.06344 0.00396 0.00084 699.9 9.7 1.07608E+01 98.42 0.01339 0.00019 456.84 1.64
4.225W 1 0.30263 0.04892 0.00315 0.00070 871.4 10.5 1.60820E+01 98.73 0.01347 0.00016 455.74 1.50
4.25W 1 0.22002 0.02909 0.00230 0.00041 1594.0 17.9 2.58154E+01 99.06 0.01377 0.00016 448.14 1.45
4.275W 1 0.06719 0.02314 0.00126 0.00032 1998.4 18.4 3.80182E+01 99.49 0.01370 0.00013 451.88 1.32
4.3W 1 0.13637 0.04099 0.00187 0.00063 1082.7 11.7 4.46298E+01 99.24 0.01350 0.00015 456.91 1.41
4.325W 1 0.20595 0.08352 0.00343 0.00127 531.5 8.0 4.78755E+01 98.56 0.01400 0.00021 439.74 1.72
4.55W 1 0.04914 0.04568 0.00105 0.00063 1012.9 14.5 5.40607E+01 99.55 0.01430 0.00021 435.04 1.65
Fuse 1 0.02953 0.01133 0.00141 0.00019 3761.6 27.4 7.70304E+01 99.41 0.01392 0.00011 445.07 1.23
Fuse 1 0.02953 0.01133 0.00141 0.00019 3761.6 27.4 1.00000E+02 99.41 0.01392 0.00011 445.07 1.23


