Embed Size (px)
Citation preview

bullbull A-
2 6 89
PROTECTION A C t N C Y^ __0^Cpound Of R E G I O N ^ COUNSEL
Geochemical Study of Sediment Contamination i n mdashNew Bedford Harbor Massachusetts
1 1 2Richard J Pruell Curtis B Norwood Robert D Bowen
1 1 3Warren S Boothman Peter F Rogerson Murray Hackett
4and Brian C Butterworth
1 - US Environmental Protection AgencyEnvironmental Research Laboratory
South Ferry RoadNarragansett RI 02882 - Present address
US Geological SurveyNational Water Quality Laboratory
593 Ward RoadArvada CO 80002
2 - Science Applications International CorporationUS Environmental Protection Agency
South Ferry RoadNarragansett RI 02882
3 - Center for Lake Superior Environmental StudiesUniversity of Wisconsin Superior
Superior WS 54880 - Present address
Department of BiochemistryUniversity of NevadaReno
Reno Nevada 89557
4 - US Environmental Protection AgencyEnvironmental Research Laboratory
6201 Congdon BoulevardDuluth MN 55804
May 1 1989
Page pound
ABSTRACT
Chemical analyses of sediment samples collected along a
transect in New Bedford Harbor revealed a gradient of increasing
concentrations of polychlorinated biphenyls (PCBs)
polychlorinated dibenzo-p-dioxins (PCDDs) polychlorinated
dibenzofurans (PCDFs) polycyclic aromatic hydrocarbons (PAHs)
and several trace metals from the southern to the northern areas
of the estuary Although the levels of contamination generally
increase with distance north in the estuary for all classes of
compounds differences were observed between the trends for many
of the compounds These differences are probably due to both the
sources and differential environmental behaviors of the compounds
in the estuary The primary sources of PCBs PCDFs and trace
metals appear to be industrial discharges either directly into
the estuary or through combined sewer overflows Additional
inputs of PCDFs may have also impacted the lower portions of the
harbor These inputs may be from the combustion of sewage sludge
containing high levels of PCBs at the New Bedford Harbor
Municipal Wastewater Treatment Plant The major inputs of PAHs
and PCDDs are probably from urban runoff entering the harbor
through combined sewer overflows and storm drains
INTRODUCTION
The ecological health of many estuarine areas is threatened
by inputs of toxic compounds and the accumulation of these
contaminants in sediments The sediments of many industrialized
estuaries contain high concentrations of anthropogenically
produced or mobilized compounds (Bopp et al 1982 Pruell and
Quinn 1985 Schults et al 1987) and many of the contaminants
Page 3
found in estuarine sediments are biologically available
(Rubinstein et al 1983 Pruell et al 1986) Thereby
sediment associated contaminats can affect biota or result in
high concentrations in the tissues of indigenous organisms
Contaminant sources to such areas are known to include
sewage outfalls industrial effluents urban runoff rivers and
atmospheric deposition A better understanding of the sources
and environmental fates of contaminants is required to limit
further degradation of urban estuaries and to remediate
contaminated areas Specifically in New Bedford Harbor (NBH)
detailed information on the spatial distribution of contaminants
is required to determine how best to deal with this highly
contaminated estuary a portion of which has been designated an
EPA Superfund Site (Weaver 1984)
Several previous studies have shown that the sediments in
some areas of NBH contain extremely high concentrations of PCBs
and metals (Weaver 1984 Stoffers et al 1977) The present
study provides additional data on the geochemistry of PCBs and
metals in the harbor as well as information on the concentrations
and distributions of compounds from several chemical classes
(PAHs PCDDs and PCDFs) which had not been previously studied in
detail in NBH These chemical data are used to produce a more
complete geochemical picture of this estuary in order to gain a
better understanding of the likely sources of contamination
Page 4
METHODS
Sediment Collection
Sediments were collected from 12 locations in NBH (Figure 1)
on January 21 and 22 1986 using a Ponar grab sampler from the
RV East Passage A sediment core (0-5 cm depth) was then
taken from each of three grabs collected at a station The
contents of the cores (34 cm diameter polycarbonate core liners)
from each station were combined and homogenized in cleaned glass
jars Sediment was collected from an additional site (Station M)
on January 6 1987 This sample was obtained in a shallow (5-10
cm water depth) area of the Acushnet River above the tidal
influence of the estuary Surface sediment (0-5 cm) was
collected with a metal shovel homogenized and aliquots were
placed into glass jars All sediment samples were stored at
4degC prior to analysis
The concentrations of total organic carbon (TOO PCBs PAHs
and several trace metals were measured in single sediment samples
from each of the 13 stations PCDDs and PCDFs were quantified in
duplicate samples collected from stations B J L and M
Total Organic Carbon
Samples to be analyzed for TOC were dried for 24 hours at
100degC and then any shell fragments were removed The
sediment was ground to a fine powder and a portion weighed into a
tin pan on a Cahn electrobalance (Model 4700) Carbon
concentrations were measured using a Carlo Erba Model 1106 CHN
analyzer
Page 5
Organic Analysis
Sediment samples were thoroughly homogenized with a spatula
and 1 to 10 g (wet weight) placed into a glass centrifuge tube
Recovery standards (octachloronaphthalene (OCN) DlO-phenanthrene
and Dl2-benzanthracene) and 50 ml of acetonitrile were added
The samples were sonicated with an ultrasonic probe for 60
seconds then centrifuged at 10000 rpm for 5 minutes in a
refrigerated centrifuge at 4degC The supernatant was decanted
into a 1 liter separatory funnel containing 300 ml of deionized
water and the extraction was repeated twice more and the extracts
combined
Fifty ml of pentane were added to the separatory funnel the
funnel was shaken and the pentane layer removed This was
repeated 2 more times and the extracts combined and then dried
with sodium sulfate The pentane was volume reduced using a
heating mantle and a Kuderna-Danish evaporator with a 3-ball
Snyder column and the solvent exchanged to 1 ml of hexane
The extracts were next fractionated using a 09 x 45 cm
column which contained 115 g of BioSil A silicic acid (BioRad
Laboratories) that had been fully activated and then 75
deactivated with water The first fraction (fl) was eluted with
50 ml of pentane and a second fraction (12) was collected using
35 ml of 20 methylene chloride in pentane The fl fraction was
treated with activated copper powder to remove sulfur and then
both fractions were volume reduced as described above
Page 6
The fl fractions were analyzed for PCBs in three ways
These included (1) the traditional measure of PCBs as a
manufactured formulation (eg Aroclor 1254) (2) quantification
of 12 individual PCB congeners and (3) by level of chlorination
using GC-MS
For the Aroclor and congener analyses 1 ul of each sample
was injected in the splitless mode into a Hewlett Packard 5840
gas chromatograph equipped with an electron capture detector and
a 30 m DBS fused silica capillary column (J + W Scientific)
Helium was the carrier gas at a flow rate of 15 mlmin and the
flow of a 955 mixture of argonmethane to the detector was
maintained at 35 mlmin The oven temperature was held at
80degC for 4 min and then programmed from 80 to 290degC at
10degCmin The injection port temperature was 270degC and
the detector was held at 300degC PCB concentrations as
Aroclor 1254 were calculated by comparing the sums of the heights
of 7 peaks in the sample chromatograms to those in the standards
of Aroclor 1254 that were analyzed at the beginning and end of
each day The 12 congeners were quantified against authentic
standards using an external standard method
Spike and recovery studies were conducted to determine the
accuracy of the PCB determinations For these experiments a
relatively uncontaminated sediment was spiked with a series of
PCB congeners Recoveries averaged 71 for
24-dichlorobiphehyl 80 for 3344-tetrachlorobiphenyl 81
for 22P334455-octachlorobiphenyl 71 for
decachlorobiphenyl and 71 for OCN OCN was also spiked into
each sample analyzed as part of this study and its recovery was
Page 7
measured These recoveries averaged 866 +_ 298 for all of the
samples that were analyzed Precision (relative standard
deviation) of Aroclor 1254 measurements was determined by
analyzing triplicate sediment samples These determinations
showed a relative standard deviation of 06 A reagent blank
was analyzed along with each set of 6 samples The compounds of
interest were not found in significant amounts in any of the
blanks
PCBs were also quantified by the level of chlorination using
gas chromatography-mass spectrometry (GC-MS) These analyses and
PAH quantifications (f2 fraction) were done using a Finnigan 4531
GC-MS with a CDC 96 megabyte drive and a Nova 3 computer running
INCOS software The GC was operated in the splitless injection
mode and contained a 30 m DBS fused silica capillary column The
GC oven was held at an initial temperature of 50degC for 2
minutes programmed to 330degC at 10degCmin and held at that
temperature for an additional 9 minutes The instrument was
operated in the electron impact mode at 70 electron volts and 300
microamps The various source potentials were adjusted to
produce a spectrum of decaflurotriphenylphosphine (DFTPP) which
met the specifications detailed by Eichelberger et al(1975)
PCB measurements by chlorine number were made using GC-MS
software routines developed by (Silivon et al 1985) For these
quantifications an internal injection standard (D12-chrysene)
was added to each extract just prior to analysis Also to
determine response factors a standard solution containing the
internal injection standard and Aroclor 1254 was analyzed at the
beginning and end of each day PAH quantification were
Page 8
accomplished using two internal standards DlO-phenanthrene and
Dl2-benz(a )anthracene which were spiked into samples just before
extraction GCMS identifications were made using retention
times and extracted ion current profiles (EICPs) Spectra were
checked if unusual peak patterns were observed Quantifications
were made using the EICPs of the internal standards and the
compounds of interest
The analysis procedures used for the PCDDs and PCDFs were
similar to those described by Kuehl et al (1987) Briefly the
sediment samples were dried and Soxhlet extracted with benzene
The extract was volume reduced and solvent exchanged to
isooctane The sample was then passed through a column
containing sodium sulfate and separate layers of silica gel that
were treated with sulfuric acid and potassium hydroxide The
extracts were also purified up using alumina silver ion silica
gel and a silica gelcarbon column (Amoco PX-21)
Identifications and quantifications were conducted on a
Finnigan-MAT 8230 double focusing GC-MS Samples were
chromatographed on both 30 m DB5 and 60 m SP2330 (Supelco Inc)
columns Carbon-13 labelled internal standards for each isomer
group were used for quantifications
Inorganic Analysis
Sediments were homogenized by hand-stirring with a spatula
and then approximately 5 g of wet sediment were transferred to
acid cleaned polyethylene bottles Also separate subsamples
were taken for wet to dry weight determinations The samples
were acidified with 50 ml of 2N HNO sealed with a
Page 9
polyethylene screw cap and immersed in an ultrasonic water bath
at ambient temperature for six hours After standing overnight
the samples were filtered through acid washed (2N HNO) Whatman
41 filter paper into 60 ml acid cleaned polyethylene bottles
Flame atomization - atomic absorption spectrophotometry
(FA-AAS) was conducted on the samples with a Perkin-Elmer (Model
5000) AAS FA-AAS signals were recorded with a Perkin-Elmer
strip chart recorder (Model 56) and the absorbance data processed
by a Perkin-Elmer Model 3600 data station microcomputer
Calibration curves generated by polynomial regression of
absorbance data for standards were used to determine
concentrations
The instrument conditions for FA-AAS determinations were
similar to those described in Methods for Chemical Analysis of
Water and Wastes (US EPA 1979) and in the manufacturers
reference manuals The AA instrument was calibrated each time
samples were analyzed for a given element and calibrations were
generally checked after every fifth sample Samples were
analyzed at least twice to determine signal reproducibility A
blank sample was analyzed for each set of about 15 samples For
each element (except iron) two samples from each set were also
analyzed by the method of standard additions All blanks were
below instrumental detection limits Spike recoveries were 97 +
9 for chromium 103 + 1 for copper 104 + 5 for zinc 104 +
1 for cadmium 107 + 3 for lead 103 + 2 for nickel and
106 + 2 for manganese In addition in house standard
reference sediments were analyzed with each set of samples
Page 10
RESULTS AND DISCUSSION
Total Organic Carbon
The concentrations of TOC in the sediment increased from 29
to 120 mgg from Stations A to L then decreased to 32 mgg at
Station M (Table 1) The levels at Stations A B and M are
similar to those previously measured in the relatively
uncontaminated lower portion of Narragansett Bay Rhode Island
(Pruell and Quinn 1985) and from a reference site in Long Island
Sound (Munns et al In press) Levels of 982 110 and 121 mgg
were found in samples from Stations J K and L respectively
These concentrations are higher than have previously been
reported in Southern New England estuaries
PCBs
Changes were seen in both the levels and distributions of
PCB congeners throughout the harbor The total PCB
concentrations increased from 61 to 2100 ugg (a factor of about
340) between Stations A and L (Table 1) Concentrations measured
as Aroclor 1254 ranged from 38 to 540 ugg between Stations A
and L (a factor of 140) then decreased to 41 ugg at Station M
(Table 1) The ratio of Aroclor 1254 to total PCBs was variable
and ranged from 041-069 with a mean of 053 for Stations A-J
This ratio was lower at Stations K and L (036 and 026
respectively) The same trend can be seen in the relative
abundance of the PCB chlorination levels (Figure 2a) The
distributions of chlorination levels were very similar in samples
collected from Stations A-I therefore the data from these
locations were averaged for Figure 2a Compounds containing 4
and 5 chlorines were in highest concentrations in samples from
Page 11
these stations A change occurred in the PCB distribution at
Station J which became more pronounced at Stations K and L In
these samples compounds containing 3 and 4 chlorine atoms were
found in the highest relative proportions The relative amounts
of dichlorobiphenyls also increased greatly at these locations
This increase in the concentrations and proportions of lower
molecular weight PCBs at stations further north in estuary can
also be seen in the individual congener data (Table 2) The two
tetrachlorobiphenyls that were quantified (047 and 052) increased
in concentration from Station A to L by more than a factor of
500 The largest increase seen along the transect for any of the
more chlorinated compounds was less than a factor of 200
Comparisons of the sediment plots in Figure 2a with those of
the Aroclors (Figure 2b) indicate that the sediments contain
mixtures of Aroclors NBH sediments contain PCBs that appear to
be mixtures of Aroclors 1016 andor 1242 and Aroclor 1254
However it is not possible to differentiate between 1016 and
1242 in NBH sediments because these formulations are very similar
except in the portion of the chromatogram influenced by Aroclor
1254
The major inputs of PCBs to NBH are believed to have come
from a factory located just north of Station L The two stations
just south of this location (K and L) contain the highest
concentrations of PCBs and the largest relative amount of the
lower chlorinated congeners Samples from all of the stations
south of Station J show PCB distributions that are similar to
each other and do not contain the relatively high proportions of
lower chlorinated compounds
Page 12
Several reasons could account for the changes seen in the
mixtures of PCBs within the harbor Firstly PCB contaminated
sediment may be resuspended in the upper areas of the bay and
then transported downbay During this process the less
chlorinated congeners which have greater water solubilities may
be preferentially lost to the dissolved phase Therefore the
particles that settle in the lower portion of the bay may be
proportionally depleted in the lower chlorinated PCBs compared
with sediments from the northern portion of the harbor
Another explanation for the observed distributions may be
differential inputs in combination with changes in sediment
deposition rates along the gradient Company records indicate
that several different Aroclor mixtures were used by the
factories bordering NBH The records show that Aroclors 1254
1242 and 1016 were the predominant PCB formulations used and that
Aroclor 1254 was used prior to the use of Aroclors 1242 and 1016
(Charles Bering personal communication) Therefore the
relative distributions of these PCB formulations with depth in
the sediments could be different Surface sediment would be
expected to be enriched in Aroclor 10161242 while deeper
sediment may contain more Aroclor 1254 Brownawell and
Farrington (1985) observed this trend in a sediment core taken
just north of Popes Island
Sumraerhayes et al (1977) reported that the silt deposits
in the harbor are deepest above the New Bedford - Fairhaven
Bridge and that the sedimentation rate is higher in the northern
areas of the harbor Therefore samples which were collected at
constant depth horizons may represent different depositional
Page 13
intervals Since the samples collected for the present study
included the top 5 cm of sediment at all stations in areas of
rapid net sedimentation (eg 1 cmyr) this sample could
represent material deposited over the last 5 years Whereas in
an area with a net sedimentation rate of 02 cmyr 5 cm of
sediment may include material deposited over the past 25 years
Because of this the surface sediments of the upbay sites could
contain mostly Aroclor 10161242 whereas areas with low net
sedimentation rates may show greater relative amounts of Aroclor
1254 near the sediment surface
A third possibility is that changes in PCB congener patterns
within the harbor could result from differences in bioturbation
rates or depths at various locations within the estuary The
sediments of heavily contaminated areas often have very shallow
bioturbation zones because of impacts on the biota due to
toxicity or low oxygen levels Therefore the historical record
of inputs may be well preserved in the sediments of such areas
Less contaminated sediments with more active biological
communities often show a poorly defined historical record of
inputs Pruell and Quinn (1985) reported a well preserved record
of inputs in sediments from the contaminated upper portion of
Narragansett Bay and a smeared record of inputs further downbay
in less contaminated areas A similar occurrence in NBH could
produce a distinct layer containing mostly Aroclor 10161242 in
the surface of the cores from the northern areas of the estuary
Bioturbation of sediments in the lower harbor would tend to mix
Aroclor 1254 from deeper in the sediment with the more recent
releases of Aroclor 10161242 Because of this process the
Page 14
surface sediments in the lower harbor may contain proportionally
greater amounts of Aroclor 1254 when compared with those from
upper harbor locations
It has recently been reported that anaerobic dechlorination
of PCBs is occurring in heavily PCB contaminated sediments from
some locations including NBH (Brown et al 1987) The congener
profiles seen in the surface samples from the present study are
not consistent with dechlorination as an explanation for the
lower molecular weight congener distributions in the northern
portion of the estuaty However in more recent work on sediment
core sections from heavily contaminated areas of NBH we have seen
congener profiles that are consistent with anaerobic
dechlorination (J Lake Personal communication)
PCB concentrations up to 2100 ugg were measured in the
sediments of NBH in the present study and much higher
concentrations have been reported in sediments from different
sites in the harbor by other investigators (Weaver 1984) These
concentrations are higher than has been found in other New
England estuarine sediments which generally contain less than 10
ugg of PCBs (Boehm et al 1984 Pruell et al 1986 Gardner
and Pruell 1987 Munns et al In press) The highest PCB
concentration in sediments measured as part of the NOAA Status
and Trends Program (NOAA 1987) was 171 ugg for Boston Harbor
In fact the PCB levels that have been found in the sediments of
NBH are higher than have been reported for any other estuary
including the Hudson River (Bopp et al 1982)
Page 15
PCDDs and PCDFs
Much recent attention has been focused on PCDDs and PCDFs as
environmental contaminants because of their extreme toxicity
bioaccumulation potential and widespread distribution However
very few studies have investigated the occurrence of these
compounds in the marine environment In the present study
several PCDDs and PCDFs were measured in sediments collected from
four sites (Stations B J L and M) along the transect in NBH
PCDD concentrations were generally lowest at Stations B and
M Compounds containing 4 5 or 6 chlorines were near or below
the analytical detection limits in these samples however
measurable concentrations of
1234678-heptachlorodibenzo-p-dioxin and
octachlorodibenzo-p-dioxin (OCDD) were found Slightly higher
PCDD concentrations were found in samples from Stations J and L
The highly toxic congener 2378-tetrachlorodibenzo-p-dioxin
(2378-TCDD) was only detected (detection limit of about 1
pgg) at Station L (44 pgg) Tiernan (1986) measured the
concentrations of PCDDs in three sediment samples from NBH That
study did not detect 2378-TCDD but found some of the more
chlorinated PCDD congeners in concentrations similar to those
measured in the present study
Norwood et al (In press) compared the concentrations of
2378-TCDD and 12378-pentachlorodibenzo-p-dioxin in the
sediments of several New England estuaries Samples from Black
Rock Harbor Connecticut and Narragansett Bay contained higher
levels than those measured in NBH Concentrations of
2378-TCDD found in sediments from three locations in the
Page 16
Hudson River (OKeefe et al 1984) ranged from lt56 to 10 pgg
with the highest levels being found in the lower portion of the
river Much higher levels of 2378-TCDD have been found in
sediments from the Passaic River New Jersey (Belton et al
1985) near a chemical plant that manufactured
245-trichlorophenoxyacetic acid The sediments of the Passaic
River contained 2378-TCDD concentrations as high as 6900 pgg
Several PCDF congeners were also measured in the sediments
from Stations B J L and M (Table 4) The concentrations of
these compounds generally increased with distance north from
Stations B to L then decreased at Station M In addition to the
concentration changes there were also major differences in the
congener and isomer ratios in the samples In particular the
levels of several of the PCDFs containing 4-6 chlorines were
considerably elevated relative to compounds containing 7 and 8
chlorines in the samples from Stations B J and L when compared
with those from Station M However unlike the PCBs which showed
relatively enriched levels of the lower chlorinated congeners at
Station K and L relative to the lower harbor sites there was
little difference in the PCDF ratios in the samples from Stations
B J and L
Norwood et al (In press) used principal components
analysis to compare the NBH PCDD and PCDF data from the present
study with data from several other coastal New England locations
In this analysis the NBH Station M results (Table 4) grouped
with results from a relatively uncontaminated site in Central
Long Island Sound This may represent background levels
resulting from long distance atmospheric transport and deposition
Page 17
(Czuczwa and Kites 1984) The PCDF concentrations measured at
Stations B J and L in NBH were all well above those found at the
other New England coastal locations and grouped separately
(Norwood et al In press) The congeners containing 4 or 5
chlorines which are the most toxic compounds (Safe 1987) were
elevated to a greater extent than were the more chlorinated
compounds
Tiernan (1986) measured 2378-tetrachlorodibenzofuran
(2378-TCDF) concentrations ranging from 406-730 pgg in
sediments from three stations in NBH These are somewhat lower
than the levels found in the present study (740-1410 pgg)
however it is difficult to directly compare the results because
exact station locations are not provided Much lower
2378-TCDF concentrations (5-46 pgg) were reported in
sediments from the Hudson River (OKeefe et al 1984)
PAHs
Numerous PAHs were also quantified in the NBH sediment
samples The concentrations of some of the more abundant
compounds and total PAH levels are presented in Table 5 The
relative distributions of PAH compounds were similar at all of
the stations The most abundant compounds included phenanthrene
fluoranthene pyrene benz[a]anthracene chrysene and
benzolajpyrene This pattern dominated by parent compounds with
lower levels of the alkylated homologs mimics those found
worldwide in marine sediments (Laflamme and Kites 1978 Lake et
al 1979) The major sources of these compounds are combustion
processes
Page 18
The concentrations of PAHs in the sediments of NBH
particularly the northern portion of the estuary (Stations J K
and L) are very high relative to those found in sediments remote
to urban areas (Laflamme and Kites 1978 Larsen et al 1986)
However concentrations measured in NBH are similar to those
measured in other northeastern urban estuaries including Black
Rock Harbor (Rogerson et al 1985) Narragansett Bay (Lake et
al 1979 Pruell and Quinn 1985) and Quincy Bay Massachusetts
(Gardner and Pruell 1987)
Metals
Three different trends were observed for metal
concentrations in the sediments of the harbor (Table 6)
Cadmium copper chromium and nickel concentrations increased
from Station A to J then decreased at Stations K L and M For
lead and zinc the concentrations maximized at Station L The
iron and manganese levels remained relatively uniform throughout
the harbor
The Massachusetts Division of Water Pollution Control
(MDWPC) measured copper chromium and nickel concentrations of
7250 3200 and 550 ugg respectively at a station about 18 km
south of our Station J (MDWPC 1971 1975) The levels that we
found at Station J (2540 1700 and 214 respectively) were
somewhat lower Both studies found that the cadmium
concentrations were highest near Station J with MDWPC (1975)
reporting a cadmium concentration of 76 ugg which is almost
identical to our value of 784 ugg The lead and zinc levels
measured in the present study at Station J were 617 and 2150
respectively which also compare well with 560 ugg for lead and
Page 19
2300 ugg for zinc reported by MDWPC (1975) Summerhayes et al
(1977) and Stoffers et al (1977) reported metals concentrations
in the clay fractions of a sediment core collected near Station J
and reported results very similar to those of the present studyl
however detailed comparisons may not be appropriate because of
the different sample types
The concentrations of cadmium copper chromium nickel
lead and zinc in the sediments of the northern portion of NBH are
generally much higher than those reported in other estuarine
areas Lead concentrations were higher than those measured in
Long Island Sound sediments (Greig et al 1977) by at least a
factor of 4 and cadmium was enriched by about a factor of 19
All of the copper concentrations measured throughout NBH were
higher than the Long Island Sound levels (Greig et al 1977)
NBH metals concentrations exceeded those in Narragansett Bay
(Oviatt et al 1984) and Quincy Bay (Gardner and Pruell 1987)
by factors of 50-60 for cadmium 10-20 for copper and 5-6 for
lead Similarly concentrations of cadmium copper chromium and
lead reported by the National Status and Trends Program (NOAA
1984) for sediments taken from along the United States coastline
were all less than those measured in the northern portion of NBH
in the present study except for chromium in Salem Harbor MA
The NBH trace metal levels however are similar to those of
Black Rock Harbor (Rogerson et al 1985) Very similar
concentrations of copper chromium and nickel were seen in these
two sediments Concentrations of cadmium lead and zinc were 2-3
times higher in sediments from NBH relative to those from Black
Rock Harbor
Page 20
No concentration trends were observed along the transect for
manganese or iron in the present study MDWPC (1975) reported
similar results for manganese but found some changes in the iron
concentrations in different areas of the estuary
Sources
In general the concentrations of all contaminants and TOC
increase with distance north in the NBH estuary (Figure 3) The
trends however were not the same for all of the classes of
compounds or even for some of the compounds within chemical
classes This indicates that there are differences in the
sources of the contaminants andor their geochemical behaviors
differ
Our data suggest that the major source of PCBs to NBH was
located in the northern portion of the estuary near our Station
L Total PCS concentrations were highest at this site and
decreased rapidly with distance downbay (Figure 3a) Station L
is located very close to a factory which manufactured electrical
equipment and is suspected of being responsible for much of the
PCB contamination within the estuary
Some of the PCDDs and PCDFs measured in the sediments of the
harbor are the result of long distance atmospheric transport of
these compounds (Czuczwa and Kites 1984) The magnitude of this
source is probably reflected by the concentrations measured at
Station M Since the concentrations of these compounds in the
remainder of the harbor are much higher additional sources are
likely The trends for Total PCDDs and PCDFs were somewhat
different (Figure 3a) Since the geochemistries of these
compounds are probably similar the major sources of the PCDDs
Page 21
and PCDFs may be different
There has been considerable debate in the literature over
the sources of PCDD and PCDF compounds in the environment
(Hutzinger et al 1985) Potential sources for these compounds
include various chemical manufacturing processes and incomplete
combustion Many studies have shown that PCDDs and PCDFs are
produced in municipal incinerators (Buser et al 1978 Czuczwa
and Kites 1984) Also recent work (Marklund et al 1987)
indicates that automobiles burning leaded gasoline may be major
sources of these compounds
Since PCDFs are contaminants in commercial PCB mixtures
(Albro and Parker 1979 Cull and Dobbs 1984 Wakimoto et al
1988) large amounts of PCDFs may have been released to NBH along
with the PCBs However the concentrations of PCDFs in the
sediments of NBH are considerably higher than would be expected
based on PCB concentrations This is especially true for
tetrachlorodibenzofurans and pentachlorodibenzofurans in the
southern portion of the estuary For example the level of
2378-TCDF at Station B is 880 times higher (Figure 4a) than
expected based on the amount of PCBs present and 2378-TCDF
concentrations of PCB mixtures (Wakimoto et al 1988)
The PCB concentration in sediment from Station L is more
than a factor of 300 higher than that at Station B (Table 1) yet
the concentrations of 2378-TCDF measured at these two
locations differ by less than a factor of 2 (Table 4) This
change in the ratios of PCBs and PCDFs could be caused by
differences in the behavior of the compounds or as the result of
additional sources of PCDFs in the lower portion of the harbor
Page 22
PCBs and PCDFs are both relatively stable compounds with very
similar solubilities and partition coefficients (Burkhard and
Kuehl 1986) therefore it is unlikely that the observed
distributions are due to the differential movement of these
compounds in the estuary Instead there may be an additional
source of PCDFs to the lower harbor area
Large amounts of PCBs are known to have been released into
the sewage system of New Bedford and high PCB levels were
reported in sludge from the New Bedford Municipal Wastewater
Treatment Plant (Weaver 1982) This facility burned its sludge
in an onsite incinerator Since PCDFs have been shown to be
formed during the combustion of PCBs (Addis 1986 des Hosiers
1987) one possible source of PCDFs may be the incineration of
PCB contaminated sewage sludge at the sewage treatment plant
which is located about 10 km south of Station B PCDFs may have
been released to the atmosphere from this operation and
significant amounts may have contaminated the lower harbor due to
atmospheric fallout Other undocumented sources of these
compounds may have also contributed
The biological availability of sediment bound contaminants
to aquatic organisms is presently not completely understood
However for nonpolar organic chemicals the organic carbon
content of the sediment is a major factor controlling the
available concentrations (Lake et al 1987) Because of this
contaminant concentrations are often normalized to TOC levels
When the concentrations of 2378-TCDF in NBH are normalized to
TOC (Figure 4b) the results indicate that the biologically
available amounts of these compounds may be highest in the
Page 23
souothern areas of the estuary This is because the levels of
TOC increase to a greater degree than do PCDFs with distance
north in the estuary
The Total PAH and Total PCDD concentrations are highest at
Station J (Figures 3a and 3b) which is close to where several
combined sewer overflows (CSOs) empty into the harbor The CSOs
are probably the major sources of these compounds Cadmium
copper chromium and lead levels are also highest at Station J
and the CSOs may contribute to this contamination (Figure 3b and
Table 6) However the major source of trace metals is believed
to be an industrial discharge located about 2 km south of this
area (Stoffers et al 1977) The spatial distributions of lead
and zinc are different from those of the other metals (Figure 3b
and Table 6) These metals increase in concentration with
distance north all the way to Station L and show strong
correlations with TOC levels Therefore these metals may behave
differently from the others once released to the harbor or there
may have been major releases of lead and zinc near Station L
In summary NBH has received large inputs of chemical
contaminants from many sources and because of these inputs its
sediments are contaminated with a complex mixture of toxic
compounds The concentrations of contaminants in NBH equal or
exceed those of other industrialized harbors in the United
States Spatial distributions suggest multiple sources for the
contamination Because the distributions of contaminants are
complex remediation of excessive concentrations of PCBs in the
Superfund site should also consider the environmental
implications of contaminants that do not covary distributionally
Page 24
with PCBs and the joint effects of all contaminants associated
with sediments from the harbor in addition in order to prevent
the further deterioration of near coastal areas more work is
needed to better define the sources of these contaminants so that
the major sources can be identified and controlled
ACKNOWLEDGEMENTS
We would like to thank Adria Elskus Larry Holland Eileen
McFadden Richard McKinney Sandra Neuman Frank Osterman and
Raymond Palmquist for the laboratory work that they provided for
this project We also thank Walter Berry David Hansen and John
Scott for their major roles in the administration of the study
and for collecting the sediments Although the research
described in this article has been supported by the United States
Environmental Protection Agency it has not been subjected to
Agency review and therefore does not necessarily reflect the
views of the Agency and no official endorsement should be
inferred Mention of trade names or commercial products does not
constitute endorsement or recommendation for use
Page 25
REFERENCES
Addis G(1986)Pyrolysis and combustion of Aroclor 1254 contaminated dielectric fluids Chemosphere 15 1265-1271
Albro PW and CE Parker(1979) Comparison of the compositions of Aroclor 1242 and Aroclor 1016 Journal of Chromatography 169 161-166
Ballschmiter K and M Zell(1980) Analysis of polychlorinated biphenyls (PCBs) by glass capillary gas chromatography Fresenius 2 Anal Chem 302 20-31
Ballschmiter K H Buchert R Niemczyk A Munder and M Swerev(1986) Automobile exhausts versus municipal-waste incineration as sources of the polychloro-dibenzodioxins (PCDD) and -furans (PCDF) found in the environment Chemosphere 15 901-915
Boehm PO W Steinhauer and J Brown(1984) Organic pollutant biogeochemistry studies in the Northeast US Marine Environment Final Report to the National Oceanic and Atmospheric Administration
Bopp RF HJ Simpson CR Olsen RM Trier and N Kostyk(1982) Chlorinated hydrocarbons and radionuclide chronologies in sediments of the Hudson River and Estuary New York Environmental Science and Technology 16 666-676
Brown JF Jr DL Bedard MJ Brennan JC Carnahan H Feng and RE Wagner(1987a) Polychlorinated biphenyl dechlorination in aquatic sediments Science 236 709-712
Brownawell BJ and JW Farrington(1985) Partitioning of PCBs in marine sediments In Marine and Estuarine Geochemistry AC Sigleo and A Hattori (Eds) Lewis Publishers Inc Chelsea Michigan
Brownawell BJ and JW Farrington(1986) Biogeochemistry of PCBs in interstitial waters of a coastal marine sediment Geochimica et Cosmochimica Acta 50 157-169
Burkhard LP and DW Kuehl(1986) N-octanolwater partition coefficients by reverse phase liquid chromatographymass spectrometry for eight tetrachlorinated planar molecules Chemosphere 15 163-167
Buser HR H-P Bosshardt and C Rappe(1978) Identification of polychlorinated dibenzo-p-dioxin isomers in fly ash Chemosphere 7 165-172
Cull MR and AJ Dobbs(1984) Analysis of polychlorobiphenyls from used transformers from polychlorodibenzofurans Chemosphere 13 1085- 1089
Page 26
Czuczwa JM and RA Kites(1984) Environmental fate of combustion- generated polychlorinated dioxins and furans Environmental Science and Technology 18 444-450
des Hosiers PE(1987) Chlorinated combustion products from fires involving PCB transformers and capacitors Chemosphere 16 1881-1888
Eichelberger JW LE Harris and WL Budde(1975 ) Chromatography- mass spectrometry systems Analytical Chemistry 47 995-1000
Gardner GR and RJ Pruell(1987) A histopathological and chemical assessment of winter flounder lobster and soft-shelled clam indigenous to Quincy Bay Boston Harbor and an in situ evaluation of oysters including sediment (surface and cores) chemistry Final report to the US Environmental Protection Agency Region I Boston MA
Greig RA RN Reid and DR Wenzloff(1977) Trace metal concentrations in sediments from Long Island Sound Marine Pollution Bulletin 8 183-188
Hutzinger 0 MJ Blumich Mvd Berg and K Olie(1985) Sources and fate of PCDDs and PCDFs An overview Chemosphere 14 581-600
Kuehl DW PM Cook AR Batterman D Lothenbach and BC Butterworth(1987) Bioavailability of polychlorinated dibenzo-p-dioxins and dibenzofurans from contaminated Wisconsin River sediment to carp Chemosphere 16 667-679
Laflamme RE and RA Kites(1978) The global distribution of polycyclic aromatic hydrocarbons in recent sediments Geochimica et Cosmichimica Acta 42 289-303
Lake JL C Norwood C Dimock and R Bowen(1979) Origins of polycyclic aromatic hydrocarbons in estuarine sediments Geochimica et Cosmochimica Acta 43 1847-1854
Lake JL N Rubinstein and S Pavignano(1987) Predicting bioaccumulation Development of a simple partitioning model for use as a screening tool for regulating ocean disposal of wastes In Fate and Effects of Sediment-Bound Chemicals in Aquatic Systems KL Dickson AW Maki and WA Brungs (Eds) Proceedings of the Sixth Pellston Workshop August 12-17 1984 Pergamon Press pp 151-166
Larsen PF DF Gadbois and AC Johnson(1986) Polycyclic aromatic hydrocarbons in Gulf of Maine sediments Distributions and mode of transport Marine Environmental Research 18 231-244
Marklund S C Rappe M Tysklind and K-E Egeback(1987) Identification of polychlorinated dibenzofurans and dioxins
Page 27
in exhaust from cars run on leaded gasoline Chemosphere 16 29-36
Munns WR Jr JF Paul VJ Bierman Jr WR Davis WB Galloway GL Hoffman RR Payne PF Rogerson and RJ Pruell(In press) Exposure assessment component of the Field Verification Program Data presentation and synthesis US Environmental Protection Agency Report
NOAA(1987) National Status and Trends Program - Progress report NOAA National Ocean Service Office of Oceanography and Marine Assessment
Norwood CB M Hackett RJ Pruell BC Butterworth KJ Williamson and SM Naumann(In press) Polychlorinated dibenzo-p-dioxins and dibenzofurans in selected estuarine sediments Chemosphere
OKeefe P D Hilker C Meyer K Aldous L Shane R Donnelly R Sloan L Skinner and E Horn(1984) Tetrachlorodibenzo-p-dioxins and tertachlorodibenzofurans in Atlantic coast striped bass and in selected Hudson River fish waterfowl and sediments Chemosphere 13 849-860
Oviatt CA MEQ Pilson SW Nixon JB Frithsen DT Rudnick J F Grassle and JP Grassle(1984) Recovery of a polluted estuarine system a mesocosm experiment Marine Ecology - Progress Series 16 203-217
Pruell RJ and JG Quinn(1985) Geochemistry of organic contaminants in Narragansett Bay sediments Estuarine Coastal and Shelf Science 21 295-312
Pruell RJ JL Lake WR Davis and JG Quinn(1986) Uptake and depuration of organic contaminants by blue mussels (Mytilus edulis) exposed to environmentally contaminated sediment Marine Biology 91 497-507
Rogerson PF SC Schimmel and G Hoffman(1985) Chemical and biological characterization of Black Rock Harbor dredged material Technical Report D-85-9 prepared by US Environmental Protection Agency Narragansett RI for the US Army Engineer Waterways Experiment Station Vicksburg Miss
Rubinstein NI E Lores and NR Gregory(1983) Accumulation of PCBs mercury and cadmium by Neries virens Mercenaria mercenaria and Palaemonetes pugip from contaminated harbor sedimentsAquatic Toxicology 3 249-260
Safe S(1987) Determination of 2378-TCDD toxic equivalent factors (TEFs) Support for the use of the in vitro AHH induction assay Chemosphere 16 791-802
Page 28
Schults DW SP Ferraro GR Ditsworth and KA Sercu(1987) Selected chemical contaminants in surface sediments of Commencement Bay and the Tacoma Waterways Washington USA Marine Environmental Research 22 271-295
Slivon LE JE Gebhart TL Hayes AL Alford-Stevens and WB Budde(1985) Automated procedures for mass spectrometric determination of polychlorinated biphenyls as isomer groups Analytical Chemistry 57 2464-2469
Stoffers P C Summerhayes U Forstner and S R Patchineelam(1977) Copper and other heavy metal contamination in sediments from New Bedford Harbor Massachusetts A preliminary note Environmental Science and Technology 11 819-821
Summerhayes CP JP Ellis P Stoffers SR Briggs and MG Fitzgerald(1977) Fine-grained sediment and industrial waste distrubution and dispersal in New Bedford Harbor and Western Buzzards Bay Massachusetts Woods Hole Oceanographic Institution Technical Report WHOI-76-115 110 pp
Tiernan T0(1986) Results of analyses of New Bedford Harbor sediment extracts received from US Coast Guard R and D Center and of New Bedford Harbor sediments received from NUS Corporation for polychlorinated dibenzo-p-dioxins (PCDD) polychlorinated dibenzofurans (PCDF) and polychlorinated biphenyls (PCB) Report to US EPA-Region I Office of Regional Counsel
US EPA(1979) Methods for Chemical Analysis of Water and Wastes US Environmental Monitoring and Support Laboratory Office of Research and Development EPA600-4-79-020
Weaver G(1982) PCB Pollution in the New Bedford Massachusetts Area - A Status Report Massachusetts Coastal Zone Management Boston MA
Weaver G(1984) PCB contamination in and around New Bedford Mass Environmental Science and Technology 18 22A-27A
Wakimoto T N Kannan M Ono R Tatsukawa and Y Masuda(1988) Isomer-specific determination of polychlorinated dibenzofurans in Japanes^ and American polychlorinated biphenyls Chemosphere 17 743-750
i-H
lto j
0 2
c
c (0
4J
0
rr
0) in
u) ltN
C
mdash
i rt
1mdash1 IU
U JJ
O
r-t (0
0
O
amp
^ u
C
lt o
ugt m
(0
TJ
U)
0) c - u
f O
U
-H
Q)
bullP bullilaquo ^_ imdash
(
1-1 O
4J
U
C
0) M
u
- p c
c bull
O
ltU u
U
B
0
bullH j^
00 T3 u
U
lfi
|M
(U
CO
olt w
as bulla c TJ C
-H
U
(0
O
U) ltM
U
(O
O
QU
O)
H
0 CO
bull laquo-l
agt i-H
X
I (0
bullPO
fl
in
_
U)
DQ
f-l
(0 mdash
bullP
- P
0
S
f-l
gti
T3
^3 in
ogt ltN
i-H ^
^J
r
u
o
u
rtj
mdash
4J
^
^1
U
EH ^
CT e
s^ c 0
bull^
Jj (0en
lt
mdash iclt
jvo
^raquo
HO
Tr~
r~-o
vo
vo
o
oo
oo
oo
oo
oo
o
CT
^V
Olaquo
HO
Olaquo
mdash (
^P
OfN
PO
fOC
OiH
C
ltN
O
bull
bull
bull
bull flaquo
| amp
amp
raquo
laquo
LO
H
3
bull
fs
j PO ^
LO f LO
tgt ^
O
gt iH
ltN
^H raquo H
t
T3
a N
ro C
(0
4J
O
2
1
C
sediments
OO
OO
iHP
Ofs
Ji-
Ht-IO
Oin
oO
O
OO
OO
OO
OO
OO
t-H
PO
O
03 ooooooooooooo
u0
03 I
u ^
oo
oo
laquoN
inp
oro
po
t--laquo-i(pound
gtin
03
Z
VD
vrgt o
oo
oo
oo
oo
i-H
^o
om
U
I
gt o
00 O vo vo
ltN
OO
OO
OO
OO
OO
OO
O
U
I laquo
shy
U U
M in
in in
bull-ia
gtr~
oo
i-ivo
pO
PO
iH
in
XX
I --
laquo
JE asraquo
m
m in
O
OO
OO
OO
OO
CN
VD
iH
O
t i in
bull shy
ooooooooooooo
in
in
i ^ ^
oo in ltN
in
O
ro
r ro
00
o
bullbull raquo
raquo -^
I bull
^^ PO
PO PO
PO
PO PO
in
o
o
---
raquo u
oo
bull
laquobull
bull 0) C
u
o
o in
P
O
tH
bullgt -raquo
v
0gtT3
00
Oo
ltN
co O
o
bull CT
0)
1 1
1 1
1 1
u
3m
o
CO O
00
PO
U J3
CO
P
OV
OiH
T
JO
OO
OO
^1 vo ltTgt
Cu u
LI
t-H O
OO
Oi-
HtN
raquo-H
i-(i-
raquoO
TH
rgt
J
bull C
P^
fM
OO
W O
O
fl 0raquo
O
laquo i-H laquo-H
tH i-H
ltN ltN
^H as
C
(00gt
in VO
VO rrgt
3T
3
Ogt
ro
0) bull13
gt-i C
in
ltN
r I-H
4J
bullH
O
o
bullH
gt X-i
u
o
a bullH
TJ 03
bullO
OJ CO
O 00 0
0
u oa
u
C
00 u
00
w
ux
bulli-i a
m co o
rH
i-H
03
X
03 SB
raquo
r-i
us u
i
M-l
0)
o
(Q
dgt I
0) shyO
Z
fQ
03
OQ O
j if^ Pa
i n
i-H
mdash U
U
I
u a 6
E --m
in
c o m
in I
i in in
o u
-H
O
c
gt --
shybullH
14-1
oo
oo
oo
oo
or^jin
iH
bull o in
bull in in
jj
o
laquo T
) 4J in
PO
u d)
PO
i IB
raquo 4J
4J
o ~
C O
^
VO C
T i-H
bullH
ltN
i PO
(U
0)
U H
o
bullH ltN
C
M
C rH
O
O
C
u
o
PO
0)
O
bull bull i-H
bulla
i i
i i
i i
bull in PO
bull ltN
OQ
ltN r -
^H
i-H O
O PO
Qgt
Um
^o
in I-H
m
i-H
ltN
C
rmdash o
Hi O
O i-l
t-l X
I m
o
bull bull o
PO
laquo
O - H
ltN I-H
r^ bull
i EH
Oo
oo
(0 O
oo
o
4-gt
Imdash
O
oo
TJ 0)4-1
U
O
O
OJ Q
rH
U
O
O
oo
a
OJ
(0 in
O
O
oo
ugt as
O
O
00 o
T
r -in
rH
UH
TJ I
O
u
O
V) lt4H OJ TJ
VO
3
W
OJ o
O
o
CO
O
gtiCO
crlt
o
oo
JD
rH
bullH
laquoTi P
O
(0 10
$
OJ C
OJ
B
(0 2
O
0) c
u
(0
TJ m
TJ
bull u
i n o
TJ
OJ OJ
OJ bullH c
r~ in
C
Ogt
rH
i-H -iH
u
c a
a
x
Qu
OJ m
g a
o
u (0
TJ - H
T
J
a ()
(0
U
I 0)
4J TJ
OJ
o a
C
o bullrlt
C
rH
MH I
0) W
g (a
a
o ltN
VO
PO
U)
N
c rH
Q
rH
U
c c o
rO Q
Q
O
J U
O
OJ u
ffi Q
U
C C
-
Q
QU
OO
OJ
O
o
Q Q
O
i I
-iH D
I J
10 TJ o
W
Q
UU
KC
OJ
-J
C-U
1-1
u
C
Q
X
X
I -
O O
4-raquo TJ
DU
O
U
KE
Bc
or
-flJU
MH
C
0)
TJ
in T
J bull
HQ
OJ
II
raquo
4J
O
O
J 4-gt
in
c
c 4-J Q
ou oo^ r^ ^o o j o j
U
(0 laquo
UI
laquolaquo
raquoraquo
TJ
J5
0J
c c
O
EH
Oo
r^o
ov
otn
-u
c
O - H
bull
H i
laquo --
laquo
~ ~
o
O
U
W
MH
oo
r^^
r-^r^
TT
J C
O
4J
bullH
raquo
gt^
raquo^
raquof
l)
OC
flj lt
H
C
4J
P-P
OP
OP
OP
OP
O4
J
-iH
CTgtC
OJ c
raquo
^laquo
raquo^
raquoo
ampgt
10 O
S
Q
) PO
O^ ^
^ ^
^ ^
^ ^
^
O
CN T3
bullrj -
rjraquo
raquo
raquoraquo
raquo4
J
Hg
j 00
Qgt rH
TJ
C
Mlt
NrH
rH
rH
rH
rH
OJ
TJ
-l-
)
gt
O
OJ C
O
bull4 a ( A
Q
I I
I I
I I
OJ OJ
QUc
o3
ltr~o
po
in o
OJ
in vo r -r
-r-2
TJ Q
C
OJ
o rH
bull iH
JO
4J
T
J 10
lt0
c
EH cn
lyses of selected ford Harbor sediments
rH
oo
Oo
re o
0O
rH
rH
o
O
o
OJ
in
O0
oO
P
O
PO
o
rshyrH
ltN
VO
C
M
rH
rH
oO
vo
PO
rH
c
rH
laquoN
cnOraquo
rH
OO
Oo
P
O
00 O
laquoN
rH
(N
CM
rH
C
b
Eb Q
rH
Q Q
U
r H
b b U
U O
1
Q
Q
Q
1
r H
4J O
O
T
3
uo
u a z
o o J=
P
O
C
mdash X
X
X
1 1
raquo
- U
rH
fH
vo a c ac Eo
o 0 1r ~ 3
fl T 3
bullH
00
1 1
1
raquo -O
C
O
0)
CTgt 0 0 oo o o r ~
o o v o J D
laquo
rf
fV3
Tl
^H
C
N
^
ID
(N
o
C
r-r- r ~
v or -i n
rtw t
bull 11
f^
Jj
Q)
Ul
bullT
T vo v o
O
raquogt
bullM
ill
laquo raquo7z T
^
u
+
-^
bull
PO T T P O
P O P O
U H
mdash
laquo
bullrH
C
OO
f1
^
rH - H
rH
P
O
rH
O
rH
4JfM
raquoH
rrkU
1fH
iI
Ol
^1
3m
rH(a
T
3
C
uc a
re
bull bull
Ol I
i i
i i
i re
e
U U
U
in
rH
oo
ltN
4J
u re
0 3
Qgt rH
P
O
vo m
V
O
bullH O
O rH
O r H
i n
W
bull
C
fH
ltN
^3-S
- H
(N
P O P O
P O P O
W
W
rtiV
W
N
Ogt
0
bullH
C
r H
^3gt
O
0 ) 0
rH
r~
O
00
C
rH
bullH e
C
C
C
OO
O
T3
u
s re
a
bullH n u
rH
PO
in
rH
bullH u r e 4J - H
re
01
Vgt re T J
b
bull -f on
c c u
Q
CM
r-
0o
T3
raquo mdash
b
O O
) O
4-
O
U
rH
PO
in
VO
C
Q
- H
O
iI S
C
0 ) Cn
rH
rH
rH
U]
b b
b
U
- U C
- U
0)
4J
C
Q D
Q
X
C J
O
u re
O
U
U
U
S 3
0) C
J i w
c c
0
o
O
bullo bullH
bb
b
O) 0
) O
l 1
J J
O
O - H
^
in
rH
O
c
JJ Q
a a
a a lt D M r--01 0 1
O
t-i O
l P
O
T
in
re uU
U
1
1 1
TJ
poundi
0 ) o
_i
i
Ml _1
ltU r H
bullr-1
|
Hr
bull ^
rtJ
O
r^bull
c^ C
2 V
O
PO
OO
00
ltD r -
1
00
c^
O1
gt 0
ltu m c
o^
fNc
oc
otN
lt U
CO
lt
MOi
o
o
o
O
M f N
ltN
CO
rHlt
Nlt
NrH
lt
UO
4J
bull P
O
TT
fH
00
tH
bullo c u
TJ-00
r~
^
rH
b
1I
i I
i i
i a gt
a gt rH
rH
Q
4-gt
CU J-gt
ogt
O r H
CO
^ O
^3 C
^3 S
O ^
U
bull
Oc
0 0 O
OO
OO
lrH
rH
rH
ZT
JD
r)
bull o
OO
VO
rH
r H
i H
re
rH
CCTi
Oo
1
1 1
EH
00
O
ltN
rH
01
bullK
gtP 4
fH
bulla
+ -U
c
re 00
-3
tj pound
u
tn
4-gt
O
bull O
ttJ
u
U) C
O
ac ltu
-Q
EH C
u
z o bull
laquo
lt u
w
32 r-
o
a ro
M
Ult
bullO
laquoJ
Z
CU
u
gt--
OO
OO
OO
OO
Or
Hr
Hr
HO
td
shy
O
33 ttraquo lt N
u-i OH
C O
Tgt
Pu
0gt PO
0) CO
bullrl
t-
LTgt
m
U
c
bull bull
0)
I u
c
C
0 ) 01
0)
0)
C u
a
Z
03 U
C
0)
CO
gti0
gt U
w
-rshy6
in
-i o
Q
irH
r O
ltU W
fSJ O
mdash
D
(N
mdash
gt
lU T
J 0)
u
4-gt
Z
T3 u
J- 3
C
OJ U
01 4J
rH
(U V
O
C
I Q
uC
o s r~~ bullO
dgt PO
^^
fl
C
- U CsJ
0) tt)^
U
--H
-^
bullH
C
4-1
fQ
CO
gt1ltN
laquo
J=
CJ
a
^j= ^
O u S
0)
gt1 03
QJ
itrade^ laquomdash
I laquo
fO
w
o
rH
u
C
(0 ^^
O^
1-4
rH 3
rH
i-H
T3
ft)_
O
^-N
O
gtH
(N
0
U
) O
C
O
C
o
to 4-) c V
gtiN
lt U
N
0) U
) N
^
ftj
aa
H C
73
C J3
J=
1 gt
C
O1
U
jr ID c agt -H
3
U
03 M
CO
Q
H J3
fl
^
bullH
C
O
I I
I I
I I
e bullO
mdash
o
in
bullr
l C
(laquo
O
3
mdash
mdash
lt
0)
O
BO
C
U
-rl
mdashl-
l
W
a
a Qpound
(0 O
CTgt (0 4-)
o K
gtmdash
Z mdash
mdash O
U
O
S
U
03
M
CO
Q
EH
gtlt
Ogt bull ^r
(0
as cu
Xlt
cu o
C
D
in
bull co QJ
gtJ i
bull o
bull O
b
n
o
0) u
U
) ()
CC
pound
c C
0)
(U
0) 4-gt
o 33
vo (N
O
u
C-C
C
bullr
l in
-r
l a) pound
0)
4-1 (0
4-gt
C
4J u
c
flj O
OO
OO
OO
OO
^O
rH
O
re a c
m laquoj
0) (Q
U
u u
to u u C
bullmdash
4J
bullH
OC
X O
0)
N
C
lt4-l 3
0)
bullU 3 u
C
01
O
IT) bull bullr
l i-H
J3
CrH
gt
iltlgt
o
u
co vrgt o
4J
Cu H
i lt h
PU 00
c03
c P
Oo
cu
0) I
I I
t I
I u
T3
Z SB O
mdash
in
i in
ac u H D os m
lt a
as zJ
gt mdash
0) [L
I-H
CU
tb CU
laquo4 Du CU
03 4
JO
OO
OO
OO
OO
rH
OO
O
bull0 I
w
ooooooooooooo
ooooooooooooo
0) O
OO
OO
OO
OO
OO
OO
T3 0)4J o
0)
C
(Ti O
O O
O O
O O
O O
O O
Ogt
o
o
in 4J
C
O
OO
OO
OO
OO
OO
OC
Ti
0)e
bull H
ltN ltN
ltN
TJ
U)
ffi
Q
OO
OO
OO
OO
OO
OO
O
U
It
U
0)bullo
e bulla
ltN ^ H
r-l If) 0)
oooooooooooorshy
0) w
i fl
U
U1 (0
4J
0)pound
OT
J
U) O
ooooooooooooo
CM
-I 3
O TJ
U
bullH Q
) ^j
00 A
u 5
4J
0)
C 2
bulla
oo ro oo lt-H o
0)o
u e
C O
O
u
U
H-l
C
0) o
m (0
H
aJ to
Page 35
Figure 1 Locations of sediment sampling stations in New Bedford Harbor
Buzzards
New Bedford
Harbor
Page 36
Figure 2 Percent abundance of PCBs at each level of chlorination in (a) New Bedford Harbor sediments and (b) Aroclors 1016 1242 and 1254
A-l Station Mean values for stations A-l
Percent
60
501
40
30shy _Z 20shy
10shy
0 2 Chlorines
1016 1242 1254
Aroclor
Page 37
Figure 3 Concentrations of (a) TOC Total PCBs Total PCDDs Total PCDFs (b) Total PAHs copper and lead in sediments collected along a south to north transect of New Bedford Harbor
Q 2500shy r 10
2000
1500
ga
1000-)
500shy
0shyCD E FG H 1 K L bull 0M
b 2500shy
Copper -175
150
2000shy125 ^
araquo
bullo 1500i 100 o
75 jshy 1000 9 a 50
deg 500 25
A B CD E FGH I K L M 0
Stations
Page 38
Figure 4 (a) Observed and expected levels of 2378-TCDF calculated from 2378-TCDF concentrations in Aroclor mixtures (Wakimoto et al 1988) and sediment PCS concentrations (b) TOC normalized concentrations of 2378-TCDF in New Bedford Harbor sediments
a 1200i
Observed
B
Station B M ObsExp 880 363 52 56
b - Organic Carbon Normalized Concentrations
20 ogt x araquo
15
a a 10 a
B J M Stations
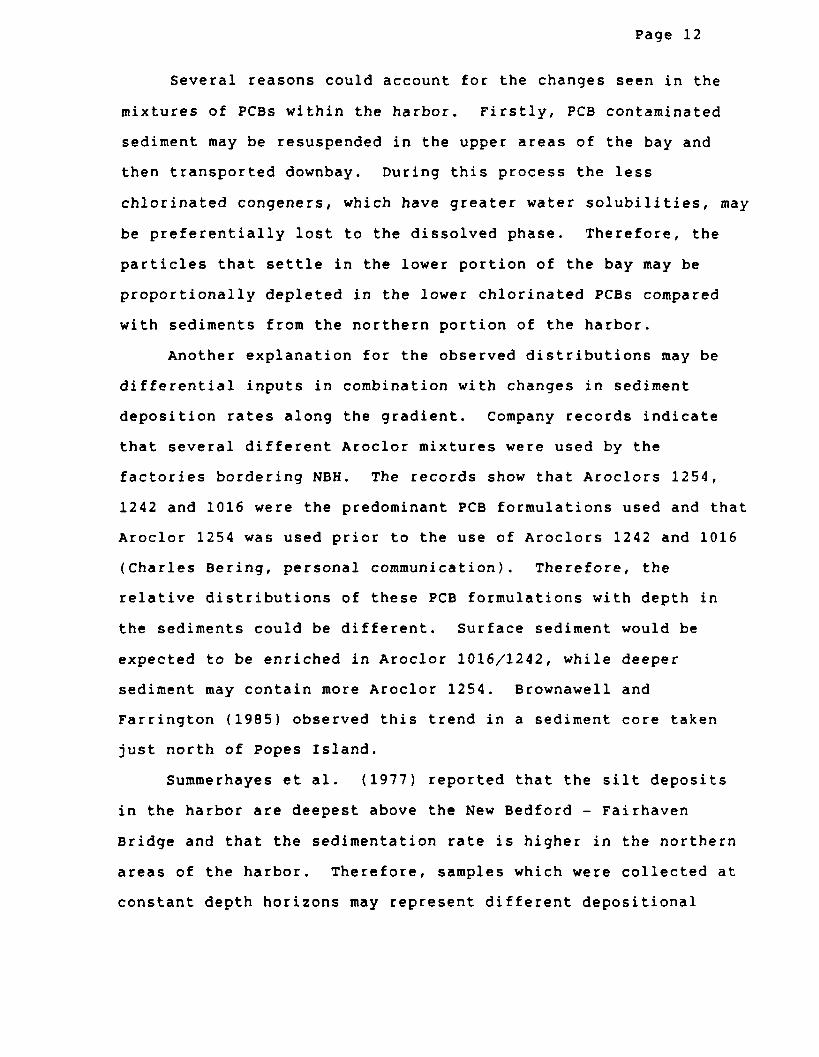

i-H
lto j
0 2
c
c (0
4J
0
rr
0) in
u) ltN
C
mdash
i rt
1mdash1 IU
U JJ
O
r-t (0
0
O
amp
^ u
C
lt o
ugt m
(0
TJ
U)
0) c - u
f O
U
-H
Q)
bullP bullilaquo ^_ imdash
(
1-1 O
4J
U
C
0) M
u
- p c
c bull
O
ltU u
U
B
0
bullH j^
00 T3 u
U
lfi
|M
(U
CO
olt w
as bulla c TJ C
-H
U
(0
O
U) ltM
U
(O
O
QU
O)
H
0 CO
bull laquo-l
agt i-H
X
I (0
bullPO
fl
in
_
U)
DQ
f-l
(0 mdash
bullP
- P
0
S
f-l
gti
T3
^3 in
ogt ltN
i-H ^
^J
r
u
o
u
rtj
mdash
4J
^
^1
U
EH ^
CT e
s^ c 0
bull^
Jj (0en
lt
mdash iclt
jvo
^raquo
HO
Tr~
r~-o
vo
vo
o
oo
oo
oo
oo
oo
o
CT
^V
Olaquo
HO
Olaquo
mdash (
^P
OfN
PO
fOC
OiH
C
ltN
O
bull
bull
bull
bull flaquo
| amp
amp
raquo
laquo
LO
H
3
bull
fs
j PO ^
LO f LO
tgt ^
O
gt iH
ltN
^H raquo H
t
T3
a N
ro C
(0
4J
O
2
1
C
sediments
OO
OO
iHP
Ofs
Ji-
Ht-IO
Oin
oO
O
OO
OO
OO
OO
OO
t-H
PO
O
03 ooooooooooooo
u0
03 I
u ^
oo
oo
laquoN
inp
oro
po
t--laquo-i(pound
gtin
03
Z
VD
vrgt o
oo
oo
oo
oo
i-H
^o
om
U
I
gt o
00 O vo vo
ltN
OO
OO
OO
OO
OO
OO
O
U
I laquo
shy
U U
M in
in in
bull-ia
gtr~
oo
i-ivo
pO
PO
iH
in
XX
I --
laquo
JE asraquo
m
m in
O
OO
OO
OO
OO
CN
VD
iH
O
t i in
bull shy
ooooooooooooo
in
in
i ^ ^
oo in ltN
in
O
ro
r ro
00
o
bullbull raquo
raquo -^
I bull
^^ PO
PO PO
PO
PO PO
in
o
o
---
raquo u
oo
bull
laquobull
bull 0) C
u
o
o in
P
O
tH
bullgt -raquo
v
0gtT3
00
Oo
ltN
co O
o
bull CT
0)
1 1
1 1
1 1
u
3m
o
CO O
00
PO
U J3
CO
P
OV
OiH
T
JO
OO
OO
^1 vo ltTgt
Cu u
LI
t-H O
OO
Oi-
HtN
raquo-H
i-(i-
raquoO
TH
rgt
J
bull C
P^
fM
OO
W O
O
fl 0raquo
O
laquo i-H laquo-H
tH i-H
ltN ltN
^H as
C
(00gt
in VO
VO rrgt
3T
3
Ogt
ro
0) bull13
gt-i C
in
ltN
r I-H
4J
bullH
O
o
bullH
gt X-i
u
o
a bullH
TJ 03
bullO
OJ CO
O 00 0
0
u oa
u
C
00 u
00
w
ux
bulli-i a
m co o
rH
i-H
03
X
03 SB
raquo
r-i
us u
i
M-l
0)
o
(Q
dgt I
0) shyO
Z
fQ
03
OQ O
j if^ Pa
i n
i-H
mdash U
U
I
u a 6
E --m
in
c o m
in I
i in in
o u
-H
O
c
gt --
shybullH
14-1
oo
oo
oo
oo
or^jin
iH
bull o in
bull in in
jj
o
laquo T
) 4J in
PO
u d)
PO
i IB
raquo 4J
4J
o ~
C O
^
VO C
T i-H
bullH
ltN
i PO
(U
0)
U H
o
bullH ltN
C
M
C rH
O
O
C
u
o
PO
0)
O
bull bull i-H
bulla
i i
i i
i i
bull in PO
bull ltN
OQ
ltN r -
^H
i-H O
O PO
Qgt
Um
^o
in I-H
m
i-H
ltN
C
rmdash o
Hi O
O i-l
t-l X
I m
o
bull bull o
PO
laquo
O - H
ltN I-H
r^ bull
i EH
Oo
oo
(0 O
oo
o
4-gt
Imdash
O
oo
TJ 0)4-1
U
O
O
OJ Q
rH
U
O
O
oo
a
OJ
(0 in
O
O
oo
ugt as
O
O
00 o
T
r -in
rH
UH
TJ I
O
u
O
V) lt4H OJ TJ
VO
3
W
OJ o
O
o
CO
O
gtiCO
crlt
o
oo
JD
rH
bullH
laquoTi P
O
(0 10
$
OJ C
OJ
B
(0 2
O
0) c
u
(0
TJ m
TJ
bull u
i n o
TJ
OJ OJ
OJ bullH c
r~ in
C
Ogt
rH
i-H -iH
u
c a
a
x
Qu
OJ m
g a
o
u (0
TJ - H
T
J
a ()
(0
U
I 0)
4J TJ
OJ
o a
C
o bullrlt
C
rH
MH I
0) W
g (a
a
o ltN
VO
PO
U)
N
c rH
Q
rH
U
c c o
rO Q
Q
O
J U
O
OJ u
ffi Q
U
C C
-
Q
QU
OO
OJ
O
o
Q Q
O
i I
-iH D
I J
10 TJ o
W
Q
UU
KC
OJ
-J
C-U
1-1
u
C
Q
X
X
I -
O O
4-raquo TJ
DU
O
U
KE
Bc
or
-flJU
MH
C
0)
TJ
in T
J bull
HQ
OJ
II
raquo
4J
O
O
J 4-gt
in
c
c 4-J Q
ou oo^ r^ ^o o j o j
U
(0 laquo
UI
laquolaquo
raquoraquo
TJ
J5
0J
c c
O
EH
Oo
r^o
ov
otn
-u
c
O - H
bull
H i
laquo --
laquo
~ ~
o
O
U
W
MH
oo
r^^
r-^r^
TT
J C
O
4J
bullH
raquo
gt^
raquo^
raquof
l)
OC
flj lt
H
C
4J
P-P
OP
OP
OP
OP
O4
J
-iH
CTgtC
OJ c
raquo
^laquo
raquo^
raquoo
ampgt
10 O
S
Q
) PO
O^ ^
^ ^
^ ^
^ ^
^
O
CN T3
bullrj -
rjraquo
raquo
raquoraquo
raquo4
J
Hg
j 00
Qgt rH
TJ
C
Mlt
NrH
rH
rH
rH
rH
OJ
TJ
-l-
)
gt
O
OJ C
O
bull4 a ( A
Q
I I
I I
I I
OJ OJ
QUc
o3
ltr~o
po
in o
OJ
in vo r -r
-r-2
TJ Q
C
OJ
o rH
bull iH
JO
4J
T
J 10
lt0
c
EH cn
lyses of selected ford Harbor sediments
rH
oo
Oo
re o
0O
rH
rH
o
O
o
OJ
in
O0
oO
P
O
PO
o
rshyrH
ltN
VO
C
M
rH
rH
oO
vo
PO
rH
c
rH
laquoN
cnOraquo
rH
OO
Oo
P
O
00 O
laquoN
rH
(N
CM
rH
C
b
Eb Q
rH
Q Q
U
r H
b b U
U O
1
Q
Q
Q
1
r H
4J O
O
T
3
uo
u a z
o o J=
P
O
C
mdash X
X
X
1 1
raquo
- U
rH
fH
vo a c ac Eo
o 0 1r ~ 3
fl T 3
bullH
00
1 1
1
raquo -O
C
O
0)
CTgt 0 0 oo o o r ~
o o v o J D
laquo
rf
fV3
Tl
^H
C
N
^
ID
(N
o
C
r-r- r ~
v or -i n
rtw t
bull 11
f^
Jj
Q)
Ul
bullT
T vo v o
O
raquogt
bullM
ill
laquo raquo7z T
^
u
+
-^
bull
PO T T P O
P O P O
U H
mdash
laquo
bullrH
C
OO
f1
^
rH - H
rH
P
O
rH
O
rH
4JfM
raquoH
rrkU
1fH
iI
Ol
^1
3m
rH(a
T
3
C
uc a
re
bull bull
Ol I
i i
i i
i re
e
U U
U
in
rH
oo
ltN
4J
u re
0 3
Qgt rH
P
O
vo m
V
O
bullH O
O rH
O r H
i n
W
bull
C
fH
ltN
^3-S
- H
(N
P O P O
P O P O
W
W
rtiV
W
N
Ogt
0
bullH
C
r H
^3gt
O
0 ) 0
rH
r~
O
00
C
rH
bullH e
C
C
C
OO
O
T3
u
s re
a
bullH n u
rH
PO
in
rH
bullH u r e 4J - H
re
01
Vgt re T J
b
bull -f on
c c u
Q
CM
r-
0o
T3
raquo mdash
b
O O
) O
4-
O
U
rH
PO
in
VO
C
Q
- H
O
iI S
C
0 ) Cn
rH
rH
rH
U]
b b
b
U
- U C
- U
0)
4J
C
Q D
Q
X
C J
O
u re
O
U
U
U
S 3
0) C
J i w
c c
0
o
O
bullo bullH
bb
b
O) 0
) O
l 1
J J
O
O - H
^
in
rH
O
c
JJ Q
a a
a a lt D M r--01 0 1
O
t-i O
l P
O
T
in
re uU
U
1
1 1
TJ
poundi
0 ) o
_i
i
Ml _1
ltU r H
bullr-1
|
Hr
bull ^
rtJ
O
r^bull
c^ C
2 V
O
PO
OO
00
ltD r -
1
00
c^
O1
gt 0
ltu m c
o^
fNc
oc
otN
lt U
CO
lt
MOi
o
o
o
O
M f N
ltN
CO
rHlt
Nlt
NrH
lt
UO
4J
bull P
O
TT
fH
00
tH
bullo c u
TJ-00
r~
^
rH
b
1I
i I
i i
i a gt
a gt rH
rH
Q
4-gt
CU J-gt
ogt
O r H
CO
^ O
^3 C
^3 S
O ^
U
bull
Oc
0 0 O
OO
OO
lrH
rH
rH
ZT
JD
r)
bull o
OO
VO
rH
r H
i H
re
rH
CCTi
Oo
1
1 1
EH
00
O
ltN
rH
01
bullK
gtP 4
fH
bulla
+ -U
c
re 00
-3
tj pound
u
tn
4-gt
O
bull O
ttJ
u
U) C
O
ac ltu
-Q
EH C
u
z o bull
laquo
lt u
w
32 r-
o
a ro
M
Ult
bullO
laquoJ
Z
CU
u
gt--
OO
OO
OO
OO
Or
Hr
Hr
HO
td
shy
O
33 ttraquo lt N
u-i OH
C O
Tgt
Pu
0gt PO
0) CO
bullrl
t-
LTgt
m
U
c
bull bull
0)
I u
c
C
0 ) 01
0)
0)
C u
a
Z
03 U
C
0)
CO
gti0
gt U
w
-rshy6
in
-i o
Q
irH
r O
ltU W
fSJ O
mdash
D
(N
mdash
gt
lU T
J 0)
u
4-gt
Z
T3 u
J- 3
C
OJ U
01 4J
rH
(U V
O
C
I Q
uC
o s r~~ bullO
dgt PO
^^
fl
C
- U CsJ
0) tt)^
U
--H
-^
bullH
C
4-1
fQ
CO
gt1ltN
laquo
J=
CJ
a
^j= ^
O u S
0)
gt1 03
QJ
itrade^ laquomdash
I laquo
fO
w
o
rH
u
C
(0 ^^
O^
1-4
rH 3
rH
i-H
T3
ft)_
O
^-N
O
gtH
(N
0
U
) O
C
O
C
o
to 4-) c V
gtiN
lt U
N
0) U
) N
^
ftj
aa
H C
73
C J3
J=
1 gt
C
O1
U
jr ID c agt -H
3
U
03 M
CO
Q
H J3
fl
^
bullH
C
O
I I
I I
I I
e bullO
mdash
o
in
bullr
l C
(laquo
O
3
mdash
mdash
lt
0)
O
BO
C
U
-rl
mdashl-
l
W
a
a Qpound
(0 O
CTgt (0 4-)
o K
gtmdash
Z mdash
mdash O
U
O
S
U
03
M
CO
Q
EH
gtlt
Ogt bull ^r
(0
as cu
Xlt
cu o
C
D
in
bull co QJ
gtJ i
bull o
bull O
b
n
o
0) u
U
) ()
CC
pound
c C
0)
(U
0) 4-gt
o 33
vo (N
O
u
C-C
C
bullr
l in
-r
l a) pound
0)
4-1 (0
4-gt
C
4J u
c
flj O
OO
OO
OO
OO
^O
rH
O
re a c
m laquoj
0) (Q
U
u u
to u u C
bullmdash
4J
bullH
OC
X O
0)
N
C
lt4-l 3
0)
bullU 3 u
C
01
O
IT) bull bullr
l i-H
J3
CrH
gt
iltlgt
o
u
co vrgt o
4J
Cu H
i lt h
PU 00
c03
c P
Oo
cu
0) I
I I
t I
I u
T3
Z SB O
mdash
in
i in
ac u H D os m
lt a
as zJ
gt mdash
0) [L
I-H
CU
tb CU
laquo4 Du CU
03 4
JO
OO
OO
OO
OO
rH
OO
O
bull0 I
w
ooooooooooooo
ooooooooooooo
0) O
OO
OO
OO
OO
OO
OO
T3 0)4J o
0)
C
(Ti O
O O
O O
O O
O O
O O
Ogt
o
o
in 4J
C
O
OO
OO
OO
OO
OO
OC
Ti
0)e
bull H
ltN ltN
ltN
TJ
U)
ffi
Q
OO
OO
OO
OO
OO
OO
O
U
It
U
0)bullo
e bulla
ltN ^ H
r-l If) 0)
oooooooooooorshy
0) w
i fl
U
U1 (0
4J
0)pound
OT
J
U) O
ooooooooooooo
CM
-I 3
O TJ
U
bullH Q
) ^j
00 A
u 5
4J
0)
C 2
bulla
oo ro oo lt-H o
0)o
u e
C O
O
u
U
H-l
C
0) o
m (0
H
aJ to
Page 35
Figure 1 Locations of sediment sampling stations in New Bedford Harbor
Buzzards
New Bedford
Harbor
Page 36
Figure 2 Percent abundance of PCBs at each level of chlorination in (a) New Bedford Harbor sediments and (b) Aroclors 1016 1242 and 1254
A-l Station Mean values for stations A-l
Percent
60
501
40
30shy _Z 20shy
10shy
0 2 Chlorines
1016 1242 1254
Aroclor
Page 37
Figure 3 Concentrations of (a) TOC Total PCBs Total PCDDs Total PCDFs (b) Total PAHs copper and lead in sediments collected along a south to north transect of New Bedford Harbor
Q 2500shy r 10
2000
1500
ga
1000-)
500shy
0shyCD E FG H 1 K L bull 0M
b 2500shy
Copper -175
150
2000shy125 ^
araquo
bullo 1500i 100 o
75 jshy 1000 9 a 50
deg 500 25
A B CD E FGH I K L M 0
Stations
Page 38
Figure 4 (a) Observed and expected levels of 2378-TCDF calculated from 2378-TCDF concentrations in Aroclor mixtures (Wakimoto et al 1988) and sediment PCS concentrations (b) TOC normalized concentrations of 2378-TCDF in New Bedford Harbor sediments
a 1200i
Observed
B
Station B M ObsExp 880 363 52 56
b - Organic Carbon Normalized Concentrations
20 ogt x araquo
15
a a 10 a
B J M Stations

Oo
oo
(0 O
oo
o
4-gt
Imdash
O
oo
TJ 0)4-1
U
O
O
OJ Q
rH
U
O
O
oo
a
OJ
(0 in
O
O
oo
ugt as
O
O
00 o
T
r -in
rH
UH
TJ I
O
u
O
V) lt4H OJ TJ
VO
3
W
OJ o
O
o
CO
O
gtiCO
crlt
o
oo
JD
rH
bullH
laquoTi P
O
(0 10
$
OJ C
OJ
B
(0 2
O
0) c
u
(0
TJ m
TJ
bull u
i n o
TJ
OJ OJ
OJ bullH c
r~ in
C
Ogt
rH
i-H -iH
u
c a
a
x
Qu
OJ m
g a
o
u (0
TJ - H
T
J
a ()
(0
U
I 0)
4J TJ
OJ
o a
C
o bullrlt
C
rH
MH I
0) W
g (a
a
o ltN
VO
PO
U)
N
c rH
Q
rH
U
c c o
rO Q
Q
O
J U
O
OJ u
ffi Q
U
C C
-
Q
QU
OO
OJ
O
o
Q Q
O
i I
-iH D
I J
10 TJ o
W
Q
UU
KC
OJ
-J
C-U
1-1
u
C
Q
X
X
I -
O O
4-raquo TJ
DU
O
U
KE
Bc
or
-flJU
MH
C
0)
TJ
in T
J bull
HQ
OJ
II
raquo
4J
O
O
J 4-gt
in
c
c 4-J Q
ou oo^ r^ ^o o j o j
U
(0 laquo
UI
laquolaquo
raquoraquo
TJ
J5
0J
c c
O
EH
Oo
r^o
ov
otn
-u
c
O - H
bull
H i
laquo --
laquo
~ ~
o
O
U
W
MH
oo
r^^
r-^r^
TT
J C
O
4J
bullH
raquo
gt^
raquo^
raquof
l)
OC
flj lt
H
C
4J
P-P
OP
OP
OP
OP
O4
J
-iH
CTgtC
OJ c
raquo
^laquo
raquo^
raquoo
ampgt
10 O
S
Q
) PO
O^ ^
^ ^
^ ^
^ ^
^
O
CN T3
bullrj -
rjraquo
raquo
raquoraquo
raquo4
J
Hg
j 00
Qgt rH
TJ
C
Mlt
NrH
rH
rH
rH
rH
OJ
TJ
-l-
)
gt
O
OJ C
O
bull4 a ( A
Q
I I
I I
I I
OJ OJ
QUc
o3
ltr~o
po
in o
OJ
in vo r -r
-r-2
TJ Q
C
OJ
o rH
bull iH
JO
4J
T
J 10
lt0
c
EH cn
lyses of selected ford Harbor sediments
rH
oo
Oo
re o
0O
rH
rH
o
O
o
OJ
in
O0
oO
P
O
PO
o
rshyrH
ltN
VO
C
M
rH
rH
oO
vo
PO
rH
c
rH
laquoN
cnOraquo
rH
OO
Oo
P
O
00 O
laquoN
rH
(N
CM
rH
C
b
Eb Q
rH
Q Q
U
r H
b b U
U O
1
Q
Q
Q
1
r H
4J O
O
T
3
uo
u a z
o o J=
P
O
C
mdash X
X
X
1 1
raquo
- U
rH
fH
vo a c ac Eo
o 0 1r ~ 3
fl T 3
bullH
00
1 1
1
raquo -O
C
O
0)
CTgt 0 0 oo o o r ~
o o v o J D
laquo
rf
fV3
Tl
^H
C
N
^
ID
(N
o
C
r-r- r ~
v or -i n
rtw t
bull 11
f^
Jj
Q)
Ul
bullT
T vo v o
O
raquogt
bullM
ill
laquo raquo7z T
^
u
+
-^
bull
PO T T P O
P O P O
U H
mdash
laquo
bullrH
C
OO
f1
^
rH - H
rH
P
O
rH
O
rH
4JfM
raquoH
rrkU
1fH
iI
Ol
^1
3m
rH(a
T
3
C
uc a
re
bull bull
Ol I
i i
i i
i re
e
U U
U
in
rH
oo
ltN
4J
u re
0 3
Qgt rH
P
O
vo m
V
O
bullH O
O rH
O r H
i n
W
bull
C
fH
ltN
^3-S
- H
(N
P O P O
P O P O
W
W
rtiV
W
N
Ogt
0
bullH
C
r H
^3gt
O
0 ) 0
rH
r~
O
00
C
rH
bullH e
C
C
C
OO
O
T3
u
s re
a
bullH n u
rH
PO
in
rH
bullH u r e 4J - H
re
01
Vgt re T J
b
bull -f on
c c u
Q
CM
r-
0o
T3
raquo mdash
b
O O
) O
4-
O
U
rH
PO
in
VO
C
Q
- H
O
iI S
C
0 ) Cn
rH
rH
rH
U]
b b
b
U
- U C
- U
0)
4J
C
Q D
Q
X
C J
O
u re
O
U
U
U
S 3
0) C
J i w
c c
0
o
O
bullo bullH
bb
b
O) 0
) O
l 1
J J
O
O - H
^
in
rH
O
c
JJ Q
a a
a a lt D M r--01 0 1
O
t-i O
l P
O
T
in
re uU
U
1
1 1
TJ
poundi
0 ) o
_i
i
Ml _1
ltU r H
bullr-1
|
Hr
bull ^
rtJ
O
r^bull
c^ C
2 V
O
PO
OO
00
ltD r -
1
00
c^
O1
gt 0
ltu m c
o^
fNc
oc
otN
lt U
CO
lt
MOi
o
o
o
O
M f N
ltN
CO
rHlt
Nlt
NrH
lt
UO
4J
bull P
O
TT
fH
00
tH
bullo c u
TJ-00
r~
^
rH
b
1I
i I
i i
i a gt
a gt rH
rH
Q
4-gt
CU J-gt
ogt
O r H
CO
^ O
^3 C
^3 S
O ^
U
bull
Oc
0 0 O
OO
OO
lrH
rH
rH
ZT
JD
r)
bull o
OO
VO
rH
r H
i H
re
rH
CCTi
Oo
1
1 1
EH
00
O
ltN
rH
01
bullK
gtP 4
fH
bulla
+ -U
c
re 00
-3
tj pound
u
tn
4-gt
O
bull O
ttJ
u
U) C
O
ac ltu
-Q
EH C
u
z o bull
laquo
lt u
w
32 r-
o
a ro
M
Ult
bullO
laquoJ
Z
CU
u
gt--
OO
OO
OO
OO
Or
Hr
Hr
HO
td
shy
O
33 ttraquo lt N
u-i OH
C O
Tgt
Pu
0gt PO
0) CO
bullrl
t-
LTgt
m
U
c
bull bull
0)
I u
c
C
0 ) 01
0)
0)
C u
a
Z
03 U
C
0)
CO
gti0
gt U
w
-rshy6
in
-i o
Q
irH
r O
ltU W
fSJ O
mdash
D
(N
mdash
gt
lU T
J 0)
u
4-gt
Z
T3 u
J- 3
C
OJ U
01 4J
rH
(U V
O
C
I Q
uC
o s r~~ bullO
dgt PO
^^
fl
C
- U CsJ
0) tt)^
U
--H
-^
bullH
C
4-1
fQ
CO
gt1ltN
laquo
J=
CJ
a
^j= ^
O u S
0)
gt1 03
QJ
itrade^ laquomdash
I laquo
fO
w
o
rH
u
C
(0 ^^
O^
1-4
rH 3
rH
i-H
T3
ft)_
O
^-N
O
gtH
(N
0
U
) O
C
O
C
o
to 4-) c V
gtiN
lt U
N
0) U
) N
^
ftj
aa
H C
73
C J3
J=
1 gt
C
O1
U
jr ID c agt -H
3
U
03 M
CO
Q
H J3
fl
^
bullH
C
O
I I
I I
I I
e bullO
mdash
o
in
bullr
l C
(laquo
O
3
mdash
mdash
lt
0)
O
BO
C
U
-rl
mdashl-
l
W
a
a Qpound
(0 O
CTgt (0 4-)
o K
gtmdash
Z mdash
mdash O
U
O
S
U
03
M
CO
Q
EH
gtlt
Ogt bull ^r
(0
as cu
Xlt
cu o
C
D
in
bull co QJ
gtJ i
bull o
bull O
b
n
o
0) u
U
) ()
CC
pound
c C
0)
(U
0) 4-gt
o 33
vo (N
O
u
C-C
C
bullr
l in
-r
l a) pound
0)
4-1 (0
4-gt
C
4J u
c
flj O
OO
OO
OO
OO
^O
rH
O
re a c
m laquoj
0) (Q
U
u u
to u u C
bullmdash
4J
bullH
OC
X O
0)
N
C
lt4-l 3
0)
bullU 3 u
C
01
O
IT) bull bullr
l i-H
J3
CrH
gt
iltlgt
o
u
co vrgt o
4J
Cu H
i lt h
PU 00
c03
c P
Oo
cu
0) I
I I
t I
I u
T3
Z SB O
mdash
in
i in
ac u H D os m
lt a
as zJ
gt mdash
0) [L
I-H
CU
tb CU
laquo4 Du CU
03 4
JO
OO
OO
OO
OO
rH
OO
O
bull0 I
w
ooooooooooooo
ooooooooooooo
0) O
OO
OO
OO
OO
OO
OO
T3 0)4J o
0)
C
(Ti O
O O
O O
O O
O O
O O
Ogt
o
o
in 4J
C
O
OO
OO
OO
OO
OO
OC
Ti
0)e
bull H
ltN ltN
ltN
TJ
U)
ffi
Q
OO
OO
OO
OO
OO
OO
O
U
It
U
0)bullo
e bulla
ltN ^ H
r-l If) 0)
oooooooooooorshy
0) w
i fl
U
U1 (0
4J
0)pound
OT
J
U) O
ooooooooooooo
CM
-I 3
O TJ
U
bullH Q
) ^j
00 A
u 5
4J
0)
C 2
bulla
oo ro oo lt-H o
0)o
u e
C O
O
u
U
H-l
C
0) o
m (0
H
aJ to
Page 35
Figure 1 Locations of sediment sampling stations in New Bedford Harbor
Buzzards
New Bedford
Harbor
Page 36
Figure 2 Percent abundance of PCBs at each level of chlorination in (a) New Bedford Harbor sediments and (b) Aroclors 1016 1242 and 1254
A-l Station Mean values for stations A-l
Percent
60
501
40
30shy _Z 20shy
10shy
0 2 Chlorines
1016 1242 1254
Aroclor
Page 37
Figure 3 Concentrations of (a) TOC Total PCBs Total PCDDs Total PCDFs (b) Total PAHs copper and lead in sediments collected along a south to north transect of New Bedford Harbor
Q 2500shy r 10
2000
1500
ga
1000-)
500shy
0shyCD E FG H 1 K L bull 0M
b 2500shy
Copper -175
150
2000shy125 ^
araquo
bullo 1500i 100 o
75 jshy 1000 9 a 50
deg 500 25
A B CD E FGH I K L M 0
Stations
Page 38
Figure 4 (a) Observed and expected levels of 2378-TCDF calculated from 2378-TCDF concentrations in Aroclor mixtures (Wakimoto et al 1988) and sediment PCS concentrations (b) TOC normalized concentrations of 2378-TCDF in New Bedford Harbor sediments
a 1200i
Observed
B
Station B M ObsExp 880 363 52 56
b - Organic Carbon Normalized Concentrations
20 ogt x araquo
15
a a 10 a
B J M Stations

4-gt
O
bull O
ttJ
u
U) C
O
ac ltu
-Q
EH C
u
z o bull
laquo
lt u
w
32 r-
o
a ro
M
Ult
bullO
laquoJ
Z
CU
u
gt--
OO
OO
OO
OO
Or
Hr
Hr
HO
td
shy
O
33 ttraquo lt N
u-i OH
C O
Tgt
Pu
0gt PO
0) CO
bullrl
t-
LTgt
m
U
c
bull bull
0)
I u
c
C
0 ) 01
0)
0)
C u
a
Z
03 U
C
0)
CO
gti0
gt U
w
-rshy6
in
-i o
Q
irH
r O
ltU W
fSJ O
mdash
D
(N
mdash
gt
lU T
J 0)
u
4-gt
Z
T3 u
J- 3
C
OJ U
01 4J
rH
(U V
O
C
I Q
uC
o s r~~ bullO
dgt PO
^^
fl
C
- U CsJ
0) tt)^
U
--H
-^
bullH
C
4-1
fQ
CO
gt1ltN
laquo
J=
CJ
a
^j= ^
O u S
0)
gt1 03
QJ
itrade^ laquomdash
I laquo
fO
w
o
rH
u
C
(0 ^^
O^
1-4
rH 3
rH
i-H
T3
ft)_
O
^-N
O
gtH
(N
0
U
) O
C
O
C
o
to 4-) c V
gtiN
lt U
N
0) U
) N
^
ftj
aa
H C
73
C J3
J=
1 gt
C
O1
U
jr ID c agt -H
3
U
03 M
CO
Q
H J3
fl
^
bullH
C
O
I I
I I
I I
e bullO
mdash
o
in
bullr
l C
(laquo
O
3
mdash
mdash
lt
0)
O
BO
C
U
-rl
mdashl-
l
W
a
a Qpound
(0 O
CTgt (0 4-)
o K
gtmdash
Z mdash
mdash O
U
O
S
U
03
M
CO
Q
EH
gtlt
Ogt bull ^r
(0
as cu
Xlt
cu o
C
D
in
bull co QJ
gtJ i
bull o
bull O
b
n
o
0) u
U
) ()
CC
pound
c C
0)
(U
0) 4-gt
o 33
vo (N
O
u
C-C
C
bullr
l in
-r
l a) pound
0)
4-1 (0
4-gt
C
4J u
c
flj O
OO
OO
OO
OO
^O
rH
O
re a c
m laquoj
0) (Q
U
u u
to u u C
bullmdash
4J
bullH
OC
X O
0)
N
C
lt4-l 3
0)
bullU 3 u
C
01
O
IT) bull bullr
l i-H
J3
CrH
gt
iltlgt
o
u
co vrgt o
4J
Cu H
i lt h
PU 00
c03
c P
Oo
cu
0) I
I I
t I
I u
T3
Z SB O
mdash
in
i in
ac u H D os m
lt a
as zJ
gt mdash
0) [L
I-H
CU
tb CU
laquo4 Du CU
03 4
JO
OO
OO
OO
OO
rH
OO
O
bull0 I
w
ooooooooooooo
ooooooooooooo
0) O
OO
OO
OO
OO
OO
OO
T3 0)4J o
0)
C
(Ti O
O O
O O
O O
O O
O O
Ogt
o
o
in 4J
C
O
OO
OO
OO
OO
OO
OC
Ti
0)e
bull H
ltN ltN
ltN
TJ
U)
ffi
Q
OO
OO
OO
OO
OO
OO
O
U
It
U
0)bullo
e bulla
ltN ^ H
r-l If) 0)
oooooooooooorshy
0) w
i fl
U
U1 (0
4J
0)pound
OT
J
U) O
ooooooooooooo
CM
-I 3
O TJ
U
bullH Q
) ^j
00 A
u 5
4J
0)
C 2
bulla
oo ro oo lt-H o
0)o
u e
C O
O
u
U
H-l
C
0) o
m (0
H
aJ to
Page 35
Figure 1 Locations of sediment sampling stations in New Bedford Harbor
Buzzards
New Bedford
Harbor
Page 36
Figure 2 Percent abundance of PCBs at each level of chlorination in (a) New Bedford Harbor sediments and (b) Aroclors 1016 1242 and 1254
A-l Station Mean values for stations A-l
Percent
60
501
40
30shy _Z 20shy
10shy
0 2 Chlorines
1016 1242 1254
Aroclor
Page 37
Figure 3 Concentrations of (a) TOC Total PCBs Total PCDDs Total PCDFs (b) Total PAHs copper and lead in sediments collected along a south to north transect of New Bedford Harbor
Q 2500shy r 10
2000
1500
ga
1000-)
500shy
0shyCD E FG H 1 K L bull 0M
b 2500shy
Copper -175
150
2000shy125 ^
araquo
bullo 1500i 100 o
75 jshy 1000 9 a 50
deg 500 25
A B CD E FGH I K L M 0
Stations
Page 38
Figure 4 (a) Observed and expected levels of 2378-TCDF calculated from 2378-TCDF concentrations in Aroclor mixtures (Wakimoto et al 1988) and sediment PCS concentrations (b) TOC normalized concentrations of 2378-TCDF in New Bedford Harbor sediments
a 1200i
Observed
B
Station B M ObsExp 880 363 52 56
b - Organic Carbon Normalized Concentrations
20 ogt x araquo
15
a a 10 a
B J M Stations

ooooooooooooo
ooooooooooooo
0) O
OO
OO
OO
OO
OO
OO
T3 0)4J o
0)
C
(Ti O
O O
O O
O O
O O
O O
Ogt
o
o
in 4J
C
O
OO
OO
OO
OO
OO
OC
Ti
0)e
bull H
ltN ltN
ltN
TJ
U)
ffi
Q
OO
OO
OO
OO
OO
OO
O
U
It
U
0)bullo
e bulla
ltN ^ H
r-l If) 0)
oooooooooooorshy
0) w
i fl
U
U1 (0
4J
0)pound
OT
J
U) O
ooooooooooooo
CM
-I 3
O TJ
U
bullH Q
) ^j
00 A
u 5
4J
0)
C 2
bulla
oo ro oo lt-H o
0)o
u e
C O
O
u
U
H-l
C
0) o
m (0
H
aJ to
Page 35
Figure 1 Locations of sediment sampling stations in New Bedford Harbor
Buzzards
New Bedford
Harbor
Page 36
Figure 2 Percent abundance of PCBs at each level of chlorination in (a) New Bedford Harbor sediments and (b) Aroclors 1016 1242 and 1254
A-l Station Mean values for stations A-l
Percent
60
501
40
30shy _Z 20shy
10shy
0 2 Chlorines
1016 1242 1254
Aroclor
Page 37
Figure 3 Concentrations of (a) TOC Total PCBs Total PCDDs Total PCDFs (b) Total PAHs copper and lead in sediments collected along a south to north transect of New Bedford Harbor
Q 2500shy r 10
2000
1500
ga
1000-)
500shy
0shyCD E FG H 1 K L bull 0M
b 2500shy
Copper -175
150
2000shy125 ^
araquo
bullo 1500i 100 o
75 jshy 1000 9 a 50
deg 500 25
A B CD E FGH I K L M 0
Stations
Page 38
Figure 4 (a) Observed and expected levels of 2378-TCDF calculated from 2378-TCDF concentrations in Aroclor mixtures (Wakimoto et al 1988) and sediment PCS concentrations (b) TOC normalized concentrations of 2378-TCDF in New Bedford Harbor sediments
a 1200i
Observed
B
Station B M ObsExp 880 363 52 56
b - Organic Carbon Normalized Concentrations
20 ogt x araquo
15
a a 10 a
B J M Stations
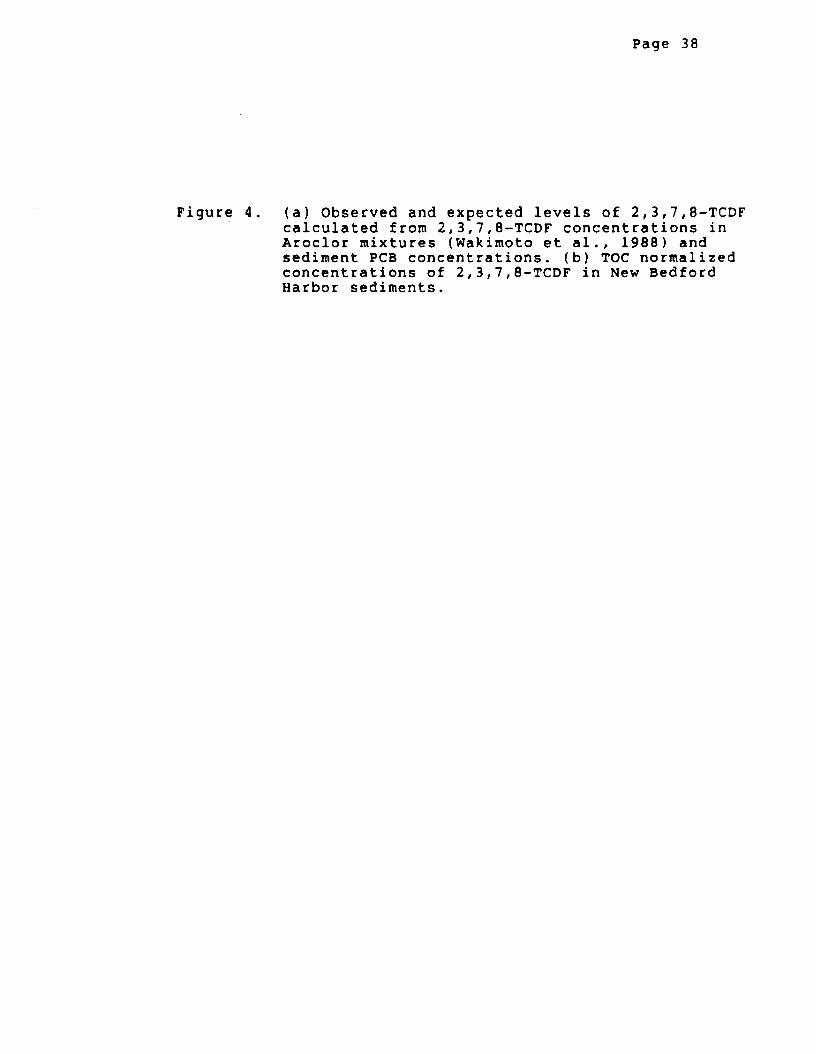

a 1200i
Observed
B
Station B M ObsExp 880 363 52 56
b - Organic Carbon Normalized Concentrations
20 ogt x araquo
15
a a 10 a
B J M Stations