Embed Size (px)
Citation preview

Geochemical Ionic Exchange Relate with Sea Water Intrusion Study Using Geo
Spatial Technique in the Ramanathapuram Coastal Stretch Tamil Nadu India
M.Vijay Prabhu*1 and S.Venkateswaran2 R.Kannan3 and R.Ayyandurai3 *1UGC, Post Doctorate Fellow, Department of Geology, Periyar University, Salem-11,Tamil Nadu
2 Professor and Head, Department of Geology, Periyar University, Salem-11, Tamil Nadu 3Research Scholars, Department of Geology, Periyar University, Salem-11, Tamil Nadu
Email:[email protected]
ABSTRACT
The geochemical characteristics of groundwater are vital for the support of habitat and for
maintaining the quality of base flow in rivers, while its quality assessment is essential to
ensure sustainable safe use of the resources for drinking in the coastal community. Thirty
nine groundwater sampling sites were selected systematically and samples were taken from a
reference line study to understand the geochemistry of the groundwater and to assess the
overall physicochemical faces pre-monsoon 2017. Generally, coastal regions receive rainfall
during SW-NE monsoon seasons. Ramanathapuram district receives maximum rainfall in
NE monsoon seasons. Rains normally occur in the form of cyclonic storms caused by
depression in the Bay of Bengal. District average annual rainfall is 827 mm. Degradation
groundwater qualities in the coastal region generally due to sea water intrusion, salt pans,
aquaculture activity along the coastal region, wind driven, Sea spray and marine aerosols
deposits on the top soil, evaporation and interaction of groundwater with brines and
sedimentary formation. Sampling was carried out using precleaned polyethylene containers.
The physical and chemical parameters of the analytical results of groundwater were compared
with the standard guideline values recommended by the World Health Organization for
drinking and public health standards. Thematic maps pertaining to TDS, EC, pH, Na, Cl
were generated using the Arc GIS platform. To find out the distribution pattern of the
concentration of different elements to identify Geochemical Ionic Exchange ratio Relate with
Sea Water Intrusion type. The higher and lower concentration was identified based on those
spatial maps for various elements were also generated, discussed, and presented. To mapping
interface of fresh and sea water signatures through high TDS, Na and Cl contents can be
attributed. An alternative graphical approach is to plot Cl vs. electrical conductivity (EC)
(Washington State Department of Ecology, 2005). Three zones on a plot of Cl vs. EC:
normal, mixed and SWI area delineated in the study area.
ISSN NO: 1021-9056
http://infokara.com/989
INFOKARA RESEARCH
Volume 8 Issue 12 2019
Keywords: Geo Spatial Technique, Coastal Stretch, Geochemical Ionic Exchange
Groundwater Quality, Sea Water Intrusion and WHO.
1. Introduction
Ramanthapuram Coast is one of the world’s richest regions of marine bio
diversity perspective and the first Marine Biosphere Reserve in Southeast Asia.
Nearly 3600 species reported in the Gulf of Mannar region. This area is endowed
with a combination of ecosystems including mangroves, seagrass, seaweeds and
coral reefs. The majority of the area is covered by the unconsolidated sediments of
Quaternary age, where isolated patches of Archaen Crystallines and Tertiary
sandstone are exposed. Seawater intrusion is one of the major problems in this area.
It may due to gentle hydraulic gradients, tidal and estuarine activity, sea level rises,
low infiltration, excessive groundwater withdrawal and local hydrogeological
conditions. Rural people mostly trusted on groundwater for domestic purposes. The
following are the reasons why groundwater is attractive for most domestic uses: the
resource is generally sheltered from most surface polluting activities and does not
need bacteriological treatment prior to consumption; aquifers underlie most of the
rural communities and can be tapped at relatively shallow depths; surface water
resources are virtually nonexistent in most of these communities and where surface
water resources exist, they are often so much polluted that the cost of tapping
groundwater is modest compared to the fee of treating surface water resources
before usage. In addition to meeting the domestic water needs of the rural
population, it has been envisaged that groundwater has the potential of being
phased in sufficient quantities to meet irrigation needs to raise the standard of living
of the communities.
Characterization of groundwater in terms of geochemical types is an essential
component of scientific management of groundwater resources in order to monitor
ISSN NO: 1021-9056
http://infokara.com/990
INFOKARA RESEARCH
Volume 8 Issue 12 2019

the quality of groundwater in an aquifer, and also for identification of recharge areas
(Schoeller, 1967). Moreover, geochemistry of groundwater is also related to the
nature of host rock as well as the overlying rock types. An understanding of
chemical quality of water is essential in determining its usefulness for domestic,
industrial and agricultural purposes (WHO, 1996).
The total dissolved salts in the water are a direct measure of the quality of
water. Many authors viz., Fetter (1990), Freeze and Cherry (1979) and Davis and De
Wiest (1966) studied the water quality and reported that high values of TDS is
unsuitable for drinking and irrigation purposes. Also, the groundwater chemistry
depends upon various rock-water interactions such as weathering, dissolution and
ion exchange reactions as well as from the anthropogenic activities discussed above.
In order to identify and evaluate the factors and processes that are responsible for
the groundwater chemistry, detailed geochemical studies have to be carried out. The
hydrogeochemical study of groundwater allows us to obtain important information
on chemical weathering of rock/soil, chemical compositions of the aquifers and also
on the impact of the anthropogenic activities.
Groundwater quality comprises the physical, chemical, and biological
qualities of groundwater. Temperature, turbidity, colour, taste, and odour make up
the list of physical water quality parameters. Since most Groundwater is colourless,
odourless, and without specific taste, concern is typically with regard to its chemical
and biological qualities. Natural groundwater contains various ions. These ions
slowly dissolve from soil particles and rocks as the water travels along mineral
surfaces in the pores or fractures of the unsaturated zone and the aquifer. They are
referred to as dissolved solids. Some dissolved solids may have originated in the
precipitation or from seepage from the river water.
Groundwater and surface water are intimately related. During dry periods,
the groundwater contribution may be the total discharge of the stream, whereas
ISSN NO: 1021-9056
http://infokara.com/991
INFOKARA RESEARCH
Volume 8 Issue 12 2019

during wet periods, the groundwater contribution may be insignificant. However, in
places where the water table has been lowered, the reverse is true, that is, water
leaks from the streams into the ground, particularly in some undermined areas.
Hence, the geologic framework between groundwater and surface water the
occurrence of water and its movement through the rock are important.
Todd et al., (1984) demonstrated local permeability impairment as a function
of injected particles size and rock properties. They pointed out that initial
permeability or pore size is not simple criteria for explaining the degree of damage
to the cores. As gravity is the dominant driving force in groundwater movement,
water flows from places of higher head to lower head. Under natural conditions,
groundwater flows generally from topographically high places to low places
(Cedergren, 1977).While non-availability of water is one side of the problem, the
deteriorating quality of existing water resources is the other side, causing great
concern. The quality of water is of vital concern for mankind, since it is directly
linked with human welfare. It is generally recognized that the quality of
groundwater in an area is as important as the quantity. Groundwater quality data
provides important clues to the geologic history of rocks and indications of
groundwater recharge, discharge, movement and storage (Walton, 1970).
Quality of water is the function of its physical, chemical, biological and
geological parameters (Bhargava and Killender, 1988), which depend upon the
soluble products of weathering and decomposition and the related changes that
occur with respect to time and space (Raghunath, 1987). The cation and anion
concentration depends upon the solubility of the minerals present in the formation
and the time duration of water in contact with the rocks and the amount of dissolved
CO2 present in the water (Viessman et al., 1989).
Studies on the geochemical processes that control groundwater chemical
composition in and around the river course may lead to improved understanding of
ISSN NO: 1021-9056
http://infokara.com/992
INFOKARA RESEARCH
Volume 8 Issue 12 2019

hydrogeochemical systems in such areas. Such studies contribute to effective
management and utilization of the groundwater resources. Exploitation of
groundwater has been increased manifold level particularly for drinking and
agricultural purpose. Poor quality of water adversely affects the plant growth and
human health. Urban rivers have been associated with water quality problems and
the practice of discharging untreated domestic and industrial waste into the water
course has emerged. The problems are associated with the quantity, quality and
temporal distribution of the waste produced effected by different sources and is
aggravated further by routing these directly into the catchment areas of the river.
Various authors studied on the groundwater quality in different parts of the country
with respect to drinking and irrigation purposes (Majumdar and Gupta, 2000;
Sreedevi, 2004; . The chemical alteration of the Groundwater depends on several
factors such as interaction with solid phases, residence time of Groundwater,
seepage of polluted river water, mixing of groundwater with pockets of saline water
and anthropogenic impacts. The water resource and Groundwater reserves have
been contaminated by biological, organic and inorganic wastes . Chennai city
groundwater quality has resulted in saline groundwater nearly 10 km inland of the
sea and similar problems can be found in populated coastal areas around the world
(UNEP, 1996). GIS technology has previously facilitated laborious procedures
(Shamsi, 2005; Assaf et al., 2008;). During the past two decades, various researches
have reported its application in Groundwater modeling and quality assessment.
Balakrishnan et al., (2011) demonstrated spatial variations in Groundwater quality
using GIS and Groundwater quality information maps of the entire polluted area in
India. Assessment of Groundwater quality through spatial distribution mapping for
various pollutants utilizing GIS technology and the resulted information on quality
of water could be useful for policy makers to take remedial measures (Nageswara
Rao et al., 2007; Pradhan et al., 2001; Swarna Latha et al., 2007). In the present work
ISSN NO: 1021-9056
http://infokara.com/993
INFOKARA RESEARCH
Volume 8 Issue 12 2019

involves Groundwater quality assessment of saline water intrusion using Geospatial
techniques in the Ramanathapuram district.
The chemical alteration of the rain water depends on several factors such as
soil-water interaction, dissolution of mineral species and anthropogenic activities
(Umar and Ahmed, 2007). The study of relatively large number of groundwater
samples from a given area offers clues to various chemical alterations which the
meteoric groundwater undergoes, before acquiring distinct chemical characteristics.
Knowledge on hydrochemistry is important to assess the quality of groundwater for
understanding its suitability for domestic, irrigation and industrial needs. Various
researchers carried out studies on the hydrogeochemical characteristics of
groundwater and quality of groundwater in different basins as well as in urban
areas (Raju et al. 2007). Further, recent advances in analytical methods have led to
the determination of toxic trace elements which can have an impact on human
health.
2. Study area
The Ramanathapuram District is divided into two municipalities, which is
further subdivided into 7 talks with 429 Panchayats, which includes 400 revenue
villages and 236 hamlet villages. The base map of the study area will be prepared
from Survey of India (SOI) Toposheet maps Nos. 58 N/11 (1971), 13,14 &15 (1970) on
1:50,000 scale. Ramanathapuram is one of the coastal district bounded on the north
by Sivagangai and Pudukottai districts, on the east and south by the Bay of Bengal,
and on the west by Thoothukudi and Virudhunagar districts. The district
headquarters is located at Ramanathapuram. The district lies between 9o 05’ and 9o
50’ North Latitude and 78o 10’ and 79o 27’ East Longitude. The general geographical
information of the district is simple and flat. The Vaigai River and Gundar River are
flowing in the district and they will be dry during the summer season. The coastline
of Tamilnadu has been along the eastern shore of Bay of Bengal. The coast has one
ISSN NO: 1021-9056
http://infokara.com/994
INFOKARA RESEARCH
Volume 8 Issue 12 2019

major and ten minor ports in their coastal belt. It is one of the most indented coasts
with numerous river mouths, lagoons, bays, creeks, cliffs, spits sand dunes and long
beaches. Sea erosion, migration of river mouths, siltation of ports and harbours are
the prominent problems along this coast. Eight rivers drain into the Bay of Bengal.
The location map of the Ramanathapuram district shown in Fig.1.
Fig.1.Location map of the Ramanathapuram District
3. Geological Setting
Geological setting comprises mainly of coastal sands of quaternary and recent
ages. Sub-recent marine formations consisting of hard calcareous sandstone and grey
calcareous clay are seen on Rameswaram Island and other islands. The sub-recent
calcareous sandstone forms the basement rock for the present-day coral reefs
growing in the Gulf of Mannar, fringing Rameswaram Island and another group of
islands. A major part of the district is covered with the fluvial, fuvio-marine, Aeolian
ISSN NO: 1021-9056
http://infokara.com/995
INFOKARA RESEARCH
Volume 8 Issue 12 2019

and marine sediments of Quaternary age. The fluvial deposits, which are made up
of sand, silt and clay in varying degree of admixture occur along the active channels
of Vaigai, Gundar, Manimuthar and Pambar rivers. They have been categorised into
the levee, flood basin, channel bar/ point bar and paleo-channel deposits. The paleo
channel deposits comprise brown coloured, fine to medium sands with well
preserved cross beddings. The geological map of the study area is shown in Fig.2.
Fig.2. Geology Map of the Ramanathapuram District
4. Geomorphology
Ramanathapuram district has a long coastline of around 260 km. The coastal
areas are flanked by beach ridge complex-sand dunes, swales, swamps and
backwater. The sand flat is another feature of the coast comprising of clays and silts,
often flooded by seawater and encrusted with salt. Other features are the shallow
pediment plain of Kamudhi, parts of Paramakudi and Tiruvadanai taluks with the
thin layer of soil covered over with weathered hornblende gneiss, laterite and the
buried pediments (CGWB 2009). A major part of the district is a gently sloping plain
ISSN NO: 1021-9056
http://infokara.com/996
INFOKARA RESEARCH
Volume 8 Issue 12 2019

except for remnant hills in the western area. Recent Quaternary studies have
brought out various erosional and depositional landforms of fluvial and marine
regimes. The fluvial landforms comprise flood plains of Vaigai, Varshalei, Pambar,
Kottakkarai and Gunnar rivers. The marine landforms comprise sand mounds
(Teri’s) and barrier dunes along the present coast. The erosional processes are
manifested in the form of pediments and pedipalain around Kamuthi. Geo-
hydrologically, the district has been divided into three zones with reference to
laterite, flood basin and coastal plain areas respectively. Further, the area is
demarcated into Manimuthar Pambar basin, Vaigai delta and Vaipar-Gundar basin.
The geomorphological map of the study area is shown in Fig.3.
Fig.3. Geomorphology map of the Ramanathapuram District
5. Soils
The soils of Ramanathapuram District can be assorted into the main types
viz., clay, coastal alluvium, sandy loam, alluvium, sandy and red soil clay, black
cotton soil is believed to have been derived from the Archaen gneisses where
calcareous formation are abundant. Calcium carbonate concretions of various sizes
ISSN NO: 1021-9056
http://infokara.com/997
INFOKARA RESEARCH
Volume 8 Issue 12 2019

and shapes are present in majority of the black soil area and this affects the fertility
of the soils. Black soil, as a whole constituted about 46 per cent of the total soil. River
alluvium includes alternate layers of sand and clay for a huge thickness. River
alluvium occurs in areas bordering the Vaigai River. Coastal alluvium occurs in
Kadaladi, R.S.Mangalam, Mandapam, Ramanathapuram, Thiruppullani and
Thiruvadanai blocks. There are vast stretches of saline and alkaline soils found in the
coastal blocks. Rameswaram Island contains mainly sandy soil. The fertility status of
soil showed that nitrogen status of soil is low in all blocks and phosphorus status of
soil is also low in all blocks except Thiruppullani, Kamudhi and Kadaladi where it is
medium. The potash content of soil is high in all the blocks. The mineral resources of
the soil include gypsum, limestone and magnesium. While Mudukulathur and
Keelakarai regions account for sizable deposits of gypsum. Rameswaram Island
contains large quantities of limestone deposits. The North western part of the
Ramanathapuram district exposes isolated patches of Archaeans crystallines and
Cuddalore Sandstone is capped by laterite/lateritic soil.
6. Experimental design, materials and methods
6.1 Materials and methods
The coastline of Tamilnadu has been along the eastern shore of Arabian Sea.
The coast has one major and ten minor ports in their coastal belt. It is one of the most
indented coasts with numerous river mouths, lagoons, bays, creeks, cliffs, spits sand
dunes and long beaches. Sea erosion, migration of river mouths, siltation of ports
and harbours are the prominent problems along this coast. Along the
Ramanathapuram district 39 groundwater samples were collected in pre-monsoon
(2017). Samples were collected in polyethylene bottles measured physicolagical
character on the spot. These bottles had been rinsed with distilled water before
sampling. These samples were collected from digging wells farmers used in
agricultural activities. The samples were adequately labeled and preserved in the
refrigerator until they were taken to the laboratory for measurement. Samples were
analyzed in the laboratory for the major ions. As the aquifer salinity ionic exchange
ISSN NO: 1021-9056
http://infokara.com/998
INFOKARA RESEARCH
Volume 8 Issue 12 2019

ratio is measured through major cations and anions percentage. Sampling,
preservation and analysis of water samples were carried out following the method
recommended APHA (2005). The pH and EC were measured using pH and EC
meters.
7. Mixing of Fresh and saline water
Groundwater quality monitoring has been carried out by establishing 39
observation wells for pre monsoon of 2017 for providing input to the integrated data
interpretation. The data presented shows that pre monsoon values of most
parameters elevated concentration. Most of groundwater samples indicated a
slightly alkaline nature with pH varying from 7.5 to 8.8. Elevated TDS concentration
levels noticed around Rameswaram, Thondi, Devipattinam, Keelakari, Ervadi,
Upoor, Thiruvettriyur, Vallinokam and Sayalkudi villages. High values of sodium
are also reported in the samples. Further, all the groundwater samples indicated
chloride concentration exceeding permissible limits. High TDS, sodium, and chloride
contents can be attributed to the possible seawater intrusion in the area. High
concentration of TDS, sodium, and chloride have been observed majority of the
coastal locations. The elevated concentration of TDS, sodium, and chloride in
samples mentioned above indicates brackishness of the groundwater.
The physical and chemical parameters of the analytical results of
groundwater were compared with the standard recommendation values stated by
the World Health Organization for drinking and public health standards. The table
shows the most samples not coming under suitable limits of drinking purposes.
Several water quality indicators have been proposed in the literature to identify
groundwater that has been impacted Chachadi, A.G. (2005), Chowdhury, A., Madan,
K., and Jha, C.V.M. (2010). Lobo, J.P., Ferreira and Chachadi, A.G. (2005). However,
in some regions the natural chemical evolution of the groundwater system can make
it challenging to apply these indicators, for example, due to cation exchange
processes that raise the relative concentration of sodium compared to calcium Saaty,
T.L. (1987). The drinking water standards are observed below 13 to 18 feet below
ground level in the coastal stretch. The geochemical parameters during pre monsoon
2017 periods for 39 wells were presented in Table.1.
ISSN NO: 1021-9056
http://infokara.com/999
INFOKARA RESEARCH
Volume 8 Issue 12 2019

Table.1.Water Sample location in Ramanathapuram district villages in the pre-monsoon 2017
Loc.No Name of the Location Ph EC TDS Ca Mg Cl TH Na K SO4 CO3 HCO3 NO3
1 Ramanathapuram 8.1 1390 907 24 15.795 167 125 248 29 47 6 170.8 4
2 Uthirakosamangai 8.4 8630 4927 140 315.9 2552 1650 1265 164 48 2.6 137.3 4
3 Chitharakottai 8.2 560 307 6 25.515 82 120 71 8 46 2.5 107.3 4
4 Mandapam 8.2 1010 576 26 43.74 163 245 122 10 864 0 408.7 14
5 Idayarvalasai 8 920 517 10 47.385 128 220 106 19 384 0 823.5 22
6 Keelakarai 8.4 5900 3630 80 43.74 1276 380 1196 26 377 6 329.4 7
7 Ragunathapuram 8.2 880 489 26 46.17 96 255 85 15 175 18 689.3 16
8 Valantaravai 8 1650 1151 20 34.02 262 190 239 113 526 30 1024.8 15
9 Ponnalikopttai 7.8 600 327 36 29.16 57 210 39 4 81 12 616.1 6
10 Pondampuli 8.2 520 292 16 15.795 18 105 64 16 144 6 603.9 5
11 Thirupullani 8 5420 3162 80 140.94 1418 780 782 160 686 0 481.9 12
12 Mudukulathur 8 2240 1307 20 31.59 440 180 428 9 516 6 823.5 5
13 Manjur 8.1 1260 720 46 21.87 60 205 207 4 99 18 573.4 14
14 Parthibanur 9 10300 6133 180 60.75 2765 700 2070 14 69 18 256.2 22
15 Kilaramanadhi 8.3 7000 4096 200 376.65 1843 2050 644 176 912 0 298.9 14
16 Kiliyur 7.8 6450 3709 160 145.8 1914 1000 1058 21 302 18 353.8 11
17 Kadambakkudi 8.2 440 221 18 37.665 46 200 7 5 576 18 1043.1 112
18 Thirutheravalai 8 1360 763 18 37.665 291 200 219 14 3816 0 134.2 76
19 Ariyakudi 8.4 19530 11427 1000 194.4 6027 3300 2990 12 40 12 305 7
20 Sadurvedamangalam 8.2 19400 11304 800 243 5672 3000 3220 9 14 5.5 294.4 3
21 Kamutnakudi 8.2 440 221 18 37.665 46 200 7 5 37 2.1 137.9 3
22 Pambur 8.6 4120 2355 84 58.32 950 450 736 19 29 2.9 152 5
23 Veeravanur 8.1 1020 617 18 7.29 117 75 200 6 30 2.1 112.8 6
24 Chittrakkottai 8.2 560 307 6 25.515 82 120 71 8 24 8.4 141.3 4
25 Keelakarai (TP) 8.4 5900 3630 80 43.74 1276 380 1196 26 75 18 555.1 4
26 Panaydiyendal 8.2 6600 4072 64 184.68 1276 920 1035 168 71 3.5 236.4 2
27 Sikkal 8.1 900 491 26 38.88 170 225 99 13 49 0 372.1 4
28 Sayalgudi (TP) 8.5 2610 1495 52 106.92 567 570 322 47 180 6 219.6 3
29 Kamuthi (TP) 8.2 540 286 28 41.31 74 240 13 7 47 5.8 194.1 5
30 Merkkukottagudi 8.1 520 303 16 15.795 53 105 64 18 25 5.5 184.4 4
31 Thimmanathapuram 8.2 540 286 28 41.31 74 240 13 7 576 18 762.5 55
32 S.Tharaikudi 7.3 1180 667 38 147.015 131 700 166 32 26 8.1 216.7 5
33 Narippaiyur 8.2 1480 922 20 88.695 230 415 145 36 35 0 292.8 1
34 Mookkaiyur 8.4 2560 1496 76 51.03 567 400 396 35 324 0 786.9 82
35 Ervadi 8.4 3250 1938 64 174.96 496 880 313 82 141 18 378.2 22
36 Thaliyanendal 8.7 1360 769 12 31.59 184 160 244 3 72 0 292.8 5
37 Vellamarichchukkatti 8 2550 1564 48 68.04 425 400 327 149 312 12 323.3 11
38 Valantaravai 8 1650 1151 20 34.02 262 190 239 113 106 12 597.8 11
39 Pirappanvalasai 8.2 710 396 76 4.86 43 210 64 9 442 12 378.2 8
ISSN NO: 1021-9056
http://infokara.com/1000
INFOKARA RESEARCH
Volume 8 Issue 12 2019

The geochemical variation in the ionic concentrations in the groundwater can
be easily understood by the plot of scatter diagrams (Fig.4,a,b,c,d,e,f) for the various
ions and their affinities. The scatter plot of Na+ + K+ versus Cl- ions, analyzed in the
ground water samples during 2017. Fig.4.showed that most of the water sample
values were fall above the equiline concentration line indicating additional source of
Na+ and K+ from weathering of silicate minerals. These scatter plot suggested that
the majority of the alkali metal ions were balanced by the chloride ions. Further,
Chloride ions could normally tend to prefer for association with alkali rather than
alkaline earth metal (Ca2+& Mg2+) in the formation of alkali chlorides.
Extra points above the scatter plot inferred that alkalis may also be associated
with carbonate and sulphate ions as alkali bicarbonate and alkali sulphates. Among
the alkalis, Na+ ion was a dominant, K+ ion in groundwater, due to chemical
weathering / dissolution of minerals of local sedimentary rocks. The plots of Ca2+ +
Mg2+ vs total cations and Na+ + K+ vs total cations, in mostly all the sample points,
lie below the theoretical line indicated that alkalis (Na+& K+) were more enriched
two to three times than the amount of Ca2+ and Mg2+ (alkaline) due to leaching from
silicate weathering in the aquifer materials of the study area. Scatter plots suggested
that dissolution of evaporation minerals occurred in source cations via silicate
weathering and /or soil salts were found to be more significant. Furthermore,
silicate weathering can also be understood by estimating the ratio between Na++ K+
and total cations. The relationships between Na+ + K+ and total cations in the study
area indicated that, the majority of the samples were plotted near the Na+ + K+ = TC+
line, indicating the involvement of silicate weathering in the geochemical processes,
which contributes mainly sodium and potassium ions in the groundwater.
ISSN NO: 1021-9056
http://infokara.com/1001
INFOKARA RESEARCH
Volume 8 Issue 12 2019

a. Na+K vs Cl diagram suggest that silicate weathering
b. Ca+Mg vs TC+diagram shows that carbonate in the study area.
c. Na+K vs TC+ diagram shows that above 50 percent of Na and K come from silicate weathering
d. (HCO3+SO4) vs TA-diagram of the
study area.
e. Cl vs TA-diagram of the study area f. Na vs Cl diagram suggesting that dissolution, it may be derived from silicate weathering.
Fig.4. Plot of scatter diagram shows geochemical variation in the ionic
concentrations in the groundwater
ISSN NO: 1021-9056
http://infokara.com/1002
INFOKARA RESEARCH
Volume 8 Issue 12 2019

8. Reverse ion exchange study
Generally, Na+ / Cl- ratio indicated that an ion exchange reaction occurs and
typically interpreted as Na+ ions released from a silicate weathering reaction.
Moreover, a high positive correlation between Na+ and Cl- suggested that the
ground water salinity reported which may be due to intermixing of two or more
ground water bodies with the different hydrogeochemical compositions. In the
present study, the molar ratio of Na+ / Cl- for ground water samples confirms that
the ion exchange was found to be the major process along with silicate weathering.
EC versus Na+ / Cl-diagram is shown in Fig.5.g,h,i. In this study area, evaporation
may be the major geochemical process controlling the chemistry of groundwater.
The plot (Ca2+ + Mg2+) vs (HCO3- + SO42-) showed the values to fall scatter to
the equiline, confirm dissolution of cations and anions. Chemical reactions occurred
through ion exchange tend to shift the points to the right of the equiline due to an
excess of HCO3 + SO42) If there is a large excess of Ca2+ + Mg2+over that of HCO3 +
SO42- then the points will be shifted to the left side of the equiline, due to the
occurrence of reverse ion exchange reactions showing that they spread above and
below the linear trend. An ion exchange process is characterized by HCO3 + SO42-
excess over Ca2+ + Mg2+ while the reverse ion exchange is marked by Ca2+ + Mg2+
excess over HCO3 + SO42- For instance, the inequality (Ca2+ + Mg2+) / (HCO3 +
SO42-) > 1, in saline ground water indicates a reverse ion exchange process.
The relationship between (Ca2+ + Mg2+) - (HCO3 + SO42-) vs Na+- Cl- showed
a negative linear trend with a slope of unity, considering the participation of cations
and anions in the ion exchange reaction. The plots of (Ca2+ + Mg2+) - (HCO3 + SO42-)
Vs Na+- Cl- shows a slope value, respectively, which is nearly equal to -1 indicating
that Ca2+, Mg2+ and Na+ ion concentration are interrelated through reverse ion
exchange. Simple linear regression models were constructed to evaluate the
relationship of hydro geochemical constituents to each other. For this analysis, Cl,
TC+, TA- , EC, HCO3 + SO4, andNa-Cl were used as independent variables and
Na+K, Ca+Mg, HCO3+SO4, Na/ Cl, (Ca + Mg) - (HCO3 + SO4), Na, and Cl were
ISSN NO: 1021-9056
http://infokara.com/1003
INFOKARA RESEARCH
Volume 8 Issue 12 2019

used as dependent variables. The linear regression model’s positive relationship of
cations and anions shown in Table.2.
g.Na / Cl vs EC diagram h. (Ca + Mg) vs (HCO3 + SO4) diagram
i.(Ca + Mg) - (HCO3 + SO4) vs Na - Cl diagram
Fig.5. Plot of the scatter diagram shows that minus sign indicates geochemical variation in reverse ionic concentrations in the groundwater
All regression models revealed positive relationships with correlation
coefficients ranging between 0.9929 and 0.0494 except for one model that showed a
strong negative slope with R2 of -0.9497. The regression analysis revealed that there
was a strong positive relationship between Total Anions (TA-) and Chloride (Cl-)
with the R2 of 0.9929, implying that increasing TA is directly proportional to the
increase in Cl. The next highest positive relationship was seen between TC+ and
Na+K with the R2 of 0.9722 indicating strong contribution of Na+K to total amount
of dissolved solids in water.
ISSN NO: 1021-9056
http://infokara.com/1004
INFOKARA RESEARCH
Volume 8 Issue 12 2019

Table.2.Positive relationship of cations and anions
S.No X Y R2
1 Cl Na+K 0.9485
2 TC+ Ca+Mg 0.8586
3 TC+ Na+K 0.9722
4 TA- HCO3+SO4 0.822
5 TA- Cl 0.9929
6 Cl Na 0.9464
7 EC Na/ Cl 0.0494
8 HCO3 + SO4 Ca+Mg 0.6087
9 Na-Cl (Ca + Mg) -
(HCO3 + SO4) -0.9497
A model constructed between Na-Cl and (Ca + Mg) - (HCO3 + SO4)
compounds showed the R2 value of -0.9497 as the third highest correlation coefficient
in which the minus sign indicates negative slope meaning that with increasing Na-
Cl, there was a decrease in the (Ca + Mg) - (HCO3 + SO4) compounds. A model using
Cl versus Na+K measured R2 of 0.9485 as the fourth highest correlation coefficient.
The fifth highest positive relationship was encountered between Cl and Na with the
R2 value of 0.9464, probably indicating the association of Na and Cl in the form of
sodium chloride mineral in the water. From R2 value 0.8586 of a model using TC and
Ca+Mg variables, it is obvious that the proportion of total cations is closely related to
the Ca and Mg constituents. A model relating TA- to HCO3+SO4 achieved R2 of
0.822. A model using HCO3 + SO4 against Ca+Mg showed a moderate degree of
positive relationship between the variables with the R2 of 0.6087. of all the simple
regression models, a model using EC against the ratio of Na to Cl measured a very
low R2 of 0.0494 showing a weaker relationship between the two variables.
9. Chloro-Alkaline Indices
It is essential to know the changes in chemical composition of groundwater
during its travel in the subsurface. CAI (1) and CAI (2) indicating the ion exchange
ISSN NO: 1021-9056
http://infokara.com/1005
INFOKARA RESEARCH
Volume 8 Issue 12 2019

between the groundwater and its host environment shown in Fig.6 and Fig.7. The
chloro-alkaline indexes were used in the evaluation of Base Exchange reactions and
calculated by using the following equations.
CAI (1) = (Cl-) - (Na++K+)/(Cl-)……………………………………..(1)
CAI (2) = (Cl-) - (Na++K+)/(SO42-+HCO32-+CO32-+ NO3-)……….(2)
CAI (1) and CAI (2) can be either positive or negative depending on whether
exchange of Na+ and k+ in water with Mg+ and Ca+ in rock /soil or vice versa. If
Na+ and K+ are exchanged with water with Mg+ and Ca+ , the value of the ratio will
be positive, indicating a base exchange reaction phenomenon. The negative value of
these ratios will be indicating chloro alkaline disequilibrium as a cation-anion
exchange reaction. From equation (1) and (2) is found that 99 % have negative
choloro alkaline index values Saaty, T.L., and Vargas, L.G. (2000).
Fig.6. Trend diagram shows that chloro Alkaline Index value -1 (CAI-1).
ISSN NO: 1021-9056
http://infokara.com/1006
INFOKARA RESEARCH
Volume 8 Issue 12 2019

Fig.7. Trend diagram shows that chloro Alkaline Index values -2 (CAI-2).
10. Sea Water Intrusion Study
Using the WHO standards for the drinking uses the classes were categorized.
The erratic behavior of groundwater geochemical elements was sorted. It shows that
in the study area, Calcium, Chloride, Magnesium, Total Dissolved Solids (TDS),
Sulphate, Total hardness and EC were observed in not potable limit. To find out the
spatial distribution of these elements in the study area, GIS was employed. The
potability and not potablity sample locations noticed in Table.3.
Table.3.The Result of Water Quality (SWI)
Sr.
No. Potability Nature Well Locations
1 Acceptable 3,5,6,7,8,9,10,17,18,21,24,27,29,30,31,
38 and 39
2 Allowable 1,4,12,20,31,32,33,35 and 36
3 Not potable (SWI) 2,11,13,14,15,16,19,22,23,25,26,28,34
and 37
The geochemical locations were digitized and the corresponding values of its
attributes were given as an input. Using this data, the interpolation raster maps were
ISSN NO: 1021-9056
http://infokara.com/1007
INFOKARA RESEARCH
Volume 8 Issue 12 2019
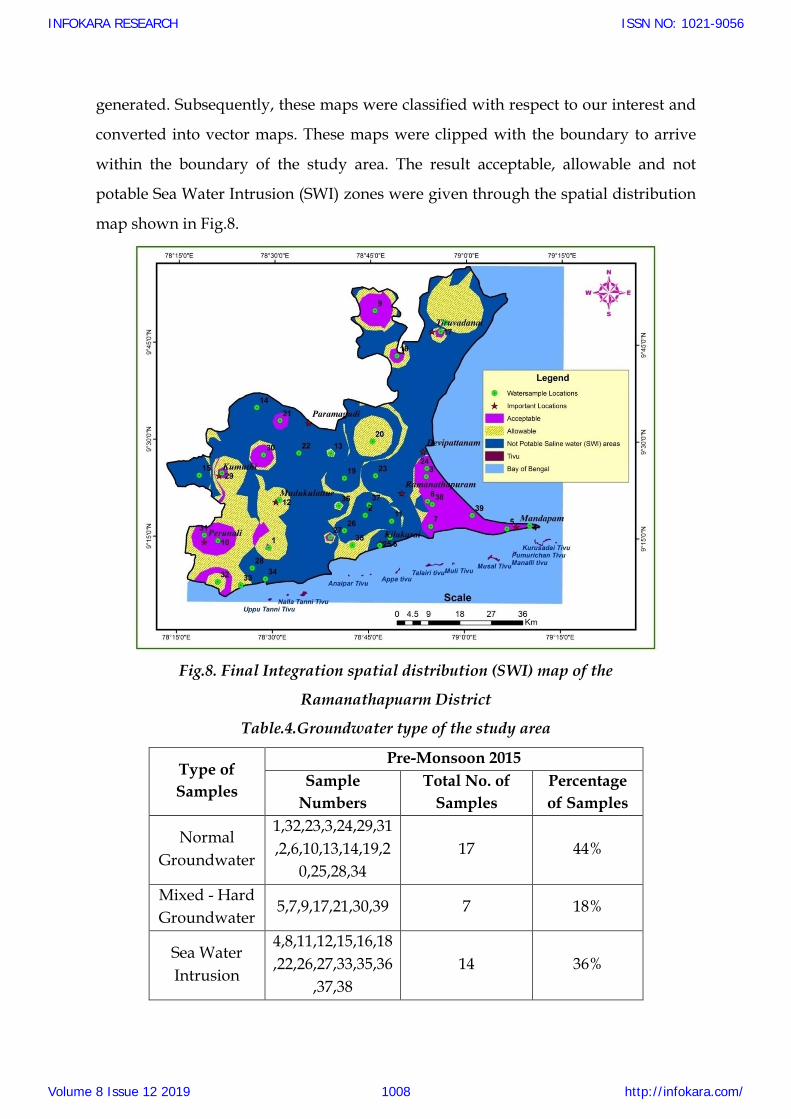
generated. Subsequently, these maps were classified with respect to our interest and
converted into vector maps. These maps were clipped with the boundary to arrive
within the boundary of the study area. The result acceptable, allowable and not
potable Sea Water Intrusion (SWI) zones were given through the spatial distribution
map shown in Fig.8.
Fig.8. Final Integration spatial distribution (SWI) map of the
Ramanathapuarm District
Table.4.Groundwater type of the study area
Type of
Samples
Pre-Monsoon 2015
Sample
Numbers
Total No. of
Samples
Percentage
of Samples
Normal
Groundwater
1,32,23,3,24,29,31
,2,6,10,13,14,19,2
0,25,28,34
17 44%
Mixed - Hard
Groundwater 5,7,9,17,21,30,39 7 18%
Sea Water
Intrusion
4,8,11,12,15,16,18
,22,26,27,33,35,36
,37,38
14 36%
ISSN NO: 1021-9056
http://infokara.com/1008
INFOKARA RESEARCH
Volume 8 Issue 12 2019

11. Chloride vs. Electrical Conductivity Diagram
Plot of chloride vs. electrical conductivity showing normal groundwater
conditions, saltwater intrusion and mixing (Hard groundwater) between the fresh
and salt water intrusion Washington State Department.
Fig.9. Chloride vs. Electrical Conductivity Diagram of the Ramanathapuarm
District
Totally 34% of the coastal area coming under normal groundwater, 14% of the
groundwater samples are coming under mixed type and 28% of the groundwater
samples are coming under sea water intrusion type. The Chloride vs Electrical
Conductivity diagram shown in Fig.9. Groundwater type are shown Table.4.
12. Graphical Projection of Hydrogeochemical Data
12.1 Piper’s Trilinear Diagram
Piper's diagrams, also called trilinear diagrams are drawn by plotting the
proportions (in equivalents) of the major cations ((Ca2+, Mg2+, (Na++K+)) on one
triangular diagram, the proportions of the major anions (Alkalinity (CO3+HCO3), Cl,
SO4) on another, and combining the information from the two triangles on a
quadrilateral. The position of this plotting indicates the relative composition of a
ISSN NO: 1021-9056
http://infokara.com/1009
INFOKARA RESEARCH
Volume 8 Issue 12 2019

groundwater in terms of the cation anion pairs that correspond to four vertices of the
field. The main drawback that Piper’s trilinear diagrams have in their plotting shows
the chemical character of the groundwater according to the relative concentration of
its constituents, but not according to the absolute concentrations.On the basis of
chemical analysis, groundwater is divided into six facies. The plot shows that the
groundwater samples fall in the field of Na Cl, Mg Cl, Mg HCO3, Na HCO3 and Ca
HCO3 respectively, according to the order of their dominance. From the plot, it is
observed that 51 % of samples fall in Sodium-Chloride type. Groundwater chemical
evolution where the water rock interaction processes are considered important in the
definition of their magnesium-bicarbonate type 31% and (Mg,Na,Ca and Bi-
Carbonate) cumulativly 18% of samples observed in the fields. From the Piper
diagram dispersion of cation and anions could be associated either to lithological
heterogeneities or whichever with human activities in the Ramanathapuram district.
The Piper's diagrams trilinear plot and its output are given in the Table.5. and Fig.10.
Fig.10.Piper’s Trilinear Diagram of the Ramanathapuarm District
ISSN NO: 1021-9056
http://infokara.com/1010
INFOKARA RESEARCH
Volume 8 Issue 12 2019

Table.5. Hydrogeochemical facies of groundwater
Facies
Pre-Monsoon 2017
Sample Numbers Total No. of
Samples
Percentage of
Samples
Na Cl
1,2,6,8,11,12,14,16,
18,19,20,22,23,25,2
6,30,34,36,37,38
20 51%
Mg Cl 3,4,5,7,15,24,27,28,
29,31,33,35 12 30%
Mg HCO3 9,17,21,32 4 10%
Na HCO3 10,13 2 5%
Ca HCO3 39 1 3%
Traditional Piper plots (Steinich et al., 1998; Appelo and Postma, 2005) can be
used to plot the relative concentrations of the major ions on ternary diagrams.
Finally, site-specific approaches can be used. For example, an approach specific to
the situation where cation exchange (Ca to Na) dominates the chemical evolution
involves plotting depth relative to sea level verses TDS, classified according to water
type (represented as zones) (Allen and Liteanu, 2006). Zone 1 is characterized by
waters that have a high TDS concentration due to direct salinization (mixing
between fresh groundwater Ca-HCO3 and sea water Na-Cl). Zone 2 is characterized
by waters with TDS values that do not increase with depth, or that just slightly
increase. These waters reflect a cation exchange process (Ca to Na) whereby no
increase in salinity is observed. The water types in Zone 2 vary from Ca-HCO3 to
Na-HCO3, with Na a rich waters generally found at greater depths. Finally, Zone 3
represents waters that are mixed (between Zone 2 waters and a saline end member).
These waters show variable cation composition (Ca or Na), but with increasing Cl
concentration .
ISSN NO: 1021-9056
http://infokara.com/1011
INFOKARA RESEARCH
Volume 8 Issue 12 2019

12.2. Gibb’s Plot
Various workers have discussed the mechanisms controlling the chemical
compositions of water. It’s well established that there is a close relationship between
water composition and aquifer lithology. Gibbs plot distinguishes the interactions of
groundwater due to precipitation or rock or evaporation, which helps to understand
the factors that controlling the chemistry of groundwater, from a ratio of 1.
Na+K/Na+Ca+K and TDS and 2. Cl/Cl+HCO3 and TDS. It is found that the
majority of the samples suggests interactions between rock and evaporation
dominance. Gibb's plot and its output are given in the Fig.11. and Table.6.
Fig.11.Gibb’s diagram of the Ramanathapuarm District
ISSN NO: 1021-9056
http://infokara.com/1012
INFOKARA RESEARCH
Volume 8 Issue 12 2019

Table.6. Results of Gibbs Diagram Interpretation
Field
Cations ((Na + K) / (Na + K +
Ca))
Percentage of Cations
Anions Cl / (Cl +
HCO3)
Percentage of Anions
Pre-monsoon 2017
Pre-monsoon
2017
Pre-monsoon 2017
Pre-monsoon
2017
Evaporation crystallization dominance
1,2,6,8,12,14,15, 16,18,
21,22,25,26,28, 33,34,35,36,37,38
49
2,6,8,11,14,15,16,19,20,
22,25,26,28,34,35,38
42
Rock dominance
3,4,5,7,9,10,11,13,17,19,20,23,24,27,29
,30,31,32,39 51
1,3,4,5,7,9,10,12,13,17,18,21,23,24,27,29,30,31,32,33,36,37,3
9
58
Precipitation dominance
-
-
13. Conclusion
The groundwater samples of the Ramanathapuram district have been found
with more salinity, TDS, calcium hardness, total alkalinity and chloride in majority
of the samples beyond the drinking level standards of WHO. Chloride contends
greater input in coastal track compare to mainland samples. Saltwater intrusion into
the mainland and coastal aquifers causing injurious and high contamination samples
was noticed 3km perpendicular and away from the coast. As the aquifers salinity
ionic exchange is mainly cations dominated over anions. From the sea water
intrusion plot clearly represent fresh, mixed and sea water intruded areas, treatment
techniques such as water softening, desalination may solve the existing water quality
parametric complications. The hydrogeochemical analysis has been proved majority
of the villages can serve as an indicate for salt water intrusion. The
hydrogeochemical analysis reveals that the groundwater of the study area is sodium
type and Chloride type. The hydrogeochemical facies infer pre monsoon 2017
majority of the samples fall Na, Cl type remaining samples mixed Cl+SO4+HCO3,
Cl+SO4 and Na+K type. Spatial analysis of various quality parameters using in
Geospatial techniques was found to be efficient. Thematic maps generated in the
ISSN NO: 1021-9056
http://infokara.com/1013
INFOKARA RESEARCH
Volume 8 Issue 12 2019

study will be helpful to planners and policy makers, especially on public health and
irrigation departments, for sustainable water management in a holistic way.
Hydrogeochemical mixing of water and ionic exchange relationship along the coast
of Ramanathapuram district 34% of the samples coming under normal groundwater,
14% of the groundwater samples are coming under mixed (Hard groundwater) type
and 28% of the groundwater samples very near the coast are coming under sea water
intrusion type. The analytical results have been utilizing the resources for planning
groundwater development the coastal areas and predict further contamination in
fresh water zone.
Acknowledgment
The authors are thankful to the University Grants Commission (UGC)
Division, Government of India, New Delhi for providing financial support for
sanction the UGC Post Doctoral Fellow award vide letter
Reference.F.No./PDFSS/2014-15-SC-TAM-9825 dated on 05.02.2015. The author
thankful to Professor and Head, Department of Geology, Periyar University, Salem
for their kind support during the field work and laboratory analysis.
References
Assaf, H. and Saadeh, M. Assessing Water Quality Management Options in the Upper Litani Basin, Lebanon, using an Integrated GIS-Based Decision Support System. Environmental Modeling and Software. 2008. 23 (10-11) 1327-1337.
Bahrgava, D.S. and Killender, D.J., (1988) The technology of water resources in
Industries. A rational approach. Jr. Ind. Wat. Works Assn., v.20(1), pp.107-112 Balakrishnan, P., Saleem, A. and Mallikarjun, N.D. Groundwater Quality Mapping
Using Geographic Information System (GIS): A Case Study of Gulbarga City, Karnataka, India. African Journal of Environmental Science and Technology. 2011. 5 (12) 1069-1084.
Cedergren, H.R., (1977) “Seepage, Drainage and Flow Nets”, John Wiley and Sons,
New York, 534p Chachadi, A.G. (2005). Seawater intrusion mapping using modified GALDIT
indicator model- case study in Goa. JalvigyanSameek 20:29–45
ISSN NO: 1021-9056
http://infokara.com/1014
INFOKARA RESEARCH
Volume 8 Issue 12 2019

Chowdhury, A., Madan, K., and Jha, C.V.M. (2010). Delineation of Groundwater
recharge zones and identification of artificial recharge sites in West Medinipur district using RS, GIS and MCDM techniques. Environ Earth Sci 59:1209–1222.
Davis S N and Dewiest R J M (1966) Hydrogeology. Wiley, New York. Eutech Instruments (1997) Conductivity to TDS conversion factors.
http://www.eutechinst.com/techtips/tech-tips40.htm Accessed: February 19, 2014.
Fetter C W (1990) Applied Hydrogeology. 2nd edn. Prentice Hall, Englewood Cliffs,
New Jersey Freeze, R.A & Cherry, J.A., (1979) Groundwater, Prentice – Hall, inc. Englewood
Cliffs, New Jersey,604P. Lobo, J.P., Ferreira and Chachadi, A.G. (2005). Assessing aquifer vulnerability to
saltwater intrusion using GALDIT method: Part 1 – Application to the portuguese aquifer to Monte Gordo, Proceedings of this 4thInterselticColloquim on Hydrol. Mangt. Water Resor., Portugal.1-12.
Majumdar, D. and Gupta, N. (2000) Nitrate Pollution of Groundwater and
Associated Human Health Disorders. Indian Journal of Environmental Health, 42, 28-39.
Mondal NC, Singh VP, Singh VS, Saxena VK (2010) Determining the interaction
between groundwater and saline water through groundwater major ions chemistry. J Hydro 25:100–111
Nageswara, Rao K., Narendra, K. and Venkateswarlu, P. Assessment of
Groundwater Quality in Mehadrigedda Watershed, Visakhapatnam District, Andhra Pradesh, India: GIS Approach. Pollution Research. 2007. 26 (3); 1526.
Pradhan, S.K., Dipika, P. and Rout, S.P. Water Quality Index for the Groundwater in
and Around a Phosphatic Fertilizer Plant. Indian Journal of Environmental Protection. 2001. 21; 355-358.
Raghunath, H.M., (1987) Groundwater, Wiley Eastern Ltd.New Delhi, India, pp.563. Raju N J, Ram P and Dey S (2007) Hydrogeochemical parameters for assessment of
groundwater quality in the upper Gunjanaeru River basin, Cuddapah district, Andhra Pradesh, south India. Environ Geol 52 1067-1074
Saaty, T.L. (1987). The Analytic Hierarchy Process: McGraw Hill.1-287.
ISSN NO: 1021-9056
http://infokara.com/1015
INFOKARA RESEARCH
Volume 8 Issue 12 2019

Saaty, T.L., and Vargas, L.G. (2000). Models, Methods, Concepts and Applications of the Analytic Hierarchy Process, Boston: Kluwer Academic Publishers.
Schoeller,H, (1967) Qualitative evaluation of Groundwater Resources (in methods
and techniques of Groundwater investigations and Development), water Resources Series,33, UNESCO,pp44-52
Shamsi, U.M., (2005) GIS Applications for Water, Wastewater, and Storm water
Systems. United States of America: Taylor & Francis. Sreedevi, P.D. (2004) Groundwater Quality of Pageru River Basin, Cuddapah
District, Andhra Pradesh. Journal of Geological Society of India, 64, 619-636. Swarna Latha, P., Nageswara Rao K., Ramesh Kumar, P.V. and Hari Krishna, M.
Water Quality Assessment at Village Level a Case Study. Indian Jour. Environ. Prot. 2007. 27 (11) 996-1000.
Todd, A.C., Somerville, J.E. and Graham, S. (1984) The Application of Depth of
Formation Damage Measurement in Predicting Water Injectivity Decline. Formation Damage Control Symposium, Bakersfield, California, February, SPE 12498.
Umar R and Ahmed I (2007) Hydrogeochemical characteristics of groundwater in
parts of Krishni-Yamuna Basin, Muzaffarnagar district, UP. Jour Geol Soc India 69 989- 995
United Nations Environment Programme (UNEP). Groundwater: a Threatened
Resource. 1996. UNEP Environment Library No.15, UNEP, Nairobi, Kenya. Viessman W, Knapp JW, Lewis GL (1989). Introduction to Hydrology, Harper and
Row Publishers, New York Walton, W. (1970) Groundwater Resource Evaluation. McGraw-Hill Series, 664 p. Washington State Department of Ecology (2005).Water Resource Inventory Area 06
Islands. Seawater Intrusion Topic Paper. Retieved From:https:// fortress. wa. gov
/ecy/publications /Summary Pages/1203271. WHO (1996) Guideline for drinking water quality, V.l, Recommendation. Geneva:
WHO, pp.1 - 4
ISSN NO: 1021-9056
http://infokara.com/1016
INFOKARA RESEARCH
Volume 8 Issue 12 2019


![Comparative Analysis Of Data Mining Algorithms In Wireless ...infokara.com › gallery › 13-oct-3013.pdf · alarm-based, network based, host-based [5]. System Intrusion rules establish](https://img.dokumen.tips/doc/110x75/5f255bfb9d3f5d554e5c80f8/comparative-analysis-of-data-mining-algorithms-in-wireless-a-gallery-a-13-oct-3013pdf.jpg)