Embed Size (px)
Citation preview

PNNL-23148
Prepared for the U.S. Department of Energy under Contract DE-AC05-76RL01830
Geochemical and Geomechanical Effects on Wellbore Cement Fractures: Data Information for Wellbore Reduced Order Model W Um HB Jung S Kabilan DM Suh CA Fernandez January 2014


PNNL-23148
Geochemical and Geomechanical Effects on Wellbore Cement Fractures: Data Information for Wellbore Reduced Order Model W Um HB Jung S Kabilan DM Suh CA Fernandez January 2014 Prepared for the U.S. Department of Energy under Contract DE-AC05-76RL01830 Pacific Northwest National Laboratory Richland, Washington 99352


iii
Summary
The primary objective of the National Risk Assessment Partnership (NRAP) program is to develop a defensible, generalized, and science-based methodology and platform for quantifying risk profiles at CO2 injection and storage sites. The methodology must incorporate and define the scientific basis for assessing residual risks associated with long-term stewardship and help guide site operational decision-making and risk management. Development of an integrated and risk-based protocol will help minimize uncertainty in the predicted long-term behavior of the CO2 storage site and thereby increase confidence in storage integrity. The risk profile concept has proven useful in conveying the qualitative evolution of risks for CO2 injection and storage site. However, qualitative risk profiles are not sufficient for specifying long-term liability for CO2 storage sites. Because there has been no science-based defensible and robust methodology developed for quantification of risk profiles for CO2 injection and storage, NRAP has been focused on developing a science-based methodology for quantifying risk profiles for various risk proxies.
Development of a site-specific risk profile comprises the development and application of a system-level methodology for quantitative probabilistic risk assessment that is based on integrated assessment models (IAMs). These IAMs will consist of reduced order models (ROMs) that describe the behavior of each of the components in the storage-site system (e.g., storage reservoir, seal integrity, wellbore integrity, other transport pathways, groundwater systems, etc.). These ROMs, in turn, will be based on detailed physical and chemical models that are calibrated and validated using laboratory and field data. ROMs for wellbore release account for multiphase flow in potential openings of wellbore materials (cement, rock, and casing). The flow of reactive fluid through cement fractures or along interfaces with casing or caprock is a potentially significant CO2 leakage pathway and may be significantly modified by confining pressure. Much of this work is focusing on the flow through fractures and interfaces of wellbore cements to understand fluid flow with geochemical and geomechanical processes that may impact the fluid permeability. Fractures may occur during the original completion of the well, but pressure changes induced by wellbore operations, including the injection of CO2, likely propagate and generate additional fractures or openings in interfaces between wellbore materials (cement, rock, and casing).
Experimental studies were conducted using batch reactors, X-ray microtomography (XMT), computational fluid dynamics (CFD) modeling, and geomechanical simulation using ABAQUS software to determine changes in cement fracture surfaces, fluid flow pathways and permeability, and cement fracture propagation with geochemical and geomechanical processes. Composite Portland cement-basalt caprock cores with artificial fractures, as well as neat Portland cement columns without fractures, were prepared to study the geochemical and geomechanical effects on the integrity of wellbores containing defects caused during geologic carbon sequestration. The samples were reacted with CO2-saturated groundwater with or without impurity H2S (1 wt.%) at 50°C and 10 MPa for 3 to 3.5 months under static conditions. Two cement-basalt cores were subjected to mechanical stress at 2.7 MPa before the CO2 reaction. XMT provided three-dimensional (3-D) visualization of the opening and interconnection of cement fractures due to mechanical stress. CFD modeling further revealed that this stress led to an increase in fluid flow and hence permeability in the fracture. After the CO2 reaction, XMT images revealed that calcium carbonate precipitation occurred extensively within the fractures in the cement matrix, but only partially along fractures located at the cement-basalt interface. The 3-D visualization and CFD modeling also showed that the precipitation of calcium carbonate within the cement fractures after

iv
the CO2 reaction resulted in the opening of fractures due to crystallization-induced pressure, as well as disconnection of cement fractures and permeability decrease. The permeability calculated based on CFD modeling was in agreement with the experimentally determined permeability. Long-term exposure of a fractured cement column to CO2-saturated groundwater at 50°C and 10 MPa over a period of 13 months resulted in progressive filling of cement fractures by CaCO3(s) precipitation. After a 3.5-month reaction with CO2-H2S-saturated groundwater at 50°C and 10 MPa, CaCO3 (s) precipitation occurred more extensively within the cement fracture than along the cement-basalt caprock interfaces. Micro X-ray diffraction analysis showed that major cement carbonation products of CO2–saturated groundwater reacting with impurity H2S were calcite, aragonite, and vaterite, consistent with cement carbonation by pure CO2-saturated groundwater, while pyrite was not identified. The cement alteration rate of neat Portland cement columns by CO2-saturated groundwater at 50°C and 10 MPa for 3 to 3.5 months was similar at ~0.02 mm/d regardless of the cement-curing pressure and temperature (P-T) conditions or the presence of impurity H2S. This suggests that cement porosity and permeability decreased to similar extents as a result of extensive carbonation in cement pores for several months of long-reaction irrespective of different initial cement curing conditions. The experimental results imply that the wellbore cement with fractures is likely to be healed during exposure to CO2-saturated groundwater under static flow conditions, whereas fractures along the cement-caprock interface are likely to remain vulnerable to the leakage of CO2. CFD simulation was performed to simulate the flow of deionized (DI) water, CO2-saturated brine, and supercritical CO2 using a pressure difference of 20 kPa and 200 kPa. The results show that an increase in pressure difference by a factor of ten from 20 kPa to 200 kPa resulted in an increase in CO2 fluid flows by a factor of only ~3–9 because the frictional losses due to boundary layer formation at the cement surface increases with higher flow rate. At the same pressure gradient, though the viscosity of supercritical CO2 is 21 fold less than CO2-saturated brine, the simulated flow rate for supercritical CO2 was higher than CO2-saturated brine only by a factor of ~2–3. A preliminary geomechanical simulation using ABAQUS code showed that pressure loading of 18 MPa, which can be formed due to overpressure during CO2 injection, can lead to extensive fracture propagation in wellbore cement. The study suggests that in deep geological reservoirs the geochemical and geomechanical processes have coupled effects on the wellbore cement fracture evolution and fluid flow along the fracture surfaces. The results from these laboratory experiments will provide essential information on the parameters and understanding of key processes, both of which can be used to improve the wellbore integrity ROMs used in the IAMs.

v
Acknowledgments
The authors are grateful to Paul Martin for high P-T experimental setup and Steve Baum for ICP-OES analysis. We also would like to express gratitude to Tamas Varga for XMT visualization and Mark Bowden for micro-XRD analysis at the Environmental Molecular Sciences Laboratory, a U.S. Department of Energy (DOE) national scientific user facility at Pacific Northwest National Laboratory (PNNL). Funding for this research was provided by the National Risk Assessment Partnership of the DOE Office of Fossil Energy’s Carbon Sequestration Program. We would like to acknowledge Maura Zimmerschied and Kathy Neiderhiser for editing and formatting this report, respectively. PNNL is operated by Battelle for the U.S. DOE under contract DE-AC05-76RLO1830.


vii
Acronyms and Abbreviations
CFD computational fluid dynamics C-S-H calcium silicate hydrate IAM integrated assessment model ROM reduced order model PNNL Pacific Northwest National Laboratory P-T pressure and temperature PTFE polytetrafluoroethylene XMT X-ray microtomography XRD X-ray diffraction w/c water-to-cement ratio µ-XRD micro X-ray diffraction


ix
Contents
Summary ........................................................................................................................................... iii Acknowledgments ............................................................................................................................... v Acronyms and Abbreviations ...........................................................................................................vii 1.0 Introduction ............................................................................................................................. 1.1 2.0 Materials and Methods ............................................................................................................ 2.1
2.1 Preparation of Cement Paste with Basalt Caprock .......................................................... 2.1 2.2 Compressive Loading ...................................................................................................... 2.3 2.3 Cement-CO2-Groundwater Reaction at High P-T Conditions ........................................ 2.3 2.4 Cement-CO2-H2S-Groundwater Reaction at High P-T Conditions ................................ 2.4 2.5 Micro X-ray Diffraction .................................................................................................. 2.4 2.6 Constant-Head Permeability Measurement ..................................................................... 2.4 2.7 X-ray Microtomography ................................................................................................. 2.5 2.8 Computational Fluid Dynamics Simulation .................................................................... 2.5 2.9 Geomechanical Modeling of Cement Fracture Propagation ........................................... 2.7
3.0 Results and Discussion ............................................................................................................ 3.1 3.1 Aqueous Chemical Compositions of CO2-Saturated Groundwater ................................ 3.1 3.2 Effect of Cement Curing Conditions on Cement Alteration ........................................... 3.2 3.3 Cement Fracture Growth and Sealing by Mechanical Stress and Carbonation ............... 3.4 3.4 Long-Term Cement Carbonation and Fracture Healing .................................................. 3.9 3.5 Cement Alteration and Fracture Sealing by CO2-H2S .................................................. 3.10 3.6 Computational Fluid Dynamics Simulation of DI Water with Fracture Evolution ....... 3.17 3.7 Computational Fluid Dynamics Modeling of CO2-Saturated Brine and Supercritical
CO2 with Fracture Evolution ........................................................................................ 3.21 3.8 Geomechanical Modeling of Cement Fracture Evolution ............................................. 3.28 3.9 Coupled Geochemical and Geomechanical Effects on Integrity of Fractured Wellbore
Cement during Geologic Carbon Sequestration ............................................................ 3.29 4.0 Conclusion ............................................................................................................................... 4.1 5.0 References ............................................................................................................................... 5.1

x
Figures
2.1 Pictures of the Cement-Basalt Interface Sample and Neat Cement Columns ........................ 2.2 2.2 The Final Volume Mesh of Case 2......................................................................................... 2.6 2.3 A: Evolution of Cohesive Elements with Fracture Propagation; B: Traction-Separation
Response ................................................................................................................................ 2.8 3.1 Aqueous Chemical Composition Changes of CO2-Saturated Groundwater during the
3-Month Reaction with Composite Cement-Basalt Cores and Neat Cement Columns in Vessels 1–4............................................................................................................................. 3.1
3.2 Horizontal and Vertical XMT Slices of Neat Portland Cement Cured at High P-T Conditions and Ambient P-T Conditions after Reaction with CO2-Saturated Groundwater at 50°C and 10 MPa for 3 Months.. ........................................................................................... 3.3
3.3 Grayscale XMT Images of Horizontal Slices of the Cement-Basalt Interface Sample for Three Different Cases ............................................................................................................ 3.5
3.4 Grayscale XMT Images of Vertical Slices of the Cement-Basalt Interface Sample for Three Different Cases ....................................................................................................................... 3.6
3.5 Grayscale XMT Images of Vertical and Horizontal Slices of Cement #2 Before and After Reaction with CO2-Saturated Groundwater at 50°C and 10 MPa for 3 Months. ................... 3.7
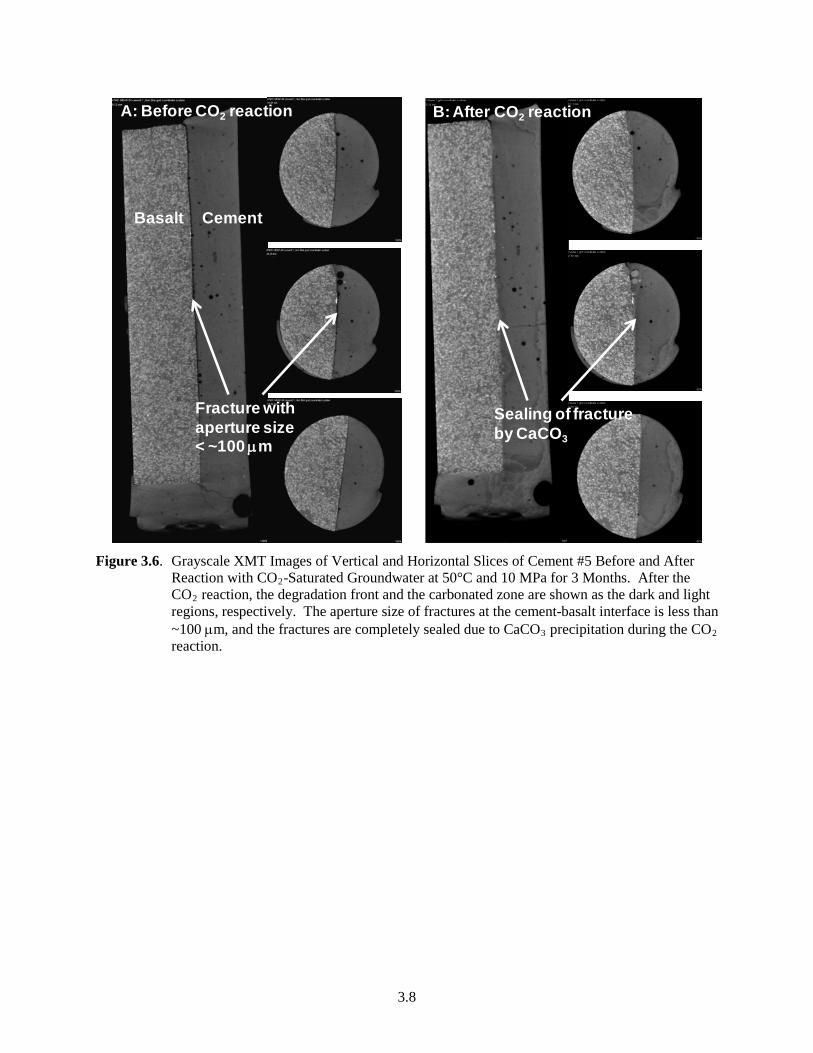
3.6 Grayscale XMT Images of Vertical and Horizontal Slices of Cement #5 Before and After Reaction with CO2-Saturated Groundwater at 50°C and 10 MPa for 3 Months. ................... 3.8
3.7 Grayscale XMT Images of Vertical and Horizontal Slices of Cement #8 Before and After Reaction with CO2-Saturated Groundwater at 50°C and 10 MPa for 3 Months. ................... 3.9
3.8 A Picture of a Neat Cement Column with Artificial Layered Fractures and Horizontal XMT Slices after Reaction with CO2-Saturated Groundwater at 50°C and 10 MPa for 5 Months and After an Additional 8 months. ....................................................................................... 3.10
3.9 A: Picture of a Cement-Basalt Interface Sample and a Neat Cement Column after 3.5-Month Reaction with Synthetic Groundwater Equilibrated with scCO2 Containing 1% H2S. B and C: A Picture and a Horizontal XMT Slice of a Cross-Section of Cement #12. D and E: Cross-Sections of Cement #11 Showing the Cement Fracture Sealed with CaCO3. ..... 3.11
3.10 XRD Patterns for White Crystals Formed on the Outside Surface of Cement #11 and Cement #12 after Reaction with CO2-H2S Saturated Groundwater at 50°C and 10 MPa for 3.5 Months. .......................................................................................................................... 3.13
3.11 XRD Patterns for Cement #11 after Reaction with CO2-H2S Saturated Groundwater at 50°C and 10 MPa for 3.5 months. ........................................................................................ 3.13
3.12 XRD Patterns for Cement #12 after Reaction with CO2-H2S-Saturated Groundwater at 50°C and 10 MPa for 3.5 Months. ....................................................................................... 3.14
3.13 Grayscale Horizontal XMT Slices of Cement #11 Before and After Compressive Loading at 2.7 MPa and Exposure to CO2-H2S-Saturated Groundwater at 50°C and 10 MPa for 3.5 Months. ................................................................................................................................ 3.15
3.14 Grayscale XMT Images of Vertical and Horizontal Slices of the Cement-Basalt Interface Sample, Cement #11, after 3.5-Month Reaction with Synthetic Groundwater Equilibrated with scCO2 Containing 1% H2S. ......................................................................................... 3.16
3.15 Vertical and Horizontal XMT Slices of a Neat Cement Column, Cement #12, Exposed to CO2-H2S-Saturated Groundwater at 50°C and 10 MPa for 3.5 Months. ............................. 3.17

xi
3.16 Vertically Connected Cement Fracture Surface of Cement #1 with XMT Image of a Horizontal Slice, Contours Colored by Absolute Pressure, and Streamtraces Colored by Absolute Velocity for the Three Different cases. ................................................................ 3.18
3.17 Grayscale XMT Images of Horizontal and Vertical Slices of Cement #1 Scanned during the Infiltration of KI solution into Cement Fractures. ................................................................ 3.21
3.18 Fluid Velocity Contours and Fluid Streamtraces for CO2-Saturated Brine at 50°C and 10 MPa, as well as Supercritical CO2 at 50°C and 10 MPa before Compressive Loading. ..... 3.25
3.19 Fluid Velocity Contours and Fluid Streamtraces for CO2-Saturated Brine at 50°C and 10 MPa, as well as Supercritical CO2 at 50°C and 10 MPa after Compressive Loading at 2.7 MPa. ..................................................................................................................................... 3.26
3.20 Fluid Velocity Contours and Fluid Streamtraces for CO2-Saturated Brine at 50°C and 10 MPa, as well as Supercritical CO2 at 50°C and 10 MPa after Reaction with CO2-Saturated Groundwater at 50°C and 10 MPa for 3 Months. ................................................................ 3.27
3.21 Cement Fracture Propagation over Time. ............................................................................ 3.28 3.22 Displacement of Five Nodes in Figure 3.21 with Fracture Propagation as a Function of
Time. .................................................................................................................................... 3.29 3.23 A: Grayscale XMT Image of a Vertical Slice of the Cement-Basalt Interface Sample after
3-Month Reaction with CO2-Saturated Groundwater at 10 MPa and 50°C. B: Schematic Diagram Showing the Mechanism for More Extensive Calcium Carbonate Precipitation within the Cement Fracture than in the Fracture at the Cement-Basalt Interface during Reaction with CO2-Saturated Groundwater. C: Grayscale Horizontal XMT Image Showing Three Major Fractures after Compressive Loading and before the Reaction with CO2-Saturated Groundwater. D: Grayscale Horizontal XMT Image Showing CaCO3 Precipitation within Cement Fractures, as well as the Widening of Fractures by Crystallization-Induced Pressure after Reaction with CO2-Saturated Groundwater. .......... 3.30
Tables
2.1 Summary of Composite Cement-Basalt Cores and Neat Cement Columns Reacted with CO2-Saturated Groundwater or CO2-H2S Saturated Groundwater at 50°C and 10 MPa for 3 months. ................................................................................................................................... 2.1
2.2 Geomechanical Properties of Hydrated Cement used in the ABAQUS Simulation .............. 2.8 3.1 Average Alteration Depth of Neat Cement Columns Cured at Ambient and High P-T
Conditions .............................................................................................................................. 3.2 3.2 The Fluid Flow Characteristics of Fractures of the Composite Cement-Basalt Core before
Compressive Loading, after Compressive Loading, and after CO2 Reaction Simulated by CFD Modeling. .................................................................................................................... 3.19
3.3 The Results of Constant-Head Permeability Measurements for the Composite Cement-Basalt Core and the Calculated Permeability after CO2 Reaction. ...................................... 3.20
3.4 CFD Modeling Results of CO2-Saturated Brine Flow through Fractures of the Composite Cement-Basalt Core at Pressure Gradients of ~1 MPa/m and ~10 MPa/m before Compressive Loading, after Compressive Loading, and after CO2 Reaction. ..................... 3.23
3.5 CFD Modeling Results of Supercritical CO2 Flow through Fractures of the Composite Cement-Basalt Core at Pressure Gradients of ~1 MPa/m and ~10 MPa/m before Compressive Loading, after Compressive Loading, and after CO2 Reaction ...................... 3.24

xii

1.1
1.0 Introduction
Carbon dioxide (CO2) capture and storage technology in deep geologic formations including oil and gas reservoirs, deep saline aquifers, basalt formations, coal seams, and salt caverns has been proposed to decrease atmospheric CO2 concentrations and mitigate global warming. During geologic carbon storage, potential CO2 leakage can occur through wellbores and damage underground sources of drinking water and consequently human health, as well as the ecosystem (Bruant et al. 2002; Little and Jackson 2010; Wilkin and Digiulio 2010). Portland cement is commonly considered as a sealing material for carbon storage sites. During typical well construction, cement slurry is placed in the annulus between the wellbore steel casing and formation rocks to prevent vertical fluid migration and to provide mechanical support (Nelson and Guillot 2006). Hydrated products formed by mixing Portland cement with water are a semi-amorphous gel-like calcium silicate hydrate (C-S-H) and a crystalline phase of portlandite [Ca(OH)2(s)] (Neville 2004; Nelson and Guillot 2006). Potential leakage pathways of stored CO2 may occur at the interface between casing and cement, cement plug and casing, and cement and host rock, or through the cement pore spaces and fractures (Gasda et al. 2004; Jung et al. 2013; Jung and Um 2013). Wellbore cement may contain fractures and defects because of changes in pressure and temperature within the wellbore during field operation, cement shrinkage during hydration, mechanical shock from pipe tripping, poor cement slurry placement, and residues of drilling mud and drill cuttings (Zhang and Bachu 2011). After well completion, changes in downhole conditions can also induce sufficient stresses to damage the integrity of the cement sheath. The presence of mechanical defects such as gaps in bonding between the casing or the formation, or fractures in the cement annulus itself, leads to flow paths with significant effective permeability (Bachu and Watson 2009). A number of previous experimental and field studies have shown that the cement fracture and the cement-rock or cement-casing interface are most vulnerable to alteration and provide a pathway for CO2 leakage during geologic carbon sequestration (Carey et al. 2007; Carey et al. 2010; Jung and Um 2013). Bachu and Bennion (2009) showed that the effective permeability of the assemblage of cement and casing is extremely low (on the order of 1 nanodarcy, nD) if both the cement and the bond are of good quality (Bachu and Bennion 2009). However, the presence of an annular gap and/or fractures with apertures on the order of 0.01–0.3 mm leads to a significant increase in effective permeability (in the range of 0.1–1 mD).
In this study, the cement-CO2 reaction was conducted under static conditions in high pressure vessels. In deep formations for storing CO2, the flow velocity of formation water is typically on the order of millimeters to centimeters per year due to the low permeability of the rocks (Bachu et al. 1994). For such low flow rates, the reactions between cement and the CO2-saturated brine can be largely regarded as similar to those that occur under static conditions (Zhang and Bachu 2011). However, if the fracture is vertically connected along the wellbore and extends from the reservoir formation to the overlying formation, the CO2 fluid either CO2 saturated brine or supercritical CO2 can also flow along a fractured wellbore at a higher rate due to the pressure gradient between the reservoir formation and the overlying formation. A number of experimental studies have been conducted under flow-through conditions to simulate the leakage of CO2 fluid along the cement-caprock interface or cement fractures (Wigand et al. 2009; Liteanu and Spiers 2011; Mason et al. 2013; Newell and Carey 2013). However, to our knowledge, no high pressure and temperature (P-T) experimental study has previously been conducted for cement alteration at the cement-rock interface under static conditions. While a number of studies have previously investigated alteration along the cement-shale caprock interface (Mason et al. 2013; Newell and Carey 2013), this study focuses on fracture growth and sealing along the cement-basalt caprock interface. Volcanic flood basalt provinces such as the Columbia River Basalt Group are currently being considered

1.2
as a geologic storage option for anthropogenic CO2 in addition to deep saline aquifers and depleted oil and gas reservoirs because of their ability to rapidly convert the injected CO2 into stable carbonate minerals, effectively and permanently isolating it from the atmosphere (McGrail et al. 2006; Goldberg et al. 2008; Schaef and McGrail 2009; Schaef et al. 2010). Multiple alternating interflow zones are considered as potential reservoirs, while flow interiors are considered as caprock in Columbia River Basalt formation (Zakharova et al. 2012).
X-ray microtomography (XMT) was used to visualize the evolution of cement fractures by geomechanical and geochemical processes under geologic carbon sequestration conditions. XMT is a noninvasive and nondestructive 3-D imaging technique that uses a series of radiographic images to reconstruct a map of an object’s X-ray absorption. This can provide information on the spatial distribution of the microstructure of a material in three dimensions with minimal sample preparation. Because X-ray absorption is a function of the elemental composition and density of the object, X-ray imaging can be related to the microstructure and mineralogical composition of the material. In grayscale XMT images, brightness is proportional to X-ray absorption, when a material is imaged near or above 100 keV, with dark and light regions corresponding to low- and high-density phases, respectively. Recently, Jung et al. (2013) demonstrated that XMT can visualize and quantify the chemical degradation and physical pore structure changes in hydrated Portland cement by supercritical CO2 or CO2-saturated groundwater (Jung et al. 2013). XMT imaging techniques can be also applied to generate a highly detailed 3-D visualization of the fractures in geologic media (Landis et al. 2003; Polak et al. 2003b; Polak et al. 2003a; Rougelot et al. 2010). The 3-D visualized structure of the fracture can then, when properly constructed, be used to simulate fluid flow (e.g., flow direction and velocity) through connected fractures using computational fluid dynamics (CFD) and high performance computing (Carson et al. 2010a). These simulations identify fluid flow patterns and pathways of particles within the fracture. In addition, the CFD model can be used with Darcy’s equation to compute the fracture permeability. From the simulation results, the effects of experimental modifications can be visualized and the impact of future modifications can be inferred. In the current study, composite cement-basalt caprock cores with artificial fractures were prepared to simulate the wellbore cement materials with defects. The samples were reacted with CO2-saturated groundwater with or without prior compressive loading to simulate the effects of mechanical stress and CO2 reaction during geologic carbon storage. The fractures in the cement-basalt cores were imaged by XMT before and after compressive loading and CO2 reaction. Then CFD analysis was performed to reveal the detailed flow characteristics through these fractures, and the intrinsic fracture permeability was calculated based on the CFD modeling results. This further allowed us to quantitatively and qualitatively compare the impact of different experimental scenarios on fracture progression. The objectives of this study are to understand the wellbore cement alteration along the defected cement-basalt caprock interface under geologic carbon sequestration conditions and to evaluate the applicability of coupled XMT and CFD modeling for bench-scale assessment of fracture evolution in geologic materials during geologic carbon sequestration.

2.1
2.0 Materials and Methods
2.1 Preparation of Cement Paste with Basalt Caprock
Composite cement-basalt cores were prepared with Portland cement slurry (Lafarge North America, Type I-II; comparable to Class A cement) and a low-permeability basalt caprock from the Grande Ronde Basalt Formation within the Columbia River Basalt Group in Washington State. The cement slurry was prepared by mixing Portland cement with water at a water-to-cement ratio (w/c) of 0.38. A small quantity of cement slurry was thoroughly mixed by hand and cement samples were cast in the form of cylinders (13 mm or 25 mm diameter) by pouring the slurry into a plastic mold along with a half-cylinder shaped piece of basalt (approximately 13 mm diameter by 35–45 mm length). Different Portland cement (Type II-V) and w/c ratio of 0.33 was used for preparing S-8 cement sample (Figure 2.1 and Table 2.1). Table 2.1. Summary of Composite Cement-Basalt Cores and Neat Cement Columns (Type I-II Portland cement
and w/c = 0.38; S-8 cement: Type II-V and w/c = 0.33) Reacted with CO2-Saturated Groundwater (Vessels 1–4 and Vessel 6) or CO2-H2S Saturated Groundwater (Vessel 5, the bottom half of cement column) at 50°C and 10 MPa for 3 months. Measured densities for neat cement columns (w/c = 0.38) cured at high P-T and ambient P-T conditions are 1.93 g/cm3 and 1.96 g/cm3, respectively, while it is 2.15 g/cm3 for S-8 (w/c = 0.33). Cement solid-to-groundwater ratios are 0.13 g/mL for Vessel 1, 0.26 mg/L for Vessels 2–4, 0.23 mg/L for Vessel 5, and 0.11 mg/L for Vessel 6. Cement #3-1, Cement #4-1, Cement #6-1 and Cement #7-1 are the duplicates for Cement #3-2, Cement #4-2, Cement #6-2, and Cement #7-2, respectively.
Vessel No. Samples Approximate Sample Size Sample Weight Cement Curing P-T conditions
Cement Basalt
Vessel 1 Cement #1 25 mm D & 20 mm L 16.62 g 5.01 g Ambient P-T
Vessel 2 Cement #2 13 mm D & 40 mm L 5.40 g 7.52 g High P-T Cement #3-1 13 mm D & 26 mm L 7.33 g High P-T Cement #3-2 13 mm D & 26 mm L 6.71 g High P-T
Cement #4-1 13 mm D & 26 mm L 7.34 g Ambient P-T
Cement #4-2 13 mm D & 26 mm L 7.14 g Ambient P-T
Vessel 3 Cement #5 13 mm D & 45 mm L 6.09 g 8.47 g High P-T Cement #6-1 13 mm D & 26 mm L 7.04 g High P-T Cement #6-2 13 mm D & 26 mm L 7.06 g High P-T Cement #7-1 13 mm D & 26 mm L 6.94 g Ambient P-T Cement #7-2 13 mm D & 26 mm L 7.20 g Ambient P-T
Vessel 4 Cement #8 13 mm D & 45 mm L 4.93 g 6.87 g High P-T Cement #9-1 13 mm D & 26 mm L 7.30 g High P-T Cement #9-2 13 mm D & 26 mm L 6.86 g High P-T Cement #10-1 13 mm D & 26 mm L 7.32 g Ambient P-T Cement #10-2 13 mm D & 26 mm L 6.83 g Ambient P-T
Vessel 5 Cement #11 25 mm D & 18 mm L 14.63 g 4.53 g Ambient P-T Cement #12 13 mm D & 52 mm L 14.70 g High P-T
Vessel 6 S-8 14 mm D & 90 mm L 29.77 g Ambient P-T

2.2
Figure 2.1. Pictures of the Cement-Basalt Interface Sample and Neat Cement Columns (Table 2.1).
A: Cement #1 after compressive loading (2.7 MPa). B: Cement #1 after 3-month CO2 reaction (10 MPa and 50°C). C: A cement-basalt composite core (Cement #2) and cement columns cured at high P-T (Cement #3-1 and #3-2) and ambient P-T (Cement #4-1 and #4-2) after 3-month CO2 reaction (10 MPa and 50°C) in Vessel 2. D: A cement-basalt composite core (Cement #5) and cement columns cured at high P-T (Cement #6-1 and #6-2) and ambient P-T (Cement #7-1 and #7-2) after 3-month CO2 reaction (10 MPa and 50°C) in Vessel 3. E: A cement-basalt composite core (Cement #8) and cement columns cured at high P-T (Cement #9-1 and #9-2) and ambient P-T (Cement #10-1 and #10-2) after 3-month CO2 reaction (10 MPa and 50°C) in Vessel 4.
2.3
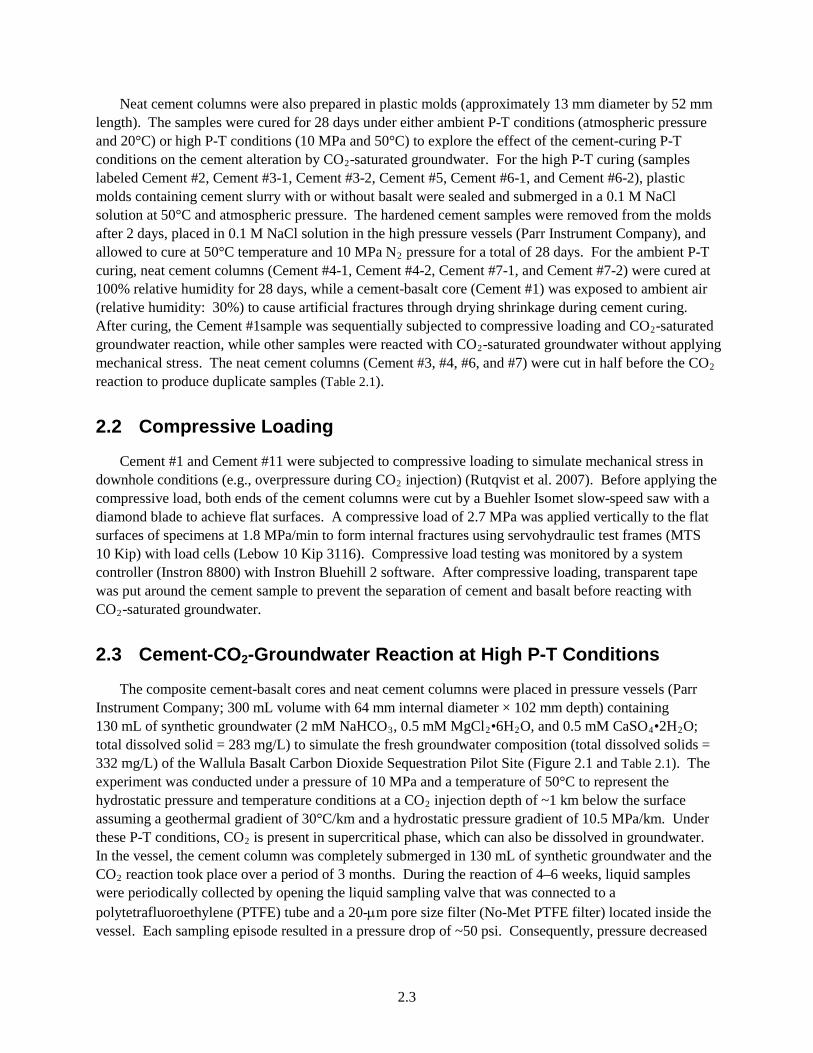
Neat cement columns were also prepared in plastic molds (approximately 13 mm diameter by 52 mm length). The samples were cured for 28 days under either ambient P-T conditions (atmospheric pressure and 20°C) or high P-T conditions (10 MPa and 50°C) to explore the effect of the cement-curing P-T conditions on the cement alteration by CO2-saturated groundwater. For the high P-T curing (samples labeled Cement #2, Cement #3-1, Cement #3-2, Cement #5, Cement #6-1, and Cement #6-2), plastic molds containing cement slurry with or without basalt were sealed and submerged in a 0.1 M NaCl solution at 50°C and atmospheric pressure. The hardened cement samples were removed from the molds after 2 days, placed in 0.1 M NaCl solution in the high pressure vessels (Parr Instrument Company), and allowed to cure at 50°C temperature and 10 MPa N2 pressure for a total of 28 days. For the ambient P-T curing, neat cement columns (Cement #4-1, Cement #4-2, Cement #7-1, and Cement #7-2) were cured at 100% relative humidity for 28 days, while a cement-basalt core (Cement #1) was exposed to ambient air (relative humidity: 30%) to cause artificial fractures through drying shrinkage during cement curing. After curing, the Cement #1sample was sequentially subjected to compressive loading and CO2-saturated groundwater reaction, while other samples were reacted with CO2-saturated groundwater without applying mechanical stress. The neat cement columns (Cement #3, #4, #6, and #7) were cut in half before the CO2 reaction to produce duplicate samples (Table 2.1).
2.2 Compressive Loading
Cement #1 and Cement #11 were subjected to compressive loading to simulate mechanical stress in downhole conditions (e.g., overpressure during CO2 injection) (Rutqvist et al. 2007). Before applying the compressive load, both ends of the cement columns were cut by a Buehler Isomet slow-speed saw with a diamond blade to achieve flat surfaces. A compressive load of 2.7 MPa was applied vertically to the flat surfaces of specimens at 1.8 MPa/min to form internal fractures using servohydraulic test frames (MTS 10 Kip) with load cells (Lebow 10 Kip 3116). Compressive load testing was monitored by a system controller (Instron 8800) with Instron Bluehill 2 software. After compressive loading, transparent tape was put around the cement sample to prevent the separation of cement and basalt before reacting with CO2-saturated groundwater.
2.3 Cement-CO2-Groundwater Reaction at High P-T Conditions
The composite cement-basalt cores and neat cement columns were placed in pressure vessels (Parr Instrument Company; 300 mL volume with 64 mm internal diameter × 102 mm depth) containing 130 mL of synthetic groundwater (2 mM NaHCO3, 0.5 mM MgCl2•6H2O, and 0.5 mM CaSO4•2H2O; total dissolved solid = 283 mg/L) to simulate the fresh groundwater composition (total dissolved solids = 332 mg/L) of the Wallula Basalt Carbon Dioxide Sequestration Pilot Site (Figure 2.1 and Table 2.1). The experiment was conducted under a pressure of 10 MPa and a temperature of 50°C to represent the hydrostatic pressure and temperature conditions at a CO2 injection depth of ~1 km below the surface assuming a geothermal gradient of 30°C/km and a hydrostatic pressure gradient of 10.5 MPa/km. Under these P-T conditions, CO2 is present in supercritical phase, which can also be dissolved in groundwater. In the vessel, the cement column was completely submerged in 130 mL of synthetic groundwater and the CO2 reaction took place over a period of 3 months. During the reaction of 4–6 weeks, liquid samples were periodically collected by opening the liquid sampling valve that was connected to a polytetrafluoroethylene (PTFE) tube and a 20-µm pore size filter (No-Met PTFE filter) located inside the vessel. Each sampling episode resulted in a pressure drop of ~50 psi. Consequently, pressure decreased

2.4
initially from 1,550 psi (10.7 MPa) to 1,450 psi (10.0 MPa) by the end of the experiment. After collecting a liquid sample of ~4 mL from each vessel, the sample was immediately filtered through a 0.45-µm pore size syringe filter (Whatman) and acidified to 1% HNO3. Prior to sampling, about 2 mL of liquid was purged from each vessel to remove liquid remaining within the dead space of the sample collection fittings. After the CO2 reaction, the pressure vessel was slowly depressurized for 24 hours before cement sample collection. Before depressurization, a liquid sample was collected from each vessel by opening the liquid sampling valve, and the sample was immediately filtered through a 0.45-µm pore size syringe filter (Whatman) and acidified to 1% HNO3. Dissolved concentrations of Ca, Mg, Na, K, Si, and Sr were determined by inductively coupled plasma-optical emission spectrometry (ICP-OES).
2.4 Cement-CO2-H2S-Groundwater Reaction at High P-T Conditions
To understand the effect of impurity H2S (a common impurity gas in CO2 streams) on the alteration of wellbore cement materials, a composite cement-basalt core (Cement #11) and a neat cement column (Cement #12) were reacted with 130 mL of synthetic groundwater (2 mM NaHCO3, 0.5 mM MgCl2•6H2O, and 0.5 mM CaSO4•2H2O) equilibrated with supercritical CO2 containing 1% H2S. After sealing each vessel, the system was purged with pure N2 gas for 10 minutes to remove atmospheric oxygen. The experiment was conducted under a pressure of 10 MPa and a temperature of 50°C for 3.5 months using a titanium pressure vessel (Parr Instrument) with a PTFE liner to prevent corrosion. After the reaction, the pressure vessel was slowly depressurized for 24 hours before cement sample collection, and the samples were scanned by XMT.
2.5 Micro X-ray Diffraction
Minerals formed on the cement fracture surfaces and cement pores after reaction with CO2-H2S-saturated groundwater for 3.5 months were analyzed using a Rigaku D/Max Rapid II micro diffraction system. X-rays were generated (MicroMax 007HF) from a rotating Cr target (λ = 2.2910 Å) and focused through a 300-μm-diameter collimator directly onto a region of interest identified using the integral video microscope. X-rays of this wavelength usually penetrate much less than 100 µm into typical specimens so that the analysis is dominated by compounds in this surface region. Diffraction data recorded on a two-dimensional image plate were integrated between 25 and 160° 2θ using the manufacturer’s software to give powder traces. The phases present were identified by comparison with mineral library patterns supplied by the International Center for Diffraction Data using JADE v9.3 software (Materials Data Inc., CA).
2.6 Constant-Head Permeability Measurement
To validate the permeability computed based on CFD simulation results, the permeability was experimentally determined using constant-head permeability measurement after the CO2 reaction. The composite cement-basalt core, Cement #1, was placed end-to-end between two plastic cylinders and the side of the core was sealed with Parafilm®. Distilled water at 20°C was used as a fluid for permeability measurement at a constant head. The volume of water flowing through the cement fractures was determined based on the weight of water collected in the bottom cylinder during a specific time period. Darcy’s law was used to determine the hydraulic conductivity:

2.5
Q = K × A × dh/dl
where Q is the discharge (m3/s), K is the hydraulic conductivity (m/s), A is the cross-sectional area (m2), and dh/dl is the hydraulic gradient.
Intrinsic permeability was calculated according to the following equation:
k = K × µ/ρg
where k is the intrinsic permeability (m2), K is the hydraulic conductivity (m/s), µ is the dynamic viscosity of the fluid (kg/m·s), ρ is the density of the fluid (kg/m3), and g is the acceleration due to gravity (m/s2).
2.7 X-ray Microtomography
Cement samples were scanned using a high-resolution microfocus X-ray computed tomography scanner (X-Tek/Metris XTH 320/225 kV) to visualize the formation, growth, and sealing of internal fractures. Scans were performed at 98-kV and 536-µA X-ray energy ranges with a 0.1-mm Cu filter for optimum image quality and contrast. The samples were rotated continuously during the scans with momentary stops to collect each projection (shuttling mode) to minimize ring artifacts. A total of 3,142 projections were collected over 360 degrees with 0.5 second exposure time and 1 frame per projection with an isotropic voxel resolution of ~10–25 microns depending on specimen dimensions. The images were reconstructed to get 3-D data sets using CT Pro 3D (Metris XT 2.2, Nikon Metrology, UK). Image stacks of two different orientations were generated from the 3-D data using the visualization program VG Studio MAX 2.1 (Volume Graphics GmbH, Germany). To visualize the fracture connectivity of Cement #1, the potassium iodide (KI) solution (0.3 g/mL) was placed on the top of the sample, which was inserted between two plastic cylinders. The bottom of the sample was sealed with Parafilm to keep the KI solution within the fractures during the XMT scanning. The sample was scanned during the infiltration of KI solution into cement fractures under the same scanning conditions described above.
2.8 Computational Fluid Dynamics Simulation
CFD simulations were performed to visualize and quantify the changes in fluid property in fractures for the cement-basalt interface sample (Cement #1) in three different cases; Case 1: before applying compressive stress, Case 2: after applying compressive stress, and Case 3: after applying compressive stress and CO2 reaction. The CFD models were driven using different pressure gradients along 2 cm long cement sample with three different working fluids; (1) DI water at 20 oC with 20 kPa, (2) CO2 saturated brine at 50 oC with 20 kPa and 200 kPa, and (3) supercritical CO2 at 50°C with 20 kPa, 200 kPa, and 1 MPa. The fracture geometries for all the three cases were segmented based on the approach described by Carson et al. (Carson et al. 2010b; Carson et al. 2010c). Briefly, the images were masked to remove any background noise and then intensity-based thresholding followed by visual validation was performed. Edge-preserving hybrid median filters and background normalization were used to remove both high- and low-frequency noise, respectively. Intensity thresholds followed by manual validation were used to identify the fracture boundaries. Isosurfaces were extracted by applying a variant of the “marching cubes” algorithm to the segmented fracture (Lorensen and Cline 1987). The isosurfaces were smoothed using volume-conserving smoothing to make sure that the volume of the geometry remained a constant

2.6
(Kuprat et al. 2001). For CFD modeling, it is desired that the inlet and outlet faces are perpendicular to the major flow direction. Hence, the inlet and outlet at the top and bottom of the sample were flattened using a commercial software package called Magics (Materialise, Plymouth, MI, USA) to create flat surfaces for the application of boundary conditions during modeling. As described by Kuprat et al., once a topologically correct and closed surface was produced, the triangulated mesh was adapted to the gradient-limited feature size to prepare the surface for scale-invariant meshing. The major purpose of scale-invariant meshing is to guarantee a minimum number of volume element layers across each resolved feature to accurately predict physical gradients regardless of scale. Therefore, points spaced relative to the gradient-limited feature size were projected into the interior of the surface mesh, filtered and reconnected into a minimum of 10 tetrahedra with a modified Delaunay approach (Kuprat and Einstein 2009). To improve the quality of the tetrahedral mesh, a combination of edge flipping and volume-conserving smoothing was used. The final meshes for Case 1, Case 2, and Case 3 consisted of 852,090, 1,240,462, and 644,751 nodes, respectively. The total numbers of tetrahedral elements for the three cases were 4.15, 6.46, and 3.34 million. Figure 2.2 shows the final volume mesh for Case 2 (after compressive loading) and the inset shows a cross-section of the volume mesh. It is clear from the inset that there are ten volumetric elements spanning the fracture on average, which is sufficient to accurately resolve the flow features in this geometry.
Figure 2.2. The Final Volume Mesh of Case 2 (after compressive loading). The inset shows the volume
elements spanning the fracture. The gradient-limited feature size in Lagrit-PNNL mesh-generating software guarantees a minimum number of volumetric elements spanning the narrowest as well the widest region in the 3-D fracture geometry.

2.7
Steady-state CFD simulations were performed using OpenFOAM® (OpenCFD Ltd., Reading, UK). The flow predictions were based upon the laminar, 3-D incompressible Navier-Stokes equations for fluid mass and momentum:
where ρ is the density, υ is the kinematic viscosity, u is the fluid velocity vector, and p is the pressure.
Three different working fluids used for the CFD simulations includes; (1): DI water at 20°C temperature with a density of 1,000 kg/m3 and a kinematic viscosity of 1.004 m2/s, (2): CO2-saturated brine (1 mol/Kg NaCl) at 50°C with a density of 1,035 kg/m3 and a kinematic viscosity of 5.99 x 10⁻⁷ m2/s (Kestin et al. 1978; Bando et al. 2004; Yan et al. 2011), and (3): supercritical CO2 at 50°C with a density of 384.3 kg/m3 and a kinematic viscosity of 7.38 x 10⁻⁸ m2/s. The models were driven by a pressure gradient with an inlet pressure of 20 kPa and 200 kPa specified for all the three models and a zero pressure boundary condition applied at the outlets. A pressure gradient of 1 MPa was tested only for supercritical CO2 case. A no-slip wall condition was applied to the fracture boundaries, which were assumed to be rigid and impermeable. In addition, intrinsic permeability, k was calculated based on Darcy’s law:
q = -k/µ × ∇P
where q is the flux (m/s), µ is the dynamic viscosity of fluid, and ∇P is the pressure gradient vector (Pa/m).
2.9 Geomechanical Modeling of Cement Fracture Propagation
To predict wellbore cement fracture propagation during geologic carbon sequestration, a simulation model was developed using commercial finite element analysis software ABAQUS (ABAQUS, Inc.). Half of a disk 90 m in diameter was meshed for this simulation study. An initial fracture was implanted at the center of the model disk. A symmetry condition was applied to nodes along the left edge line. All nodes on the outside were fixed at their initial positions. The applied pressure difference between the initial fracture and the outside boundary was approximately 18 MPa. The applied pressure caused the initial fracture growth. The 3-D pore pressure elements were used for the disk body in ABAQUS, while coherent elements were applied to the face where the initial fracture would propagate.
The Young’s modulus of hydrated cement used for the simulation was ~30 GPa (Walsh et al. 2013). The fracture propagation property in the wellbore cement was defined according to damage initiation and evolution models in ABAQUS. Coherent elements in Figure 2.3A start to be fractured, when tangential and normal stresses satisfy the equation below.

2.8
where t0 is the threshold stress for the nominal or tangential direction.
Figure 2.3. A: Evolution of Cohesive Elements with Fracture Propagation; B: Traction-Separation
Response
After a fracture initiates in an element, its evolution is defined based on the energy that was dissipated as a result of the fracture process, which is also called the fracture energy. The fracture energy is equal to the area under the traction-separation curve (Figure 2.3B) (ABAQUS 6.11 Analysis User’s Manual 31.5.6: defining the constitutive response of cohesive elements using a traction-separation description). This energy for complete fracturing (Gc) is given as a material property. As a fracture grows, the cement fracture aperture is widened and its fracture energy (G) increases. When a fracturing element’s energy, G reaches Gc, the element is completely fractured and no further fracture propagation is occurred. Because the properties of cement, t0 and Gc, are widely varying depending on the conditions, these values were adopted from an ABAQUS example problem (10.1.5. hydraulically induced fracture in a wellbore) and t0 and Gc were set to 320 kPa and 28 kJ/m3, respectively.
Table 2.2 shows all the mechanical properties used in the simulation. To simulate the fracture propagation driven by hydraulic pressure of injected CO2, a coupled pore fluid diffusion and stress analysis was conducted, using *Soil, consolidation in ABAQUS Keyword (ABAQUS 6.11 Analysis User’s Manual 6.8.1: Coupled pore fluid diffusion and stress analysis). The analysis was done in a transient mode to calculate fracture growth with time.
Table 2.2. Geomechanical Properties of Hydrated Cement used in the ABAQUS Simulation
Property Description Value
E Young’s Modulus of cement 30 GPa
t0 Threshold stress for fracture initiation 320 kPa
Gc Complete Fracture Energy density 28 kJ/m3
µf Fluid (CO2 saturated brine) dynamic viscosity at 50oC and 10 MPa in the fracture 0.62 mPa·s

3.1
3.0 Results and Discussion
3.1 Aqueous Chemical Compositions of CO2-Saturated Groundwater
During the 3-month reaction of cement samples with CO2-saturated groundwater, the dissolved concentrations of Ca increased from 20 mg/L to 1,950, 1660, 1,830, and 2,040 mg/L in Vessel 1, Vessel 2, Vessel 3, and Vessel 4, respectively (Figure 3.1).
Figure 3.1. Aqueous Chemical Composition Changes of CO2-Saturated Groundwater during the
3-Month Reaction with Composite Cement-Basalt Cores and Neat Cement Columns in Vessels 1–4
Geochemical equilibrium modeling for portlandite [Ca(OH)2(s)]-CO2-saturated groundwater at 50°C and 10 MPa predicts a dissolved Ca concentration of 1,280 mg/L, a pH of 4.83, and saturation with respect to calcite at a cement solid-to-groundwater ratio of ~0.015–5 g/mL, assuming that portlandite contributes ~15% of the total cement mass (Kutchko et al. 2007; Jung and Um 2013). Given that the cement solid-to-groundwater ratio is 0.13 g/mL for Vessel 1, while 0.26 g/mL for Vessels 2–4, geochemical modeling shows that the groundwater in Vessels 1–4 is saturated with respect to calcite. The dissolved Ca concentrations in Vessels 1–4 are higher than the dissolved Ca concentration predicted at equilibrium with portlandite by ~30–60%. This could result from additional release of Ca from the dissolution of C-S-H phase, a major amorphous phase in hydrated cement. While the concentrations of dissolved Na (229–332 mg/L), K (85–117 mg/L), and Si (61–62 mg/L) are similar for all vessels, the

3.2
concentration of dissolved Mg is significantly higher for Vessels 2–4 (160-168 mg/L) than for Vessel 1 (89 mg/L) (Figure 3.1). Flow interior samples (low permeability caprock) from the Grande Ronde Basalt Formation contain on average 3 wt.% MgO (Schaef and McGrail 2009). Therefore, the lower concentration of dissolved Mg in Vessel 1 than in Vessels 2–4 is attributed to the lower mass of basalt in Vessel 1 (5.01 g) compared to Vessels 2–4 (6.87 g–8.47 g) (Table 2.1). It is also worth noting that dissolved Ca, Na, and K concentrations rapidly reached a steady state within 2 weeks, whereas dissolved Mg concentration steadily increased over a period of 3 months.
3.2 Effect of Cement Curing Conditions on Cement Alteration
Cement alteration depth (length to the degradation front) was estimated by analyzing the vertical XMT slices at 10 degree intervals over a full 360 degrees rotation. There was no significant difference in the cement alteration depth between neat cement columns cured at high P-T conditions (Cement #3-1, #6-1, and #9-1) and ambient P-T conditions (Cement #4-1, #7-1, and #10-1) (Table 3.1 and Figure 3.2).
Table 3.1. Average Alteration Depth of Neat Cement Columns Cured at Ambient and High P-T Conditions
Sample No. Curing Conditions Reaction Period
Average Cement Alteration Depth
mm
Cement #3-1 50°C and 10 MPa 3 months 1.82 Cement #6-1 2.03 Cement #9-1 1.66
Average 1.84 Cement #4-1 20°C and 0.1 MPa 3 months 1.63 Cement #7-1 1.75
Cement #10-1 1.72 Average 1.70
Cement #12 50°C and 10 MPa 3.5 months 2.17

3.3
Figure 3.2. Horizontal and Vertical XMT Slices of Neat Portland Cement Cured at High P-T Conditions
(50°C and 10 MPa N2 pressure; Cement #3-1, Cement #6-1, and Cement #9-1) and Ambient P-T Conditions (20°C and atmospheric pressure; Cement #4-1, Cement #7-1, and Cement #10-1) after Reaction with CO2-Saturated Groundwater at 50°C and 10 MPa for 3 Months. The degradation front and the carbonated zone are shown as the regions with dark and bright grayscale color.
Cement columns cured at ambient P-T and high P-T conditions all showed distinct alteration zones, which are the lower density degradation front with darker color and the higher density carbonated zone with brighter color compared to unaltered cement matrix near the center (Figure 3.2). Cement alteration depth was spatially heterogeneous, ranging from approximately 0 to 5 mm; this is attributed to the heterogeneous micropore structure of the hydrated cement. The average cement alteration depths were

3.4
1.82 mm, 2.03 mm, and 1.66 mm for cement columns Cement #3-1, Cement #6-1, and Cement #9-1 cured at high P-T conditions, respectively, while they were 1.63 mm, 1.75 mm, and 1.72 mm for cement columns of Cement #4-1, Cement #7-1, and Cement #10-1 cured at ambient P-T conditions, respectively (Table 3.1 and Figure 3.2). Kutchko et al. (2007) showed that the initial cement alteration rate after 9-day exposure to CO2-saturated brine at 50°C and 30.3 MPa was slower when cured at high P-T conditions (0.22 mm on average) compared to ambient P-T conditions (0.59 mm on average). This was attributed to smaller and more evenly distributed Ca(OH)2 minerals in hydrated Portland cement cured at high P-T conditions, which thus could provide a more uniform and effective barrier to carbonic acid attack (Kutchko et al. 2007). However, our experimental results indicate that the cement alteration rate after relatively long-term (3 months) exposure to CO2-saturated groundwater was similar regardless of the P-T conditions for cement curing. It appears that the change in cement pore structure during the CO2 reaction was governed more by extensive carbonation than portlandite content. This extensive carbonation occurred in cement columns cured in both high P-T and ambient P-T conditions and likely reduced the porosity and permeability of those cement columns to similar extents (Jung and Um 2013) despite the different initial cement pore structure due to different cement curing conditions (Kutchko et al. 2007). Therefore, although the cement alteration depth after short-term (e.g., days to weeks) exposure to CO2-saturated groundwater or brine could vary depending on the cement-curing P-T conditions, the cement alteration depth after long-term CO2 attack (e.g., months to years) may not be significantly affected by the cement-curing P-T conditions.
3.3 Cement Fracture Growth and Sealing by Mechanical Stress and Carbonation
Three major fractures were formed in the Cement #1 along the longitudinal axis due to cement shrinkage during the cement curing at ambient relative humidity of ~30% (Figure 3.3 and Figure 3.5) (Holt and Leivo 2004). A fracture (Fracture 1; aperture = ~200 µm) was created along the interface between cement and basalt, resulting in poor bonding between cement and basalt. In a wellbore environment, poor bonding of cement to the formation rock is considered a major cause of the failure of cement seals (Zhang and Bachu 2011). Two other fractures (Fracture 2 and Fracture 3; apertures = ~150–300 µm) were formed within the cement matrix, and propagated from the corner or the side of the basalt column. It is worth noting that the cement bonding to the basalt column was strong along the rounded surface of the basalt column, while the cement-basalt bonding was poor along the flat surface of the basalt column (Figure 3.3).
Compressive loading at 2.7 MPa resulted in the detachment of a cement chip from the upper part of the cement column (Figure 2.1 and Figure 3.3). However, XMT images of vertical and horizontal slices (Figure 3.3 and Figure 3.5) showed that no new major fractures were formed after compressive loading at 2.7 MPa. The XMT images obtained after reacting with CO2-saturated groundwater at 50°C and 10 MPa (Figure 3.3 and Figure 3.5) displayed a significant precipitation of calcium carbonate (CaCO3) that occurred along the cement fractures. The newly formed calcium carbonate along the fractures appears as brighter spots compared to unaltered cement matrix due to the higher density of fresh calcium carbonate (i.e., calcite = 2.71 g/cm3) than that of the cement matrix (2.0 g/cm3) or air (0.0018 g/cm3) in the fractures (Figure 3.3 and Figure 3.5). X-ray diffraction indicates that the calcium carbonate formed on the cement surface or within the cement pores after the reaction with CO2-saturated groundwater under similar experimental conditions (50°C and 10 MPa) was mainly calcite and aragonite (Jung et al. 2013; Jung and

3.5
Um 2013). Unlike the fractures in the cement matrix or cement pores no calcium carbonate precipitation was visible along the fractured cement-basalt interface (Figure 3.3 and Figure 3.5).
Figure 3.3. Grayscale XMT Images of Horizontal Slices of the Cement-Basalt Interface Sample (Cement
#1) for Three Different Cases (A: before compressive loading, B: after compressive loading, C: after CO2 reaction). Horizontal slices from top to bottom are displayed from left to right. Dark spots correspond to air-filled voids, and the regions with lighter and darker gray color indicate higher density carbonated zones and lower density Ca(OH)2 depleted degradation fronts, respectively. Three major fractures are clearly visible along the cement-basalt interface (Fracture 1) or within the cement matrix (Fractures 2 and 3). Precipitated calcium carbonate with lighter color is visible within the cement fractures (Fractures 2 and 3) after CO2 reaction.
A. Before compressive loading
B. After compressive loading (2.7 MPa)
C. After compressive loading (2.7 MPa) and CO2 reaction
Cement
Basalt
Damagedcement
CaCO3
Unaltered cement
Degradation front
Carbonatedzone
Air void

3.6
Figure 3.4. Grayscale XMT Images of Vertical Slices of the Cement-Basalt Interface Sample (Cement
#1) for Three Different Cases (A: before compressive loading, B: after compressive loading, C: after CO2 reaction). Dark spots correspond to air-filled voids, and the regions with lighter and darker gray color indicate higher density carbonated zones and lower density Ca(OH)2 depleted degradation fronts, respectively. Precipitated calcium carbonate with lighter color is shown within the cement fractures after CO2 reaction, but not along the cement-basalt interface.
A composite cement-basalt core, Cement #2 cured at high P-T conditions, showed only a partial sealing of the fractured cement-basalt interface (aperture size up to ~500 µm) by calcium carbonate precipitation after the 3-month reaction with CO2-saturated groundwater (Figure 3.6). A horizontal XMT slice for Cement #2 indicates that the fracture between cement and basalt with aperture size < ~100 µm was completely sealed by carbonation after the 3-month reaction with CO2-saturated groundwater (Figure 3.6). Other horizontal XMT slices exhibit CaCO3 precipitation along the narrower fracture between cement and basalt with aperture size < ~200 µm, whereas no visible CaCO3 precipitation occurred along the larger fracture between cement and basalt with aperture size > ~200 µm. Vertical and horizontal XMT slices for Cement #5 and Cement #8 show that the fracture between cement and basalt with aperture size < ~100 µm was completely sealed by carbonation during the reaction with CO2-saturated
A. Before compressive loading
B. After compressive loading (2.7 MPa)
C. After compressive loading (2.7 MPa) and CO2 reaction
Cement
BasaltFracture Fracture
Damaged cement
Carbonatedzone
Degradationfront CaCO3
Unaltered cement

3.7
groundwater for 3 months (Figure 3.7 and Figure 3.7). The results indicate that the aperture size of fractures along the cement-basalt caprock interface is a critical factor in determining the wellbore integrity during geologic carbon storage. The experimental results suggest that the fracture along the wellbore cement and basalt caprock is likely healed by carbonation during the reaction with CO2-saturated groundwater if the fracture is minor (e.g., aperture size < ~200 µm under the current experimental conditions). The carbonation along the fractured cement-caprock interface under static flow conditions will therefore improve the integrity of the wellbore and reduce the risk of CO2 leakage during geologic carbon sequestration if the fracture is minor and enough Ca source is available from the cement and reservoir rocks. The results imply that wellbore cement will be significantly less vulnerable to chemical degradation during geologic carbon sequestration if properly completed and abandoned, thus preventing major migration of CO2 from reservoirs over long periods of time (Zhang and Bachu 2011).
Figure 3.5. Grayscale XMT Images of Vertical and Horizontal Slices of Cement #2 Before and After
Reaction with CO2-Saturated Groundwater at 50°C and 10 MPa for 3 Months. After the CO2 reaction, the degradation front and the carbonated zone are shown as the dark and light regions, respectively. Fractures (aperture size: ~0–500 µm) formed at the cement-basalt interface due to incomplete bonding during the curing are partially filled with CaCO3 precipitate after the CO2 reaction.
3.8
Figure 3.6. Grayscale XMT Images of Vertical and Horizontal Slices of Cement #5 Before and After
Reaction with CO2-Saturated Groundwater at 50°C and 10 MPa for 3 Months. After the CO2 reaction, the degradation front and the carbonated zone are shown as the dark and light regions, respectively. The aperture size of fractures at the cement-basalt interface is less than ~100 µm, and the fractures are completely sealed due to CaCO3 precipitation during the CO2 reaction.
A: Before CO2 reaction B: After CO2 reaction
Fracture with aperture size < ~100 µm
Sealing of fracture by CaCO3
Basalt Cement

3.9
Figure 3.7. Grayscale XMT Images of Vertical and Horizontal Slices of Cement #8 Before and After
Reaction with CO2-Saturated Groundwater at 50°C and 10 MPa for 3 Months. After the CO2 reaction, the degradation front and the carbonated zone are shown as the dark and light regions, respectively. The aperture size of fractures at the cement-basalt interface is less than ~100 µm, and the fractures are completely sealed due to CaCO3 precipitation during the CO2 reaction.
3.4 Long-Term Cement Carbonation and Fracture Healing
A hydrated Portland cement column (type II-V and w/c = 0.33) with artificial fractures (aperture size = ~100–300 µm), S-8 sample, was exposed to CO2-saturated groundwater (the bottom half) and wet supercritical CO2 (the top half) at 50°C and 10 MPa for 5 months (Jung et al. 2013). After collecting XMT images, the sample was returned to a high pressure vessel to be reacted with CO2-saturated groundwater for an additional 8 months (total 13 months) under the same P-T conditions. XMT images of S-8 sample were collected again after additional 8 months of reaction. The comparison of XMT images between 5 months reaction and the additional 8 months reaction provided information on time-dependent cement alteration and fracture sealing by CO2-saturated groundwater over a period of total 13 months (Figure 3.8). The cement alteration occurred preferentially along the fractures. The cement alteration depth was approximately 4–5 mm along the horizontal direction of the fractures (yellow arrows), whereas it was negligible in the direction perpendicular to the fracture. This suggests that the CO2-saturated groundwater migrated into the fractures and then diffused into cement pores perpendicularly to the fracture surface. XMT images collected after the additional 8-month CO2 reaction indicate that the cement alteration continually proceeded preferentially along the fracture (Figure 3.8). Although variable, the cement alteration was significantly slower during the additional 8-month CO2

3.10
reaction than the initial 5-month CO2 reaction (Figure 3.8). This is attributed to slower diffusion of CO2 groundwater into cement pores over time because the cement porosity and permeability gradually decreased as a result of progressive cement carbonation with increasing reaction time with CO2-saturated groundwater (Duguid et al. 2011).
Figure 3.8. A Picture of a Neat Cement Column with Artificial Layered Fractures and Horizontal XMT
Slices after Reaction with CO2-Saturated Groundwater at 50°C and 10 MPa for 5 Months and After an Additional 8 months. Yellow colored arrows indicate the fractures with CaCO3 precipitation.
After 5 months of CO2 reaction, the fracture healing by CaCO3 precipitation was completed by approximately 70% or less, but it was nearly 100% completed with the additional 8-month CO2 reaction (Figure 3.8). This suggests that cement fracture healing by CaCO3 precipitation was progressive with longer reaction time with CO2-saturated groundwater. The narrower fractures with aperture size smaller than ~200 µm (Slices A to C) were almost completely sealed during the 13-month period of CO2 reaction, whereas the fracture with aperture size larger than ~200 µm (Slice D) was only partially sealed even after a total of 13 months of CO2 reaction (Figure 3.8). This again highlights the relationship between fracture aperture size and sealing during CO2 reaction. The results suggest that the long-term reaction of fractured wellbore cement with CO2-saturated groundwater or brine during geologic carbon sequestration is likely to result in the healing of cement fractures and improved integrity of the wellbore. However, if wellbore cement contains major fractures with large apertures, the fracture healing could be slow and limited.
3.5 Cement Alteration and Fracture Sealing by CO2-H2S
A number of previous studies have investigated alteration of cement by CO2-H2S saturated brine (Jacquemet et al. 2008; Kutchko et al. 2011; Jacquemet et al. 2012) because H2S is one of the most common components in natural gas and products derived from oil processing and production, and it is one of the main impurities in flue gas streams (Last and Schmick 2011; Ji and Zhu 2013). Those previous

3.11
studies conducted experiments at relatively high concentrations of H2S ranging from 21 to 66 mole%. Although H2S concentrations as high as 21 mole% have been used for enhanced oil recovery (Bryant and Lake 2005), most co-capture source streams such as those from integrated gasification combined cycle technology are expected to contain about 3 mole% H2S (Haines et al. 2004).
After exposure to CO2-H2S-saturated groundwater (1 wt.% H2S) at 50°C and 10 MPa for 3.5 months, the outside surface of the cement samples (Cement #11 and #12) appeared black (Figure 3.9) unlike the cement samples exposed to only CO2-saturated groundwater, which appeared orange (Figure 2.1), because of hydration products of the iron-rich ferrite as a result of cement decalcification (Kutchko et al. 2011). Cross-sections of Cement #11 exposed to CO2-H2S-saturated groundwater exhibit preferential cement alteration occurring along a cement fracture, with black- or orange-colored alteration zones in cement matrix (Figure 3.9). The fracture was also sealed with white-colored precipitates. Large white crystals were also formed on the outside surface of Cement #11 and Cement #12 (Figure 3.9).
Figure 3.9. A: Picture of a Cement-Basalt Interface Sample (Cement #11) and a Neat Cement Column
(Cement #12) after 3.5-Month Reaction with Synthetic Groundwater Equilibrated with Supercritical CO2 Containing 1% H2S. B and C: A Picture and a Horizontal XMT Slice of a Cross-Section of Cement #12. D and E: Cross-Sections of Cement #11 Showing the Cement Fracture Sealed with CaCO3.
The micro-XRD (µ-XRD) data indicate that the white precipitate is pure calcite (Figure 3.10). For Cement #11, the gray-colored cement near the center (Spot #1 in Figure 3.11) consisted of mainly portlandite, as well calcite and brownmillerite [Ca2(Al,Fe)2O5, a ferrite phase] as minor minerals. The presence of calcite in the apparently unaltered cement matrix suggests that minor carbonation occurred even in the interior cement matrix near the center. The broad background hump of XRD pattern at ~50 2-theta region suggests the presence of amorphous phases (e.g., C-S-H phase). The white-colored minerals filling the cement fracture (Spot #2) were identified to be calcite as a major mineral phase, as well as aragonite and portlandite as minor mineral phases. Although Spots #3 and #4 displayed different colors (orange and black, respectively), the XRD patterns for the two spots were similar (Figure 3.11). The altered cement regions were extensively carbonated, consisting of calcite, aragonite, and vaterite, while no portlandite was identified. Although pyrite formation after reaction with supercritical CO2-H2S or CO2-H2S-saturated brine has been reported (Jacquemet et al. 2008; Kutchko et al. 2011), our µ-XRD data did not identify pyrite formation. This could be attributed to significantly lower H2S concentration

3.12
(1 wt.%) in our experiment compared to previous studies with 21–66 mole% H2S. In addition, pyrite could have been formed, but the amount of pyrite could be too low to be detected by XRD. For Cement #12, the gray cement matrix near the center (Spot #1) consisted of mainly portlandite, while calcite, ettringite, and brownmillerite were minor mineral phases (Figure 3.12). Formation of ettringite [Ca6Al2(SO4)3(OH)12•26H2O] is attributed to internal sulfate attack, which results from the oxidation of H2S that migrated into the cement pores and the subsequent reaction with species of the cement pore solution (e.g., Ca2+ and Al3+) (Kutchko et al. 2011). The degradation front (Spot #2) contained calcite as a major mineral, as well as ettringite, brownmillerite, and aragonite as minor mineral phases, while no peaks for portlandite were detected (Figure 3.12). The carbonated zone with orange color (Spot #3) consisted predominantly of CaCO3 minerals such as calcite, aragonite, and vaterite, as well as brownmillerite as a minor mineral (Figure 3.12). The XRD pattern for the carbonated zone with black color (Spot #4) is similar to that for Spot #3 with orange color despite the distinctive color difference. No pyrite was detected in the dark carbonated zone, consistent with Cement #11. Jung and Um (2013) showed that portlandite was completely depleted, while calcite was formed as a major mineral along with aragonite as a minor mineral in the carbonate cement matrix with orange color after 5 months of reaction with CO2-saturated groundwater at 50°C and 10 MPa (Jung and Um 2013). The results therefore suggest that major alteration products in wellbore cement during reaction with CO2-saturated groundwater under geologic sequestration conditions are CaCO3 precipitates such as calcite, aragonite, and vaterite whether impurity H2S is present or not.
Although Cement #11 was cured at ambient P-T conditions with 30% relative humidity in the same manner as Cement #1, Cement #11 showed an intact interface between cement and basalt unlike Cement #1, and contained narrower fractures with aperture size of less than ~50 µm (Fracture 1) and ~100 µm (Fracture 2) (Figure 3.13) compared to Cement #1 (aperture size = ~150-300 µm) before compressive loading and CO2 reaction (Figure 3.3). XMT images displayed distinctive alteration zones such as the degradation front with dark color and the carbonated zone with bright color (Figure 3.13–Figure 3.15), which are similar to the alteration zones formed by 100% CO2-saturated groundwater (Figure 3.2). Consistent with XRD data, the XMT imaging indicates that the impact of H2S in CO2-saturated groundwater on cement alteration was limited and the cement alteration rate was similar between the experiment with 100% CO2 and that with CO2-H2S (Table 3.1). The depth of cement alteration by reaction in CO2-H2S saturated groundwater for 3.5 months was on average 2.17 mm, equivalent to the alteration rate of 0.021 mm/d (Figure 3.15), while depth of cement alteration by CO2-saturated groundwater after 3 months of reaction was on average 1.84 mm and 1.70 mm for cement columns cured at high P-T and ambient P-T conditions, respectively (Table 3.1), which correspond to the alteration rates of 0.020 mm/d and 0.019 mm/d, respectively. This is consistent with previous studies of cement-CO2-H2S reaction, in which the cement alteration by H2S-CO2 was similar to alteration by CO2 alone, except for the sulfidation of ferrite (Jacquemet et al. 2008; Kutchko et al. 2011; Jacquemet et al. 2012). The H2S reactivity with cement in this study was limited, probably because the effect of H2S on the pH of CO2-saturated water is minor in the absence of oxygen (Knauss et al. 2005; Xu et al. 2007; Koenen et al. 2011).

3.13
Figure 3.10. XRD Patterns for White Crystals Formed on the Outside Surface of Cement #11 and Cement
#12 (white circles in the figure) after Reaction with CO2-H2S Saturated Groundwater at 50°C and 10 MPa for 3.5 Months.
Figure 3.11. XRD Patterns for Cement #11 after Reaction with CO2-H2S Saturated Groundwater at 50°C
and 10 MPa for 3.5 months. Spot #1: interior cement matrix; Spot #2: calcium carbonate sealing in cement fracture; Spot #3: the carbonated zone with orange color: Spot #4: the carbonated zone with dark color. The red smooth curve indicates the background subtraction.
30 40 50 60 70 80 90 100 110 120 130 140 150Two-Theta (deg)
0
50
100
150
Inte
nsity
(Cou
nts)
[Cement 7 white crystals.asc]00-047-1743> Calcite - CaCO3
30 40 50 60 70 80 90 100 110 120 130 140 150Two-Theta (deg)
0
25
50
75
100
125
Inte
nsity
(Cou
nts)
[Cement 7 Area 1.asc]00-005-0586> Calcite - CaCO3
00-044-1481> Portlandite - Ca(OH)200-030-0226> Brownmillerite - Ca2(Al,Fe+3)2O5
30 40 50 60 70 80 90 100 110 120 130 140 150Two-Theta (deg)
0
50
100
150
Inte
nsity
(Cou
nts)
[Cement 7 Area 2 light.asc]00-047-1743> Calcite - CaCO3
00-041-1475> Aragonite - CaCO300-044-1481> Portlandite - Ca(OH)2
30 40 50 60 70 80 90 100 110 120 130 140 150Two-Theta (deg)
0
25
50
75
100
Inte
nsity
(Cou
nts)
[Cement 7 Area 3.asc]00-041-1475> Aragonite - CaCO3
00-047-1743> Calcite - CaCO300-060-0483> Vaterite - CaCO3
00-030-0226> Brownmillerite - Ca2(Al,Fe+3)2O5
30 40 50 60 70 80 90 100 110 120 130 140 150Two-Theta (deg)
0
25
50
75
Inte
nsity
(Cou
nts)
[Cement 7 Area 4.asc]00-041-1475> Aragonite - CaCO3
00-047-1743> Calcite - CaCO300-060-0483> Vaterite - CaCO3
00-030-0226> Brownmillerite - Ca2(Al,Fe+3)2O5
#1 #2
#4#3

3.14
Figure 3.12. XRD Patterns for Cement #12 after Reaction with CO2-H2S-Saturated Groundwater at 50°C
and 10 MPa for 3.5 Months. Spot #1: interior cement matrix; Spot #2: the degradation front; Spot #3: the carbonated zone with orange color; Spot #4: the carbonated zone with dark color. The red smooth curve indicates the background subtraction.
XMT images provided 3-D visualization of preferential cement alteration along the fractures (Figure 3.14), consistent with visual inspection of cement cross-sections (Figure 3.9). The narrower cement fractures with aperture size < ~50 µm were completely sealed with CaCO3, while larger cement fractures with aperture size of ~150–500 µm were partially sealed with CaCO3 (Figure 3.13 and Figure 3.14). After reaction with CO2-H2S-saturated groundwater, the fractures along the interface between cement and basalt caprock with aperture size of ~100–200 µm were partially filled with CaCO3, but the extent of CaCO3 precipitation was less than the CaCO3 precipitation in fractures within cement matrix. This is consistent with Cement #2, in which CaCO3 precipitation partially sealed the narrow fractures with aperture size < ~200 µm between cement and basalt, whereas no CaCO3 precipitation was visible in the larger fractures along the cement-basalt interface (Figure 3.6). This suggests that wellbore fracture healing by CaCO3 precipitation during geologic carbon sequestration with or without impurity H2S is more likely to occur in narrower apertures within cement matrix or along the cement-caprock interface. Cement alteration along the tightly bonded interface between cement and basalt was negligible (Figure 3.13 and Figure 3.14), suggesting that Portland-cement-based wellbore systems can provide an effective barrier to prevent significant CO2 migration during geologic carbon sequestration, if properly completed (Carey et al. 2007; Crow et al. 2010).
Compressive stress at 2.7 MPa applied on Cement #11 led to the opening of an existing fracture (Fracture 2), and the formation of a new fracture (Fracture 3; aperture size = ~50 µm) (Figure 3.13). The aperture size of Fracture 2 increased from ~100 µm to ~200 µm after compressive loading, while the change of aperture size for Fracture 1 was minor. The compressive loading also opened the interface
30 40 50 60 70 80 90 100 110 120 130 140 150Two-Theta (deg)
0
50
100
150
200
Inte
nsity
(Cou
nts)
[NRAP 65 Area 1.asc]00-044-1481> Portlandite - Ca(OH)2
00-047-1743> Calcite - CaCO300-041-1451> Ettringite - Ca6Al2(SO4)3(OH)12·26H2O
00-030-0226> Brownmillerite - Ca2(Al,Fe+3)2O5
30 40 50 60 70 80 90 100 110 120 130 140 150Two-Theta (deg)
0
10
20
30
40
50
60
70
Inte
nsity
(Cou
nts)
[NRAP 65 Area 2.asc]00-047-1743> Calcite - CaCO3
00-041-1451> Ettringite - Ca6Al2(SO4)3(OH)12·26H2O00-030-0226> Brownmillerite - Ca2(Al,Fe+3)2O5
00-041-1475> Aragonite - CaCO3
30 40 50 60 70 80 90 100 110 120 130 140 150Two-Theta (deg)
0
50
100
150
Inte
nsity
(Cou
nts)
[NRAP 65 Area 3.asc]00-047-1743> Calcite - CaCO3
00-030-0226> Brownmillerite - Ca2(Al,Fe+3)2O500-041-1475> Aragonite - CaCO3
00-033-0268> Vaterite - CaCO3
30 40 50 60 70 80 90 100 110 120 130 140 150Two-Theta (deg)
0
50
100
150
Inte
nsity
(Cou
nts)
[NRAP 65 Area 4.asc]00-047-1743> Calcite - CaCO3
00-030-0226> Brownmillerite - Ca2(Al,Fe+3)2O500-041-1475> Aragonite - CaCO3
00-060-0483> Vaterite - CaCO3
#2
#4
#1
#3

3.15
between cement and basalt along the round side of the basalt, resulting in a ~50 µm aperture (Figure 3.13). After the reaction with CO2-H2S-saturated groundwater for 3.5 months, the aperture sizes of Fracture 2 and Fracture 3 further increased to ~400–500 µm and ~200 µm, respectively, while the aperture at the cement-basalt interface increased to ~100–200 µm (Figure 3.13). The significant increase in fracture aperture size is similar to the enlargement of fractures in Cement #1, which was attributed to crystallization-induced pressure by newly formed CaCO3 during the 3-month reaction with CO2-saturated groundwater. However, it should be noted that after compressive loading at 2.7 MPa, Cement #11 was subjected to additional stress, a confining pressure of 8.3 MPa, during the porosity measurement using a CMS™-300 automated permeameter at Core Laboratories (Jung and Um 2013), which could possibly have caused further damage to the sample. Therefore it is difficult to attribute the cement fracture aperture increase in Cement #11 after the CO2-H2S reaction entirely to the crystallization-induced pressure due to CaCO3 precipitation.
Figure 3.13. Grayscale Horizontal XMT Slices of Cement #11 Before and After Compressive Loading at
2.7 MPa and Exposure to CO2-H2S-Saturated Groundwater at 50°C and 10 MPa for 3.5 Months.

3.16
Figure 3.14. Grayscale XMT Images of Vertical and Horizontal Slices of the Cement-Basalt Interface
Sample, Cement #11, after 3.5-Month Reaction with Synthetic Groundwater Equilibrated with Supercritical CO2 Containing 1% H2S.

3.17
Figure 3.15. Vertical and Horizontal XMT Slices of a Neat Cement Column, Cement #12, Exposed to
CO2-H2S-Saturated Groundwater at 50°C and 10 MPa for 3.5 Months.
3.6 Computational Fluid Dynamics Simulation of DI Water with Fracture Evolution
Figure 3.16A through Figure 3.16C display the final fracture surfaces of Cement #1 along with a horizontal slice of an XMT image for the three cases as visualized using Digital Data Viewer (DDV; Computational Geometry Consulting, Inc., http://cgc-code.org/). CFD simulations for all three cases were driven for DI water by a pressure gradient of 20 kPa. Therefore, differences in both the volumetric flow and the average velocity of the fluid within the fractures in the three simulation cases were dependent upon the connectivity of fractures and the available cross-sectional area for fluid flow.
Case 1 (before compressive loading): Figure 3.16D and Figure 3.16G show contours of pressure and stream traces colored by absolute velocity for Case 1. It is clear from these figures that two major fractures, one along the cement-basalt interface (Fracture 1) and the other within cement matrix (Fracture 2), are collectively well connected in the vertical direction, whereas the other major fracture within the cement matrix (Fracture 3) does not connect to Fracture 1 or Fracture 2. Hence, Fracture 3 was not included in the Case 1 simulation. The fluid entering Fracture 2 does not flow straight down due to the limited fracture connectivity in the upper part of Fracture 2 and aperture difference. After entering Fracture 2, fluid flows towards Fracture 1, and then moves back to Fracture 2 in the lower part of the sample without flow possibility in the middle region of Fracture 2. The overall flow velocity within Fracture 2 is much lower (0.44 m/s) compared to Fracture 1 (1.88 m/s). As expected, high velocity flow

3.18
region was found in Fracture 1 adjacent to joint area with Fracture 2 due to curvature and large fracture aperture. Even though Fracture 1 was well connected vertically, the simulated flow field was not uniform along the Fracture 1 surface from top to bottom, which indicates that fracture aperture sizes seem to be smaller in the lower region than the top areas. The intrinsic permeabilities calculated for Fracture 1 and Fracture 2 were 1.44 × 10⁻⁹ m2 and 1.92 × 10⁻¹⁰ m2, respectively (Table 3.2). Along a cross-section halfway between top and bottom, the average flow rate and average velocity of the fluid were 5.18 × 10⁻⁶ m3/s and 1.21 m/s respectively. The overall fracture permeability of the sample was 8.59 × 10⁻¹⁰ m2.
Figure 3.16. Vertically Connected Cement Fracture Surface of Cement #1 with XMT Image of a
Horizontal Slice (A-C), Contours Colored by Absolute Pressure (D-F), and Streamtraces Colored by Absolute Velocity (G-I) for the Three Different cases (A, D, G: before compressive loading; B, E, H: after compressive loading; C, F, I: after CO2 reaction)
Case 2 (after compressive loading): After applying the compressive loading at 2.7 MPa, the fracture within the cement matrix (Fracture 3) opened up along the longitudinal axis and was connected with the other two major fractures (Fractures 1 and 2) (Figure 3.16B). Fracture 1 along the cement-basalt interface was connected to Fracture 3 within the cement matrix through a narrow passage after compressive loading. The fluid velocity within Fracture 3 is relatively low at 0.50 m/s, but accelerates through the narrow connection to Fracture 1 and the average velocity within Fracture 1 increases from 1.88 m/s to 2.14 m/s after additional compressive loading due to the expanded fracture apertures. In addition, more uniform and relatively higher flow velocity profiles were found along most of Fracture 1 surface after compressive loading (Figure 3.16H) compared to those in Figure 3.16G. The permeability of Fracture 3 is 3.56 × 10⁻¹⁰ m2. After compressive loading, the noticeable increase in flow velocity within the sample
Fracture 1
Fracture 3
A
B
C
D
E
F
G
H
IPressure (kpa) Absolute Velocity (m/s)

3.19
could be attributed to the opening up of the fractures, particularly in the lower half of the sample, by mechanical stress. The change in flow velocity within Fracture 2 from 0.44 m/s in Case 1 to 0.59 m/s in Case 2 is due to the application of compressive force and the increased fracture connectivity in vertical consequently. The intrinsic permeabilities for Fractures 1 and 2 are 1.74 × 10⁻⁹ m2 and 4.36 × 10⁻¹⁰ m2, respectively, which are greater than those noticed in Case 1 (Table 3.2). The average flow rate along a cross-section at the middle of the fractures was 8.58 × 10⁻⁶ m3/s, which is greater than the average flow rate in Case 1. This is mainly attributed to the increase in the cross-sectional area of Fracture 1 from 2.73 × 10⁻⁶ m2 in Case 1 to 3.21× 10⁻⁶ m2 in Case 2 by the applied compressive stress (Table 3.2). However, the average velocity of 1.26 m/s is similar to Case 1 because the Case 1 simulation did not include Fracture 3, which exhibits flow velocities comparatively lower than Fractures 1 and 2. The bulk fracture permeability of the sample in Case 2 is 9.96 × 10⁻¹⁰ m2, which is greater than Case 1 (8.59 × 10⁻¹⁰ m2).
Table 3.2. The Fluid Flow Characteristics of Fractures of the Composite Cement-Basalt Core (Cement #1) before Compressive Loading (Case 1), after Compressive Loading (Case 2), and after CO2 Reaction (Case 3) Simulated by CFD Modeling
Case Fracture area Flow rate Flow velocity Permeability m2 m3/s m/s m2
Case 1 Fracture 1 2.73E-06 4.63E-06 1.88 1.44E-09 Fracture 2 2.40E-06 5.42E-07 0.44 1.92E-10 Fracture 3 - - - -
Bulk 5.13E-06 5.18E-06 1.21 8.59E-10
Case 2 Fracture 1 3.21E-06 6.64E-06 2.14 1.74E-09 Fracture 2 2.43E-06 1.26E-06 0.59 4.36E-10 Fracture 3 1.60E-06 6.78E-07 0.50 3.56E-10
Bulk 7.24E-06 8.58E-06 1.26 9.96E-10
Case 3 Fracture 1 4.56E-06 9.94E-06 2.24 2.03E-09 Fracture 2 1.80E-06 1.05E-07 0.20 5.42E-11 Fracture 3 - - - -
Bulk 6.36E-06 1.00E-05 1.66 1.47E-09
Case 3 (after CO2 reaction): Due to the partial filling of Fractures 2 and 3 with calcium carbonate precipitates after CO2 reaction, Fracture 3 was once again disconnected from Fractures 1 and 2; therefore Fracture 3 was not included in the simulation (Figure 3.16C, Figure 3.16F, and Figure 3.16I). In addition, the flow velocity in Fracture 2 is significantly reduced, to 0.20 m/s with decreased fracture aperture after CO2 reaction. Fracture 1, on the other hand, exhibited a marginal increase in overall flow velocity (2.24 m/s) and flow rate (9.94 × 10⁻⁶ m3/s), most likely due to the reduced flow rate in Fracture 2 (1.05 × 10⁻⁷ m3/s) in Case 3 compared to Case 2 (1.26 × 10⁻⁶ m3/s) and Case 1 (5.42 × 10⁻⁷ m3/s) (Table 3.2). In addition, more uniformly distributed high flow velocity was found in Fracture 1 because of increased

3.20
pressure distribution in the middle region of Fracture 1 (Figure 3.16F) compared to Figure 3.16D and 3.16E. More areas of higher pressure (10-15 kPa) regions became discernible in Fracture 1 (Figure 3.16F), because of increased relative pressure per decreased fracture surface areas in Case 3. Or increased Fracture 1 could be possible because dissolution reaction was preferable along the interface fracture like Fracture 1, while preferential CaCO3 precipitate reaction occurred in the cement fractures (Fractures 2 and 3) because of enough Ca source in Fractures 2 and 3 compared to Fracture 1. The permeabilities of Fracture 1 and Fracture 2 are 2.03 × 10⁻⁹ m2 and 5.42 × 10⁻¹¹ m2, respectively. The reduced permeability of Fracture 2 could be attributed to calcium carbonate formation within the fracture in the cement. The average flow rate and average velocity along a cross-section at the middle of the fractures (Fractures 1 and 2 combined in Case 3) were 1.0 × 10⁻⁵ m3/s and 1.66 m/s, respectively. The average flow rate and flow velocity for Case 3 are higher than those for Cases 1 and 2 because the fluid flow in Case 3 occurs predominantly along Fracture 1, which is now wider than in Cases 1 and 2, while Fractures 2 and 3 are nearly disconnected by calcium carbonate precipitation (Figure 3.3 and Figure 3.5). The width increase observed in Fracture 1 occurs even after CO2 reaction. This has to do with the fact that extensive calcium carbonate precipitation with high molar volume induced a pressure increase within Fracture 2 and caused the widening of both Fractures 1 and 2, since they are interconnected. The overall fracture permeability of the sample in Case 3 was 1.47 × 10⁻⁹ m2, which is greater than in Case 1 (8.59 × 10⁻¹⁰ m2) and Case 2 (9.96 × 10⁻¹⁰ m2) as shown in Table 3.2.
Experimentally measured average permeability of eight measurements for Case 3 (1.08 ± 0.03 × 10⁻⁹ m2) (Table 3.3) was in good agreement with the permeability predicted in Case 3 by CFD modeling. In addition, the XMT imaging of KI infiltration through fractures after the CO2 reaction supports the CFD modeling results (Figure 3.17). Fracture 1 (cement-basalt interface) was completely filled with KI solution (bright grayscale color) from top to bottom because of good vertical connectivity, while Fracture 2 and Fracture 3 appeared empty or less filled by KI solution, except for the top 5 mm, due to poor vertical connectivity as a result of extensive calcium carbonate precipitation filling the fractures (Figure 3.17).
Table 3.3. The Results of Constant-Head Permeability Measurements for the Composite Cement-Basalt Core (Cement #1) and the Calculated Permeability after CO2 Reaction (Case 3)
Measurement Flow (mL)
Time (s)
Flow rate (m3/s)
Hydraulic conductivity (m/s)
Permeability (m2)
1 7.6 65 1.17E-07 1.08E-02 1.10E-09
2 8.23 68 1.21E-07 1.12E-02 1.14E-09
3 6.75 60 1.13E-07 1.04E-02 1.06E-09
4 6.82 60 1.14E-07 1.05E-02 1.07E-09
5 6.93 60 1.16E-07 1.07E-02 1.09E-09
6 6.61 60 1.10E-07 1.02E-02 1.04E-09
7 6.99 60 1.17E-07 1.08E-02 1.10E-09
8 6.78 60 1.13E-07 1.05E-02 1.07E-09
Average 1.15E-07 1.06E-02 1.08E-09

3.21
Figure 3.17. Grayscale XMT Images of Horizontal and Vertical Slices of Cement #1 Scanned during the
Infiltration of KI solution (0.3 g/mL; light region) into Cement Fractures. Fracture 1 is filled with KI solution from top to bottom, while only the top parts of Fracture 2 and Fracture 3 are filled with KI solution.
3.7 Computational Fluid Dynamics Modeling of CO2-Saturated Brine and Supercritical CO2 with Fracture Evolution
In order to better understand the geochemical and geomechanical effects on cement fracture evolution and fluid flow change under geologic carbon sequestration conditions, CFD modeling was performed to simulate flow of CO2-saturated brine (1 mol/kg; kinematic viscosity: 0.599 mPa·s, dynamic viscosity: 0.62 mPa•s, and density: 1.035 g/mL) and supercritical CO2 (kinematic viscosity: 0.074 mPa·s, dynamic viscosity: 0.0284 mPa•s, and density: 0.384 g/mL) at 50°C and 10 MPa. To examine the effect of pressure gradients on CO2 fluid flow through cement fractures, the CFD modeling was conducted with an inlet pressure of 20 kPa and 200 kPa and an outlet pressure of 0 Pa. This corresponds to pressure gradients of 1 MPa/m and 10 MPa/m along ~2 cm-long cement fractures, respectively. Additionally, a pressure difference of 1 MPa between the inlet and outlet was used to simulate flow of supercritical CO2 fluid. However, due to lack of noticeable differences in flow characteristics between the 1 MPa case and the 200 kPa case, the results from the 1 MPa case were not included in this report.
Compressive loading at 2.7 MPa increased the aperture areas of Fracture 1 and Fracture 2 by 17% and 11%, respectively (Table 3.4), and interconnected Fracture 3 to Fracture 1 and Fracture 2 (Figure 3.18 and Figure 3.19). After compressive loading, for CO2-saturated brine flow at 1 MPa/m pressure gradient (or 20 kPa pressure difference), the average flow rate, velocity, and permeability increased by factors of 1.3, 1.1, and 1.1, respectively, for Fracture 1, while they increased by factors of 26, 23, and 22, respectively, for Fracture 2. This suggests that the mechanical stress increases the fracture connectivity much more significantly for Fracture 2 than Fracture 1. For CO2-saturated brine flow at 10 MPa/m pressure gradient
Cement
Basalt
Fracture 1
Fracture 1
Fracture 1
Fracture 2BasaltCement
KI solution Fracture 1
Fracture 3

3.22
(or 200 kPa pressure difference), the increases in average flow rate, velocity, and permeability along Fracture 1 after compressive loading were similar to the CO2 brine flow at 1 MPa/m, but the increase was only by a factor of 7–8 along Fracture 2 (Table 3.4).
The chemical reaction with CO2-saturated brine at 50°C and 10 MPa resulted in increased aperture area of Fracture 1 by 36% but decreased aperture area of Fracture 2 by 73% due to CaCO3 precipitation. Whether the pressure gradient is 1 MPa/m or 10 MPa/m, the average flow rate, velocity, and permeability of Fracture 1 increase by factors of 1.5, 1.1, and 1.2, respectively compared to those in Case 2. The flow of CO2-saturated brine through Fracture 2 is predicted to be significantly reduced after reaction with CO2-saturated groundwater because of CaCO3 precipitation along Fracture 2. The average flow rate, velocity, and permeability of Fracture 2 decreased by factors of 81, 22, and 20 at a pressure gradient of 1 MPa/m, while they decreased by factors of 44, 12, and 11 at a pressure gradient of 10 MPa/m (Table 3.4 and Figure 3.20). A pressure gradient increase from 1 MPa/m to 10 MPa/m (by an order of magnitude) results in an increase in the CO2 fluid flow rate or flow velocity by a factor of only 2.7–8.6 (Table 3.4 and Figure 3.18–Figure 3.20). Therefore, the fracture permeabilities calculated based on Darcy’s law are lower by factors of 1.2–3.7 for the CFD simulation with 1 MPa/m pressure gradient than for the CFD simulation with 10 MPa/m. This is attributed to the increased friction of CO2-saturated brine along the cement fracture surfaces with higher flow rate due to the enhanced pressure gradient.
The CFD simulation of supercritical CO2 flow through cement fractures shows overall similar flow pattern changes to CO2-saturated brine flow after compressive loading and CO2 reaction, but the extent is different. At a pressure gradient of either 1 MPa/m or 10 MPa/m, the average flow rate, velocity, and permeability for Fracture 1 increased by approximately 10–40% after compressive loading and CO2 reaction (Figure 3.18, Figure 3.19, and Table 3.5). For Fracture 2, the compressive loading led to an increase of average flow rate, velocity, and permeability by factors of ~4-5 at 1 MPa/m pressure gradient and by factors of ~3 at 10 MPa pressure gradient. Consistent with the CFD modeling of CO2-saturated brine flow, the CO2 reaction resulted in a significant decrease in fluid flow through Fracture 2. At pressure gradients of both 1 MPa/m and 10 MPa/m, the average flow rate, velocity, and permeability along Fracture 2 decreased by factors of 41, 11, and 10 after CO2 reaction (Table 3.5 and Figure 3.20). Although the pressure gradient increases from 1MPa/m to 10 MPa/m (by an order of magnitude), the average flow rate and velocity of supercritical CO2 increase by factors of only 3.0–4.6. Therefore, the permeabilities calculated based on Darcy’s law are lower by factors of 2.2–3.3 when the pressure gradient is higher. This results from higher friction of supercritical CO2 along the cement fracture surfaces with higher flow rate due to the increased pressure gradient.
At the same pressure gradient, there is a significant difference in simulated fluid velocity and calculated permeability between CO2-saturated brine flow and supercritical CO2 flow. The fluid velocity is higher by approximately 2 to 3 times for supercritical CO2 than for CO2-saturated brine at 1 MPa/m pressure gradient, except for Fracture 2 before compressive loading, which shows an ~8 times higher flow rate for supercritical CO2 than for CO2-saturated brine. At 10 MPa/m pressure gradient, the flow velocity is higher by ~2 for supercritical CO2 than for CO2-saturated brine, except for Fracture 2 before compressive loading. It appears that the higher flow velocity for supercritical CO2 than for CO2-saturated brine is attributed to significantly lower kinematic viscosity of supercritical CO2 (7.38 x 10⁻⁸ m2/s) compared to CO2-saturated brine (5.99 x 10⁻⁷ m2/s) at 50°C and 10 MPa. Accordingly the calculated permeability is higher by a factor of ~8–16 for CO2-saturated brine than for supercritical CO2 at pressure gradients of 1 MPa/m and 10 MPa/m, except for Fracture 2 before compressive loading, which shows ~3–5 times higher permeability for CO2-saturated brine than for supercritical CO2.

3.23
Table 3.4. CFD Modeling Results of CO2-Saturated Brine Flow through Fractures of the Composite Cement-Basalt Core (Cement #1) at Pressure Gradients of ~1 MPa/m (inlet pressure: 20 kPa and outlet pressure: 0 kPa) and ~10 MPa/m (inlet pressure: 200 kPa and outlet pressure: 0 kPa) before Compressive Loading (Case 1), after Compressive Loading (Case 2), and after CO2 Reaction (Case 3)
Pressure gradient: 1 MPa/m (pressure difference of 20 kPa for ~2 cm long sample) Area (m2) Flow rate (m3/s) Average velocity (m/s) Permeability (m2)
Case 1 Fracture 1 2.92E-06 5.93E-06 2.03E+00 1.11E-09 Fracture 2 2.31E-06 4.46E-08 1.94E-02 1.06E-11 Fracture 3 - - - Bulk 5.25E-06 5.98E-06 1.14E+00 6.21E-10
Case 2 Fracture 1 3.41E-06 7.79E-06 2.28E+00 1.19E-09 Fracture 2 2.56E-06 1.15E-06 4.50E-01 2.35E-10 Fracture 3 2.02E-06 8.79E-07 4.35E-01 2.27E-10 Bulk 8.06E-06 9.83E-06 1.22E+00 6.38E-10
Case 3 Fracture 1 4.63E-06 1.17E-05 2.52E+00 1.45E-09 Fracture 2 6.85E-07 1.42E-08 2.07E-02 1.19E-11 Fracture 3 - - - Bulk 5.34E-06 1.17E-05 2.19E+00 1.26E-09
Pressure gradient: 10 MPa/m (pressure difference of 200 kPa for ~2 cm long sample) Area (m2) Flow rate (m3/s) Average velocity (m/s) Permeability (m2)
Case 1 Fracture 1 2.92E-06 2.40E-05 8.21E+00 4.48E-10 Fracture 2 2.31E-06 3.83E-07 1.66E-01 9.05E-12 Fracture 3 - - - Bulk 5.25E-06 2.44E-05 4.64E+00 2.53E-10
Case 2 Fracture 1 3.41E-06 3.30E-05 9.66E+00 5.05E-10 Fracture 2 2.56E-06 3.10E-06 1.21E+00 6.34E-11 Fracture 3 2.02E-06 3.61E-06 1.79E+00 9.35E-11 Bulk 8.06E-06 3.97E-05 4.93E+00 2.58E-10
Case 3 Fracture 1 4.63E-06 4.86E-05 1.05E+01 6.05E-10 Fracture 2 6.85E-07 7.00E-08 1.02E-01 5.88E-12 Fracture 3 - - - Bulk 5.34E-06 4.87E-05 9.12E+00 5.26E-10

3.24
Table 3.5. CFD Modeling Results of Supercritical CO2 Flow through Fractures of the Composite Cement-Basalt Core (Cement #1) at Pressure Gradients of ~1 MPa/m (inlet pressure: 20 kPa and outlet pressure: 0 kPa) and ~10 MPa/m (inlet pressure: 200 kPa and outlet pressure: 0 kPa) before Compressive Loading (Case 1), after Compressive Loading (Case 2), and after CO2 Reaction (Case 3)
Pressure gradient: 1 MPa/m (pressure difference of 20 kPa for ~2 cm long sample) Area (m2) Flow rate (m3/s) Average velocity (m/s) Permeability (m2)
Case 1 Fracture 1 2.92E-06 1.39E-05 4.75E+00 1.19E-10 Fracture 2 2.31E-06 3.43E-07 1.49E-01 3.71E-12 Fracture 3 - - - - Bulk 5.25E-06 1.35E-05 2.58E+00 6.43E-11
Case 2 Fracture 1 3.41E-06 1.88E-05 5.51E+00 1.32E-10 Fracture 2 2.56E-06 1.56E-06 6.08E-01 1.46E-11 Fracture 3 2.02E-06 2.13E-06 1.05E+00 2.52E-11 Bulk 8.06E-06 2.25E-05 2.80E+00 6.69E-11
Case 3 Fracture 1 4.63E-06 2.71E-05 5.84E+00 1.54E-10 Fracture 2 6.85E-07 3.84E-08 5.61E-02 1.48E-12 Fracture 3 - - - - Bulk 5.34E-06 2.71E-05 5.08E+00 1.34E-10
Pressure gradient: 10 MPa/m (pressure difference of 200 kPa for ~2 cm long sample) Area (m2) Flow rate (m3/s) Average velocity (m/s) Permeability (m2)
Case 1 Fracture 1 2.92E-06 4.21E-05 1.44E+01 3.60E-11 Fracture 2 2.31E-06 1.56E-06 6.78E-01 1.69E-12 Fracture 3 - - - - Bulk 5.25E-06 4.36E-05 8.31E+00 2.07E-11
Case 2 Fracture 1 3.41E-06 6.05E-05 1.77E+01 4.24E-11 Fracture 2 2.56E-06 4.96E-06 1.94E+00 4.64E-12 Fracture 3 2.02E-06 6.96E-06 3.45E+00 8.24E-12 Bulk 8.06E-06 7.24E-05 8.98E+00 2.15E-11
Case 3 Fracture 1 4.63E-06 8.71E-05 1.88E+01 4.96E-11 Fracture 2 6.85E-07 1.22E-07 1.78E-01 4.70E-13 Fracture 3 - - - -
Bulk 5.34E-06 8.72E-05 1.63E+01 4.31E-11

3.25
Figure 3.18. Fluid Velocity Contours (left column) and Fluid Streamtraces (right column) for
CO2-Saturated Brine at 50°C and 10 MPa (A: 1 MPa/m pressure gradient, B: 10 MPa/m pressure gradient), as well as Supercritical CO2 at 50°C and 10 MPa (C: 1 MPa/m pressure gradient, D: 10 MPa/m pressure gradient) before Compressive Loading (Case 1).
A
D
C
B

3.26
Figure 3.19. Fluid Velocity Contours (left column) and Fluid Streamtraces (right column) for
CO2-Saturated Brine at 50°C and 10 MPa (A: 1 MPa/m pressure gradient, B: 10 MPa/m pressure gradient), as well as Supercritical CO2 at 50°C and 10 MPa (C: 1 MPa/m pressure gradient, D: 10 MPa/m pressure gradient) after Compressive Loading at 2.7 MPa (Case 2).
A
D
C
B

3.27
Figure 3.20. Fluid Velocity Contours (left column) and Fluid Streamtraces (right column) for
CO2-Saturated Brine at 50°C and 10 MPa (A: 1 MPa/m pressure gradient, B: 10 MPa/m pressure gradient), as well as Supercritical CO2 at 50°C and 10 MPa (C: 1 MPa/m pressure gradient, D: 10 MPa/m pressure gradient) after Reaction with CO2-Saturated Groundwater at 50°C and 10 MPa for 3 Months (Case 3).
Before compressive loading, the flow velocity of CO2-saturated brine or supercritical CO2 is significantly higher along Fracture 1 than Fracture 2 because Fracture 1 has better fracture connectivity than Fracture 2. CO2-saturated brine or supercritical CO2 flows straight along the surface of Fracture 1, whereas flow vortices and recirculation zones could be noticed in Fracture 2 due to poor connectivity and
A
D
C
B

3.28
flow blockages (Figure 3.18). After compressive loading, the vorticity of CO2 fluid within Fracture 2 is significantly reduced because the fracture is better connected due to the opening of Fracture 2. After CO2 reaction, the flow of CO2 fluid through Fracture 2 becomes negligible because the fracture is sealed by CaCO3 precipitation.
3.8 Geomechanical Modeling of Cement Fracture Evolution
When a high pressure was applied to a fracture tip, the fracture propagation was calculated as shown in Figure 3.21. According to this result, the fracture in the cement material was extended up to 10 m in 140 seconds. The propagation speed appears to be significantly higher than for typical observations of CO2 leakage through wellbore integrity. To determine the cement fracturing rate, parametric studies on damage properties of the cement were conducted.
Figure 3.21. Cement Fracture Propagation over Time. Color represents the fracture aperture size.
First, fracture propagation in the cement was calculated with increasing threshold stress (Figure 3.22) with applied constant pressure of 18 MPa. When the fracture propagates, the fracture aperture will be widened and the nodes on the fracture path (shown in Figure 3.21) will be displaced in the vertical direction with time. In Figure 3.22, Node a, which was placed near an initial fracture tip, moved quickly after a high pressure condition (18 MPa) was applied. Node e, which was placed 8 m away from Node a, started to move approximately after around 3 sec. This indicates that the cement fracturing rate was approximately 2.5 m/s under given threshold stress value of 320 kPa. When the threshold stress was increased to 8 MPa, Node e started to move in 5 seconds, and the fracturing rate decreased to 1.6 m/s compared to previous low threshold stress condition (320 kPa). However, when the threshold stress was increased to 9 MPa, the cement fracture did not start to propagate any more by applied pressure of 18 MPa. In addition, to see the effect of Gc (energy for complete fracturing) on fracture behavior, simulations were performed with the value changing from 28 kJ/m3 to 28,000 kJ/m3. However, its effect of varying Gc was very minor compared to the threshold stress and could be negligible.

3.29
Figure 3.22. Displacement of Five Nodes in Figure 3.21 with Fracture Propagation as a Function of Time
and Threshold Stresses.
In the present simulations, the threshold stress was assumed to be a constant value for all coherent elements. However, the threshold value for damage (or fracture) initiation in the cement material can be changed in a wellbore environment during geologic carbon sequestration. Geochemical alteration of wellbore cement by CO2-rich groundwater/brine or supercritical CO2 can deteriorate the mechanical properties of wellbore cement. Therefore the cement fracture growth and propagation will depend on chemical reaction between cement and CO2 fluid as well. For better long-term prediction of cement fracture evolution, the threshold stress property should be given as a function of time, to reflect the wellbore cement degradation with time and CO2 reaction.
3.9 Coupled Geochemical and Geomechanical Effects on Integrity of Fractured Wellbore Cement during Geologic Carbon Sequestration
XMT images of horizontal and vertical slices for Cement #1 (Figure 3.3 and Figure 3.4) show that extensive precipitation of CaCO3 occurred along the fractures within the cement matrix (typical aperture size: ~150–300 µm) after the reaction with CO2-saturated groundwater under static condition, but not along the fractured cement-basalt interface (typical aperture size: ~200 µm). The XMT images of other cement-basalt caprock cores such as Cement #2, Cement #5, Cement #8, and Cement #11 showed that precipitation of CaCO3 was visible along parts of the fractured cement-basalt interface with aperture size smaller than ~200 µm, but not along parts of the fractured cement-basalt interface with aperture size larger than ~200 µm. Previous experimental studies have consistently reported that there was a significant calcium carbonate precipitation within the cement fractures under both flowing and static conditions, whereas no calcium carbonate precipitation occurred in the fracture along the cement-caprock interface by flowing CO2-brine under flowing conditions. Few studies have investigated carbonation along the fractured cement-caprock interface by CO2-brine/groundwater at high P-T conditions under static condition. Newell and Carey (2013) and Mason et al. (2013) showed that the flow of CO2-brine (10 MPa and 60°C or 3 MPa and 60ºC) caused leaching and erosion along the cement-caprock boundary without calcium carbonate precipitation along the interface (Mason et al. 2013; Newell and Carey 2013). In contrast, Wigand et al. (2009) reported calcium carbonate precipitation within the fracture of a cement

3.30
core during injection of the CO2-brine through a shale caprock at 19.9 MPa and 54°C (Wigand et al. 2009). Another flow-through experiment with an analog dilute acid (pH = 2.0–3.15) and a fractured cement core also showed mineral precipitation (e.g., calcite) along the fracture (Huerta et al. 2013). Under static condition, heavy carbonation in cement pores and precipitation of calcium carbonate in the fracture plane occurred after reaction with the water-saturated supercritical CO2 (Liteanu and Spiers 2011).
Figure 3.23. A: Grayscale XMT Image of a Vertical Slice of the Cement-Basalt Interface Sample
(Cement #1) after 3-Month Reaction with CO2-Saturated Groundwater at 10 MPa and 50°C. B: Schematic Diagram Showing the Mechanism for More Extensive Calcium Carbonate Precipitation within the Cement Fracture than in the Fracture at the Cement-Basalt Interface during Reaction with CO2-Saturated Groundwater. C: Grayscale Horizontal XMT Image Showing Three Major Fractures after Compressive Loading and before the Reaction with CO2-Saturated Groundwater. D: Grayscale Horizontal XMT Image Showing CaCO3 Precipitation within Cement Fractures, as well as the Widening of Fractures by Crystallization-Induced Pressure after Reaction with CO2-Saturated Groundwater
More extensive calcium carbonate precipitation within the cement fracture than along the cement-basalt interface in Cement #1 and other cement-basalt caprock cores could result from a higher concentration of Ca2+ and higher pH within the cement fractures than in the fracture along the cement-basalt caprock interface (Figure 3.23). When CO2-saturated groundwater reacts with the cement
Basalt caprock
Unalteredcement
Carbonated zone
Calcium carbonate
Basaltcaprock
High Ca2+
diffusionHigh Ca2+
diffusionLow Ca2+
diffusion
High Ca2+ and pHLow Ca2+ and pH
CaCO3
Cement Cement
A B
C D CaCO3precipitation
Crystallization induced pressure
No CaCO3precipitation10 MPa CO2
pressure

3.31
matrix, dissolved Ca2+ concentration increases and the pH is buffered as a result of dissolution of Ca(OH)2 or C-S-H phase in the cement (Kutchko et al. 2007). However, it seems that the dissolution rate of basalt caprock by CO2-saturated groundwater is much slower than the dissolution rate of hydrated cement due to the limited diffusion of CO2 through the small pores of low-permeability basalt caprock (Zakharova et al. 2012). In addition, the fracture connectivity in the cement matrix was poorer than the fracture connectivity along the straight cement-basalt interface prior to the CO2 reaction (Figure 3.23). These differences probably contributed to a more preferable microenvironment for CaCO3 precipitation and deposition within cement fractures compared to the fracture along the cement-basalt interface (Figure 3.23B). Wolterbeek et al. (2013) reported a similar result: the healing of debonding defects at casing-cement interfaces was slower and less effective than healing of fractures in cement because the thin corrosion scale films formed on cement surfaces interfacing with steel inhibited release of Ca2+ from the cement and impeded the precipitation of CaCO3 (Wolterbeek et al. 2013). In Cement #2, Cement #5, and Cement #8, the precipitation and deposition of CaCO3 occurred along the narrow fractures with apertures less than ~200 µm between cement and basalt, whereas no CaCO3 was visible in the fractures with larger apertures (Figure 3.5–Figure 3.7). This is attributed to a higher concentration of Ca2+ and higher pH localized along the narrower fractures, which thus leads to saturation with respect to CaCO3. Nevertheless, it is possible that micron- or nano-sized CaCO3 particles that are not detectable by XMT (voxel resolution: 10–25 µm) were formed in the large-aperture fractures along the cement-basalt interface. The experimental results suggest that the healing of wellbore cement fractures by calcium carbonate precipitation during geologic carbon storage is more likely to occur mostly within the cement matrix than along the cement-caprock interface (Wigand et al. 2009; Huerta et al. 2013; Mason et al. 2013; Newell and Carey 2013). It is also important to mention that a wellbore core consisting of casing, cement and shale caprock from a 30-year-old CO2-flooding operation at the SACROC Unit in West Texas showed heavy carbonation along the cement-shale interface by migration of CO2 (Carey et al. 2007). This suggests that a fracture along a cement-caprock interface can also be healed by calcium carbonate precipitation during long-term (e.g., decades) CO2 leakage, especially when the fracture aperture size is relatively small (< ~200 µm under the current experimental conditions).
Comparison of XMT images collected before and after the CO2 reaction reveals that the width of the three major fractures increased slightly (~30–40%) after the reaction with CO2-saturated groundwater (Figure 3.23C and Figure 3.23D). The width increase of Fractures 2 and 3 is attributed to the crystallization-induced pressure (up to ~75 MPa for calcite, depending on the supersaturation and the composition of the solution) (Wiltschko and Morse 2001; Wigand et al. 2009) due to the growth of calcium carbonate with high molar volume (e.g., calcite: 37 cm3/mol) (Liteanu and Spiers 2011) at the fracture surfaces. Geochemical equilibrium modeling indicates that the CO2-saturated groundwater reacting with Cement #1 at a cement solid-to-groundwater ratio of ~0.13 g/mL was saturated with respect to calcite (Jung and Um 2013). XRD analysis of Cement #11 after reaction with CO2-H2S-saturated groundwater revealed that the fracture filling mineral is purely calcite (Figure 3.11). The widening of Fracture 2 due to extensive calcium carbonate precipitation could have also caused the widening of Fracture 1 along the cement-basalt interface, because Fractures 1 and 2 were interconnected although no calcium carbonate precipitation was observed in Fracture 1 in XMT image analysis. In addition, the dissolution of cement along the interface with basalt caprock could have contributed to the widening of Fracture 1. The calcium carbonate precipitation in Fracture 2 and Fracture 3 contributed more dominantly to fracture sealing than to fracture opening, as CFD modeling predicted permeability decrease by more than an order of magnitude after CO2 reaction (Table 3.2 and Figure 3.16). Therefore cement fracture sealing by CaCO3 precipitation can improve the integrity of wellbores during geologic carbon

3.32
sequestration. Unlike Cement #1, it appears that the partial calcium carbonate precipitation along the cement-basalt interface in Cement #2, Cement #5, and Cement #8 did not lead to the opening of the fracture between cement and basalt (Figure 3.5–Figure 3.7). This could be attributed to incomplete fracture connectivity in Cement #2 or Cement #5, whereas the fractures in Cement #1 were completely connected from top to bottom before the CO2 reaction (Figure 3.4). In addition, the amount of calcium carbonate formed along the cement-basalt interface in Cement #2 or Cement #5 could be smaller than that along the cement fractures in Cement #1. This could result in lower crystallization-induced pressure in Cement #2 than in Cement #1. These results highlight the fact that geochemical reactions and geomechanical processes have coupled effects on the integrity of wellbores during geologic carbon sequestration.
In summary, the experimental and modeling results suggest that the precipitation of calcium carbonate in the fractures of wellbores with defects during geologic carbon storage can lead to the opening of fractures, but the permeability of fractures eventually decreases because of the filling of fractures with calcium carbonate. In addition, the fractured interface between cement and caprock is likely more vulnerable to the leakage of CO2 than the fractures within the cement matrix because calcium carbonate precipitation is less likely to occur along the fractured interface between cement and caprock, especially on large sized apertures (e.g., > ~200 µm under the current experimental conditions).

4.1
4.0 Conclusion
XMT imaging and CFD modeling results show that the integrity of wellbore cement material with defects is affected by coupled geochemical and geomechanical processes during geologic carbon sequestration. The 3-D XMT visualization displayed the opening and interconnection of cement fractures under mechanical stress at 2.7 MPa, and CFD modeling revealed that this stress led to an increase in fluid flow and permeability. After a 3-month reaction with CO2-saturated groundwater at 50°C and 10 MPa, extensive calcium carbonate precipitation occurred in the fractures within the cement matrix. This caused a decrease in permeability, but might increase the opening of cement fractures as well because of crystallization-induced pressure. In contrast, no extensive precipitation of calcium carbonate occurred along the fracture between cement and basalt caprock, especially in large sized apertures (e.g., > ~200 µm under the current experimental conditions). Long-term reaction of a fractured cement column with CO2-saturated groundwater over a period of 13 months resulted in progressive fracture healing by calcium carbonate precipitation. Extensive calcium carbonate precipitation also occurred along the cement fracture after a 3.5-month reaction with CO2-H2S-saturated groundwater, while the sealing of fractures along the cement-basalt caprock interface was minor. Micro-XRD analysis showed that major cement carbonation products by CO2-H2S-saturated groundwater were calcite, aragonite, and vaterite without pyrite found because of low H2S impurity in this study. The experimental results suggest that the fractures formed within the cement matrix are likely healed during the reaction with CO2-saturated groundwater, whereas the fractures along the cement-caprock interface are likely to remain vulnerable to the leakage of CO2. After 3-month exposure to CO2-saturated groundwater or 3.5-month reaction with CO2-H2S-saturated groundwater, the cement alteration rates were similar at ~0.02 mm/d regardless of the P-T conditions for cement curing or the presence of impurity H2S because the cement pore structure change was governed mostly by extensive carbonation, which can significantly reduce the porosity and permeability of the cement material. CFD modeling was performed to simulate flow of CO2-saturated brine and supercritical CO2 at pressure gradients of 1 MPa/m and 10 MPa/m corresponding of 20 kPa and 200 kPa pressure difference along about ~2 cm long cement sample. The results show that a pressure gradient increase from 1 MPa/m to 10 MPa/m resulted in the increase of CO2 fluids flow by a factor of only ~3–9 because the friction of CO2 fluids on cement surfaces increases with higher flow rate. At the same pressure gradient, the simulated flow rate was higher for supercritical CO2 than for CO2-saturated brine by a factor of only ~2–3, although the viscosity of supercritical CO2 is lower than that of CO2-saturated brine by a factor of ~8. A preliminary geomechanical simulation using ABAQUS code showed that a differential pressure of 18 MPa applied, which can be formed due to overpressure during CO2 injection, can lead to extensive fracture propagation in wellbore cement. However, coupled geochemical and geomechanical reactions should be understood to make long-term prediction for fracture propagation of wellbore cement and potential CO2 leakage through wellbore integrity.


5.1
5.0 References
Bachu S, and DB Bennion. 2009. "Experimental assessment of brine and/or CO2 leakage through well cements at reservoir conditions." International Journal of Greenhouse Gas Control 3(4) 494-501.
Bachu S, WD Gunter, and EH Perkins. 1994. "Aquifer disposal of CO2 - Hydrodynaic and mineral trapping " Energy Conversion and Management 35(4) 269-279.
Bachu S, and TL Watson. 2009. "Review of failures for wells used for CO2 and acid gas injection in Alberta, Canada." In: Gale, J., Herzog, H., Braitsch, J. (Eds.), Greenhouse Gas Control Technologies 9. Energy Procedia. Elsevier Science Bv, Amsterdam, pp. 3531-3537.
Bando S, F Takemura, M Nishio, E Hihara, and M Akai. 2004. "Viscosity of aqueous NaCl solutions with dissolved CO2 at (30 to 60) degrees C and (10 to 20) MPa." Journal of Chemical and Engineering Data 49(5) 1328-1332.
Bruant RG, AJ Guswa, MA Celia, and CA Peters. 2002. "Safe storage of CO2 in deep saline aquifers." Environmental Science & Technology 36(11) 240A-245A.
Bryant S, and LW Lake. 2005. "Effect of Impurities on Subsurface CO2 Storage Processes." In: Thomas, D.C., Benson, S.M. (Eds.), Carbon Dioxide Capture for Storage in Deep Geologic Formations. Elsevier Ltd, pp. 983-996.
Carey JW, R Svec, R Grigg, J Zhang, and W Crow. 2010. "Experimental investigation of wellbore integrity and CO2-brine flow along the casing-cement microannulus." International Journal of Greenhouse Gas Control 4(2) 272-282.
Carey JW, M Wigand, SJ Chipera, G WoldeGabriel, R Pawar, PC Lichtner, SC Wehner, MA Raines, and GD Guthrie. 2007. "Analysis and performance of oil well cement with 30 years Of CO2 exposure from the SACROC Unit, West Texas, USA." International Journal of Greenhouse Gas Control 1(1) 75-85.
Carson JP, DR Einstein, KR Minard, MV Fanucchi, CD Wallis, and RA Corley. 2010a. "High resolution lung airway cast segmentation with proper topology suitable for computational fluid dynamic simulations." Computerized Medical Imaging and Graphics 34(7) 572-578.
Carson JP, DR Einstein, KR Minard, MV Fanucchi, CD Wallis, and RA Corley. 2010b. "High resolution lung airway cast segmentation with proper topology suitable for computational fluid dynamic simulations." Comput Med Imaging Graph 34(7) 572-8.
Carson JP, AP Kuprat, X Jiao, V Dyedov, F Del Pin, JM Guccione, MB Ratcliffe, and DR Einstein. 2010c. "Adaptive generation of multimaterial grids from imaging data for biomedical Lagrangian fluid-structure simulations." Biomech Model Mechanobiol 9(2) 187-201.
Crow W, JW Carey, S Gasda, DB Williams, and M Celia. 2010. "Wellbore integrity analysis of a natural CO2 producer." International Journal of Greenhouse Gas Control 4(2) 186-197.
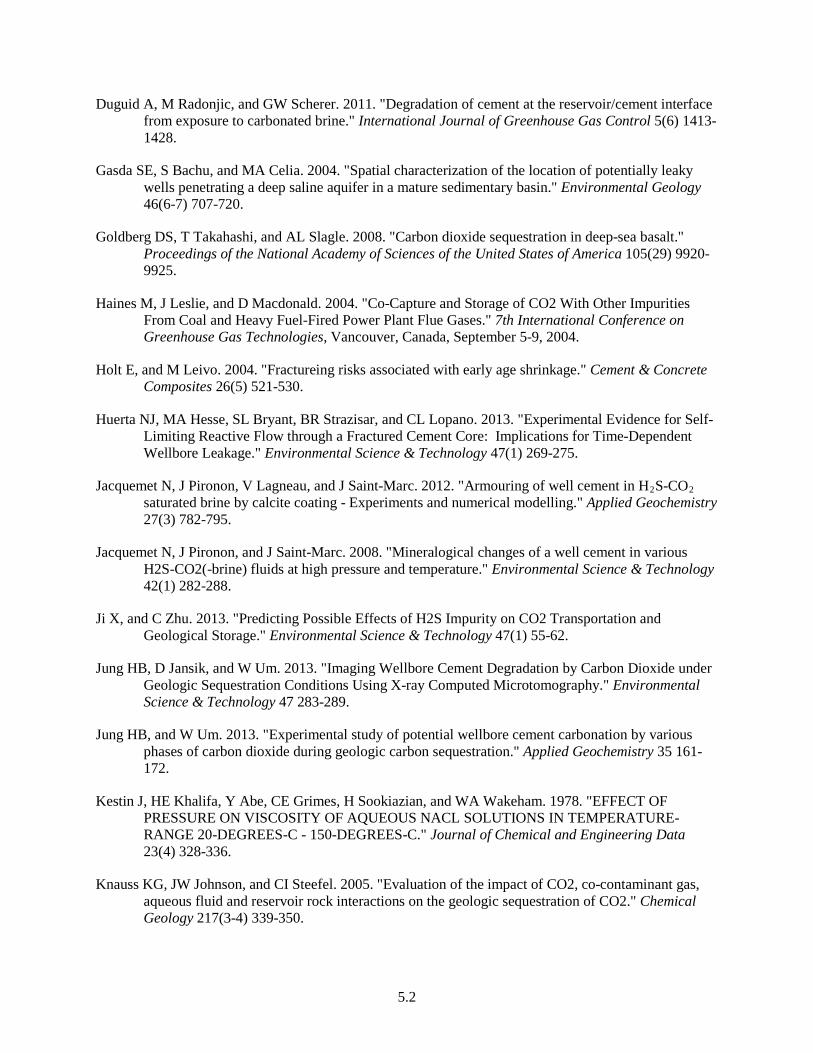
5.2
Duguid A, M Radonjic, and GW Scherer. 2011. "Degradation of cement at the reservoir/cement interface from exposure to carbonated brine." International Journal of Greenhouse Gas Control 5(6) 1413-1428.
Gasda SE, S Bachu, and MA Celia. 2004. "Spatial characterization of the location of potentially leaky wells penetrating a deep saline aquifer in a mature sedimentary basin." Environmental Geology 46(6-7) 707-720.
Goldberg DS, T Takahashi, and AL Slagle. 2008. "Carbon dioxide sequestration in deep-sea basalt." Proceedings of the National Academy of Sciences of the United States of America 105(29) 9920-9925.
Haines M, J Leslie, and D Macdonald. 2004. "Co-Capture and Storage of CO2 With Other Impurities From Coal and Heavy Fuel-Fired Power Plant Flue Gases." 7th International Conference on Greenhouse Gas Technologies, Vancouver, Canada, September 5-9, 2004.
Holt E, and M Leivo. 2004. "Fractureing risks associated with early age shrinkage." Cement & Concrete Composites 26(5) 521-530.
Huerta NJ, MA Hesse, SL Bryant, BR Strazisar, and CL Lopano. 2013. "Experimental Evidence for Self-Limiting Reactive Flow through a Fractured Cement Core: Implications for Time-Dependent Wellbore Leakage." Environmental Science & Technology 47(1) 269-275.
Jacquemet N, J Pironon, V Lagneau, and J Saint-Marc. 2012. "Armouring of well cement in H2S-CO2 saturated brine by calcite coating - Experiments and numerical modelling." Applied Geochemistry 27(3) 782-795.
Jacquemet N, J Pironon, and J Saint-Marc. 2008. "Mineralogical changes of a well cement in various H2S-CO2(-brine) fluids at high pressure and temperature." Environmental Science & Technology 42(1) 282-288.
Ji X, and C Zhu. 2013. "Predicting Possible Effects of H2S Impurity on CO2 Transportation and Geological Storage." Environmental Science & Technology 47(1) 55-62.
Jung HB, D Jansik, and W Um. 2013. "Imaging Wellbore Cement Degradation by Carbon Dioxide under Geologic Sequestration Conditions Using X-ray Computed Microtomography." Environmental Science & Technology 47 283-289.
Jung HB, and W Um. 2013. "Experimental study of potential wellbore cement carbonation by various phases of carbon dioxide during geologic carbon sequestration." Applied Geochemistry 35 161-172.
Kestin J, HE Khalifa, Y Abe, CE Grimes, H Sookiazian, and WA Wakeham. 1978. "EFFECT OF PRESSURE ON VISCOSITY OF AQUEOUS NACL SOLUTIONS IN TEMPERATURE-RANGE 20-DEGREES-C - 150-DEGREES-C." Journal of Chemical and Engineering Data 23(4) 328-336.
Knauss KG, JW Johnson, and CI Steefel. 2005. "Evaluation of the impact of CO2, co-contaminant gas, aqueous fluid and reservoir rock interactions on the geologic sequestration of CO2." Chemical Geology 217(3-4) 339-350.

5.3
Koenen M, TJ Tambach, and FP Neele. 2011. "Geochemical effects of impurities in CO2 on a sandstone reservoir." In: Gale, J., Hendriks, C., Turkenberg, W. (Eds.), 10th International Conference on Greenhouse Gas Control Technologies. Energy Procedia, pp. 5343-5349.
Kuprat A, A Khamayseh, D George, and L Larkey. 2001. "Volume Conserving Smoothing for Piecewise Linear Curves, Surfaces, and Triple Lines." Journal of Computational Physics 172(1) 99-118.
Kuprat AP and DR Einstein. 2009. "An anisotropic scale-invariant unstructured mesh generator suitable for volumetric imaging data." Journal of Computational Physics 228(3) 619-640.
Kutchko BG, BR Strazisar, DA Dzombak, GV Lowry, and N Thaulow. 2007. "Degradation of well cement by CO2 under geologic sequestration conditions." Environmental Science & Technology 41(13) 4787-4792.
Kutchko BG, BR Strazisar, SB Hawthorne, CL Lopano, DJ Miller, JA Hakala, and GD Guthrie. 2011. "H2S-CO2 reaction with hydrated Class H well cement: Acid-gas injection and CO2 Co-sequestration." International Journal of Greenhouse Gas Control 5(4) 880-888.
Landis EN EN Nagy, and DT Keane. 2003. "Microstructure and fracture in three dimensions." Engineering Fracture Mechanics 70(7-8) 911-925.
Last GV and MT Schmick. 2011. Identification and Selection of Major Carbon Dioxide Stream Compositions, PNNL-20493, Pacific Northwest National Laboratory, Richland, Washington.
Liteanu E and CJ Spiers. 2011. "Fracture healing and transport properties of wellbore cement in the presence of supercritical CO2." Chemical Geology 281(3-4), 195-210.
Little MG and RB Jackson. 2010. "Potential Impacts of Leakage from Deep CO2 Geosequestration on Overlying Freshwater Aquifers." Environmental Science & Technology 44(23) 9225-9232.
Lorensen WE and HE Cline. 1987. "Marching cubes: A high resolution 3D surface construction algorithm." ACM SIGGRAPH Computer Graphics 21(4) 163-169.
Mason HE, WL Du Frane, SDC Walsh, Z Dai, S Charnvanichborikarn, and SA Carroll. 2013. "Chemical and Mechanical Properties of Wellbore Cement Altered by CO2-Rich Brine Using a Multianalytical Approach." Environmental Science & Technology 47(3) 1745-1752.
McGrail BP, HT Schaef, AM Ho, Y-J Chien, JJ Dooley, and CL Davidson. 2006. "Potential for carbon dioxide sequestration in flood basalts." Journal of Geophysical Research-Solid Earth 111(B12).
Nelson EB and D Guillot. 2006. Well Cementing, 2nd ed. Schlumberger, Sugar Land, TX, U.S.A.
Neville AM. 2004. Properties of Concrete, 4th ed. John Wiley and Sons, New York.
Newell DL and JW Carey. 2013. "Experimental Evaluation of Wellbore Integrity Along the Cement-rock Boundary." Environmental Science & Technology 47 276-282.
Polak A, AS Grader, R Wallach, and R Nativ. 2003a. "Chemical diffusion between a fracture and the surrounding matrix: Measurement by computed tomography and modeling." Water Resources Research 39(4).

5.4
Polak, A, AS Grader, R Wallach, and R Nativ. 2003b. "Tracer diffusion from a horizontal fracture into the surrounding matrix: measurement by computed tomography." Journal of Contaminant Hydrology 67(1-4) 95-112.
Rougelot T, N Burlion, D Bernard, and F Skoczylas. 2010. "About microfractureing due to leaching in cementitious composites: X-ray microtomography description and numerical approach." Cement and Concrete Research 40(2) 271-283.
Rutqvist J, J Birkholzer, F Cappa, and CF Tsang. 2007. "Estimating maximum sustainable injection pressure during geological sequestration of CO2 using coupled fluid flow and geomechanical fault-slip analysis." Energy Conversion and Management 48(6) 1798-1807.
Schaef HT and BP McGrail. 2009. "Dissolution of Columbia River Basalt under mildly acidic conditions as a function of temperature: Experimental results relevant to the geological sequestration of carbon dioxide." Applied Geochemistry 24(5) 980-987.
Schaef HT, BP McGrail, and AT Owen. 2010. "Carbonate mineralization of volcanic province basalts." International Journal of Greenhouse Gas Control 4(2) 249-261.
Walsh SDC, WL Du Frane, HE Mason, and SA Carroll. 2013. "Permeability of Wellbore-Cement Fractures Following Degradation by Carbonated Brine." Rock Mechanics and Rock Engineering 46(3) 455-464.
Wigand M, JP Kaszuba, JW Carey, and WK Hollis. 2009. "Geochemical effects of CO2 sequestration on fractured wellbore cement at the cement/caprock interface." Chemical Geology 265(1-2) 122-133.
Wilkin RT and DC Digiulio. 2010. "Geochemical Impacts to Groundwater from Geologic Carbon Sequestration: Controls on pH and Inorganic Carbon Concentrations from Reaction Path and Kinetic Modeling." Environmental Science & Technology 44(12) 4821-4827.
Wiltschko DV and JW Morse. 2001. "Crystallization pressure versus "fracture seal" as the mechanism for banded veins." Geology 29(1) 79-82.
Wolterbeek TKT, CJ Peach, and CJ Spiers. 2013. "Reaction and transport in wellbore interfaces under CO2 storage conditions: Experiments simulating debonded cement–casinginterfaces." International Journal of Greenhouse Gas Control 19 519-529.
Xu T, JA Apps, K Pruess, and H Yamamoto. 2007. "Numerical modeling of injection and mineral trapping Of CO2 with H2S and SO2 in a sandstone formation." Chemical Geology 242(3-4) 319-346.
Yan W, S Huang, and EH Stenby. 2011. "Measurement and modeling of CO2 solubility in NaCl brine and CO2-saturated NaCl brine density." International Journal of Greenhouse Gas Control 5(6) 1460-1477.
Zakharova NV, DS Goldberg, EC Sullivan, MM Herron, and JA Grau. 2012. "Petrophysical and geochemical properties of Columbia River flood basalt: Implications for carbon sequestration." Geochemistry Geophysics Geosystems 13.
Zhang M and S Bachu. 2011. "Review of integrity of existing wells in relation to CO2 geological storage: What do we know?" International Journal of Greenhouse Gas Control 5(4) 826-840.

5.5


PNNL-23148
Distribution
No. of No. of Copies Copies
Distr.1
1 Brian Strazisar National Energy Technology Laboratory 626 Cochrans Mill Road
P.kox 10940 Pittsburgh, PA 15236 4 Los Alamos National Laboratory P.O. Box 1663 Los Alamos, NM 87545 Bill Carey Amy B. Jordan Rajesh Pawar Philip H. Stauffer 3 Lawrence Berkeley National Laboratory Earth Sciences Division 1 Cyclotron Road Berkeley, CA 94720 USA Curtis M. Oldenburg Jim Houseworth Preston D. Jordan 2 Lawrence Livermore National Laboratory 7000 East Avenue Livermore, CA 94550 Susan A. Carroll Stuart Walsh
12 Local Distribution Pacific Northwest National Laboratory
Christopher Brown PDF Kirk Cantrell PDF Chris Murray PDF Charlotte Sullivan PDF Wooyong Um PDF Nik Qafoku PDF Hun Bok Jung PDF


![Geomechanical and Geochemical Evidence of Piezonuclear Fission Reactions in the Earths ... · 2012-09-13 · atmosphere between 2.7 and 2.4 Gyrs ago [8–12], the strong iron depletion](https://img.dokumen.tips/doc/110x75/5f51b2fb39ae4d64fc6b0583/geomechanical-and-geochemical-evidence-of-piezonuclear-fission-reactions-in-the.jpg)