Embed Size (px)
Citation preview

Presented by:
Do You Measure Up?Analytics for GIS Departments
October 26, 2015
Tammy KobliukGIS CoordinatorI.T. Services – Corporate GIS Branch
2
Analytics for GIS Departments
• Why should you care• What are they• Where is my information• How to communicate

3
Why Should You Care?
Is it really worth the time?

4
Why You Should Care
Your business case failed Your value is unknown You are under-resourced

5
Asking For More
• Money• Staff• Resources
Include facts and figures in your business case

6
Return On Investment
• Time savings• Cost savings• Usage of product
7
Accountability

8
Performance Monitoring

9
HardwareSoftware
MoneyStaff
Keeping The Status Quo

10
What Are Analytics?

11
Analytics: What Are They?
“the patterns and other meaningful information gathered from the analysis of data”
12
Valu
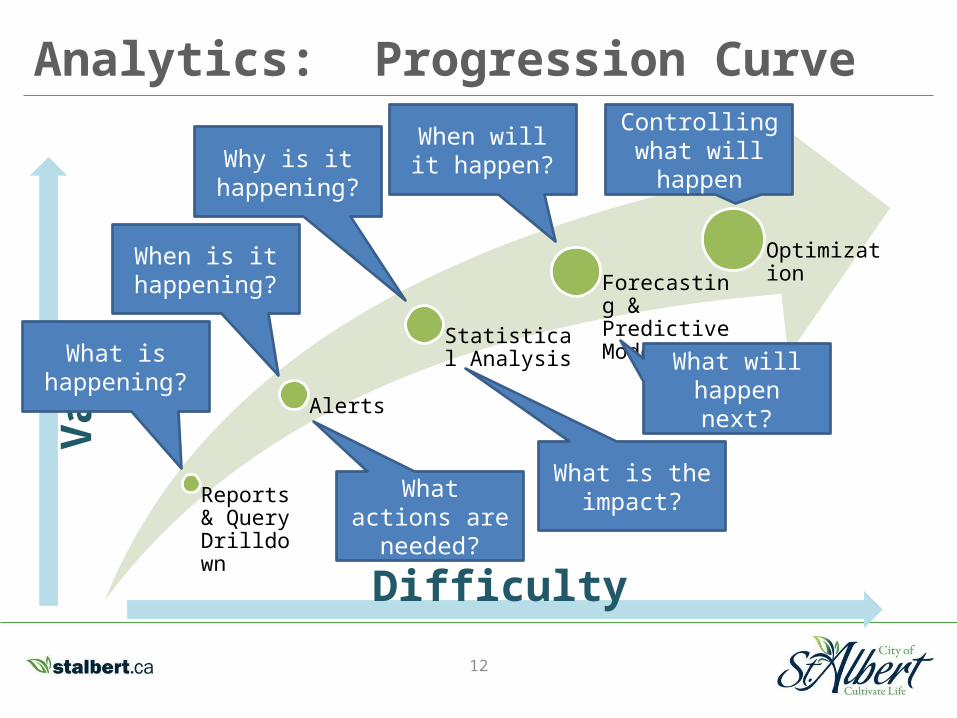
eAnalytics: Progression Curve
Reports & Query Drilldown
Alerts
Statistical Analysis
Forecasting & Predictive Modeling
Optimization
What is happening?
When is it happening?
What actions are needed?
Why is it happening?
When will it happen?
What will happen next?
Difficulty
What is the impact?
Controlling what will happen
13
Tying To Your Business
• Tie back to organization objectives and goals• Have a reason for each target• Neither too easy nor too difficult

14
Be SMART With Your Goals

15
Targets & Indicators
TARGET“a goal to be reached”
INDICATOR“A thing, especially a trend,
that indicates the state or level of something”

16
Example: Web Services
• OBJECTIVE: To maintain reliable web mapping support for city applications.
• GOAL: 100% of IPS GIS web services should have 100% uptime during office hours.
• TARGET: No alarms triggered M-F 7AM-5PM
• INDICATOR : Number and time of alarms• TARGET: Map service should load within 3
secs• INDICATOR : Average map service load time

17
Unexpected Consequences
Good Intentions≠
Good Results

18
Example: Unexpected Consequences
• Objective – Excellent customer service• Goal – Requests will be dealt with within xxx hours• Target - Decrease avg response time from 3 to 2
• Indicator – Time taken to complete request
• Potential Result:• Tickets are closed prematurely in the system to boost results.• Clients get notified that their ticket has been closed, but their issue
has not actually been resolved.• More focus on generating the right results than on delivering good
customer service
• Better goal: High customer satisfaction as measured by customer surveys

19
Information Sources
Where to get your numbers from

20
Where To Get Your Numbers
• People• Databases• Software
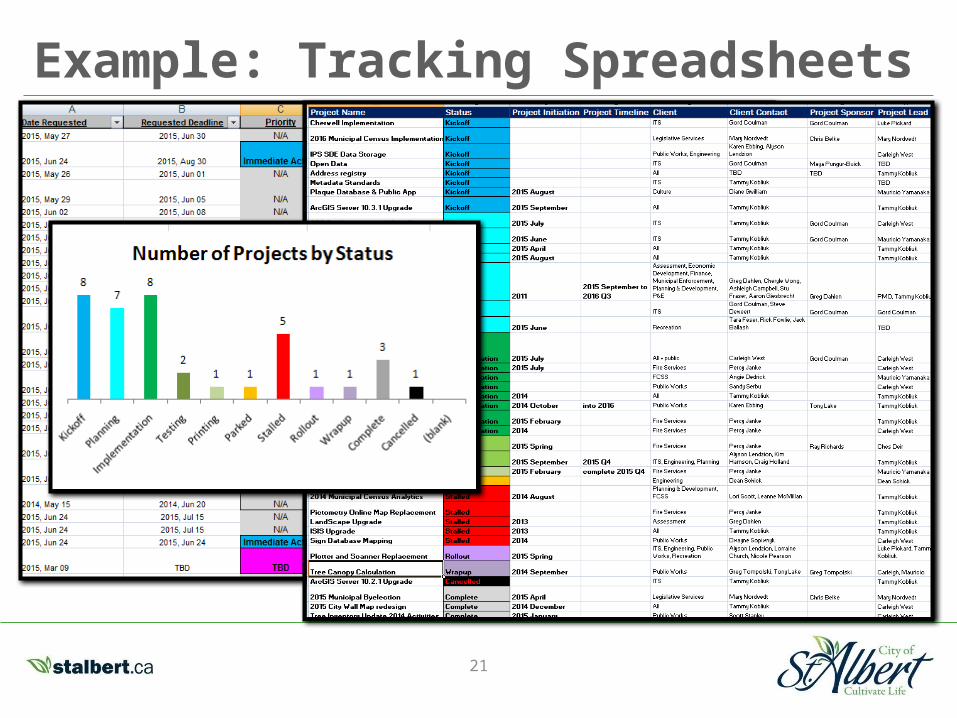
21
Example: Tracking Spreadsheets

22
Example: Geocortex Optimizer
23
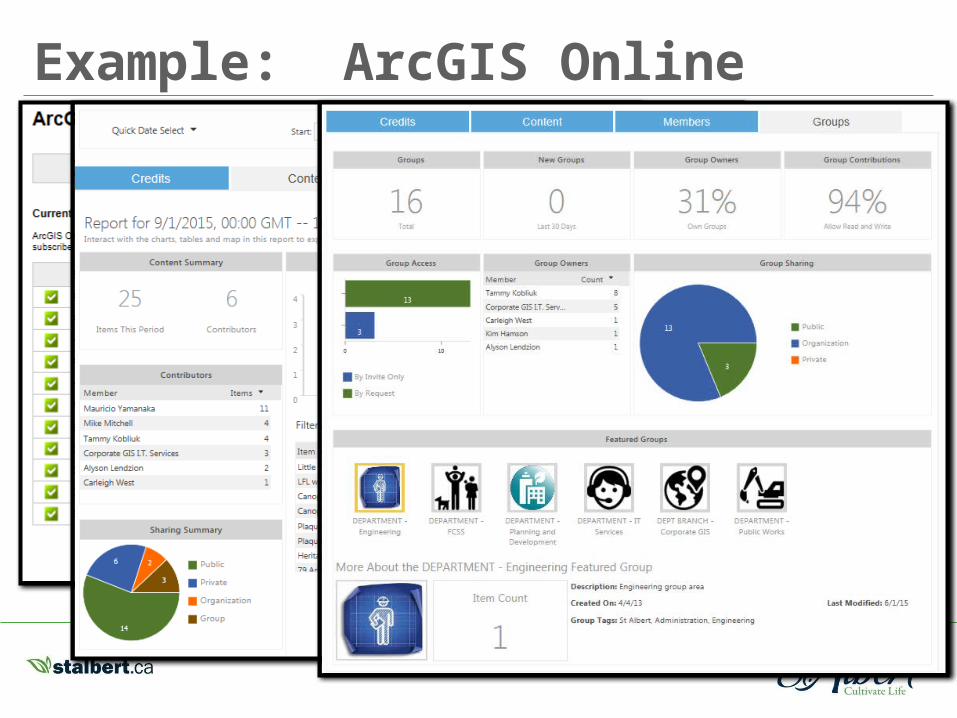
Example: ArcGIS Online

24
Example: See Click Fix

25
Communication

26
• Public Officials / Shareholders• Management• General Public• Peers• Yourself
Know Your Audience
27
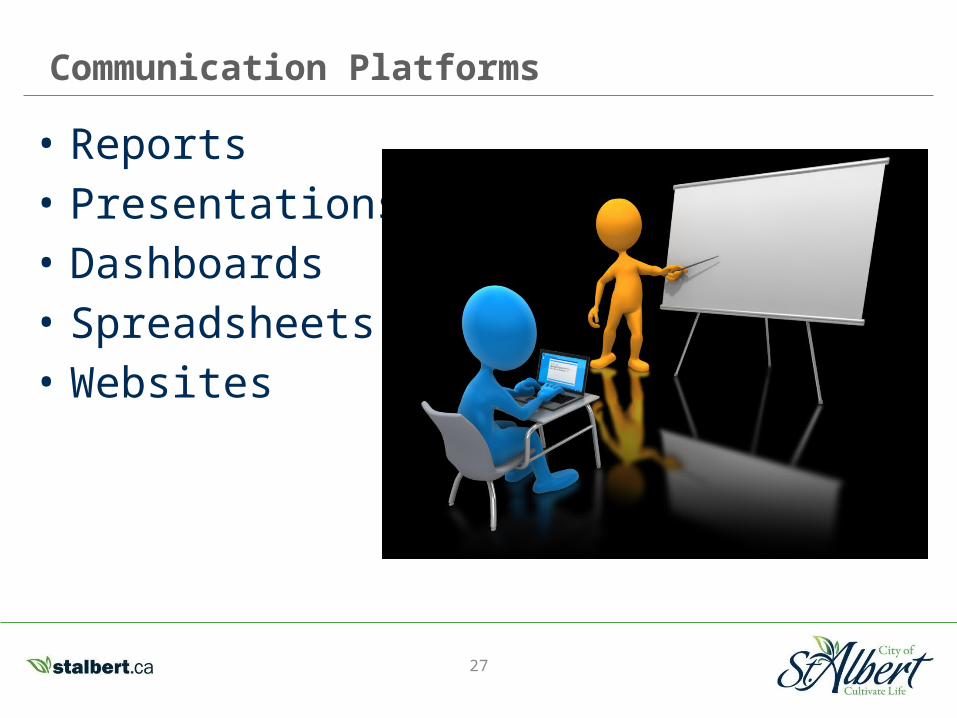
• Reports• Presentations• Dashboards• Spreadsheets• Websites
Communication Platforms

28
Types of Widgets

29
“graphic visual representations of information, data or knowledge intended to present
information quickly and clearly”
Infographics

30
Website Example: STATtracker
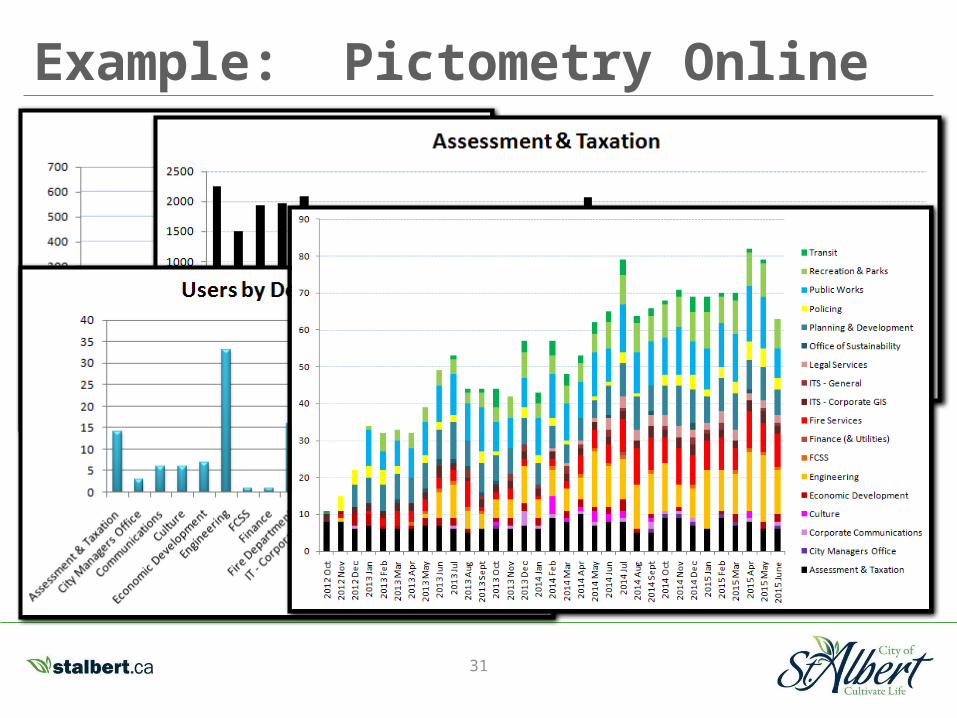
31
Example: Pictometry Online

32
Example: Edmonton Insight Community

33
Wrapping Up!
34
• Be intentional• Be specific and relevant• Tailor to your audience
Remember: To Get What You Need

35
Questions?
Tammy KobliukGIS CoordinatorI.T. Services – Corporate GIS Branch: [email protected]: 780-459-1730

36
Appendix
37
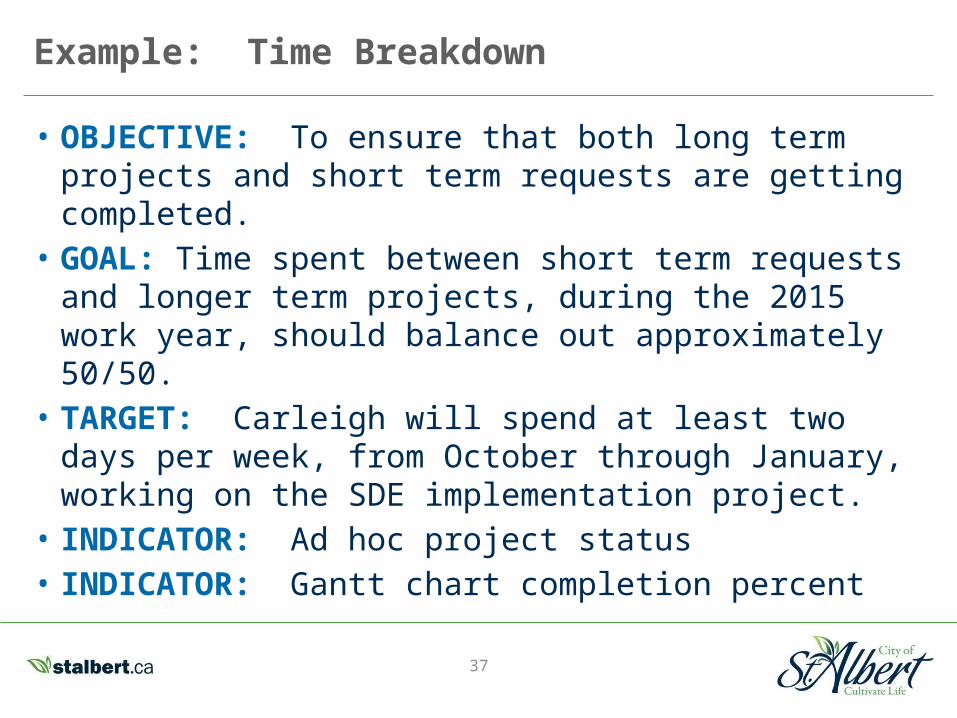
Example: Time Breakdown
• OBJECTIVE: To ensure that both long term projects and short term requests are getting completed.
• GOAL: Time spent between short term requests and longer term projects, during the 2015 work year, should balance out approximately 50/50.
• TARGET: Carleigh will spend at least two days per week, from October through January, working on the SDE implementation project.
• INDICATOR: Ad hoc project status• INDICATOR: Gantt chart completion percent
38
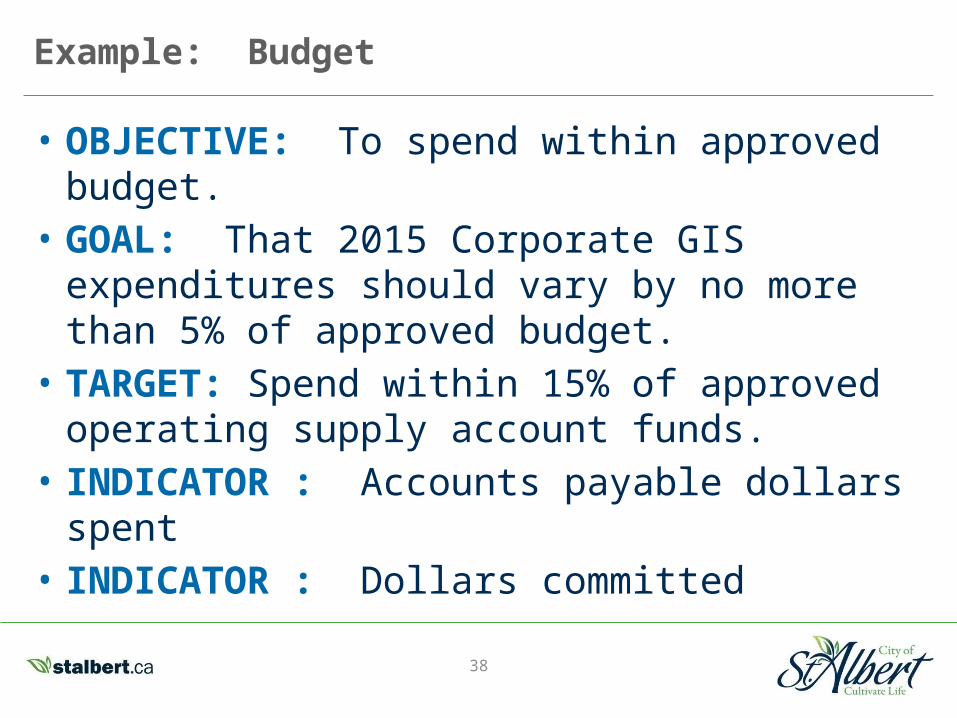
Example: Budget
• OBJECTIVE: To spend within approved budget.
• GOAL: That 2015 Corporate GIS expenditures should vary by no more than 5% of approved budget.
• TARGET: Spend within 15% of approved operating supply account funds.
• INDICATOR : Accounts payable dollars spent• INDICATOR : Dollars committed

39
Example: LiDAR
• OBJECTIVE: To capture datasets that will be valuable to the organization in terms of staff efficiency and value in delivering services.
• GOAL: That the 2010 LiDAR flight will save the city money by 2014, equivalent to the cost of the data capture contract, in terms of reduced survey needs.
• TARGET: Use of the LiDAR data products should save the city at least $20,000 in the first year of use.
• INDICATOR : Dollar expenditures avoided

40
Example: Staffing
• OBJECTIVE: To increase GIS staffing to better meet demand for services.
• GOAL: That Corporate GIS receive approval for 1.0 full-time FTE in the 2015 budget.
• TARGET: Demonstrate increased demand over the last 5 years
• INDICATOR : Number of requests received• INDICATOR: Average wait time for requests
to be addressed.

41
Example: Customer Satisfaction
• OBJECTIVE: Satisfied Customers• GOAL: At least 80% of customers are
satisfied or very satisfied as measured on the annual satisfaction surveys.
• TARGET: Increase satisfied/very satisfied by 5% in the next customer survey.
• INDICATOR: 2015 customer satisfaction survey results