Embed Size (px)
Citation preview

Heliyon 6 (2020) e03327
Contents lists available at ScienceDirect
Heliyon
journal homepage: www.cell.com/heliyon
Research article
Geo-investigation on groundwater control in some parts of Ogun state usingdata from Shuttle Radar Topography Mission and verticalelectrical soundings
Emmanuel S. Joel a,*, Peter I. Olasehinde b, Theophilus A. Adagunodo a, Maxwell Omeje a,Ifeanyi Oha c, Marvel L. Akinyemi a, Olukunle C. Olawole a
a Department of Physics, Covenant University, Ota, Nigeriab Department of Geophysics, University of Ilorin, Ilorin, Nigeriac Department of Geology, University of Nigeria, Nsukka, Nigeria
A R T I C L E I N F O
Keywords:PhysicsGeophysicsPhysics methodsAgricultural water managementEnvironmental scienceEnvironmental managementEarth sciencesRemote sensingGeologyLithologyVertical electrical soundingLineamentsNigeriaGroundwater control systemAquifersIju – Ota axisShuttle radar topography mission
* Corresponding author.E-mail address: emmanuel.joel@covenantuniver
https://doi.org/10.1016/j.heliyon.2020.e03327Received 25 February 2019; Received in revised fo2405-8440/© 2020 The Authors. Published by Elsenc-nd/4.0/).
A B S T R A C T
Groundwater is a vital natural resource that plays a significant function in sustainability of living things on earth.Its exploration requires special skill for optimum exploitation. Shuttle Radar Topography Mission (SRTM)andVertical Electrical Sounding (VES) were used to detectthe stratigraphy and subsurface structures controlling thegroundwater system around Iju – Ota, Ogun State, Southwestern Nigeria. Nineteen (19) VES points were carriedout where there were dense concentrations of lineaments and interconnected to establish the connection of theobserved lineaments with groundwater occurrence in the study area using Schlumberger array, with electrodespacing of AB/2 varying from 180 to 320 m. The analysis of SRTM data revealedthe dominating structural NE-SWand NW-SE trends, which control aquifer structure. The geoelectrical parameters from the VES results were usedto map the stratigraphic sequences in the study area. Six (6) units that comprisethe topsoil, lateritic clay, clayeysand, mudstone, sand (main aquifer), and shale or clay were identified in the study area. The aquiferous unitaround Iju – Ota axis ranged from 30 to 80 m. Theextracted from the hill shaded SRTM data and the result of VESrevealed that the thickness of the aquifer is as a result of interconnectivity of the lineaments observed in the SRTMdata suggesting that the groundwater occurrence in the study area is chiefly controlled by these fractures.
1. Introduction
It has been established that civilization and development of any na-tions (communities inclusive) have flourished due to reliable watersupplies and have suffered setback as the water supplies failed (Troften,1973; Olasehinde, 2010). Water is an inevitable tool for life survival onearth (Chaplin, 2001; Jequier and Constant, 2010; Hanslmeier, 2011;Oladejo et al., 2013; Adagunodo et al., 2018; Adejumo et al., 2018; SDG6,2018; Westall and Brack, 2018). It occurs in three forms: as rain, surfaceflow and subsurface flow. In Nigeria, rain and surface water are easilycontaminated due to negligence of the regulatory bodies on water con-servation and treatment for its sustainability (Adagunodo et al., 2018;Joel et al. 2019a, b). As a result of this, groundwater is the major sourceof water for drinking (Adagunodo, 2017) and domestic usages (Olafisoye
sity.edu.ng (E.S. Joel).
rm 3 October 2019; Accepted 24vier Ltd. This is an open access ar
et al., 2012; Oladejo et al., 2015). Groundwater is cheap, safe, constant inquality and quantity, and abundant to man when properly explored(Umar et al., 2017). It is however essential to understand the strati-graphic structures of a terrain before its groundwater resource can beoptimally harnessed, either through dug wells or boreholes (Olasehinde,2010). Various methods have been employed in groundwater explorationglobally, ranging from traditional methods such as fracture trace methodand borehole drilling (Lattman and Parizek, 1964; Acharya et al., 2012)to the use of geophysical methods such as electrical resistivity, magnetics,electromagnetics, seismic, radiometric techniques and so on (McNeill,1991; Bernard and Legchenko, 2003; Goldman and Neubauer, 1994;Hewaidy et al., 2015; Shishaye and Abdi, 2016; Helaly, 2017; Muham-mad and Khalid, 2017; Muthamilselvan et al., 2017; Poongothai andSridhar, 2017; Umar et al., 2017; Gao et al., 2018). In addition, Sunmonu
January 2020ticle under the CC BY-NC-ND license (http://creativecommons.org/licenses/by-

E.S. Joel et al. Heliyon 6 (2020) e03327
et al. (2016), Adagunodo et al. (2018) and Joel et al. (2019a) hadestablished that geophysical methods are capable to map the depthtogroundwater table. Groundwater has been successfully investigated onsedimentary and basement terrains using resistivity technique by numberof researchers (Okereke et al., 1998; Nwankwoet al., 2004; Singh et al.,2006; Ariyo and Adeyemi, 2009; Al-Amoush, 2010; Nwankwo, 2011;Zarroca et al., 2011; Ikhane et al., 2012; Molli et al., 2015; Omeje et al.,2013; Omeje et al., 2014; Rotimi et al., 2014; Sunmonu et al., 2015;Aizebeokhai et al., 2016; Sunmonu et al., 2016; Joel et al., 2016;Muhammad and Khalid, 2017; Poongothai and Sridhar, 2017; Umaret al., 2017).
The application of Shuttle Radar Topography Mission (SRTM), aremotely-sensed data for hydro-geophysical investigation is increasinglybecoming well knownmost importantly in areas where orthodox methodsuch as resistivity technique is inadequate. This is used for subjectiveestimation of ground-water resources through the extraction and study-ing of geological features, surface-morphology and their hydrogeologicalattributes. In addition, better observation and systematic examinationinvariedgeomorphic units, lineaments structure and land-forms whichoversee the condition of presence of water underneath the earth-surfaceare provided. Employed remote-sensing and GIS techniques to identifypotential areas for groundwater in the Musi-basin by the use of variousmaps (these include hydro-geomorphological, structural, geological,slope, drainage, land use or land cover and slope. Other investigators thathave used remotely-sensed data to carry out groundwater investigationseither as stand-alone or as integrated techniquewith other geophysicaltechniques include Edet et al. (1994), Batalan and De Smedt (2000),Valeriano et al. (2006), Wright et al.(2006), Grohmann et al. (2007) andSultan et al. (2017). The use of remotely sensed data in hydrogeologicalinvestigation has been able to provide complementary information aboutthe subsurface of an area before borehole can be drilled (Goki et al. 2010;Anudu et al. 2011; Omeje et al., 2014; Sultan et al., 2017).
Due to the influx of people into study area (Iju – Ota community areaof Ado-Odo/Ota Local Government Area, Ogun State),basic necessities oflife (such as water) has been a concern as a result of uneven distributionof water in this zone. Inadequate water supply to the communities hasbeen epileptic due to the inability of the government to meet demand ofwater resources needed by this ever-growing community as a result ofabsolute reliance on surface water. Therefore, the search for groundwaterresource as a complimentary is needed in the community in order to meetthe demand of water resources for domestic purposes and other relatedusages. Application of both Vertical Electrical Sounding (VES) andShuttle Radar Topography Mission (SRTM) on this terrain will aid themapping of groundwater potential system inIju – Ota community, whichwill be insightful for borehole drilling. In addition, extracted lineamentsfrom satellite imagery will aid the choice of VES point selection withinthe study area, such that these fracture traces will be the prospects forhydrogeophysical mapping in Iju – Ota community. Although somestudies have reported significant deviations between the traced linea-ments and the major fracture systems in some regions (Acharya et al.,2012; Acharya and Mallik, 2011; De'gnan and Clark, 2002), integrationof geophysical method (such as electrical resistivity method) with sat-ellite imagery for groundwater exploration will assist one to locate thecorrect point that is suitable for groundwater exploitation (Omeje et al.,2014; Dafalla et al., 2015; Anbazhagan and Jothibasu, 2016). This pre-sent study, therefore, employed the integration ofSRTM and VES with theaim to accurately investigate groundwater potential zones in aninter-bedded area (conglomerates of sedimentary and shallow basementrocks) such as Iju – Ota community in Ogun State, in order to address theinadequate water supply being experienced in the area.
2. Geological and hydrogeology settings of the study area
The study region is generally a gently sloping low-lying area. It fallswithin the eastern Dahomey (or Benin) Basin of southwestern Nigeriawhich stretches along the continental margin of the Gulf of Guinea. The
2
groundwater occurrence, movement and accumulation are chieflycontrolled by geology. The geologic factors that control the groundwatersystem are stratigraphy, petrography, thickness, geomorphology andstructure (Adagunodo, 2017). The local geology of Iju – Ota axis lieswithin the sedimentary rock sequence of Dahomey Basin which extendsfrom the eastern part of Ghana through Togo and Benin Republic to thewestern margin of the Niger Delta (Onuoha, 1999) (Figure 1). Thesequence arrangement of the local geology underlain by the study area isas follows: Recent Alluvium (Quaternary age) which trends towardssouth-east, east south and central part of the study area and formed aboundary with Coastal Plain Sands in the west. This formation is fol-lowed by Coastal Plain Sands (Tertiary age – Pliocene) which is located inthe west, south-west and eastern part of the study area and also formedboundary with Ilaro Formation in the north-west. Ilaro Formation (Ter-tiary age - Eocene) overlays both Coastal Plain Sands and Recent Allu-vium and formed boundary with EwekoroFormation/OshosunFormation/Akinbo Formation. This formation cutacross north-west to north-east of the study area. This geological for-mation is followed by Ewekoro Formation/Oshosun Formation/AkinboFormation (Cretaceous – Paleocene). It cutsacross north-north tonorth-east trend. The last geological formation which underliesEwekoroFormation is Abeokuta Formation which is Cretaceous age (Senonia) andthis formation formed boundary with Basement Complex in the northand Ewekoro Formation in the north-east (Omatsola and Adegoke,1981). The Hydrogeology of Dahomey basin comprises Ogun River andOwena basin. The tectonic structure of the basin is simple, forming amonocline against the basement outcrop to the North, with only littleevidence of faulting (Joel et al., 2019b). The area is characterized by twomajor climatic seasons, namely:dry season spanning from November toMarch and rainy (or wet) season between April and October. Occasionalrainfalls are usually witnessed within the dry season, particularly alongthe region adjoining the coast. Mean annual rainfall is greater than 2000mm and forms the major source of groundwater recharge in the area.
3. Material and methods
3.1. Shuttle Radar Topography Mission (SRTM)
The Shuttle Radar Topography Mission (SRTM) is an internationalresearch effort that obtains digital elevation models on a near-globalscale from 56�S to 60�N to generate the most complete high-resolutiondigital topographic database of the Earth. SRTM consisted of aspecially modified radar system that flew onboard the Space ShuttleEndeavour during the 11-day STS-99 mission in February 2000 usingolder Space-borne Imaging Radar-C/X-band Synthetic Aperture Radar(SIR-C/X-SAR). To acquire topographic data, the SRTM payload wasoutfitted with two radar antennas. One antenna was located in theShuttle's payload bay, the other – a critical change from the SIR-C/X-SAR,allowing single-pass interferometry – on the end of a 60-meter (200-foot)mast that extended from the payload bay once the Shuttle was in space.The technique employed is known as interferometric synthetic apertureradar. The elevation models are arranged into tiles, each covering onedegree of latitude and one degree of longitude, named according to theirsouthwestern corners. The resolution of the raw data is one arcsecond (30m along the equator) and coverage includes Africa, Europe, NorthAmerica, South America, Asia, and Australia. The elevation modelsderived from the SRTM data are used in geographic information systemsand can tell how the surface of Earth changes due to the actions of gla-ciers, rivers and the processes.
The SRTM, a pass of single interferometer mission flown on February2000, with generated Digital Elevation Model (DEM) data at 90 m ofresolution, which is 80% of surface of the earth in C-band is presented inFigure 2. The shuttle radar topography mission digital elevation modeldata were obtained from the archives of United State Geological SurveyAgency (http://www.cgiar-csi. Org/data/srtm-90m-digital-elevation-database-v4-1). The extracted data are within the longitude 3� 000 to

Figure 1. Map of Nigeria showing the geological map, base map and VES points in Iju – Ota axis.
E.S. Joel et al. Heliyon 6 (2020) e03327
3� 300 E and latitude 6� 300 to 7� 000 N. These data were subjected to hill-shading using Idrisi 32 software to enhance the linear features that couldbe the major regional fractures (Valeriano et al., 2006). The analyticalhill shaded result was used to create the hill-shadingimage with the Sunazimuth angle set to 315� (NW) and the Sun elevation angle set at 30� asreported inAnudu et al. (2011) and Omeje et al. (2014). The lineamentsand its orientations were digitized on-screen using GEOrient 9.5.0software.
Figure 2. Digital Elevation Model showing the watershed of Iju area.
3.2. Vertical Electrical Sounding
In this investigative study, nineteen (19) resistivity soundings werecarried out both in NE –SW and NW – SE orientations, where linea-ments were concentrated and interconnected (Lattman and Parizek,1964; Acharya et al., 2012) as shown in Figures 5a and b. ABEM 4000series equipment was used and this computes and displays meanapparent resistivity for the electrode configurations of choice. Asadopted by other authors (Sunmonu et al., 2012; Adagunodo et al.2017, 2018; Oyeyemi et al., 2018),Schlumberger Array was used for
3

Figure 3. Some of the VES curve types obtained in Iju – Ota axis (VESs 1 to 4 and VES 7).
E.S. Joel et al. Heliyon 6 (2020) e03327
the present study with current electrode spacing that ranged from 180to 320 m.
The obtained data were manually plotted using log-log graph. Anautomated iterative program (1D inversion algorithm) known as Win-Resist version 1.0 software was used to model the partial curve matchingresults (Aizebeokhai and Oyebanjo, 2013; Adagunodo et al., 2015),which greatly minimized the interpretation errors (Sunmonu et al. 2012,2016; Adagunodo et al., 2017). The major VES curve types obtained inthis study are presented in Figure 3.
4. Results and discussions
4.1. Interpretation of SRTM (digital elevation model) data
The SRTM data extracted from Hill shaded digital elevation modeland Aeronautical Reconnaissance Coverage Geographic InformationSystem (ArcGIS) software was used to infer the detailed hydrogeological
4
features that control the groundwater system in the area. The purpose ofusing SRTM is to acquire possible knowledge of surficial features such astopographic information and/or lineaments, which could have origi-nated as a result of joints, foliation, fractures, faults and other subsurfacefeatures (Wright et al., 2006; Anudu et al., 2011) in some parts of thestudy area. Understanding of these surficial features prior to localizedgeophysical survey(s) could enhance proper identification of suitable sitefor development of productive wells, corresponding to the zones ofdeformation in the subsurface (Akinluyi et al., 2018). Figure 2 presentsthe hydrogeological near-surface feature (in watershed form) of the studyarea. The watershed presented on the DEM is capable of revealingshallow underground tributaries, based on the relationship between thesurficial and subsurface features (Valeriano et al., 2006; Zandbergen,2008). The total numbers of lineaments extracted and digitized werefifty-eight (58) as revealed in Figure 4. The lineament map is presented inFigure 5a, while the map revealing the lineaments and the VES points ispresented in Figure 5b. By comparing Figures 2,5a and b, the lineaments
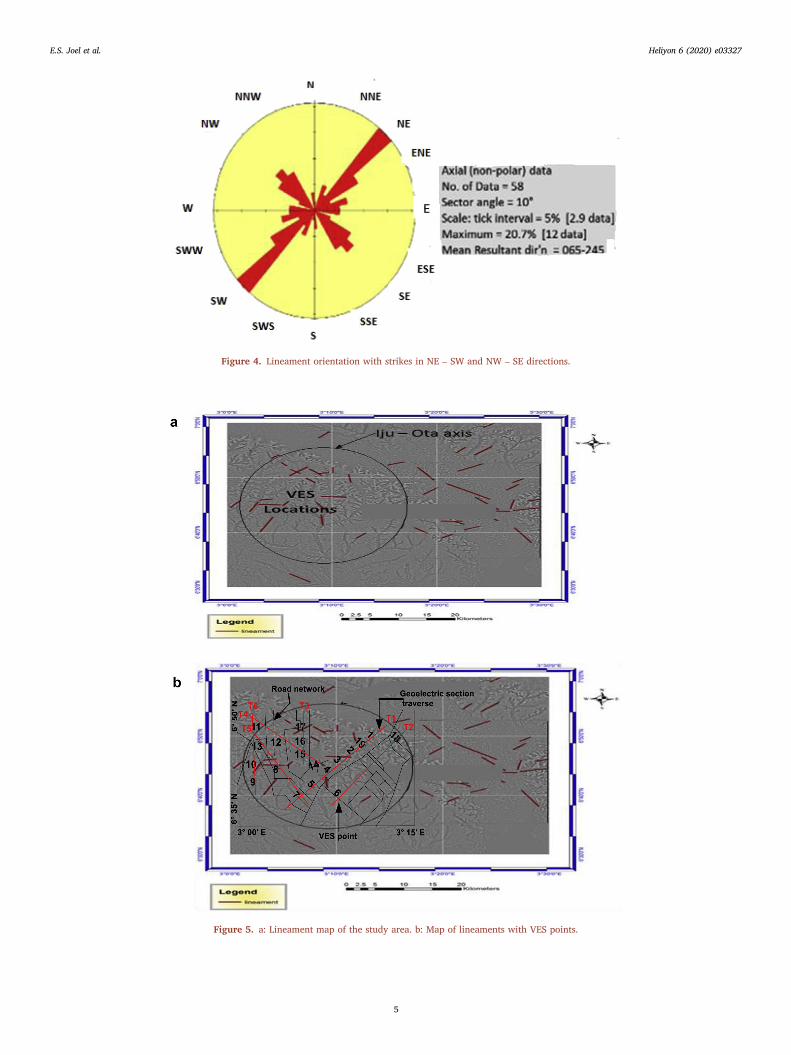
Figure 4. Lineament orientation with strikes in NE – SW and NW – SE directions.
Figure 5. a: Lineament map of the study area. b: Map of lineaments with VES points.
E.S. Joel et al. Heliyon 6 (2020) e03327
5
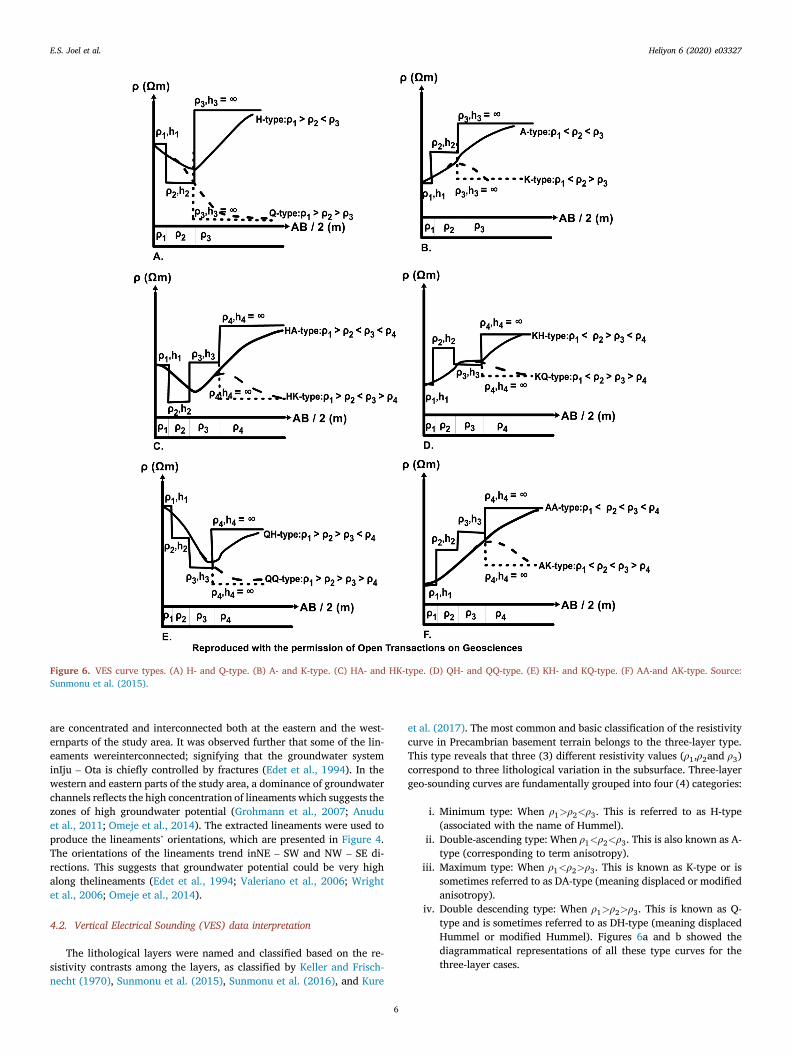
Figure 6. VES curve types. (A) H- and Q-type. (B) A- and K-type. (C) HA- and HK-type. (D) QH- and QQ-type. (E) KH- and KQ-type. (F) AA-and AK-type. Source:Sunmonu et al. (2015).
E.S. Joel et al. Heliyon 6 (2020) e03327
are concentrated and interconnected both at the eastern and the west-ernparts of the study area. It was observed further that some of the lin-eaments wereinterconnected; signifying that the groundwater systeminIju – Ota is chiefly controlled by fractures (Edet et al., 1994). In thewestern and eastern parts of the study area, a dominance of groundwaterchannels reflects the high concentration of lineaments which suggests thezones of high groundwater potential (Grohmann et al., 2007; Anuduet al., 2011; Omeje et al., 2014). The extracted lineaments were used toproduce the lineaments’ orientations, which are presented in Figure 4.The orientations of the lineaments trend inNE – SW and NW – SE di-rections. This suggests that groundwater potential could be very highalong thelineaments (Edet et al., 1994; Valeriano et al., 2006; Wrightet al., 2006; Omeje et al., 2014).
4.2. Vertical Electrical Sounding (VES) data interpretation
The lithological layers were named and classified based on the re-sistivity contrasts among the layers, as classified by Keller and Frisch-necht (1970), Sunmonu et al. (2015), Sunmonu et al. (2016), and Kure
6
et al. (2017). The most common and basic classification of the resistivitycurve in Precambrian basement terrain belongs to the three-layer type.This type reveals that three (3) different resistivity values (ρ1,ρ2and ρ3)correspond to three lithological variation in the subsurface. Three-layergeo-sounding curves are fundamentally grouped into four (4) categories:
i. Minimum type: When ρ1>ρ2<ρ3. This is referred to as H-type(associated with the name of Hummel).
ii. Double-ascending type: When ρ1<ρ2<ρ3. This is also known as A-type (corresponding to term anisotropy).
iii. Maximum type: When ρ1<ρ2>ρ3. This is known as K-type or issometimes referred to as DA-type (meaning displaced or modifiedanisotropy).
iv. Double descending type: When ρ1>ρ2>ρ3. This is known as Q-type and is sometimes referred to as DH-type (meaning displacedHummel or modified Hummel). Figures 6a and b showed thediagrammatical representations of all these type curves for thethree-layer cases.

Table 1. Resistivity sounding classifications.
Curve type VES point Curve frequency Curve model Model percentage
AAKQ 1, 4 and 5 3 ρ1 < ρ2 < ρ3 < ρ4 > ρ5 > ρ6 15.8%
KHKQ 2, 8, 10, 12 and 18 5 ρ1 < ρ2 > ρ3 < ρ4 > ρ5 > ρ6 26.3%
AKQQ 3, 6, 9, 14, 15, 16, 17 and 19 8 ρ1 < ρ2 < ρ3 > ρ4 > ρ5 > ρ6 42.1%
KHAK 7 and 11 2 ρ1 < ρ2 > ρ3 < ρ4 < ρ5 > ρ6 10.5%
QHKQ 13 1 ρ1 > ρ2 > ρ3 < ρ4 > ρ5 > ρ6 5.3%
Table 2. Lithological characterization of Iju –Ota axis.
Layers 1 2 3 4 5 Shale/Clay
Lith. Topsoil Lateritic clay Clayey sand Mudstone Sand (main aquifer)
VES Res. (Ωm) h (m) D (m) Res. (Ωm) h (m) D (m) Res. (Ωm) h (m) D (m) Res. (Ωm) h (m) D (m) Res. (Ωm) h (m) D (m) Res. (Ωm)
1 69.1 1.3 1.3 297.6 1.4 2.7 845.8 2.3 5.0 2092.7 11.8 16.8 589.9 10.7 27.5 80.9
2 359.5 1.0 1.0 907.4 2.7 3.7 500.5 6.6 10.3 688.0 37.8 48.1 265.3 32.0 80.1 53.1
3 158.8 1.4 1.4 386.3 2.5 3.9 1497.9 21.3 25.1 1046.9 15.4 40.5 688.6 8.6 49.1 387.2
4 80.8 1.3 1.3 237.1 1.8 3.1 662.6 6.5 9.7 769.5 21.1 30.8 141.0 20.7 51.5 43.5
5 304.7 1.1 1.1 602.7 4.6 5.7 637.3 3.0 8.8 2203.9 15.8 24.6 172.0 19.6 44.2 27.9
6 367.2 1.4 1.4 436.6 1.6 3.0 818.5 8.0 10.9 790.2 27.5 38.5 221.7 11.9 50.3 78.8
7 54.8 0.9 0.9 443.4 2.1 3.0 263.7 6.8 9.8 762.6 11.3 21.1 1250.8 18.7 39.7 463.1
8 514.2 1.6 1.6 764.4 2.5 4.1 417.0 7.1 11.2 1194.8 25.7 36.9 241.7 15.9 52.8 7.3
9 93.1 1.1 1.1 483.2 2.0 3.1 660.5 5.7 8.7 574.7 30.8 39.5 218.7 24.7 64.2 42.1
10 191.5 1.1 1.1 783.0 2.6 3.7 404.8 7.2 11.0 1849.1 22.5 33.4 438.3 16.1 49.5 30.9
11 195.3 1.2 1.2 597.9 2.4 3.6 312.3 4.7 8.2 595.4 6.3 14.6 1931.6 23.2 37.8 504.2
12 237.3 1.5 1.5 482.5 3.3 4.8 453.8 6.6 11.4 888.6 29.5 40.9 837.7 22.7 63.5 107.4
13 636.0 1.5 1.5 510.7 3.4 5.0 496.1 1.8 6.8 1183.5 5.1 11.9 1786.3 25.7 37.6 53.9
14 166.4 1.5 1.5 194.9 2.5 4.1 893.6 6.7 10.7 763.9 18.5 29.2 505.8 19.5 48.6 77.2
15 302.1 1.7 1.7 506.7 3.1 4.8 743.9 8.8 13.6 556.6 36.9 50.5 530.1 26.9 77.4 7.6
16 126.8 1.1 1.1 522.0 2.1 3.2 1244.5 15.9 19.1 447.4 15.5 34.6 186.6 15.5 50.1 83.6
17 79.5 1.0 1.0 526.3 7.4 8.6 1317.5 19.7 28.2 561.6 8.7 37.0 251.2 14.2 51.2 19.6
18 273.1 1.0 1.0 925.5 2.9 4.0 908.3 4.9 8.9 1902.9 14.1 23.0 234.2 14.3 37.4 53.1
19 224.1 1.3 1.3 1375.4 6.6 7.9 1564.4 14.2 22.1 582.4 15.3 37.4 192.1 17.1 54.5 28.8
Note: Lith. ¼ Lithology, Res. ¼ Resistivity, h ¼ Thickness, D ¼ Depth.
E.S. Joel et al. Heliyon 6 (2020) e03327
However, in sedimentary basin, more than three-layered lithologicalsettings (such as four, five-layer curves and so on) corresponding tomultiple curve types could be achievable. For example, in order to clas-sify a 4-layered resistivity curve, its classification can be done byanalyzing the first 3 resistivity values (ρ1,ρ2and ρ3) and the last threeresistivity values (ρ2, ρ3and ρ4), such that eight (8) categories of four-layered curves (that is, HA, HK, AA, AK, KH, KQ, QH, and QQ) arepossible as shown in Figures 6c, d, e, f. Further classifications can be doneusing this basic approach as documented by Patra and Nath (1999) andSunmonu et al. (2015). Five (5) different curve types were identified inthe study area, which are AAKQ-curve, KHKQ-curve, AKQQ-curve,KHAK-curve, and QHKQ-curve types (Table 1). The percentage distri-bution of the curve types in the order of appearance from the curve typesare as follow: 15.8% are of AAKQ-type, 26.3% are of KHKQ-type, 42.1%are of AKQQ-type, 10.5% are of KHAK-type, and 5.3% are of QHKQ-typerespectively. Classification of the VESs to their respective types, curvemodels and their frequencies are summarized in Table 1. The interpre-tation of geoelectrical results revealed six lithological layers in the studyarea such as topsoil, lateritic clay, clayey sand, mudstone, sand (mainaquifer) and shale or clay as shown in Table 2 in accordance to theinterpretation of Oyeyemi et al. (2018). Because of the unavailability ofborehole data due to the practising system of groundwater withdrawal(hand-dug well) in the study area, these lithological distribution wasinferred based on the comparison with the local geology of Iju and Otarespectively. The first layer which is topsoil has resistivity values rangingfrom 69.1 to 636.0Ωmwith mean value of 233.4Ωm, while the thickness
7
varies from 0.9 to 1.7 m. Most times, the resistivity value of first layeralways depends on the volume of clay content of the moisture and itscompaction degree level (Aizebeokhai et al., 2016). The layer underlainby topsoil is lateritic clay, with resistivity values ranging from 237.1 to1375.4 Ωm with average value of 550.4 Ωm and varying thickness ofabout 1.4–6.6 m. Beneaththe lateritic clay is clayey sand with mean valueof 770.7 Ωm which is continuous laterally from second layer. The re-sistivity value of this layer ranges from 263.7 to 1564.4 Ωm, with athickness of about 2.3–19.7 m. Both second and third layers havedifferent degree of water saturation and compaction, which are imper-meable, most especially area where percolation are poor as a result ofcompaction. These layers once a while always form parched aquifer andas a result the areas experience flooding (Aizebeokhai et al., 2016).Fourth layer is underlain by mudstone and is highly resistive. This wasdelineated to have resistivity value that ranged from 447.4 to 2203.9Ωm,with average value of 1023.9 Ωm and thickness that varies from 5.1 to37.8 m. High resistivity value was observed in this layer and could beattributed to intercalation of phosphate of metamorphic and magmaticflow. Underneath this layer is sand which is found to be the main aquiferwith resistivity value that ranges from 141.0 to 1931.6 Ωm and meanvalue of 562.3 Ωm while the thickness varies from 8.6 to 26.9 m,respectively. The fifth layer delineated is the main aquifer that consists ofunconsolidated grain sand, which is coarse in nature. Underneath theaquifer layer is shale or clay with resistivity values that fluctuated from7.3 to 504. 2 Ωm.

Figure 7. a. Geoelectric section of traverse 1. b. Geoelectric section of traverse 2. c. Geoelectric section of traverse 3. d. Geoelectric section of traverse 4. e. Geoelectricsection of traverse 5. f. Geoelectric section of traverse 6.
E.S. Joel et al. Heliyon 6 (2020) e03327
4.2.1. Geoelectric sectionThe result presented showed the geospatial features of the subsurface
layers according to their depths and stations. The geoelectric sections ofsix traverses, as revealed on Figures 1 and 5b were plotted in order tomap the depth to the main aquifer (Figures 7a, b, c, d, e, f). The impor-tance of geoelectric sections is to map the variations of geoelectricalparameters along a linear path (Adagunodo et al. 2015, 2017; Sunmonuet al., 2015, 2016; Raji and Adeoye, 2017). The six traverses weregrouped as follow: traverse 1 contained VESs 1, 19, 2, 3, 4, 5 and 7 in NE– SW direction, traverse 2 contained VESs 18 and 6 in NE – SW direction,traverse 3 contained VESs 17, 16 and 15 in N – S direction, traverse 4contained VESs 11, 13, 15 and 14 in NW – SE direction, traverse 5
8
contained VESs 13, 8 and 7 in NW – SE direction, and traverse 6 con-tained VESs 11, 13, 10 and 9 in NS direction. Each traverse was chosenaccording to how the two-dimensional (2D) signatures of the subsurfacevariations can be imaged conveniently (Adagunodo et al., 2017). The 2Dimaging is also capable of revealing both lateral and vertical variationswithin the subsurface. The top of the main aquifer in the study areafluctuates from 11.9 to 50.5 m while the aquifer bottom fluctuates from27.5 to 80.1 m. This reveals that the depth to the main aquifer in Iju andOta is approximately 25.0 m. The aquifer thickness varies from point topoint with minimum thickness of about 8.6 m and maximum thickness of32.0 m. The thickness of the aquifer in Iju and Ota community is a result
E.S. Joel et al. Heliyon 6 (2020) e03327
of the fractures (lineaments) that are interconnected, which will defi-nitely result to good yield at this depth.
Traverse 1 revealed that aquifer may be reached at depth of 28.0 mfor VES 1, for VES 19 the depth to the aquifer ranged between 35.0 m and55.0 m, as well as VES 3. But at VES 2, the depth to the aquifer is between50.0 m and 80.0 m while is 40.0 m at VES 4 and VES 5 and 35.0 m at VES7 respectively in the NE-SW direction (Figure 7a)Transverse 2 showedthe variations in the aquifer to be between 28.0 m and 50.0 m in NE-SWdirection (Figure 7b). Transverse 3 in the N–S direction further revealedthe thickness of aquifer towards the southern part of the study area to beapproximately 30.0 m thick and the depth to reach the aquifer in tha-torientationranged between 40.0 m and 80.0 m (Figure 7c). Transverse 4in the NW-SE direction unfolds the depth to the aquifer that ranged be-tween 20.0 m and 80.0 m with deep aquifer observed at VES 4(Figure 7d) while transverse 5 revealed similar trend but at the depth tothe aquifer that ranged between 20.0 m and 50.0 m with observed thickoverburden (Figure 7e). Also transverse 6 discloses the trend of theaquifer to be N-S direction at the depth thatvaried between 20.0 m and60.0 m at VES 11, VES 13, VES 10 and VES 9 respectively (Figure 7f).
5. Conclusions
The lineaments and the production of the rose diagram indicate thetrend of the structural features that control the groundwater system inthe area which invariably suggests high groundwater potential of thestudy area, where water can be tapped and served for long period of time.Resistivity technique (geoelectric section) revealed good aquiferousfeatures with variation in depths of about 25.0 m–80m for a good yield inthe study area. The use of resistivity technique and SRTM for hydro-geological investigation revealed significant subsurface features of abetter groundwater characterization in the study area. Significantly, thecombinations of these two techniques serve a better scientific idea forundisclosed nature of groundwater featuresin sedimentary terrain wherefractures are buried in the subsurface. It is therefore recommended thatthickness of aquifers should be determined from geo-electric studiesbefore recommending the drilling locations in the study area.
Declarations
Author contribution statement
Emmanuel S. Joel: Conceived and designed the experiments; Per-formed the experiments; Analyzed and interpreted the data; Wrote thepaper.
Peter Olasehinde: Conceived and designed the experiments.Theophilus Adagunodo: Analyzed and interpreted the data.Maxwell Omeje, Ifeanyi Oha, Marvel L. Akinyemi, Olukunle C. Ola-
wole: Contributed reagents, materials, analysis tools or data.
Funding statement
This research did not receive any specific grant from funding agenciesin the public, commercial, or not-for-profit sectors.
Competing interest statement
The authors declare no conflict of interest.
Additional information
No additional information is available for this paper.
Acknowledgements
The authors are thankful to Covenant University Ota, for providingenabling environment. Furthermore, authors are also grateful to Open
9
Transaction on Geosciences for the permission given to reproduceFigure 6 from Sunmonu et al. (2015).
References
Acharya, T., Mallik, S.B., 2011. Analysis of lineament swarms in a Precambrianmetamorphic rocks in India. J. Earth Syst. Sci. 121 (2), 453–462.
Acharya, T., Nag, S.K., Basumallik, S., 2012. Hydraulic significance of fracture correlatedlineaments in precambrian rocks in purulia district, West Bengal. J. Geol. Soc. India80 (5), 723–730.
Adagunodo, T.A., 2017. Groundwater Contamination:Performance, Effects, Limitationsand Control. Chapter 3 in Book: Groundwater Contamination: Performance,Limitations and Impacts, 1 – 135. In: Anna L. Powell © 2017. Nova SciencePublishers, Inc., pp. 33–64
Adagunodo, T.A., Adeniji, A.A., Erinle, A.V., Akinwumi, S.A., Adewoyin, O.O., Joel, E.S.,Kayode, O.T., 2017. Geophysical investigation into the integrity of a reclaimed opendumpsite for civil engineering purpose. Inter. J. 42 (11), 324–339.
Adagunodo, T.A., Akinloye, M.K., Sunmonu, L.A., Aizebeokhai, A.P., Oyeyemi, K.D.,Abodunrin, F.O., 2018. Groundwater in aaba residential area of akure, Nigeria. Front.Earth Sci. 6, 66.
Adagunodo, T.A., Sunmonu, L.A., Adeniji, A.A., 2015. Effect of dynamic pattern of thesaprolitic zone and its basement on building stability: a case study of a high-risebuilding in ogbomoso. J. Appl. Phys. Sci. Int. 3 (3), 106–115.
Adejumo, R.O., Adagunodo, T.A., Bility, H., Lukman, A.F., Isibor, P.O., 2018.Physicochemical constituents of groundwater and its quality in crystalline bedrock,Nigeria. Int. J. Civ. Eng. Technol. 9 (8), 887–903.
Aizebeokhai, A.P., Oyebanjo, O.A., 2013. Application of vertical electrical soundings tocharacterize aquifer potential in Ota, Southwestern Nigeria. Int. J. Phys. Sci. 8 (46),2077–2085.
Aizebeokhai, A.P., Oyeyemi, K.D., Joel, E.S., 2016. Groundwater potential assessment in aSedimentary terrain, southwestern Nigeria. Arab. J. Geosci. 9, 1–15.
Akinluyi, F.O., Olorunfemi, M.O., Bayowa, O.G., 2018. Investigation of the influence oflineaments, lineament intersections and geology on groundwater yield in thebasement complex terrain of Ondo state, southwestern Nigeria. Appl. Water Sci. 8,49.
Al-Amoush, H., 2010. Integration of vertical electrical sounding and aeromagnetic datausing GIS techniques to assess the potential of unsaturated zone and natural basaltcaves for groundwater artificial recharge in NE-Jordan. Jord. J. Civ. Eng. 4 (4),389–408.
Anbazhagan, S., Jothibasu, A., 2016. Geoinformaticsin groundwater potential mappingand sustainable development: a case study from southern India. Hydrol. Sci. J. 61 (6),1109–1123.
Anudu, G.K., Essien, B.I., Onuba, L.N., Ikpokonte, A.E., 2011. Lineament analysis andinterpretation for assessment of groundwater potential of Wamba and adjoiningareas, Nassarawa state, north-central Nigeria. J. Appl. Technol. Environ. Sanit. 1,185–198.
Ariyo, S.O., Adeyemi, G.O., 2009. Role of electrical resistivity method for groundwaterexploration in hard rock areas: a case study from Fidiwo/Ajebo areas of SouthwesternNigeria. Pacif. J. Sci. Technol. 10, 483–486.
Batalan, O., De Smedt, F., 2000. Using Landsat5 imagery in the assessment ofgroundwater resources in the crystalline rocks around Dutsin-Ma, northwesternNigeria. J. Min. Geol. 36, 85–92.
Bernard, J., Legchenko, A., 2003. Groundwater exploration with the magnetic resonancesounding method. ASEG Extend. Abstr. 2, 1–5.
Chaplin, M.F., 2001. Water: its importance to life. Biochem. Mol. Biol. Educ. 29, 54–59.Dafalla, D.S., Kheiralla, K.M., Dahab, M.A.H., 2015. Groundwater exploration using
integration of electrical resistivity data with remote sensing and GIS data, northernstate – Sudan. Int. J. Sci. Res. Eng. Technol. 4 (7), 736–740.
De’gnan, J.R., Clark JR., S.F., 2002. Fracture-correlated Lineaments at Great Bay,Southeastern New Hampshire. U.S.G.S. Open-File Report 02-13.
Edet, A.E., Teme, C.S., Okereke, C.S., Esu, E.O., 1994. Lineament analysis for groundwaterexploration in precambrian oban massif and obudu plateau, south-east Nigeria.J. Min. Geol. 30, 87–95.
Gao, Q., Shang, Y., Hassan, M., Jin, W., Yang, P., 2018. Evaluation of a Weathered rockaquifer using ERT method in south Guangdong, 337 China. Water 10, 293.
Goki, N.G., Ugodulunwa, F.X.O., Ogunmola, J.K., Oha, I.A., Ogbole, J.O., 2010.Geological controls for groundwater distribution in the basement rocks of Kanke,central Nigeria from geophysical and remotely sensed data. Afr. J. Basic Appl. Sci. 2,104–110.
Goldman, M., Neubauer, F.M., 1994. Groundwater exploration using integratedgeophysical techniques. Surv. Geophys. 15 (3), 331–361.
Grohmann, H.C., Riccomini, C., Machado-Alves, F., 2007. SRTM-based morphotectonicanalysis of the Pocos de Caldas Alkaline massif, Southern Brazil. Comput. Geosci. 33,10–19.
Hanslmeier, A., 2011. Life and Water. Chapter 2 in Book: Water in the Universe, 368.Astrophysics and Space Science Library, pp. 25–36. http://www.springer.com/978-90-481-9983-9.
Helaly, A.S., 2017. Assessment of groundwater potentiality using geophysical techniquesin Wadi Allaqi Basin, Eastern desert, Egypt-case study. NRIAG J. Astron. Geophy. 6,408–421.
Hewaidy, A.G.A., El-motaal, E.A., Sultan, S.A., Ramdan, T.M., El-khafif, A.A.,Soliman, S.A., 2015. Groundwater exploration using resistivity and magnetic data atthe northwestern part of the Gulf of suez, Egypt. Egypt. J. Petrol. 24, 255–263.

E.S. Joel et al. Heliyon 6 (2020) e03327
Ikhane, P.R., Omosanya, K.O., Akinmosin, A.A., Odugbesan, A.B., 2012. Electricalresistivity imaging of slope deposits and structures in some parts of Eastern Dahomeybasin. J. Appl. Sci. 12, 716–726.
Jequier, E., Constant, F., 2010. Water as an essential nutrient: the physiological basis ofhydration. Eur. J. Clin. Nutr. 64, 115–123.
Joel, E.S., Olasehinde, P.I., De, D.K., Omeje, M., Adewoyin, O.O., 2016. Estimation ofaquifer transmissivity from geophysical data. A case study of Covenant Universityand Environs, southwestern Nigeria. Sci. Int. (Lahore) 28 (4), 3379–3385.
Joel, E.S., Olasehinde, P.I., Adagunodo, T.A., Omeje, M., Akinyemi, M.L., Ojo, J.S., 2019a.Integration of aeromagnetic and electrical resistivity imaging for groundwaterpotential assessment of Coastal Plain sands area of Ado-Odo/Ota in southwestNigeria. Groundwater Sustain. Develop. 9, 100264.
Joel, E.S., Maxwell, O., Adewoyin, O.O., Olawole, C.O., Arijaje, T.E., Embong, Z.,Saeed, M.A., 2019b. Investigation of natural environmental radioactivityconcentration in soil of coastaline area of Ado-Odo/Ota Nigeria and its radiologicalimplications. Sci. Rep. 9 (1), 4219.
Keller, S., Frischnecht, N., 1970. An interactive computer/graphic – display-terminalsystem for interpretation of resistivity soundings. Geophys. Prosp. 23, 449–458.
Kure, N., Hyacientjh, A.O., Raimi, J., Alao, J.O., Daniel, I.H., 2017. The delineation ofpotential groundwater aquifers within Basement complex in ABU Zaria, Nigeria. Br.J. Appl. Sci. Technol. 19 (1), 1–9.
Lattman, L.H., Parizek, R.R., 1964. Relationship between fracture traces and theoccurrence of ground water in carbonate rocks. J. Hydrol. 2 (2), 73–91.
McNeill, J.D., 1991. Advances in electromagnetic methods for groundwater studies.Geoexploration 27, 65–80.
Molli, G., Doveri, M., Manzella, A., Bonini, L., Botti, F., Menichini, M., Montanari, D.,Trumpy, E., Ungari, A., Vaselli, L., 2015. Surface - subsurface structural architectureand groundwater flow of the EquiTerme hydrothermal area, Northern Tuscany Italy.Ital. J. Geosci. 134 (3), 1–16.
Muhammad, S., Khalid, P., 2017. Hydrogeophysical investigations for assessing thegroundwater potential in part of the Peshawar basin, Pakistan. Environ. Earth Sci. 76,494.
Muthamilselvan, A., Srimadhi, K., Nandhini, R., Pavithra, P., Balamurugan, T., Vasuki, V.,2017. Spatial confirmation of major lineament and groundwater exploration usingground magnetic method near mecheri village, salem district of Tamil nadu, India.J. Geol. Geophys. 6, 1.
Nwankwo, L.I., 2011. 2D Resistivity survey for groundwater exploration in a hard rockterrain.A case study of MAGDAS observatory, University of Ilorin, Nigeria. Asian J.Earth Sci. 4 (1), 46–53.
Nwankwo, L.I., Olasehinde, P.I., Babatunde, E.B., 2004. The use of electrical resistivitypseudo-section in elucidating the geology of an east-west profile in the basementcomplex terrain of Ilorin, West-Central Nigeria. Niger. J. Pure Appl. Sci. 19,1672–1682.
Okereke, C.S., Esu, O.E., Edet, A.E., 1998. Determination of potential groundwater sitesusing geological and geophysical techniques in cross river state, SoutheasternNigeria. J. Afric. Earth. Sci. 27 (1), 149–163.
Oladejo, O.P., Sunmonu, L.A., Adagunodo, T.A., 2015. Groundwater prospect in a typicalprecambrian basement complex using karous-hjelt and fraser filtering techniques.J. Ind. Eng. Res. 1 (4), 40–49.
Oladejo, O.P., Sunmonu, L.A., Ojoawo, A., Adagunodo, T.A., Olafisoye, E.R., 2013.Geophysical investigation for groundwater development at oyo state housing estateogbomosho, southwestern Nigeria. Res. J. Appl. Sci. Eng. Technol. 5 (5), 1811–1815.
Olafisoye, E.R., Sunmonu, L.A., Ojoawo, A., Adagunodo, T.A., Oladejo, O.P., 2012.Application of very low-frequency electromagnetic and hydro-physicochemicalmethods in the investigation of groundwater contamination at aarada Waste disposalsite, ogbomoso, southwestern Nigeria. Austr. J. Basic Appl. Sci. 6 (8), 401–409.
Olasehinde, P.I., 2010. An integrated geological and geophysical exploration techniquesfor groundwater in the basement complex of west central part of Nigeria. J. Natl.Assoc. Hydrogeol. (Water Res.) 10, 46–49.
Omatsola, M.E., Adegoke, O.S., 1981. Tectonic evolution and cretaceous stratigraphy ofthe Dahomey basin. Nig. J. Min. Geo. 18 (1), 130–137.
10
Omeje, M., Husin, W., Noorddin, I., Oha, I.A., Onwuka, O.S., Soheil, S., 2014.Integratedgeoelectrical and structural studies for ground-water investigation in partsof Abuja, North Central Nigeria. Near Surf. Geophys. 12, 515–521.
Omeje, M., Husin, W., Noorddin, I., Oha, I.A., Onwuka, O.S., Ugwoke, P.E., Meludu, O.,2013. Geoelectrical investigation of aquifer problems in Gosa area of Abuja, NorthCentral Nigeria. Int. J. Phys. Sci. 8, 549–559.
Onuoha, K.O., 1999. Structural features of Nigeria’s coastal margin: an assessment basedon age data from wells. J. Afr. Earth Sci. 29 (3), 485–499.
Oyeyemi, K.D., Aizebeokhai, A.P., Ndambuki, J.M., Sanuade, O.A., Olofinnade, O.M.,Adagunodo, T.A., Olaojo, A.A., Adeyemi, G.A., 2018. Estimation of aquifer hydraulicparameters from surficial geophysical methods: a case study of Ota, southwesternNigeria. IOP Conf. Ser. Earth Environ. Sci. 173, 012028.
Patra, H.P., Nath, S.K., 1999. Schlumberger Geoelectric Sounding in Ground Water(Principle, Interpretation and Application). A.A. Balkema Publishers, Old Post Road,Brookfield, VT 05036-9704, USA.
Poongothai, S., Sridhar, N., 2017. Application of geoelectrical technique for groundwaterexploration in lower Ponnaiyar sub-watershed, Tamilnadu, India. IOP Conf. Ser.Earth Environ. Sci. 80, 1–10, 012071.
Raji, W.O., Adeoye, T.O., 2017. Geophysical mapping of contaminant leachate around areclaimed open dumpsite. J. King Saud Univ. Sci. 29, 348–359.
Rotimi, O.J., Atunbi, J.F., Osunnuga, B., 2014. Groundwater prospecting using electricalresistivity profiles over Jubilee Homes Parkland, Southwest, Nigeria. J. Emerg.Trends Eng. Appl. Sci. 5 (3), 188–196.
SDG6 (Sustainable Development Goal 6), 2018. Synthesis Report 2018 on Water andSanitation. United Nations Publications, New York, USA.
Shishaye, H.A., Abdi, S., 2016. Groundwater exploration for water well site locationsusing geophysical survey methods. Hydrol. Curr. Res. 7, 1.
Singh, K.K.K., Singh, A.K.S., Singh, K.B., Sinha, A., 2006. 2D resistivity imaging survey forsiting water-supply tube wells in metamorphic terrains: a case study of CMRI campus,Dhanbad, India. Lead. Edge 25, 1458–1460.
Sultan, S.A., Essa, K.S.A., Khalil, M.H., El-Nahry, A.E.H., Galal, A.N.H., 2017. Evaluationof groundwater potentiality survey in south Ataqa-Northwestern part of Gulf of Suezby using Resistivity data and site-selection modelling. NRIAG J. Astron. Geophy. 6,230–243.
Sunmonu, L.A., Adagunodo, T.A., Olafisoye, E.R., Oladejo, O.P., 2012. The groundwaterpotential evaluation at industrial estate ogbomoso southwestern Nigeria. RMZ Mater.Geoenviron. 59 (4), 363–390.
Sunmonu, L.A., Adagunodo, T.A., Adeniji, A.A., Oladejo, O.P., Alagbe, O.A., 2015.Geoelectric delineation of aquifer pattern in crystalline bedrock. Open Trans. Geosci.2 (1), 1–16.
Sunmonu, L.A., Adagunodo, T.A., Bayowa, O.G., Erinle, A.V., 2016. Geophysical mappingof the proposed Osun state housing estate, Olupona for subsurface competence andgroundwater potential. J. Basic. Appl. Res. 2 (2), 27–47.
Troften, P.F., 1973. Groundwater utilization in hard rocks atlas copco MCT AB-stockholmSweden. AHB 48, 35 – 15, Printed Matter no. 15317a.
Umar, A.B., Ladan, B., Gado, A.A., 2017. Groundwater evaluation study using electricalresistivity measurements in Bunza area of KebbiState, Nigeria. Int. J. Environ.Bioenergy 12 (2), 100–114.
Valeriano, M.M., Kuplich, T.M., Storino, M., Amaral, B.D., Mendes, J.N., Lima, D.J., 2006.Modelling small watersheds in Brazilian amazonia with shuttle radar topographicmission 90 m data. Comput. Geosci. 32, 1169–1181.
Westall, F., Brack, A., 2018. The importance of water for life. Space Sci. Rev. 214, 50.Wright, R., Garbeil, H., Baloga, S., Mougin-Mark, P., 2006. An assessment of Shuttle
Radar Topographic Mission digital elevation data for studies of volcano morphology.Rem. Sens. Environ. 105, 41–53.
Zandbergen, P., 2008. Applications of shuttle radar topography mission elevation data.Geogr. Comp. 2/5, 1404–1431.
Zarroca, M., Bach, J., Linares, R., Pellicer, X.M., 2011. Electrical methods for identifying,mapping and monitoring different saline domains in a coastal plain region (AltEmporda, Northern Spain). J. Hydrol. 409, 407–422.

![Groundwater Investigation and Characterization · Groundwater Investigation and Characterization ... manual for environmental site characterization [2] ... through drilling, well](https://img.dokumen.tips/doc/110x75/5b4001557f8b9a5e528ccc77/groundwater-investigation-and-characterization-groundwater-investigation-and.jpg)


