Embed Size (px)
Citation preview
Melisande Cardona
Institute for Prospective Technological Studies Digital Economy Working Paper 2016/04
Geo-blocking in Cross-border e-Commerce in the EU Digital Single Market
2016
Geo-blocking in Cross-border e-Commerce in the EU Digital Single Market
This publication is a Working Paper by the Joint Research Centre of the European Commission. It results from the
Digital Economy Research Programme at the JRC Institute for Prospective Technological Studies, which carries
out economic research on information society and EU Digital Agenda policy issues, with a focus on growth, jobs
and innovation in the Single Market. The Digital Economy Research Programme is co-financed by the Directorate
General Communications Networks, Content and Technology.
It aims to provide evidence-based scientific support to the European policy-making process. The scientific output
expressed does not imply a policy position of the European Commission. Neither the European Commission nor
any person acting on behalf of the Commission is responsible for the use which might be made of this publication.
JRC Science Hub
https://ec.europa.eu/jrc
JRC101438
ISSN 1831-9408 (online)
© European Union, 2016
Reproduction is authorised provided the source is acknowledged.
All images © European Union 2016
How to cite: Melisande Cardona (2016). ‘Geo-blocking in Cross-border e-Commerce in the EU Digital Single
Market.’ Institute for Prospective Technological Studies, Joint Research Centre. Digital Economy Working Paper
2016/04.
1
Abstract:
A cross-border e-commerce Mystery Shopping Survey conducted in 2015, finds that the
practice of erecting virtual barriers is still common in cross-border e-commerce within the EU, as it was in 2009. Electrical appliances, electronics and computer games are
particularly difficult to buy online from another country. Geo-blocking often takes place at the delivery stage of the online purchase process and less often at the access stage.
Larger websites can also block access according to a buyer’s IP address. Geo-blocking is less probably between countries sharing a common language while a common border or
geographical proximity has no effect. Travel services have a different pattern of geo-
blocking from tangible goods, where geo-blocking mainly takes place at the access stage. Price analysis shows that differentiation takes place in all sectors, but is more
common in the sectors less affected by geo-blocking.
2
Table of Contents
Abstract: ............................................................................................................ 1
1 Introduction ............................................................................................ 3
2 The extent and drivers of geo-blocking ................................................... 4
2.1 Methodology ........................................................................................ 4
2.2 Results of the regression analysis ............................................................ 6
3 Comparing the situation in 2015 and 2009 ............................................. 7
3.1 Methodology ........................................................................................ 7
3.2 Main Results ........................................................................................ 8
4 Price analysis .......................................................................................... 8
4.1 Methodology ........................................................................................ 8
4.2 Results ................................................................................................ 9
5 Conclusions ........................................................................................... 10
References ........................................................................................................ 11
List of Figures .................................................................................................... 12
List of Tables ..................................................................................................... 12
3
1 Introduction
It is often believed that Internet-based transactions have no borders (Cairncross, 2001).
Consumers can search globally for products and firms should view the entire world as their potential market. In reality, however, online consumers and firms face barriers to
cross-border online transactions. Firms may face administrative costs induced by regulatory differences between countries (Duch-Brown et al., 2015). Consumers face
language barriers and may have concerns about their personal and payment data and delivery conditions (Cardona et al., 2015). Online sellers may deliberately restrict access to
their web shops for users based in other countries. We call this geo-blocking. Geo-
blocking is enabled by means of geo-location tools that allow websites to identify the physical location of their visitors through their IP addresses, physical mailing addresses
or card payment details. Geo-location technologies may have positive effects for e-
commerce because they enable localised advertising and search and help to prevent fraud. Geo-blocking can be legitimate as it can help web shops to comply with trade
restrictions in national legislation. Online cross-border trade may be illegal for some services, for instance some types of copyright-protected digital media content or
gambling services. Moreover, access to media content may be blocked on Netflix or Amazon stores (Alaveras et al., 2015, Batikas et al., 2015a, b). However, geo-location tools
can also be used for commercial reasons to erect barriers. For instance, online shops can offer different prices and sales conditions for a given product or service based on the
geographic location of the consumer. Commercial strategies of this kind re-erect ‘virtual barriers’ in an otherwise borderless world (House of Representatives Standing Committee on
Infrastructure and Communications, 2013). Finally, shops may have good reasons to block
cross-border sales because they are costly for sellers in terms of administrative costs and compliance with tax and regulatory provisions in foreign markets.
The European Commission has placed the achievement of a truly European Digital Single Market (DSM) high on the policy priorities list. The DSM policy agenda aims to facilitate
cross-border online trade and reduce the regulatory barriers and real trade costs that
segment online markets, for instance by reducing parcel delivery costs, facilitating the management of differences in VAT rates, opening up cross-border access to copyright-
protected media content, etc. Geo-blocking between EU countries is recognized as a cause of the geographical fragmentation of digital markets in Europe. Eliminating this is one of the policy targets in the EU Digital Single Market Strategy (European Commission,
2015).
We know little about the extent of geo-blocking, how it is done or why it occurs. In this study, we focus on the extent of geo-blocking in online transactions and how it is implemented. We use data from a recent Mystery Shopping Survey (GfK, 2016). A
companion study (Duch-Brown & Martens, 2016) explores the potential economic impact of lifting geo-blocking restrictions.
An EU Mystery Shopping Survey to gauge the extent of geo-blocking was carried out in 2009 (Meier-Pesti et al., 2009). Using a sample of 100 online products, it found that 64%
of all cross-border shopping attempts failed. Means of online payment were often used to reduce cross-border access. Cross-border shoppers usually have fewer payment options
than domestic shoppers. It also discovered that in 13 EU countries approximately half of
the 100 products could only be obtained through cross-border transactions and not on the domestic market. This emphasizes the importance of cross-border shopping as a
source of product variety. Using the 2009 Mystery Shopping Survey data, Cardona & Martens (2014) found that it is more likely that shopping across the border will be
successful if the same language is spoken in the origin and destination country. On the other hand, geographical distance or common borders between countries have no effect.
The most significant effect, however, was found to be due to the type of product. Electronics and electric goods are more subject to geo-blocking than books or clothing
for instance. This raises questions about the type of online shops that block cross-border
access, and why they do it.
4
The penetration of e-commerce in retail shopping 1 has increased considerably since
2009. In 2009, 36% of all Europeans had online shopping experience; in 2015 this number had grown to 53%. In 2015, 16% of all Europeans reported that they had
bought cross-border online, up from 8% in 2009. A 2015 online consumer survey found that “more choice” and “better quality” are the main motivations for consumers to go cross-border (Cardona et al., 2015). But what has happened to the incidence of geo-
blocking over this period of time?
To answer this question, a new EU Mystery Shopping Survey was carried in 2015. For a detailed description of methods and results, see GFK (2016). In this report we go beyond
the descriptive statistics in the GfK study and focus on the regression analysis at
different stages in geo-blocking (Section 1) to clarify the factors that contribute to geo-blocking. This enables us to isolate the various factors that contribute to the likelihood of
geo-blocking. We also compare the 2009 and 2015 findings (Section 2). Finally, we analyse the price information collected in the mystery shopping survey (Section 3).
2 The extent and drivers of geo-blocking
2.1 Methodology
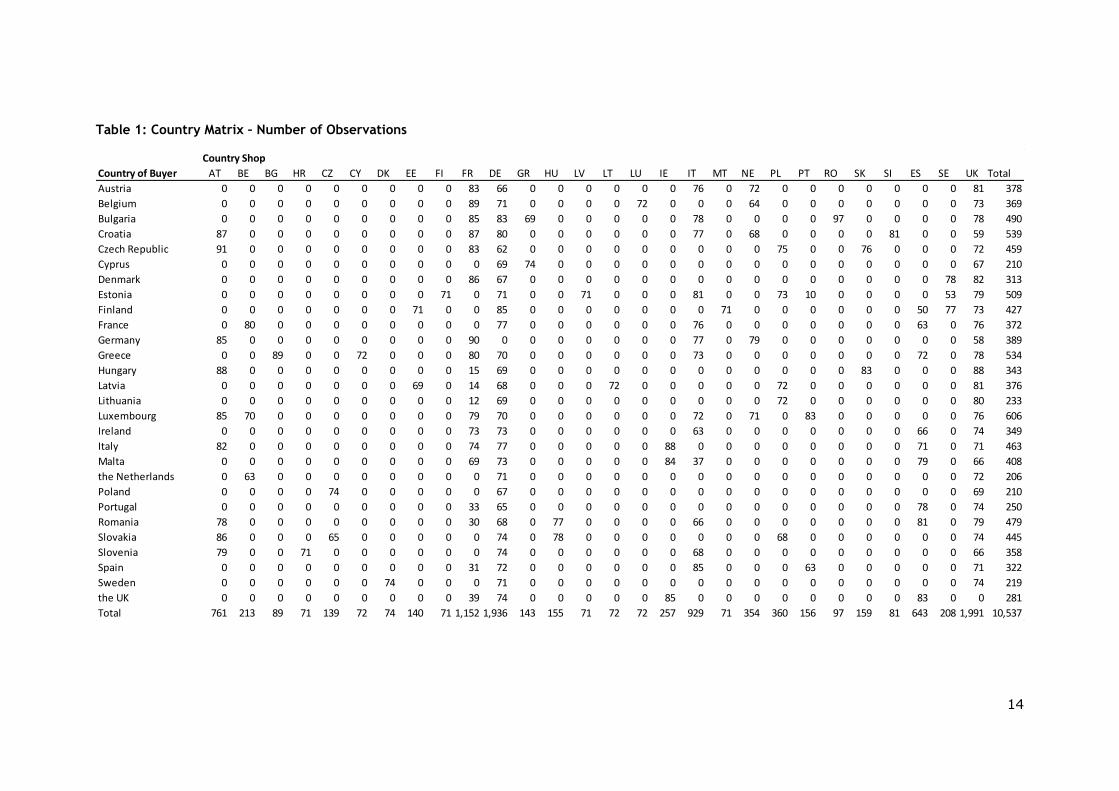
This study is based on an EU-wide online mystery shopping survey conducted in 2015. In total 10,537 observations were collected for cross-border shopping attempts for 147
different country pairs. Table 1 shows the number of observations for each country pair.
From each EU country, between 200 and 600 shopping attempts were tested, depending on the relative importance of the country in total online cross-border trade in the EU.
The country pairs were chosen primarily to represent the major online trade routes within the EU2. The relative importance of these online "trade routes" was taken from an earlier consumer survey (GfK, 2015). Germany and the UK are the main online exporters.
Access to websites in these two countries was tested from all other EU countries. A general overview of the methodology and results can be found in GfK (2016).
Mystery shoppers were assigned a website and two products3. First they tested the website and the availability of the two products as a domestic shopper in the country of
establishment of the web shop. Via a VPN network, they accessed the targeted web-shop with a domestic IP address of the shop’s country and recorded the information on
the availability of the assigned products, the price, delivery costs and payment options. Then the IP address was changed to the country of residence of the buyer to test
whether a cross-border shopping attempt could be completed successfully. From this foreign IP address, the mystery shoppers put the assigned product into the shopping
basket and performed all steps to complete the order.
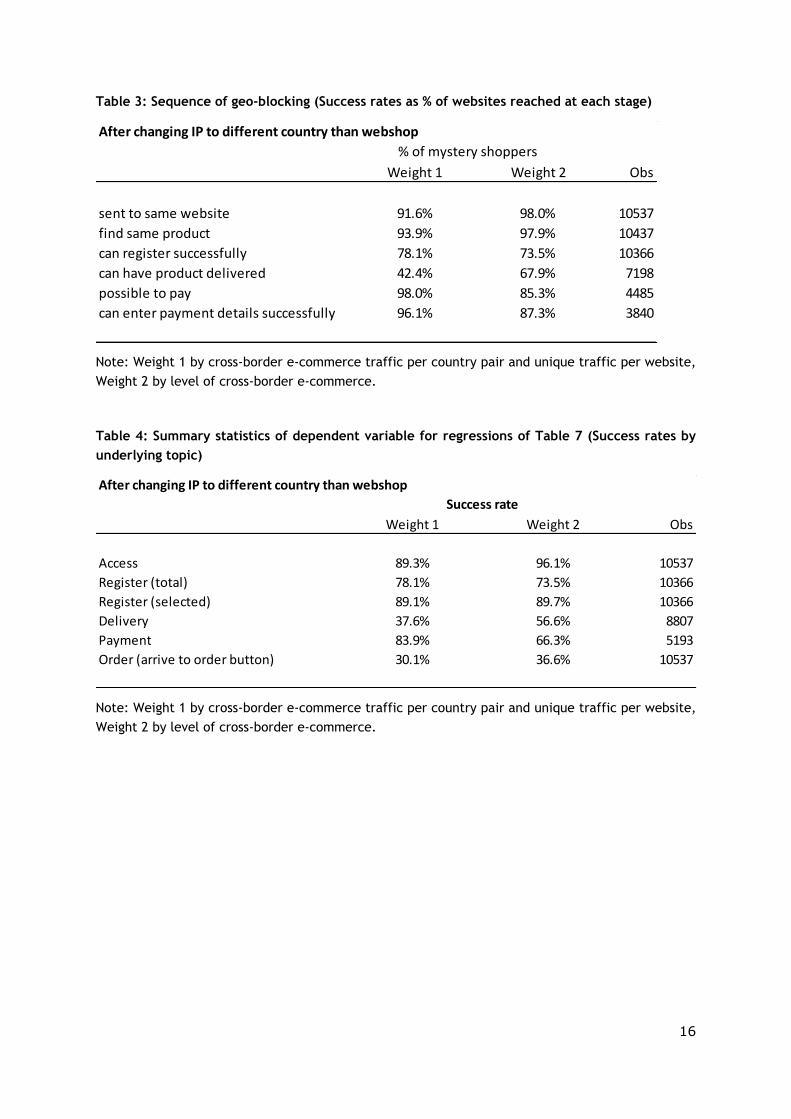
Figure 1 reflects the answers to the questionnaire questions in the order they were asked. The exact sequence of the questionnaire can be seen in the Appendix. If one
stage could not be completed successfully, the mystery shoppers stopped the process. Subsequent questions were answered only by mystery shoppers who could successfully
complete the previous stage. For example questions about delivery were only answered by those who could register successfully on the website (n=7198). The different stages
at which shopping attempts can be geo-blocked are: 1) Access (having access to the same website and finding the same product on the website); 2) Register (successfully
registering); 3) Delivery (foreign country delivery options are available); and 4) Payment
1 Measured as percentage of individuals who have bought at least once online within the last 12
months. Data from http://ec.europa.eu/eurostat/web/information-society/data/database 2 The data of the trade flows was based on a consumer survey carried out with EU28 online
respondents in the first quarter of 2015 http://ec.europa.eu/consumers/consumer_evidence/market_studies/obstacles_dsm/docs/21.09_dsm_final_report.pdf
3 Copyright-protected digital media content was excluded from this mystery shopping survey.
5
(the means of payment is accepted and payment details can be entered successfully).
Successful completion of all these stages implies that the mystery shoppers arrived at the order confirmation button (without pushing that button).
Two different weights are applied when presenting the results. Weight 1 is based on cross-border website traffic between the country pairs and the size of the website
measured in number of visits. 4 Weight 2 is based on the level of cross-border e-commerce as calculated on the basis of the consumer survey 2015, which was also used for the sampling (GfK, 2015) and is calculated at the country-pair level. Weight 2 is
designed to represent actual euro trade values for each country pair instead of internet
traffic flows. Trade level and cross-border internet traffic draw a very similar picture,
therefore the main difference between Weight 1 and Weight 2 is that the first takes into account the size of the website on which the shopping attempt was conducted.
In order to understand the factors that explain whether an online shopping stage will be passed successfully, we ran a logit regression on the binary variable at each stage
(yes/no successful). This allowed us to control for many effects simultaneously and therefore the significant correlations we find here are more reliable than those we would
have found in cross tabulations. Furthermore, it helped us to discover any patterns in the geoblocking.
We formulated the probability function for successfully completing a step in the online
shopping procedure as a function of product-specific, website-specific and country pair characteristics:
( ) ( )
( )
The equation was estimated with observations for each shopping attempt i in the
Mystery Shopper Survey by the maximum likelihood estimator. We included country buyer and seller fixed effects to control for any country idiosyncrasies (Country of Buyer,
CoB; and Country of Seller, CoS). Furthermore we included country pair variables, which are usually implemented in trade models to estimate the volume of trade between two countries (e.g. Feenstra, 2002, Gomez et al., 2014): i.e. common language (lang),
neighbouring countries (contiguity) and distance between the two countries. Several website characteristics were taken into account, including the number of visits on a
website (Websize)5 and whether the website was available in one or more languages (OneWeblang). Websites usually operate in the language of the web shop’s home
country. One or more additional languages can be interpreted as an indicator of the web shop's interest in selling abroad. A dummy for each product category was used to
estimate the probability of success in the shopping attempt for the sampled sectors (clothing, electronics, travel, cosmetics, books, computer games, electrical household
appliances and online reservations).
We should bear in mind some caveats with the Mystery Shopping Survey. We cannot determine unambiguously to what extent an unsuccessful shopping attempt is actually
due to geo-blocking. Non-delivery is clearly associated with geographical discrimination because the website simply refuses to deliver to the shopper’s country of residence.
Registration problems are also country-related (“could not select country”, or less clearly “no valid telephone number”). On the other hand, non-acceptance of the means of
payment may have different causes (e.g. “cardholder does not match buyer/driver”) or cannot be linked unambiguously to geo-blocking (“unable to authenticate”, “number
invalid”). A further important limitation is that mystery shopping attempts are not real
4 Data from two different web analytics companies, Similarweb (individual website data) and Alexa (country pair traffic), were used for the data on website traffic.
5 Similarweb data was used as a source, because it covered a higher percentage of websites of the sample.

6
shopping experiences. The mystery shoppers were instructed to shop for particular
products in particular countries. The geographical distribution was designed to reflect as closely as possible the actually observed trade routes of e-commerce. However, this
pattern of actual observations can be endogenous to the shopping experience: consumers are less likely to try routes that have a high failure rate. As such, the
percentages may not necessarily reflect the experiences and failed attempts of actual consumers. Nevertheless, the sample allows us to get a better understanding of the
drivers across countries and product categories.
2.2 Results of the regression analysis
The results in this section are all presented at the website level for the first tested
product.
Figure 1 shows the success rates in each of the consecutive stages that the mystery
shoppers went through. 2% of the shopping attempts were blocked at the first stage because they could not access the same website from another country. Weighted
according to the size (traffic volume) of the website, 8.4% of shopping attempts did not
have access to the same website after changing the country IP address. Instead, they were either blocked or redirected to a different website. On the same or redirected
website, not all mystery shoppers were able to find the same product they found as a domestic shopper (97.4% or 93.8%). A substantial drop in success rates came with
registration. This was the only step where mystery shoppers were more successful on larger websites than on smaller ones. When weighted by website traffic, 75%
successfully passed the registration stage, while with country-pair based weights, 72.5% could register. The steepest drop in success rates came with delivery, after which less
than half could continue the shopping attempt. At the same time, we observed a big split
in success rates according to the different weights (62% and 49.2%). “Can have product delivered” does not reflect the actual performed delivery, but the available information
on the website about delivery to the shoppers’ country. In the next step, shoppers had to check whether their means of payment was listed (31.3% and 41.9% respectively by
weights). For this purpose mystery shoppers were provided with prepaid credit cards. In most cases global cards (92%) were used, but also some country-specific local cards
(8%) were tested. In the last stage, payment details were entered. 30.1% (or 36.6%) passed this stage successfully and arrived at the final order confirmation button. We
have no information on the payment success rates for mystery shoppers who had no
delivery option to their country.
There were big differences in the success rates across this sequence of steps by product
category. From the registration stage onwards, shopping for travel services had the highest success rates for all steps – almost by definition since travel services are often
cross-border services. However, foreign shoppers for travel services were least likely to find the same offer as domestic shoppers. The reverse was true for electrical appliances:
while only 14% of mystery shoppers arrived at the order button for this category, 99% found the same electrical household appliance accessing the website from the same and
foreign country. Geoblocking and product differentiation appeared to be applied in
different ways in different product categories. The main change in success rates came at the delivery stage.
Table 3 shows the same sequence but calculates success rates conditional on having passed the previous stage. 67.9% of mystery shoppers who successfully registered were
also able to find a delivery option for their country of residence. After having confirmed a delivery option, 85% found their means of payment accepted. Again, delivery is a crucial
step in the geo-blocking sequence.
Table 4 shows success rates re-arranged by issue. For instance, if registering was
unsuccessful due to the payment information not being accepted, the payment variable
was coded accordingly. We also separated the registration variable in two parts: "Register (total)" reflects whether the stage was passed, while "register (selected)"
7
eliminates registration failure reasons that were attributed to other issues (delivery
address, payment details) and is restricted to proper registration problems (telephone number, postal code not accepted). Again, the results emphasized that passing the
delivery stage was pivotal. In order to get a sharper picture of the factors that drive success and failure in the mystery shopping process, the re-arranged variables are used
for the regressions.
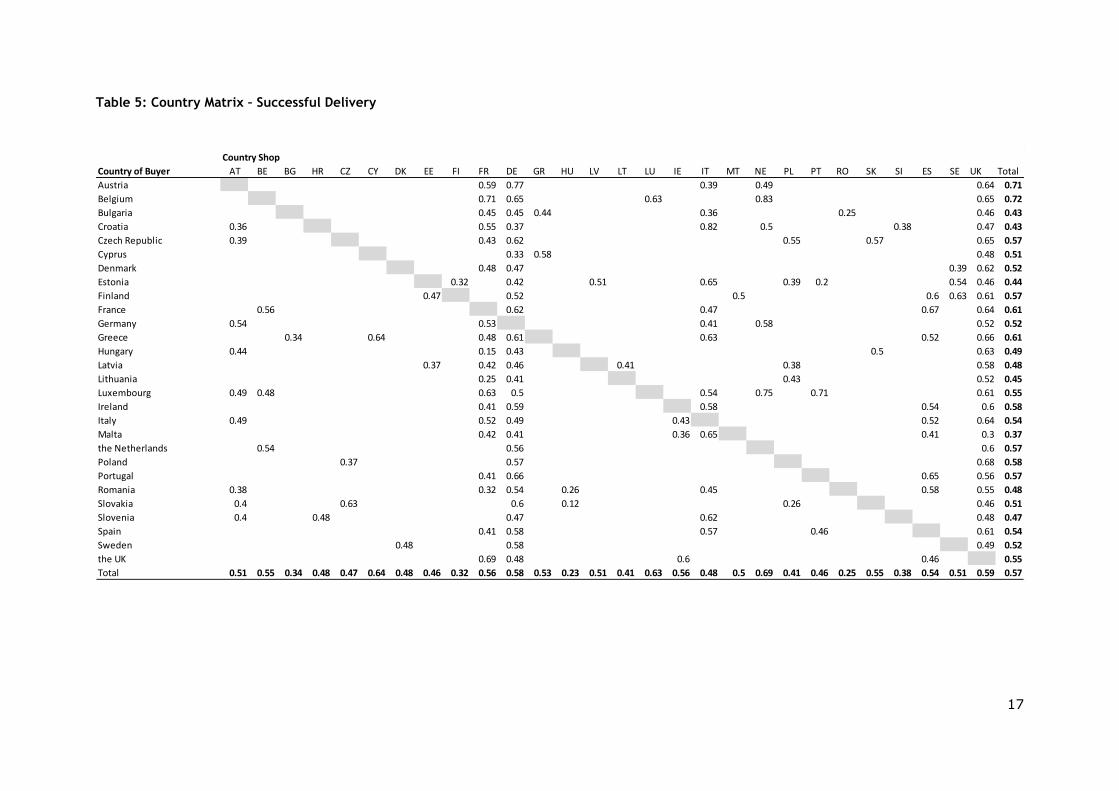
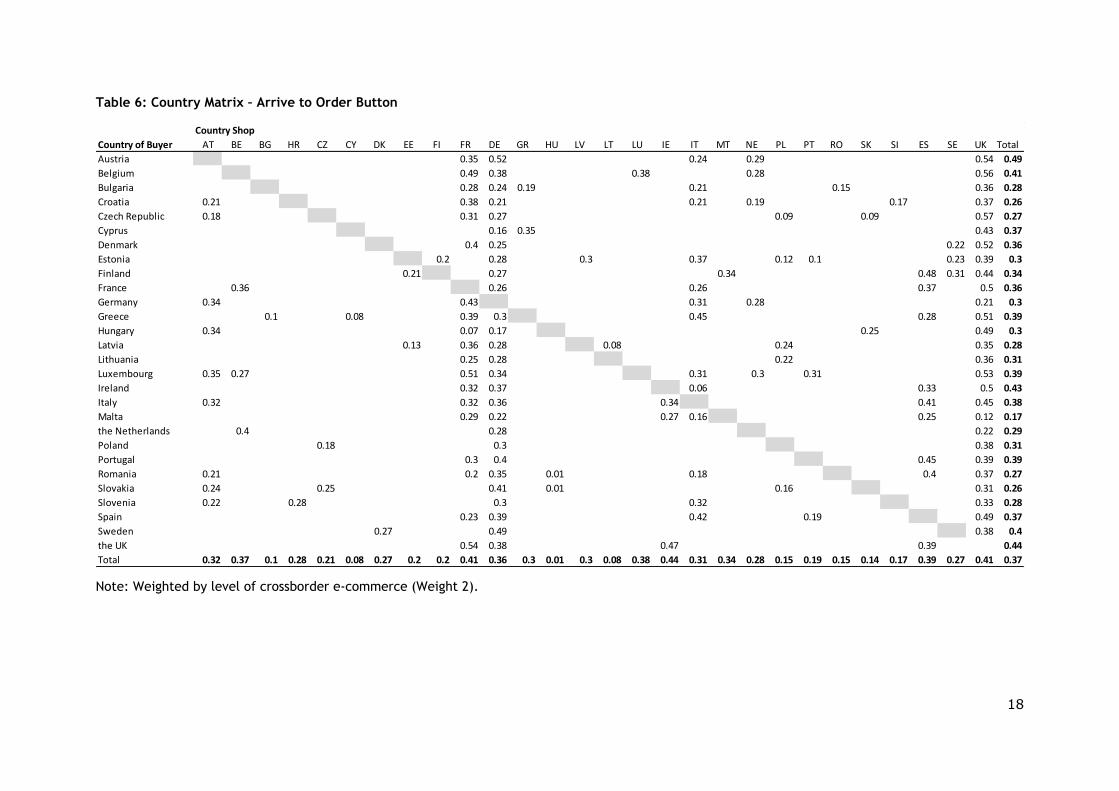
Tables 5 and 6 give detailed information at the country level on the crucial delivery step
and the final stage. These data must be interpreted bearing Table 1 in mind. This is particularly true for the last line that gives the averages by exporting (or seller) country.
These averages are sometimes calculated on the basis of only around 70 observations.
Germany, France and the UK as major exporters have samples of above 1,000 each and all have similar averages (between 56% and 59% for delivery, and 36% and 41% for
reaching the order confirmation button). On the buyer (importer) side, all averages are based on at least 200 observations. According to the survey, whereas buyers from
Austria, Belgium, France and Greece have the highest success rates for delivery. Shoppers in Austria, the UK and Ireland have the highest success rates for making it to
the order button. At the other end of the scale, the lowest success rates for delivery were found for shoppers from Bulgaria, Croatia and Malta. Shoppers from Slovakia join
this group. when they get to the last stage. Of course, these tables do not take into
account which products or country pairs were tested.
In order to combine the impact of all these variables, we used regression analysis. For
the purpose of the regression, we pooled and re-arranged the information from different questions into relevant issues as shown in Table 4.
The results of the logit regression in Table 7 show that larger websites are significantly related with geo-blocking and that they mainly discriminate at the access and delivery
stages, while they are more likely to accept payment means. The market/sector fixed effects largely confirm the cross-tabulation in Table 2. We see that local cards do not
have any significant effect on successful payment. This is another indication that
payment is not the main stage for geo-blocking.
The main drivers for successful cross-border shopping, next to website size and common
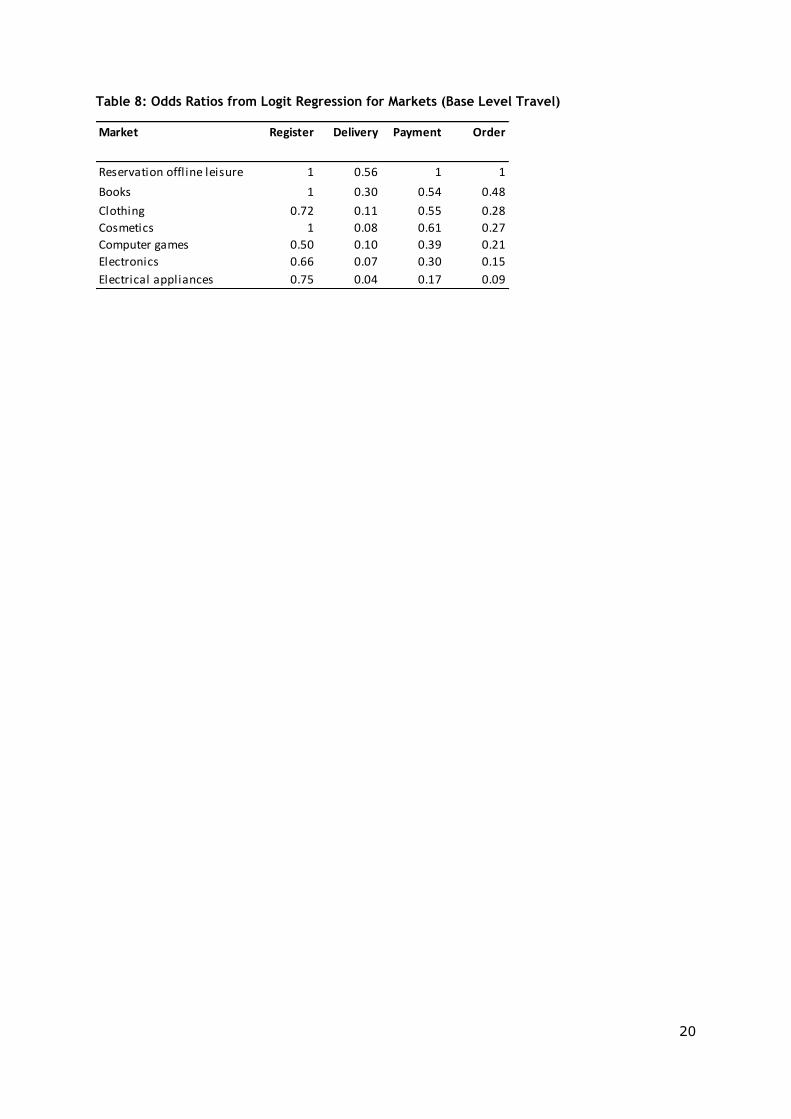
language, are the product categories. We therefore put them separately as odds ratios (calculated as the exponential of the coefficient) in Table 8. We can see how much less
likely the odds (probability of success/probability of failure) for various product categories are, relative to travel. If the odds for travel services to be delivered are e.g. 4
(which corresponds to a probability of 80%), then for electrical appliances the odds are only 0.04 times the odds of travel, which is 0.16 (corresponding to around 14%). The
table shows quite clearly that the odds change decisively according to the product
market, after controlling for country and website effects.
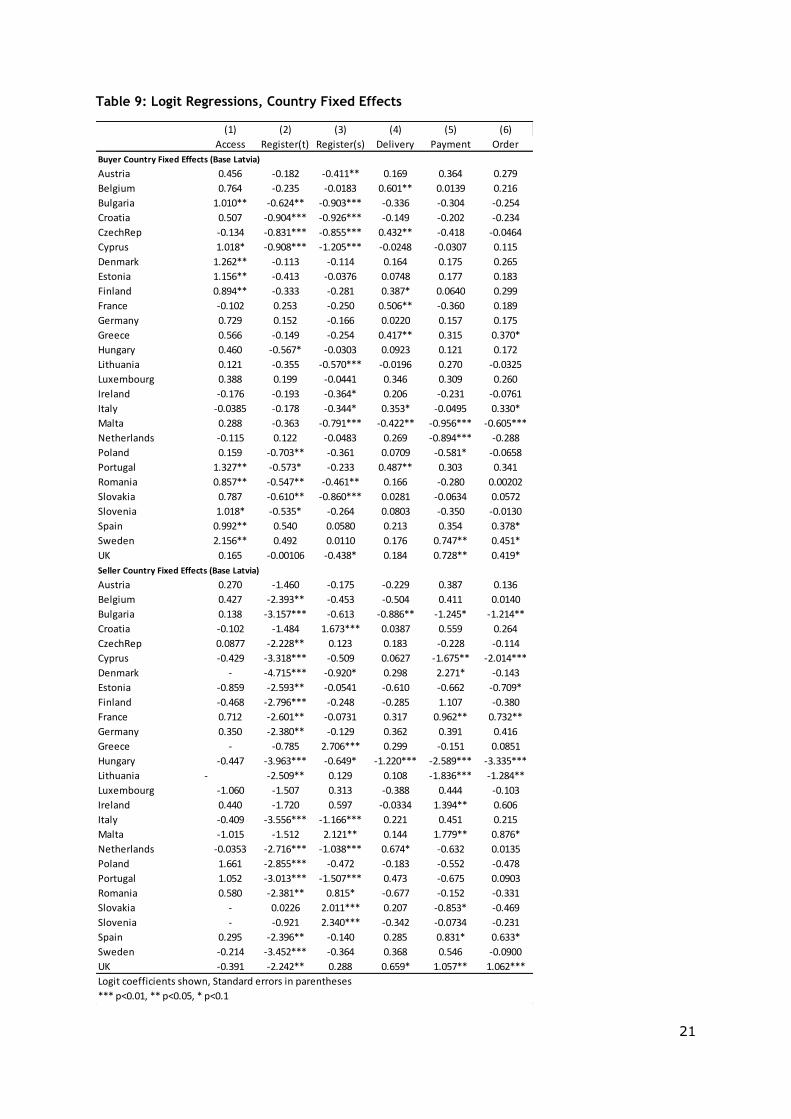
Table 9 shows the significance and direction of the country fixed effects compared to the
base country Latvia.6 For example, we can see that Austria has no significant positive effect as a buyer country at the delivery stage, despite it having the highest acceptance
rate in Table 5. This may be due to the significance of language at this stage. Interestingly, at the last stage we observe hardly any significant differences according to
the country of the buyer, although the simple averages vary between 17% and 49%. Many of these differences are obviously explained by country of seller and product
category.
6 For comparability reasons we used the same base country as in the analysis of 2009 survey (Cardona et al, 2014). Latvia, had the highest probability to ship the online orders.
8
3 Comparing the situation in 2015 and 2009
3.1 Methodology
Since a similar Mystery Shopper Survey was carried out in 2009, it is obvious that the
results should be compared to understand if and how geo-blocking has changed over the last 6 years in a setting where (cross-border) e-commerce has considerably increased.
This comparison is complicated by three differences between the surveys: first, the very
different sampling strategies; second, the differences in sampled product categories; and third, different questionnaire design. While the first two can be controlled for, the third
needs some logical reasoning when interpreting the data.
Due to the difference in sampling design between the mystery shopping exercise in 2009
and the one in 2015, some adjustments in the data are required before comparing the two. The design of 2009 survey covered more country pairs, with fewer observations
each. To make the data comparable, 312 country pairs that were not covered in 2015 were eliminated from the 2009 data. These country pairs represented rather infrequent
cross-border shopping routes and accounted for only about 14% of all the observations.
On the other hand, 20 country pairs of the 2015 survey were not tested in the 2009 mystery shopping exercise, mainly those pairs which included the new Member State,
Croatia. We applied the country pair trade weights according to the cross-border trade volume of 2015 to the 2009 survey data.
3.2 Main Results
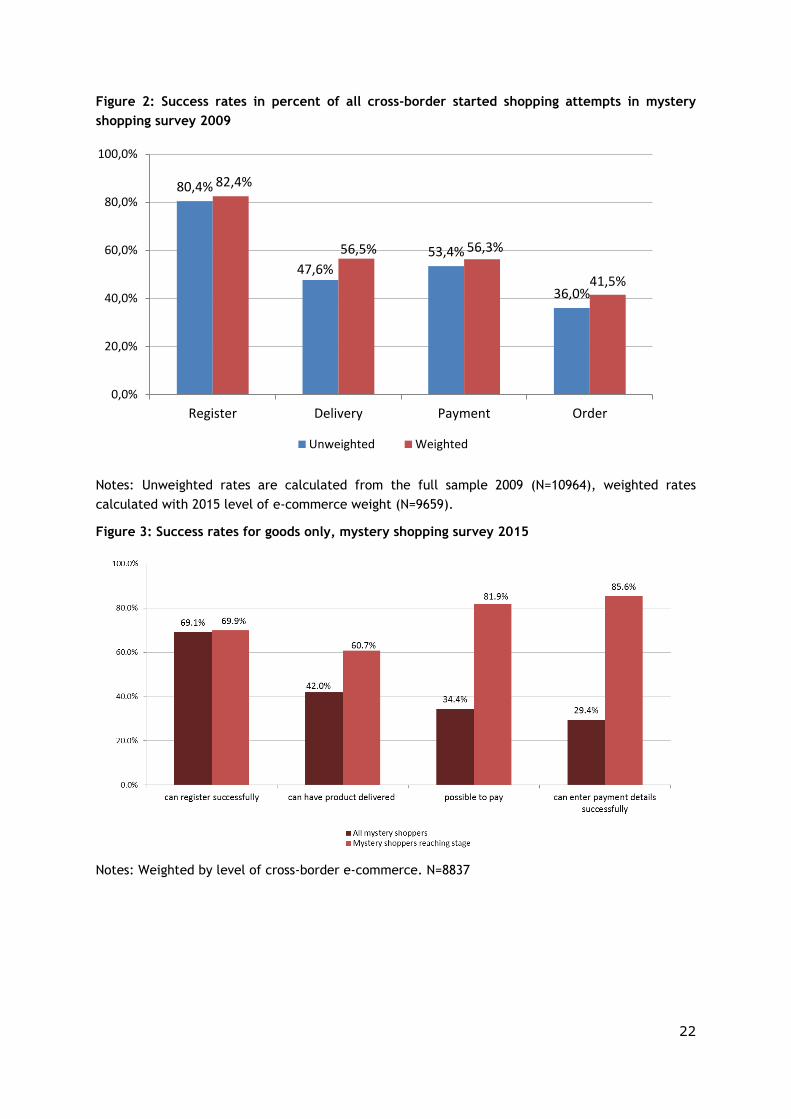
For the first issue, the weighted percentages took into account the different sampling strategies. When we compared the weighted data (according to the 2015 sampling) with
the original raw data from 2009 in Figure 2, it became apparent that the success rates had increased. This is easily explained by the fact that the 2015 sampling was based on
existing e-commerce trade routes and geo-blocking is usually less prevalent in popular trade routes. The weighted numbers are the most accurate comparison level for the
present survey. The 2009 survey covered only goods and not services (travel, online reservations) that were tested in 2015. To improve comparability, Figure 2 shows the
success rates for goods only (Clothing, Books, Electronics, Computer games, Cosmetics,
and Electrical Household Appliances). This is a better benchmark than the numbers presented in Section 2.
We also have to take into account the questionnaire design. For example, the question on delivery was answered by all mystery shoppers in 2009 and was not conditional on
the successful completion of previous steps; it was conditional however in 2015). 56.5% found a delivery option for their country. In 2015, mystery shoppers only answered the
question about whether a delivery to their country was available (60.7%), if registration had been successful. But we know that registration (the previous step) also failed in
many cases because the delivery address was not accepted. So it is fair to assume that
the success rate in delivery of the entire sample is smaller, although not necessarily as low as 42%. Some could not register, but even so, they might have been able to have
the product delivered. Most likely though it is closer to 42% than 61%, because it is probable that failure rates in registration would be correlated to delivery options. It is
reasonable to conclude that the delivery situation has not improved since 2009.
Regarding the last step of the questionnaire, 29.4% arrived at the order button after
surviving each step in the 2015 survey, while 36% stated in 2009 that it was possible to conduct the complete ordering process. This would indicate a fall in success rates, but
the stricter 2015 survey design that included filtering out shopping attempts when
stages could not be fully completed might explain the difference. Despite the comparison being limited due to different sampling and questionnaire design, we conclude that the
geo-blocking situation has not improved over the last 6 years. In fact geo-blocking practices may have increased.
9
4 Price analysis
4.1 Methodology
Every mystery shopper recorded product and price information for the same product
from two different perspectives: first, from that of a domestic shopper in the country of the web shop and second, from that of a cross-border shopper from another country.
After changing the IP address from a domestic one to a foreign one and before
registering with that foreign address, price information was recorded again (Step 1, Q17). It was recorded a third time after the registering process (Step 2, Q22). The
prices of the different products were recorded a fourth time just before confirming the order. This last price information usually includes delivery or other additional costs,
though these costs may not necessarily be made explicit. Therefore the price recorded last cannot be compared reliably to the first three prices.
This section relied on the product price information that the mystery shoppers entered. In a first procedure, GfK checked and fixed data manually by double checking the type of
product and URL page provided. Furthermore, all observations where product prices
were 0 were deleted. When the first and second price reported differed substantially and were inconsistent with the product information provided, the values were also set as
"missing". Additionally, we did some manual checks and corrected price changes which were of multipliers of 10, and deleted prices changes with increases larger than 500%
and decreases of more than 80%.
The level of analysis of prices was by product. Every website was tested by the mystery
shopper for two different products, and all available price information for the 3 stages
was used. Price differences were always presented as percentage change (
) Product
prices included VAT, but not delivery costs, which were analysed separately. In order to
test whether any pattern in the price differences was recognisable, we ran an OLS regression with the price differences as dependent variable.
Throughout this section, trade weight 2 (level of cross-border trade) was applied.
4.2 Results
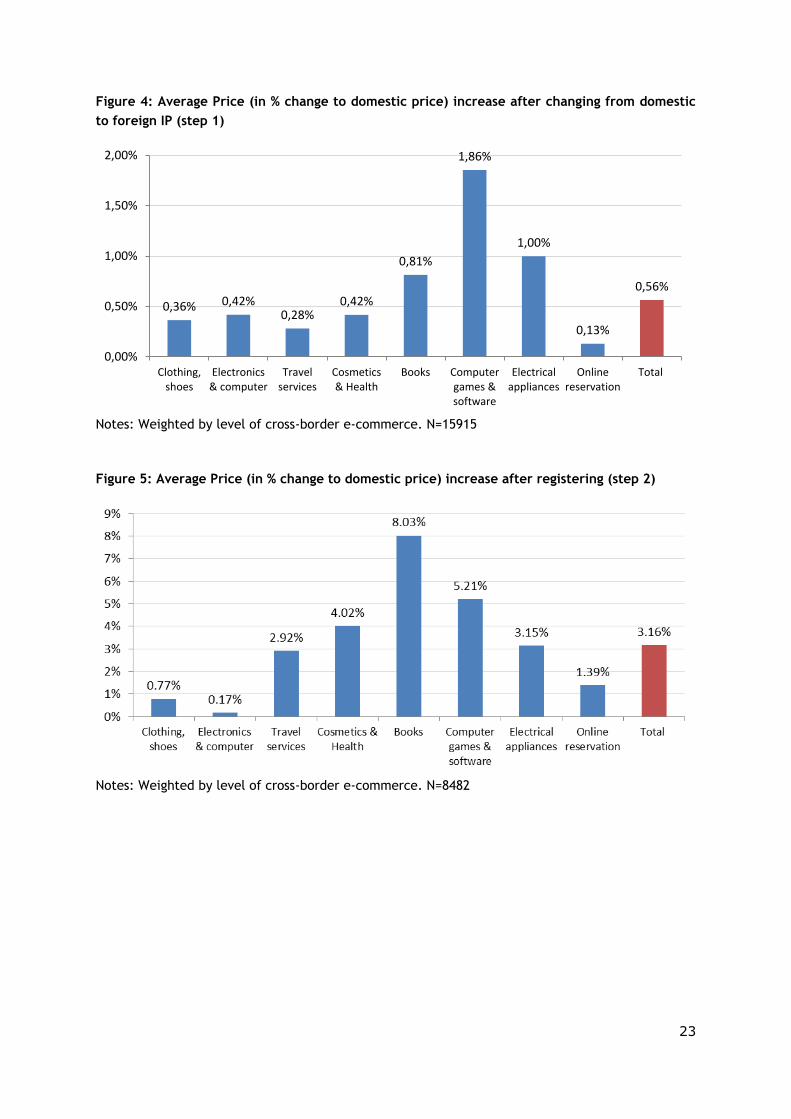
Figures 4 and 5 show the average price increases by product category. The averages
take into account unchanged prices, decreases and increases. The average prices in each sector increase when buying from a foreign country. Interestingly, the incidence of price
changes seems to be somewhat reversely correlated with the likelihood of geo-blocking. The highest price increases were observed for books and computer games, while the
lowest price increases appeared for electronics.
Figures 6 and 7 and Table 10 draw a more differentiated picture. They show that price
discrimination is more widespread in the Computer games and software and Electrical
appliances sectors. On the other hand, for books, cosmetics and health price discrimination is applied less often but on average much higher mark-ups are applied to
cross-border buyers. Overall, some form of price discrimination can be observed in around 20% of the sampled products. The observed differences by country are shown in
Table 11. Note that the price changes are often based on very small samples.
According to the regression (Table 12), price discrimination for Computer games and
software is higher than for books. As country pair fixed effects were included, this implies that the observed high price increase in Figure 5 was partly driven by the
countries in which this product category was tested and/or correctly recorded
disproportionately. The percentage price increase on domestic products is higher by 10 percentage points when ordering software and games as compared with booking travels
online. For books, the increase is 6 percentage points higher.
10
No significant connection between price discrimination and geo-blocking was found in the
regression analysis, which would suggest that web-shops which engage in geo-blocking do not bother to discriminate by price.
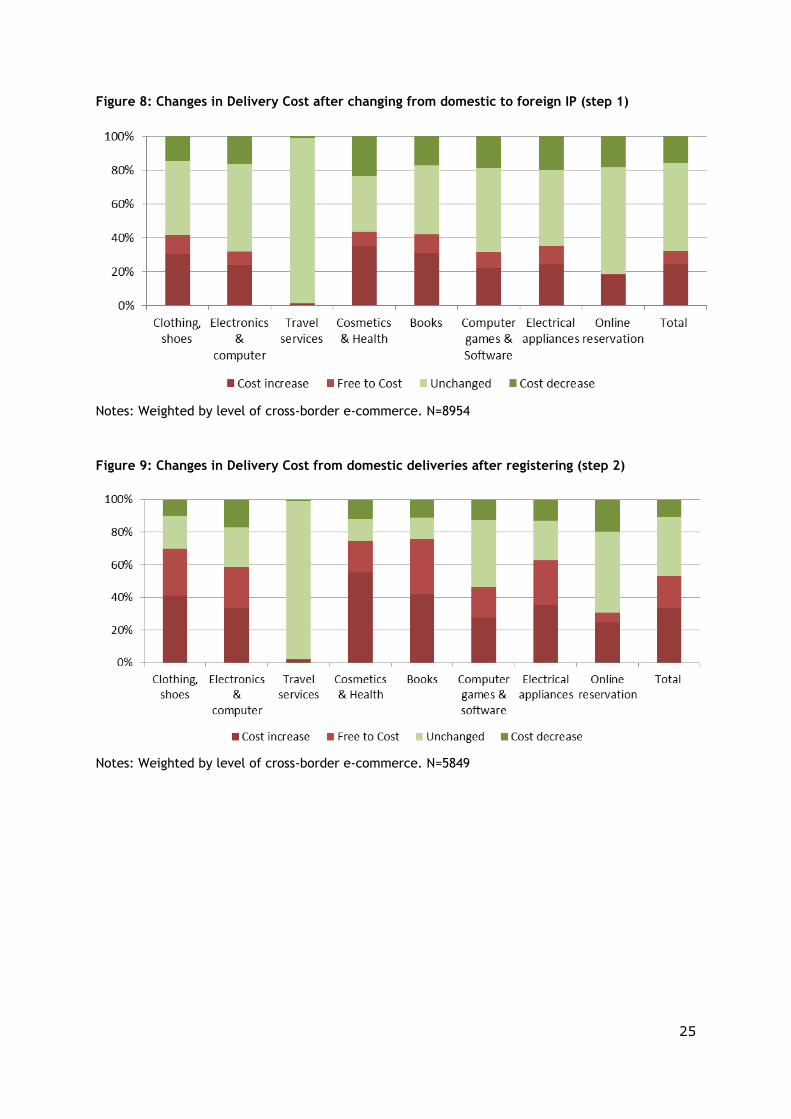
Changes in delivery cost for the two different steps are presented in Figures 8 and 9. They show that higher delivery prices for cross-border shoppers are mainly charged for
Cosmetics, Books and Clothing. These are the tangible goods least affected by geo-blocking. Unsurprisingly, there are no changes in delivery cost for travel services.
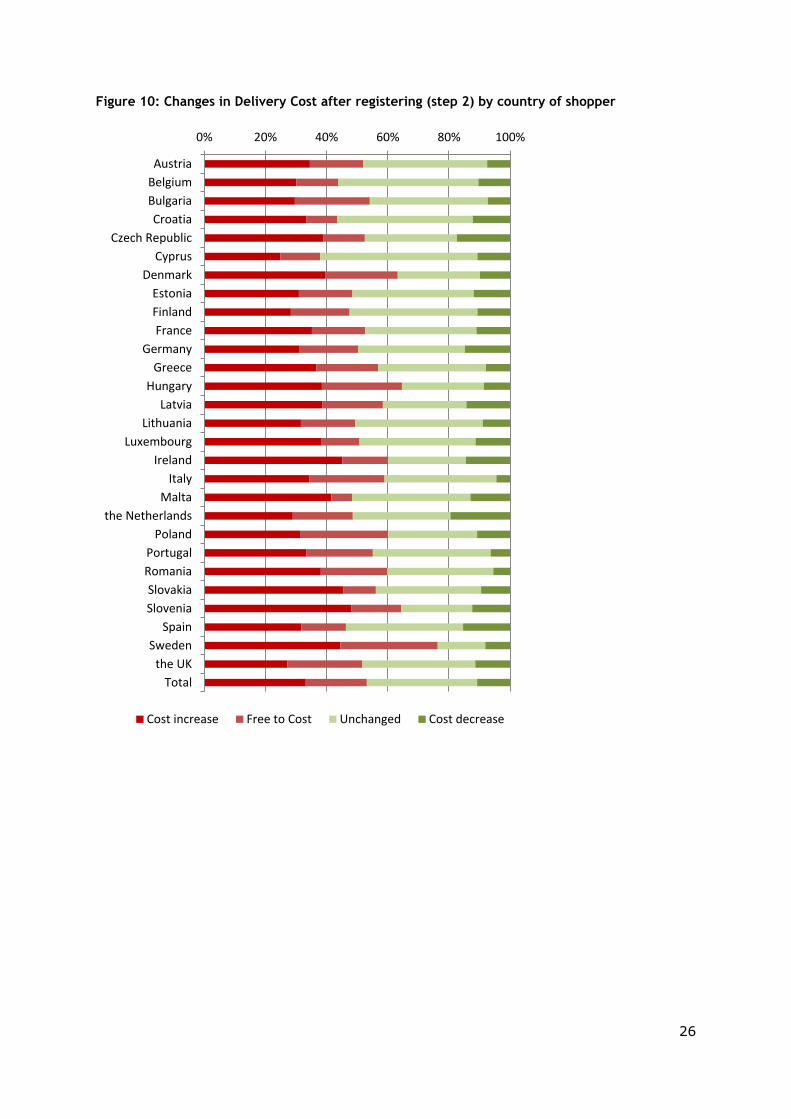
Country differences are presented in Figure 10, which are less apparent than they are for different product categories.
11
5 Conclusions
We find that the practice of erecting virtual barriers is still common in cross-border e-
commerce within the EU. The possibility of buying electrical appliances, electronics and computer games from another country is rather unlikely. Geo-blocking often takes place
at the delivery stage and less often at the access stage. Larger websites also block
access according to shoppers’ IP addresses. Between countries which have a common language, geo-blocking is less probable. However, being a neighbouring country or
geographically close has no effect. Travel services have a different pattern of geo-blocking from tangible goods, where geo-blocking mainly takes place at the access
stage. Our analysis shows that price differentiation occurs in all sectors, but is more common in sectors which are less affected by geoblocking.

12
References
Alaveras, Georgios; Estrella Gomez-Herrera and Bertin Martens. 2015. "Market
Fragmentation in Video-on-Demand Services in the Eu28," Digital Economy Working Paper. JRC/IPTS:
https://ec.europa.eu/jrc/sites/default/files/JRC98019.pdf.
Batikas, Michail; Estrella Gomez-Herrera and Bertin Martens. 2015a. "Film
Availability in Netflix Country Stores in the Eu," Digital Economy Working Paper: https://ec.europa.eu/jrc/sites/default/files/JRC98020.pdf.
Batikas, Michail; Estrella Gomez-Herrera and Bertin Martens. 2015b. "Geographic
Fragmentation in the Eu Market for E-Books: The Case of Amazon," Digital Economy Working Paper. JRC/IPTS:
https://ec.europa.eu/jrc/sites/default/files/JRC98022.pdf.
Cairncross, Frances. 2001. The Death of Distance: How the Communications
Revolution Is Changing Our Lives. Harvard Business Press.
Cardona, Melisande; Nestor Duch-Brown and Bertin Martens. 2015. "Consumer
Perceptions of (Cross-Border) E-Commerce in the Eu Digital Single Market," Digital Economy Working Paper. JRC/IPTS:
https://ec.europa.eu/jrc/sites/default/files/JRC97231.pdf.
Cardona, Melisande and Bertin Martens. 2014. "Supply-ide Barriers to Cross-Border E-Commerce in the Eu Digital Single Market," Digital Economy Working Paper.
JRC/IPTS: https://ec.europa.eu/futurium/sites/futurium/files/futurium/library/Supply%20sid
e%20barriers.pdf.
Duch-Brown, Nestor and Bertin Martens. 2015. "Barriers to Cross-Border Ecommece
in the Eu Digital Single Market," Digital Economy Working Paper, JRC/IPTS, https://ec.europa.eu/jrc/sites/default/files/JRC96872.pdf.
European Commission. 2015. "A Digital Single Market Strategy for Europe - Analysis
and Evidence," Commission Staff Working Document. http://eur-lex.europa.eu/legal-content/EN/TXT/PDF/?uri=CELEX:52015SC0100&from=EN.
Feenstra, Robert C. 2002. "Border Effects and the Gravity Equation: Consistent Methods for Estimation." Scottish Journal of Political Economy, 49(5), 491-506.
GfK. 2015. "Identifying the Main Cross-Border Obstacles to the Digital Single Market and Where They Matter Most," European Commission:
http://ec.europa.eu/consumers/consumer_evidence/market_studies/obstacles_dsm/docs/21.09_dsm_final_report.pdf.
GfK. 2016. "Provision of a Mystery Shopping Survey on Territorial Restrictions and Geo-
Blocking in the European Digital Single Market," available at http://ec.europa.eu/consumers/consumer_evidence/market_studies/index_en.ht
m
Gomez, Estrella; Bertin Martens and Geomina Turlea. 2014. "The Drivers and
Impediments to Online Cross-Border Trade in the Eu." Information Economics and Policy, 27.
House of Representatives Standing Committee on Infrastructure and Communications. 2013. "At What Cost? It Pricing and the Australia Tax,"
http://www.aph.gov.au/parliamentary_business/committees/house_of_represent
atives_committees?url=ic/itpricing/report/fullreport.pdf.
Meier-Pesti, Katja and Christian Trübenbach. 2009. "Mystery Shopping Evaluation
of Cross-Border E-Commerce in the Eu," Psychonomics, http://ns.is/sites/default/files/pdfskjol/ec_e-commerce_final_report_201009.pdf
13
List of Figures
Figure 1: Sequence of geo-blocking: success rates in percent of all started shopping
attempts ....................................................................................... 14
Figure 2: Success rates in percent of all cross-border started shopping attempts in
mystery shopping survey 2009 ......................................................... 21
Figure 3: Success rates for goods only ............................................................ 21
Figure 4: Average price (in % change to domestic price) increase after changing from domestic to foreign IP (step 1) .................................................. 22
Figure 5: Average price (in % change to domestic price) increase after registering
(step 2) ........................................................................................ 22
Figure 6: Changes in product price after changing from domestic to foreign IP
(step 1) ........................................................................................ 23
Figure 7: Changes in product price from domestic price after registering (step 2) .. 23
Figure 8: Changes in delivery costs after changing from domestic to foreign IP (step 1) ........................................................................................ 23
Figure 9: Changes in delivery cost from domestic deliveries after registering (step 2) ................................................................................................ 24
Figure 10: Changes in delivery cost after registering (step 2) by country of shopper25
List of Tables
Table 1: Country Matrix – number of observations ........................................... 15
Table 2: Mystery shoppers’ success rates by product category .......................... 16
Table 3: Sequence of geo-blocking, Success rates in percent of websites for which mystery shoppers reach each stage .................................................. 17
Table 4: Summary statistics of dependent variable for reggress of Table 7 (Success rates by underlying topic) ................................................................ 17
Table 5: Country matrix – successful delivery ................................................. 18
Table 6: Country matrix – arrive at order button ............................................. 19
Table 7: Logit regressions explaining success rates at different stages ................ 20
Table 8: Odds ratios from Logit Regression for markets (Base-level Travel) ......... 21
Table 9: Logit regressions, country fixed effects .............................................. 21
Table 10: Average product price increases and decreases ................................... 25
Table 11: Country matrix – % product price increase compared to domestic price . 28
Table 12: OLS regression explaining product price differences compared to domestic price ............................................................................................. 29
14
Table 1: Country Matrix – Number of Observations
Country Shop
Country of Buyer AT BE BG HR CZ CY DK EE FI FR DE GR HU LV LT LU IE IT MT NE PL PT RO SK SI ES SE UK Total
Austria 0 0 0 0 0 0 0 0 0 83 66 0 0 0 0 0 0 76 0 72 0 0 0 0 0 0 0 81 378
Belgium 0 0 0 0 0 0 0 0 0 89 71 0 0 0 0 72 0 0 0 64 0 0 0 0 0 0 0 73 369
Bulgaria 0 0 0 0 0 0 0 0 0 85 83 69 0 0 0 0 0 78 0 0 0 0 97 0 0 0 0 78 490
Croatia 87 0 0 0 0 0 0 0 0 87 80 0 0 0 0 0 0 77 0 68 0 0 0 0 81 0 0 59 539
Czech Republic 91 0 0 0 0 0 0 0 0 83 62 0 0 0 0 0 0 0 0 0 75 0 0 76 0 0 0 72 459
Cyprus 0 0 0 0 0 0 0 0 0 0 69 74 0 0 0 0 0 0 0 0 0 0 0 0 0 0 0 67 210
Denmark 0 0 0 0 0 0 0 0 0 86 67 0 0 0 0 0 0 0 0 0 0 0 0 0 0 0 78 82 313
Estonia 0 0 0 0 0 0 0 0 71 0 71 0 0 71 0 0 0 81 0 0 73 10 0 0 0 0 53 79 509
Finland 0 0 0 0 0 0 0 71 0 0 85 0 0 0 0 0 0 0 71 0 0 0 0 0 0 50 77 73 427
France 0 80 0 0 0 0 0 0 0 0 77 0 0 0 0 0 0 76 0 0 0 0 0 0 0 63 0 76 372
Germany 85 0 0 0 0 0 0 0 0 90 0 0 0 0 0 0 0 77 0 79 0 0 0 0 0 0 0 58 389
Greece 0 0 89 0 0 72 0 0 0 80 70 0 0 0 0 0 0 73 0 0 0 0 0 0 0 72 0 78 534
Hungary 88 0 0 0 0 0 0 0 0 15 69 0 0 0 0 0 0 0 0 0 0 0 0 83 0 0 0 88 343
Latvia 0 0 0 0 0 0 0 69 0 14 68 0 0 0 72 0 0 0 0 0 72 0 0 0 0 0 0 81 376
Lithuania 0 0 0 0 0 0 0 0 0 12 69 0 0 0 0 0 0 0 0 0 72 0 0 0 0 0 0 80 233
Luxembourg 85 70 0 0 0 0 0 0 0 79 70 0 0 0 0 0 0 72 0 71 0 83 0 0 0 0 0 76 606
Ireland 0 0 0 0 0 0 0 0 0 73 73 0 0 0 0 0 0 63 0 0 0 0 0 0 0 66 0 74 349
Italy 82 0 0 0 0 0 0 0 0 74 77 0 0 0 0 0 88 0 0 0 0 0 0 0 0 71 0 71 463
Malta 0 0 0 0 0 0 0 0 0 69 73 0 0 0 0 0 84 37 0 0 0 0 0 0 0 79 0 66 408
the Netherlands 0 63 0 0 0 0 0 0 0 0 71 0 0 0 0 0 0 0 0 0 0 0 0 0 0 0 0 72 206
Poland 0 0 0 0 74 0 0 0 0 0 67 0 0 0 0 0 0 0 0 0 0 0 0 0 0 0 0 69 210
Portugal 0 0 0 0 0 0 0 0 0 33 65 0 0 0 0 0 0 0 0 0 0 0 0 0 0 78 0 74 250
Romania 78 0 0 0 0 0 0 0 0 30 68 0 77 0 0 0 0 66 0 0 0 0 0 0 0 81 0 79 479
Slovakia 86 0 0 0 65 0 0 0 0 0 74 0 78 0 0 0 0 0 0 0 68 0 0 0 0 0 0 74 445
Slovenia 79 0 0 71 0 0 0 0 0 0 74 0 0 0 0 0 0 68 0 0 0 0 0 0 0 0 0 66 358
Spain 0 0 0 0 0 0 0 0 0 31 72 0 0 0 0 0 0 85 0 0 0 63 0 0 0 0 0 71 322
Sweden 0 0 0 0 0 0 74 0 0 0 71 0 0 0 0 0 0 0 0 0 0 0 0 0 0 0 0 74 219
the UK 0 0 0 0 0 0 0 0 0 39 74 0 0 0 0 0 85 0 0 0 0 0 0 0 0 83 0 0 281
Total 761 213 89 71 139 72 74 140 71 1,152 1,936 143 155 71 72 72 257 929 71 354 360 156 97 159 81 643 208 1,991 10,537

15
Figure 1: Sequence of geo-blocking, success rates in percent of all started shopping attempts
Notes: Weight 1 by cross-border e-commerce traffic per country pair and unique traffic per
website, Weight 2 by level of cross-border e-commerce. ”Find same product” can be higher than
the previous “send to the same website”, because only answer option “website is blocked” was
filtered (see flow chart).
Table 2: Mystery shoppers’ success rates by product category
Note: Weight 2 by level of cross-border e-commerce applied
Marketsent to same
website
find same
product
can register
successfully
can have
product
delivered
possible to
pay
can enter
payment
details
successfully
Clothing, shoes and accessories 97% 97% 75% 45% 37% 35%
Electronics & computer hardware 98% 98% 64% 31% 25% 21%
Travel services (hotels, transport) 99% 94% 86% 80% 74% 67%
Cosmetics and healthcare products 96% 98% 74% 44% 40% 37%
Books 99% 97% 75% 66% 53% 41%
Computer games and software 98% 98% 62% 42% 32% 26%
Electrical household appliances 98% 99% 59% 25% 19% 14%
Online reservations of offline leisure 98% 98% 83% 71% 66% 60%
16
Table 3: Sequence of geo-blocking (Success rates as % of websites reached at each stage)
Note: Weight 1 by cross-border e-commerce traffic per country pair and unique traffic per website,
Weight 2 by level of cross-border e-commerce.
Table 4: Summary statistics of dependent variable for regressions of Table 7 (Success rates by
underlying topic)
Note: Weight 1 by cross-border e-commerce traffic per country pair and unique traffic per website,
Weight 2 by level of cross-border e-commerce.
Weight 1 Weight 2 Obs
sent to same website 91.6% 98.0% 10537
find same product 93.9% 97.9% 10437
can register successfully 78.1% 73.5% 10366
can have product delivered 42.4% 67.9% 7198
possible to pay 98.0% 85.3% 4485
can enter payment details successfully 96.1% 87.3% 3840
After changing IP to different country than webshop
% of mystery shoppers
Weight 1 Weight 2 Obs
Access 89.3% 96.1% 10537
Register (total) 78.1% 73.5% 10366
Register (selected) 89.1% 89.7% 10366
Delivery 37.6% 56.6% 8807
Payment 83.9% 66.3% 5193
Order (arrive to order button) 30.1% 36.6% 10537
After changing IP to different country than webshop
Success rate
17
Table 5: Country Matrix – Successful Delivery
Country Shop
Country of Buyer AT BE BG HR CZ CY DK EE FI FR DE GR HU LV LT LU IE IT MT NE PL PT RO SK SI ES SE UK Total
Austria 0.59 0.77 0.39 0.49 0.64 0.71
Belgium 0.71 0.65 0.63 0.83 0.65 0.72
Bulgaria 0.45 0.45 0.44 0.36 0.25 0.46 0.43
Croatia 0.36 0.55 0.37 0.82 0.5 0.38 0.47 0.43
Czech Republic 0.39 0.43 0.62 0.55 0.57 0.65 0.57
Cyprus 0.33 0.58 0.48 0.51
Denmark 0.48 0.47 0.39 0.62 0.52
Estonia 0.32 0.42 0.51 0.65 0.39 0.2 0.54 0.46 0.44
Finland 0.47 0.52 0.5 0.6 0.63 0.61 0.57
France 0.56 0.62 0.47 0.67 0.64 0.61
Germany 0.54 0.53 0.41 0.58 0.52 0.52
Greece 0.34 0.64 0.48 0.61 0.63 0.52 0.66 0.61
Hungary 0.44 0.15 0.43 0.5 0.63 0.49
Latvia 0.37 0.42 0.46 0.41 0.38 0.58 0.48
Lithuania 0.25 0.41 0.43 0.52 0.45
Luxembourg 0.49 0.48 0.63 0.5 0.54 0.75 0.71 0.61 0.55
Ireland 0.41 0.59 0.58 0.54 0.6 0.58
Italy 0.49 0.52 0.49 0.43 0.52 0.64 0.54
Malta 0.42 0.41 0.36 0.65 0.41 0.3 0.37
the Netherlands 0.54 0.56 0.6 0.57
Poland 0.37 0.57 0.68 0.58
Portugal 0.41 0.66 0.65 0.56 0.57
Romania 0.38 0.32 0.54 0.26 0.45 0.58 0.55 0.48
Slovakia 0.4 0.63 0.6 0.12 0.26 0.46 0.51
Slovenia 0.4 0.48 0.47 0.62 0.48 0.47
Spain 0.41 0.58 0.57 0.46 0.61 0.54
Sweden 0.48 0.58 0.49 0.52
the UK 0.69 0.48 0.6 0.46 0.55
Total 0.51 0.55 0.34 0.48 0.47 0.64 0.48 0.46 0.32 0.56 0.58 0.53 0.23 0.51 0.41 0.63 0.56 0.48 0.5 0.69 0.41 0.46 0.25 0.55 0.38 0.54 0.51 0.59 0.57
18
Table 6: Country Matrix – Arrive to Order Button
Note: Weighted by level of crossborder e-commerce (Weight 2).
Country Shop
Country of Buyer AT BE BG HR CZ CY DK EE FI FR DE GR HU LV LT LU IE IT MT NE PL PT RO SK SI ES SE UK Total
Austria 0.35 0.52 0.24 0.29 0.54 0.49
Belgium 0.49 0.38 0.38 0.28 0.56 0.41
Bulgaria 0.28 0.24 0.19 0.21 0.15 0.36 0.28
Croatia 0.21 0.38 0.21 0.21 0.19 0.17 0.37 0.26
Czech Republic 0.18 0.31 0.27 0.09 0.09 0.57 0.27
Cyprus 0.16 0.35 0.43 0.37
Denmark 0.4 0.25 0.22 0.52 0.36
Estonia 0.2 0.28 0.3 0.37 0.12 0.1 0.23 0.39 0.3
Finland 0.21 0.27 0.34 0.48 0.31 0.44 0.34
France 0.36 0.26 0.26 0.37 0.5 0.36
Germany 0.34 0.43 0.31 0.28 0.21 0.3
Greece 0.1 0.08 0.39 0.3 0.45 0.28 0.51 0.39
Hungary 0.34 0.07 0.17 0.25 0.49 0.3
Latvia 0.13 0.36 0.28 0.08 0.24 0.35 0.28
Lithuania 0.25 0.28 0.22 0.36 0.31
Luxembourg 0.35 0.27 0.51 0.34 0.31 0.3 0.31 0.53 0.39
Ireland 0.32 0.37 0.06 0.33 0.5 0.43
Italy 0.32 0.32 0.36 0.34 0.41 0.45 0.38
Malta 0.29 0.22 0.27 0.16 0.25 0.12 0.17
the Netherlands 0.4 0.28 0.22 0.29
Poland 0.18 0.3 0.38 0.31
Portugal 0.3 0.4 0.45 0.39 0.39
Romania 0.21 0.2 0.35 0.01 0.18 0.4 0.37 0.27
Slovakia 0.24 0.25 0.41 0.01 0.16 0.31 0.26
Slovenia 0.22 0.28 0.3 0.32 0.33 0.28
Spain 0.23 0.39 0.42 0.19 0.49 0.37
Sweden 0.27 0.49 0.38 0.4
the UK 0.54 0.38 0.47 0.39 0.44
Total 0.32 0.37 0.1 0.28 0.21 0.08 0.27 0.2 0.2 0.41 0.36 0.3 0.01 0.3 0.08 0.38 0.44 0.31 0.34 0.28 0.15 0.19 0.15 0.14 0.17 0.39 0.27 0.41 0.37

19
Table 7: Logit Regressions explaining success rates at different stages
(1) (2) (3) (4) (5) (6)
Access Delivery Payment Order
VARIABLES Coeff. se Coeff. se Coeff. se Coeff. se Coeff. se Coeff. se
Gravity/Country Pair Variables
Contiguity 0.0636 (0.233) 0.199 (0.128) 0.0254 (0.0937) 0.0403 (0.0996) -0.0772 (0.128) -0.131 (0.108)
Common Language -0.173 (0.291) -0.559*** (0.171) -0.174 (0.121) 0.305** (0.124) 0.107 (0.160) 0.322*** (0.131)
Distance -0.221 (0.221) 0.294** (0.129) 0.155 (0.0958) -0.0607 (0.107) -0.0965 (0.133) -0.144 (0.110)
Website Variables
One Language 0.219 (0.139) 0.0732 (0.0803) -0.273*** (0.0639) -0.681*** (0.0678) -0.385*** (0.0849) -0.529*** (0.0606)
Website size (in visits) (Logs) -0.108*** (0.0211) -0.0140 (0.0121) -0.00231 (0.00895) -0.0764*** (0.00972) 0.118*** (0.0140) 0.00761 (0.00919)
Market (Base Travel)
Clothing 0.799*** (0.184) -0.322** (0.130) -0.922*** (0.104) -2.213*** (0.121) -0.590*** (0.120) -1.281*** (0.0858)
Electronics 0.696*** (0.187) -0.421*** (0.131) -1.182*** (0.104) -2.666*** (0.124) -1.201*** (0.125) -1.897*** (0.0944)
Cosmetics 0.786*** (0.198) -0.0368 (0.137) -0.929*** (0.105) -2.468*** (0.122) -0.501*** (0.122) -1.315*** (0.0876)
Books 0.929*** (0.235) -0.208 (0.145) -0.638*** (0.114) -1.215*** (0.131) -0.626*** (0.120) -0.729*** (0.0924)
Computer games 1.201*** (0.249) -0.701*** (0.137) -1.252*** (0.112) -2.294*** (0.132) -0.942*** (0.141) -1.583*** (0.103)
Electrical household appliances 1.516*** (0.271) -0.295** (0.140) -1.335*** (0.108) -3.191*** (0.132) -1.795*** (0.142) -2.429*** (0.115)
Reservation of offline leisure 0.774*** (0.219) -0.225 (0.145) -0.330*** (0.119) -0.586*** (0.140) 0.203 (0.126) -0.0641 (0.0919)
Local Card 0.167 (0.166)
Constant 4.708*** (1.788) 3.218** (1.318) 1.475** (0.700) 3.451*** (0.754) 0.251 (0.956) 1.104 (0.715)
Observations 9,750 10,104 10,104 8,576 5,034 10,270
Logit coefficients shown, Standard errors in parentheses
*** p<0.01, ** p<0.05, * p<0.1
Country of Buyer and Seller Fixed Effects included
Register (total) Register (selected)
20
Table 8: Odds Ratios from Logit Regression for Markets (Base Level Travel)
Market Register Delivery Payment Order
Reservation offline leisure 1 0.56 1 1
Books 1 0.30 0.54 0.48
Clothing 0.72 0.11 0.55 0.28
Cosmetics 1 0.08 0.61 0.27
Computer games 0.50 0.10 0.39 0.21
Electronics 0.66 0.07 0.30 0.15
Electrical appliances 0.75 0.04 0.17 0.09
21
Table 9: Logit Regressions, Country Fixed Effects
(1) (2) (3) (4) (5) (6)
Access Register(t) Register(s) Delivery Payment Order
Buyer Country Fixed Effects (Base Latvia)
Austria 0.456 -0.182 -0.411** 0.169 0.364 0.279
Belgium 0.764 -0.235 -0.0183 0.601** 0.0139 0.216
Bulgaria 1.010** -0.624** -0.903*** -0.336 -0.304 -0.254
Croatia 0.507 -0.904*** -0.926*** -0.149 -0.202 -0.234
CzechRep -0.134 -0.831*** -0.855*** 0.432** -0.418 -0.0464
Cyprus 1.018* -0.908*** -1.205*** -0.0248 -0.0307 0.115
Denmark 1.262** -0.113 -0.114 0.164 0.175 0.265
Estonia 1.156** -0.413 -0.0376 0.0748 0.177 0.183
Finland 0.894** -0.333 -0.281 0.387* 0.0640 0.299
France -0.102 0.253 -0.250 0.506** -0.360 0.189
Germany 0.729 0.152 -0.166 0.0220 0.157 0.175
Greece 0.566 -0.149 -0.254 0.417** 0.315 0.370*
Hungary 0.460 -0.567* -0.0303 0.0923 0.121 0.172
Lithuania 0.121 -0.355 -0.570*** -0.0196 0.270 -0.0325
Luxembourg 0.388 0.199 -0.0441 0.346 0.309 0.260
Ireland -0.176 -0.193 -0.364* 0.206 -0.231 -0.0761
Italy -0.0385 -0.178 -0.344* 0.353* -0.0495 0.330*
Malta 0.288 -0.363 -0.791*** -0.422** -0.956*** -0.605***
Netherlands -0.115 0.122 -0.0483 0.269 -0.894*** -0.288
Poland 0.159 -0.703** -0.361 0.0709 -0.581* -0.0658
Portugal 1.327** -0.573* -0.233 0.487** 0.303 0.341
Romania 0.857** -0.547** -0.461** 0.166 -0.280 0.00202
Slovakia 0.787 -0.610** -0.860*** 0.0281 -0.0634 0.0572
Slovenia 1.018* -0.535* -0.264 0.0803 -0.350 -0.0130
Spain 0.992** 0.540 0.0580 0.213 0.354 0.378*
Sweden 2.156** 0.492 0.0110 0.176 0.747** 0.451*
UK 0.165 -0.00106 -0.438* 0.184 0.728** 0.419*
Seller Country Fixed Effects (Base Latvia)
Austria 0.270 -1.460 -0.175 -0.229 0.387 0.136
Belgium 0.427 -2.393** -0.453 -0.504 0.411 0.0140
Bulgaria 0.138 -3.157*** -0.613 -0.886** -1.245* -1.214**
Croatia -0.102 -1.484 1.673*** 0.0387 0.559 0.264
CzechRep 0.0877 -2.228** 0.123 0.183 -0.228 -0.114
Cyprus -0.429 -3.318*** -0.509 0.0627 -1.675** -2.014***
Denmark - -4.715*** -0.920* 0.298 2.271* -0.143
Estonia -0.859 -2.593** -0.0541 -0.610 -0.662 -0.709*
Finland -0.468 -2.796*** -0.248 -0.285 1.107 -0.380
France 0.712 -2.601** -0.0731 0.317 0.962** 0.732**
Germany 0.350 -2.380** -0.129 0.362 0.391 0.416
Greece - -0.785 2.706*** 0.299 -0.151 0.0851
Hungary -0.447 -3.963*** -0.649* -1.220*** -2.589*** -3.335***
Lithuania - -2.509** 0.129 0.108 -1.836*** -1.284**
Luxembourg -1.060 -1.507 0.313 -0.388 0.444 -0.103
Ireland 0.440 -1.720 0.597 -0.0334 1.394** 0.606
Italy -0.409 -3.556*** -1.166*** 0.221 0.451 0.215
Malta -1.015 -1.512 2.121** 0.144 1.779** 0.876*
Netherlands -0.0353 -2.716*** -1.038*** 0.674* -0.632 0.0135
Poland 1.661 -2.855*** -0.472 -0.183 -0.552 -0.478
Portugal 1.052 -3.013*** -1.507*** 0.473 -0.675 0.0903
Romania 0.580 -2.381** 0.815* -0.677 -0.152 -0.331
Slovakia - 0.0226 2.011*** 0.207 -0.853* -0.469
Slovenia - -0.921 2.340*** -0.342 -0.0734 -0.231
Spain 0.295 -2.396** -0.140 0.285 0.831* 0.633*
Sweden -0.214 -3.452*** -0.364 0.368 0.546 -0.0900
UK -0.391 -2.242** 0.288 0.659* 1.057** 1.062***
Logit coefficients shown, Standard errors in parentheses
*** p<0.01, ** p<0.05, * p<0.1
22
Figure 2: Success rates in percent of all cross-border started shopping attempts in mystery
shopping survey 2009
Notes: Unweighted rates are calculated from the full sample 2009 (N=10964), weighted rates
calculated with 2015 level of e-commerce weight (N=9659).
Figure 3: Success rates for goods only, mystery shopping survey 2015
Notes: Weighted by level of cross-border e-commerce. N=8837
80,4%
47,6% 53,4%
36,0%
82,4%
56,5% 56,3%
41,5%
0,0%
20,0%
40,0%
60,0%
80,0%
100,0%
Register Delivery Payment Order
Unweighted Weighted
23
Figure 4: Average Price (in % change to domestic price) increase after changing from domestic
to foreign IP (step 1)
Notes: Weighted by level of cross-border e-commerce. N=15915
Figure 5: Average Price (in % change to domestic price) increase after registering (step 2)
Notes: Weighted by level of cross-border e-commerce. N=8482
0,36% 0,42% 0,28%
0,42%
0,81%
1,86%
1,00%
0,13%
0,56%
0,00%
0,50%
1,00%
1,50%
2,00%
Clothing,shoes
Electronics& computer
Travelservices
Cosmetics& Health
Books Computergames &software
Electricalappliances
Onlinereservation
Total

24
Figure 6: Changes Product price after changing from domestic to foreign IP (step 1)
Figure 7: Changes Product price from domestic price after registering (step 2)
Table 10: Average product price increases and decreases
Average percentage Price Changes in each category
Increase Decrease Increase Decrease
Clothing, shoes 19.6% -12.7% 18.0% -13.4%
Electronics & computer 12.8% -11.1% 11.2% -14.2%
Travel services 12.6% -12.5% 31.6% -15.4%
Cosmetics & Health 21.8% -15.7% 44.5% -20.7%
Books 32.1% -15.7% 63.4% -18.9%
Computer games & software 33.9% -11.6% 33.3% -12.7%
Electrical appliances 28.0% -8.6% 25.9% -19.9%
Online reservation 18.0% -11.6% 21.6% -11.4%
Total 20.6% -12.6% 33.5% -15.7%
After registeringAfter changing IP
25
Figure 8: Changes in Delivery Cost after changing from domestic to foreign IP (step 1)
Notes: Weighted by level of cross-border e-commerce. N=8954
Figure 9: Changes in Delivery Cost from domestic deliveries after registering (step 2)
Notes: Weighted by level of cross-border e-commerce. N=5849
26
Figure 10: Changes in Delivery Cost after registering (step 2) by country of shopper
0% 20% 40% 60% 80% 100%
Austria
Belgium
Bulgaria
Croatia
Czech Republic
Cyprus
Denmark
Estonia
Finland
France
Germany
Greece
Hungary
Latvia
Lithuania
Luxembourg
Ireland
Italy
Malta
the Netherlands
Poland
Portugal
Romania
Slovakia
Slovenia
Spain
Sweden
the UK
Total
Cost increase Free to Cost Unchanged Cost decrease
27
Table 11: Country Matrix – % Product price increase compared to domestic price
Notes: Weighted by level of cross-border e-commerce. N=5849
Country Shop
Country of Buyer AT BE BG HR CZ CY DK EE FI FR DE GR HU LV LT LU IE IT MT NE PL PT RO SK SI ES SE UK Total
Austria -0.01 0 0.2 0.3 0.01 0.02
Belgium -0.02 0 -0.01 0.06 0.02 0.02
Bulgaria -0.03 0.01 0.26 0.05 0 0.05 0.05
Croatia 0 0.03 -0.01 0.1 0.35 0 0.02 0.02
Czech Republic 0.01 0 -0.02 -0.01 0.15 0.01 0.03
Cyprus 0.02 -0.02 0.07 0.02
Denmark 0 0 -0.01 -0.01 -0.01
Estonia -0.01 0 0.01 0.03 0.16 0 0.04 0.01 0.02
Finland 0.01 0.01 -0.01 0.26 0.03 -0.02 0.02
France -0.01 -0.01 0.1 0 0 0
Germany 0.03 0 0.04 0.27 -0.01 0.04
Greece 0.02 0.05 0 0.01 0.02 0 0.04 0.03
Hungary 0 0 -0.03 0.13 0 0.01
Latvia 0.19 0 0 0.11 -0.04 0 0.02
Lithuania 0 0 0.04 0.02 0.02
Luxembourg 0 0.02 0.01 0.03 0.04 0.28 0.26 -0.01 0.03
Ireland 0 -0.01 0.25 0.15 0 0.02
Italy -0.01 -0.01 0.03 0.01 0 0.1 0.05
Malta 0.02 0.03 0.06 0.15 0.05 -0.01 0.04
the Netherlands 0.05 0 0.04 0.02
Poland 0.14 0 0.06 0.04
Portugal 0 0 -0.04 0.04 0
Romania 0.01 0.45 -0.02 0.05 0.01 0.01 0.25 0.1
Slovakia -0.01 0.32 0 0 0 0.05 0.16
Slovenia 0 0.49 0 0.31 -0.01 0.11
Spain 0.15 0 0.17 0.11 0 0.05
Sweden 0 0.01 0.05 0.03
the UK 0.02 0.05 0 0.05 0.03
Total 0.02 0 0.02 0.49 0.24 0.05 0 0.03 -0.01 0.02 0.01 0.05 0.05 0.01 0.11 -0.01 0 0.11 -0.01 0.15 0.01 0.11 0 0.15 0 0.03 0.02 0.03 0.03
28
Table 12: OLS regression explaining product price differences compared to domestic price
Dependent Variable: Percentage Price Difference
(1) (2)
Covariates First Step Second Step
Gravity/Country Pair Variables
Contiguity -0.0240 (0.0233) 0.0948 (0.0797)
Common Language 0.0309** (0.0144) -0.0489 (0.0520)
Distance 0.00718 (0.0121) 0.0215 (0.0418)
Website Variables
One Language -0.00304 (0.00261) -0.00957 (0.00758)
Website size (in visits) (Logs) -0.000353 (0.000401) 0.00131 (0.00131)
Geoblocking Variables
Registering -0.000768 (0.00335)
Delivery 0.00457 (0.00335)
Order 0.000373 (0.00299) -0.000413 (0.00756)
Market (Base Travel)
Clothing 0.000373 (0.00299) -0.000413 (0.00756)
Electronics 0.00647* (0.00378) 0.00279 (0.0105)
Cosmetics 0.00325 (0.00399) -0.0123 (0.0119)
Books 0.00571 (0.00389) 0.0603*** (0.0111)
Computer games 0.0182*** (0.00407) 0.108*** (0.0107)
Electrical household appliances 0.00701 (0.00460) 0.0240* (0.0134)
Reservation of offline leisure 0.00578 (0.00445) 0.0233 (0.0150)
0.00265 (0.00410) 0.0111 (0.0104)
Constant -0.0270 (0.0913) -0.143 (0.312)
Country Pair Fixed Effects Incl. Incl.
Observations 13,980 8,393
R-squared 0.025 0.117
Standard errors in parentheses
*** p<0.01, ** p<0.05, * p<0.1
How to obtain EU publications
Our publications are available from EU Bookshop (http://bookshop.europa.eu),
where you can place an order with the sales agent of your choice.
The Publications Office has a worldwide network of sales agents.
You can obtain their contact details by sending a fax to (352) 29 29-42758.
Europe Direct is a service to help you find answers to your questions about the European Union
Free phone number (*): 00 800 6 7 8 9 10 11
(*) Certain mobile telephone operators do not allow access to 00 800 numbers or these calls may be billed.
A great deal of additional information on the European Union is available on the Internet.
It can be accessed through the Europa server http://europa.eu
2
JRC Mission
As the Commission’s
in-house science service,
the Joint Research Centre’s
mission is to provide EU
policies with independent,
evidence-based scientific
and technical support
throughout the whole
policy cycle.
Working in close
cooperation with policy
Directorates-General,
the JRC addresses key
societal challenges while
stimulating innovation
through developing
new methods, tools
and standards, and sharing
its know-how with
the Member States,
the scientific community
and international partners.
Serving society Stimulating innovation Supporting legislation