Embed Size (px)
Citation preview

Gentzkow and Shapiro I
• First, they come up with a measure of ideological slant of newspapers.
• Second, they estimate the elasticity of demand for a newspaper with respect to its ideology.
• Third, they estimate a structural model of newspaper profits and find that newspapers choose the profit maximizing degree of slant (i.e. all demand-side not supply side).

Gentzkow and Shapiro II
• Do word search on 2005 Congressional Register– Top 500 two word phrases and top 500 three word
phrases used by Democrats and Republicans respectively according to chi-squared statistic:
– Take out two-word phrases appearing in between 200 and 15,000 headlines and three word phrases appearing in between 5 and 1,000 headlines
( )( )( )( )( )pdprpdpdpdprpdpr
prpdpdprp ffffffff
ffff
~~~~
2~~2
++++−
=χ

Gentzkow and Shapiro III
• Test words as predictors of ideology on members of congress (will use it to come up with ideology measure of newspaper). Look at relation between congress memebers share of usage of a phrase and ideology (measured by adjusted ADA scores). First run this for every word:
• Then, create demeaned word shares:
pccpppc ys εβα ++=
ppcpc Ss α−=

Gentzkow and Shapiro IV
• Then compute ideology for a congressperson to minimize sum of squared prediction error in word usage:
• Finally, compare to ADA scores:– Regression of estimated ideology on true ideology (where true
ideology is ADA scores) has a constant of zero and a coefficientof one.
– Correlation coefficient between estimated and true ideology is .6.
( )∑
∑∑ =−=
pp
p
pnp
pnppnn
s
ysy2
minβ
ββ

Table 1 Politically loaded phrases from the 2005 Congressional Record
Panel A: Phrases used more often by DemocratsTwo-word phrasesprivate accounts rosa parks workers rightstrade agreement president budget poor peopleamerican people republican party republican leadertax breaks change the rules arctic refugetrade de�cit minimum wage cut fundingoil companies budget de�cit american workerscredit card republican senators living in povertynuclear option privatization plan senate republicanswar in iraq wildlife refuge fuel e¢ ciencymiddle class card companies national wildlifeafrican american security trust president cheneybudget cuts bill cuts price gougingnuclear weapons medicaid cuts iraq warchecks and balances trade policy million americanscivil rights asian paci�c house republicansveterans health cia agent assault weaponscut medicaid billions of dollars senior citizensforeign oil abuse of power cost of the warpresident plan manufacturing jobs karl rovegun violence billion in tax spending cutsblack caucus lost their jobs record pro�tsnational debt central american bunker busterpublic broadcasting child labor food stampschild support low income bring our troopsstudent loans cut programs troops home
Three-word phrasesveterans health care corporation for public broadcasting cut health carecongressional black caucus additional tax cuts civil rights movementva health care pay for tax cuts cuts to child supportbillion in tax cuts tax cuts for people drilling in the arctic nationalcredit card companies oil and gas companies victims of gun violencesecurity trust fund prescription drug bill solvency of social securitysocial security trust caliber sniper ri�es voting rights actprivatize social security increase in the minimum wage war in iraq and afghanistanamerican free trade system of checks and balances civil rights protectionscentral american free middle class families credit card debtnational wildlife refuge cut student loans little rock ninedependence on foreign oil american people deserve social security plantax cuts for the wealthy cut food stamps arctic wildlife refugevice president cheney health care education education health carearctic national wildlife federal trade commission social security the presidentbring our troops home congressional hispanic caucus social security bene�tssocial security privatization alternative minimum tax explosive device detonatedbillion trade de�cit asian and paci�c islander plan to privatize socialasian paci�c american global gag rule ryan white carepresident bush took o¢ ce cut social security major oil companiesprivatization of social security billion in tax breaks outing a cia agentprivatizing social security below the poverty line fuel economy standardsparty line vote middle class americans improvised explosive devicechild support enforcement funding for veterans health president social securitycredit card industry health care for veterans international labor organizationSource: Authors�calculations from the Congressional Record.Notes: Table shows top words, ranked according to the �2 statistic in a test of the independence betweenphrases and political party of the speaker. See section 3 for details.
51

Panel B: Phrases used more often by Republicans
Two-word phrasesstem cell personal accounts retirement accountsnatural gas saddam hussein government spendingdeath tax pass the bill national forestillegal aliens private property minority leaderclass action border security urge supportwar on terror president announces cell linesembryonic stem human life cord bloodtax relief chief justice action lawsuitsillegal immigration human embryos economic growthdate the time increase taxes food programboy scouts growth rate time and i movehate crimes cell research legal systemoil for food property rights nuclear powerglobal war border patrol democrat leadermedical liability budget committee growing economyhighway bill consent decrees raising taxesadult stem crimes law witnesses may testifydemocratic leader post o¢ ce savings accountsfederal spending european union iraqi peopletax increase president business forest serviceraise taxes postal service law we can changeillegal immigrants terri schiavo immigration reformpresident i move circuit court indian a¤airsthird time temporary worker ten commandmentspercent growth war on terrorism un reform
Three-word phrasesembryonic stem cell circuit court of appeals tongass national foresthate crimes legislation death tax repeal pluripotent stem cellsadult stem cells housing and urban a¤airs supreme court of texasoil for food program million jobs created justice priscilla owenpersonal retirement accounts national �ood insurance justice janice rogersenergy and natural resources oil for food scandal american bar associationglobal war on terror private property rights growth and job creationhate crimes law temporary worker program natural gas naturalchange hearts and minds class action reform grand ole opryglobal war on terrorism chief justice rehnquist reform social securityclass action fairness percent growth rate judge john robertscommittee on foreign relations united states postal service supply of natural gasde�cit reduction bill american farm bureau gas natural gasboy scouts of america gross national product chief of naval operationsrepeal of the death tax social security reform underground storage tankhighway trust fund export import bank partial birth abortionaction fairness act justice of the supreme court judicial con�rmation processcommittee on commerce science price of natural gas personal savings accountscord blood stem �fth circuit court near earth objectsmedical liability reform social security system national security issuestem cell lines committee on homeland security law enforcement and intelligenceblood stem cells united nations reform justice william rehnquistsupreme court of the united million illegal aliens medical liability crisishealth savings accounts california supreme court judge alberto gonzalesbanking housing and urban term care insurance economic growth and job
Source: Authors�calculations from the Congressional Record.Notes: Table shows top words, ranked according to the �2 statistic in a test of the independence betweenphrases and political party of the speaker. See section 3 for details.
52

Gentzkow and Shapiro V• Demand Model: Ideology is a linear function of share of contributions
to republicans in zipcode [r(z)]:
• Utility Function minimizes distance between individual ideology and newspaper ideology:
• Thus, share of subscribers in a zip code is given by:
• Multiplying this out, we get:
• -
zz ry βα +=
( ) iznznznizn yyU ξεγ ++−−=2
( ) znznzn yyS εγδ +−−=2
( ) ( ) znzzznnnzn rrryyyS εβαββαγγαδ +++−−−−= 2222 222
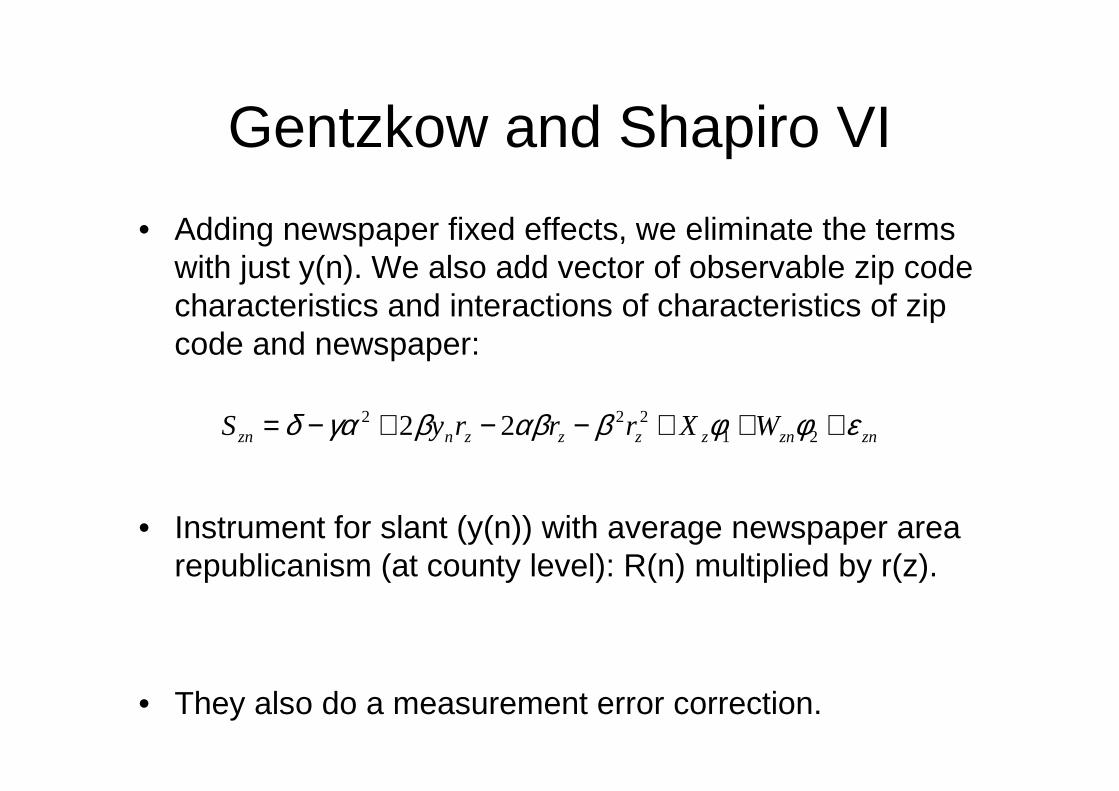
Gentzkow and Shapiro VI
• Adding newspaper fixed effects, we eliminate the terms with just y(n). We also add vector of observable zip code characteristics and interactions of characteristics of zip code and newspaper:
• Instrument for slant (y(n)) with average newspaper area republicanism (at county level): R(n) multiplied by r(z).
• They also do a measurement error correction.
znznzzzznzn WXrrryS εφφβαββγαδ +++−−+−= 21222 22

Gentzkow and Shapiro VII
• Now, they estimate profit maximizing levels of slant for each newspaper by assuming the following profit function:
• Solving for first order conditions, they get:
• Which leads to the following solution for the ideal profit maximizing slant for the newspaper:
• -
∑=Πz
znznn SHm
( ) 0=−−∑z
znz ryH βα
nnn ridealy βα +==*

Gentzkow and Shapiro VIII
• They now allow a Becker-style utility function which maximizes the sum of profits and ideology:
• Solving for first order conditions, they get:
• They can now estimate the following:
• -
( )[ ] n
ngnnng ryHV βαµλ +=−−Π=∑
gn
nn
nnn m
idealm
midealy µ
λγλ
λγ ++
+==*
ngnn
nn
nnn mm
idealm
midealy ςµ
λγλµ
λγλ
λγ+
++
++
+==

Table 2 Estimates of the demand for slant
Dependent variable: Share of households in zipcode subscribing to newspaperDescription (1) (2) (3) (4) (5)
Model OLS 2SLS 2SLS/RC 2SLS/RC 2SLS/RC(Zip share donating 0.1733 0.6379 1.0897 0.8077 0.8505to Republicans) � Slant (0.0740) (0.1894) (0.3165) (0.2949) (0.3119)
Zip share donating -0.0165 -0.2281 -0.4296 -0.3251 -0.3418to Republicans (0.0362) (0.0879) (0.1447) (0.1380) (0.1452)
(Zip share donating -0.0598 -0.0615 -0.0638 -0.0353 -0.0380to Republicans)2 (0.0081) (0.0079) (0.0135) (0.0129) (0.0127)
Market-newspaper FE? X X X X X
Zipcode demographics? X X
Zipcode X market char.? X
Estimate of � 0.0954 0.3576 0.3942 0.4025 0.4019(Con�dence interval) (-1.17;0.30) (0.21;0.40) (0.30;0.43) (0.25;0.44) (0.25;0.44)
Estimate of � 0.6900 0.1929 0.1171 0.0874 0.0894(Con�dence interval) (0.32;3.06) (0.11;0.47) (0.06;0.29) (0.02;0.34) (0.02;0.34)
Estimate of 0.1256 1.6533 4.6547 4.6206 4.7553(Con�dence interval) (0.004;0.45) (0.29;4.35) (0.87;13.1) (0.29;24.7) (0.33;22.3)
Number of observations 61845 61845 61845 61845 61845Number of newspapers 290 290 290 290 290Source: Authors� calculations based on Audit Bureau of Circulations (newspaper subscriptions), FederalElection Commission (campaign contributions), U.S. Presidential Atlas (county-level voting), U.S. Census(zipcode demographics), Editor and Publisher International Yearbook 2000-2005 (newspaper location).Notes: Table shows estimates of models of the form of equation (9). Standard errors (in parentheses) areclustered by newspaper. Zipcode demographics are log of total population, log of income per capita, percent ofpopulation urban, percent white, percent black, population per square mile, share of houses owner-occupied,and the share of population 25 and over whose highest level of schooling is college, all as of 2000. �Zipcode Xmarket characteristics�refers to a vector of these characteristics interacted with their analogue at the levelof the newspaper�s market.
53

Table 3 Ownership and newspaper slant
Dependent variable: Slant index (yn)(1) (2) (3) (4)
Average slant of other newspapers 0.6040 0.5453 0.4217 0.2438in ownership group (0.1159) (0.1375) (0.1843) (0.2139)
Control for pro�t-maximizing slant? X X X
Census division �xed e¤ects? X
State �xed e¤ects? X
Number of observations 338 338 338 338
Number of ownership groups 36 36 36 36
R2 0.0877 0.0713 0.0393 0.0130
Source: Authors� calculations based on ProQuest database and Congressional Record (slant index), U.S.Presidential Atlas (county-level voting), Editor and Publisher International Yearbook 2000-2005 (newspaperlocation and ownership).Notes: Standard errors (in parentheses) clustered by ownership group. See section 3 for derivation of slantindex and section 4.4 for details on calculation of pro�t-maximizing slant. In speci�cations (2) through (4),slant index is regressed on controls, and then residuals are averaged to form adjusted average slant of othernewspapers in ownership group.
54

Table 4 Decomposing the variation in newspaper slant
Dependent variable: Slant index (yn)(1) (2) (3) (4) (5)
Pro�t-maximizing slant � 2.0340 1.9136 2.1078 2.2246in newspaper�s market (0.2413) (0.1930) (0.2029) (0.2039)
Ownership group �xed e¤ects? X
Census division �xed e¤ects? X
State �xed e¤ects? X
Standard deviation of 0.0144 0.0121 0.0046 0.0000ownership e¤ect (0.0034) (0.0039) (0.0032) (0.0051)
Ownership share of 0.1324 0.0943 0.0208 0.0000residual variation (0.0633) (0.0529) (0.0206) (0.0599)
Consumer share of 0.1910 0.2005 0.2071 0.2238residual variation (0.0453) (0.0404) (0.0399) (0.0410)
Number of observations 413 413 413 413 413Number of multi-paper groups 36 36 36 36 36Source: Authors� calculations based on ProQuest database and Congressional Record (slant index), U.S.Presidential Atlas (county-level voting), Editor and Publisher International Yearbook 2000-2005 (newspaperlocation and ownership).Notes: See section 3 for derivation of slant index. Newspaper market is de�ned as the newspaper�s primarymetropolitan statistical area if available, and the newspaper�s county if not. Models estimated via maximumlikelihood. Standard errors on the standard deviation of the ownership e¤ect and the ownership share of thevariation are obtained through a parametric bootstrap. Ownership and consumer share of residual variationare the share of variation in slant explained by ownership group random e¤ects and pro�t-maximizing slantrespectively; in columns (2), (4) and (5) the share(s) are computed after partialling for group, division, andstate �xed e¤ects respectively.
55

Table 5 Robustness of the relationship between slant and consumer characteristics
Dependent variable: Slant index (yn)(1) (2) (3) (4)2SLS 2SLS OLS OLS
Instrument(s) % church log population,% black, % college
Pro�t-maximizing slant 1.8565 3.6437 1.0654 1.2073in newspaper�s market (0.7609) (0.3642) (0.1955) (0.1942)
Log(market population) -0.0057 -0.0014(2000) (0.0012) (0.0015)
Share black in market -0.1471 -0.1408(2000) (0.0149) (0.0147)
Share college-educated -0.0530 -0.0304in market (2000) (0.0247) (0.0247)
Log(number of -0.0023newspaper employees) (0.0022)
Log(number of pages) -0.0133(0.0052)
Number of Pulitzers, -0.00041970-2006 (0.0005)
Number of observations 406 413 413 413R2 � � 0.4231 0.4560Source: Authors� calculations based on ProQuest database and Congressional Record (slant index), U.S.Presidential Atlas (county-level voting), Editor and Publisher International Yearbook 2000-2005 (newspaperlocation, ownership, and characteristics), DDB Needham LifeStyle survey 1972-1998 (church attendance),U.S. Census 2000 (demographics), <www.pulitzer.org> (number of Pulitzer prizes).Notes: Standard errors in parentheses. See section 3 for derivation of slant index and section 4.4 for detailson calculation of pro�t-maximizing slant. Speci�cation (1) uses the share attending church monthly from1972-1998 in the newspaper�s primary market as an instrument for ideal slant. Speci�cation (2) uses logpopulation, share black, and share with a college degree in the newspaper�s primary market as instruments forslant. Number of employees and number of pages are reported in the 2001 Editor and Publisher InternationalYearbook. In column (4), dummies are included to control for missing values of number of employees andnumber of pages.
56
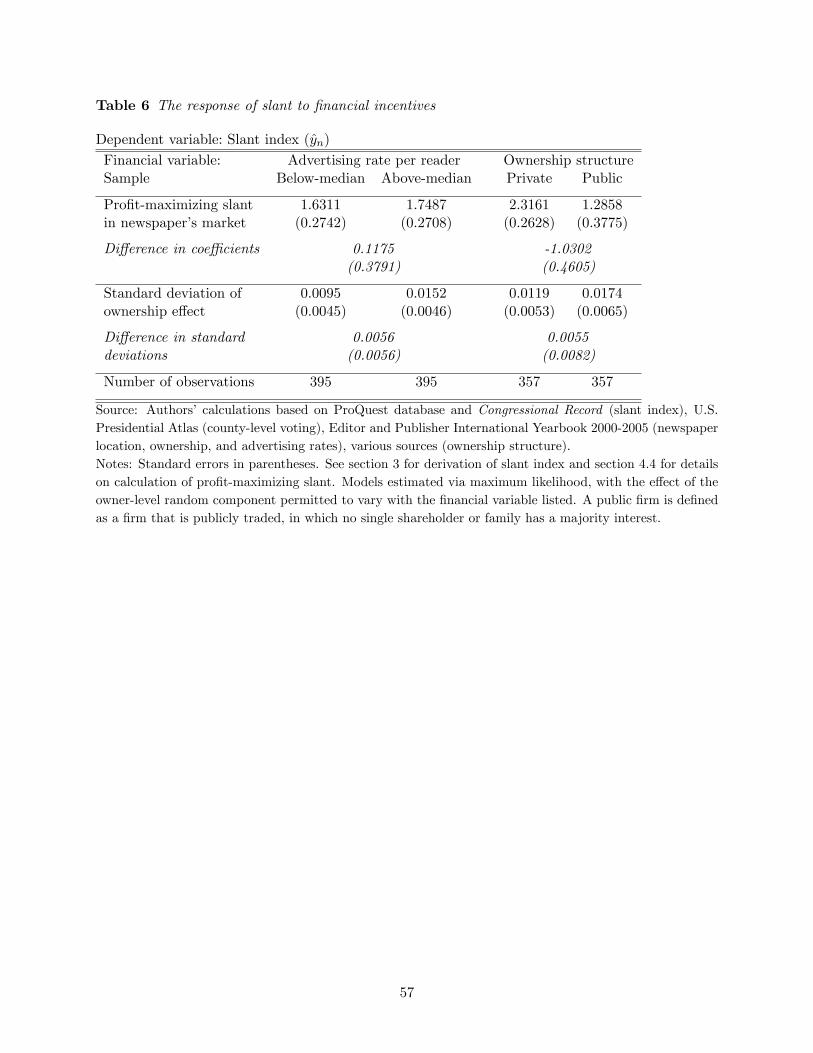
Table 6 The response of slant to �nancial incentives
Dependent variable: Slant index (yn)Financial variable: Advertising rate per reader Ownership structureSample Below-median Above-median Private Public
Pro�t-maximizing slant 1.6311 1.7487 2.3161 1.2858in newspaper�s market (0.2742) (0.2708) (0.2628) (0.3775)
Di¤erence in coe¢ cients 0.1175 -1.0302(0.3791) (0.4605)
Standard deviation of 0.0095 0.0152 0.0119 0.0174ownership e¤ect (0.0045) (0.0046) (0.0053) (0.0065)
Di¤erence in standard 0.0056 0.0055deviations (0.0056) (0.0082)
Number of observations 395 395 357 357
Source: Authors� calculations based on ProQuest database and Congressional Record (slant index), U.S.Presidential Atlas (county-level voting), Editor and Publisher International Yearbook 2000-2005 (newspaperlocation, ownership, and advertising rates), various sources (ownership structure).Notes: Standard errors in parentheses. See section 3 for derivation of slant index and section 4.4 for detailson calculation of pro�t-maximizing slant. Models estimated via maximum likelihood, with the e¤ect of theowner-level random component permitted to vary with the �nancial variable listed. A public �rm is de�nedas a �rm that is publicly traded, in which no single shareholder or family has a majority interest.
57
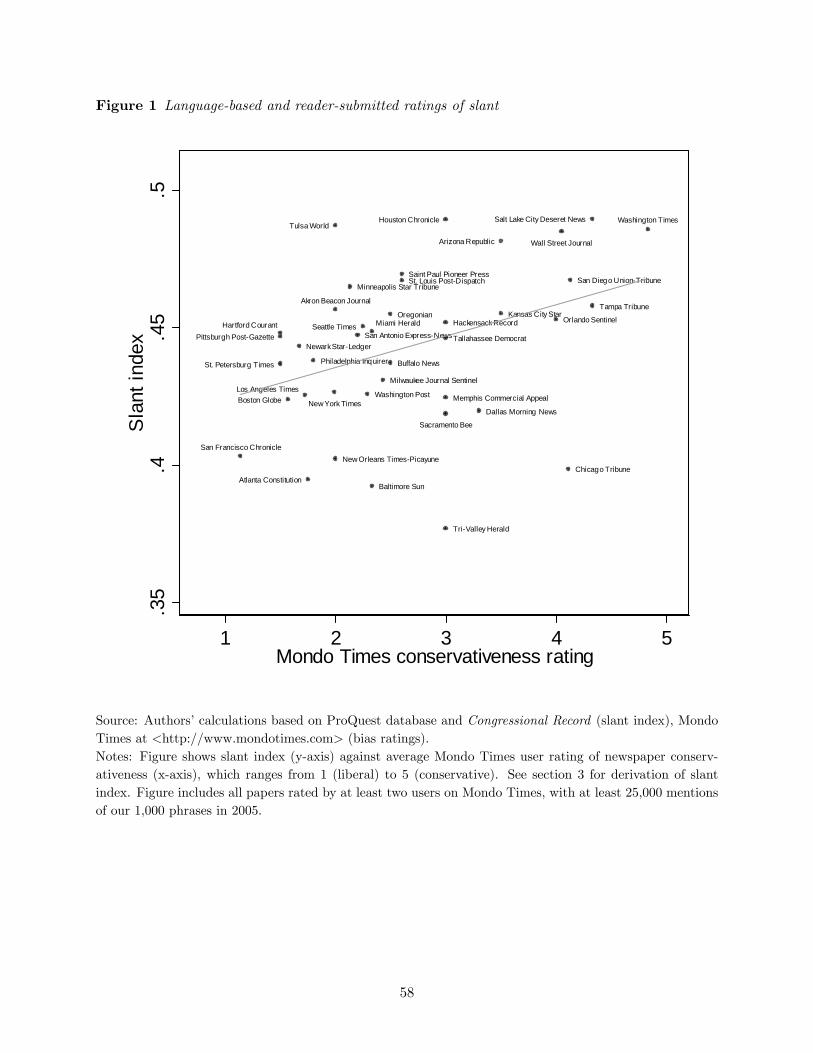
Figure 1 Language-based and reader-submitted ratings of slant
Arizona Republic
Los Angeles Times
TriValley Herald
Sacramento Bee
San Diego UnionTribune
San Francisco Chronicle
Hartford Courant
Washington Post
Washington Times
Miami Herald Orlando Sentinel
St. Petersburg Times
Tallahassee Democrat
Tampa Tribune
Atlanta ConstitutionChicago Tribune
New Orleans TimesPicayune
Boston Globe
Baltimore Sun
Minneapolis Star Tribune
Saint Paul Pioneer Press
Kansas City Star
St. Louis PostDispatch
Hackensack Record
Newark StarLedger
Buffalo News
New York Times
Wall Street Journal
Akron Beacon Journal
Tulsa World
Oregonian
Philadelphia Inquirer
Pittsburgh PostGazette
Memphis Commercial Appeal
Dallas Morning News
Houston Chronicle
San Antonio ExpressNews
Salt Lake City Deseret News
Seattle Times
Milwaukee Journal Sentinel
.35
.4.4
5.5
Sla
nt in
dex
1 2 3 4 5Mondo Times conservativeness rating
Source: Authors�calculations based on ProQuest database and Congressional Record (slant index), MondoTimes at <http://www.mondotimes.com> (bias ratings).Notes: Figure shows slant index (y-axis) against average Mondo Times user rating of newspaper conserv-ativeness (x-axis), which ranges from 1 (liberal) to 5 (conservative). See section 3 for derivation of slantindex. Figure includes all papers rated by at least two users on Mondo Times, with at least 25,000 mentionsof our 1,000 phrases in 2005.
58

Figure 2 Newspaper slant and consumer demand
The Arizona Republic
Los Angeles Times
San Bernardino County SunThe San Diego UnionTribune
San Francisco Chronicle
Denver Rocky Mountain NewsThe Denver Post
The Hartford Courant
The Stamford AdvocateThe Washington Post
The Washington Times
Constitution
The Des Moines Register
The Wichita Eagle
Boston Herald
The Boston Globe
Sentinel & Enterprise
The Berkshire Eagle
Telegram & Gazette
The Sun
Portland Press Herald
The Kansas City Star
St. Louis PostDispatch
Springfield NewsLeader
The Charlotte Observer
The News & Observer
Omaha WorldHerald
The Telegraph
Courier News
CourierPost
The RecordAsbury Park Press
The Daily Journal
Burlington County Times
NewsdayPoughkeepsie Journal
The PostStandard
Akron Beacon JournalThe Plain Dealer
The Columbus Dispatch
The Oregonian
The Morning Call
The Intelligencer Record
The PatriotNews
Intelligencer Journal
The Philadelphia Inquirer
The Providence Journal
The State
The Commercial Appeal
Austin AmericanStatesman
The Dallas Morning News
Fort Worth StarTelegram
San Antonio ExpressNews
The Free LanceStar
Richmond TimesDispatchThe Burlington Free Press
The Seattle Times
Wisconsin State Journal
Milwaukee Journal Sentinel
Charleston Gazette
.05
0.0
5.1
Coe
ffici
ent o
n zi
p R
epub
lican
sha
re
.35 .4 .45 .5Slant measure
Source: Authors�calculations based on ProQuest database and Congressional Record (slant index), AuditBureau of Circulations (newspaper subscriptions), Federal Election Commission (campaign contributions)Notes: Y-axis shows the estimated e¤ect of the share contributing to Republican candidates on the share ofhouseholds in the zipcode reading each newspaper, from a model in which readership shares are regressed,separately by newspaper, on contribution shares and market �xed e¤ects. X-axis shows slant measure.Figure excludes data for newspapers circulating in fewer than 300 zipcodes.
59

Figure 3 Newspaper slant and variation in consumer demand
.04
.05
.06
.07
Shar
e re
adin
g ne
wsp
aper
0 2 4 6 8 10Zipcode decile of Republican contribution share
Slant Quartile 1
.06
.07
.08
.09
Shar
e re
adin
g ne
wsp
aper
0 2 4 6 8 10Zipcode decile of Republican contribution share
Slant Quartile 2.0
6.0
7.0
8.0
9Sh
are
read
ing
new
spap
er
0 2 4 6 8 10Zipcode decile of Republican contribution share
Slant Quartile 3
.06
.07
.08
.09
Shar
e re
adin
g ne
wsp
aper
0 2 4 6 8 10Zipcode decile of Republican contribution share
Slant Quartile 4
Source: Authors�calculations based on ProQuest database and Congressional Record (slant index), AuditBureau of Circulations (newspaper subscriptions), Federal Election Commission (campaign contributions).Notes: Figure shows coe¢ cients on decile dummies in regressions of the share of households in a zipcodereading a newspaper on dummies for decile of share donating to Republicans in the 2000-2004 election cycle,with market-newspaper �xed e¤ects, and weighted by zipcode population. Equation is estimated separatelyfor newspapers in each quartile of the distribution of measured slant.
60

Figure 4 Di¤erences between slant and predicted ideal point
mean
95% C.I.0
510
15D
ensi
ty
.1 .05 0 .05 .1Slant Ideal point
Source: Authors� calculations based on ProQuest database and Congressional Record (slant index), U.S.Presidential Atlas, FEC contribution data, and Audit Bureau of Circulations (ideal points).Notes: Figure shows the distribution of the di¤erence between newspapers�actual slant and our estimate oftheir pro�t-maximizing level of slant (yn�idealn). See section 3 for derivation of slant index, and section4.4 for details on the computation of pro�t-maximizing level of slant. The dashed line indicates the mean ofthe distribution and the dotted lines indicate the 95 percent con�dence interval for the value of the mean(incorporating both sampling variation in slant and uncertainty in the demand estimates that are inputs tocomputing idealn).
61

Figure 5 Slant and consumer preferences
.35
.4.4
5.5
.55
.6S
lant
.2 .4 .6 .8Market percent Republican
Actual slant Predicted ideal point
Source: Authors� calculations based on ProQuest database and Congressional Record (slant index), U.S.Presidential Atlas (county-level voting), Editor and Publisher International Yearbook 2000-2005 (newspaperlocation).Notes: Figure shows newspaper slant index and pro�t-maximizing level of slant (y-axis) against Bush�s shareof the two-party vote in 2004 in the newspaper�s market (x-axis). See section 3 for derivation of slant index,and section 4.4 for details on the computation of pro�t-maximizing level of slant. Newspaper market isde�ned as the newspaper�s primary metropolitan statistical area if available, and the newspaper�s county ifnot.
62

Figure 6 Newspaper slant and ownership
Figure A: Relationship between newspaper slant and average slant of co-owned papers
.35
.4.4
5.5
.55
Ave
rage
sla
nt o
f oth
er p
aper
s w
ith s
ame
owne
r
.35 .4 .45 .5 .55 .6Slant index
Figure B: Newspaper slant and slant of co-owned papers, controlling for consumer preferences andstate
.1.
050
.05
Ave
rage
sla
nt o
f oth
er p
aper
s w
ith s
ame
owne
r
resid
ual
.1 .05 0 .05 .1Slant index residual
Source: Authors�calculations based on ProQuest database and Congressional Record (slant index), Editorand Publisher International Yearbook 2000-2005 (newspaper location and ownership).Notes: See section 3 for derivation of slant index and section 4.4 for details on calculation of pro�t-maximizingslant. Figure A shows average slant of co-owned newspapers graphed against a newspaper�s own slant. FigureB parallels �gure A, but measures slant using residuals from a regression of slant on pro�t-maximizing slantand dummies for the state in which the newspaper is located.
63

Figure 7 Testing for �xed costs in the production of news content
.1.0
50
.05
.1S
lant
re
sidu
al
.01 .005 0 .005 .01 .015Average ideal point of other papers with same owner residual
Source: Authors�calculations based on ProQuest database and Congressional Record (slant index), Editorand Publisher International Yearbook 2000-2005 (newspaper location and ownership).Notes: Both variables partialled with respect to the pro�t-maximizing level of slant in the newspaper�smarket. See section 3 for derivation of slant index, and section 4.4 for details on the computation of pro�t-maximizing level of slant. Newspaper market is de�ned as the newspaper�s primary metropolitan statisticalarea if available, and the newspaper�s county if not.
64

Figure 8 Newspaper slant and political contributions
Figure A: Newspaper slant and donations of top-ranking corporate executives and o¢ cers
Belo
Block
CalkinsConsolidated Copley
Gannett
Hearst
Landmark
MediaNews
MorrisSeattle Times
.4.4
5.5
.55
Slan
t ind
ex
0 .2 .4 .6 .8 1Share of contributions to Republicans
Figure B: Newspaper slant and corporate donations
Belo
Cox Gannett
Hearst
Media General
Morris
Tribune
Washington Post
.4.4
5.5
.55
Slan
t ind
ex
0 .2 .4 .6 .8 1Share of contributions to Republicans
Source: Authors� calculations based on ProQuest database and Congressional Record (slant index), Edi-tor and Publisher International Yearbook 2000-2005 (newspaper ownership), Federal Election Commission(donations of executives), Center for Public Integrity (corporate donations).Notes: Figure A shows average slant of newspapers owned by a �rm graphed against the share of totalcontribution dollars going to Republicans from the CEO, President, Managing Director, or Chairman of theBoard, as collected from the FEC�s disclosure database. Figure B shows average slant graphed against theshare of corporate contribution dollars going to Republicans, as measured by the Center for Public Integrity.
65

Appendix Table 1 Additional robustness checks
Speci�cation Pro�t-maximizing slant Ownership share of Consumer share ofin newspaper�s market residual variation residual variation
(1) Baseline 2.2246 0.0000 0.2238(0.2039) (0.0599) (0.0410)
(2) Logit demand model 2.2325 0.0000 0.2238(0.2046) (0.0599) (0.0410)
(3) Logit demand model with 2.1679 0.0000 0.2238cross-paper substitution (0.1987) (0.0599) (0.0410)
(4) Exclude newspapers in 2.0099 0.0000 0.1753multi-paper cities (0.2150) (0.0336) (0.0375)
(5) Controlling for predicted 2.2270 0.0000 0.2243sophistication (0.2056) (0.0598) (0.0414)
(6) Tightening cuto¤s on 3.5729 0.0000 0.1942phrase counts by 5% (0.3581) (0.0553) (0.0389)
(7) Measuring ideology 1.8389 0.0000 0.2009with adjusted ADA score (0.1805) (0.0246) (0.0394)
Source: Authors� calculations based on ProQuest database and Congressional Record (slant index), U.S.Presidential Atlas (county-level voting), Editor and Publisher International Yearbook 2000-2005 (newspaperlocation and ownership).Notes: Standard errors in parentheses. See section 3 for derivation of slant index, and section 4.4 for detailson the computation of pro�t-maximizing level of slant. Newspaper market is de�ned as the newspaper�sprimary metropolitan statistical area if available, and the newspaper�s county if not. Models include state�xed e¤ects and owner random e¤ects, and are estimated via maximum likelihood. Standard errors on theownership share of the variation are obtained through a parametric bootstrap. Ownership and consumershare of residual variation are the share of variation in slant explained by ownership group random e¤ectsand pro�t-maximizing slant respectively; these shares are computed after partialling for state �xed e¤ects.See appendix A for details.
66

Structural Approach
• Benefits:– Ability to make predictions out of sample because of estimation
of structural parameters
– Potentially large sample sizes
• Costs:– Identification often non-existent (GS paper is better than most)
– Usually not robust to functional form assumptions
– Usually not easily interpretable outside of the structural framework

Manipulability and Research Design: Specification Bias
• Designs:– Experiments: Clean and transparent, simple design;
manipulability comes in choice of who the experiment is done on, how the experiment is done, and the topic selected for the experiment; the statistics are non-manipulable.
– Natural Experiments: Often simple design; manipulability can come in through selection of controls and estimation technique; also sample selection leads to manipulability.
– Structural Estimation: Not very transparent; highly manipulable through sample selection, functional form selection, and estimation technique selection.
– Standard Estimation: Manipulable in selection of controls.