Embed Size (px)
Citation preview

A — S 8
31M05SW0001 2.14037 COLEMAN 010
REPORT1 ON Ai i'
HIGH SENSITIVITYMAGNETIC fir VLF EMAIRBORNE SURVEY
LATCHFORD PROJECT COLEMAN TOWNSHIP
oi
i
LARDER LAKE MINING DIVISION
ONTARIO
f o ar
GENTRY RESOURCES LTD.
14037
TERRAQUEST LTD. Toaronto, Canada.
S e p L e m to e ir 1 1 , SO
TERRAQUEST LTD.

TABLE OF CONTENTS
1 .0
2 .0
3.0
A.O
5.0
e .o
7.0
Page
31M05SW0001 a .14037 COLEMAN
INTRODUCTION . .
THE SURVEY AREA
GEOLOGY . . . . . .
010C
SURVEY SPECIFICATIONS4.1 Aircraft and Instruments . . . . .4.2 Lines and Data . . . . . . . . . .4.3 Tolerances . . . . . . . . . . . .4.4 Navigation and Recovery . . . . . .
DATA PROCESSING
INTERPRETATION6.1 General Approach . . . .6.2 Interpretation . . . . .
SUMMARY
l
l
1
22344
5 5 l
APPENDIX I PersonnelAPPENDIX II Certificate of Qualifications
LIST OF FIGURES
Figure l - General Location MapFigure 2 - Survey Area MapFigure 3 - Sample RecordFigure 4 - Terraquest Classification of VLF-EM Conductor Axes
LIST OF MAPS IN JACKET
No, No, No,
A-898-1, A-898-2, A-898-3,
No. A-898-4,
Total Magnetic Field Vertical Magnetic Gradient VLF-EM Survey Interpretation
TERRAQUEST LTD.

l .O INTRODUCTION
This report describes the specifications and results of an airborne geophysical survey carried out for GENTRY RESOURCES LTD. of 1290- 122 4th Avenue S.W., Calgary AB T2P OH3 by Terraquest Ltd., 240 Adelaide Street West, Toronto, Canada. The field work was com pleted on July 20, 1990 and the data processing, interpretation and reporting from July 21 to September 11, 1990.
The purpose of a survey of this type is two-fold. First to prospect directly for anomalously conductive and magnetic areas in the earth's crust which may be caused by, or at least related to, mineral deposits. A second is to use the magnetic and conductivity patterns derived from the survey results to assist in mapping geology, and to indicate the presence of faults, shear zones, folding, alteration zones and other structures potentially favour able to the presence of gold and base-metal concentration. To achieve this purpose the survey area was systematically traversed by an aircraft carrying geophysical instruments along parallel flight lines spaced at even intervals, 90 metres above the terrain surface, and aligned so as to intersect the regional geology in a way to provide the optimum contour patterns of geophysical data.
2.0 THE SURVEY AREA
The survey area is located in Coleman Township, in the Larder Lake Mining Division of Ontario about 10 kilometres west of the town of Cobalt. The claims lie in the centre of the township east of Bay Lake, south of Portage Bay and 2 kilometres north of the town of Latchford. Highway #11 passes through the southeast corner of the survey area.
The latitude and longitude are 47 degrees 21 minutes, and 79 degrees 49 minutes respectively, and the N.T.S. reference is 31M/5.
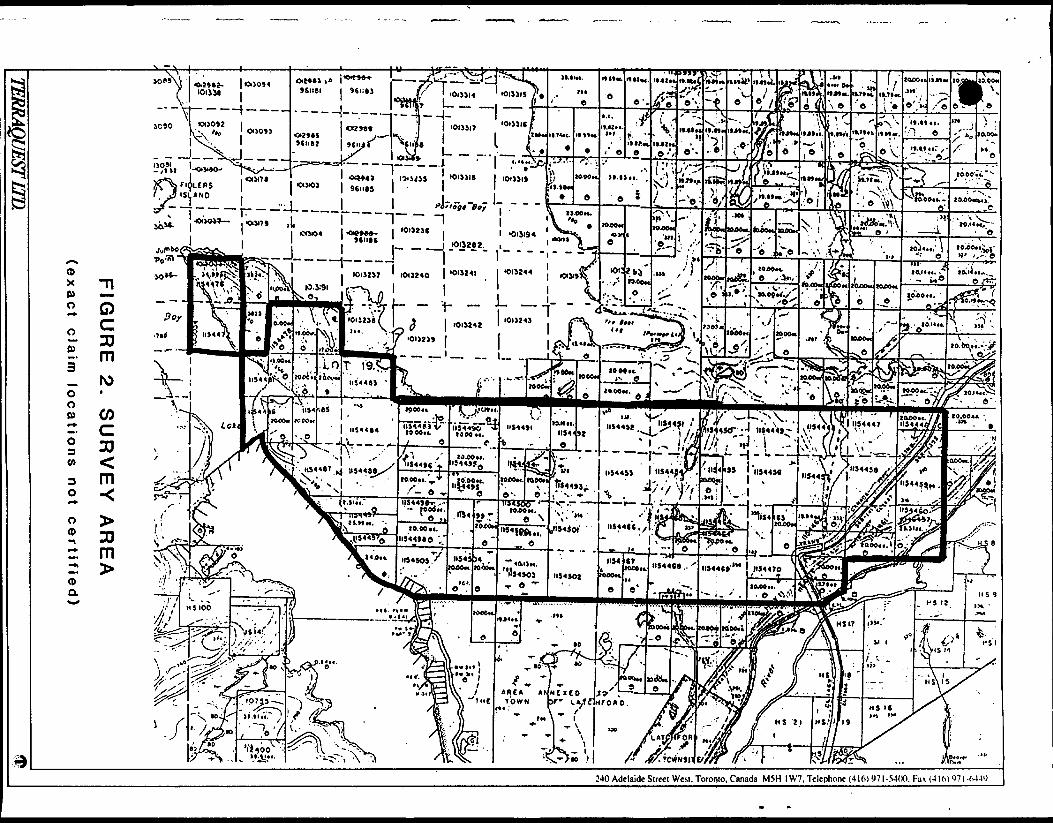
The locations of the claims numbers are shown in figure 2.
3.0 GEOLOGY
Map References
3.
Map 2361: Sudbury - Cobalt, Geological Compilation Series, scale 1:253,440 OGS 1977
Hanneson,J.E. and Huxter,R.S., 1987: The detection and mapping of basement conductors under areas covered by thick Huronian sedimentary rocks, District of Timiskaming, in Summary of Field Work and Other Activities, 1987. OGS, Misc. Pap. 137, p.406-410
Born,P. and Hitch,M.W., 1988: Geology of the Bay Lake area,
TERRAQUEST LTD.

Federal National Topographic System (N.T.S.) Maps
FIGURE 1. Location Map
TERRAQUEST LTD.
l-'.
t,?
^F
V,s
rM5i.
i g
i e
(_
- j^
s_
| g
wy.r
fi rv
i\i
-•m,:1 f*
X
tf.sICOp3
FIG
UR
E
2.
SU
RV
EY
A
RE
A
(exact
cla
im
locatio
ns
no
t certifie
d)
TEWAQUESTLTD.

District of Timiskaming, in Summary of Field Work and Other Activities, 1988, OGS Misc. Pap. 141, p.281-287
4. Map OFM 120: Geology of the Bay Lake Area, District of Timiskaming. P.Born and M.Hitch, scale 1:15,840 Open File Map OGS
Most of the survey area is underlain by sediments of the Gowganda and Lorrain Formations of the Cobalt Group. These have been intruded by the Nipissing Diabase Sill also of Middle Precambrian age and is exposed as irregular bands across the property. Significant cobalt, gold, silver and copper mineralization have been discovered along the edges of this intrusive. A recent airborne UTEM survey north of Portage Bay shows that conductors occur along the intrusives at depth within the Gowganda and Lorrain Formation sediments.
A.O SURVEY SPECIFICATIONS
4.1 Aircraft and Instruments
The survey was carried out. using a Cessna 206 aircraft, registra tion C-GUCE, which carries two magnetometers and a VLF electromag netic detector.
The magnetometer sensors are high sensitivity, optically pumped cesium vapour magnetometers mounted in wingtip extensions with a separation of 14.3 metres. Their specifications are as follows:
Working range: Sensitivity: Sampling rate: Model: Manufacturer:
20,000-100,000 gammas0.005 gammas0.2 secondsBIW 2321H8Scintrex, Concord Ontario,
The magnetometer processor is a PMAG 3000 and the data acquisition system is a PDAS 1000, both manufactured by Picodas Group Inc.
The signal to noise ratio of the magnetic response is improved by a real time compensation technique provided by Picodas Group Inc. The sources of noise are permanent, induced and eddy current effects of the airframe, and the heading effects. The system uses three orthogonal fluxgate magnetometers to measure the aircraft attitude with respect to the earth's magnetic field vector. A mathematical model is used to solve this interference effect.
The VLF-EM antenna is mounted in a reinforced fibreglass tube projected forward from the midsection of the starboard wing. It is composed of three orthogonal coils and measures (a) the total field strength of the EM field, and (b) the quadrature which is defined as the phase difference between the vertical coil and either one of the horizontal coils. The quadrature polarity is
TERRAQUEST LTD.

defined by the direction of flight, routinely normalized to north or east headings. The total field magnitude is insensitive to antenna orientation in pitch, roll and yaw.
The VLF-EM system measures two frequencies simultaneously so as to allow two transmitters to be selected to ensure good coupling with the target conductors. The "LINE" transmitter (Channel 1) is located ideally at right angles to the flight lines such that the transmitted energy will couple well with the stratigraphy. In this case the recorded quadrature is the phase difference between the vertical coil and the "along line" or LINE coil. The "ORTHO" transmitter (Channel 2) is ideally located along the flight lines or along the direction of cross-faulting, and the recorded quadra ture is the phase difference between the vertical coil and the "across line" or ORTHO coil.
Although total field and quadrature data are recorded from both Channels, only the data from Channel l are routinely processed and plotted. The data from the Channel 2 are available for processing if requested. Whenever the transmitters are shut down for main tenance the next most suitable transmitter is selected.
The specifications of the VLF-EM system are:Frequency Range Sensitivity Range
Accuracy: Reading Interval: Model: Manufacturer:
Other instruments are:
15kHz to 25kHz for each channel130uV to lOOmV m at 20kHz3dB down at 14kHz and 24kHzUO . 2 secondTOTEM 2AHerz Industries, Toronto, Canada
King KRA-10A radar altimeterPDAS-1000 data processor with 40 mByte cassette tape and 3 1/2" disk recorder manufactured by Picodas Group Inc. Trimble TRANS GPS satellite navigationVideo tape flight path confirmation, 1/lOth second fiducial intervals and with electronic attitude compensa tion
4.2 Lines and Data
Total survey area..................138 kilometresClaim group coverage................95 kilometresLine direction.....................180 degrees azimuthLine interval......................100 metresTie line interval.................. 2 kilometresTerrain clearance...................90 metresAverage ground speed...............193 kilometres/hourData point interval:
TERRAQUESTLTD.

IVCE 1: RAO Full Scale: 180.000 ft *
TRACE 2: Vl-I Full Scale: 200.000 Zl l l l l l l l I.I,j.M.lrfi.l.ltototi*ll**H l l l l l l l 1.1.l l l l l . l i , , n J l l 1J 1.1 l 1.1 J.I l
TRACE It: V2-I Full Scale: 200.000l ^ i ^ i J- 1- 1 -i .t-1 -j 1,1.1 Li j-
TRACE 5: V2-Q Full Scale: 200.000 X *| 1,1 1.1 l i l J lil l I.I J.I ..ill. . L~-*..J-..~ - .-i . . .li , , ,,t li , U.I., . ..1.1.. J , lJ... , . , l l l ,
TRACE 7: MAGI Full Scale: 875.000 nT
hinl
TRACE 3: Vl-Q Full Scale: 200.000 X ftl ' ' ' ' [ ' l l l l l^fA-L*-*-!-*-!-*-*-! l ]-LI l .J LI l J J 1-1 l l J l 1.1 ..l l l l 11 l J 1 l . l l . l . l l l 111 J l l l li II l l ,
i L, j
TRACE 9: MAG2 Full Scale: 875.000 nT
TRACE19: MAGI Full Scale: 8.750 nT /m T-GR1l . i i i l , i i i l i i , . l i . , i l . i i , l i - i i l . i i . L ...j ̂ .i^ .^^Lt^ijJ-.-.
Line : 750.ON Time:. t——^^
5.0 Slart Fid: 420 File: S9091014.B13
FIGURE 3. SAMPLE OF ANALOG DATA
TERMQUESTLTD.

Magnetic..................11 metresVLF-EM....................11 metres
Channel l ("LINE" Transmitter).........NAA Cutler, 24.0 kHzChannel FLIGHT LOG:
July 20
2 ("ORTHO" Transmitter)........NSS Annapolis, 21.4 kHz
flight U-270, partly cloudy
4.3 Tolerances
Line spacing: Any gaps wider than twice the line spacing andlonger than 10 times the line spacing were filled in by a newline.
Terrain clearance: Portions of line which were flown above 125metres for more than one kilometre were reflown if safetyconsiderations were acceptable.
Diurnal magnetic variation: Less than ten gammas deviation froma smooth background over a period of two minutes or less asseen on the base station analogue record.
Manoeuvre noise: nil
4.4 Navigation and Recovery
The satellite navigation system was used during periods of satel lite visibility to ferry to the survey site and to survey along each line using UTM coordinates. The accuracy is variable depend ing on the number and condition of the satellites; however it is less than twenty five metres and typically in the ten to fifteen metre range.
For assisting the navigation of the aircraft and the recovery of the flight path, serai-controlled mosaics of aerial photographs were made from existing air photos. Each photograph forming the mosaic was adjusted to conform to the NTS map system before the mosaic was assembled. These mosaics are alsd used as a base for the data and interpretation maps and thereby allow detailed ground locations for follow-up investigations and further mapping.
Flight path recovery was also carried out in the field using a video tape viewer to observe the flight path as recorded by the Geocam video camera system. The flight path recovery was completed daily to enable reflights to be selected where needed for the following day and to provide correlation between the satellite navigation/recovery data and the photomosaic base maps.
5 . O DATA PROCESSING
The total field magnetic data was calculated using the magnetic values from the port wing-tip mounted magnetometer. The magnetic data values were levelled in the standard manner by tying survey
TERRAQUESTLTD.

lines to the control lines. The data were then gridded at 2.5mm grid cell size at map scale and contoured using standard cubic spline interpolation to confirm the accuracy of the levelling procedure. Additional adjustments to the total field magnetics were made as required and then plotted on mylar.
The vertical magnetic gradient is computed from the gridded and contoured final total field data using a method of transforming the data set into the frequency domain, applying a transfer function to calculate the gradient, and then transforming back into the spatial domain. The method is described by a number of authors including Grant, 1972 and Spector, 1968. The computer program for this purpose is provided by Paterson, Grant and Watson Ltd. of Toronto.
The VLF data was treated automatically so as to normalize the non conductive background areas to 100 (total field strength) and zero (quadrature). The algorithms to do this were developed by Terra- quest and will be provided to anyone interested by application to the company.
All of these data processing calculations and map contouring were carried out by Dataplotting Services Inc. of Toronto.
Grant, F.S. and Spector A., 1970: Statistical Models for Inter preting Aeromagnetic Data; Geophysics, Vol 35
Grant, F.S., 1972: Review of Data Processing and Interpretation Methods in Gravity and Magnetics; Geophysics Vol 37-4
Spector, A., 1968: Spectral Analysis of Aeromagnetic maps; un published thesis; University of Toronto.
S.O INTERPRETATION
6.1 General Approach
To satisfy the purpose of the survey as stated in the introduction, the interpretation procedure was carried out on both the magnetic and VLF-EM data. On a local scale "geological" units were inter preted from the magnetic gradient contour patterns based on their characteristic patterns and intensities, or "signatures". The contacts are typically located along the steepest section of the gradient; therefore the vertical magnetic gradient format was used primarily to delineate stratigraphy. The total magnetic field format was used to determine the relative magnetic intensity of the interpreted unit. Where possible these units were related to existing geology (known outcrops) to provide a geological identity to the units.
Magnetic anomalies that are caused by iron deposits of ore quality
TERRAQUEST LTD.

are usually obvious owing to their high amplitude, often in tens of thousands of gammas. Mafic to felsic metavolcanics are usually characterized by respectively strong to weak magnetic intensities. Clastic metasediments generally possess very low concentrations of iron bearing minerals and therefore correlate with very low magnetic responses. In some cases, the weak responses from the metasediments are overwhelmed by the magnetic fields from the surrounding lithologies.
Alteration zones can show up as anomalously quiet areas, often adjacent to strong, circular anomalies that represent intrusives, or along an otherwise magnetically active horizon. In some cases contact metamorphic aureoles are characterized by magnetic anom alies .
On a regional scale the total magnetic field contour patterns were used in the same way to delineate bodies of larger dimensions.
Faults and shear zones were interpreted mainly from lateral displacements of otherwise linear magnetic anomalies but also from long narrow "lows". The direction of regional faulting and the topographic lineaments in the general area were taken into account when selecting the dominant fault orientations. Folding is usually seen as curved regional patterns.
VLF-EM anomalies are evaluated according to a) the relative intensities of the total field strength, b) correlation of the total field strength with magnetic, geologic and topographic features, and c) the intensity and nature of the quadrature or phase response.
Areas showing a smooth VLF-EM response somewhat above background (ie. 110 or so) are likely caused by overburden which is thick enough and conductive enough to saturate at these frequencies. In this case limited response from bedrock is seen.
The VLF-EM conductor axes have been identified and evaluated according to the Terraquest classification system (Figure 4). This system correlates the nature and orientation of the conductor axes with stratigraphic, structural and topographic features to obtain an association from which one or more possible origins may be selected. Alternate associations are indicated in parentheses.
The phase response has been categorized according to whether the slope/direction is normal, reverse, or no phase at all. The significance of the differing phase responses is not completely understood although in general reverse phase indicates either overburden as the source or a conductor with considerable depth extent, or both. Normal phase response is theoretically caused by surface conductors with limited depth extent. In some cases, a change in the orientation of the conductor appears to affect the sense of the phase response.
TERRAQUEST LTD.

FIGURE 4
TERRAQUEST CLASSIFICATION OF VLF-EM CONDUCTOR AXES
SYMBOL
a , A
b, B
c . C
d f
D F
ob, OB
cu\ , CUL
CORRELATION
Coincident with magnetic stratigraphy
Parallel to magnetic stratigraphy
No correlation with magnetic stratigraphy
Coincident with magnetic dyke
Coincident with topographic lineament or parallel to fault system
Contours of total field response conform to topographic depression
Coincident with cultural sources
ASSOCIATION; Possible Origins
Bedrock magnetic horizons: stratabound mineralogic origin or shear zone
Bedrock non-magnetic horizons: stratabound mineralogic origin or shear zone
Association not known: possible small scale stratabound mineralogic origin, fault or shear zone, overburden
Dyke or possible fault: mineralogic or electrolytic
Fault zone: mineralogic or electrolytic
Most likely overburden: clayey sediments, swampy mud
Electrical, pipe or railway lines
NOTES
1 - Upper case symbols denote a relatively strong total field strength2 - Underlined symbols denote a relatively strong quadrature response3 - Mineralogic origins include sulphides, graphite, and in fault zones, gouge4 - Electrolytic origins imply conductivity related to porosity or high moisture content
240 Adelaide Street West, Toronto, Canada M5H IW7. Telephone (416) 971-5400. Fax 1416)

The VLF-EM data from Channel l has been processed; the data from Channel 2 has been recorded and can be processed upon request.
6.2 Interpretation
The magnetic and VLF-EM data are shown in contoured format on maps at a scale of 1:10,000 in the back pocket. An interpretation map is also provided. The following notes are intended to supplement these maps.
The total magnetic field has a relief of approximately 550 gammas and shows relatively low and uniform magnetic responses which are interrupted by irregular bands of strong susceptibilities. The vertical magnetic gradient shows improved resolution and has been used to delineate the stratigraphy and structure.
The Gowganda (Unit 5) and Lorrain (Unit 6) Formations are both associated with weak magnetic responses and cannot be discriminated from each other.
The strong responses are associated with the Nipissing Diabase Sill (Unit 7). These responses dominate the magnetic map, and in places overwhelm the weak responses from the adjacent sedimentary litho- logies. The magnetic mapping shows some significant improvements to the geological mapping in places of no outcrop. The centre of the property (Lot 17 6 18, Con 3) with no outcrop appears to be underlain by the diabase, connecting the known exposures to form a large "X" pattern. Similarly, subtle magnetic responses south- east of the Last Chance Mining Property are suggestive of narrow diabasic bodies, or perhaps diabase at greater depth.
A broad and subtle magnetic anomaly southeast of Portage Bay, along the northern edge of the survey area, occurs in an area mapped as Lorrain Formation sediments. This anomaly appears to be truncated at the eastern and western ends by faults. It may be related to diabase at depth or perhaps older metavolcanic rocks (similar to those outcropping near the town of Cobalt) beneath the sediments.
The regional Latchford Fault displaces the diabase sill with a minor sinistral motion. It is suspected that the diabase along Jumbo Point may have exploited a splay fault related to the Latch ford Fault.
Several magnetically interpreted faults or shear zones strike to the northeast, consistent with the topographic lineaments. It is suggested that the "X" pattern formed by the diabase is related to intrusive emplacement along the northwest and the northeast fault systems. If this model is verified, it could be used to predict- the occurrences of the diabase for further exploration.
The VLF-EM survey has identified several weak conductors. One
TERRAQUEST LTD.

8
coincides with the edge of Portage Bay and is most likely due to surficial conductivity.
Most of the conductor axes are associated with faults or jshear zones. Several structures identified in this technique trend to the northwest and west-northwest. This type of conductivity may be caused by (a) minerals such as graphite, sulphides or gouge, or (b) an ionic effect created by water or porosity either within the structure or along the upper weathered and leached edge. In general, conductive structures are open or tensional features.
A few conductor axes coincide with the diabase. This type of conductivity may be similar to structural type sources along the edges of the intrusive, or to mineralization within the intrusive. As this is the model of mineralization for the Cobalt region these conductors warrant detailed ground follow up using EM or IP methods .
7,0 SUMMARY
An airborne combined magnetic and VLF-EM survey has been carried out at 90 metre mean terrain clearance with 100 metre line inter vals and with data reading stations at 11 metres along the flight lines. All data is produced on maps at a scale of 1:10,000.
The magnetic data has been used to modify and update the existing geology, especially in areas of little or no outcrop. The mag netics have been used to identify diabase probably at depth. A model for the emplacement of the diabase along northeast and northwest trending structures has been presented that if verified, may predict the occurrences of diabase. Magnetically interpreted structures trend to the northeast and northwest and are coincident with topographic lineaments.
Several weak VLF-EM conductor axes were found most of which are associated with structural sources. A few are believed to have potential sulphide origins along the edges of the diabase and have been recommended for additional investigation.
TERRAQUEST LTD
Charles Q. Barrie, M.Se Geologist-
TERRAQUESTLTD,

PERSONNEL
Field:
APPENDIX I
Operator...........Andre RoyPilot..............Ken TowersDataman............Michel RoyCompletion Date....July 20, 1990
Office: Manager............Roger Watson, P.EngProcessing.........Dataplotting Services Inc.Interpretation.....Charles Barrie, M.Se.
i
TESSAQUBSTLTD.

10
APPENDIX II
CERTIFICATE OF QUALIFICATION
I, Charles Q. Barrie, certify that :
1. I am registered as a Fellow with the Geological Associa tion of Canada and work as a Professional Geologist.
2. I hold an honours B.Se. degree in Geology from McMaster University, obtained in 1977.
3. I hold an M.Se. degree in Geology from Dalhousie Univers ity, obtained in 1980.
4. I am a member of the Prospectors and Developers Associa tion of Canada.
5. I have been working continuously as a geologist in the mineral industry for ten years.
6. I reside at 1373 Queen Victoria Avenue in the city of Mississauga, Ontario, L5H 3H2.
7. I am employed by and am an owner of Terraquest Ltd., specializing in high sensitivity airborne geophysical surveys.
8. The accompanying report has been prepared from airborne data collected by Terraquest Ltd. exclusively for GENTRY RESOURCES LTD.. Reference material included geological maps published by the provincial government. I have not visited the property.
9. I have no interest in the property described nor the immediate area of the claims.
Toronto, Ontario September 11, 1990
Sign
Charles Q. Barrie, M.Se. Vice President, TERRAQUEST LTD,
TERRAQUEST LTD.

A —S
31M05SW0001 2.14037 COLEMAN 020
REPORT ON A
HIGH SENSITIVITYMAGNETIC fir VLF EMAIRBORNE SURVEY
KITTSON PROJECT
KITTSON fir COLEMAN TOWNSHIPS
LARDER LAKE MINING DIVISION
ONTARIO
f oar
WINSLOW GOLD CORP.
2.14037
TERRAQUEST LTD. Toaronto, Canada.
S epr, 1O, i ^^O

TABLE OF CONTENTS
1.0
2 .O
3 .O
4.0
31M05SW0001 2 .14037 COLEMAN
INTRODUCTION ..
THE SURVEY AREA
GEOLOGY . . . . . .
0S0C
SURVEY SPECIFICATIONS4.1 Aircraft and Instruments . . . . .4.2 Lines and Data . . . . . , . . . .4.3 Tolerances . . . . . . . . . . . .4.4 Navigation and Recovery . . . . . .
5 .0
6 .O
7.0
DATA PROCESSING
INTERPRETATION6.1 General Approach . . . .6.2 Interpretation . . . . .
Page
l
l
1
22444
SUMMARY
667
APPENDIX I PersonnelAPPENDIX II Certificate of Qualifications
LIST OF FIGURES
Figure l - General Location MapFigure 2 - Survey Area MapFigure 3 - Sample RecordFigure 4 - Terraquest Classification of VLF-EM Conductor Axes
LIST OF MAPS IN JACKET
No. A-897-1,No. A-897-2,No. A-897-3,
Total Magnetic Field Vertical Magnetic Gradient VLF-EM Survey
No. A-897-4, Interpretation
TUCT

l.O INTRODUCTION
This report describes the specifications and results of an airborne | geophysical survey carried out for WINSLOW GOLD CORP. of 1290-112 4th Avenue S.W., Calgary, AB T2P OH3 by Terraquest Ltd., 240 Adelaide Street West, Toronto, Canada. The field work was com pleted on July 20, 1990 and the data processing, interpretation and reporting from July 21 to September 10, 1990.
f The purpose of a survey of this type is two-fold. First toprospect directly for anomalously conductive and magnetic areas in the earth's crust which may be caused by, or at least related to, mineral deposits. A second is to use the magnetic and conductivity patterns derived from the survey results to assist in mapping tl- geology, and to indicate the presence of faults, shear zones, •" folding, alteration zones and other structures potentially favour able to the presence of gold and base-metal concentration. To achieve this purpose the survey area was systematically traversed by an aircraft carrying geophysical instruments along parallel flight lines spaced at even intervals, 90 metres above the terrain surface, and aligned so as to intersect the regional geology in a way to provide the optimum contour patterns of geophysical data.
2. O THE SURVEY AREA
The survey area is located in Kittson and Coleman Townships, in the Larder Lake Mining Division of Ontario about 15 kilometres west of the town of Cobalt. The claims lie along the western part of Coleman Township and the eastern part of Kittson Township, north and east of Kitt Lake, south of Montreal River, and west of Bay Lake. The property is readily accessible by water routes and old bush roads from Highway #11.
The latitude and longitude are 47 degrees 22 minutes, and 79 degrees 55 minutes respectively, and the N.T.S. reference is 31M/5.
The property boundary and claim numbers are shown in figure 2.
3.O GEOLOGY
References
1. Map 2361: Sudbury - Cobalt, Geological Compilation Series, scale 1:253,440 OGS 1977
2. Map OFM 120: Geology of the Bay Lake Area, scale 1:15,840 P.Born and M.Hitch, OGS
3. Born, P, and Burbidge, G.H. 1987: Geology of Brigstocke and Kittson Townships, District of Timiskaming, in Summary of Field Work and Other Activities, 1987. OGS Misc. Pap.
l

r
.' x en
54A\ \ Hiu o S O N It._ * \ i i
Federal National Topographic System (N.T.S.) Maps
FIGURE 1. Location Map
TERMQUESTLTD.

240
Ade
laid
e S
tree
t W
est.
Toro
nto.
Can
ada
M5H
IW
7.
Tele
phon
e (4
16) 9
71-5
400.
Fax
(4I
6I97
I-W
41)

137, p.198-2044. Hanneson, J.E. and Huxter,R.S. 1987: The detection and mapping
of basement conductors under areas covered by thick Huronian sedimentary rocks. District of Timiskaming, in Summary of Field Work and Other Activities, 1987. OGS Misc.Pap., p.406-410
5. Born, P. and Hitch, M.W., 1988: Geology of the Bay Lake area, District of Timiskaming, in Summary Of Field Work and Other Activities, 1988. OGS Misc.Pap. 141, p. 281-287
The eastern part of the survey area is underlain by Proterozoic metasediments belonging to the Lorrain Formation, primarily arkosic lithologies. These are semiconformably underlain to the west by rocks of the Gowganda Formation, primarily siltstone, arenite and mudstone. Both Formations have been intruded by the Nipissing Diabase Sill which locally is composed of quartz gabbro, varied texture gabbro and granophyre.
The dominant regional structure trends to the northwest and is represented by the Latchford Fault which runs through Bay Lake to the east of the property. Less extensive parallel structures have been mapped recently within the property. Cross structures trend to the northeast.
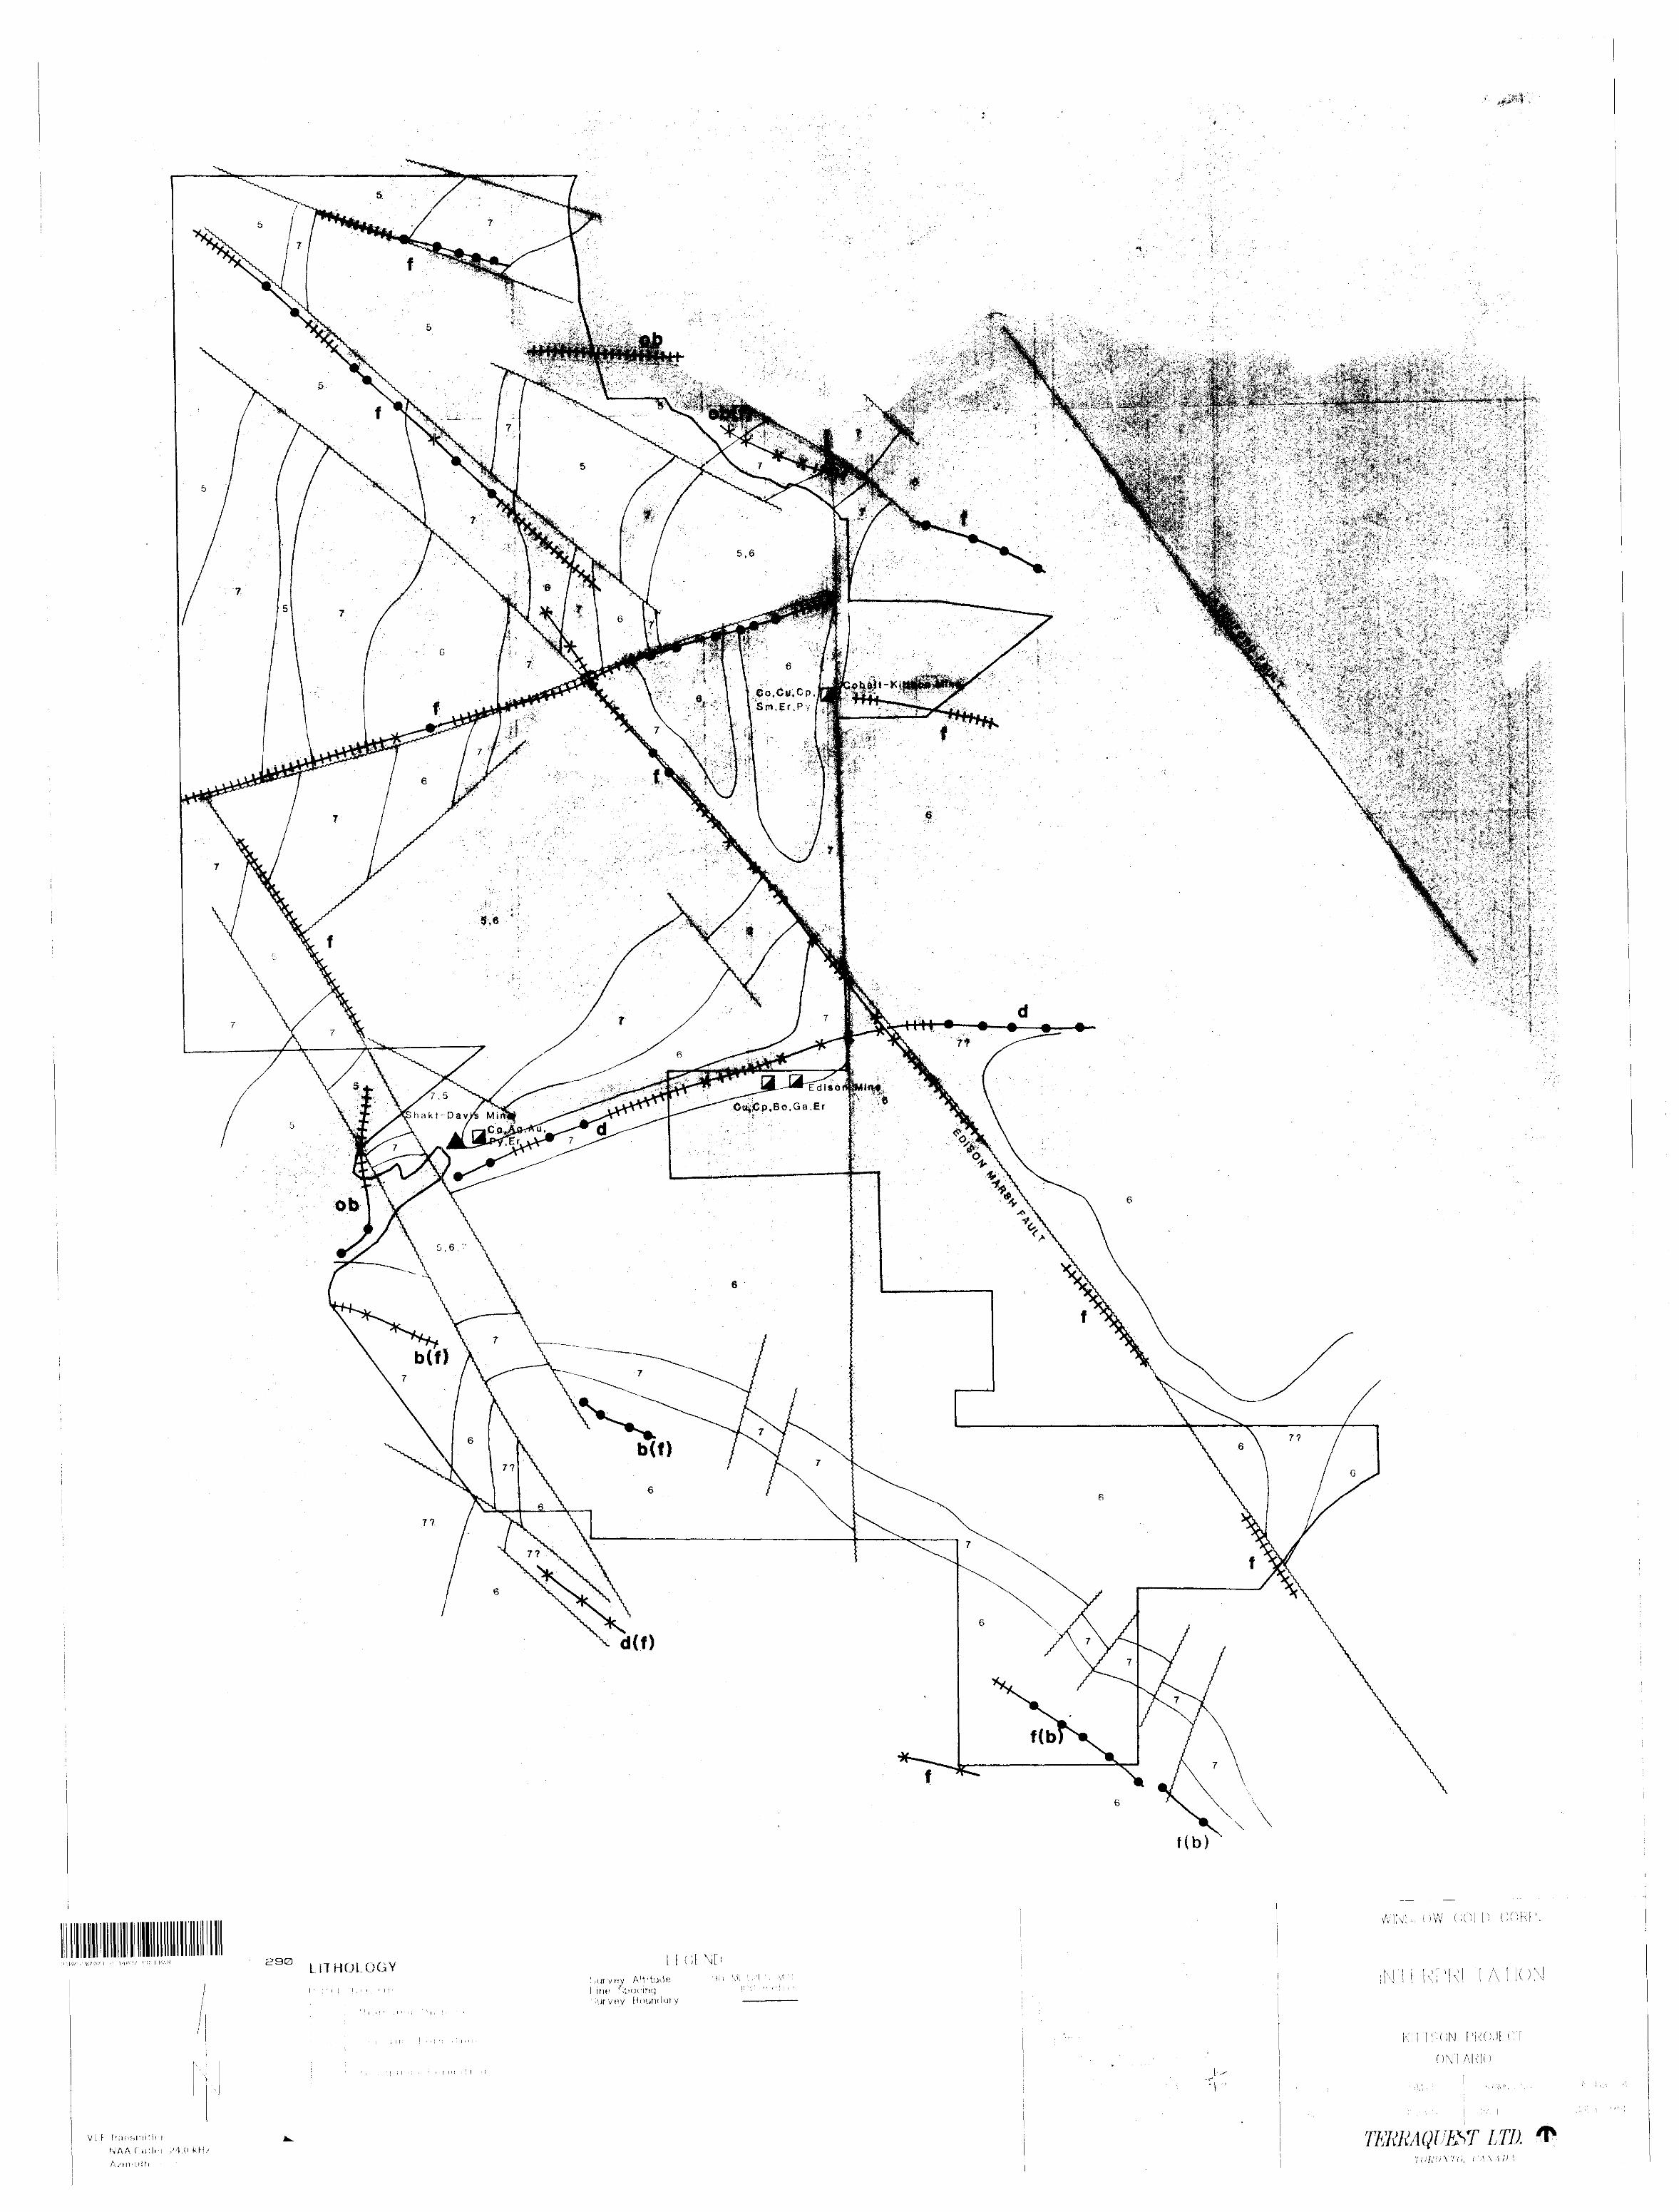
Mineralization occurs along the edges of the Nipissing Diabase Sill in calcite veins. Three mines have extracted cobalt within the survey area, the Shakt-Davis, Edison and Cobalt-Kittson mines. Significant mineralization within these deposits include smaltite, cobaltite, gersdorffite, erythrite (cobalt bloom), annabergite (nickel bloom), pyrite, chalcopyrite, niccolite, silver and gold.
The area has potential for precious and base metal mineralization along the sill. A recent airborne UTEM survey north of Bay Lake indicated several conductors at depth beneath the Proterozoic sediments.
A.O SURVEY SPECIFICATIONS
4.1 Aircraft and Instruments
The survey was carried out using a Cessna 206 aircraft, registra tion C-GUCE, which carries two magnetometers and a VLF electromag netic detector.
The magnetometer sensors are high sensitivity, optically pumped cesium vapour magnetometers mounted in wingtip extensions with a separation of 14.3 metres. Their specifications are as follows:
Working range: Sensitivity: Sampling rate?:
20,000-100,000 0.005 gammas 0.2 seconds
gammas

Model: Manufacturer:
BIW 2321H8Scintrex, Concord Ontario,
The magnetometer processor is a PMAG 3000 and the data acquisition system is a PDAS 1000, both manufactured by Picodas Group Inc.
The signal to noise ratio of the magnetic response is improved by a real time compensation technique provided by Picodas Group Inc. The sources of noise are permanent, induced and eddy current effects of the airframe, and the heading effects. The system uses three orthogonal fluxgate magnetometers to measure the aircraft attitude with respect to the earth's magnetic field vector. A mathematical model is used to solve this interference effect.
The VLF-EM antenna is mounted in a reinforced fibreglass tube projected forward from the midsection of the starboard wing. It is composed of three orthogonal coils and measures (a) the total field strength of the EM field, and (b) the quadrature which is defined as the phase difference between the vertical coil and either one of the horizontal coils. The quadrature polarity is defined by the direction of flight, routinely normalized to north or east headings. The total field magnitude is insensitive to antenna orientation in pitch, roll and yaw.
The VLF-EM system measures two frequencies simultaneously so as to allow two transmitters to be selected to ensure good coupling with the target conductors. The "LINE" transmitter (Channel 1) is located ideally at right angles to the flight lines such that the transmitted energy will couple well with the stratigraphy. In this case the recorded quadrature is the phase difference between the vertical coil and the "along line" or LINE coil. The "ORTHO" transmitter (Channel 2) is ideally located along the flight lines or along the direction of cross-faulting, and the recorded quadra ture is the phase difference between the vertical coil and the "across line" or ORTHO coil.
Although total field and quadrature data are recorded from both Channels, only the data from Channel l are routinely processed and plotted. The data from the Channel 2 are available for processing if requested. Whenever the transmitters are shut down for main tenance the next most suitable transmitter is selected.
The specifications of the VLF-EM system are:Frequency Range Sensitivity Range
Accuracy: Reading Interval: Model: Manufacturer:
Other instruments are:
15kHz to 25kHz for each channel130uV to lOOmV m at 20kHz3dB down at 14kHz and 24kHzi\0.2 secondTOTEM 2AHerz Industries, Toronto, Canada

'RACE 1: RAO Full Scale: 180.000 ft *
TRACE 2: Vl-I Full Scale: 200.000liiul
TRACE 3: Vl-Q Full Scale: 200.000 Z *I...,!....!..,...,]....,.,,!. ,,.I....I.....J....I....I....l,
TRACE 4: V2-I Full Scale: 200.000 l,,,, l,, ,. l, , ., l
TRACE 5: V2-Q Full Scale: 200.000 t *l j i i i l i i i - l i i i i l i i i i l i i -..-t- - ,., J— ̂ j , l . . . , ! . , , . l . . . . l .
TRACE 7: MAGI Full Scale: 875.000 nTl i i . i l i i i i l i . , i l i i i i l , , . , l , . . . ! , . . . ! . -, , L-
TRACE 9: MAC2 Full Scale: 875.000 nT
TRACE19: MAGI Full Scale: 8.750 nT /B T-GR1l , i i . l . , i i ! i t , , ! i . . i l i i , . l . .
Line : 750,ON Time: 14:14: 5.0 Start Fi4: 420 File: S9091014.B13
FIGURE 3. SAMPLE OF ANALOG DATA

King KRA-10A radar altimeterPDAS-1000 data processor with 40 mByte cassette tape and 3 1/2" disk recorder manufactured by Picodas Group Inc. Trimble TRANS OPS satellite navigationVideo tape flight path confirmation, 1/lOth second fiducial intervals and with electronic attitude compensa tion
4.2 Lines and Data
Total survey area................. .176 kilometresClaim group coverage...............135 kilometresLine direction.....................360 degrees azimuthLine interval......................100 metresTie line interval.................. 2 kilometresTerrain clearance...................90 metresAverage ground speed...............193 kilometres/hourData point interval:
Magnetic..................11 metresVLF-EM....................11 metres
Channel l ("LINE" Transmitter).........NAA Cutler, 24.0 kHzChannel 2 ("ORTHO" Transmitter)........NSS Annapolis, 21.4 kHzFLIGHT LOG:
July 20 flight U-269, partly cloudy
4.3 Tolerances
Line spacing: Any gaps wider than twice the line spacing andlonger than 10 times the line spacing were filled in by a newline.
Terrain clearance: Portions of line which were flown above 125metres for more than one kilometre were reflown if safetyconsiderations were acceptable.
Diurnal magnetic variation: Less than ten gammas deviation froma smooth background over a period of two minutes or less asseen on the base station analogue record.
Manoeuvre noise: nil
4.4 Navigation and Recovery
The satellite navigation system was used during periods of satel lite visibility to ferry to the survey site and to survey along each line using UTM coordinates. The accuracy is variable depend ing on the number and condition of the satellites; however it is less than twenty five metres and typically in the ten to fifteen metre range.
For assisting the navigation of the aircraft and the recovery of
\
c5
oo

the flight path, semi-controlled mosaics of aerial photographs were made from, existing air photos. Each photograph forming the mosaic was adjusted to conform to the NTS map system before the mosaic was assembled. These mosaics are also used as a base for the data and interpretation maps and thereby allow detailed ground locations for follow-up investigations and further mapping.
Flight path recovery was also carried out in the field using a video tape viewer to observe the flight path as recorded by the Geocam video camera system. The flight path recovery was completed daily to enable reflights to be selected where needed for the following day and to provide correlation between the satellite navigation/recovery data and the photomosaic base maps.
5 .0 DATA PRO C ES SING
The total field magnetic data was calculated using the magnetic values sampled from the port magnetometer. The magnetic values were levelled in the standard manner by tying survey lines to the control lines. Standard cubic spline gridding of the levelled data at 2.5 mm grid cell spacing at map scale and subsequent contouring were then performed.
The vertical magnetic gradient is computed from the gridded and contoured final total field data using a method of transforming the data set into the frequency domain, applying a transfer function to calculate the gradient, and then transforming back into the spatial domain. The method is described by a number of authors including Grant, 1972 and Spector, 1968. The computer program for this purpose is provided by Paterson, Grant and Watson Ltd. of Toronto.
The VLF data was treated automatically so as to normalize the non conductive background areas to 100 (total field strength) and zero (quadrature). The algorithms to do this were developed by Terra- quest and will be provided to anyone interested by application to the company.
All of these data processing calculations and map contouring were carried out by Dataplotting Services Inc. of Toronto.
Grant, F.S. and Spector A., 1970: Statistical Models for Inter preting Aeromagnetic Data; Geophysics, Vol 35
Grant, F.S., 1972: Review of Data Processing and Interpretation Methods in Gravity and Magnetics; Geophysics Vol 37-4
Spector, A., 1968: Spectral Analysis of Aeromagnetic maps; un published thesis; University of Toronto.

6.0 INXERJ?REXAXION
6.1 General Approach
To satisfy the purpose of the survey as stated in the introduction, the interpretation procedure was carried out on both the magnetic and VLF-EM data. On a local scale "geological" units were inter preted from the magnetic gradient contour patterns based on their characteristic patterns and intensities, or "signatures". The contacts are typically located along the steepest section of the gradient; therefore the vertical magnetic gradient format was used primarily to delineate stratigraphy. The total magnetic field format was used to determine the relative magnetic intensity of the interpreted unit. Where possible these units were related to existing geology (known outcrops) to provide a geological identity to the units.
Magnetic anomalies that are caused by iron deposits of ore quality are usually obvious owing to their high amplitude, often in tens of thousands of gammas. Mafic to felsic metavolcanics are usually characterized by respectively strong to weak magnetic intensities. Clastic metasediments generally possess very low concentrations of iron bearing minerals and therefore correlate with very low magnetic responses. In some cases, the weak responses from the metasediments are overwhelmed by the magnetic fields from the surrounding lithologies.
Alteration zones can show up as anomalously quiet areas, often adjacent to strong, circular anomalies that represent intrusives, or along an otherwise magnetically active horizon. In some cases contact metamorphic aureoles are characterized by magnetic anom alies .
On a regional scale the total magnetic field contour patterns were used in the same way to delineate bodies of larger dimensions.
Faults and shear zones were interpreted mainly from lateral displacements of otherwise linear magnetic anomalies but also from long narrow "lows". The direction of regional faulting and the topographic lineaments in the general area were taken into account when selecting the dominant fault orientations. Folding is usually seen as curved regional patterns.
VLF-EM anomalies are evaluated according to a) the relative intensities of the total field strength, b) correlation of the total field strength with magnetic, geologic and topographic features, and c) the intensity and nature of the quadrature or phase response.
Areas showing a smooth VLF-EM response somewhat above background (ie. 110 or so) are likely caused by overburden which is thick

FIGURE 4
TERRAQUEST CLASSIFICATION OF VLF-EM CONDUCTOR AXES
SYMBOL
a , A
b, B
c , C
d f
DF
ob, OB
cul , CUL
CORRELATION
Coincident with magnetic stratigraphy
Parallel to magnetic stratigraphy
No correlation with magnetic stratigraphy
Coincident with magnetic dykeCoincident with topographic lineament or parallel to fault system
Contours of total field response conform to topographic depression
Coincident with cultural sources
ASSOCIATION: Possible Origins
Bedrock magnetic horizons: stratabound mineralogic origin or shear zone
Bedrock non-magnetic horizons: stratabound mineralogic origin or shear zone
Association not known: possible small scale stratabound mineralogic origin, fault or shear zone, overburden
Dyke or possible fault: mineralogic or electrolytic Fault zone: mineralogic or electrolytic
Most likely overburden: clayey sediments, swampy mud
Electrical, pipe or railway lines
NOTES
1 - Upper case symbols denote a relatively strong total field strength2 - Underlined symbols denote a relatively strong quadrature response3 - Mineralogic origins include sulphides, graphite, and in fault zones, gouge4 - Electrolytic origins imply conductivity related to porosity or high moisture content
240 Adelaide Street WeM. Toronio. Canada MSH l W7. Telephone 14 Ifi) 971 -54(X). f M 1 4 Ifi) W l -

enough and conductive enough to saturate at these frequencies. In this case limited response from bedrock is seen.
The VLF-EM conductor axes have been identified and evaluated according to the Terraquest classification system (Figure 4). This system correlates the nature and orientation of the conductor axes with stratigraphic, structural and topographic features to obtain an association from which one or more possible origins may be selected. Alternate associations are indicated in parentheses.
The phase response has been categorized according to whether the slope/direction is normal, reverse, or no phase at all. The significance of the differing phase responses is not completely understood although in general reverse phase indicates either overburden as the source or a conductor with considerable depth extent, or both. Normal phase response is theoretically caused by surface conductors with limited depth extent. In some cases, a change in the orientation of the conductor appears to affect the sense of the phase response.
The VLF-EM data from Channel l has been processed; the data from Channel 2 has been recorded and can be processed upon request.
6.2 Interpretation
The magnetic and VLF-EM data are shown in contoured format on maps at a scale of 1:10,000 in the back pocket. An interpretation map is also provided. The following notes are intended to supplement these maps.
The total magnetic field has a relief of approximately 500 gammas and shows several strong, well defined anomalies, a few weak, poorly defined trends, and broad expanses of low, relatively uniform magnetic values. The vertical magnetic gradient shows improved resolution of the anomalies and has been used to delineate the stratigraphy and structure.
The broad expanses of weak, relatively uniform magnetic values correlate with the Lorrain Formation (Unit 6) and the Gowganda Formation (Unit 5). These are typical responses for sedimentary lithologies.
The strong magnetic values coincide with the Nipissing Diabase Sill (Unit 7). Generally there is a good correlation with the current geological mapping with a few prominent exceptions. Along the southwestern edge of the survey area, between Kitt and Second Justin Lakes a strong anomaly coincides with sedimentary rocks. Also, in the northwest corner of the survey strong responses were recorded over sedimentary rocks. In these locations the Nipissing Diabase Sill probably occurs close to the surface beneath the sedimentary rocks.
8
The moderate to weak anomalies are also probably associated with the diabase sill, perhaps at. greater depth, less total volume, or with different composition. For example the weak anomaly south of Edison Marsh is associated with outcrops of diabase that appears to be similar in composition to the main sill, therefore it is interpreted to have limited thickness. Other minor occurrences of the diabase sill are interpreted from the magnetic data.
The airborne survey has identified a major, northwest trending fault that passes through Edison Marsh and is referred to here as the Edison Marsh Fault. This structure can be interpreted from both the magnetic and VLF-EM data and is coincident with a prominent lineament that can be identified on both the air photos and the topographic map. It extends well beyond the survey area and i s probably related to the same deformational event that was responsible for the Latchford and Montreal River Faults.
Interpretation of the magnetic data suggests that this fault has an upthrown component on the west side and a minor dextral com ponent. The fact that it has VLF-EM conductivity suggests that it may be an open or porous structure capable of hosting water or mineralization. Weak magnetic signatures along the structure may indicate that diabase has been intruded along this zone of weak ness. Consequently all structures should be investigated for possible diabaseic intrusives.
Other less extensive structures with similar orientation have been interpreted from the magnetic data. Several northeast trending faults or shear zones displace the diabase sill.
Numerous weak conductors have been identified from the VLF-EM survey. Three correlate with the edges of lakes and are inter preted to be related to conductive overburden. Surficial conduct ivity appears to be confined to topographic depressions.
Most of the conductor axes are associated with structures. These may be caused by (a) minerals such as graphite, sulphides or gouge, or (b) an ionic effect created by water or porosity within the structure or along the upper weathered and leached edge.
Some correlate with the edges of the diabase sills and may be related to either a structural type source along the zone of weakness or more importantly to mineralization within the diabase. As this is the habit of most of the mineralization in the region, these conductors should be investigated thoroughly on the ground using EM or IP techniques. All three past producing mines occur along the same diabase sill and are close to major cross structures and VLF-EM conductivity.

7.0 SUMMARY
An airborne combined magnetic and VLF-EM survey has been carried out at 90 metre mean terrain clearance with 100 metre line inter vals and with data reading stations at 11 metres along the flight lines. All data is produced on maps at a scale of 1:10,000.
The magnetic data has been used to modify and update the existing geology and has shown a number of areas with potential for buried diabase sill beneath the Lorrain and Gowganda Formations. Several minor structures and a one major fault have been interpreted. The intrusion of the diabase may be related to zones of weakness as controlled by the faults, therefore all structures should be investigated for potential diabase.
Numerous weak VLF-EM conductor axes were found most of which are associated with structural sources. Some are coincident with the edges of the diabase intrusives and possess good potential for precious or base metal mineralization.
XERRA.QUEST LTD.
Charles Q. Barrie, M.Se. Geologist

10
PERSONNEL
Field:
APPENDIX I
Operator...........Andre RoyPi lot.. . .. . . . . . ....Ken TowersDataman............Michel RoyCompletion Date....July 20, 1990 5
Office: Manager............Roger Watson, P.EngProcessing.........Dataplotting Services Inc,Interpretation.....Charles Barrie, M.Se.
oS

li
APPENDIX II
CERTIFICATE OF QUALIFICATION
I, Charles Q. Barrie, -certify that :
1. I am registered as a Fellow with the Geological Associa tion of Canada and work as a Professional Geologist.
2. I hold an honours B.Se. degree in Geology from McMaster University, obtained in 1977.
3. I hold an M.Se. degree in Geology from Dalhousie Univers ity, obtained in 1980.
4. I am a member of the Prospectors and Developers Associa tion of Canada.
5. I have been working continuously as a geologist in the mineral industry for ten years.
6. I reside at 1373 Queen Victoria Avenue in the city of Mississauga, Ontario, L5H 3H2.
7. I am employed by and am an owner of Terraquest Ltd., specializing in high sensitivity airborne geophysical surveys.
8. The accompanying report has been prepared from airborne data collected by Terraquest Ltd. exclusively for WINSLOW GOLD CORP.. Reference material included geological maps published by the provincial government. I have not visited the property.
9. I have no interest in the property described nor the immediate area of the claims.
Toronto, Ontario September 10, 1990
Signed, ^
_ 2 . Barrie, M.Se. Vice President, TERRAQUEST LTD,

910800 /3VDevelopment
Mining ActReport of Wort(Geophysical, Geological and Geochemi
aiMessweaet 2.M837 COLEMAN 900
Type of Surveyd) 1 Mining Omawn Tow** or AreaAirborne Magnetic and VLP-EM Larder Lake Coleman Town.h^T"**1" *~? /s ^Gerald N. Ross -*T. /4~ r?
1290 P 112 -
^*^fc t^^**JJ^ PlMptCNOf S L4C9AC0 MO.
f f C 36800ToUphMwNo.
4th Avenue SW. . ralaarv. An TOO nu? 14031 ^fti.ciciSurvey Company
Terraquest Ltd.Name and Addreu of Author (of Geo-Technical Report)
C. Barifie, 240 Adelaide St. West, Toront. ON MCredits Requested per Each Claim In Columns at rightSpecie) ftovtekme
For fcM aurvay:
Enter 40 day*. (ThU mctude*
For each additional turvey:uetag tie tame grid:
Enter 20 dayi (for each)
ManOaya
enter toui(t) hne tide and •re
AhvOvrto CfedNa
credlti do not apply to Airborne Survey*.
Geophyiical
• Electromagnetic
- Magnetometer
•Other
Geological
Geochemical
Geophyiical
• Electromagnetic
. Magnetometer
•Other
Geological
Geochemical
Electromagnetic
Magnetometer
Other S*
Dsir
Osir
"ST4040' )
Total miles flown over claim(s). f JDate
MarchCertification
25/91Verifying lSAA/VT* ft! MJfwlt
Mning Claims TraversedMrtngdeim
Prefa Number
J
Da* t* tufvw SH 1W7 d0, H7 , ^5T S a7, vUst in numerical sequence)
MMngCtaimPrefa Number
Mining ClaimPrefa
SEE ATTACHE^
SCHEDIIT.T? ' A"
RFf
'APR
-
*FI\
?t9 1!
MINING LANuoTotal number ofmining cleimi oovered by this ftport d wortt
NufhMf
ED ——
91,i)iM
91
1 hereby certify that 1 have a penonai and intimate knowtedpe of the feet* eel forth in thfc Report of Work, having performed e* work or wtneeted lame during end/or after Hi completion and annued report li true. ^~*\Name and Addreie of Penon CertifyingGerald N. Ross, 1290, 112 - 4th Avenue SH.
t Telephone Na. 403) 264-6161
For Office Use Only
Total Days Cr Recorded
-UJ0
Date Recorded
/YXi ^^ t
Mining Recorder .̂.^J)
r\. \~*?ii k K C\^. l .1 tciCOU;
Dal* Aprxovtd as nicofdtd Ptfv&f^pintQei. Mmir
^eZ^J f̂af^C
igiends^* t'iJ
-* *^ (p *^
, Calgary, AB T2P OH3 /^ yOwe CerMtod *y (Wature) ./^March 25/91 X*VY r-^CT
RECEIVE!LARDER LAX
MINING DIViSI
).eON
MAR ^9 ice, ^"
J TJMC q.s;r^^^Q2^^

rBCHEDULK X
SCHEDOLg OF MIKjttMi GLXTMfl
COLEMAN TQWMBHIP. PRQVIIIOB OF QOTXMQ
1. L1154446 thru IA1544612* L1154462 thru L11544753. L1154476 thru L11544914. L1154492 thru L11545055. L1154506 thru L11545176. L1154518 thru L1154S257. L1131868 thru L113^1881
i
16
14
13
14
12814
91
Gerald N. Gerald N. ROBS Gerald H. ROBS Oerald N. Ross Gerald H. Ross Gerald H. Ross Gerald N* Ross
(i) excepting claims L1154479, LU54480 and L1154482
MIKING DIVISION

Northern Development, and Mines
DOCUMENT No.W9108.QQ.3S
Report of Work ' ' Mining Act (Geophysical, Geological and Geochemical Surveys)
- n**ae type or print.- Aetor tt S*cMn 77, ** Mmng Aa tor tMWnwn work r*qu**m*M* nd mwwnum crtdM Mow*0 p*r *urv*y typ*.
- R numb* ol mining dftrn* trMtrxd **c**d* ip*c* on (nil toon. tt*cti*k*
- TKMctf ftapon* *nd imp* m dupic*M thouU M tutmrM to Mmmg Undt faction. MMWH 0*v*topm*M *od Und* fnnch:
Type ol Survey**)
Airborne Magnetic and VLF-EMRecorded Hdderts)
Gerald N. Ross ^1290. 112 - 4th Avenue SW. . Calemrv.
Survey Company
Terraquest Ltd.
Mining Owieion Townehip or Are* ~
Larder Lake Kittson Township
J0& J? /* C 36800r TetopnontNo.
AB T2P OH5 (403) 264-61fil
Name and Address o* Author tot Gee-Technical Report) Del* el Survey (kw
C. Barrie, 240 Adelaide St. West. Toront, ON M5H 1W7 oi0i H7 i *PCredits Requested per Each Claim in Columns at rightSpade* rfovHtona
For Drat survey:
Enter 40 day*. (This include* line culling)
For each additional survey: uemg the tame grid:
Enter 20 day* (kx each)
Men Day*
Complete reverse side and enter toiaK*) here
Airborne Credit*
No**: Special provWon*credits do nw apply to Airborne Survey*.
Geophysical
- Electromagnetic
- Magnetometer
•Other
Geological
Geochemical
Geophysical
- Eleclromagnelic
- Magnetometer
• Other
Geological
Geochemical
Electromagnetic
Magnetometer
Other
Total miles flown over claim(s).s
"sir
Ogar
"sir4040^~ A
S 1March 25/91 j X*vV r^Z
Mining Claims TraversedMining Claim
Prefix Number
1 * ̂ *f :
List in numerical sequence)Mining Ctoint
Prefix
f
~
-
NumberMining Claim
Preflx
SEE ATTACHED
SCHEDULE 1A"
- "rj
Number
——— ' l'APR ?. Q fW1
|MINING LANDS SECT
Total number of mining eWm* covered by thl* report el work.
ION43
Certification Verifying Report o( Work
1 hereby certrry thai 1 have t personal and Wimate knowMg* ol m* (act* Ml tor* in In* Report ol Work, having performed Ih* work or wttneued Mm* during ter Ms compwiofl *nd annexed r*pon i* Iru*.Name and Addieat ol Peraon C*rtifying
Gerald N. Ross, 1290, 112 - 4th Avenue SW., Calgary, AB T2P OH3T*Kphoo*NB.
(403) 264-6161 March 25/91CertMed *y Mnature)
Received Stamp
For Office Use Only
loiiil 5Yy* Cr Record**]
Date Recorded
Date A^ *.p;?ftd as Recorded
Mining Recorder
. Mining lands
RECEtVEOIAROBRLAK6
MINING DIVISION
MAR Z& 1VV1
, ....

/"'.L- bieo. #^3SJ
gCHBPVM PT MUBIUft ClAIMi
gltTSOK TftWyBHIP, PRQVlNCt Of OKTKRXO
Qlaip Number
7 Gerald N, Ross lt LH32400 thru LH32406 Gerald N. ROSS2 . LU32439 thru U132449 Gerald N. Ross3. L1132407 thru L1132417 Gerald K. Ross4. LU32425 thru LU32438 "
43

Winslow Gold Corp.Suite 1290, 112 - 4th Avenue S. W., Calgary, Alberta T2P OH3
Telephone: (403) 264-6161 Fax: (403) 266-3069
May 24, 1991
JUN O 3 1991
MINING LANDS SECTION Mining Lands4th Floor, 159 Cedar StreetSudbury, Ontario x /~v O f^ P3E 6A5 2 ' l 4 O O 4
ATTENTION: Mr. Larry Btoliker
Dear Sir:
RE: Latchford S Kittson Projects Technical Maps Your File No. 2.14037
Please find enclosed original copies of Terraquest Ltd. 's technical maps pertaining to the July 20, 1990 High Sensitivity Magnetic and VLF-EM Airborne Survey conducted over the Latchford and Kittson project claims. The maps enclosed are as follows:
1. Airborne Magnetic Survey - Total Magnetic Field;2. Airborne Magnetic Survey - Vertical Magentic Gradient;3. Airborne VLF-EM Survey - Contours of Total Field Strength;4. Interpretation.
A duplicate set of maps will be forwarded in another six weeks or so if requested. We are currently in the process of tracking down the mylars from which to make additional copies. In the meantime, it would be appreciated if our Latchford and Kittson project filings could be formalized with just the one set of maps.
Kindly advise the undersigned if this is possible and if a second set of maps is definitely required.
Yours very truly,
WINSLOW GOLD CORP.
r^A^-^ l^-n^?ST--r.~Lt^kt~
Ketan Panchmatia Controller

Winslow Gold Corp.Suite 1290, 112 - 4th Avenue S. W., Calgary, Alberta T2P OH3
Telephone: (403) 264-6161 Fax: (403) 266-3069
June 12, 1991
Mining Lands4th Floor, 159 Cedar StreetSudbury, Ontario *fy/) 'P3E 6A5 *bATTENTION: Mr. Larry Stoliker x
Dear Sir:
RE: Latchford fi Kittson Technical Maps Your File No. 2.14037
Latchford fi Kittson Projects f\ -i /L 6\ Technical Maps fr f JL ^ "
Please find enclosed a second set of original copies of Terraquest Ltd. 's technical maps pertaining to the July 20, 1990 High Sensitivity Magnetic and VLF-EM Airborne Survey conducted over the Latchford and Kittson project claims. The following maps are enclosed:
1. Airborne Magnetic Survey - Total Magnetic Field;2. Airborne Magnetic Survey - Vertical Magnetic Gradient;3. Airborne VLF-EM Survey - Contours of Total Field Strength;4. Interpretation.
The first set of maps was forwarded to your office on May 24, 1991.
I understand that you are now in receipt of all the necessary documents required pursuant to our Latchford and Kittson project filings.
Yours very truly,
WINSLOW GOLD CORP.
Ketan Panchmatia Controller

Winslow Gold Corp.Suite 1290, 112 - 4th Avenue S.W., Calgary, Alberta T2P OH3
Telephone: (403) 264-6161 Fax: (403) 266-3069
May 2, 1991
RECEIVEDMining Lands4th Floor, 159 Cedar StreetSudbury, Ontario MAY l 3P3E 6A5Dear Sir/Madam: MINING LANDS
RE: Terraquest Ltd.Latchford s Kittson Projects Technical Maps
Please find enclosed, in duplicate, copies of Terraquest Ltd."s Technical Maps pertaining to the July 20, 1990 High Sensitivity Magnetic and VLF-EM Airborne Survey conducted over Latchford and Kittson project claims.
Report of Work forms pertaining to the aforementioned Survey were filed with the Mining Recorder's office in Kirkland Lake on March 25, 1991. The Technical Reports pertaining to same were filed with your offices on March 27, 1991.
Should you have any questions regarding the enclosed, please do not hesitate to contact the undersigned.
Yours very truly,
WINSLOW GOLD CORP.-V .
Ketan Panchmatia Controller
Encl.
KP/jlw

Winslow Gold Corp.Suite 1290, 112 - 4th Avenue S.W., Calgary, Alberta T2P OH3
Telephone: (403) 264-6161 Fax: (403) 266-3069
March 27, 1991 RECEIVED
APR O 4 1991
Mining Lands M|N|NG LANDS SECTION 159 Cedar Street 4th Floor Sudbury, Ontario P3E 6A5
Dear Sirs:
RE: Technical Reports and NapsTerraguest Ltd.'s Latchford and Kittson Project on behalf of Gerald N. Ross
Please find enclosed, in duplicate, copies of Terraquest Resources Ltd. "s ("Terraquest") High Sensitivity Magnetic and VLF-EM Airborne Surveys on the Latchford and Kittson projects.
Terraquest conducted these surveys on behalf of Gerald N. Ross, the registered owner of the claims covered in Terraquest 's report. The surveys were conducted on July 20, 1990 over various claims in the Coleman and Kittson townships, Larder Lake mining division. The maps pertaining to same will follow under separate cover.
Please be advised that the Report of Work forms have been filed with the Mining Recorders Office in Kirkland Lake.
If you should have any questions, please do not hesitate to contact the undersigned.
Yours very truly,
WINSLOW GOLD CORP.
Ketan Panchmatia Controller
Encl.
KP/jlw

TOWN
K W23 REFER TO CLAIM MAP
OF COLEMAN
J ^ C
BRIGSTOCKE^ TOW
Ministry ofNaturalResources
Ontario
Ministry of Northern Devetopme and Mines QCOlogy re! erence-COBALT
RESIDENT GEO
INDEX TO LAND DISPOSITION
PLAN
G-3434TOWNSHIP
KITTSON
YI.N.R. ADMINISTRATIVE DISTRICT
TEMAGAMIMINING DIVISION
LARDER LAKELAND TITLES/REGISTRY DIVISION
TIMISKAMING
Scale 1:20 000
1000 1000 2000M*tr*t
1000
Metre*
1000 2000 3000 4000 5000 MOO 7000 1000 9000 10000 ^——rrr^zj Feet
Contour Interval 10 Metres
SYMBOLSBoundary
Township, Meridian, Baseline.
Road allowance; surveyed shoreline.
Lot/Concession; surveyed.,.,.... unsurveyed ,....,y
Parcel; surveyedunsurveyed
Right-of-way; roadrailway utility.
Reservation
Cliff, Pit, Pile
ContourInterpolated Approximate ......,..Depression...........
Control point (horizontal) . . . . . . . . . . . . . . . . . . . . . . . A
Flooded land . . . . . . . . . . . . . . . . . . . . . . . ~ "-i--~:---~~ii-~
Mine head frame . . . . . . . . . . . . . . . . . . . . . . . . . . . . . . . a
Pipeline (above ground) . . . . . . . . . . . . . - — -
Railway; single track. . . , . . . . . . . . . . . . " — -- * —— —double track . . . . . . . . . . . . . . . -^ —— ~ —— i-1--abandoned. . . , . . . . . . . . . . . . -1 — - — ' — - ~t~
Road; highway, county, township . . . . . = -access . . . . . . . . . . . . . . . . . . . . . . " : "trail, bush. . . . . . . . . . . . .. . . . . . . ---— — -- -
Shoreline (original). . . . . . . . . . . . , . . . . . - - 1 ••-"""" -- - ••~.
Transmission line . . . . . . . . . . . . . . . . . . ,
area.
DISPOSITION OF CROWN LANDSPatent
Surface St M ining Rights ... ... .... ........... .0Surface Rights Only......................... .ftMining Rights Only.................... ...... . 3
LeaseSurface A Mining Rights .................... .BSurface Rights Only Mining Rights Only.
Licence of Occupation ...................,...... V
Order-in-Council. .... ... .. ... ... ............. . .OC
Cancelled ...... .. ... .. ... ....... ........ ..... ®
Reservation. ..... .. ..... .. ...... ............ . w
Sand S Gravel.............. .................. ^
Hy
CIRCULATED MAY 3/88
AREAS WITHDRAWN FROM DISPOSITION
MRO- M ining Rights OnlySRO- Surface Rights OnlyM + S - Mining and Surface Rights
De*c-"lpllon Order No. Dale Dtepoaftloo Ftto
LO 7439 249*3
FLOODING ON LADY EVELYM LAKE TO CONTOUR ELEVATION 948.46
SURFACE RtOHTS ON ALL CROWN LAND IN THIS TWP. flOSPECTING^TAKIHG OUT. SALE OR LEASE SEC*ON 3* R.S.O 1980 OTOER W-M^2 EFFECTIVE IU5/K.
**PART OF OROCR W-W-62 RE-OPENEC ORDER O-ML01-90 MER EFFECTIVE APRL 3 AT 7 AM E.S.T.
THE INFORMATION THAT APPEARS ON THIS MAP HAS BEEN COMPILED FROM VARIOUS SOURCES, AND ACCURACY IS NOT GUARANTEED. THOSE WISHING TO'STAKE MIN ING CLAIMS SHOULD CON SULT WITH THE MINING RECORDER, MINISTRY OF NORTHERN DEVELOP MENT AND MINES, FOR AD DITIONAL INFORMATION ON THE STATUS OF THE LANDS SHOWN HEREON
"THIS MAP SHOWS THE APPROXIMATE LOCATION OF THE BOUNDARIES OF THE AREA WHICH IS THE SUBJECT OF CURRENT LITIGATION. THE EXACT LOCATION WILL BE SHOWN FOLLOWING CONFIRMATION BY THE PARTIES TO THE ACTION."
DATE Of ISSUE
LARDER LAKE MINIMS RECORDER'S OFBCE
Map base and land disposition drafting by Surveys and Mapping Branch, Ministry of Natural Resources.
The disposition of land, location of lot fabric and parcel boundaries on this index was compiled for administrative purp"^-^ only.

MSI
.")?
MSN
03-
CO
RK
ILL
.?9
KX
OO
oe
ICI3
230
|! II
358O
51
- ..-.
-d ^
,- —
UJ^-i--
. -
L . -
L r
h" - -
'
* —— X
l
_ _
—.
— iL
-jA
r_ _
—
• -•^
^f
-M2S
230
j 11
2622
6
l——
—I^
M-J
IJV
."
l .
lSK
1****
* V
--
-___
---4-
FOR
STA
TUS
OF
LAN
DS
RE
FE
R
TO
KIT
TS
ON
TO
WN
SH
IP M
AP
_____i
——
_
'^ii^^
\ i
5R
L406
l U
f
'
IOI3
0DI
JS
52
'
KMBI
OO
'
l 11
3582
0F
ILL
ER
S
ISLA
ND
or t a
ae
Ba
v
. \
J; -
t '^-'
T t
l L
l --
,__
__
__
_U
f--L
__
— L
.____l_
____!_
___
l__
Pi
J~
" ~
—
f'-—
-L,
,, IO
I3I9
!
-
t-
—
SYM
BOLS
Bou
ndar
yTo
wns
hip.
Mer
idia
n. B
as
elin
e...........
\T-H
3A50
G.
Roa
d al
low
ance
; su
rvey
ed
shor
elin
e
Lot/C
once
ssio
n;
surv
eyed
, un
surv
eyed
Parc
el;
surv
eyed
eaoo
oft z
aboo
c. ea
oooc
aao
o*t
unsu
rvey
ed ...
....
....
....
....
....
....
.. —
——
——
—
Rig
ht-o
f-way
: roa
dra
ilway
uti
lity....
......
.^..
......
......
....
^^
Res
erva
tion
Clif
f, Pi
t, Pi
le
Con
tour
...
....
....
....
....
....
....
....
....
....
...
Inte
rpol
ated
App
roxi
mat
eD
epre
ssio
n.
LA
.TC
H F
OR
D
AR
EA
S W
ITH
DR
AW
N F
RO
M D
ISP
OS
ITIO
N
MR
O -
Min
ing
Rig
hts
Onl
yS
RO
- S
urfa
ce R
ight
s O
nly
M +
S -
Min
ing
and
Sur
face
Rig
hts
Con
trol p
oint
(hor
izon
tal)
......
......
......
....
......
......
....
Floo
ded la
nd....
......
......
......
......
......
.,.. i
-i-i-l
-i-i-;
-i-c-
i-c
Min
e he
ad fr
ame
...............,...............,.............. a
Pip
elin
e (a
bove
gro
und)
,.
Rai
lway
; si
ngle
trac
k
doub
le tr
ack
aban
done
d
23
/7/8
4
S.R
.O.
16/3
/64
.SB
tt
Min
istr
y of
M
inis
try o
fN
atur
al
Nor
ther
n D
evel
opm
ent
Res
ourc
es
and
Min
esST
ATUS
OF,
LAND
S
"-'^
KIT
TSO
N T
OW
NSH
IP M
AP
Cro
wro
ck
. B
ay
liFtf
"
Roa
d; h
ighw
ay, c
ount
y, to
wns
hip
acce
ss
trail,
bus
hIN
DE
X T
O L
AN
D D
ISP
OS
ITIO
NT
HIS
MA
P S
HO
WS
TH
E
AP
PR
OX
IMA
TE
LO
CA
TIO
N
OF
TH
E B
OU
ND
AR
IES
OF
THE
AR
EA
WH
ICH
IS
THE
Shor
elin
e (o
rigin
al)
Tran
smis
sion
line
Woo
ded
area
M.N
.R. A
DM
INIS
TRA
TIVE
DIS
TRIC
T
TE
MA
GA
MI
MIN
ING
DIV
ISIO
NG
-3418
FLO
OD
ING
O
N
MO
NT
RE
AL
RIV
ER
T
0
CO
NT
OU
R
ELE
VA
TIO
N2
77
.37
m
EY
O
NT
AR
IO
HY
DR
O
FR
OM
H
OU
ND
C
H'J
TL
T
OT
OW
N
OF
LA
TC
HF
OR
D .
L.O
. 715:
IAR
DF
R
IAK
-F
SU
BJE
CT
OF
CU
RR
EN
TLA
RD
ER
LA
KE
L1
TIG
ATIO
N. T
HE E
XAC
TU
NO
TIT
LES/
REG
ISTR
Y DI
VISI
ON
LO
CA
TIO
N W
ILL
BE
MIN
ING
CLAI
MS
ON
CLEA
R LA
KE
ETC.
SU
B*;E
CT
TO
'/.'AT
E R
RESE
RVAT
ION
TO
TOW
N OF
CO
BALT
OLE
MA
NT
IMIS
KA
MIN
GS
HO
WN
FO
LLO
WIN
G
CO
NF
IRM
AT
ION
BY
TH
E
PA
RTI
ES
TO
TH
E A
CT
ION
.N
OT
ICE
O
F F
OR
ES
TR
Y A
CT
IVIT
YTH
IS T
OW
NS
HIP
l
AR
EA
FA
LLS
WIT
HIN
TH
E
llT̂̂
l^JiA
J^G
F^E
NT
jJN
F _
__
__
__
__
__
__
*
NJ?
??A
Y B
?
SU
BJE
CT
TO
FO
RE
S^
R^
O^
ET
iAT
ioN
S.
AT
:
DISP
OSI
TIO
N OF
CRO
WN
LAND
SB
RIG
ST
OC
DATE
OF I
SSUE
Pat
ent
Sur
face
A M
inin
g R
ight
s S
urfa
ce R
ight
s O
nly
Min
ing
Rig
hts
Onl
y
Leas
eS
urfa
ce fi
Min
ing
Rig
hts
Sur
face
Rig
hts
Onl
y M
inin
g R
ight
s O
nly
Lice
nce
of O
ccup
atio
n ..
....
....
....
...,
....
....
....
....
..,.
.. .T
Ord
er-
in-C
ou
nc
il..
.,..
....
....
....
....
...
....
. .
OC
FO
R T
HIS
AR
EA
CA
N B
E
APR
15 1
991
P.O
. B
OX
38
LA
KE
SH
OR
E D
RIV
E
"EM
AG
AM
I, O
N~
.LA
RDER
LAK
E M
ININ
G RE
CORD
ER'S
OFFIC
EC
on
tou
r In
terv
al 1
0 M
etre
*
31M
05S
W00
01
2.1
4037
CO
LEM
AN
10
705
-569
-362
2
TH
E
INF
OR
MA
TIO
N
TH
AT
A
PP
EA
RS
O
N
TH
IS
MA
P
HA
S
BE
EN
C
OM
PIL
ED
F
RO
M V
AR
IOU
S S
OU
RC
ES
A
ND
A
CC
UR
AC
Y
IS
NO
T
GU
AR
AN
TE
ED
. T
HO
SE
W
ISH
ING
T
O
ST
AK
E
MIN
IN
G C
LA
IMS
SH
OU
LD
CO
N
SU
LT
W
ITH
T
HE
M
ININ
G
RE
CO
RD
ER
. M
INIS
TR
Y
OF
N
OR
TH
ER
N
DE
VE
LO
P-
ME
NT
AN
D M
INE
S.
FO
R A
D-
OP
TIO
NA
L
INF
OR
MA
TIO
N
ON
T
HE
S
TA
TU
S
OF
T
HE
L
AN
DS
SH
OW
N H
ER
EO
N
geol
ogy
refe
renc
e-C
OB
AL
l

220
LEGENDSurvey Altitude ljn Line S pacing Survey Boundary
TOTAL MAGNETIC FIELD
1 { \ f \ '
GENTRY RESOURCES LMITED
AIRBORNE MAGNETIC SURVEYTOTAL MAGNETIC FIELD
LATCHFORD PROJECT ONTARO
TERRAQUEST LTD.VOKONTO, CANADA

4020
o
4000
230
EGENDSurvey Altitude l ine Spacing Survey Boundary
DIAL MAGNETIC Fit L D
AIRBORNE MAGNETIC SURVEY
TERRAQUEST LTD.TORONTO, CANADA

•i-
O
l a NIAltitude 'it
ac ing Survey Houndar y
Vf.RFICAI MAUN! lit:
AIRBORNE MAGNETIC SURVEY
j rnj\Lil).TORONTO, CANADA

o
o o
ooCM
250
Survey Altitude i ine SpGcJnq Sur vey Houndory
VI RTICAl MAliNt IK: (--K'ADH: N
AIRBORNE MAGNETIC SURVEY
TfflWAQI/EW LTD.

AIRBORNE VLE-EM SURVEY

• Si
270
vey Altitude
O'lAi Fit
QUADRA [UW (Profiles (iloruj flight line Nnrrnol r.opc Reverse Slop*;
AIRBORNE VLF-EM SURVEY
TERRAQVm LTD.

•i*- v-
#': ̂ ';; i-V^Stf ̂ lkK™^^
LOGV
o
asoTERRAQdEW LTD.
f
290 UT
TEKRAQUWT LTD.T{)Kti\"IV. ( MY-t/M