Embed Size (px)
Citation preview

Biophysical Chemistry
Biophysical Chemistry 66 (1997) 75-l IO
GenotJypes wit!h pher Adventures in an RNA
lotypes: toy world
Pet’er Schuster *
Instztut ftir Theoretische Chemze und Strahlenchemze. Universitiit Wien, A-1090 Wien? Austria and Santa Fe Institute, Santa Fe, NM 87501, USA
Received I7 April 1997; accepted I7 April 1997
Abstract
Evolution has created t,he complexity of the animate world and deciphering the language of evolution is the key towards understanding nature. The dyrtamics of evolution is simplified
by considering it as a superposition of three less soph&icated processes: population dynamics, populat,ion support dynamics, an<1 genotype-l,hetlotype mapping. Evolution of molecules in lab- orat.ory assay> provide> a sufficiently sintple system for t,hr quatttitative analysis of t.hr t.hree
phettotttena. C’oa.rse-grained notions of st,ructures like RNA secondary structures are used as model phenotypes. ‘They provide att excellent, tool for a comprehensive analysis of the entire
complex of molecular evolution. ‘I’he mapping from RNA genotypes into secondary structures
is highly redundant. In order t,o find at least one sequence for every common structjures one need only search a (relatively) small part of sequence space. The existence of selectively neut,ral pltettotypes plays an itttportant role for the the success and the efficiency of evolutionary opti- tnizatiort. Mol<~crtlar evolution found a highly promising technological application in the design
of biomolecuics with predefined properties. 0 I997 Published by Elsevier Science B.V.
Keyuiords: Dynamics of evolut,ion. evolut,ionary biotechnology, fit,ness landscape. molecular evolution. RNA struci.rtrc~, selective nrlttralitb
1. Evolution and molecules
=“i stat,cment like The book of life is written in the language of evolution”, looks
like a rephrasing of Theodosius Dohzha.nsky’s fa.mous sentence: “Nothing in biol-
ogy makes sense except in the light of evolution” [16]. The sentence, mimicking
Galilei’s famous phra.se [37, 711, 1 lowcver. is much stronger since it postulates the
existence of a language that allows t,o describe and explain observations in nature
by means of formal concepts. To decipher the code that relates formal structures
to biological phenomena is the grea.test current challenge for scientists in the life
sciences. The early discoveries of molecular biology [53], the double-helical struc-
ture of nucleic acids and the mechanism of cellular protein synthesis, were first
0301-4622/W/$17.00 Copyright 0 1997 Elsevier Science B.V. All rights reserved. PIZ SO301 -4622(97) 00058-6

76 P. Schuster/Biophysical Chemistry 66 (1997) 75-l 10
steps in this direction. Investigations on bacteriophages and the use of synthetic
polynucleotides constituted a kind of “Rosetta stone” that allowed to relate nu-
cleotide sequences of DNA or RNA and a,mino a,cid sequences of proteins. The
genetic code turned out to be (almost) universal in the sense that all forms of
life use the same genetic la,nguage. Otherwise genetic engineering in bact,eria that
a.llows to translate DNA messages from a,11 kinds of sources into protein would not
be possible.
‘The genetic code, however? is only one part of the higly complex language
of evolution. There are, for exa.mples, other issues like the language relating se-
quences and three-dimensional structures of biopolymers (often called the second
half of the genetic code[38]) or the la.nguage of morphogenesis used in the transfor-
mation of a fertilzed egg into an adult multicellular organism. These other ‘-codes“
are presently under intensive invest,igation. We arc, however. still fa.r awa,y from
a. full understanding of these relations. In summasy, we are currently not a,ble
to read the book of life but the enormous wealt,h of molecular data in this field
which has been accumulated in the pa,st and which is fa.stly growing at, present
111a~. alrc,ad>. contain the ultimate “R,osetta stone” of the life sciences that a.llows
to translate the language of physics and chemistry int’o the language of biology.
This heap of data waits to be exploited by means of a still unknown comprehensive
theoretical approach.
A novel access to evolutionary phenomena started from the discovery of the
double-helical structure of DNA. Comparison of homologous biopolymers with
identical functions in different organisms allowed to reconstruct phylogentic trees.
which yielded novel insights into the mechanisms of evolution [12, 691. The dis-
covery of neutral evolution [58] . levealcd tha.t the majority of natura.1 amino a.cid
replacements are selectively neutral and thus build the basis for a molecular clock
of evolution. The conventiona. neutral theory. however. is dealing with the evolu-
tion of rather complex orga,nisms and camlot provide direct insight into molecular
details that can be interpreted by the methods of physics and chemistry.
Molecular evolution has been addressed also in a different context: instead of
studying the molecula,r details of present day forms of life evolution was reduced to
its essence. This alternative a.pproach simplifies evolutionary systems as much as

P. SchustedBiophysical Chemistry 66 (1997) 75-110 77
possible and makes them accessible t’o an anlysis by the conventional methods of
physics and chemistry. Two great scholars initiated studies on evolution in vitro:
Sol Spiegelman [67, 851 did the first optimization experiments on molecules based
on Darwin’s principle of variation and selection and Manfred Eigen [21] presented
an access to the phenomena of evolut,ion by means of chemical reaction kinetics.
Spiegelman’s work started from an l,n vitro replicaGon assa.ys for RNA molecules
that used a virus specific RNA replicase isolated form Escherichiu coli bacteria.
infect,ed by t’he bacteriophage Q,d. Replication errors pro\Tide the genetic reservoir
on which natural selection operates in the spirit of Charles Darwin. Spiegelman
and his coworkers were indeed able t,o speed up th rate of RNA replication h>r
more than one orclr,r of magnitude in t,hc,ir serial transfer experimcnt,s wit,h the
QL~ assay. The Q/3 system has been studied extensively in the forthcoming years
and by now the mechanism of Q,/? RNA replication is well understoocl in all it,s
kinetic details [5]. Th e s ,rllctural prerequisites RNA molecules have to fulfil in -t
order to be recognized and replicatetl 1~)~ t,he enzyme are known [4]. The studies
on in vitro evolution have first of all shown that evolutionary phenomena are no
priviledge of cellular life they a,re observed equally well with molecules in test tuhcs
provided they fulfil the necessary prerc~>quisites: (i) capability of replication under
the conditions of the experiments, (ii) creation of diversity through error-prone
replication, and (iii) limited resources leading to selection. The knowledge gained
from these investigations has not only shetl light on tht, mechanisms of evolution it
has also provitlcd the basis for a. novel kind of biotechnology as predicted already
in t’he eighties [25, 541.
Manfred Eigen’s theory of molecu1a.r evolution is dealing with t,he kinetics
of replica,tion, mutation, aad select,ion in populations of asexually reproducing
species [21]. The novelty in this approa.ch is the view of correct replication and
mutation being parallel reactions involving the same template. The notion of se-
quence space turned out to be illustrative and useful in the context of evolution
as it relates biophysics of evolut,ion to information theory and the science of coin-
munication. It is worth not,icing that, the first, appearence of sequence space in
the biological literature seems to be Sewall Wrights seminal paper on optimiza-
tion of genot’ypes [94]. E very polynllcleotide sequence is represented by a point in

78 P. Schuster/Biophysical Chemist? 66 (1997) 75-I 10
sequence spa.ce. The relat,edness of two sequences is measured by t,he Hamming dis-
tance d [43]. It counts the minimal number of point, muMions required to convert.
t’he two sequences into each other. F$Thcnever point mutations are the domina.nt
cla.ss of replication errors. t.he Hamming distance is a. measure for the evolution-
ary distance of genot,ypes. In the limit of sufficiently long times replication and
mutation produce stationary mutant distributions provided mutation ra,tes are
below a well defined threshold value. These stationary distributions were called
quasispecies [36. 271 because they rc,present the genetic reservoires of asexually
reproducing populations. The quasispecies concept turned out to be very useful
for understanding virus evolution [6: li ~ 23, 241 as well as for the development of
novel antiviral stra.tegies [30. 661.
Popula.tions, na.tural or a.rtificia.1. cover (usually) connect,ed a.rea.s in sequence
space (figure 1). These areas migrate in sequence space through creat,ion of new
genotypes by muta,tion and removal of existming genotypes by cxtinct,ion. Evolution
relat,cs t,his niigrat,ion t.0 d>~naniical ph~~~niena iike, for example. optimizat,ion of
fitness approaching a unique stationary state, oscillations and deterministic chaos,
and random drift being the extreme case of population dynamics in the absence
of fitness differences.
The search for a language, of evolution a,s well as the existence of a genetic code
suggest to make use of the concept of information in order to interpret biology.
Manfred Eigen centers his theory of evolution around the notion of biological infor-
ma,tion [Zl]. Indeed, he sees the essentia.l difference between physics and biology in
the> applicability of the-, conc<,pt of informat,ion to the analysis of evolutionary phe-
nomena. The history of life and biological evolution are the best currently known
examples for origin and increase of information a,nd complexity. Darwinian evo-
lution operates on popula.tions of in&\-iduals that carry their specific genotypes.
Selection favors phenotypes that are fitter and, in particular, better in exploiting
their environments. By variation through mutation and selection the populations
gains information on the environment and stores it in the genotypes. Da,rwinian
selection and adaptation to the environment, however, is not the exclusive mech-
anism of evolution. Tl le search for a. comprehensive view of evolution thus has :
to be open with respect to more complex population dynamics. The key towards

P. SchustedBiophysical Chemistry 66 (1997) 75-110 79
Figure 1: A typical quasispecies distribution of genotypes in sequence space. The
quasispecies is the stationary state of an asexually reproducing population. It consists
of a fittest dominant genotype, the master sequence, and the most frequent mutants
surrounding it in seqlience space. Frequencies of individual mutants are determined
by their fitness values as well as by their Hamming distances form the master. Pop-
ulations approach stationary states only if the mutation rates are below well defined
threshold values. Otherwise populations migrate indefinitely through sequence space.
A quasispecies or a population, in general, occupies a (usually connected) region in se-
quence space. In mathematical notation this region is called the (population) support.
In case of a quasispecies the support is stationary. In the general, non-stationary case
the (population) support migrates through sequence space.
80 P. SchustedBiophysical Chemistry 66 (1997) 75-110
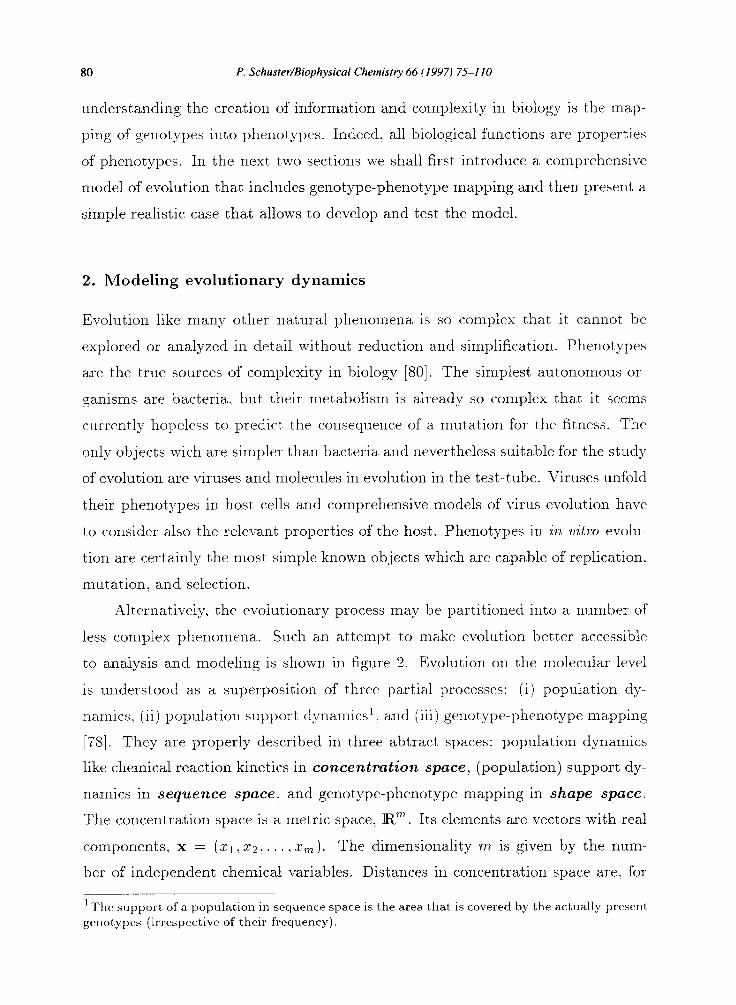
understanding the creation of information and complexity in biology is the map-
ping of genotypes into phenotypes. Indeed, all b io 0 1 g ical functions are properties
of phenotypes. In the next two sections we shall first introduce a comprehensive
model of evolution that includes genotype-phenotype mapping and then present a
simple realistic case that allows to develop and test the model.
2. Modeling evolutionary dynamics
Evolution like many other natural phenomena is so complex that it cannot be
explored or analyzed in detail without reduction and simplification. Phenotypes
are the true sources of complexity in biology [80]. The simplest autonomous or-
ganisms are bacteria, but their metabolism is already so complex that it seems
current~ly hopeless t,o predict the consequence of a muta,tion for the fitness. The
only objects with are simpler than bacteria and nevertheless suitable for the study
of evolution are viruses and molecules in evolution in the test-tube. Viruses unfold
their phenotypes in host cells and comprehensive models of virus evolution have
to consider also the relevant properties of the host. Phenotypes in in vitro evolu-
tion are certainly the most simple known objects which are capable of replication
mutation, and selection.
Alternatively, the evolutionary process may be partitioned into a number of
less complex phenomena. Such an attempt to make evolution better accessible
to analysis and modeling is shown in figure 2. Evolution on the molecular level
is understood as a superposition of t,hree partial processes: (i) popula.tion dy-
na,mics, (ii) population support dynamics’~ a,nd (iii) genotype-phenotype mapping
[78]. They are properly described in three abtract spaces: population dynamics
like chemical reaction kinetics in concentration space, (population) support dy-
namics in sequence space, and genotype-phenotype mapping in shape space.
The concentration space is a, metric space, R”. Its elements are vectors with real
components, x = (x1,22,. . . , 5, ). The dimensionality m is given by the num-
ber of independent chemical variables. Distances in concentration space are? for
‘The support of a population in sequence space is the area that is covered by the actually present
genotypes (irrespective of their frequency).

P. SchustedBiophysical Chemistry 66 (1997) 75-I 10 81
example, given by the quadratic norm
Ix - Yl = J(XI - y1 J2 + (72 - y# + . . . + (xm - t&)2 .
The shape space is t.he space of phenotypes. Every phenotype is represented
by a point in shape space. Phenotypes or shapes are non-scalar quantities. In
general, it is not easy to find an appropriate distance that measures the relatedness
between two phenotypes. In some special cases like coarse grained structures of
biopolymers, however, such definitions can be found.
Population dynamics is closely related to conventional population genetics
although molecular biology of simple forms of life has shown that the ranges of
evolutionary parameters like population sizes or mutation rates are much wider
than estimated from the data known for higher organisms [18, 201. Population dy-
namics is commonly modeled by means kinetic differential equations. An example
is the selectionmutation equation formulated by Eigen [21]:
dxi dt = Xi (‘iQii - d; - G(X)) + C kjQj;xj ; i = 1,2,. . . ,m . (1)
j#i
Replication a,nd degra.dation ra,te constant,s are denoted by k; and dl, respectively;
replication accuracies and mutation frequencies are given in the (bistochastic)
matrix Q - {Qij} with C;“=, Q;j = 1 and x2”=, Qij = 1; a(x) = Czl(ki - d;)x; is the mean excess production of the population. Population variables are assumed
to be normalized and thus the physically meaningful range of variables is confined
to the concentration simplex: S, - {x; 2 0 ‘d i = 1,. . . , m; Cz”=, = l}. This
deterministic approach towa.rds selection is very useful in the derivation of simple
mathematical expression for evolutionary relevant properties. As an example we
present the error threshold phenomenon of molecular quasispecies. Considering
only point mutations and assuming that error rates do not depend on the specific
position on polynucleotide sequence lea.ds to the uniform error rate model that
allows to express all mutation rates by mea.ns of the Hamming distance (cl) and
the accuracy of replication (y):
(2)

82 P. Schuster/Biophysical Chemistry 66 (I 997) 75-l 10
Shape Space
Phenotyl,es.
Nucleic Acid Molecules
Moircuiur Shapes
Fitness Values
CoarseGained Structures
Contact Matrices I Real Numherv
Combinatory Maps
Genotypes:
Polynucleotide Sequences
Landscapes
Population Support Dynamics Population Dynamics
Figure 2: A comprehensive model of evolutionary dynamics. The complex evolu-
tionary process is partitioned into three simpler phenomena: (i) population dynamics.
(ii) population support dynamics, and (iii) genotype-phenotype mapping. Population
dynamics is tantamount to chemical reaction kinetics of replication, mutation, and
selection. Population support dynamics describes the migration of populations in
the space of genotypes. Genotype-phenotype mapping unfolds biological information
stored in polynucleotide sequences. Two classes of mappings are distinguished: (i)
combinatory maps from genotype space onto another vector space or another space
of non-scalar objects and (ii) landscapes mapping genotype space into the real num-
bers. In molecular evolution landscapes provide rate constants, equilibrium constants
and other more complex scalar properties of phenotypes, for example, fitness values.
Landscapes are often (but not necessarily) constructed in two steps: (i) a mapping
from sequence space into molecular structures and (ii) a mapping from the space of
structures into real numbers representing molecular properties.

P. Schuster/Biophysical Chemistry 66 (1997) 75-l IO 83
By n we denote the chain length of the polynucleotide, d;j is the Hamming distance
between the t’wo genotypes under consideration, and the single digit accuracy is
closely related to the mutation or error rate per site: p = 1 - q. The higher
the error rate is, the larger is the fraction of mutants in the population. There
is, however. a minimum replication accuracy (qmin ) above which populations be-
come non-stationary in sequence space and inheritance breaks down because all
genotypes have finite lifetimes [27]. Th e critical change in population support dy-
namics has been characterized as the error threshold. The minimum replication
accuracy (qmin ) can be calculated easily when the mutational backflow from the
mutants to the master sequence is neglected. The master sequence is the most
frequent and in case of a quasispecies the fittest genotype in the population. The
error threshold can now be expressed in terms of the already defined quantities:
with grnt = - k mt
k+dmt -2 .
The subscript “mt” refers to the master sequence. The mean values are taken over
all genotypes except the master:
i= c k; I (1 - Z,t) and d = i=l,i#mt
This simple expression has been applied successfully to study natural virus pop-
ulations. Most RNA viruses were found to live under “close-to-error-threshold”
conditions [23, 271.
The simplified treatment of the replication-error propagation problem as de-
scribed above has much in common with a kind of mean field approach. It has
been characterized a,s the “single-peak-landscape” model since the effective kinetic
parameters distinguish only between the master sequence and the members of a
mutation cloud. The deterministic approach to the error-threshold problem has
been extended to more detailed assumptions on the fitness landscape [22, 84, 871
as well as to diploid organims [93].
Irrespective of the apparent success in the interpretation of several qualitative
phenomena the deterministic approach suffers from a number of principal and
technical problems:
84 P. Schuster/Biophysical Chemistry 66 (1997) 75-1 IO
(i) mutations, in principle, come in single copies only and rare mutations must
be handled therefore by a stochastic approach,
(ii) stationary states are handling all mutants that can be reached in a sequence
of point mutations which is tantamount to all ~~ (6 = 4 for DNA or RNA)
genotypes of constant chain length n and thus realistic populations of 101”
genotypes or less are unable to reach stationarity for sequences of chains length
n = 42 or more, and
(iii) numbers of parameters are multiples of the numbers of different genotypes
and thus it is impossible to work with predefined “look-up-tables” and one
has to search for a model that allows to derive the properties of phenotypes
from known polynucleotide sequences of the genotypes.
The deterministic approach through differential equations can be replaced by mul-
titype branching processes, a class of stochastic processes that allows to describe
series of replication and mutation events over many generations [ 131. The stochas-
tic description deals with probabilities of mutant formation and fixation in the
population. Still missing in this model, however, is the description of the evolu-
tion of non-stationary populations. The model introduced in figure 2 deals with
the drift of populations in sequence space by considering support dynamics. The
second gap to be filled is the handling of phenotypes. The evolutionary relevant
property of a phenotype is its fitness. What is needed therefore is a mapping of
the kind
genotype ==+ phenotype ==+ fitness .
Highly simplified models, for example the NF;-model of Stuart Kauffman [56, 5’i]
and various other models related to the theory of spin glasses [l], assign fitness
values directly to genotypes.
Population support dynamics is dealing with the migration of populations
through sequence space. The two extremes of support dynamics are: (i) adaptive
walk and (ii) random drift of populations. An adaptive walk is characterized by a
sequence of genotypes with the restriction that each new genotype has to yield a
phenotype with higher fitness. On the level of populations the “no-downhill-step”
condition for adaptive walks is somewhat relaxed as populations with sufficiently

P. SchustedBiophysical Chemistry 66 (1997) 7.5-110 85
large population sizes can bridge narrow valleys of width of a few point muta-
tions (see figure 4). Random drift occurs in absence of fitness differences. It has
close similarity to the diffusion process. The only currently available analytical
approach to population support dynamics is restricted to evolution on flat fitness
landscapes [15, 581. Computer simulation of random drift has shown that growing
populations may split into subpopulations [45, 491. Evolution of populations on
realistic landscapes has only been studied by computer simulation [35, 36, 491.
Evolutionary optimization turned out to be a combination of fast adaptive peri-
ods and slow random drift phases and thus occurs in stepwise manner with two
different time scales.
As the huge universes of possible genotypes and phenotypes are prohibitive
for the usage of a priori determined (and stored) properties we need a model
theory of phenotypes that allows to derive the evolutionary relevant parameters
from polynucleotide sequences. A useful model would thus be a set of rules2, an
algorithm and/or its computer implementa.tion using the genotype as input and
producing a list of properties of the corresponding phenotype. To be operational
the algorithm should be sufficiently simple so tha,t it can be incorporated into
a comprehensive model evolution and at the same time it should be as close to
reality as possible. Such a theory of phenotypes is currently not available yet.
First developments in this direction pioneered by Walter Fontana [31, 321 are
still far away from being applicable to the specific problems we are interested
in here. In the next section we shall introduce a particularly simple example of
genotype-phenotype mapping that is based on RNA secondary structures. In this
case the mapping can be studied by computer simulation [40, 411 and analyzed
mathematically by means of a model based on random graph theory [74].
3. Genotype-phenotype mapping with RNA secondary structures
Already Sol Spiegelman [85] had p ointed out that genotype and phenotype are
two features of the same molecule in case of RNA evolution in the test-tube, the
2The computation of the mutation matrix from the uniform error-rate model is an example for
such a simple rule: for a given genotype all mutation frequences are computed from a single
parameter, the single digit accuracy 4.

86 P. SchustedBiophysical Chemistry 66 (1997) 75- I10
nucleotide sequence and the spatial structure, respectively. Relating a phenotype
to a genotype then becomes tantamount to structure prediction from known se-
quences. RNA molecules became even more interesting objects when Tom Cech [7,
81 and Sidney Altman [42] d iscovered RNA catalysis. RN,4 molecules thus cannot
only act at the same time a,s genotypes and (non-active) phenotypes but they have
also a repertoire of catalytic activities. Limited as such a catalytic repertoire of
RNA molecules might appear when it is compared with universal protein catalysis,
it was presumably sufficient for processing and replica,ting RNA under prebiotic
conditions. The idea of an RNA world preceding our current DNA-RNA-protein
world was and is therefore strongly favored by several authors [39, 511. Apart
from their possible relevance for the origin of life RNA molecules replicating in the
test-tube are extremely useful as a simple model to study evolution.
Mapping RNA genotypes into phenotypes requires a solution to the structure
prediction problem [83]. C urrent knowledge on three-dimensional structures of
RNA molecules, however, is rather limited: only very few structures have been de-
termined so far by crystallography and nmr spectroscopy. Needless to say, spatial
structures of RNA molecules are also very hard to predict by computations based
on minimization of potential energies and molecular dynamics simulations. The
so-called secondary structure of RNA is a coarse grained version of structure that
lists Watson-Crick (GC and AU) and GU base pairs. A secondary structure can
be represented by a planar graph without knots or pseudoknots3. Secondary struc-
tures are conceptionally much simpler than three-dimensional structures and allow
to perform rigorous mathematical analysis [91] as well as large scale computations
by means of algorithms based on dynamic programming [95] and implementation
on parallel processors [46]. RNA secondary structure predictions are more reliable
than those of full spatial structures. In addition, the definition of RNA secondary
structures allow to find formally consistent distance measures (71) in shape space
[34, 48, 60, 731. S ome sta,tistical properties of RNA secondary structures were
shown to depend very little on choices of algorithms and parameter sets [88].
“The precise definition for an acceptable secondary structure is: (i) base pairs are not allowed
between neighbors in the sequences (i,z+l) and (ii) if (z,j) and (k,~) are two base pairs then
(apart from permutat.ions) only two arrangements along the sequence are acceptable: (i<j<k<!)
and (;<k<e<j), respectively.

P. SchustedBiophysical Chemistry 66 (1997) 75-110 87
Table 1: Common secondary structures of GC-only sequences.
#Sequences n 4” 2” 7 16,384 128
10 1.05 x 10⁶ 1,024
;; llL;7xxl;; 9 1.05 32 x 768 lo6 25 1.13 x 10¹⁵ 3.36 x lo7 30 1.15 x 1or* 1.07 x log
#Struct. 1 GC*
I
22 11 258 116
3613 1610 55 848 18 590
917 665 218 820
RC 1 4
43 286
2 869 22 718
859 28 935
902 918 30 745 86 1
999 508 805
* The total number of minumum free energy secondary structures formed by GC-only sequences
is denoted by SGC, R, is the rank of the least frequent common structure and thus is tanta-
mount to the number of common structures. and R, is the number of sequences folding into
common structures.
RNA secondary structures provide an excellent model system for the study
of global relations between genotypes and phenotypes. The conventional one-
sequence-one-structure approach of structural biology is extended to a general
concept that considers sequence structure relations as (non-invertible) mappings
from sequence space into shape space [34, 74, 821. Application of combinatorics
allows to derive an asymptotic expression for the numbers of acceptable structures
as a function of the chain length n [47, 811:
S,, zz 1.4848 x n3j2 ( 1.8488)7L . (4
This expression is based on two assumptions: (i) the minimum stack length is two
base pairs (nstack > 2, i.e., isolated base pairs are excluded) and (ii) the minimal
size of hairpin loops is three (nlooPs 2 3). Tl re numbers of sequences are given
by 4” for natural RNA molecules and by 2” for GC-only or AU-only sequences.
In both cases there are more RNA sequences than secondary structures and we
are dealing with neutrality in the sense that many RNA sequences form the same
(secondary) structure.
Not all acceptable secondary structures are actually formed as minimum free
energy structures. The numbers of stable secondary structures were determined
by exhaustive folding [40, 411 of all GC-only sequences with chain lengths up to
n = 30 (table 1). Th e f raction of acceptable structures obtained as minimum free
88 P. Schuster/Biophysical Chemistry 66 (1997) 75-I 10
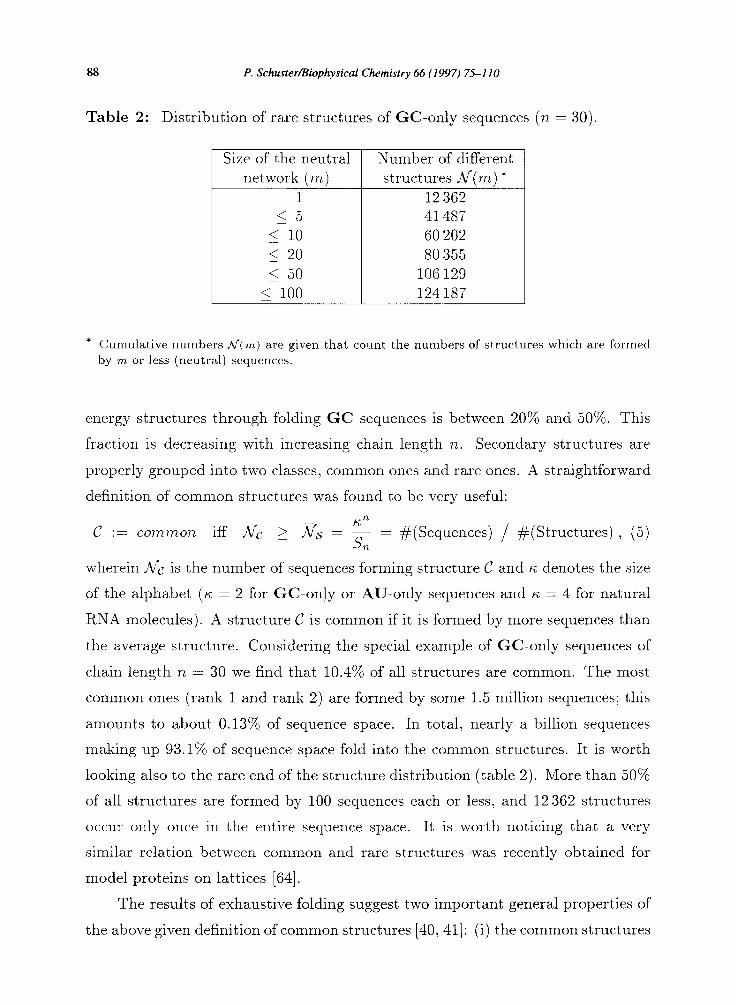
Table 2: Distribution of rare structures of GC-only sequences (n = 30).
Size of the neutral network (m)
1 <5
Cl0 7 20 < 50
2 100
Number of different structures n/(m) *
12 362 41487 60 202 80 355
106 129 124 187
* Cumulative numbers N(m) are given that count the numbers of structures which are formed by m or less (neutral) sequences.
energy structures through folding GC sequences is between 20% and 50010. This
fraction is decreasing with increasing chain length n. Secondary structures are
properly grouped into two classes, common ones and rare ones. A straightforward
definition of common structures was found to be very useful: n
C := common iff n/c > 6 = c = #(Sequences) / #(Structures), (5) STl
wherein JQ’~ is the number of sequences forming structure C and K. denotes the size
of the alphabet (K = 2 f or GC-only or AU-only sequences and K = 4 for natural
RNA molecules). A structure C is common if it is formed by more sequences than
the average structure. Considering the special example of GC-only sequences of
chain length n = 30 we find that 10.4% of all structures are common. The most
common ones (rank 1 and rank 2) are formed by some 1.5 million sequences; this
amounts to about 0.13Yo of sequence space. In total, nearly a billion sequences
making up 93.1Yo of sequence space fold into the common structures. It is worth
looking also to the rare end of the structure distribution (table 2). More than 50%
of all structures are formed by 100 sequences each or less! and 12 362 structures
occur only once in the entire sequence space. It is worth noticing that a very
similar relation between common and rare structures was recently obtained for
model proteins on lattices [64].
The results of exhaustive folding suggest two important general properties of
the above given definition of common structures [40,41]: (i) the common structures

P. SchustedBiophysical Chemistry 66 ( 1997) 75-l IO 89
represent only a small fraction of all structures and this fraction decreases with
increasing chain length, and (ii) the fraction of sequences folding into the common
structures increases with chain length and approaches unity in the limit of long
chains. Thus> for sufficiently long chains almost all RNA sequences fold into a small
fraction of the secondary structures. The effective ratio of sequences to structures
is larger than computed from equ(5) since only common structures play a role in
natural evolution and in evolutionary biotechnology.
Inverse folding determines the sequences that fold into a given structure.
Application of inverse folding to RNA secondary structures [46] has shown that
sequences folding into the same structure are (almost) randomly distributed in
sequence space. It is straightforward then to compute a spherical environment
(around any randomly chosen reference point in sequence space) that contains
at least one sequence (on the average) for every common structure. The radius
of such a sphere. called the covering radius rcoV, can be estimated from simple
probability arguments [79]:
r - min{h=1~2,...,rc. 1 Bh > nn/?lT,c=S,}, CCJZ’ - (6)
with Bh being the number of sequences contained in a ball of radius h. The cover-
ing radius is much smaller than the radius of sequence space. The covering sphere
represents only a small connected subset of all sequences but contains, neverthe-
less, all common structures (figure 3) and forms an evolutionarily representative
part of shape space.
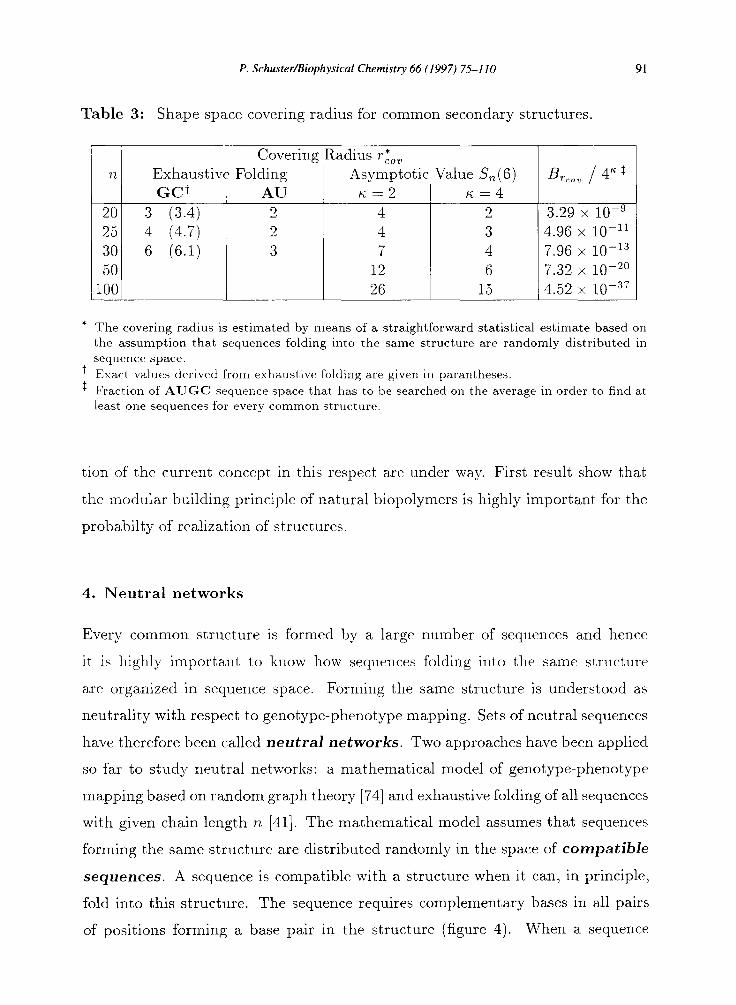
Numerical values of covering radii are presented in table 3. In the case of
natural sequences of chain length n = 100 a covering radius of T,,, = 15 implies
that the number of sequences that have to be searched in order to find all common
structures is about 4 x 10²”. Although 1O24 is a very large number (and exceeds
the capacities of all currently availa,ble polynucleotide libraries), it is negligibly
small compared to the size of the entire sequence space that contains 1.6 x 10⁶’
sequences. E h x austive folding allows to test the estimates derived from simple
statistics [41]. The agreement for GC-only sequences of short chain lengths is
surprisingly good. The covering radius increases linearly with chain length with a
90 P. SchustedBiophysical Chemistry 66 (1997) 75-110
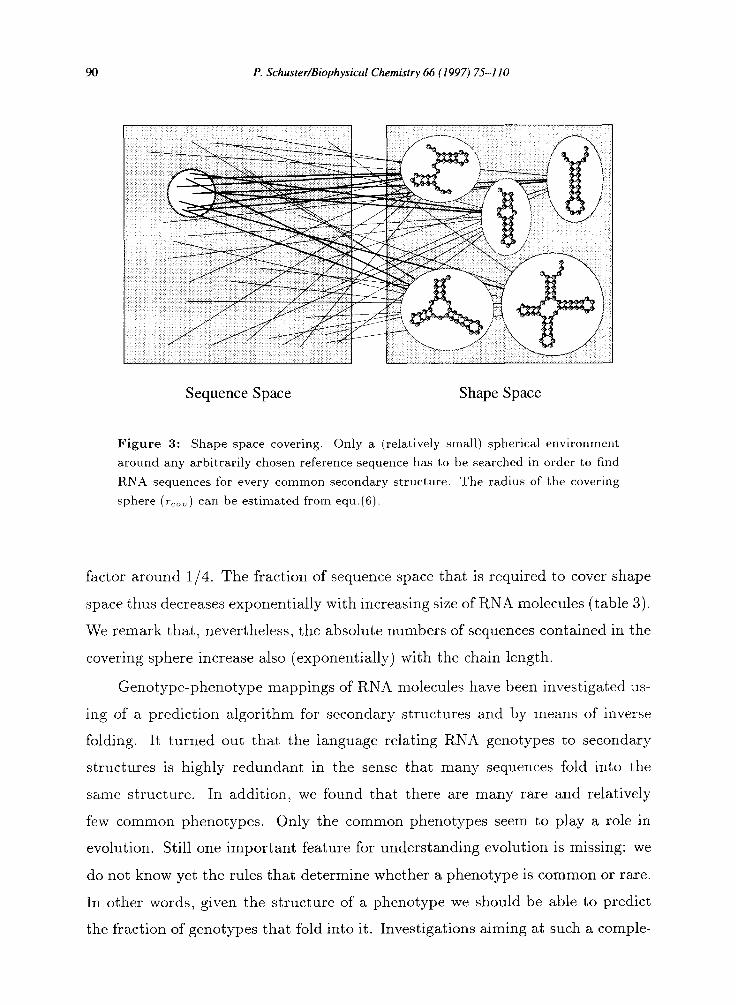
Sequence Space Shape Space
Figure 3: Shape space covering. Only a (relatively small) spherical environment
around any arbitrarily chosen reference sequence has to be searched in order to find
RNA sequences for every common secondary structure. The radius of the covering
sphere (T<~~) can be estimated from equ.(6).
factor around l/4. The fraction of sequence space that is required to cover shape
space thus decreases exponentially with increasing size of RNA molecules (table 3).
We remark that, nevertheless, the absolute numbers of sequences contained in the
covering sphere increase also (exponentially) with the chain length.
Genotype-phenotype mappings of RNA molecules have been investigated us-
ing of a prediction algorithm for secondary structures and by means of inverse
folding. It turned out that the language relating RNA genotypes to secondary
structures is highly redundant in the sense that many sequences fold into the
same structure. In addition, we found that there are many rare and relatively
few common phenotypes. Only the common phenotypes seem to play a role in
evolution. Still one important feature for understanding evolution is missing: we
do not know yet the rules that determine whether a phenotype is common or rare.
In other words, given the structure of a phenotype we should be able to predict
the fraction of genotypes that fold into it. Investigations aiming at such a comple-
P. Schuster/Biophysical Chemistry 66 (1997) 75-l IO
Table 3: Shape space covering radius for common secondary structures.
91
r Covering Radius rz,,
n Exhaustive Folding Asymptotic Value S, (6) B,_, / 4” : GCt AU r;=2 PC=4
20 3 (3.4) 2 4 2 3.29 x 10-g 25 4 (4.7) 2 4 3 4.96 x lo-l1 30 6 (6.1) 3 7 4 7.96 x lo-l3 50 12 6 7.32 x 1O-2o
100 26 15 4.52 x 1O-37
* The covering radius is estimated by means of a straightforward statistical estimate based on
the assumption that sequences folding into the same structure are randomly distributed in
sequence space.
+ Esact values derived from exha.ustive folding are given in parantheses.
t Fraction of AUGC sequence space that has to be searched on the average in order to find at
least one sequences for every common structure.
tion of the current concept in this respect are under way. First result show that
the modular building principle of natural biopolymers is highly important for the
probabilty of realization of structures.
4. Neutral networks
Every common structure is formed by a large number of sequences and hence
it is highly important to know how sequences folding into the same structure
are organized in sequence space. Forming the same structure is understood as
neutrality with respect to genotype-phenotype mapping. Sets of neutral sequences
have therefore been called neutral networks. Two approaches have been applied
so far to study neutral networks: a mathematical model of genotype-phenotype
mapping based on random graph theory [74] and exhaustive folding of all sequences
with given chain length n [41]. Th e mathematical model assumes that sequences
forming the same structure are distributed randomly in the space of compatible
sequences. A sequence is compatible with a structure when it can, in principle,
fold into this structure. The sequence requires complementary bases in all pairs
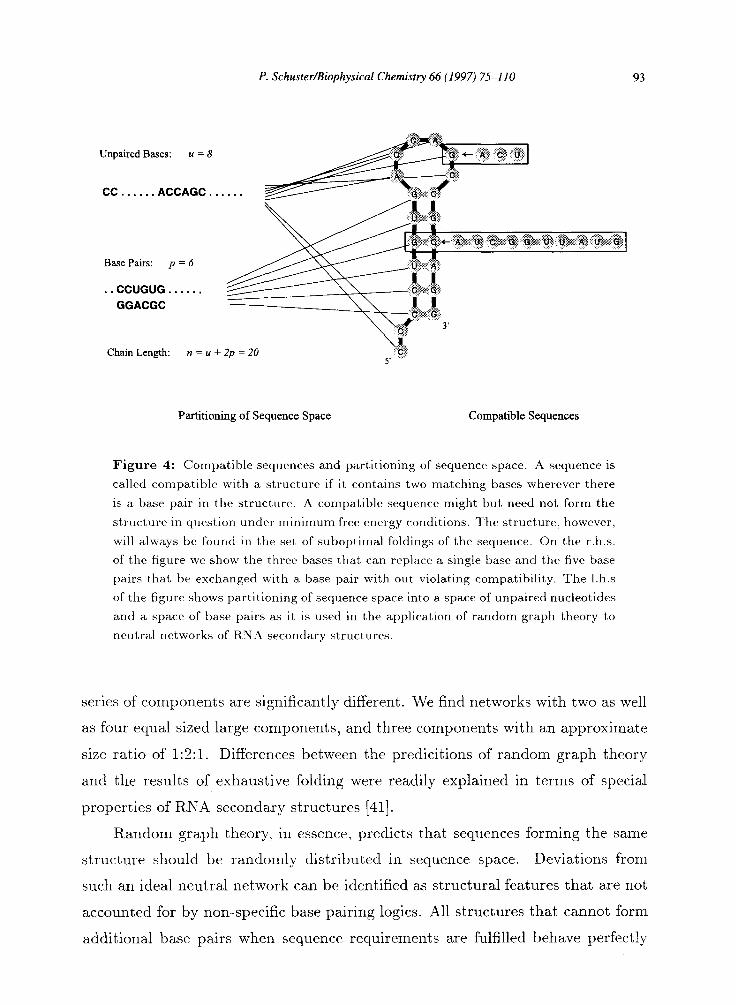
of positions forming a base pair in the structure (figure 4). When a sequence

92 P. SchustedBiophysical Chemistry 66 (1997) 75-l 10
is compatible with a structure then the latter is necessarily among the foldings,
minimum free energy or suboptimal, of the RNA molecule; a compatible sequence
might but need not form the structure under minimum free energy conditions.
The neutral network of a structure is the subset of its compatible sequences
that actually form the structure under the minimum free energy conditions. In
the mathematical approach [74] neutral networks are modelled by random graphs
in sequence space. The analysis is simplified through partitioning of sequence
space into a subspace of unpaired bases and a subspace of base pairs (figure 4).
Neutral neighbors in both subspaces are chosen at random and connected to yield
the edges of the random graph that is representative for the neutral network. The
fraction of neighboring pairs that are assigned to be neutral is controlled by the
parameter X. In other words, X measures the mean
in sequence space. The statistics of random graphs
The connectivity of networks, for example, changes
passes a threshold value:
- X,,(K) = 1 - k--l 1 . \i K
fraction of neutral neighbors
is studied as a function of X.
drastically threshold when X
(7)
The quantity K in this equa.tion represents the size of the alphabet. As shown in
figure 3 we have r; = 4 (A,U,G,C) for b ases in single stranded regions of RNA
molecules and K = 6 (AU,UA,UG,GU,GC,CG) for base pairs. Depending on
the particular structure considered the fraction of neutral neighbors is commonly
different in the two subspaces of unpaired and paired bases and we are dealing with
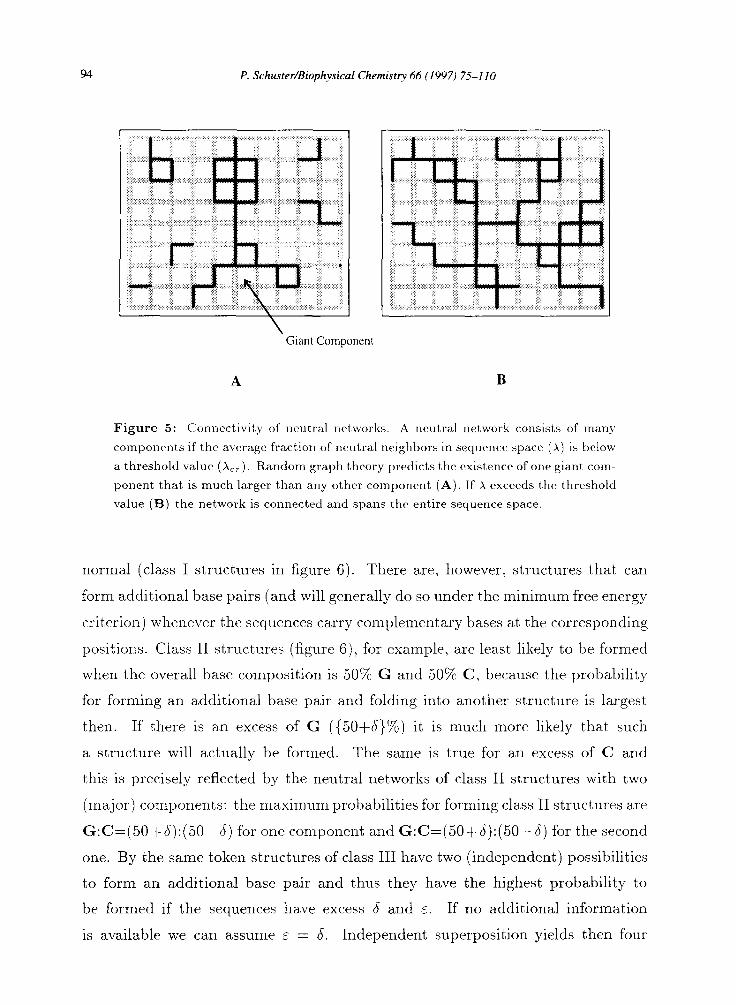
two different parameter values, X, and X,, respectively. Neutral networks consist
of a single component that spans whole sequence space if X > X,, and below
threshold, X < X,,, the network is partitioned into a great number of components,
in general, a giant component and many small ones (figure 5).
Exhaustive folding allows to check the predictions of random graph theory
and reveals further details of neutral networks. The typical series of components
for neutral networks (either a connected network spanning whole sequence space or
a very large component accompanied by several small ones) is indeed found with
many common structures. Th ere are, however, also numerous networks whose
P. SchustedBiophysical Chemistry 66 (1997) 75-110 93
Unpaired Bases: ll=8
CC. . . . . . ACCAGC .
Base Pairs: p=6
. . CCUGUG . . . . . . GGACGC
Chain Length: ??=u + 2p = 20
Partitioning of Sequence Space Compatible Sequences
Figure 4: Compatible sequences and partitioning of sequence space. A sequence is
called compatible with a structure if it contains two matching bases wherever there
is a base pair in the structure. A compatible sequence might but need not form the
structure in question under minimum free energy conditions. The structure, however,
will always be found in the set of suboptimal foldings of the sequence. On the r.h.s.
of the figure we show the three bases that can replace a single base and the five base
pairs that be exchanged with a base pair with out violating compatibility. The 1.h.s
of the figure shows partitioning of sequence space into a space of unpaired nucleotides
and a space of base pairs as it is used in the application of random graph theory to
neutral networks of RNA secondary structures.
series of components are significantly different. We find networks with two as well
as four equal sized large components, and three components with an approximate
size ratio of 1:2:1. Differences between the predicitions of random graph theory
and the results of exhaustive folding were readily explained in terms of special
properties of RNA secondary structures [41].
Random graph theory, in essence, predicts that sequences forming the same
structure should be randomly distributed in sequence space. Deviations from
such an ideal neutral network can be identified as structural features that are not
accounted for by non-specific base pairing logics. All structures that cannot form
additional base pairs when sequence requirements are fulfilled behave perfectly
P. SchustedBiophysical Chemistry 66 (1997) 75-110
Giant Component
Figure 5: Connectivity of neutral networks. A neutral network consists of many
components if the average fraction of neutral neighbors in sequence space (A) is below
a threshold value (A,,). Random graph theory predicts the existence of one giant com-
ponent that is much larger than any other component (A). If x exceeds the threshold
value (B) the network is connected and spans the entire sequence space.
normal (class I structures in figure 6). There are, however, structures that can
form additional base pairs (and will generally do so under the minimum free energy
criterion) whenever the sequences carry complementary bases at the corresponding
positions. Class II structures (figure 6), for example, are least likely to be formed
when the overall base composition is 50% G and 50% C, because the probability
for forming an additional base pair and folding into another structure is largest
then. If there is an excess of G ({SO+S}%) it is much more likely that such
a structure will actually be formed. The same is true for an excess of C and
this is precisely reflected by the neutral networks of class II structures with two
(major) components: the maximum probabilities for forming class II structures are
G:C=(50+6):(50-S) f or one component and G:C=(50+&):(50-6) for the second
one. By the same token structures of class III have two (independent) possibilities
to form an additional base pair and thus they have the highest probability to
be formed if the sequences have excess b and E. If no additional information
is available we can assume E = S. Independent superposition yields then four
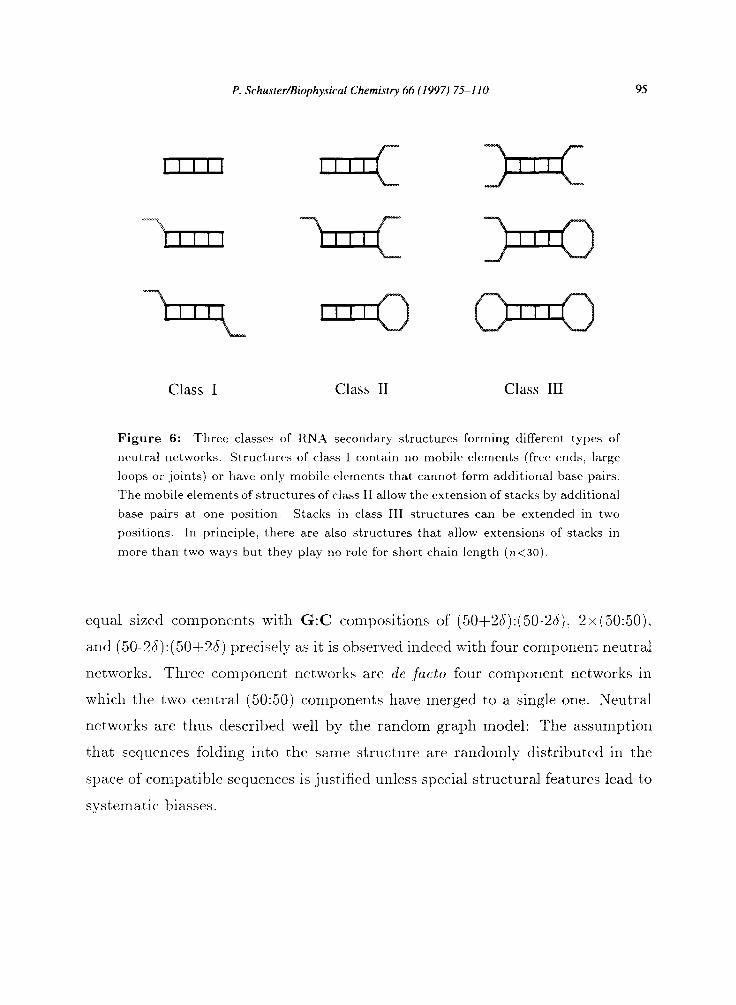
P. Schuster/Biophysical Chemistry 66 (1997) 75-I IO 95
Class I Class II Class III
Figure 6: Three classes of RNA secondary structures forming different types of
neutral networks. Structures of class I contain no mobile elements (free ends, large
loops or joints) or have only mobile elements that cannot form additional base pairs.
The mobile elements of struct,ures of class II allow the extension of stacks by additional
base pairs at one position. Stacks in class III structures can be extended in two
positions. In principle, there are also structures that allow extensions of stacks in
more than two ways but they play no role for short chain length (n<30).
equal sized components with G:C compositions of (50+26):(50-26), 2x(50:50),
and (50-26):(50+26) p recisely as it is observed indeed with four component neutral
networks. Three component networks are de facto four component networks in
which the two central (50:50) components have merged to a single one. Neutral
networks are thus described well by the random graph model: The assumption
that sequences folding into the same structure are randomly distributed in the
space of compatible sequences is justified unless special structural features lead to
systematic biasses.
% P. SchustedBiophysical Chemistry 66 (1997) 75-1 IO
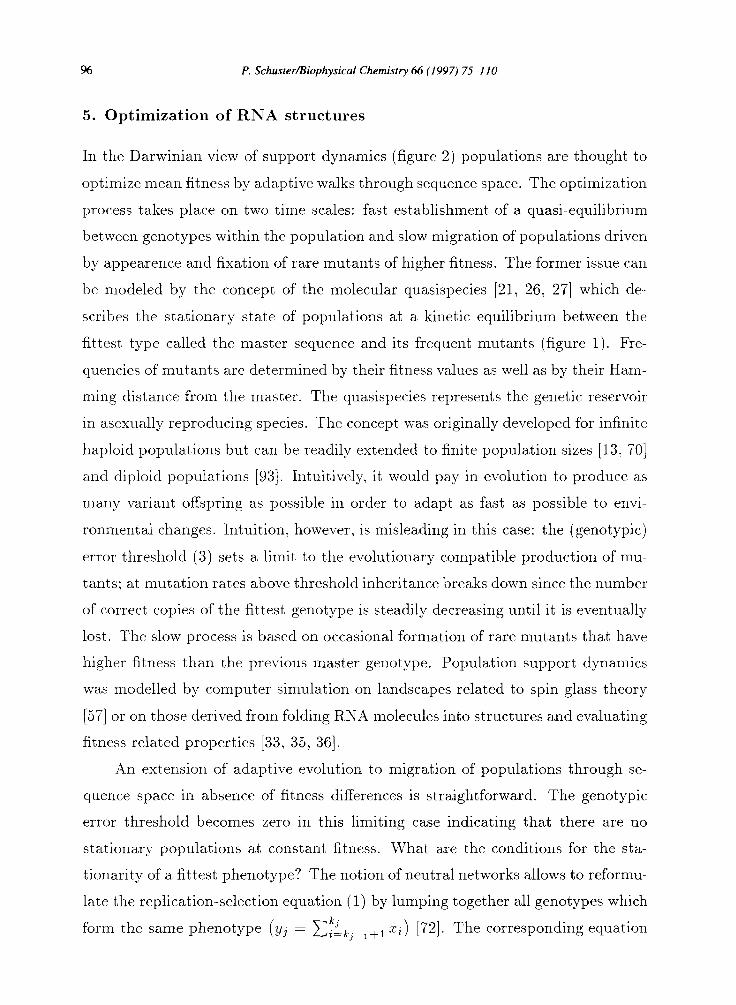
5. Optimization of RNA structures
In the Darwinian view of support dynamics (figure 2) populations are thought to
optimize mean fitness by adaptive walks through sequence space. The optimization
process takes place on two time scales: fast establishment of a quasi-equilibrium
between genotypes within the population and slow migration of populations driven
by appearence and fixation of rare mutants of higher fitness. The former issue can
be modeled by the concept of the molecular quasispecies [21, 26, 271 which de-
scribes the stationary state of populations at a kinetic equilibrium between the
fittest type called the master sequence and its frequent mutants (figure 1). Fre-
quencies of mutants are determined by their fitness values as well as by their Ham-
ming distance from the master. The quasispecies represents the genetic reservoir
in asexually reproducing species. The concept was originally developed for infinite
haploid populations but can be readily extended to finite population sizes [13. 701
and diploid populations [93]. Intuitively, it would pay in evolution to produce as
many variant offspring as possible in order to adapt as fast as possible to envi-
ronmental changes. Intuition, however, is misleading in this case: the (genotypic)
error threshold (3) sets a limit to the evolutionary compatible production of mu-
tants; at mutation rates above threshold inheritance breaks down since the number
of correct copies of the fittest genotype is steadily decreasing until it is eventually
lost. The slow process is based on occasional formation of rare mutants that have
higher fitness than the previous master genotype. Population support dynamics
was modelled by computer simulation on landscapes related to spin glass theory
[57] or on those derived from folding RNA molecules into structures and evaluating
fitness related properties [33, 35, 361.
An extension of adaptive evolution to migration of populations through se-
quence space in absence of fitness differences is straightforward. The genotypic
error threshold becomes zero in this limiting case indicating that there are no
stationary populations at constant fitness. What are the conditions for the sta-
tionarity of a fittest phenotype? The notion of neutral networks allows to reformu-
late the replication-selection equation (1) by lumping together all genotypes which
form the same phenotype (yj = ~~~,j_,+, x;) [72]. The corresponding equation

P. SchustedBiophysical Chemistry 66 (1997) 75-l IO
for the master phenotype ‘972” can be approximated by
dYm - = Ym (kmgmm - dt
dm - fD) + Mutational Backflow .
The replication accuracy Q,, is modified in order to account for mutational
backflow on the neutral network? i.e. without changing the phenotype:
Qmnt = &mm + AmU - &mm) .
The parameter X, represents the mean fraction of neutral neighbours of the master
phenotype. Neglecting again the mutational backflow from non-neutral genotypes
to the master phenotype we can calculate a minimum single digit accuracy (qmin)
for the phenotypic error threshold:
Eyu.(S) represents an extension of the genotypic error threshold (2) into the do-
main of selective neutrality. Accordingly, the genotypic threshold is obtained in
the limit lim x, + 0. With an increasing degree of neutrality a larger fraction of
mutations can be tolerated. There is a critical value, (I,,,) cT = a,‘. above which
the population can tolerate unlimited mutation rates without loosing the master
phenotype.
Neutral evolution has been studied on model landscapes by analytical ap-
proaches [15] d erived from t,he random-energy model [14] as well as by computer
simulation [44, 451. M ore recently the computer simulations were extended to
neutral evolution on RNA folding landscapes [49]. I n case of selective neutrality
populations drift randomly in sequence space by a diffusion-like mechanism. Pop-
ulations corresponding to large areas in sequence space are partitioned into smaller
patches which have some average life time. These feature of population dynamics
in neutral evolution was seen in analogy to the formation and evolution of bio-
logical species [45]. Popula,tion dynamics on neutral networks has been analysed
by means of stochastic processes and computer simulation [92]. In analogy to the
genotypic error threshold there exists also a phenotypic error threshold that sets
98 P. SchustedBiophysical Chemistry 66 (I 997) 7S- I10
a limit to the error rate which sustains a stationary master phenotype (despite
always changing genotypes).
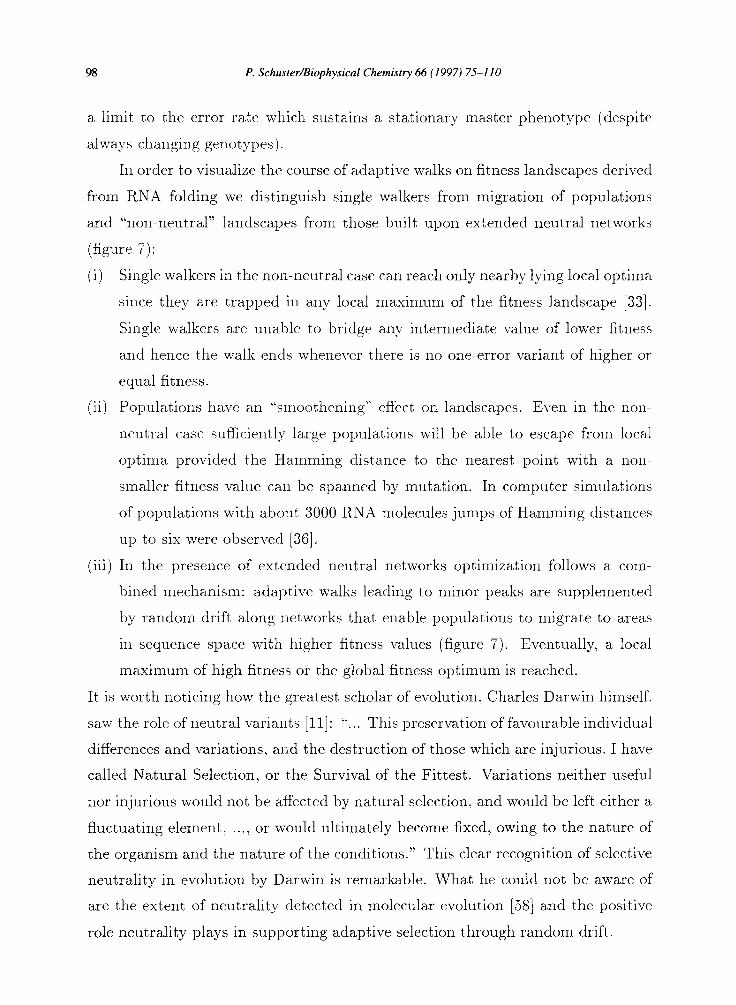
In order to visualize the course of adaptive walks on fitness landscapes derived
from RNA folding we distinguish single walkers from migration of populations
and “non-neutral” landscapes from those built upon extended neutral networks
(figure 7):
(i) Single walkers in the non-neutral case can reach only nearby lying local optima
since they are trapped in a,ny local maximum of the fitness landscape [33].
Single walkers are unable to bridge any intermediate value of lower fitness
and hence the walk ends whenever there is no one-error variant of higher or
equal fitness.
(ii) Populations have an “smoothening” effect on landscapes. Even in the non-
neutral case sufficiently large populations will be able to escape from local
optima provided the Hamming distance to the nearest point with a non
smaller fitness value can be spa.nned by mutation. In computer simulations
of populations with about 3000 RNA molecules jumps of Hamming distances
up to six were observed [36].
(iii) In the p resence of extended neutral networks optimization follows a com-
bined mechanism: adaptive walks leading to minor peaks are supplemented
by random drift along networks that enable populations to migrate to areas
in sequence space with higher fitness values (figure 7). Eventually, a local
maximum of high fitness or the global fitness optimum is reached.
It is worth noticing how the greatest scholar of evolution, Charles Darwin himself.
saw the role of neutral variants [ll]: ‘.... This preservation of favourable individual
differences and variations, and the destruction of those which are injurious, I have
called Natural Selection, or the Survival of the Fittest. Variations neither useful
nor injurious would not be affected by natural selection, and would be left either a
fluctuating element, . . , or would ultimately become fixed, owing to the nature of
the organism and the nature of the conditions.” This clear recognition of selective
neutrality in evolution by Darwin is remarkable. What he could not be aware of
are the extent of neutrality detected in molecular evolution [58] and the positive
role neutrality plays in supporting adaptive selection through random drift.

P. Schuster/Biophysical Chemistry 66 (1997) 75-l 10
Adaptive Walks without Selective Neutrality
Start of Walk
Sequence Space
Adaptive Walk on Neutral Networks
I End of Walk
’ Start of Walk
Sequence Space
Figure 7: Optimization in sequence space through adaptive walks of populations.
Adaptive walks allow to choose the next step arbitrarily from all directions of where
fitness is (locally) non-decreasing. Populations can bridge over narrow valleys with
widths of a few point mutations. In absence of selective neutrality (upper part)
they are, however, unable to span larger Hamming distances and thus will approach
only the next major fitness peak. Populations on rugged landscapes with extended
neutral networks evolve by a combination of adaptive walks and random drift at
constant fitness along the network (lower part). Eventually populations reach the
global maximum of the fitness landscape.

100 I? SchustedBiophysical Chemistry 66 (1997) 75-l IO
Genetic Diversity
Diversification
Selection +
Figure 8: Evolutionary design of biopolymers. Properties and catalytic functions of
biomolecules are optimized iteratively through selection cycles. Each cycle consists of
three different phases: amplification, diversification by replication with high error rates
or random synthesis, and selection. Currently successful selection techniques apply one
of two strategies: (i) selection in (homogeneous) mixtures using binding to solid phase
targets (SELEX) [29, 901 or reactive tags that allow to separate suitable molecules
from the rest [52] and (ii) spatial separation of individual molecular genotypes and
large scale screening [59, 75, 761.

P. SchustedBiophysical Chemistry 66 (1997) 75-110 101
Since Spiegelman’s pioneering works on evolution of RNA molecules in vitro
many different studies were dealing with the optimization of biopolymers by means
of evolutionary techniques. Serial transfer experiments in the presence of increas-
ing concentrations of the RNA degrading enzyme RNase A, for example, yielded
“resistant” RNA molecules [86]. Catalytic RNA molecules of the group I intron
family were trained to cleave DNA rather than RNA [3, 611, the SELEX technique
[29, 901 was applied to the selection of RNA molecules which bind to predefined
targets with high specificity [50], and ribozymes with novel catalytic functions
were derived from libraries of random RNA sequences [2, 9, 651. Other approaches
made use of in viva selection to derive new variants of biopolymers [lo. 681 or
exploited the capacities of the immune system for evolutionary optimization in
the design of catalytic antibodies [63, 771.
In fact, in vitro evolution experiments laid out the basis for a new discipline
called evolutionary biotechnology or applied molecular evolution [25, 52,
54, 551. In particular, the selection of RNA molecules that bind optimally to pre-
defined targets has already become routine [28]. Attempts were made to apply
the results of the theoretical approach presented here to the evolutionary design
of RNA molecules [79]. I n order to “breed” molecules for predefined purposes
one cannot be satisfied with natural selection being tantamount to a search for
the fastest replicating molecular species. In “artificial selection” the properties
to be optimized must be disconnected from mere replication. The principle of
evolutionary design of biomolecules is shown in figure 8. Molecular properties are
optimized iteratively in selection cycles. The first cycle is initiated by a sample
of random sequences or alternatively by a population derived from error prone
replication of RNA (or DNA) sequences. Each selection cycle consists of three
steps: (i) selection of suitable RNA molecules, (ii) amplification through replica-
tion, and (iii) d iversification through mutation (with artificially increased error
rates). The first step, selection of the genotypes that fulfil the predefined criteria
best, requires biochemical and biophysical intuition or technological skill. Two
strategies are used at present: selection of best suited candidates from a large
sample of different genotypes in homogeneous solutions or spatial separation of
genotypes and massively parallel screening. Variants are tested and discarded in

102 P. SchustedBiophysical Chemistry 66 (1997) 75-1 IO
case they do not fulfil the predefined criteria. Selected genotypes are amplified.
diversified by mutation with error rates adjusted to the current problem, and then
the new population is again subjected to selection. Optimally adapted genotypes
are usually obtained after some twenty to fifty selection cycles. After isolation they
can be processed by the conventional methods of molecular biology and genetic
engineering.
6. Conclusions and perspectives
Molecular evolution experiments with RNA molecules provided essentially two
important insights into the nature of evolutionary processes:
(i) the Darwinian principle of (natural) selection is no priviledge of cellular life
since it is valid also for evolution in the test-tube, and
(ii) evolution is speeded up by many orders of magnitude in typical laboratory
experiments and thus adaptation to the environment and optimization of
molecular properties can be observed within days or weeks.
Speeding up evolution by reducing generation times to less than a minute made
selection and adaptation to environment a subject of laboratory investigations.
The enormous potential residing in the application of molecular evolution to the
design of biopolymers was recognized within the last decade and successful pi-
oneering experiments raised great hopes in a novel kind of biotechnology that
copies the most successful principle of nature. In order to be able to create and
optimize biomolecules with an efficiency suitable for technological applications,
further development of the theory of evolution is required. Just as chemical engi-
neering would be doomed to fail without a solid background in chemical kinetics
and material science, evolutionary biotechnology can’t be successful without a
comprehensive knowledge on molecular evolution and structural biology.
Most of the results on genotype-phenotype mapping presented here were de-
rived from coarse-grained structures evaluated by means of the minimum free
energy criterium of RNA folding. The validity of the statistical results, like shape
space covering or the existence of extended neutral networks, is, however, not
P. SchustedBiophysical Chemistry 66 (1997) 75-l 10 103
limited to minimum free energy folding since they belong to the (largely) algo-
rithm independent properties of RNA secondary structures [88]. They depend, in
essence, only on the ratio of sequences to (acceptable) structures. In this respect,
RNA secondary structures provide us with a toy world of vast neutrality that
allows to study the powerful interplay of adaptive and neutral evolution.
Whether or not the results obtained with secondary structures are of gen-
eral vahdity and thus can be transferred to three-dimensional structures of RNA
molecules is an open question. There are, however, strong indications that this will
be so although the degree of neutrality is expected to be somewhat smaller than
with the secondary structures. The answer to this question will be obtained from
suitable experiments that screen structures and properties of RNA molecules over
sufficiently large parts of sequence space. Corresponding experiments dealing with
binding of RNA molecules to predefined targets as the property to be optimized
are under way in several groups. Preliminary data confirm the existence of neu-
tral networks with respect to (coarse-grained) binding constants. A whole wealth
of data on protein folding and resilience of protein structures against exchanges
of amino acid residues seems to provide ample evidence for the validity of shape
space covering and the existence of extended neutral networks for proteins too.
Neutral evolution, apparently, is not a dispensable addendum to evolutionary
optimization as it has been often suggested. In contrary, neutral networks provide
a powerful medium through which evolution can become really efficient. Adaptive
walks of populations, usually ending in one of the nearby minor peaks of the
fitness landscape, are supplemented by random drift on neutral networks. Periods
of neutral diffusion end when the populations reach areas of higher fitness values.
Series of adaptive walks interrupted by phases of (selectively neutral) random
drift allow to approach the global minimum provided the neutral networks are
sufficiently large.
This review has initially considered the language of evolution. Surely enough,
we have now a very detailed knowledge on the language of genetics and the ma-
chinery processing genetic information. Evolution, however, is dealing with the
evaluation of phenotypes and thus the core problem is to understand the relations
between genotypes and phenotypes. The cases analyzed here are especially simple
104 P. SchustedBiophysical Chemistry 66 (1997) 75-110
since genotypes and phenotypes are two features of the same molecule and then
genotype-phenotype mapping becomes tantamount to sequence-structure relations
of RNA molecules, often apostrophed as the “second half of the genetic code” [38].
Although prediction of biopolymer structures is a very hard problem, it is, nev-
ertheless, doable and modeling of RNA evolution in vitro can be carried out in a
kind of toy universe. All natural systems are substantially more involved but for
RNA viruses [19] and eubacteria [62, 891 current progress in the research of evo-
lutionary phenomena is fast. It is at least conceivable that comprehensive models
of procaryote evolution which deal with phenotypes explictly will be developed in
the not too distant future.
Acknowledgements
The author had the pleasure and priviledge to work together with Manfred Eigen
on molecular evolution since the late sixties. He is thankful for a wonderful coop-
eration over almost three decades. The dynamical concept of molecular evolution
presented here was developed together with Drs. Walter Fontana, Christian Forst,
Martijn Huynen, Christian Reidys, and Peter F. Stadler. Many fruitful discussion
with them are gratefully acknowledged. Financial support for the work presented
here was provided by the Austrian Fonds zur Ftirderung der wissenschuftlichen
Forschung (Projects P-10578 and P-11065), by the Commission of the European
Union (Contract Study PSS*O884), and by the Santa Fe Institute.
References
[l] C. Amitrano, L. Peliti, and M. Saber. A spin-glass model of evolution. In A. S. Perelson and S. A. Kauffman, editors, Molecular Evolution on Rugged Landscapes, volume IX of Santa Fe Institute Studies in the Sciences of Com- plezity, pages 27-38. Add ison-Wesley Publ. Co., Redwood City, CA, 1991.
[2] D. P. B ar e and J. W. Szostak. Isolation of new ribozymes from a large t 1 pool of random sequences. Science, 261:1411-1418, 1993.
[3] A. A. Beaudry and G. F. Joyce. Directed evolution of an RNA enzyme. Science, 257:635-641, 1992.

P. Schuster/Biophysical Chemistry 66 (1997) 75-1 IO 105
[4] C. K. Biebricher. Replication and evolution of short-chained RNA species by Q/3 replicase. Cold Spring Harbor Symp. Quant. Biol., 52:299-306, 1988.
[5] C. K. Biebricher and M. Eigen. Kinetics of RNA replication by Qp repli- case. In E. Domingo, J. J. Holland, and P. Ahlquist, editors, RNA Genetics. Vo1.I: RNA Directed Virus Replication, pages 1-21. CRC Press, Boca Ra- ton, FL, 1988.
[6] C. K. B’ b ’ h ie ric er? M. Eigen, W. C. Gardiner, Y. Husimi, H. C. Keweloh, and A. Obst. Modeling studies of RNA replication and viral infection. In J. Warnatz and W. Jager, editors. Complex Chemical Reaction Systems: Mathematical Modeling and Simulation. Proceedings of the Second Work- shop, pages 17--38, Berlin: 1987. Springer-Verlag.
[7] T. R. Cech. RNA as an enzyme. Sci. Am., 255(5):76-84, 1986.
[8] T. R. Cech. Self-splicing of group I introns. Ann. Rev. Biochem., 59:543- 568, 1990.
[9] K. B. Chapman and J. W. Szostak. In vitro selection of catalytic RNAs. Curr. Opinion in Struct. Biol., 4:618-622, 1994.
[lo] F. C. Ch ’ t ris ians and L. A. Loeb. Novel human DNA alkyltranferases ob- tained by random substitution and genetic selection in bacteria. Proc. Natl. Acad. Sci. USA, 93:6124-6128, 1996.
[ll] C. R. Darwin. The Origin of Species, page 81. Number 811 in Everyman’s Library. J. M. Dent & Sons, Aldine House, Bedford Street, London, UK, 1928.
[la] M. 0. Dayhoff and W. C. Barker. Mechanisms in molecular evolution: Ex- amples. In M. 0. Dayhoff, editor, Atlas of Protein Sequence and Structure, Vol. 5, pages 41-45. Natl. Biomed. Res. Found., Silver Spring, MD, 1972.
[13] L. Demetrius, P. Schuster, and K. Sigmund. Polynucleotide evolution and branching processes. Bull. Math. Biol., 47:239-262, 1985.
[14] B. Derrida. Random-energy model: An exactly solvable model of disordered systems. Phys. Rev. B, 24:2613-2626, 1981.
[15] B. Derrida and L. Peliti. Evolution in a flat fitness landscape. Bull. Math. Biol., 531355-382, 1991.
[16] T. Dobzhansky. Nothing in biolology makes sense except in the light of evolution. Am. Bio. Teacher, 35:1255129, 1973.
[17] E. Domingo. Virus quasispecies: Impact for disease control. Futura, 3/90:6- 8, 1990.
[18] E. Domingo, M. Davila, and J. Ortin. Nucleotide sequence heterogeneity of the RNA from a population of foot-and-mouth disease virus. Gene, 11:333- 346, 1980.
[19] E. Domingo, J. J. Holland, and P. Ahlquist, editors. RNA Genetics. CRC Press, Boca Raton, FL, 1988.

106 P. Schusrer/Biophysical Chemistry 66 (1997) 75-l 10
[20] E. Domingo, D. Sabo, T. Taniguchi, and C. Weissmann. Nucleotide se- quence heterogeneity of an RNA phage population. Cell, 13:735-744, 1978.
[21] M. Eigen. Selforganization of matter and the evolution of biological macro- molecules. Nuturwissenschuften, 58:465-523, 1971.
[22] M. Eigen. M acromolecular evolution: Dynamical ordering in sequence space. Ber. Bunsenges. Phys. Chem., 89:658-667, 1985.
[23] M. Eigen and C. K. Biebricher. Sequence space and quasispecies distribu- tion. In E. Domingo, J. J. Holland, and P. Ahlquist, editors, RNA Genetics.
Vol.III: Variability of Virus Genornes, pages 211-245. CRC Press, Boca Ra- t’on, FL. 1988.
[24] M. Eigen, C. K. Biebricher, M. Gebinoga, and W. C. Gardiner. The hyper- cycle. Coupling of RNA and protein biosynthesis in the infection cycle of an RNA bacteriophage. Biochemistry, 30:11005511018, 1991.
[25] M. Eigen and W7. C. Gardiner. Evolutionary molecular engineering based on RNA replication. Pure Appl. Chem., 56:967-978, 1984.
[26] M. Eigen, J. McCaskill, and P. Schuster. The molecular quasispecies. Adv. Chem. Phys., 75:149 - 263, 1989.
[27] M. Eigen and P. Schuster. The hypercycle. A principle of natural self-or- ganization. Part A: Emergence of the hypercycle. Nuturwissenschuften, 64:541-565, 1977.
[28] A. D. Ell’ gt m on. Aptamers achieve the desired recognition. Current Biology, 41427-429, 1994.
[29] A. D. El1 in on and J. W. Szostak. In vitro selection of RNA moleucles gt that bind specific ligands. Nature, 346:818-822, 1990.
[30] C. Escarmis, M. Davila, N. Charpentier, A. Bracho, A. Moya, a,nd E. Domingo. G ene ic t 1 esions associated with muller’s ratchet in an RNA virus. J. Mol. Biol., 264:255-267, 1996.
[31] W. Fontana and L. Buss. “the arrival of the fittest”: Toward a theory of biological organization. Bull. Muth. Biol., 56: l-64, 1994.
[32] W. Fontana and L. Buss. What would be conserved “if the tape were played twice”. Proc. Nutl. Ad. Sci. USA, 71:757-761, 1994.
[33] W. Fontana, T. Griesrnacher, W. Schnabl, P. F. Stadler, and P. Schuster. Statistics of landscapes based on free energies, replication and degradation rate constants of RNA secondary structures. Mh. Chem., 122:7955819, 1991.
[34] W. Fontana, D. A. M. Konings, P. F. Sta.dler, and P. Schuster. Statistics of RNA secondary structures. Biopolymers, 33:1389-1404, 1993.
[35] W. Fontana, W. Schnabl, and P. Schuster. Physical aspects of evolutionary optimization and adaptation. Phys. Rev. A, 40:3301-3321, 1989.
[36] W. Fontana and P. Schuster. A computer model of evolutionary optimiza- tion. Biophys. Chem., 26: 1233147, 1987.

P. SchustedBiophysical Chemistry 66 (1997) 75-l IO 107
[37] Galileo Galilei. Opere. volume 6, page 232. Barbera, Firenze, Italy, A. Favaro edition. 1968. The original quotation reads: .‘___ It (the great book of the u.nkerse) is wrztten in the
language of mathematzcs and its symbols are triangles, circles, “.
[38] L. M. Gierasch and J. King, editors. Protein Folding. Deciphering the Sec- ond Half of the Genetic Code. American Association for the Advancement of Science, Washington. DC. 1990.
[39] WT. Gilbert. The RNA world. Nuture. 319:618, 1986.
[40] W. Griiner, R. Giegerich, D. Strothmann, C. Reidys, J. Weber, I. L. Ho- facker, P. F. Stadler, and P. Schuster. Analysis of RNA sequence structure maps by exhaustive enumera,tion. I. Neutral networks. Mh.Chem., 127:355- 374, 1996.
[41] W. Griiner, R. Giegerich, D. Strothmann, C. Reidys, J. Weber, I. L. Ho- facker, P. F. Stadler, and P. Schuster. Analysis of RNA sequence struc- ture maps by exhaustive enumera,tion. II. Structure of neutral networks and shape space covering. Mh. Chern., 127:375&389, 1996.
[42] C’. Guerrier-Taka,da, K. Gardiner. T. Marsh. N. Pace: and S. Altman. The RNA moiety of ribonuclease P is the catalytic subunit of the enzyme. Cell, 35:849-857, 1983.
[43] R. W. Hamming. Error detecting and error correcting codes. Bell Syst. Tech.. J.. 39:137-160, 1950.
[+I] P. G. Higg s and B. Derrida. Stochastic models for species formation in evolving populations. J. Physics A, 24:L9855L991, 1991.
[45] P. G. Higg s and B. Derrida. Genetic distance and species formation in evolving populations. J. Mol. Euol.. 35:454-465, 1992.
[46] I. L. H f k o ac er, W. Fontana, P. F. Stadler, S. Bonhoeffer, M. Tacker, and P. Schuster. Fast folding and comparison of RNA secondary structures. Mh. Chem., 125:167--188; 1994.
[47] I. L. H f k o ac er, P. Schuster, and P. F. Stadler. Combinatorics of RNA sec- ondary structures. Preprint, 1996.
PI p. H t3 g o ewe and B. Hesper. Energy directed folding of RNA sequences. Nu- cleic Acids Research, 12:67-74, 1984.
[49] M. A. H u y nen, P. F.Stadler, and W. Fontana,. Smoothness within rugged- ness: The role of neutrality in adaptation. Proc. Natl. Acad. Sci. USA, 93:397--401, 1996.
[50] R. D. Jenison, S. C. Gill, A. Pardi, and B. Polisky. High-resolution molecu- lar discrimination by RNA. Science, 263:1425-1429, 1994.
[51] G. F. Joyce. RNA evolution and the origins of life. Nature, 338:217-224, 1989.
[52] G. F. Joyce. D’ u-ected molecular evolution. Sci. Am., 267(6):48%55, 1992.

108 P. SchustedBiophysical Chemistry 66 (1997) 75-110
[53] H. F. Judson. The Eighth Day of Creation - The Makers of the Revolution in Biology. Jonathan Cape Ltd., London, 1979.
[54] S. A. Kauffman. Autocatalytic sets of proteins. J. Theor. Biol., 119:1-24, 1986.
[55] S. A. Kauffman. Applied molecular evolution. J. Theor. Biol., 157:ll7, 1992.
[56] S. A. Kauffman and S. Levine. Towards a general theory of adaptive walks on rugged landscapes. J. Theor. Biol., 128:11-45, 1987.
[57] S. A. Kauffman and E. D. Weinberger. The n-k model of rugged fitness landscapes and its application to maturation of the immune response. J. Theor. Biol., 141:211-245, 1989.
[58] M. Kimura. The Neutral Theory of Molecular Evolution. Cambridge Univer- sity Press, Cambridge, UK, 1983.
[59] J. M. K ii hl er, R. Pechmann, A. Scharper? A. Schober, T. M. Jovin, M. Thiirk, and A. Schwienhorst. Micromachanical elements for the detec- tion of molecules and molecular design. Microsystems Technol., 1:202-208, 1995.
[60] D. Konings and P. Hogeweg. Pattern analysis of RNA secondary structure. Similarity and consensus of minimal-energy folding. J. Mol. Biol., 207:597- 614, 1989.
[61] N. Lehman and G. F. <Joyce. Evolution in vitro: Analysis of a lineage of ribozymes. Current Biology, 3:723-734, 1993.
[62] R. E. Lenski and M. Travisano. Dynamics of adaptation and diversification: A lO,OOO-generation experiment with bacterial populations. Proc. Natl. Acad. Sci. USA, 91:6808-6814, 1994.
[63] R. A. Lerner, S. ,J. Benkovic, and P. G. Schultz. At the crossroads of chem- istry and immunology: Catalytic antibodies. Science, 252:6599667, 1991.
[64] H. Li, R. Helling, C. Tang, and N. Wingreen. Emergence of preferred struc- tures in a simple model of protein folding. Science, 273:666-669, 1996.
[65] J. R. Lorsch and J. W. Szostak. In vitro evolution of new ribozymes with polynucleotide kinase activity. Nature, 371:31-36, 1994.
[66] A. M. Martin-H ernandez, E. Domingo, and L. Menkdez-Arias. Human immunodeficiency virus reverse transcriptase: Role of tyr 115 in deoxynu- cleotide binding and misinsertion fidelity of DNA synthesis. EMBO J., 150:4434-4442, 1996.
[67] D. R. Mills, R. L. P e erson, and S. Spiegelman. An extracellular Darwinian t experiment with a self-duplicating nucleic acid molecule. Proc. Natl. Acad. Sci. USA, 58:217-224, 1967.
[68] K. M. Munir, D. C. French, and L. A. Loeb. Thymidine kinase mutants obtained by random selection. Proc. Natl. Acad. Sci. USA, 90:4012-1016, 1993.

P. Schuster/Biophysical Chemistry 66 (1997) 75-l 10 109
[69] M. Nei and R. K. Koehn, editors. Evolution of Genes and Proteins. Sinauer Associates Inc., Sunderland, MA, 1983.
[70] M. Nowak and P. Schuster. Error thresholds of replication in finite popu- lations. Mutation frequencies and the onset of Muller’s ratchet. J. Theor. Biol., 137:375-395, 1989.
[71] D. Park. The H ow and the Why. An essay on the Origins and Development of Physical Theory. Princeton University Press, Princeton, NJ, 1988.
[72] C. Reidys, C. V. Forst: and P. Schuster. Replication on neutral networks of RNA secondary structures. Preprint, 1996.
[73] C. Reidy s and P. F. Stadler. Bio-molecular shapes and algebraic structures. Computers Chem., 20:85594, 1996.
[74] C. Reidys, P. F. Stadler, and P. Schuster. Generic properties of combina- tory maps - Neutral networks of RNA secondary structures. Bull. M&h. Biol.. 59:339-397, 1997.
[75] A. Schober, A. Schwienhorst, J. M. Kijhler, M. Fuchs, R. Gunther, and M. Thiirk. Microsystems for independent parallel chemical and biochemi- cal processing. Microsystems Tech,nol., 1:168-172, 1995.
[76] A. Schober, N. G. Walter, U. Tangen, G. Strunk, T. Ederhof, J. Dapprich, and M. Eigen. Multichannel PCR and serial transfer machine as a future tool in evolutionary biotechnology. Bio Techniques, 18:652-658, 1995.
[77] P. G. Schultz. Catalytic antibodies. Angew. Chem., 28:1283-1295, 1989.
[78] P. S h t c us er. Artificial life and molecular evolutionary biology. In F. Moran, A. Moreno, J. J. Morelo, and P. Chacon, editors, Advances in Artificial Life, volume 929 of Lecture Notes in Artificial Intelligence, pages 3-19. Springer-Verlag, Berlin, 1995.
1791 P. Schuster. How to search for RNA structures. Theoretical concepts in evolutionary biotechnology. Journal of Biotechnology, 41:239-257, 1995.
[80] P. Schuster. H ow does complexity arise in evolution? Complexity, 2:22230, 1996.
[81] P. S h t c us er, W. Fontana, P. F. Sta,dler, and I. L. Hofacker. From sequences to shapes and back: A case study in RNA secondary structures. Proc. Roy.Soc. (London)B, 25512799284, 1994.
[82] P. Schuster and P. F. Stadler. Landscapes: Complex optimization problems and biopolymer structures. Computers Chem., 18:295-314, 1994.
[83] P. Schuster, P. F. Stadler, and A. Renner. RNA Structure and folding. From conventional to new issues in structure predictions. Curr. Opinion in Struct. Biol., 7(3), 1997. In press.
[84] P. Schuster and J. Swetina. Stationary mutant distribution and evolution- ary optimization. Bull. Math. Biol., 50:6355660, 1988.

110 I? Schuster/Biophysical Chemistry 66 (1997) 75-l 10
[85] S. Sp ie e man. g 1 An approach to the experimental analysis of precellular evo- lution. Quart. Rev. Biophys.! 4:213-253, 1971.
[86] G. St,runk. Automatized evolution experiments in vitro and natural selection under controlled conditions by means of the serial transfer technique. PhD thesis, Universitat Braunschweig, 1993.
[87] J. Swetina and P. Schuster. Self-replication with errors - A model for polynucleotide replication. Biophys. Chem., 16:3299345, 1982.
[88] M. Tacker, P. F. Stadler, E. G. Bornberg-Bauer, I. L. Hofacker, and P. Schuster. Algorithm independent properties of RNA secondary structure predictions. Eur.Biophys.J., 25:115-130, 1996.
[89] M. Travisano and R. E. Lenski. Long-term experimental evolution in es- cherichia coli. IV. Targets of selection and the specificity of adaptation. Ge- netics, 143:15-26, 1996.
[90] C. T uer and L. Gold. Systematic evolution of ligands by exponential en- k richment: RNA ligands to bacteriophage T4 DNA polymerase. Science, 249:5055510, 1990.
[91] M. S. W t a erman. Secondary structure of single-stranded nucleic acids. Stud- ies on foundations and combinatorics. Advances in Mathematics. Supple- mentary studies. Academic Press N. Y., 1:1677212, 1978.
[92] J. Weber, C. Reidys, C. Forst, and P. Schuster. Evolutionary dynamics on neutral networks. Preprint, IMB Jena. Germany, 1996.
[93] T. Wiehe, E. B aa k e, and P. Schuster. Error propagation in reproduction of diploid orga,nisms. A case study in single peaked landscapes. J. Theor. Biol.: 177:1--~15. 1995.
[94] S. Wright. Th e roles of mutation, inbreeding, crossbreeding and selection in evolution. In D. F. Jones, editor, Int. Proceedings of the Sixth International Congress on Genetics, volume 1, pages 3566366, 1932.
[95] M. Zuker and D. Sankoff. RNA secondary structures and their prediction. Bull. Math. Biol., 46:591-621, 1984.