Embed Size (px)
DESCRIPTION
Pharmacogenetics for Genes Associated with Age-Related M acular Degeneration in the Comparison of AMD Treatments Trials (CATT). Hagstrom SA, Ying G-S, Pauer GJT, Sturgill -Short GM, Huang J, Callanan DG, Kim IK, Klein ML, Maguire MG , Martin DF for the CATT Research Group - PowerPoint PPT Presentation
Citation preview

1
Pharmacogenetics for Genes Pharmacogenetics for Genes Associated with Age-Related Associated with Age-Related Macular Degeneration in the Macular Degeneration in the
Comparison of AMD Treatments Comparison of AMD Treatments Trials (CATT)Trials (CATT)
Hagstrom SA, Ying G-S, Pauer GJT, Hagstrom SA, Ying G-S, Pauer GJT, Sturgill-Short GM, Sturgill-Short GM, Huang J, Callanan DG, Kim IK, Klein ML, Huang J, Callanan DG, Kim IK, Klein ML, Maguire MGMaguire MG,
Martin DF for the CATT Research Groupfor the CATT Research Group
Available through Available through http://www.med.upenn.edu/cpob/publications_main.shtml
Hagstrom SA, Ying G-S, Pauer GJT, Hagstrom SA, Ying G-S, Pauer GJT, Sturgill-Short GM, Sturgill-Short GM, Huang J, Callanan DG, Kim IK, Klein ML, Huang J, Callanan DG, Kim IK, Klein ML, Maguire MGMaguire MG,
Martin DF for the CATT Research Groupfor the CATT Research Group
Available through Available through http://www.med.upenn.edu/cpob/publications_main.shtmlSupported by Cooperative Agreements from the Supported by Cooperative Agreements from the
National Eye Institute, National Institutes of Health, National Eye Institute, National Institutes of Health, DHHSDHHS

Genotype Genotype DeterminationDetermination
Each patient was genotyped for Each patient was genotyped for CFHCFH, , ARMS2ARMS2, , HTRA1HTRA1, and , and C3C3..
Gene SNP ExonAmino Acid
CFH rs1061170
9 Y402H
ARMS2
rs10490924
1 A69S
HTRA1 rs11200638
promoter
-
C3 rs2230199
3 R80G
InflammationLipid Metabolism
Angiogenesis
Oxidative Stress
ECM StasisAMD
Biological PathwaysVEGFA
KDR
CFIBF
CFHC3C2
ARMS2ND2
HTRA1TIMP3
COL8A1FRK
APOELIPCCETP
LPLABCA1
Hagstrom et al. Pharmacogenetics of Anti-VEGF Therapy in CATT Ophthalmology 2013;120:593-599
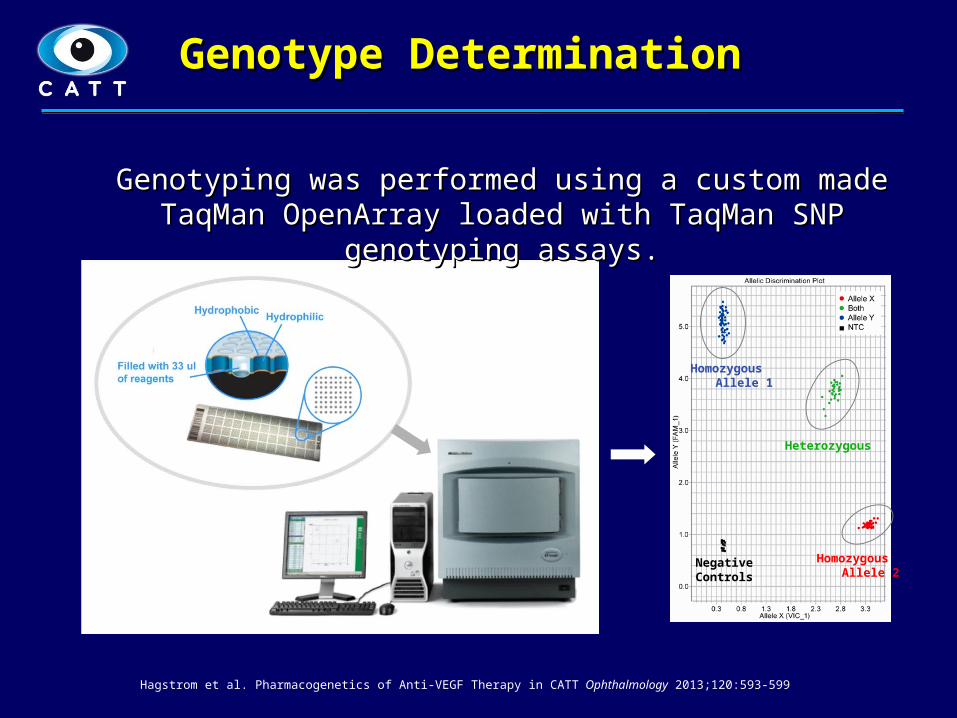
Homozygous Allele 1
Homozygous Allele 2
Heterozygous
NegativeControls
Genotyping was performed using a custom made Genotyping was performed using a custom made TaqMan OpenArray loaded with TaqMan SNP genotyping TaqMan OpenArray loaded with TaqMan SNP genotyping
assays.assays.
Genotype Genotype DeterminationDetermination
Hagstrom et al. Pharmacogenetics of Anti-VEGF Therapy in CATT Ophthalmology 2013;120:593-599

Outcome VariablesOutcome Variables
All outcomes were determined following standardized All outcomes were determined following standardized protocols.protocols.
VA assessed using eETDRS VA assessed using eETDRS testingtesting
OCT outcomes determined by OCT outcomes determined by independent OCT Reading independent OCT Reading
Center Center
FA and photographic outcomes FA and photographic outcomes determined by independent determined by independent
Fundus Photographic Reading Fundus Photographic Reading CenterCenter
Hagstrom et al. Pharmacogenetics of Anti-VEGF Therapy in CATT Ophthalmology 2013;120:593-599

Comparison of baseline demographic and ocular Comparison of baseline demographic and ocular characteristics between participants and non-characteristics between participants and non-
participants in the genetic study (N=1149)participants in the genetic study (N=1149)
Hagstrom et al. Pharmacogenetics of Anti-VEGF Therapy in CATT Ophthalmology 2013;120:593-599
Baseline CharacteristicsSubjects in
genetic study
(N=834)
Alive subjects not in genetic
study
(N=315)
P Value
Age (years): Mean (SD) 78.5 (7.5) 80.9 (7.2) <0.0001
Female (%) 510 (61.2) 204 (64.8) 0.28
Former or current cigarette smoker (%) 483 (57.9) 169 (53.7) 0.36Presence of hypertension (%) 563 (67.5) 232 (73.7) 0.045Taking AREDS supplement (%) 536 (64.3) 189 (60.0) 0.21
Baseline VA (letters): Mean (SD) 61.3 (13.3) 58.8 (13.7) 0.005
Baseline area of CNV (DA): Mean (SD) 1.70 (1.69) 1.91 (1.90) 0.096Baseline total area of CNV lesion (DA):
Mean (SD)2.47 (2.55) 2.49 (2.54) 0.87
Presence of occult lesion (%) 505 (60.6) 169 (53.7) 0.04
Presence of RAP lesion (%) 80 (9.6) 41 (13.0) 0.12Total foveal thickness (microns): Mean
(SD)462 (190) 456 (180) 0.60
SD = standard deviation; AREDS = age-related eye disease study; VA = visual acuity; DA = disc area.

Visual Outcomes by Visual Outcomes by GenotypeGenotype
6
GeneGene GenotypeGenotype nnMean VA Mean VA in lettersin letters
Mean VA Mean VA changechange
in lettersin letters
≥ ≥ 15 letters 15 letters increaseincrease
CFH
CC 270 70 7.9 28%
TC 391 68 8.2 29%
TT 173 69 8.6 34%
P-Value 0.30 0.61 0.22
ARMS2
TT 170 69 8.2 28%
GT 398 69 8.3 31%
GG 266 70 7.9 28%
P-Value 0.51 0.77 0.97
HTRA1
AA 162 69 8.4 29%
AG 398 69 8.2 31%
GG 274 69 7.9 29%
P-Value 0.68 0.69 0.99
C3
GG 56 71 8.1 28%
CG 318 70 8.9 31%
CC 460 68 7.6 29%
P-Value 0.03 0.34 0.72
# of Risk
Alleles
0-1 123 68 7.0 29%
2 141 69 9.1 33%
3 175 69 7.9 27%
4 170 69 8.1 31%
>=5 225 70 8.5 29%
P-Value 0.42 0.66 0.71
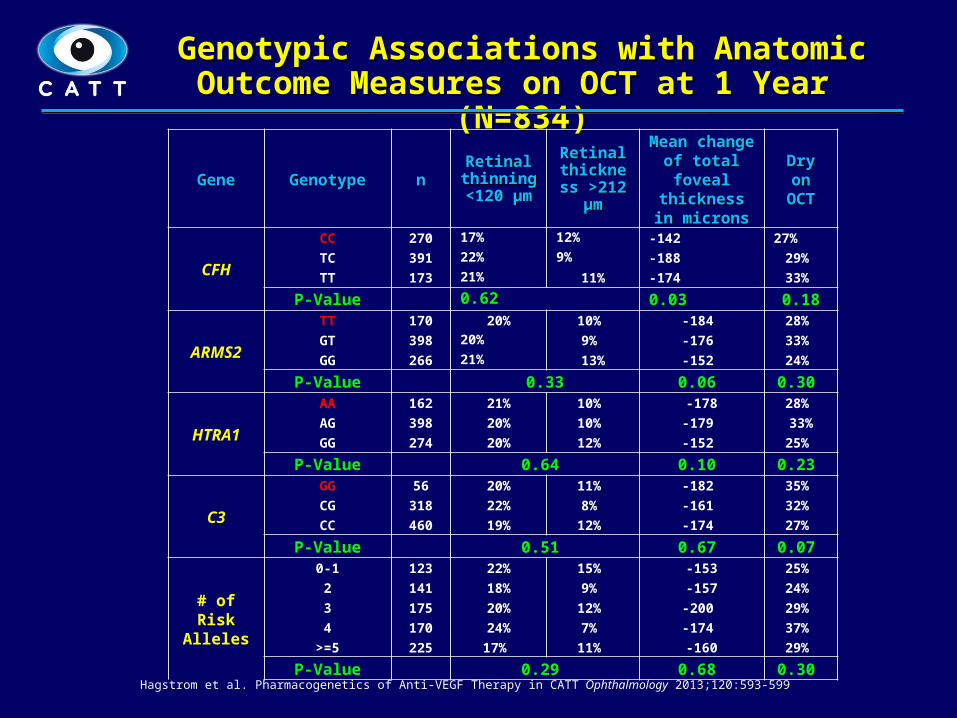
Genotypic Associations with Anatomic Genotypic Associations with Anatomic Outcome Measures on OCT at 1 Year Outcome Measures on OCT at 1 Year
(N=834)(N=834)
7
GeneGene GenotypeGenotype nn
Retinal Retinal thinning thinning
<120 <120 µmµm
Retinal Retinal thicknethickness >212 ss >212
µmµm
Mean Mean change of change of
total foveal total foveal thickness thickness in micronsin microns
Dry Dry on on
OCTOCT
CFH
CC 270 17% 12% -142 27%
TC 391 22% 9% -188 29%
TT 173 21% 11% -174 33%
P-Value 0.62 0.03 0.18
ARMS2
TT 170 20% 10% -184 28%
GT 398 20% 9% -176 33%
GG 266 21% 13% -152 24%
P-Value 0.33 0.06 0.30
HTRA1
AA 162 21% 10% -178 28%
AG 398 20% 10% -179 33%
GG 274 20% 12% -152 25%
P-Value 0.64 0.10 0.23
C3
GG 56 20% 11% -182 35%
CG 318 22% 8% -161 32%
CC 460 19% 12% -174 27%
P-Value 0.51 0.67 0.07
# of Risk
Alleles
0-1 123 22% 15% -153 25%
2 141 18% 9% -157 24%
3 175 20% 12% -200 29%
4 170 24% 7% -174 37%
>=5 225 17% 11% -160 29%
P-Value 0.29 0.68 0.30 Hagstrom et al. Pharmacogenetics of Anti-VEGF Therapy in CATT Ophthalmology 2013;120:593-599

FA and Fundus Outcomes by Genotype FA and Fundus Outcomes by Genotype (N=834(N=834))
8
GeneGene GenotypeGenotype nnDye leakage Dye leakage
on FAon FA
Mean change Mean change in lesion size in lesion size in disc areain disc area
CFH
CC 270 46% 0.2
TC 391 47% 0.2
TT 173 44% 0.4
P-Value 0.71 0.48
ARMS2
TT 170 49% 0.5
GT 398 44% 0.0
GG 266 48% 0.4
P-Value 0.89 0.80
HTRA1
AA 162 49% 0.5
AG 398 43% 0.1
GG 274 49% 0.3
P-Value 0.84 0.42
C3
GG 56 50% 0.0
CG 318 45% 0.1
CC 460 46% 0.3
P-Value 0.85 0.28
# of Risk
Alleles
0-1 123 55% 0.2
2 141 45% 0.5
3 175 38% 0.1
4 170 44% 0.0
>=5 225 50% 0.3
P-Value 0.93 0.80
Hagstrom et al. Pharmacogenetics of Anti-VEGF Therapy in CATT Ophthalmology 2013;120:593-599
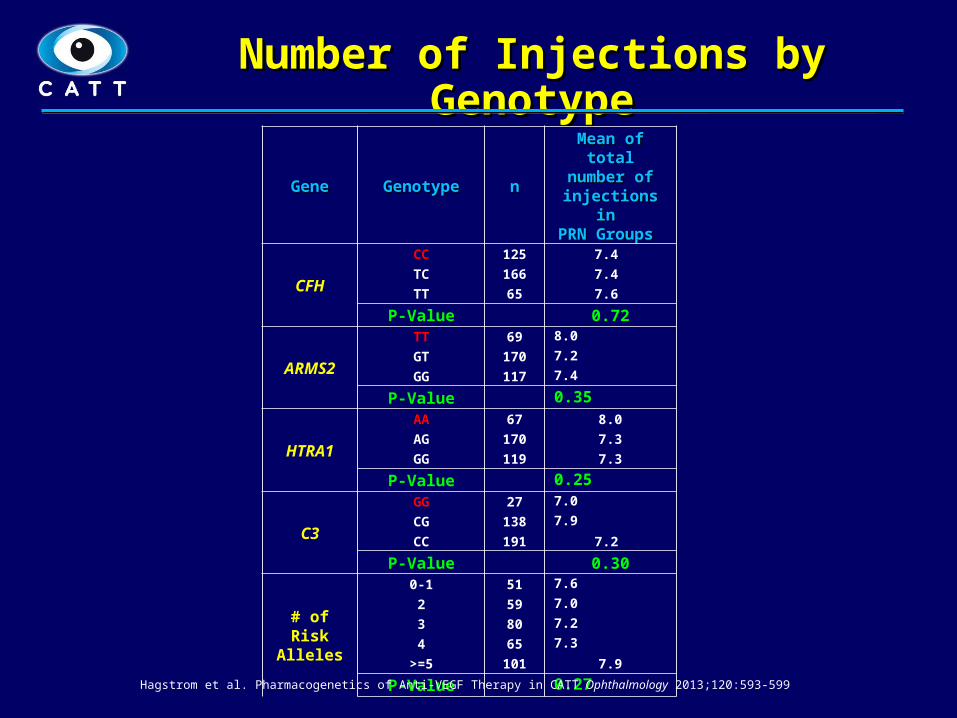
Number of Injections by Number of Injections by GenotypeGenotype
9
GeneGene GenotypeGenotype nn
Mean of Mean of total total
number of number of injections in injections in PRN Groups PRN Groups
CFH
CC 125 7.4
TC 166 7.4
TT 65 7.6
P-Value 0.72
ARMS2
TT 69 8.0
GT 170 7.2
GG 117 7.4
P-Value 0.35
HTRA1
AA 67 8.0
AG 170 7.3
GG 119 7.3
P-Value 0.25
C3
GG 27 7.0
CG 138 7.9
CC 191 7.2
P-Value 0.30
# of Risk
Alleles
0-1 51 7.6
2 59 7.0
3 80 7.2
4 65 7.3
>=5 101 7.9
P-Value 0.27Hagstrom et al. Pharmacogenetics of Anti-VEGF Therapy in CATT Ophthalmology 2013;120:593-599

ConclusionsConclusions
10
Largest pharmacogenetic analysis exploring the Largest pharmacogenetic analysis exploring the relationship between genotypes and response to anti-relationship between genotypes and response to anti-VEGF therapy with >90% power to detect a 1 line VEGF therapy with >90% power to detect a 1 line difference between the highest risk and lowest risk difference between the highest risk and lowest risk groups.groups.
The relationship between genotype and response to The relationship between genotype and response to therapy did not vary by drug or dosing regimen.therapy did not vary by drug or dosing regimen.
Although specific risk alleles for Although specific risk alleles for CFHCFH, , ARMS2ARMS2, , HTRA1HTRA1 and and C3C3 may predict the development of AMD, they did may predict the development of AMD, they did not predict response to anti-VEGF therapy. not predict response to anti-VEGF therapy.
Further studies targeting SNPs in additional biological Further studies targeting SNPs in additional biological pathways are ongoing.pathways are ongoing.
Hagstrom et al. Pharmacogenetics of Anti-VEGF Therapy in CATT Ophthalmology 2013;120:593-599