Embed Size (px)
Citation preview

0 0 M O N T H 2 0 1 5 | V O L 0 0 0 | N A T U R E | 1© 2015 Macmillan Publishers Limited. All rights reserved
ARTICLEdoi:10.1038/nature16152
Genome-wide patterns of selection in 230 ancient EurasiansIain Mathieson1, Iosif Lazaridis1,2, Nadin Rohland1,2, Swapan Mallick1,2,3, Nick Patterson2, Songül Alpaslan Roodenberg4, Eadaoin Harney1,3, Kristin Stewardson1,3, Daniel Fernandes5, Mario Novak5,6, Kendra Sirak5,7, Cristina Gamba5,8†, Eppie R. Jones8, Bastien Llamas9, Stanislav Dryomov10,11, Joseph Pickrell1†, Juan Luís Arsuaga12,13, José María Bermúdez de Castro14, Eudald Carbonell15,16, Fokke Gerritsen17, Aleksandr Khokhlov18, Pavel Kuznetsov18, Marina Lozano15,16, Harald Meller19, Oleg Mochalov18, Vyacheslav Moiseyev20, Manuel A. Rojo Guerra21, Jacob Roodenberg22, Josep Maria Vergès15,16, Johannes Krause23,24, Alan Cooper9, Kurt W. Alt19,25,26, Dorcas Brown27, David Anthony27, Carles Lalueza-Fox28, Wolfgang Haak9,23*, Ron Pinhasi5* & David Reich1,2,3*
The arrival of farming in Europe around 8,500 years ago necessitated adaptation to new environments, pathogens, diets and social organi-zations. While indirect evidence of this adaptation can be detected in patterns of genetic variation in present-day people1, these patterns are only echoes of past events, which are difficult to date and interpret, and are often confounded by neutral processes. Ancient DNA provides a direct way to study these patterns, and should be a transformative technology for studies of selection, just as it has transformed studies of human pre-history. Until now, however, the large sample sizes required to detect selection have meant that studies of ancient DNA have con-centrated on characterizing effects at parts of the genome already believed to have been affected by selection2–5.
Genome-wide ancient DNA from West EurasiaWe assembled genome-wide data from 230 ancient individuals from West Eurasia dated to between 6500 and 300 !" (Fig. 1a, Extended Data Table 1, Supplementary Data Table 1 and Supplementary Information section 1). To obtain this data set, we combined published data from 67 samples from relevant periods and cultures4–6, with 163 samples for which we report new data, of which 83 have, to our knowledge,
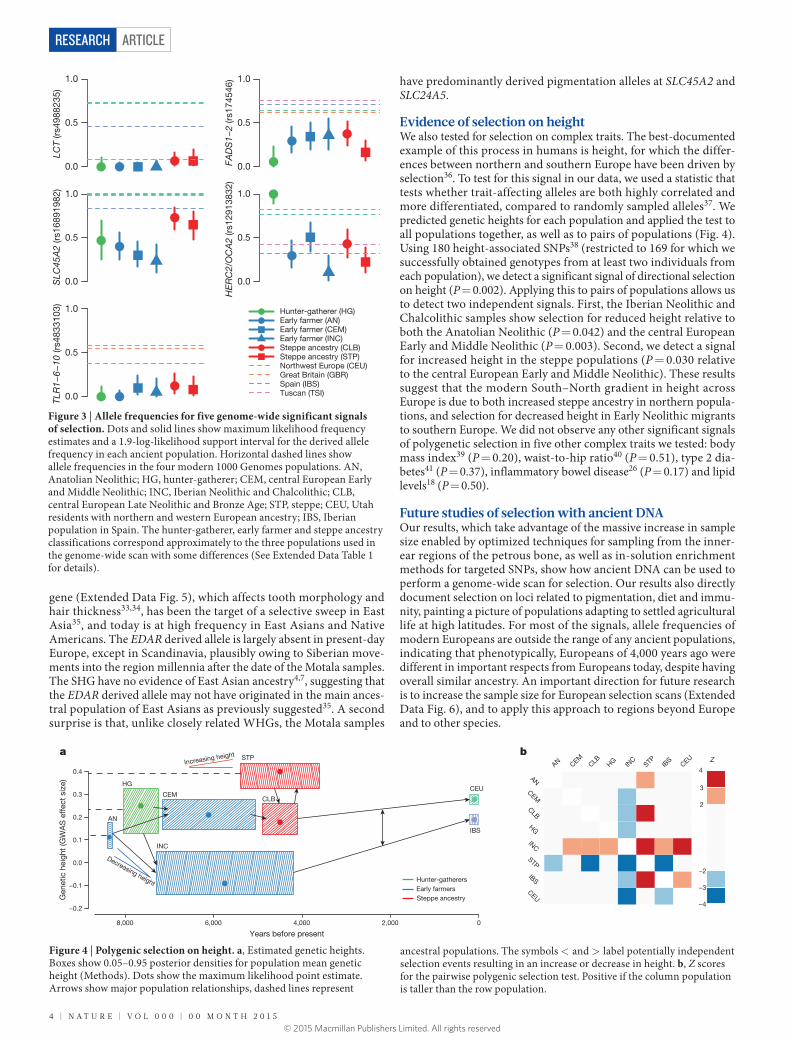
never previously been analysed (the remaining 80 samples include 67 whose targeted single nucleotide polymorphism (SNP) coverage we tripled from 390,000 (‘390k capture’) to 1,240,000 (‘1240k capture’)7; and 13 with shotgun data for which we generated new data using our targeted enrichment strategy3,8). The 163 samples for which we report new data are drawn from 270 distinct individuals who we screened for evidence of authentic DNA7. We used in-solution hybridization with synthesized oligonucleotide probes to enrich promising libraries for the targeted SNPs (Methods). The targeted sites include nearly all SNPs on the Affymetrix Human Origins and Illumina 610-Quad arrays, 49,711 SNPs on chromosome X, 32,681 SNPs on chromosome Y, and 47,384 SNPs with evidence of functional importance. We merged libraries from the same individual and filtered out samples with low coverage or evidence of contamination to obtain the final set of individuals. The 1240k capture gives access to genome-wide data from ancient samples with small fractions of human DNA and increases efficiency by tar-geting sites in the human genome that will actually be analysed. The effectiveness of the approach can be seen by comparing our results to the largest previously published ancient DNA study, which used a shotgun sequencing strategy5. Our median coverage on analysed SNPs
Ancient DNA makes it possible to observe natural selection directly by analysing samples from populations before, during and after adaptation events. Here we report a genome-wide scan for selection using ancient DNA, capitalizing on the largest ancient DNA data set yet assembled: 230 West Eurasians who lived between 6500 and 300 !", including 163 with newly reported data. The new samples include, to our knowledge, the first genome-wide ancient DNA from Anatolian Neolithic farmers, whose genetic material we obtained by extracting from petrous bones, and who we show were members of the population that was the source of Europe’s first farmers. We also report a transect of the steppe region in Samara between 5600 and 300 !", which allows us to identify admixture into the steppe from at least two external sources. We detect selection at loci associated with diet, pigmentation and immunity, and two independent episodes of selection on height.
1Department of Genetics, Harvard Medical School, Boston, Massachusetts 02115, USA. 2Broad Institute of MIT and Harvard, Cambridge, Massachusetts 02142, USA. 3Howard Hughes Medical Institute, Harvard Medical School, Boston, Massachusetts 02115, USA. 4Independent researcher, Santpoort-Noord, The Netherlands. 5School of Archaeology and Earth Institute, Belfield, University College Dublin, Dublin 4, Ireland. 6Institute for Anthropological Research, Zagreb 10000, Croatia. 7Department of Anthropology, Emory University, Atlanta, Georgia 30322, USA. 8Smurfit Institute of Genetics, Trinity College Dublin, Dublin 2, Ireland. 9Australian Centre for Ancient DNA, School of Biological Sciences & Environment Institute, University of Adelaide, Adelaide, South Australia 5005, Australia. 10Laboratory of Human Molecular Genetics, Institute of Molecular and Cellular Biology, Siberian Branch of the Russian Academy of Sciences, Novosibirsk 630090, Russia. 11Department of Paleolithic Archaeology, Institute of Archaeology and Ethnography, Siberian Branch of the Russian Academy of Sciences, Novosibirsk 630090, Russia. 12Centro Mixto UCM-ISCIII de Evolución y Comportamiento Humanos, 28040 Madrid, Spain. 13Departamento de Paleontología, Facultad Ciencias Geológicas, Universidad Complutense de Madrid, 28040 Madrid, Spain. 14Centro Nacional de Investigacíon sobre Evolución Humana (CENIEH), 09002 Burgos, Spain. 15IPHES. Institut Català de Paleoecologia Humana i Evolució Social, Campus Sescelades-URV, 43007 Tarragona, Spain. 16Area de Prehistoria, Universitat Rovira i Virgili (URV), 43002 Tarragona, Spain. 17Netherlands Institute in Turkey, Istiklal Caddesi, Nur-i Ziya Sokak 5, Beyog lu 34433, Istanbul, Turkey. 18Volga State Academy of Social Sciences and Humanities, Samara 443099, Russia. 19State Office for Heritage Management and Archaeology Saxony-Anhalt and State Museum of Prehistory, D-06114 Halle, Germany. 20Peter the Great Museum of Anthropology and Ethnography (Kunstkamera) RAS, St Petersburg 199034, Russia. 21Department of Prehistory and Archaeology, University of Valladolid, 47002 Valladolid, Spain. 22The Netherlands Institute for the Near East, Leiden RA-2300, the Netherlands. 23Max Planck Institute for the Science of Human History, D-07745 Jena, Germany. 24Institute for Archaeological Sciences, University of Tübingen, D-72070 Tübingen, Germany. 25Danube Private University, A-3500 Krems, Austria. 26Institute for Prehistory and Archaeological Science, University of Basel, CH-4003 Basel, Switzerland. 27Anthropology Department, Hartwick College, Oneonta, New York 13820, USA. 28Institute of Evolutionary Biology (CSIC-Universitat Pompeu Fabra), 08003 Barcelona, Spain. †Present addresses: Centre for GeoGenetics, Natural History Museum of Denmark, University of Copenhagen, Øster Voldgade 5–7, 1350 Copenhagen, Denmark (C.G.); New York Genome Center, New York, New York 10013, USA (J.P.).*These authors contributed equally to this work.

2 | N A T U R E | V O L 0 0 0 | 0 0 M O N T H 2 0 1 5
ARTICLERESEARCH
© 2015 Macmillan Publishers Limited. All rights reserved
is approximately fourfold higher even while the mean number of reads generated per sample is 36-fold lower (Extended Data Fig. 1).
Insight into population transformationsTo learn about the genetic affinities of the archaeological cultures for which genome-wide data are reported for the first time here, we studied either 1,055,209 autosomal SNPs when analysing 230 ancient individuals alone, or 592,169 SNPs when co-analysing them with 2,345 present-day individuals genotyped on the Human Origins array4. We removed 13 samples either as outliers in ancestry relative to others of the same archaeologically determined culture, or first-degree relatives (Supplementary Data Table 1).
Our sample of 26 Anatolian Neolithic individuals represents the first genome-wide ancient DNA data from the eastern Mediterranean. Our success at analysing such a large number of samples is due to the fact that in the case of 21 of the successful samples, we obtained DNA from the inner ear region of the petrous bone9, which has been shown to increase the amount of DNA obtained by up to two orders of magnitude relative to teeth3. Principal component (PCA) and ADMIXTURE10 analyses show that the Anatolian Neolithic samples do not resemble any present-day near-Eastern populations but are shifted towards Europe, clustering with early European farmers (EEF) from Germany, Hungary and Spain7 (Fig. 1b and Extended Data Fig. 2). Further evidence that
the Anatolian Neolithic and EEF were related comes from the high frequency (47%; n = 15) of Y-chromosome haplogroup G2a typical of ancient EEF samples7 (Supplementary Data Table 1), and the low fixa-tion index (FST; 0.005 – 0.016) between Neolithic Anatolians and EEF (Supplementary Data Table 2). These results support the hypothesis7 of a common ancestral population of EEF before their dispersal along distinct inland/central European and coastal/Mediterranean routes. The EEF are slightly more shifted to Europe in the PCA than are the Anatolian Neolithic (Fig. 1b) and have significantly more admixture from Western hunter-gatherers (WHG), as shown by f4-statistics (|Z| > 6 standard errors from 0) and negative f3-statistics (|Z| > 4)11 (Extended Data Table 2). We estimate that the EEF have 7–11% more WHG admixture than their Anatolian relatives (Extended Data Fig. 2, Supplementary Information section 2).
The Iberian Chalcolithic individuals from El Mirador cave are genet-ically similar to the Middle Neolithic Iberians who preceded them (Fig. 1b and Extended Data Fig. 2), and have more WHG ancestry than their Early Neolithic predecessors7 (|Z| > 10) (Extended Data Table 2). However, they do not have a significantly different proportion of WHG ancestry (we estimate 23–28%) than the Middle Neolithic Iberians (Extended Data Fig. 2). Chalcolithic Iberians have no evi-dence of steppe ancestry (Fig. 1b and Extended Data Fig. 2), in contrast to central Europeans of the same period5,7. Thus, the steppe-related ancestry that is ubiquitous across present-day Europe4,7 arrived in Iberia later than in central Europe (Supplementary Information section 2).
To understand population transformations in the Eurasian steppe, we analysed a time transect of 37 samples from the Samara region spanning ~5600–1500 !" and including the Eastern hunter-gath-erer (EHG), Eneolithic, Yamnaya, Poltavka, Potapovka and Srubnaya cultures. Admixture between populations of Near Eastern ancestry and the EHG7 began as early as the Eneolithic (5200–4000 !"), with some individuals resembling EHG and some resembling Yamnaya (Fig. 1b and Extended Data Fig. 2). The Yamnaya from Samara and Kalmykia, the Afanasievo people from the Altai (3300–3000 !"), and the Poltavka Middle Bronze Age (2900–2200 !") population that fol-lowed the Yamnaya in Samara are all genetically homogeneous, forming a tight ‘Bronze Age steppe’ cluster in PCA (Fig. 1b), sharing predom-inantly R1b Y chromosomes5,7 (Supplementary Data Table 1), and having 48–58% ancestry from an Armenian-like Near Eastern source (Extended Data Table 2) without additional Anatolian Neolithic or EEF ancestry7 (Extended Data Fig. 2). After the Poltavka period, popula-tion change occurred in Samara: the Late Bronze Age Srubnaya have ~17% Anatolian Neolithic or EEF ancestry (Extended Data Fig. 2). Previous work documented that such ancestry appeared east of the Urals beginning at least by the time of the Sintashta culture, and suggested that it reflected an eastward migration from the Corded Ware peoples of central Europe5. However, the fact that the Srubnaya also had such ancestry indicates that the Anatolian Neolithic or EEF ancestry could have come into the steppe from a more eastern source. Further evidence that migrations originating as far west as central Europe may not have had an important impact on the Late Bronze Age steppe comes from the fact that the Srubnaya possess exclusively (n = 6) R1a Y chromosomes (Supplementary Data Table 1), and four of them (and one Poltavka male) belonged to haplogroup R1a-Z93, which is common in central/south Asians12, very rare in present-day Europeans, and absent in all ancient central Europeans studied to date.
Twelve signals of selectionTo study selection, we created a data set of 1,084,781 autosomal SNPs in 617 samples by merging 213 ancient samples with genome-wide sequencing data from four populations of European ancestry from the 1,000 Genomes Project13. Most present-day Europeans can be modelled as a mixture of three ancient populations related to Western hunter-gatherers (WHG), early European farmers (EEF) and steppe pastoralists (Yamnaya)4,7, and so to scan for selection, we divided our
Figure 1 | Population relationships of samples. a, Locations colour-coded by date, with a random jitter added for visibility (8 Afanasievo and Andronovo samples lie further east and are not shown). b, Principal component analysis of 777 modern West Eurasian samples (grey), with 221 ancient samples projected onto the first two principal component axes and labelled by culture. E/M/LN, Early/Middle/Late Neolithic; LBK, Linearbandkeramik; E/WHG, Eastern/Western hunter-gatherer; EBA, Early Bronze Age; IA, Iron Age; LNBA, Late Neolithic and Bronze Age.
7,0006,0005,0004,0003,0002,0001,000
0Date BC
WHGMotala HGEHGSamara EneolithicYamnaya KalmykiaYamnaya SamaraAfanasievoPoltavka
Poltavka outlierPotapovkaRussia EBASrubnayaSrubnaya outlierSintashtaAndronovoAndronovo outlier
Anatolia NeolithicAnatolia Neolithic outlierHungary ENLBK ENIberia ENCentral MNIberia MNIceman
RemedelloIberia ChalcolithicCentral LNBACentral LNBA outlierBell Beaker LNNorthern LNBAHungary BAScythian IA
Western European hunter-gatherers
Scandinavian hunter-gatherers
Eastern European hunter-gatherers
Eneolithic SamaraBronze Age (steppe)
Srubnaya
Sintashta/Andronovo
Anatolia NeolithicEarly Neolithic
Middle NeolithicChalcolithic Iberia
a
b

0 0 M O N T H 2 0 1 5 | V O L 0 0 0 | N A T U R E | 3
ARTICLE RESEARCH
© 2015 Macmillan Publishers Limited. All rights reserved
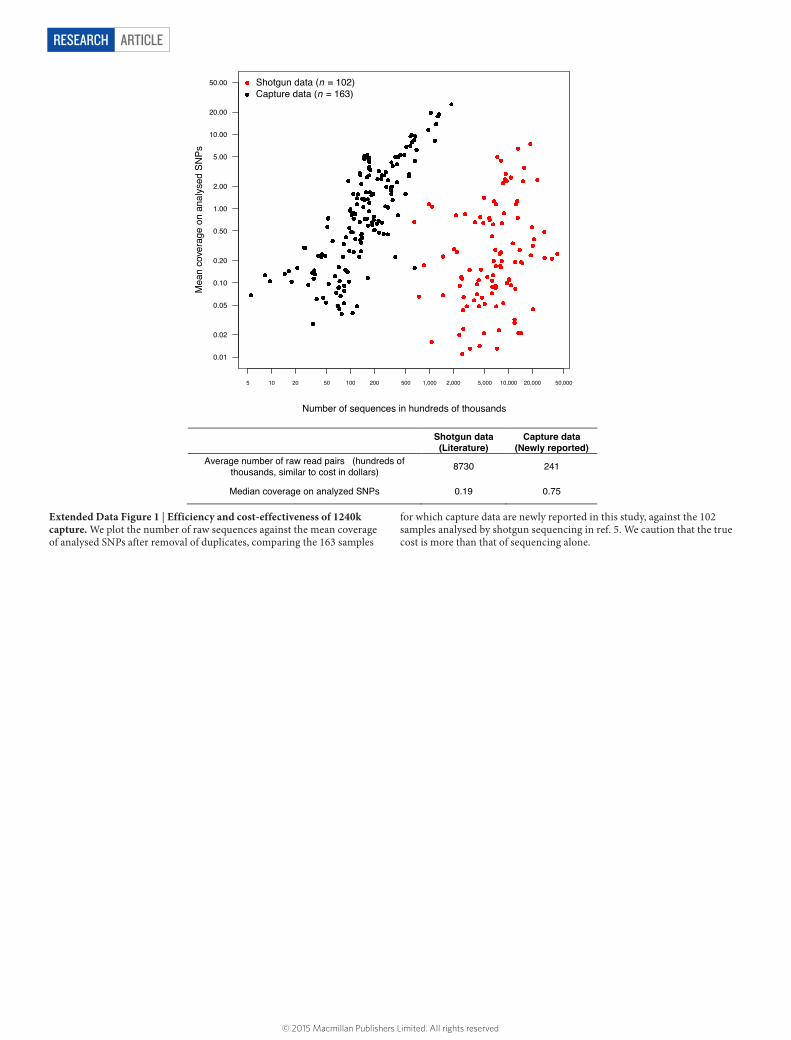
samples into three groups based on which of these populations they clustered with most closely (Fig. 1b and Extended Data Table 1). We estimated mixture proportions for the present-day European ancestry populations and tested every SNP to evaluate whether its present-day frequencies were consistent with this model. We corrected for test statistic inflation by applying a genomic control correction analogous to that used to correct for population structure in genome-wide asso-ciation studies14. Of approximately one million non-monomorphic autosomal SNPs, the ~50,000 in the set of potentially functional SNPs were significantly more inconsistent with the model than neutral SNPs (Fig. 2), suggesting pervasive selection on polymorphisms of functional importance. Using a conservative significance threshold of P = 5.0 ! 10"8, and a genomic control correction of 1.38, we iden-tified 12 loci that contained at least three SNPs achieving genome-wide significance within 1 Mb of the most associated SNP (Fig. 2, Extended Data Table 3, Extended Data Fig. 3 and Supplementary Data Table 3).
The strongest signal of selection is at the SNP (rs4988235) responsi-ble for lactase persistence in Europe15,16. Our data (Fig. 3) strengthens previous reports that an appreciable frequency of lactase persistence in Europe only dates to the last 4,000 years3,5,17. The allele’s earliest appearance in the dataset is in a central European Bell Beaker sample (individual I0112) dated to between 2450 and 2140 !". Two other independent signals related to diet are located on chromosome 11 near FADS1 and DHCR7. FADS1 and FADS2 are involved in fatty acid metabolism, and variation at this locus is associated with plasma lipid and fatty acid concentration18. The selected allele of the most significant SNP (rs174546) is associated with decreased triglyceride levels18. This locus has experienced independent selection in non-Eu-ropean populations13,19,20 and is likely to be a critical component of adaptation to different diets. Variants at DHCR7 and NADSYN1 are associated with circulating vitamin D levels21 and the most associ-ated SNP in our analysis, rs7940244, is highly differentiated across closely related northern European populations22,23, suggesting selection related to variation in dietary or environmental sources of vitamin D.
Two signals have a potential link to coeliac disease. One occurs at the ergothioneine transporter SLC22A4 that is hypothesized to have expe-rienced a selective sweep to protect against ergothioneine deficiency in agricultural diets24. Common variants at this locus are associated with increased risk for ulcerative colitis, coeliac disease, and irritable bowel
disease and may have hitchhiked to high frequency as a result of this sweep24–26. However, the specific variant (rs1050152, L503F) that was thought to be the target did not reach high frequency until relatively recently (Extended Data Fig. 4). The signal at ATXN2/SH2B3—also associated with coeliac disease25—shows a similar pattern (Extended Data Fig. 4).
The second strongest signal in our analysis is at the derived allele of rs16891982 in SLC45A2, which contributes to light skin pigmentation and is almost fixed in present-day Europeans but occurred at much lower frequency in ancient populations. In con-trast, the derived allele of SLC24A5 that is the other major deter-minant of light skin pigmentation in modern Europe (and that is not significant in the genome-wide scan for selection) appears fixed in the Anatolian Neolithic, suggesting that its rapid increase in frequency to around 0.9 in Early Neolithic Europe was mostly due to migration (Extended Data Fig. 4). Another pigmenta-tion signal is at GRM5, where SNPs are associated with pigmen-tation possibly through a regulatory effect on nearby TYR27. We also find evidence of selection for the derived allele of rs12913832 at HERC2/OCA2, which is at 100% frequency in the European hunter- gatherers we analysed, and is the primary determinant of light eye colour in present-day Europeans28,29. In contrast to the other loci, the range of frequencies in modern populations is within that of ancient populations (Fig. 3). The frequency increases with higher latitude, suggesting a complex pattern of environmental selection.
The TLR1–TLR6–TLR10 gene cluster is a known target of selec-tion in Europe, possibly related to resistance to leprosy, tuberculosis or other mycobacteria30–32. There is also a strong signal of selection at the major histocompatibility complex (MHC) on chromosome 6. The strongest signal is at rs2269424 near the genes PPT2 and EGFL8, but there are at least six other apparently independent signals in the MHC (Extended Data Fig. 3); and the entire region is significantly more associated than the genome-wide average (residual inflation of 2.07 in the region on chromosome 6 between 29–34 Mb after genome-wide genomic control correction). This could be the result of multiple sweeps, balancing selection, or increased drift as a result of background selection reducing effective population size in this gene-rich region.
We find a surprising result in six Scandinavian hunter-gatherers (SHG) from Motala in Sweden. In three of six samples, we observe the haplotype carrying the derived allele of rs3827760 in the EDAR
Figure 2 | Genome-wide scan for selection. GC-corrected –log10 P#value for each marker (Methods). The red dashed line represents a genome-wide significance level of 0.5 ! 10"8. Genome-wide significant points filtered because there were fewer than two other genome-wide significant points within 1#Mb are shown in grey. Inset, quantile–quantile plots for corrected –log10 P#values for different categories of potentially functional SNPs
(Methods). Truncated at " log10[P#value] = 30. All curves are significantly different from neutral expectation. CMS, composite of multiple signals selection hits; HiDiff, highly differentiated between HapMap populations; Immune, immune-related; HLA, human leukocyte antigen type tag SNPs; eQTL, expression quantitative trait loci (see Methods).
1 2 3 4 5 6 7 8 9 10 11 12 13 14 15 16 17 18 20 22
50
40
30
20
10
0
–log
10[P
val
ue]
Chromosome
30
25
20
15
10
5
0
0 1 2 3 4 5 6Expected –log10[P value]
Obs
erve
d –l
og10
[P v
alue
]
NeutralGWASCMSHiDiffImmuneHLAeQTL
LCT
TLR1-6-10
SLC
45A2
SLC
22A4 MH
CZK
SCAN3 DHCR7
FADS1-2
GRM5
ATX
N2
Chr
13:3
8.8
HER
C2
4 | N A T U R E | V O L 0 0 0 | 0 0 M O N T H 2 0 1 5
ARTICLERESEARCH
© 2015 Macmillan Publishers Limited. All rights reserved
gene (Extended Data Fig. 5), which affects tooth morphology and hair thickness33,34, has been the target of a selective sweep in East Asia35, and today is at high frequency in East Asians and Native Americans. The EDAR derived allele is largely absent in present-day Europe, except in Scandinavia, plausibly owing to Siberian move-ments into the region millennia after the date of the Motala samples. The SHG have no evidence of East Asian ancestry4,7, suggesting that the EDAR derived allele may not have originated in the main ances-tral population of East Asians as previously suggested35. A second surprise is that, unlike closely related WHGs, the Motala samples
have predominantly derived pigmentation alleles at SLC45A2 and SLC24A5.
Evidence of selection on heightWe also tested for selection on complex traits. The best-documented example of this process in humans is height, for which the differ-ences between northern and southern Europe have been driven by selection36. To test for this signal in our data, we used a statistic that tests whether trait-affecting alleles are both highly correlated and more differentiated, compared to randomly sampled alleles37. We predicted genetic heights for each population and applied the test to all populations together, as well as to pairs of populations (Fig. 4). Using 180 height-associated SNPs38 (restricted to 169 for which we successfully obtained genotypes from at least two individuals from each population), we detect a significant signal of directional selection on height (P = 0.002). Applying this to pairs of populations allows us to detect two independent signals. First, the Iberian Neolithic and Chalcolithic samples show selection for reduced height relative to both the Anatolian Neolithic (P = 0.042) and the central European Early and Middle Neolithic (P = 0.003). Second, we detect a signal for increased height in the steppe populations (P = 0.030 relative to the central European Early and Middle Neolithic). These results suggest that the modern South–North gradient in height across Europe is due to both increased steppe ancestry in northern popula-tions, and selection for decreased height in Early Neolithic migrants to southern Europe. We did not observe any other significant signals of polygenetic selection in five other complex traits we tested: body mass index39 (P = 0.20), waist-to-hip ratio40 (P = 0.51), type 2 dia-betes41 (P = 0.37), inflammatory bowel disease26 (P = 0.17) and lipid levels18 (P = 0.50).
Future studies of selection with ancient DNAOur results, which take advantage of the massive increase in sample size enabled by optimized techniques for sampling from the inner-ear regions of the petrous bone, as well as in-solution enrichment methods for targeted SNPs, show how ancient DNA can be used to perform a genome-wide scan for selection. Our results also directly document selection on loci related to pigmentation, diet and immu-nity, painting a picture of populations adapting to settled agricultural life at high latitudes. For most of the signals, allele frequencies of modern Europeans are outside the range of any ancient populations, indicating that phenotypically, Europeans of 4,000#years ago were different in important respects from Europeans today, despite having overall similar ancestry. An important direction for future research is to increase the sample size for European selection scans (Extended Data Fig. 6), and to apply this approach to regions beyond Europe and to other species.
!0.2
!0.1
0.0
0.1
0.2
0.3
0.4
Gen
etic
hei
ght (
GW
AS
effe
ct s
ize)
!
8,000 6,000 4,000 2,000 0
STP
HG
AN
CEMCLB
INC
CEU
IBS
Increasing height
Decreasing height
a
Steppe ancestryEarly farmersHunter-gatherers
Years before present
AN CEMCLB HG IN
CSTP IB
SCEU
CEU
IBS
STP
INC
HG
CLB
CEM
AN
!4
!3
!2
2
3
4
Zb
Figure 4 | Polygenic selection on height. a, Estimated genetic heights. Boxes show 0.05–0.95 posterior densities for population mean genetic height (Methods). Dots show the maximum likelihood point estimate. Arrows show major population relationships, dashed lines represent
ancestral populations. The symbols < and > label potentially independent selection events resulting in an increase or decrease in height. b, Z scores for the pairwise polygenic selection test. Positive if the column population is taller than the row population.
0.0
0.5
1.0
LCT
(rs49
8823
5)
0.0
0.5
1.0
FADS1!
2 (rs
1745
46)
0.0
0.5
1.0
SLC
45A2
(rs16
8919
82)
0.0
0.5
1.0
HER
C2/OCA2
(rs12
9138
32)
0.0
0.5
1.0
TLR1!
6!10
(rs4
8331
03)
Hunter-gatherer (HG)Early farmer (AN)Early farmer (CEM)Early farmer (INC)Steppe ancestry (CLB)Steppe ancestry (STP)Northwest Europe (CEU)Great Britain (GBR)Spain (IBS)Tuscan (TSI)
Figure 3 | Allele frequencies for five genome-wide significant signals of selection. Dots and solid lines show maximum likelihood frequency estimates and a 1.9-log-likelihood support interval for the derived allele frequency in each ancient population. Horizontal dashed lines show allele frequencies in the four modern 1000 Genomes populations. AN, Anatolian Neolithic; HG, hunter-gatherer; CEM, central European Early and Middle Neolithic; INC, Iberian Neolithic and Chalcolithic; CLB, central European Late Neolithic and Bronze Age; STP, steppe; CEU, Utah residents with northern and western European ancestry; IBS, Iberian population in Spain. The hunter-gatherer, early farmer and steppe ancestry classifications correspond approximately to the three populations used in the genome-wide scan with some differences (See Extended Data Table 1 for details).

0 0 M O N T H 2 0 1 5 | V O L 0 0 0 | N A T U R E | 5
ARTICLE RESEARCH
© 2015 Macmillan Publishers Limited. All rights reserved
Online Content Methods, along with any additional Extended Data display items and Source Data, are available in the online version of the paper; references unique to these sections appear only in the online paper.
Received 12 March; accepted 30 October 2015. Published online 23 November 2015.
1. Grossman, S. R. et al. Identifying recent adaptations in large-scale genomic data. Cell 152, 703–713 (2013).
2. Wilde, S. et al. Direct evidence for positive selection of skin, hair, and eye pigmentation in Europeans during the last 5,000 y. Proc. Natl Acad. Sci. USA 111, 4832–4837 (2014).
3. Gamba, C. et al. Genome !ux and stasis in a "ve millennium transect of European prehistory. Nature Commun. 5, 5257 (2014).
4. Lazaridis, I. et al. Ancient human genomes suggest three ancestral populations for present-day Europeans. Nature 513, 409–413 (2014).
5. Allentoft, M. E. et al. Population genomics of Bronze Age Eurasia. Nature 522, 167–172 (2015).
6. Keller, A. et al. New insights into the Tyrolean Iceman’s origin and phenotype as inferred by whole-genome sequencing. Nature Commun. 3, 698 (2012).
7. Haak, W. et al. Massive migration from the steppe was a source for Indo-European languages in Europe. Nature 522, 207–211 (2015).
8. Olalde, I. et al. Derived immune and ancestral pigmentation alleles in a 7,000-year-old Mesolithic European. Nature 507, 225–228 (2014).
9. Pinhasi, R. et al. Optimal ancient DNA yields from the inner ear part of the human petrous bone. PLoS ONE 10, e0129102 (2015).
10. Alexander, D. H., Novembre, J. & Lange, K. Fast model-based estimation of ancestry in unrelated individuals. Genome Res. 19, 1655–1664 (2009).
11. Patterson, N. et al. Ancient admixture in human history. Genetics 192, 1065–1093 (2012).
12. Underhill, P. A. et al. The phylogenetic and geographic structure of Y-chromosome haplogroup R1a. Eur. J. Hum. Genet. 23, 124–131 (2015).
13. The 1000 Genomes Project Consortium. A global reference for human genetic variation. Nature 526, 68–74 (2015).
14. Devlin, B. & Roeder, K. Genomic control for association studies. Biometrics 55, 997–1004 (1999).
15. Enattah, N. S. et al. Identi"cation of a variant associated with adult-type hypolactasia. Nature Genet. 30, 233–237 (2002).
16. Bersaglieri, T. et al. Genetic signatures of strong recent positive selection at the lactase gene. Am. J. Hum. Genet. 74, 1111–1120 (2004).
17. Burger, J., Kirchner, M., Bramanti, B., Haak, W. & Thomas, M. G. Absence of the lactase-persistence-associated allele in early Neolithic Europeans. Proc. Natl Acad. Sci. USA 104, 3736–3741 (2007).
18. Teslovich, T. M. et al. Biological, clinical and population relevance of 95 loci for blood lipids. Nature 466, 707–713 (2010).
19. Fumagalli, M. et al. Greenlandic Inuit show genetic signatures of diet and climate adaptation. Science 349, 1343–1347 (2015).
20. Mathias, R. A. et al. Adaptive evolution of the FADS gene cluster within Africa. PLoS ONE 7, e44926 (2012).
21. Wang, T. J. et al. Common genetic determinants of vitamin D insu#ciency: a genome-wide association study. Lancet 376, 180–188 (2010).
22. Price, A. L. et al. The impact of divergence time on the nature of population structure: an example from Iceland. PLoS Genet. 5, e1000505 (2009).
23. Wellcome Trust Case Control Consortium. Genome-wide association study of 14,000 cases of seven common diseases and 3,000 shared controls. Nature 447, 661–678(2007).
24. Hu$, C. D. et al. Crohn’s disease and genetic hitchhiking at IBD5. Mol. Biol. Evol. 29, 101–111 (2012).
25. Hunt, K. A. et al. Newly identi"ed genetic risk variants for celiac disease related to the immune response. Nature Genet. 40, 395–402 (2008).
26. Jostins, L. et al. Host–microbe interactions have shaped the genetic architecture of in!ammatory bowel disease. Nature 491, 119–124 (2012).
27. Beleza, S. et al. Genetic architecture of skin and eye color in an African–European admixed population. PLoS Genet. 9, e1003372 (2013).
28. Sturm, R. A. et al. A single SNP in an evolutionary conserved region within intron 86 of the HERC2 gene determines human blue-brown eye color. Am. J. Hum. Genet. 82, 424–431 (2008).
29. Eiberg, H. et al. Blue eye color in humans may be caused by a perfectly associated founder mutation in a regulatory element located within the HERC2 gene inhibiting OCA2 expression. Hum. Genet. 123, 177–187 (2008).
30. Barreiro, L. B. et al. Evolutionary dynamics of human Toll-like receptors and their di$erent contributions to host defense. PLoS Genet. 5, e1000562 (2009).
31. Uciechowski, P. et al. Susceptibility to tuberculosis is associated with TLR1 polymorphisms resulting in a lack of TLR1 cell surface expression. J. Leukoc. Biol. 90, 377–388 (2011).
32. Wong, S. H. et al. Leprosy and the adaptation of human toll-like receptor 1. PLoS Pathog. 6, e1000979 (2010).
33. Fujimoto, A. et al. A scan for genetic determinants of human hair morphology: EDAR is associated with Asian hair thickness. Hum. Mol. Genet. 17, 835–843 (2008).
34. Kimura, R. et al. A common variation in EDAR is a genetic determinant of shovel-shaped incisors. Am. J. Hum. Genet. 85, 528–535 (2009).
35. Kamberov, Y. G. et al. Modeling recent human evolution in mice by expression of a selected EDAR variant. Cell 152, 691–702 (2013).
36. Turchin, M. C. et al. Evidence of widespread selection on standing variation in Europe at height-associated SNPs. Nature Genet. 44, 1015–1019 (2012).
37. Berg, J. J. & Coop, G. et al. A population genetic signal of polygenic adaptation. PLoS Genet. 10, e1004412 (2014).
38. Lango Allen, H. et al. Hundreds of variants clustered in genomic loci and biological pathways a$ect human height. Nature 467, 832–838 (2010).
39. Speliotes, E. K. et al. Association analyses of 249,796 individuals reveal 18 new loci associated with body mass index. Nature Genet. 42, 937–948 (2010).
40. Heid, I. M. et al. Meta-analysis identi"es 13 new loci associated with waist–hip ratio and reveals sexual dimorphism in the genetic basis of fat distribution. Nature Genet. 42, 949–960 (2010).
41. Morris, A. P. et al. Large-scale association analysis provides insights into the genetic architecture and pathophysiology of type 2 diabetes. Nature Genet. 44, 981–990 (2012).
Supplementary Information is available in the online version of the paper.
Acknowledgements We thank P. de Bakker, J. Burger, C. Economou, E. Fornander, Q. Fu, F. Hallgren, K. Kirsanow, A. Mittnik, I. Olalde, A. Powell, P. Skoglund, S. Tabrizi and A. Tandon for discussions, suggestions about SNPs to include, or contribution to sample preparation or data curation. We thank S. Pääbo, M. Meyer, Q. Fu and B. Nickel for collaboration in developing the 1240k capture reagent. We thank J. M. V. Encinas and M. E. Prada for allowing us to resample La Braña 1. I.M. was supported by the Human Frontier Science Program LT001095/2014-L. C.G. was supported by the Irish Research Council for Humanities and Social Sciences (IRCHSS). F.G. was supported by a grant of the Netherlands Organization for Scientific Research, no. 380-62-005. A.K., P.K. and O.M. were supported by RFBR no. 15-06-01916 and RFH no. 15-11-63008 and O.M. by a state grant of the Ministry of Education and Science of the Russia Federation no. 33.1195.2014/k. J.K. was supported by ERC starting grant APGREID and DFG grant KR 4015/1-1. K.W.A. was supported by DFG grant AL 287 / 14-1. C.L.-F. was supported by a BFU2015-64699-P grant from the Spanish government. W.H. and B.L. were supported by Australian Research Council DP130102158. R.P. was supported by ERC starting grant ADNABIOARC (263441), and an Irish Research Council ERC support grant. D.R. was supported by US National Science Foundation HOMINID grant BCS-1032255, US National Institutes of Health grant GM100233, and the Howard Hughes Medical Institute.
Author Contributions W.H., R.P. and D.R. supervised the study. S.A.R., J.L.A., J.M.B., E.C., F.G., A.K., P.K., M.L., H.M., O.M., V.M., M.A.R., J.R., J.M.V., J.K., A.C., K.W.A., D.B., D.A., C.L., W.H., R.P. and D.R. assembled archaeological material. I.M., I.L., N.R., S.M., N.P., S.D., J.P., W.H. and D.R. analysed genetic data. N.R., E.H., K.St., D.F., M.N., K.Si., C.G., E.R.J., B.L., C.L. and W.H. performed wet laboratory ancient DNA work. I.M., I.L. and D.R. wrote the manuscript with input from all co-authors.
Author Information The aligned sequences are available through the European Nucleotide Archive under accession number PRJEB11450. The Human Origins genotype datasets including ancient individuals can be found at (http://genetics.med.harvard.edu/reich/Reich_Lab/Datasets.html). Reprints and permissions information is available at www.nature.com/reprints. The authors declare no competing financial interests. Readers are welcome to comment on the online version of the paper. Correspondence and requests for materials should be addressed to I.M. ([email protected]), W.H. ([email protected]), R.P. ([email protected]) or D.R. ([email protected]).

ARTICLERESEARCH
© 2015 Macmillan Publishers Limited. All rights reserved
Genome-wide scan for selection. For most ancient samples, we did not have sufficient coverage to make reliable diploid calls. We therefore used the counts of sequences covering each SNP to compute the likelihood of the allele frequency in each population. Suppose that at a particular site, for each population we have M samples with sequence level data, and N samples with full diploid genotype calls (Loschbour, Stuttgart and the 1,000 Genomes samples). For samples i = 1…N, with diploid genotype data, we observe X copies of the reference allele out of 2N total chromosomes. For each of samples i = (N+1)…(N+M), with sequence level data, we observe Ri sequences with the reference allele out of Ti total sequences. Then, the likelihood of the population reference allele frequency, p given data
=D X N R T{ , , , }i i is given by
L p D B X N p
p B R T p p B R Ti N
N Mi i i i
; , ,
, , ., ,
( )= ( )!
"( )+ "( )= +
+
#
2
1 2 1 0 51
2 ! (( )+ "( ) ( ){ }1 2p B R Ti i, ,!
where B k n p nk p p, , 1k n k( )( ) = ( " ) " is the binomial probability distribution and
! is a small probability of error, which we set to 0.001. We write ( )! p D; for the log-likelihood. To estimate allele frequencies, for example in Fig. 3 or for the poly-genic selection test, we maximized this likelihood numerically for each population.
To scan for selection across the genome, we used the following test. Consider a single SNP. Assume that we can model the allele frequencies pmod in A modern populations as a linear combination of allele frequencies in B ancient populations panc. That is, pmod = C panc, where C is an A by B matrix with rows summing to 1.We have data Dj from population j which is some combination of sequence counts and genotypes as described above. Then, writing p p p p p,anc mod A B1= $%&
'()=$%& … '
()+ the
log-likelihood of the allele frequencies equals the sum of the log-likelihoods for each population.
*( ) = ( )=
+! !p pD D, ;
j
A B
j j1
To detect deviations in allele frequency from expectation, we test the null hypothesis H0: pmod = C panc against the alternative H1: pmod unconstrained. We numerically maximize this likelihood in both the constrained and unconstrained model and use the fact that twice the difference in log-likelihood is approximately "A
2 distributed to compute a test statistic and P#value.We defined the ancient source populations by the ‘Selection group 1’ label in
Extended Data Table 1 and Supplementary Table 1 and used the 1000 Genomes CEU, GBR, IBS and TSI as the present-day populations. We removed SNPs that were monomorphic in all four of these modern populations as well as in 1000 Genomes Yoruba (YRI). We do not use FIN as one of the modern populations, because they do not fit this three-population model well. We estimated the pro-portions of (HG, EF, SA) to be CEU = (0.196, 0.257, 0.547), GBR = (0.362, 0.229, 0.409), IBS = (0, 0.686, 0.314) and TSI = (0, 0.645, 0.355). In practice, we found that there was substantial inflation in the test statistic, most likely due to unmod-elled ancestry or additional drift. To address this, we applied a genomic control correction14, dividing all the test statistics by a constant, #, chosen so that the median P#value matched the median of the null 4
2" distribution. Excluding sites in the potentially functional set, we estimated # = 1.38 and used this value as a correction throughout. One limitation of this test is that, although it identifies likely signals of selection, it cannot provide much information about the strength or date of selection. If the ancestral populations in the model are, in fact, close to the real ancestral populations, then any selection must have occurred after the first admix-ture event (in this case, after 6500 !"), but if the ancestral populations are mis-spec-ified, even this might not be true.
To estimate power, we randomly sampled allele counts from the full data set, restricting to polymorphic sites with a mean frequency across all populations of <0.1. We then simulated what would happen if the allele had been under selection in all of the modern populations by simulating a Wright–Fisher trajectory with selection for 50, 100 or 200 generations, starting at the observed frequency. We took the final frequency from this simulation, sampled observations to replace the actual observations in that population, and counted the proportion of simulations that gave a genome-wide significant result after GC correction (Extended Data Fig. 6a). We resampled sequence counts for the observed distribution for each population to simulate the effect of increasing sample size, assuming that the coverage and distribution of the sequences remained the same (Extended Data Fig. 6b).
We investigated how the genomic control correction responded when we sim-ulated small amounts of admixture from a highly diverged population (Yoruba;
METHODSNo statistical methods were used to predetermine sample size. The experiments were not randomized and the investigators were not blinded to allocation during experiments and outcome assessment.Ancient DNA analysis. We screened 433 next-generation sequencing libraries from 270 distinct samples for authentic ancient DNA using previously reported proto-cols7. All libraries that we included in nuclear genome analysis were treated with uracil-DNA-glycosylase (UDG) to reduce characteristic errors of ancient DNA42.
We performed in-solution enrichment for a targeted set of 1,237,207 SNPs using previously reported protocols4,7,43. The targeted SNP set merges 394,577 SNPs first reported in ref. 7 (390k capture), and 842,630 SNPs first reported in ref. 44 (840k capture). For 67 samples for which we newly report data in this study, there was pre-existing 390k capture data7. For these samples, we only performed 840k capture and merged the resulting sequences with previously generated 390k data. For the remaining samples, we pooled the 390k and 840k reagents together to produce a single enrichment reagent, which we called 1240k. We attempted to sequence each enriched library up to the point where we estimated that it was economically inef-ficient to sequence further. Specifically, we iteratively sequenced more and more from each sample and only stopped when we estimated that the expected increase in the number of targeted SNPs hit at least once would be less than about one for every 100 new read pairs generated. After sequencing, we filtered out samples with <30,000 targeted SNPs covered at least once, with evidence of contamination based on mitochondrial DNA polymorphism43, a high rate of heterozygosity on chromosome X despite being male45, or an atypical ratio of X to Y sequences.
Of the targeted SNPs, 47,384 are ‘potentially functional’ sites chosen as follows (with some overlap): 1,290 SNPs identified as targets of selection in Europeans by the Composite of Multiple Signals (CMS) test1; 21,723 SNPS identified as signif-icant hits by genome-wide association studies, or with known phenotypic effect (GWAS); 1,289 SNPs with extremely differentiated frequencies between HapMap populations46 (HiDiff); 9,116 ‘Immunochip’ SNPs chosen for study of immu-nity-related phenotypes (Immune); 347 SNPs phenotypically relevant to South America (mostly altitude adaptation SNPs in EGLN1 and EPAS1), 5,387 SNPs which tag HLA haplotypes and 13,672 expression quantitative trait loci47 (eQTL).Population history analysis. We used two data sets for population history analysis. ‘HO’ consists of 592,169 SNPs, taking the intersection of the SNP targets and the Human Origins SNP array4; we used this data set for co-analysis of present-day and ancient samples. ‘HOIll’ consists of 1,055,209 SNPs that additionally includes sites from the Illumina genotype array48; we used this data set for analyses only involving the ancient samples.
On the HO data set, we carried out principal components analysis in smartpca49 using a set of 777 West Eurasian individuals4, and projected the ancient individuals with the option ‘lsqproject: YES’. We carried out admixture analysis on a set of 2,345 present-day individuals and the ancient samples after pruning for LD in PLINK 1.9 (https://www.cog-genomics.org/plink2)50 with parameters ‘-indep-pairwise 200 25 0.4’. We varied the number of ancestral populations between K = 2 and K = 20, and used cross-validation (–cv.) to identify the value of K = 17 to plot in Extended Data Fig. 2f.
We used ADMIXTOOLS11 to compute f-statistics, determining standard errors with a block jackknife and default parameters. We used the option ‘inbreed: YES’ when computing f3-statistics of the form f3(ancient; Ref1, Ref2) as the ancient samples are represented by randomly sampled alleles rather than by diploid genotypes. For the same reason, we estimated FST genetic distances between populations on the HO data set with at least two individuals in smartpca also using the ‘inbreed: YES’ option.
We estimated ancestral proportions as in Supplementary Information section 9 of ref. 7, using a method that fits mixture proportions on a ‘test’ population as a mixture of n ‘reference’ populations by using f4-statistics of the form f4(test or ref, O1; O2, O3) that exploit allele frequency correlations of the test or reference pop-ulations with triples of outgroup populations We used a set of 15 world outgroup populations4,7. In Extended Data Fig. 2, we added WHG and EHG as outgroups for those analyses in which they are not used as reference populations. We plot
t Raresnorm T22
= " ˆ the squared 2-norm of the residuals where â is a vector of n estimated mixture proportions (summing to 1), t is a vector of ( )"m m 1
2 f4-statistics of the form f4(test, O1; O2, O3) for m outgroups, and R is a ( )" !m m n1
2 matrix of the form f4(ref, O1; O2, O3) (Supplementary Information section 9 of ref. 7).
We determined sex by examining the ratio of aligned reads to the sex chro-mosomes51. We assigned Y-chromosome haplogroups to males using version 9.1.129 of the nomenclature of the International Society of Genetic Genealogy (http://www.isogg.org), restricting analysis using samtools52 to sites with map quality and base quality of at least 30, and excluding two bases at the ends of each sequenced fragment.

ARTICLE RESEARCH
© 2015 Macmillan Publishers Limited. All rights reserved
1000 Genomes YRI) into a randomly chosen modern population. The genomic inflation factor increases from around 1.38 to around 1.51 with 10% admixture, but there is little reduction in power (Extended Data Fig. 6c). Finally, we investi-gated how robust the test was to misspecification of the mixture matrix C. We re-ran the power simulations using a matrix C+ = xC + (1 " x)R for ,x [0, 1] where R was a random matrix chosen so that for each modern population the mixture proportions of the three ancient populations were jointly uniformly distributed on [0,1]. Increasing x increases the genomic inflation factor and reduces power, demonstrating the advantage of explicitly modelling the ancestries of the modern populations (Extended Data Fig. 6d).Test for polygenic selection. We implemented the test for polygenic selection described by ref. 37. This evaluates whether trait-associated alleles, weighted by their effect size, are over-dispersed compared to randomly sampled alleles, in the directions associated with the effects measured by genome-wide association stud-ies (GWAS). For each trait, we obtained a list of significant SNP associations and effect estimates from GWAS data, and then applied the test both to all populations combined and to selected pairs of populations. For height, we restricted the list of GWAS associations to 169 SNPs where we observed at least two chromosomes in all tested populations (Selection population 2). We estimated frequencies in each population by computing the maximum likelihood estimate (MLE), using the likelihood described above. For each test we sampled SNPs, frequency-matched in 20 bins, computed the test statistic QX and for ease of comparison converted these to Z scores, signed according the direction of the genetic effects. Theoretically QX has a "2 distribution but in practice, it is over-dispersed. Therefore, we report bootstrap P#values computed by sampling 10,000 sets of frequency-matched SNPs.
To estimate population-level genetic height in Fig. 4a, we assumed a uniform prior on [0,1] for the frequency of all height-associated alleles, and then sampled from the posterior joint frequency distribution of the alleles, assuming they were independent, using a Metropolis–Hastings sampler with a N(0,0.001) proposal density. We then multiplied the sampled allele frequencies by the effect sizes to get a distribution of genetic height.Code availability. Code implementing the selection analysis is available at https://github.com/mathii/europe_selection.
42. Briggs, A. W. et al. Removal of deaminated cytosines and detection of in vivo methylation in ancient DNA. Nucleic Acids Res. 38, e87 (2010).
43. Fu, Q. et al. DNA analysis of an early modern human from Tianyuan Cave, China. Proc. Natl Acad. Sci. USA 110, 2223–2227 (2013).
44. Fu, Q. et al. An early modern human from Romania with a recent Neanderthal ancestor. Nature. 524, 216–219 (2015).
45. Korneliussen, T. S., Albrechtsen, A. & Nielsen, R. ANGSD: analysis of next generation sequencing data. BMC Bioinformatics 15, 356 (2014).
46. International HapMap Consortium. A second generation human haplotype map of over 3.1 million SNPs. Nature 449, 851–861 (2007).
47. Lappalainen, T. et al. Transcriptome and genome sequencing uncovers functional variation in humans. Nature 501, 506–511 (2013).
48. Li, J. Z. et al. Worldwide human relationships inferred from genome-wide patterns of variation. Science 319, 1100–1104 (2008).
49. Loh, P. R. et al. Inferring admixture histories of human populations using linkage disequilibrium. Genetics 193, 1233–1254 (2013).
50. Chang, C. C. et al. Second-generation PLINK: rising to the challenge of larger and richer datasets. GigaScience 4 (2015).
51. Skoglund, P., Storå, J., Götherström, A. & Jakobsson, M. Accurate sex identi"cation of ancient human remains using DNA shotgun sequencing. J. Archaeol. Sci. 40, 4477–4482 (2013).
52. Li, H. et al. The sequence alignment/map format and SAMtools. Bioinformatics 25, 2078–2079 (2009).
53. Norton, H. L. et al. Genetic evidence for the convergent evolution of light skin in Europeans and East Asians. Mol. Biol. Evol. 24, 710–722 (2007).
54. Bokor, S. et al. Single nucleotide polymorphisms in the FADS gene cluster are associated with delta-5 and delta-6 desaturase activities estimated by serum fatty acid ratios. J. Lipid Res. 51, 2325–2333 (2010).
55. Tanaka, T. et al. Genome-wide association study of plasma polyunsaturated fatty acids in the InCHIANTI Study. PLoS Genet. 5, e1000338 (2009).
56. Ahn, J. et al. Genome-wide association study of circulating vitamin D levels. Hum. Mol. Genet. 19, 2739–2745 (2010).
57. Gründemann, D. et al. Discovery of the ergothioneine transporter. Proc. Natl Acad. Sci. USA 102, 5256–5261 (2005).
58. Chauhan, S. et al. ZKSCAN3 is a master transcriptional repressor of autophagy. Mol. Cell 50, 16–28 (2013).
59. Soler Artigas, M. et al. Genome-wide association and large-scale follow up identi"es 16 new loci in!uencing lung function. Nature Genet. 43, 1082–1090 (2011).
60. Pruim, R. J. et al. LocusZoom: regional visualization of genome-wide association scan results. Bioinformatics 26, 2336–2337 (2010).
ARTICLERESEARCH
© 2015 Macmillan Publishers Limited. All rights reserved
Extended Data Figure 1 | Efficiency and cost-effectiveness of 1240k capture. We plot the number of raw sequences against the mean coverage of analysed SNPs after removal of duplicates, comparing the 163 samples
for which capture data are newly reported in this study, against the 102 samples analysed by shotgun sequencing in ref. 5. We caution that the true cost is more than that of sequencing alone.

ARTICLE RESEARCH
© 2015 Macmillan Publishers Limited. All rights reserved
Extended Data Figure 2 | Early isolation and later admixture between farmers and steppe populations. a, Mainland European populations later than 3000 !" are better modelled with steppe ancestry as a third ancestral population, (closer correspondence between empirical and estimated f4-statistics as estimated by resnorm; Methods). b, Later (post-Poltavka) steppe populations are better modelled with Anatolian Neolithic as a third ancestral population. c, Estimated mixture proportions of mainland
European populations without steppe ancestry. d, Estimated mixture proportions of Eurasian steppe populations without Anatolian Neolithic ancestry. e, Estimated mixture proportions of later populations with both steppe and Anatolian Neolithic ancestry. f, Admixture plot at k = 17 showing population differences over time and space. EN, Early Neolithic; MN, Middle Neolithic; LN, Late Neolithic; BA, Bronze Age; LNBA, Late Neolithic and Bronze Age.
0.0000 0.0005 0.0010 0.0015
24
68
resnorm
9 po
pula
tions
Sintashta
Srubnaya
Andronovo
Potapovka
Samara_Eneolithic
Poltavka
Afanasievo
Yamnaya_Kalmykia
Yamnaya_Samara N=2(Armenian+EHG)N=3(Anatolia_Neolithic+Armenian+EHG)
0e+00 1e!04 2e!04 3e!04 4e!04 5e!04 6e!04
24
68
1012
resnorm
12 p
opul
atio
ns
Central_LNBANorthern_LNBA
Bell_Beaker_LNRemedello
Hungary_BAIceman
Iberia_MNCentral_MN
Iberia_ENIberia_Chalcolithic
LBK_EN
Hungary_EN N=2(Anatolia_Neolithic+WHG)N=3(Anatolia_Neolithic+WHG+Yamnaya_Samara)
Hungary_EN
Remedello
Iceman
Iberia_EN
LBK_EN
Iberia_MN
Central_MN
Iberia_Chalcolithic
Anatolia_NeolithicWHG
Samara_Eneolithic
Yamnaya_Kalmykia
Yamnaya_Samara
Afanasievo
Poltavka
ArmenianEHG
Andronovo
Potapovka
Srubnaya
Hungary_BA
Northern_LNBA
Sintashta
Bell_Beaker_LN
Central_LNBA
Anatolia_NeolithicWHGYamnaya_Samara
a b
c d e
K=17
Central_LNBA_outlier
Hungary_BA
Anatolia_Neolithic_outlier
Anatolia_Neolithic
Hungary_EN
LBK_EN
Remedello
Iberia_Chalcolithic
Central_MN
Iberia_MN
Iberia_ENIcemanEHG
Motala_HG
Scythian_IAPoltavka
Yamnaya_Samara
Afanasievo
Yamnaya_Kalmykia
PotapovkaRussia_EBA
Andronovo_outlierSamara_EneolithicSrubnaya_outlier
WHG
Bell_Beaker_LN
Northern_LNBA
Srubnaya
Andronovo
Central_LNBA
SintashtaPoltavka_outlier
f
ARTICLERESEARCH
© 2015 Macmillan Publishers Limited. All rights reserved
!
! ! ! ! ! !!!!!!
!!!! ! ! !! !!!
!!!!
!
!!!!!!
!
!!!!!!!!!!!
!!! !
!!!!!!!!!!!!!
!!!!
!
!!
!
!!
!
!
!
!!!
!!!!!!
!
!
!
!!!
!
!!!!!!
!
!!!
!!
!
!!!
!
!!
!
!!!!!!
!!!!! !!!!!!!!
!!!
!
!!!!!!!!!!!!!!!!!!
!!!!!!!!!!!!!!!!!!!!!!!!!!!!!!!!!!
!
!
!!!
!!!!!!!!
!!!
!!!!!
!!!!!!!!!!!!!!!!!!!!!!
!!!!!!!!!!!!!!!!!!!!!!!!!!!!!!!!!!!!!!!!!!
!
!!!!!!!!!
!!!!!!!!!!!!!!!!!!!!!!!
!!!
!
!!!!!!!!!!!!!!!!!!!!
!
!!!!!!!
!
!!!!!!!!!!!!!!!!!!!!!!!!!!!!!!!!!!!!!!!!!!!!!!!!!
!!!!!!!!!!!
!
!
!!!!!!!!!!!!
!
!!!!!!!!!!!!!!!!!!!!!!!!!!!!!!!!!!!!!!!!!!!!!!!!!!!!!!!!!!!!!!!!!!!!
!!!!!!!!!!!!!!!!!!!!!!!!!
!!
!!
!
!!!!!!
!!!!!!!!!
!!!!!!!!!!
!! !
!!!
!
! !!
!!!!
!
!! !!!!!!! !
!!!
!
!
!
!!!!
!
!!
!!
!
!
!!!!!!
!
!
!
!
!!!
!
!
!
!!
!
! ! !
!
!!!!
!!!!
!
!!!
!
!! !!
!
!
!
!
!
!
!
!
!!
!!!
!
!!
!
!
!
!
!
!
!
!
! !
!
!
!
!
!
!
! ! ! ! !! !!
! !!!!
!!!!!! !! !!!!!!!!!!!!!!!!!!!!
!!!!!!!!
!!!!!!!!!!!!!!!
!!! !!!!!!
!
!!!
!!!!!!
!!!!!!!!!!!!!!!!!!
!!!!!!!!!!!!!!!!!
!
!!!!!!
!!!!
!! !!!!
!!!!! !
!!!!!!
!
!!!!!!!!!!!
!
!
!
!!!!!!!!!!!!
!
!
!!!!!!!!!!
!!
!!!!!!!!!!
!
!!!!!!!!!!!!!!!!!!!!!!!!!!
!!!!!!!!!!!!!!!!!!!!!!!!!!!
!!!!!!!!!!!
!!!!!!!!!!!!!!!
!!!!!!!!!!!!!
!!!!!!!!!!!!!!!!!!!!
!
!
!
!
!!!
!!
!!!!
!
!
!
!
!!
!!!
!
!
!
!
!
!
!!!
!
!
!
!
!
!
!
!
!!! !
! !
!
!!! !!
!!!!
!
!!!!!!!
!!!!!!!!!!!!!!!!!!!!
!!!!!!!!!!
!
!!!
!
!!
!
!!!!!
!!
!
!
!
!!
!!
!!!!!!!
!
!!!
!!!!!!
!!
!
!!!
!!!!!!!!!
!
!!!!!
!
!!!!!
!!
!!!!
!!!
!
!
!!!!
!!!!!!
!!!!
!
!!!!!!
!!!
!!!!
!!!
!!!
!!!!!
!
!!
!
!!!
!
!!
!
!!!!!!
!
!!!
!!!
!
!!
!!
!!!!
!
!!
!!!!
!
!
!
!
!
!
!!
!!
!
!!!
!
!!
!
!!!!!!!!
!!!!
!
!!
!!!!!
!
!!!!
! ! !!! !!!!!!!!
!!!!!!!!!!!!!!
!
!!
!!!!
!!!
!
!
!
!
!
!
!!
!!
!!!
!
!
!!!!
!
!
!
!
!
!
!!
!
!
!
!
!!!
!
!
! !! !!
!
!
!! !
! ! ! ! ! !!!
!!!!
!
!!! !!!
!
!!!!!!!!
!
!!!!!!!!!!
!
!
!
!
!
!
!!
!!!!!
!
!
!
!
!
!!!!!!
!
!
!
!
!
!
!
!
!!
!
!!
!
!
!
!!
!!
!
!!!!
!
!!!!
!
!
!
!!
!
!
!
!!!!!!
!!!!!!
!
!!
!
!!!!!
!!!!
!!!
!
!
!
!!
!!
!
!
!!!!!!!
!!
!!
!
!
!!
!
!
!!!!
!
!
!
!
!
!!!!
!
!
!
!!
!
!
!!!
!
!!!!!!!
!!!
!!!
!
!!!!
!!
!!
!
!
!!!!
!
!
!
!!!!!!!!!!!!!!!
!!!!!!!!!!!
!!!!!!
!!
!
!
!!!!!
!!!
!!!!
!
!
!
!
!
!
!
!
!
!
!
!!!
!
!
!
!
!
!
!
!
!
!
!
!
!!
!
!
!
!
!
!
!
!
!!
!
!
!
!
!
!!!
!
!
!
!
!
!
!
!
!!
!!
!
!!
!
!
!
!
! !! !!!!!!!
!!!!!!!!!!!!! ! !!! ! ! ! ! !
!
!
!!!
!
!!
!
!!
!!!!!!
!
!!!!!!!! !!!!!!
!
!!!!!!!!!!
!
!!
!!!
!!!
!!!!!!!!!
!!!!!
!!!!!!!!!
!!!
!
!!!!
!!!!!!!
!
!
!
!!!!!!!!!!!!!!!
!!!!!! !!!
!
!!!
!
!!!
!!!!!
! !!!
!
!
!
!!!!!!!!!
!!
!
!!!!
!!!
!!!!!!
!!!!!!!
!
!!!!! !!
!!
! !
!! !
!
!
!
!
!
!
!
!
!
! !! !!!!
! ! ! ! ! !
!!!
!!!!!!!!!!!!!!!!!
!!!!!!!!!!!!!!!!!!!!!!!!!!!
!!!!!!!!!!!!!!!!!!!!!!!!!!!!!!!!!!!!!!!!!!!!!!!!!!!!!!!!!!!!!!!!
!!!!!!!!!!!!!!!!!!!!!!!!!!!!!!
!!!!!!!!!!!!!!!!!!!!!!!!!!!!!!!!!!
!!!!!!!!!!!!!!!!!!
!!!!!!!!!!!!!!!
!!!!!!!!!!!!!!!!!!!
!
!!!!!!!!!!!
!
!!!
!!!!!!!!!!!!! !!
!!!!!!!!!!
!
!
!
!
!
!
!
!
!!!
!!!!!!
!
!
!
!!!!!!!!!!!!!!!!!!!!
!
!!!!!!!!!!!!!!!!!!!!!!!!!!!!! !! ! !! ! !!!!
!!!!!!!!!!!!
!!!
!
!
!
!
!!!
!
!
!
!
!
!
!!
!
!
!
!
!
!
!!!!
! !!!! !! !!! ! ! !!!!!!! ! ! !!
!!!!!
!!!!!!
!
!!
!
!!
!
!
!!!!!!!!!!!!!
!!!!!!!
!
!!!!!!
!!!!!!!
!
!!!!
!!!!!!!
!!
!!
!
!!
!
!!!!!
!
!!
!!!!!!!!!!
!
!!!!!
!
!!!!!!!!
!!!
!
!!
!
!!
!!
!!!!!!!
!!!!!!!!!
!
!!!!!!!!!!
!!!!
!!!!!!!
!!!!!!!
!
!!!!!!!
!
!!
!
!
!!!!!!!
!!
!!!
!
!!!!!!!!!!!
!
!!
!!!
!
!
!!!!!!!!
!!!!!!
!
!!!!!!!!!!!!!!!!!!!!
!!!!!!!!!!
!
!!!!!
!
!!!
!!!
!!!
!!!
!
!!!!!
!
!
!!!!!!!!!!!!!!!!
!!!!!
!
!
!
!
!!!
!
!
!
!!
!
!!
!!
!
!!!!
!!
!!!
!
!!!!!!!
!
!!
!
!!
!!
!
!
!!!!!!!
!
!
!
!
!
!!!!!!!!
!!!!
!
!
!!
!
!!
!!!
!
!
!!!!!!!!!!!!!!!!
!
!!
!
!!
!!!!!
!
!!
!
!
!!!
!! !
!!!!!!!!!
!
!
!!
! !!
!!!
!
!
!
!
!!
!
!
!!
!
!
!
!
!
!
!
!
!!!
!
!
!!
!
!!
!!
!
!
!
!!
!
!!!!!!!!
!!!!!
!!!
!!
!
!!!
!!!
!!!
!!!!!!!!!!!!!!
!! !
!!
!
!
!!
!
!!
!
!
!
!
!
!
!
!
!
!
!
!!
!
!
!
!!! ! !
!
!!!
!!
!!!!!!!!!!!!!!!!!!!!!
!
!!!!!!
!!!!
!
!!!!!
!!!!!!!!!
!!!!!!!!!!!!
!
!!
!
!!!!!!!!!!!!!!!!!!!!!!!
!!
!
!!!!!
!
!!!
!
!!!
!!
!
!!!!!!!!!
!
!
!!
!
!!!!!!!!
!!!!!!!!!!!!!!!!
!!!!!!!!!!!!!!!!!!!!!!!!!!!!!!!!!!!!!!!
!!!!!!!!!!!!
!
!!!
!
!!!!!!
!!!!!!!!!!!!!!!!!!!!!!!!!!!!!
!
!!!!!!
!!!!!!!!!
!
!!!!!!
!
!!!!
!!!!!!!!!!!!!!!!!!!!
!
!!!!!!
!!!!!!
!
!!!!!
!!!!!!!!!!!
!
!!!!
!!!!!!!!!
!
!
!
!!!
!!!
!
!!!!!!
!!!!!!!
!!!!
!!!!!!
!!!!!!!!!!!!!!!!!!!!!!!
!!!
!!!!!!!!!!!!!!!!!!!!!!!
!!!!!!!!!!!!!!!!!!!!!!!
!
!
!
!!
!
!
!
!
!
!
!
!!
!!
!!
!!
!!
!
!!!!!!!!!!!
!!!!!!
!
!!!!
!!
!
!
!!!!!!!!!!!
!
!
!!!
!!!
!
!!!
!
!!!
!!
!!
!!!!!
!!!!!
!!
!
!!!!!!!!!!
!
!!!
!
!!!
!
!!
!
!
!
!
!
!
!!!!
!!
!!!!!!!!
!
!
!!
!
!
!
!
!!!
!
!
!
!
!!
!
!
!!!!!
!
!
!
!!!!!
!!
!
!
!
!!!!
!
!
!
!!
!!
!!!!
!!
!
!
!
!!!!!
!
!!!! !
!
!!!!
!
!
!
!
!
!
!
!
!
!
!
!!
!
!
!
!
!
!
!!!
!
!
!
! !! !!! ! !
!
!!!!!
! !! !
! !!!!!!!!!!!!!
!!!!!!!!!!!!!!!
!!!!!!!!!!!!!!!!!!!!!!!!!!!!!!!!!!!!!!!!!!!!!!!!!
!!!!!!!!!
!!!
!!!!!!!!
!!!!!!!!!!!!!!!!!!!!!!!!!!!!!
!
!!
!!!!
!!!
!
!!!!!!
!
!!
!
!!!!!!
!
!!!!
!
!
!!!!!!!!!
!
!
!!
!!!!!
!
!
!
!
!
!
!
!!!!!
!
!!!!!!!
!
!!!
!
!
!
!
!
!
!
!
!
!!!
!
!!
!
!!
!
!
!
!!
!!
!
!
!
!!
!
!!!
!
!!
!!!!!
!!
!
!
!!!!
!
!
!!
!
!!
!
!
!!!
!!
!
!!
!!
!
!
!
!
!
!
!
!
!!
!!
!
!
!
!
!
!!!!!!!!!!!
!!!!!
!
!!!
!
!
!!!
!
!
!!!!!
!!!!!!!!!!!!!!!!!!!!!!!!!!!!!!!
!!!!!!!!!!!!!!!
!
!!!!!!!!!!!!!!! !!!!!!!!
!!!!!!!!!
!
!
!
!!!!!!!
!
!!!!!!!!!! !!!!
!!!!!!!!
!!!!
!
!
!!
!
! !
!
!
!!
!
!
!
!
!!!
!!! !
!!!!!!
!
!!!!!!!
!
!
!!!!!
!!
!!!
!!! !!!!!!!!!!!!!!
!!!!!!!!!
!!!!!!!!!!!!!!
!!!!!!!!!!!!!!!!!!!!!!!!
!
!!!
!
!!!!!!!!!!!!!
!!!!!!!!!!!!
!!!!!!!!!!!!
!!!!!!!!!
!!!!!!!!!!!!!
!
!!!!!!!!!
!!!!
!!!!
!!!!!
!!!!!!
!!!! !!!!
!!!!!!
!!!
!
!
!
!
!
!!!
!!
!
!
!
!
!
!
!
!
!
!
!
!!!!
!
!
!
!
!
!
!!!
!
!
!
!
!!!
!!
! !
!!
! !!
!
!
!!
!
!!
!!
!
!!!
!
!
!
!!!
! !!
!
!
! !
!
!!!
!
!!
!
!
!
!
!
!!!
!
!!!!
!
! !
!!
!
!
!
!
!!
!!
!
!!!
!
!
!
!!
!!
!!!!
!
!
!
!
!!
!
!
! ! ! ! !!!!
!! !!!!!!!!!!!!!!!
!
!!!!
!
!!!!!!!!!! !
!
!!!!!!!!!!!!
!!!!!!!!
!!!
!!!!!
!!!!!!!!!!!!!
!
!!!!!!!!!
!
!!!!!!
!
!!
!
!!!!!!!!!!!!!
!
!!!!!
!!!
!!!
!!!!!!!!
!!
!
!!
!!!!
!!!
!!!!!!!!!
!
!!!!!!!!!!!!
!!!!!!!! !!!!
!!!!!!!!!!!!
!!!
!
!!!!!!!!!
!!!!!
!!!!!!
!!!
!!
!!!!!!!!!
!!
!!!!
!
!!!!!
!!
!
!!!!!
!!!!!!
!!!!!!!!
!!!!!!!!!!
!
!!!!!
!
!!
!!!!!!
!!!!!!!!!
!!!!!!!!!!
!
!!!
!!
!!!!!!
!!
!
!!!!!!!!
!!!
!!
!!
!!!!
!
!
!
!!
!
!
!!!!!!! !
!
!! !
!
!
!
!!!!
!
!!!! !!!
!
!!! !
!
!!!!
!
!
!
!
!!
!
!!!
!
!!!!!!!!!
!!!
!
!!!!!!
!!!
!!
!
!
!
!!!!!
!
!
!!
!!
!!
!
!
!
!!
!
!
!!!!
!
!
!
!!
!!!!!
!!
!
!
!!!
!
!!
!!
!
!
!!
!!!!!!!!
!
!
!!!
!
!!!
!
!
!!
!
!!!!!
!!!!!!!!
!
!!!!!!!!
!!!!
!!!!!!!!!!!
!!
!!
!
!!
!
!!
!
!
!!!!!!!
!
!!!!!
!
!
!
!
!
!
!
!
!
!
!
!!!
!
!
!
!
!!!!!!
!!
!
!
!
!!!!
!!!
!!!
!!!
!
!!!
!
!
!!!!
!!!!!!!!
!
!
!!
!
!!
!!
!
!!!!!
!
!
!!
!
!!!
!
!
!
!!!!!!!!
!
!!!!!
!
!!!
!!
!
!!
!
!!!
!
!
!
!
!
!!
!
!
!
!
!!
!!!!!!!!!!
!!!!!!
!!
!
!!!!!!
!!!!!!
!!!!!
!
!
!
!!!!!!!!!!!
!!!!
!!!!!!
!
!
!
!!!!!!
!
!
!
!
!
!!
!!
!
!
!
!
!
!!!!
!
!!!!
!
!!!!!!!
!
!
!
!!!!
!
!
!
!
!
!
!
!!
!
!!!!!
!
!
!!!!
!!
!
!!!
!!!!
!
!!!!!
!
!!!
!!
!
!
!!!
!!
!!
!
!
!
!!
!
!
!
!
!!
!
!!!!!!
!
!
!
!!!
!
!
!!!!!!
!
!!!!!
!
!!
!!!!
!
!
!
!!
!
!
!
!!
!
!
!
!!!
!!
!
!
!
!!
!
!
!
!
!
!
!
!!!!!!
!
!!!!!!
!
!
!!
!
!
!!!
!
!
!!!!!
!!
!
!!!!!
!!
!!!!!!!!!
!
!
!
!
!
!
!!!!!
!
!
!
!
!
!
!!!!
!!!!!!
!
!
!!
!!!!
!!
!!!!
!
!
!
!
!
!
!
!
!
!!
!!
!!
!
!
!
!
!
!
!!!!!
!
!!!
!
!!
!!!!!
!
!
!
!
!!
!
!
!
!
!
!!
!
!!
!!
!
!!!
!!
!
!
!
!
!
!
!!
!!
!
!!!!!
!
!
!!
!
!!
!
!
!!
!
!
!
!!!!!
!
!!
!
!!
!!
!
!!!!!
!
!
!
!
!
!
!!
!
!!
!
!!
!!!
!
!!!!!
!
!
!
!
!
!!
!!
!
!!!
!!
!!!!!!!
!
!
!!
!
!!
!!
!!!
!
!
!
!
!!
!
!!!
!
!
!!
!
!
!!
!!
!
!
!
!
!!!
!
!
!!
!!
!!
!!
!!
!
!
!!
!
!
!
!!
!!
!
!
!
!
!
!!
!!!!
!!!
!
!
!!!!!
!
!
!
!
!
!
!!
!
!
!
!!
!
!!
!
!!
!!
!
!
!
!
!!!
!!!
!
!
!
!
!!
!
!
!!
!
!!!
!!
!
!
!
!
!
!!!!!
!
!!
!!
!
!!
!
!
!!
!
!!
!
!!
!!
!
!!
!!
!
!!!
!!
!
!
!
!!!
!
!
!
!
!
!!!!
!
!
!
!
!
!
!
!
!
!
!!
!
!!
!
!
!
!!
!!
!!!!
!
!!
!
!
!
!!!!
!
!
!
!
!
!
!
!!
!
!
!
!
!
!
!
!
!
!!!!!!
!!!!
!
!
!
!!!!!!!!!
!
!!
!!!!
!
!!!!!!
!
!
!
!!
!
!
!!
!
!
!!!!!!
!!
!!
!!!
!
!
!
!
!!
!!!!
!!
!!!!
!
!
!
!!
!
!
!
!
!
!
!!
!
!!!
!
!!
!
!!!
!!
!!
!
!!!
!!
!!
!!!
!!!
!
!
!
!
!
!!
!
!!!!!
!!
!!!!!!!
!!
!!!!!!
!
!!!!
!
!!!
!!
!!
!
!
!
!
!!!!
!
!!
!
!
!
!
!
!
!
!
!
!!!!!!!
!
!!
!
!!!!
!
!
!
!!
!
!
!!
!
!
!!
!!
!!
!!
!
!
!!!!
!
!
!!
!
!
!
!
!
!
!!
!!
!
!
!!!
!!
!
!!
!
!!!
!
!
!
!
!
!!
!
!
!
!
!
!
!
!!
!
!!
!
!
!
!
!
!
!
!
!
!
!
!
!!
!
!
!!
!
!
!
!
!
!
!
!
!
!
!!
!
!
!!
!
!!
!
!
!!!!
!
!
!
!
!
!!
!!!!
!
!
!
!!!
!
!
!
!!
!
!
!!!!
!!
!
!
!
!
!
!
!
!
!
!
!!!!!!
!
!
!!
!
!
!
!
!
!
!!!
!!!!!
!
!
!
!
!
!!
!
!!
!
!
!!
!
!
!
!
!
!!!!!
!
!
!
!
!
!!!
!
!!
!
!
!
!
!
!
!
!
!
!
!
!
!!!
!
!!!
!
!
!!!!!!!!
!!
!!!!
!
!!
!
!
!
!
!
!!!
!
!
!
!
!
!
!
!
!
!
!!
!
!!!!
!
!!
!
!!!!!
!
!!
!
!
!
!!
!
!
!
!
!!
!
!
!!!!!
!
!
!
!
!
!!!
!
!
!
!
!
!
!
!
!
!!!
!!
!
!
!
!!!
!
!
!!!
!
!
!!!
!!
!
!
!
!
!
!!
!
!!!!
!
!!
!!!
!!
!
!!
!!!!
!
!
!
!
!
!
!!
!
!
!
!!!
!
!!
!
!!!!
!
!!
!
!!!!!
!!
!
!
!
!
!!
!
!!!
!
!
!
!
!
!
!
!!
!
!!!!
!!
!
!!
!
!!!!!!!!!
!!
!!
!
!
!
!
!
!!!
!
!!!!!
!
!!!
!
!!!!
!
!
!
!!!!
!
!!!!!!!!!!
!!
!!!!!
!
!
!!
!!!!!!!!
!
!!!!!!!!!
!
!!!!
!!!!!
!!!!
!!
!!
!
!!
!
!
!
!
!!!
!
!!!!!!!!!!!
!
!!!!!!!
!!!
!!!!!!!!!!
!!!!!
!!!
!
!!!!!!!!!!!!
!!
!!
!!!!
!!!!
!
!!!!!!!
!
!!
!
!!!
!
!
!!
!
!!!!!
!
!
!!
!!
!!
!!!
!!
!
!
!
!!
!!!
!
!!!!!!
!!
!
!
!!!
!
!
!
!!!
!
!!
!
!
!
!
!
!!
!
!!!!!
!
!
!!!!
!
!
!
!
!!!
!
!
!
!!
!
!!!!!!
!!!
!
!!!!!!!!!
!
!!!!!!!!!!
!!!!
!
!!
!!
!
!!
!
!
!!
!
!
!
!!
!
!!!
!
!!!
!!!
!
! ! !
!
! !!!
!!!
!
!
!
! !!!
!
!
!
!
!
!!! !!!!
!!!!!
!
!
!!!!!!!
!
!!!!!!!!
!!!!!!!!!!!!!!!!!!!!!!!!!!!!!!!!!!!
!!
!!!!
!
!!!!!!!!!!!!!!
!!!
!!!!!!!!!!!!!!!!!!!!!
!!!
!
!!!!!!!
!!!!!!!!!!!!!
!
!!
!!!
!!
!
!!
!!!!!!!!!!!!!!
!!!!!
!
!
!
!!!!!
!!
!!
!!
!
!!!!
!!!!
!
!!
!
!!
!!
!!!!!!
!
!
!!!!!
!
!!!
!
!!!!
!!!!!!
!!!
!
!
!!
!!!!!!!!!!!!!!!!!!!!!!
!!!
!
!!
!!
!!
!
!!!!
!!
!!!!!!!!!
!!
!
!!
!!
!
!!!
!!!!!
!
!!!
!
!!
!
!!!
!!!!!!!!!!!!!!!!!!!!
!
!!!!!!!!!!!!!!!!!!!!!!!!!!
!
!!
!
!!!!
!
!!!!!
!
!
!!!!!!!!!!!!
!!
!!!!
!!!
!!!!!!!!!
!
!!
!!!!!
!
!
!!
!!!!!!!!
!!
!!!
!
!!!
!
!
!!!!
!!!!!!!!
!!!!
!!!!!!!!!!!!!!!!!!!!!!!!!!
!
!!!!!!
!
!!!!!
!
!
!!!!!
!
!
!!!!
!
!!
!
!
!
!
!!
!
!
!
!
!!!!
!
!!!!
!
!!!!!
!
!!!!!!
!!!!!!!!!!
!!!!!!
!
!!!!
!!
!
!
!
!
!!
!
!
!
!
!!
!
!
!!!
!
!!!!!!!!!!!
!
!!!!!!!
!
!!
!
!!!!!
!!
!
!!!
!!!
!
!!!!!!!!
!
!!!!!!
!!
!!!!!
!
!
!!!
!!!!
!!!!
!!!!!
!
!
!
!!!
!!
!
!
!
!
!
!!
!
!
!
!
!
!!
!!
!
!!!
!!!
!
!!
!!!!
!!
!
!!!!!!
!
!
!
!
!
!
!!
!
!!
!!
!
!!!
!!!!!
!
!!
!
!!
!
!!!!!
!
!
!!
!!
!!!!
!
!
!!!!
!
!
!
!!!
!!
!
!!
!
!
!
!!!!
!!!
!!!
!
!
!
!!!!
!!
!
!!!!
!
!!
!!!
!
!
!!!
!
!!
!
!
!
!!!!!!!!!!!!!
!!
!!!!!!
!
!
!
!!
!
!!!
!!
!!!!!
!
!!!
!
!
!!
!!!
!!!
!
!
!
!
!
!
!!
!
!!!!!!!!!
!
!!!!!
!
!!!!!!
!
!
!
!
!
!
!!!!!!!
!
!!!!
!
!
!!!
!
!
!!!!!
!
!
!!!!
!
!
!!!!
!!!
!!
!
!
!
!!
!
!
!
!
!!!!
!
!
!!!
!
!!
!
!!
!
!
!!!
!!!
!
!
!!
!
!!!
!
!!!!!
!
!!
!
!
!
!!!!!!
!
!!!!
!!
!
!!!
!!!!!
!
!
!
!
!
!!!!!!!
!!!
!!
!!!!!
!
!!!!!!
!
!!!
!!!
!
!!
!!
!
!
!
!
!
!!
!!
!
!
!!
!
!
!
!!
!
!!!!!!!!!!!!!
!!!!!!!!
!!
!
!!
!!!!!!!!!!!!!!
!
!
!
!
!!
!
!
!
!
!!
!
!!
!
!!!!
!
!
!!!!
!
!
!
!
!
!!
!!
!
!
!
!!!!
!!!!!!!!
!
!!!!
!
!!!!!
!
!
!
!
!!!
!!!!
!
!!!
!!
!
!!!!
!!
!!!!!!!!!!!!!!!!!
!!
!
!
!
!
!!!!!
!!!
!
!!!!!!!!!
!!!!!!!!!!!!
!!
!
!
!!!!
!!
!!!!!
!!!
!!!
!
!
!!!!
!
!
!
!
!!!
!
!
!!!
!
!
!
!!
!!!
!
!!!
!!!
!!!
!
!!
!
!
!!!!!
!
!
!
!!!!
!!
!
!!
!
!
!!!!!!!!
!
!!!!
!!
!
!!
!
!
!!!!!!!!
!
!!!!!!
!
!!
!
!
!!!
!
!!!
!
!!
!
!!
!!
!!!!!!
!
!!!!!!!!!!!!!!
!
!!!!!!!!!!
!
!
!
!!!!!!!!!!!!!
!
!
!
!!
!
!
!
!
!!!!!!
!!!!
!!
!!!
!!
!!!!!
!!!
!
!!
!!!
!
!
!
! ! !!!! !!! !!
!!
!!
!
!
! !!!
!
!!!!!!!!!
!
!!!!
!!!
!!!
!
!!!!!!!!!
!!!!!!
!!!
!
!
!!!
!!!!
!!!!
!!
!!
!!!!!!
!
!!!!!!!!!!!!!!
!
!!!!!!!!!!
!
!
!
!!!!!!!!!!!!!
!
!
!!!
!
!
!
!
!!!!!!
!!!!
!!!!!!!!
!
!!!!!!!!!!!!!!!!!!!!!!!!
!!!!!
!!!!!
!!!!!
!
!!
!
!
!!!!!
!!!!!!!!!!!
!!!!!!!
!!!!!!
!
!!!!!!!!!!!
!!!!!
!!!
!!!!!
!!!!
!
!!!!!!!
!
!!!!!!
!!!
!
!!!
!
!!!!!
!!
!!
!
!!!!!
!!!
!
!
!
!!
!
!!!!!!
!!!
!
!
!
!
!
!!
!
!!!!
!
!
!
!
!!
!
!!!!
!
!!
!
!!!
!
!!!!!!!
!!
!
!!!
!
!
!
!
!!!!
!!!!!!!!!!!!!!!!!!!
!!!!
!
!!!!
!
!!!
!
!!!!!!!!!!!!!!!!!!!!!!!!!!!!!
!!!!!!!!!!!!!!!!!!!!!!!!!!!!!!!!!
!!!!!!!
!!!!!!!
!
!!
!
!!!!!!!!!!!!!!!!!!!!!!!!!!!!!!!!!!!!!!!!!!!
!!!!!!!!!!!!!!!!!!!!!!!!!!!
!!
!!
!
!!!!!!!!!!!!!!!!!!!!!!!
!
!
!!
!
!!!!!
!
!!!!!!
!
!!
!!!!!!!!!!!!!!!!!!
!
!!!!
!
!!
!
!!!!
!
!!!!!!!!!!
!!
!!!!!!!!!!
!!
!!!!!!
!!
!
!!
!
!!!!!!!!!!!!!!!!!!!!!!!!!!!!!!!!!
!
!!!
!!!!!!
!
!!!!!
!!!!!!!!!!!
!
!!!
!
!!
!!!
!
!!!!!!!!!!!!!!!!!!!!!!!!!
!
!
!
!!!!!!!!!
!
!
!
!!!!!
!
!!!!
!!
!!!
!
!!!!!!!!!!!!!!!!!!!!!!!!!!!!!!!!!!!!!!!!!!!!!!!!!!
!
!!!!
!
!!!!!!!!!!!!!!!!!!!!!!
!
!!
!!!!
!
!!!!!!!!!!!!!!!!!!!!!!!!!!!!!
!!!!!
!
!!!!
!!
!!!!!!
!
!!!!
!
!!!!!!!!
!!
!
!!!!!!
!
!!!!
!
!!
!!!!!!!
!
!!
!
!!!!!!!!!!!!!
!!!!
!!
!!!!!!!!
!
!!
!!
!!!!!!!!!!
!
!
!
!!!!!
!
!!!
!
!!
!
!!!!!!!
!
!!!!!!!!
!
!
!!
!
!
!!
!
!
!
!! !
!!!!!!
!
!
!
!
!
!
!
!!
!
!
!
!
!
!
!
!
!
!
!
!
!
!
!!!
!!
!
!
!!
!
!!!
!
!
! !
!
! !
!
!
! !!!! !!!!!!!!!!!!!!!!!!
!
!!
!!!!
!
!!!!!!
!
!!
!
!
!
!!!
!
!!!
!!
!
!!!!!!!!!!!!
!
!!!!!!!
!!
!!!
!!!!!
!
!!!!!
!
!
!!!!!
!!!!!!!!!!!!!!!
!!
!!
!
!!!!!!!!!!!!!!!!!
!!!!!
!
!
!
!
!
!
!!!
!!
!
!!!!!!
!
!
!
!!!
!
!
!
!!!!
!!!
!!!!!
!
!!!!
!
!
!
!
!!!!
!
!!!!!!
!
!!!
!!
!
!!
!!!!!!!
!!
!!!!!!
!!
!
!!
!
!!!
!
!
!!!!
!
!!!!!!!!!!!!!!!!!!
!!!!!
!
!
!!
!!!
!!!
!
!!!
!!
!!!!!
!!!!!
!
!
!!!
!
!!
!!!
!
!!
!!!!!!!!!!!!!!
!!
!!!
!!
!!
!
!
!
!!!!!!!!!
!
!
!
!!!!!
!
!!!!
!
!
!!!
!
!!!!!
!!!!!!!!!!!
!!!!!!!
!!!!!!!!!
!
!
!!!!!
!
!!!
!!!!!!!!
!
!!!!
!
!!!!!!!!!!!!!!!!!!!!!!
!
!!
!!!!
!
!!!!!
!!!!!!!!!!!!!
!!!!!!!!!!!
!
!!!!
!
!
!!!!
!
!!!!!!
!
!!!!
!
!!!!!!!!
!
!
!
!!!!
!
!
!
!!!
!
!
!
!
!
!!!!!!
!
!
!
!
!!!!!!!
!!!!
!!
!!!!
!
!
!
!!!!!!!
!
!!
!
!
!!
!
!!!!!!!
!
!
!
!!
!
!
!
!
!
!!
!
!!
!
!!
!!!!!
!
!!!!!!!!
!
!!!!!
!!
!
!
!
!!
!!
!!!!
!
!
!
!
!
!
!!
!
!
!
!
!
!
!
!
!
!!
!!!!!!!!!!!!!
!
!!!!!!!
!!
!
!!!!
!
!!!!!
!
!!!!!
!
!!!!!!!
!!!!!!
!
!
!!!!!!!
!
!!!!!!!!!!!!!!
!
!!!
!!
!!!
!
!
!!
!
!
!!!!!!
!
!!!!
!
!
!
!!!!!!!
!!
!
!
!!!!!!!
!
!!!!!
!
!!!!!!!
!!!
!!!
!
!!
!
!
!
!
!!!
!!
!!
!!
!
!
!!
!
!
!!
!
!
!
!
!
!!
!
!!
!
!
!
!!!!!!!!!!!!!
!
!!!!!!!!
!
!!!!
!
!
!
!
!
!
!
!!
!
!!!!
!
!
!
!!!
!!
!!
!
!!
!!
!!
!
!
!!!
!!!!
!!!
!
!!
!
!!!
!!!!!!!!!!!!!!
!
!!!!
!!!!
!
!!!!!!!!!!!!!!!!!
!
!!!!!!!!!!!!!!!
!
!!!!!!
!!
!!!!!
!
!!!!!!
!
!!!
!
!
!
!
!!!!!!!!
!
!
!
!!!!!
!
!!!!
!
!
!
!!!
!
!
!
!!
!
!!
!!
!!!
!!!
!
!
!!!!!!!!!!!
!!
!!!!!!!!!!!!!!!!!!
!!!!!!!!!!!!!!!!!!!!!
!!!!!!!!
!
!!
!
!!!!
!!!!!!!!
!!!!!!!!!!
!!!!
!!
!!!
!!!!!!!!!!!!!!!!
!
!!!!!!!!!!!!!!!!!!!!
!
!!
!
!!!!!!!!!!!
!!!
!!
!!!!
!
!!!!!!!!!!!!
!!
!
!!!!!!!
!
!
!
!!!
!
!!!!!
!
!
!!!!!
!
!!!!!!
!!!
!
!!
!!!
!
!!!!
!
!!
!!!
!!!!
!
!
!!!!!
!
!!!!!!!!!!!
!
!!!
!
!
!
!!!!!
!
!!
!
!!
!!!!!
!
!!!!!!
!
!!!!!!
!!!!!!!!
!
!!!!
!
!!!!!!!!!!!!!!!!!!!!
!
!
!!!
!
!
!!!!
!
!!!!!!!
!
!
!!!
!!
!!!!!!
!
!
!
!
!!
!!
!
!!!!!!!!
!
!!
!!!!
!
!
!!!!!
!
!
!!!!!!!!
!!
!
!!!!
!
!!
!
!!!!
!!!!!
!!!!
!
!!
!
!
!!!!!!!!!!!!
!
!
!!!
!
!
!
!!!
!
!!!!!!!!!!!!!!!!!
!
!!
!
!
!
!
!!
!!
!!!!!!
!!!
!
!
!!
!!!!!!!!
!
!!!!!!
!!
!!!!!!!!!!!
!
!! !
!!
!
!
!
!!
!!!
!
!!!!!!!!!!
!!!!!!!!!!
!!!!!
!!!!
!
!
!
!!!
!!
!!!
!!
!
!
!
!!
!!
!!
!
!
!
!!
!
!!!!
!
Extended Data Figure 3 | Regional association plots. Locuszoom60 plots for genome-wide significant signals. Points show the –log10 P value for each SNP, coloured according to their linkage disequilibrium
(LD; units of r2) with the most associated SNP. The blue line shows the recombination rate, with scale on right hand axis in centimorgans per megabase (cM/Mb). Genes are shown in the lower panel of each subplot.

ARTICLE RESEARCH
© 2015 Macmillan Publishers Limited. All rights reserved
Extended Data Figure 4 | PCA of selection populations and derived allele frequencies for genome-wide significant signals. a, Ancient samples projected onto principal components of modern samples, as in Fig. 1, but labelled according to selection populations defined in Extended Data Table 1. b, Allele frequency plots as in Fig. 3. Six signals
not included in Fig. 3—for SLC22A4 we show both rs272872, which is our strongest signal, and rs1050152, which was previously hypothesized to be under selection, and we also show SLC24A5, which is not genome-wide significant but is discussed in the main text.

ARTICLERESEARCH
© 2015 Macmillan Publishers Limited. All rights reserved
Extended Data Figure 5 | Motala haplotypes carrying the derived, selected EDAR allele. This figure compares the genotypes at all sites within 150#kb of rs3827760 (in blue) for the 6 Motala samples and 20 randomly chosen CHB (Chinese from Beijing) and CEU (Utah residents with northern and western European ancestry) samples. Each row is a sample and each column is a SNP. Grey means homozygous for the major (in CEU) allele. Pink denotes heterozygous and red indicates homozygous for the other allele. For the Motala samples, an open circle means that
there is only a single sequence, otherwise the circle is coloured according to the number of sequences observed. Three of the Motala samples are heterozygous for rs3827760 and the derived allele lies on the same haplotype background as in present-day East Asians. The only other ancient samples with evidence of the derived EDAR allele in this data set are two Afanasievo samples dating to 3300–3000 !", and one Scythian dating to 400–200 !" (not shown).

ARTICLE RESEARCH
© 2015 Macmillan Publishers Limited. All rights reserved
Extended Data Figure 6 | Estimated power of the selection scan. a, Estimated power for different selection coefficients (s) for a SNP that is selected in all populations for either 50, 100 or 200 generations. b, Effect of increasing sample size, showing estimated power for a SNP selected for 100 generations, with different amounts of data, relative to the main text. c, Effect of admixture from Yoruba (YRI) into one of the
modern populations, showing the effect on the genomic inflation factor (blue, left axis) and the power to detect selection on a SNP selected for 100 generations with a selection coefficient of 0.02. d, Effect of mis-specification of the mixture proportions. Here 0 on the x axis corresponds to the proportions we used, and 1 corresponds to a random mixture matrix.

ARTICLERESEARCH
© 2015 Macmillan Publishers Limited. All rights reserved
Extended Data Table 1 | 230 ancient individuals analysed in this study
Population, samples grouped by a combination of date, source, archaeology and genetics; Date range, approximate date range of samples in this group; N, number of individuals sampled; Out, number of PCA outliers (marked with an asterisk if used in selection analysis); Rel, number of related individuals removed; E$ N Chr, average over sites of the e$ective number of chromosomes when we use genotype likelihoods, computed as 2 per called site for samples with genotype calls, or 2" 0.5(c"1) for samples with read depth c; Selection population 1, coarse population labels (marked with a caret if not used in genome-wide scan); Selection population 2, "ne population labels. E/M/LN, Early/Middle/Late Neolithic; LBK, Linearbandkeramik; E/S/WHG, Eastern/Scandinavian/Western hunter-gatherer; EBA, Early Bronze Age; IA, Iron Age.

ARTICLE RESEARCH
© 2015 Macmillan Publishers Limited. All rights reserved
Extended Data Table 2 | Key f-statistics used to support claims about population history
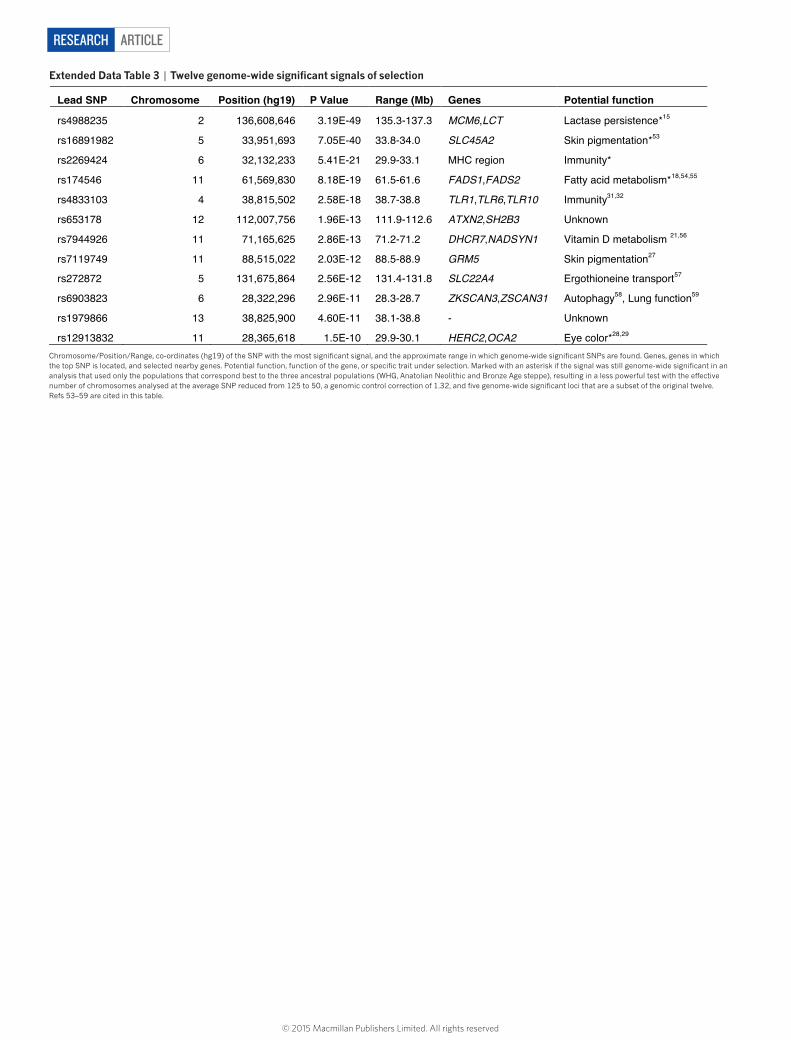
ARTICLERESEARCH
© 2015 Macmillan Publishers Limited. All rights reserved
Extended Data Table 3 | Twelve genome-wide significant signals of selection
Chromosome/Position/Range, co-ordinates (hg19) of the SNP with the most signi"cant signal, and the approximate range in which genome-wide signi"cant SNPs are found. Genes, genes in which the top SNP is located, and selected nearby genes. Potential function, function of the gene, or speci"c trait under selection. Marked with an asterisk if the signal was still genome-wide signi"cant in an analysis that used only the populations that correspond best to the three ancestral populations (WHG, Anatolian Neolithic and Bronze Age steppe), resulting in a less powerful test with the e$ective number of chromosomes analysed at the average SNP reduced from 125 to 50, a genomic control correction of 1.32, and "ve genome-wide signi"cant loci that are a subset of the original twelve. Refs 53–59 are cited in this table.

Archaeological context for 83 newly reported ancient samples
Overview
This note provides archaeological context information for the 83 samples for which genome-wide data is presented for the first time in this study. Descriptions of the context for the remaining ancient samples analyzed in this study have been published in previous publications. Specific references for each sample are given in Supplementary Data Table 1.
Anatolia Neolithic (n=26 samples)
Since the 1950’s, central and southeastern Anatolia have been the subject of archaeological research focused on the origins of sedentism and food-production. The Marmara region of northwestern Anatolia, the location of the to archaeological sites that are the sources of the Anatolian samples in this study (Mente!e Höyük and Barcın Höyük) was for a long time considered to be a region where early agricultural development had not occurred.
Systematic multidisciplinary research in the eastern Marmara region started at the end of the 1980s under the auspices of the Netherlands Institute for the Near East, Leiden (NINO) and its annex in "stanbul, the Netherlands Institute in Turkey (NIT). The first excavations were at Ilıpınar Höyük near "znik Lake. These were followed by excavations at Mente!e and Barcın, situated near an ancient lake in the basin of Yeni!ehir. These sites have provided key data on early farming communities, their environmental settings, and their cultural development over more than a thousand years, from 6600 calBCE (Barcın) to 5500 calBCE (Ilıpınar). A fourth important site in the same region, Aktopraklık, is being excavated by the Prehistory Department of Istanbul University.
These Neolithic villages are distinctive for monochrome pottery, a sophisticated bone industry, single room dwellings with mud and timber frame walls, and mud-brick buildings that were either freestanding or side-by-side in rows. Ilıpınar includes a large number of free standing timber wall buildings consisting of posts closely set in ditches and coated with mud, and pitched reed-covered roofs carried by central posts1. These buildings are regarded as prototypes for houses in eastern and central Europe after the onset of the European Neolithic.
Another characteristic of the eastern Marmara region is the abundance of graves in or near settlements. Given the few hundred burials uncovered so far, it has been hypothesized that the regional tradition involved interment of a large part of the deceased population in the village ground. This custom contrasts with nearby regions of western Anatolia and Turkish and Bulgarian Thrace, where inhumations are scarce2. In central Anatolia, for example at Çatal Höyük3, burial frequencies are similar to the Marmara region. There are also other links between the two regions in terms of ceramic assemblages and other material culture elements.
With a few exceptions, the funeral practices of the eastern Marmara region were as follows. Graves were spread across the courtyards or concentrated in one spot near the village4. The
WWW.NATURE.COM/NATURE | 1
SUPPLEMENTARY INFORMATIONdoi:10.1038/nature

dead were buried in single graves and lay in contracted positions on their left or right side with varying body orientations. The articulated skeletal parts point to primary interments. Another feature of the burials is the presence of wooden remains in many grave pit bottoms, showing that the deceased had been deposited on wooden boards5. Grave goods often accompanied the dead, as there were pottery vessels, necklaces, pendants, stone tools, and also animal parts (horns, scapulae).
Mente!e Höyük in Anatolia (n=5 samples) Several archaeological excavations were carried out at Mente!e between 1996 and 2000 with the purpose of comparing the extensive chronological and socio-economic data from Ilıpınar with that from Mente!e. Mente!e was a small farming community in the plain of Yeni!ehir with a millennium-long occupation history and an economy based on plant cultivation and animal husbandry. Houses were built with light mud and timber-frame walls of the wattle-and-daub type. The material culture includes monochrome pottery and falls within the tradition of the Marmara region loosely defined as the Fikirtepe culture6. Eleven radiocarbon dates running from 6400 to 5600 calBCE corroborate the stratigraphy of the mound.
The total number of individuals excavated at Mente!e is 20: 11 adults and 9 infants and children7. The following 5 individuals produced genome-wide data:
! I0724 / UP This individual is estimated to be 10-14, years old, with a stature of 157 cm. Osteological analysis indicates a male, and we confirm this genetically. He was found close to an adult woman who was older than 40. He was lying on his left side in a S-N orientation with his back turned to the woman.
! I0725 / UA SSK15 (filtered out of main analyses) This individual is estimated to be 23-34 years old, with a stature of 155 cm. Osteological analysis indicates a female, which we confirm genetically. She had two traumas: a healed impression fracture of the vault of her skull, and a split and fused distal phalanx of one of her thumbs. She was buried on her right side in a SW-NE orientation, and wooden remains at the bottom of her grave indicated she was buried on a wooden plank. Two aspects of her burial were unusual and suggested the possibility of a later burial: her grave yielded some broken pottery of a type that is unusual for the Mente!e archaeological assemblage, and the truncated burial shaft was dug more than one meter deep from an unknown surface. Population genetic analysis of data from this individual indicates that she is an outlier compared to other Anatolian Neolithic samples. Combined with the other unusual features of her burial, this led us to filter her data out of our main analyses.
! I0727/UA JK 16 This individual is estimated to be 34-40 years old, with a stature of 168 cm. Osteological analysis indicates a male, which we confirm genetically. He probably suffered from diffuse idiopathic skeletal hyperostosis (DISH) and osteoarthritis, and his left forearm showed a healed fracture. His highly flexed skeleton was buried its right side in a SW-NE orientation. A broken pot that was of a style that does not fit well for the archaeological assemblage of Mente!e was found near his face. Despite this feature, we did not filter out his data from our main analyses because unlike I0725 / UA SSK15, he is not a population genetic outlier.
WWW.NATURE.COM/NATURE | 2
SUPPLEMENTARY INFORMATIONRESEARCHdoi:10.1038/nature

! I0726 / UF This individual is estimated to be 23-40 years old. Osteological analysis indicates a male, but the genetic data contradicts this and suggests a female. The individual, who suffered from osteoarthritis, was buried with pottery vessels as indicated by sherds near the head and feet, and was lying on its right side in a W-E orientation.
! I0723 / UH This individual is estimated to be 43-48 years old, with a stature of 166 cm. Osteological analysis indicated a male, which we confirm genetically. A bone tool found near his waist suggests that he wore a belt when he was buried. Like I0726 / UF, he suffered from osteoarthritis. His skeleton was lying on its left side in a S-N orientation.
Barcın Höyük in Anatolia (n=21 samples) Barcın Höyük is located in the Yeni!ehir Plain in Northwest Turkey, originally on a small natural elevation at the edge of a retreating lake8. Excavations have demonstrated continuous occupation between around 6600 calBCE and 6000 calBCE9, producing about 4 meters of stratified Neolithic settlement deposits. From the start of habitation, animal husbandry and crop cultivation were the mainstay of this subsistence economy. The deepest levels at Barcın Höyük represent the oldest known farming community in northwestern Anatolia.
It is important to place the site of Barcın within the context of a broader understanding of the Neolithization of western and northwestern Anatolia. Ongoing excavations in both regions now indicate a rather sudden appearance of farming villages around 6700-6600 calBCE10. This development breached a boundary that had remained in place for more than 1,500 years between agricultural landscapes in southeastern and central Anatolia to the east and uninhabited or lightly inhabited forager landscapes to the west11.
Excavations at Barcın between 2007 and 2014 yielded large assemblages of human remains, mostly from primary and single inhumation burials within the settlement2. Infants, juveniles and adults are all represented. To date, remains of 115 individuals have been excavated (47 adults, 68 non-adults). More than half of the burials belong to infants. DNA was successfully extracted from 21 samples (15 infants, 1 child, 5 adults). Fourteen of the 21 the skeletons were osteologically analyzed. The age determination of the infants that were not examined was estimated by observing bone dimensions when the samples were collected.
The sample numbers and descriptions are given below:
• I0707 / L11-213This infant is estimated to be about 3 months old based on long bone size and 4-8 months oldbased on dentition. The sample is genetically determined to be female.
• I0708 / L11-439This is a badly disturbed burial that is both osteologically and genetically male.
• I0709 / M13-170.This is an older infant estimated from bone size. The sample is genetically male.
WWW.NATURE.COM/NATURE | 3
SUPPLEMENTARY INFORMATIONRESEARCHdoi:10.1038/nature
"
• I0736 / L11-216This is estimated to be a neonate (from the bone size). The sample is genetically female. It isalso genetically a first degree relative of I0854 / L11-215.
• I0744 / M10-275This is estimated to be a neonate (from the bone size). The sample is genetically male.
• I0745 / M11-363This is estimated to be a neonate (from the bone size). The sample is genetically male.
• I0746 / L11-322This infant is estimated to be about 3 months old based on long bone size and 4-8 months oldbased on dentition. The sample is genetically male.
• I0854 / L11-215 (filtered out of main analyses)This is estimated to be a neonate (from the bone size). The sample is genetically female. Thesample is also genetically a first degree relative of I0736 / L11-216. We use this sample’s firstdegree relative to represent this family because it is has more genetic data.
• I1096 / M10-76This infant is estimated to be 1-2 years old. The sample is genetically male.
• I1097 / M10-271This is estimated to be a neonate (from bone size). The sample is genetically male.
• I1098 / M10-352This is estimated to be a neonate (from bone size). The sample is genetically female.
• I1099/ L11-S-488This is estimated to be a neonate (from bone size). The sample is genetically male.
• I1100 / M11-351This is estimated to be a neonate (from bone size). The sample is genetically female.
• I1101 / M11-352aThis is estimated to be a neonate (from bone size). The sample is genetically male.
• I1102 / M11-354This is estimated to be a neonate (from bone size). The sample is genetically male.
• I1103 / M11-S-350This is estimated to be a neonate (from bone size). The sample is genetically male.
• I1579 / M13-72This individual is osteologically determined to be a 35-45 year old female, and is alsogenetically female. She was buried on her left side in a highly flexed position.
WWW.NATURE.COM/NATURE | 4
SUPPLEMENTARY INFORMATIONRESEARCHdoi:10.1038/nature

• I1580 / L12-393This individual, genetically female, was not fully examined. A flint artefact was in the grave.
• I1581/ L12-502This adult, genetically female, was not examined.
• I1583/L14-200.This child, age about 6-10 years, is genetically male.
• I1585 / M11-59.This badly disturbed burial of an individual from middle to older age did not have anosteologically determined sex. The sample is genetically female.
Iberia Chalcolithic (n=14 samples)
El Mirador Cave in Iberia (n=14 samples) All the Iberia Chalcolithic samples are from El Mirador Cave, which overlooks the southernmost flank side of Sierra de Atapuerca (Burgos, Spain), at an altitude of 1,033 meters above sea level. The mouth of this karst cavity is now approximately 23 meters wide and 4 meters high, penetrating some 15 meters inwards. Initial archaeological work was carried out in the 1970s. In 1999, the fieldwork was resumed, and it is still ongoing12.
Three different assemblages of human remains have been retrieved from this site:
(a) A single burial from the Middle Bronze Age dated to 1,740 calBCE (Beta-296226)
(b) Six individuals from the Early Bronze Age dated to between 2,030 and 2,430 calBCE(Beta-153366, 182041 and 182042) that correspond to human remains that werecannibalized and then abandoned13.
(c) A minimum of 23 individuals from a collective burial from the Chalcolithic period,excavated in a small natural cavity located in the NE corner of the cave (Fig. 1). Theremains are associated with smooth hemispherical bowls, fractured deer antlers, and rivershell valves. Two bones have been radiocarbon dated, yielding similar dates: 2,880calBCE (Beta-296227), and 2,630 calBCE (Beta-296225). Based on the union of thecalibrated confidence intervals, we estimate the burials to be between 2,570 and 2,900years calibrated BCE. Mitochondrial DNA of some specimens was published in 201414.
The following 14 samples successfully produced genome-wide data:
! I0581 / MIR5 and MIR6 This sample is genetically male. Initially these samples were thought to be from two different individuals but the genetic analysis indicates they are the same individual so we merged them.
! I1274 / MIR11 (filtered out of main analyses) This sample is genetically male. Genetic analysis indicates that this individual is a first degree relative (parent-child or sibling) of I1277 / MIR14. We filtered this sample from our main
WWW.NATURE.COM/NATURE | 5
SUPPLEMENTARY INFORMATIONRESEARCHdoi:10.1038/nature

"
analyses because its first degree relative has more genetic data.
! I1277 / MIR14 This sample is genetically male. Genetic analysis indicates that this individual is a first degree relative (parent-child or sibling) of I1274 / MIR11.
! I1302 / MIR24 (filtered out of main analyses) This sample is genetically male. Genetic analysis indicates that this individual is a first degree relative (parent-child or sibling) of I1314 / MIR26. We filtered this sample from our main analyses because its first degree relative has more genetic data.
! I1314 / MIR26 This sample is genetically male. Genetic analysis indicates that this individual is a first degree relative (parent-child or sibling) of I1302 / MIR24.
! I1271 / MIR1 This sample is genetically female.
! I1272 / MIR2 This sample is genetically female.
! I1276 / MIR13 This sample is genetically female.
! I1280 / MIR17 This sample is genetically female.
! I1281 / MIR18 This sample is genetically female.
! I1282 / MIR19 This sample is genetically male.
! I1284 / MIR21 This sample is genetically male.
! I1300 / MIR22 This sample is genetically female.
! I1303 / MIR25 This sample is genetically male.
Neolithic samples from Mittelelbe-Saale, Germany (n=15) This study includes 15 newly reported samples from the transect-through-time study in Mittelelbe-Saale, Central Germany that featured in previous publications15,16. For the reader’s convenience and reasons of consistency, we repeat summary descriptions for some sites followed by the list of samples for which genome-wide data are newly reported in this study.
WWW.NATURE.COM/NATURE | 6
SUPPLEMENTARY INFORMATIONRESEARCHdoi:10.1038/nature

"
LBK in Germany: Halberstadt-Sonntagsfeld (n=1) The Linearbandkeramik (LBK) Halberstadt-Sonntagsfeld site was discovered during construction of a new development and was excavated between 1999 and 2002, uncovering 1324 archaeological features across an area of 9947m2. The majority of the finds could be attributed to the LBK, with contours and remnants of seven long houses, several pits and 42 graves17. The remaining finds could be attributed to the Middle Neolithic Bernburg culture as well as the Unetice and Urnfield cultures of the Bronze Age. The site is a classical example of LBK settlement burials, where the majority of graves were grouped around five long houses, while one group of six graves was located inside the central yard area of the settlement. We add one 40-60 year-old individual clearly associated with an LBK house.
! I1550 / HAL19 This is grave 22, feature 666. The sample is osteologically and genetically female.
LBK in Germany: Karsdorf (n=1) The site of Karsdorf is located in the valley of Unstrut, Burgenlandkreis, Saxony-Anhalt, Germany. The slope on which Karsdorf is located is characterized by alluvial loess. The place itself was settled intensively since the earliest phase of the LBK in the region. The settlement area is at least 50 acres in size and nearly 30 houses have been excavated. So-called ‘settlement burials’ were regularly found in pits in the center of the settlement area. We add one individual.
• I0797 / KAR16Feature 611. This sample is genetically male.
Salzmuende culture in Germany: Salzmünde-Schiebzig (n=1) The spur on which the site of Salzmünde (7 km south of Halle/Saale, Saxony-Anhalt) is located has been inhabited intermittently since the Paleolithic. Human occupation intensified during the Neolithic, with archaeological evidence for settlements and burials. Around 3300 BCE people of the eponymous Middle Neolithic Salzmünde culture built a causewayed enclosure (earthwork) with double trenches. Ground plans of houses and several clay pits indicate permanent settlements at the site. Excavation between 2005 and 2008 found human remains of 141 individuals, which reveal a number of complex burial rites: remains were found both inside and outside the enclosure, sometimes underneath layers of potsherds, and sometimes as isolated skeletal elements (mostly skulls) in trenches and clay pits. We report one new individual from this culture.
• I0551 / SALZ3bFeature 6582. This is a 2.5-4 year old child from an unusual multiple grave of nineindividuals that was found in a 1-1.5m deep, circular pit of 1.3m diameter underneath a layerof 8000 sherds of amphorae and other pottery. The sample is genetically male.
Corded Ware in Germany: Esperstedt (n=9) The site of Esperstedt forms part of large-scale excavations initiated in 2005 in the context of major infrastructural roadworks in Saxony-Anhalt, Germany to build motorway A38. Individuals from Esperstedt reference site 4 could be unambiguously assigned to the Corded Ware culture, both by accompanying pottery and by characteristic orientation of the burials18.
WWW.NATURE.COM/NATURE | 7
SUPPLEMENTARY INFORMATIONRESEARCHdoi:10.1038/nature

"
Males were usually buried in a right-hand side flexed position with head to the west and facing south, while females were buried on their left-hand side with their head to the east. We added nine new individuals from this site:
• I1532 / ESP8.Feature 4182. This is genetically male.
• I1534 / ESP14Feature 6141. This is genetically male.
• I1536 / ESP17Feature 4098. This is genetically male.
• I1538 / ESP20Feature 2200. This is genetically male.
• I1539 / ESP25Feature 4179. This is genetically female.
• I1540 / ESP28Feature 2152. This is genetically male.
• I1541 / ESP32Feature 4290. This is genetically male.
• I1542 / ESP33Feature 2101. This is genetically male.
• I1544 / ESP36.Feature 6232. This is genetically male.
Bell Beaker in Germany: Benzingerode-Heimburg (n=2) The archaeological site was excavated 2000-2005 in the context of major infrastructural roadworks in Saxony-Anhalt, Germany, to build motorway B6n. Numerous Late Neolithic finds across the 2.5km long and 30-100m wide section V between the villages Benzingerode and Heimburg indicate settlement activity during the Bell Beaker and Early Bronze Age Unetice periods19. We include two new individuals attributed to the Bell Beaker period:
• I1546 / BZH2Grave 8, feature 5079. This individual is genetically female. The body was oriented in right-hand-side flexed position in SO-NW orientation with the head in the southwest facing north.Based on this it was tentatively classified as Bell Beaker by excavator Tanja Autze20.
• I1549 / BZH15.Grave 1, feature 1289. This individual is osteologically and genetically female, and wasclassified as Bell Beaker x by excavator Tanja Autze1. The body of the 50-65 year-old wasoriented in right-hand-side flexed position with the head in the east facing northeast.
WWW.NATURE.COM/NATURE | 8
SUPPLEMENTARY INFORMATIONRESEARCHdoi:10.1038/nature
Bell Beaker in Germany: Quedlinburg VII (n=1) The site of Quedlinburg, Harzkreis, is situated in the fertile foothills of the northern Harz, a region characterized by rich loess soils. A group of six graves was discovered at the Quedlinburg reference site VII in Saxony-Anhalt and has been attributed to the Bell Beaker culture based on the form and orientation of the burials21. We included one new individual:
• I0805 / QLB26Feature 19614. This 35-45 year-old individual is osteologically and genetically male. Thebody was buried in NO-SW orientation with the head in the north facing east. Grave goodsare scarce and include three silex arrowheads, a few potsherds, and animal bones. A notableobservation from the physical anthropological examination is traits at the acetabulum and thefemur head suggesting that the individual frequently rode horses.
Prehistoric Samples from Russia, Eneolithic to Bronze Age (n=27) This study contains 26 additional samples from Russia obtained during the Samara Valley Project, and 1 from Karelia, in addition to those previously published in ref. 16. For the reader’s convenience we repeat summary descriptions for some sites that contained both previously published graves and graves that are published here for the first time.
Hunter-gatherer sample: Karelia Russia (n=1) In this study we added another individual from the ~5500 BCE Mesolithic site Yuzhnyy Oleni Ostrov (an island in Lake Onega) in Karelia, Western Russia, to the one reported in ref. 16. Mitochondrial data from seven other individuals from the same site have been described22.
• I0221 / UZ0040MAE RAS collection number 5773-40, grave number 39/1. This is genetically male.
Khvalynsk Eneolithic in the Volga steppes: Saratovo, Russia (n=3) Three individuals described here were among 39 excavated in 1987-88 at the Eneolithic cemetery of Khvalynsk II, Saratov oblast, Russia, on the west bank of the Volga River, 6 km north of the village of Alekseevka. Khvalynsk I and II are two parts of the same cemetery, excavated in 1977-79 (Khvalynsk I) and 1987-88 (Khvalynsk II).23 The two excavations revealed 197 graves, about 10x larger than other cemeteries of this period in the Volga-Ural steppes, dated by radiocarbon to 5200-4000 BCE (95.4% confidence). Bones of domesticated cattle and sheep-goat, and horses of uncertain status, were included in 28 human graves and in 10 sacrificial deposits. The 367 copper artifacts in the graves, mostly beads and rings, are the oldest copper objects in the Volga-Ural steppes, and trace elements and manufacturing methods in a few objects suggest trade with southeastern Europe. Together with high 15N in the human bones from Khvalynsk, which might have caused a reservoir effect making 14C dates too old, the circulation of so much copper, which increased in SE Europe after 4700 BCE, suggests that a date after 4700 BCE would be reasonable for many graves at Khvalynsk. Copper was found in 13 adult male graves, 8 adult female graves, and 4 sub-adult graves. The unusually large cemetery at Khvalynsk contained southern Europeoid and northern Europeoid cranio-facial types, consistent with the possibility that people from the northern and southern steppes mingled and were buried here.
! 10122 / SVP35 (grave 12) Male (confirmed genetically), age 20-30, positioned on his back with raised knees, with 293 copper artifacts, mostly beads, amounting to 80% of the copper objects in the combined
WWW.NATURE.COM/NATURE | 9
SUPPLEMENTARY INFORMATIONRESEARCHdoi:10.1038/nature

cemeteries of Khvalynsk I and II. Probably a high-status individual, his Y-chromosome haplotype, R1b1, also characterized the high-status individuals buried under kurgans in later Yamnaya graves in this region, so he could be regarded as a founder of an elite group of patrilineally related families. His MtDNA haplotype H2a1 is unique in the Samara series.
! 10433 / SVP46 (grave 1) Male (confirmed genetically), age 30-35, positioned on his back with raised knees, with a copper ring and a copper bead. His R1a1 haplotype shows that this haplotype was present in the region, although it is not represented later in high-status Yamnaya graves. His U5a1i MtDNA haplotype is part of a U5a1 group well documented in the Samara series.
! 10434 / SVP47 (grave 17) Male (confirmed genetically), age 45-55, positioned contracted on his side, with 4 pathological wounds on his skull, one of which probably was fatal. No grave gifts or animal sacrifices accompanied the burial. His Q1a Y-chromosome haplotype is unique in the Samara steppe series, but his U4a2 or U4d MtDNA haplotype are not unusual.
Middle Bronze Age Poltavka culture, Samara, Russia (n=5) Five Middle Bronze Age (MBA) individuals described here were excavated by Samara archaeologists at five different MBA kurgan cemeteries of the Poltavka culture, all located in the Samara oblast. The Poltavka culture evolved from the Yamnaya culture beginning about 2900-2800 BCE and lasted until about 2200-2100 BCE. Four of the five individuals are directly dated with 14C dates that fall between 2925-2484 BCE. Poltavka graves exhibited new types of pottery vessels and some small innovations in grave shape and construction compared with the earlier Yamnaya, but the Poltavka economy was a continuation of the mobile pastoral economy introduced during the Early Bronze Age Yamnaya period beginning about 3300 BCE. MBA Poltavka settlements excavated during the Samara Valley Project were ephemeral seasonal camps that yielded <1 artifact per 2m2, a signal of high mobility.
Kutuluk III, kurgan 1, grave 2 ! 10126 / SVP51 Kutuluk III is a Poltavka kurgan cemetery dated to the MBA located on the Kinel’ River, a tributary of the Samara, near two earlier EBA Yamnaya kurgan cemeteries. Kurgan 1, grave 2 contained a male (confirmed genetically), age 25-35, feet stained with red ochre, ovicaprid bones associated in the grave. Y-chromosome haplotype R1b1a2a2, MtDNA type H6a2.
Grachevka II, kurgan 1, grave 1 ! 10371 / SVP11 Grachevka II is a Poltavka kurgan cemetery dated to the MBA located on the Sok River, north of the Samara River in Samara oblast, within a regional cluster of Bronze Age kurgan cemeteries. Kurgan 1, grave 1 contained a male (confirmed genetically), age not recorded. Y-chromosome haplotype R1b1a2, MtDNA type U2d2.
Nikolaevka III, kurgan 5, grave 1 ! 10374 / SVP16 Nikolaevka is a cemetery of five kurgans dated to the MBA located south of the estuary of the Samara River near its junction with the Volga. Kurgan 5, grave 1 contained a male (confirmed genetically) age 35-45. Y-chromosome haplotype R1b1a2a, MtDNA type H13a1a.
Lopatino II, grave kurgan 1, grave 1 ! 10440 / SVP53 Lopatino II is a cemetery of kurgans dated to both the EBA and MBA located on the Sok River in Samara oblast, within a regional cluster of Bronze Age kurgan cemeteries. Kurgan 1,
WWW.NATURE.COM/NATURE | 10
SUPPLEMENTARY INFORMATIONRESEARCHdoi:10.1038/nature

grave 1 contained a male (confirmed genetically) age 25-35 with red ochre staining on his distal tibia. Y-chromosome haplotype R1b1a2a2, MtDNA type I3a.
Potapovka I, kurgan 5, grave 6 ! 10432 / SVP42 Potapovka I is an important cemetery of the late MBA or MBA2 Sintashta-culture era, but this grave shows that an older MBA Poltavka cemetery was located in the same place on the Sok River, in the transitional forest-steppe zone of Samara oblast. Grave 6 was dated 2925-2536 calBCE (4180 ± 84 BP: AA12569), centuries older than the MBA2 grave pit that cut through it, removing about 60% of the Grave 6 skeleton. Grave 6 was that of a male (confirmed genetically) age 35-45 years, his foot bones stained with red ochre, buried with the lower leg bones of a sheep or goat. His Y-chromosome haplotype was R1a1a1b2a, the only R1a male in the EBA-MBA series and a signal of an emerging broader set of more varied male haplogroups that would become better defined in the MBA2 and LBA. His MtDNA haplotype was U5a1c. Another Poltavka grave under kurgan 3 was cut through in the same way, so Potapovka 1 seems to have been established in the MBA2 directly on top of an older Poltavka cemetery.
Late Middle Bronze Age (MBA2) Potapovka culture, Samara, Russia (n=3) Three individuals of the MBA2 period, 2200-1800 calBCE, were excavated from two MBA2 kurgan cemeteries of the Potapovka culture near the village of Utyevka in the Samara oblast. The Potapovka culture was a western variant of the Sintashta culture, which was centered 400 km to the east and produced the oldest dated chariots, buried in graves with paired horse teams and weapons. In the Samara steppes, cemeteries of the Potapovka type contained material culture very similar to Sintashta in graves with paired horses and cheekpieces, but no spoked wheel remains survived.24 Sintashta and Potapovka are argued to have been the parent cultures from which the LBA Andronovo and Srubnaya cultures evolved, and so played a key role in the transition from the mobile EBA/MBA economies to the more settled LBA economy. The MBA2 period witnessed innovations in warfare and weaponry, the beginning of a change to sedentary pastoralism, and the extension of trade contacts from the northern steppes to Central Asian urban centers. The population afforded graves under kurgans expanded to include not just a few adult men, but many women and children as well, perhaps entire elite families.
Utyevka VI, kurgan 6, grave2 ! 10246 / SVP41 The Utyevka VI cemetery was located 0.8 km north-northeast of the village of Utyevka, Samara oblast, south of the Samara River. It contained some of the richest and most unusual graves of the Potapovka culture. Kurgan 6, grave 2 contained six humans: a male-female couple buried facing each other aged 15-17; and four children and infants too old and numerous to be the offspring of the couple—perhaps siblings. Horse sacrifices, shield-shaped studded bone cheekpieces interpreted as chariot-driving gear, weapons (three copper daggers, a flat copper axe, 16 flint projectile points), copper beads and rings, and other objects were found in the grave. Sample 10246 is from the 15-17-year-old male (confirmed genetically). His Y-chromosome haplotype was P1.
Utyevka IV, kurgan 4, grave 1 ! 10418 / SVP24 The Utyevka IV cemetery was located 1 km SE of the Utyevka VI cemetery. Kurgan 4, grave 1 contained a mature female (confirmed genetically) age 45+, buried with the bones of an ovicaprid. Her MtDNA haplotype was T1a1.
Utyevka VI, kurgan 7, grave 1 ! 10419 / SVP27
WWW.NATURE.COM/NATURE | 11
SUPPLEMENTARY INFORMATIONRESEARCHdoi:10.1038/nature

"
Kurgan 7, grave 1 at Utyevka VI contained a mature male (confirmed genetically) age 45+ . He was buried with a Potapovka-style ceramic pot and his grave was covered by a pair of sacrificed horse skulls and hooves probably originally attached to their hides. His Y- haplotype was R1a1a1b; MtDNA was U2e1h, found in other ancient steppe graves.
Late Bronze Age Srubnaya culture, Samara, Russia (n=14) Fourteen individuals of the LBA Srubnaya, or Timber-Grave, culture were sampled from 7 kurgan cemeteries in the middle Volga region of Russia. The LBA Srubnaya-Andronovo horizon was a chain of similar settlements, cemeteries, and material culture types associated with a settled form of pastoralism that extended across the Eurasian steppe belt, connecting China with Europe and Iran for the first time. The upper Samara valley south of the Urals was the border between Srubnaya to the west and Andronovo to the east; many settlements in this region contain both styles of pottery. Srubnaya material culture types appeared earliest about 1900 BC in the Samara region, then spread west and south to the Dnieper in Ukraine by 1700 BC. Srubnaya settlements extended north into the forest-steppe zones in the Samara region between 1900-1200 BC. Srubnaya cemeteries included the whole population in normal proportions by age and sex. Unlike the cemeteries of the EBA-MBA and MBA2, the cemeteries of the LBA provide a demographic sample with data in all age and sex classes. Chariots were used, and large copper mines operated in and around Samara oblast, although most Srubnaya settlements in the region were family-sized homesteads of 3-5 structures. The Spiridonovka II cemetery was the richest Srubnaya cemetery in the Samara valley, probably associated with a local chiefly family.
Novosel’ki, kurgan 6, grave 1 ! 10232 / SVP12 Novosel’ki was a Srubnaya cemetery containing 11 kurgans and 76 Srubnaya graves, located in Tatarstan oblast near the forest-steppe/forest zone ecotone, an early example of a Srubnaya community located in the forest-steppe zone, well north of the steppes. Kurgan 6, grave 4 contained a young male (confirmed genetically) age 17-25, with a normal steppe Y-chromosome haplotype of R1a1a1b2, MtDNA type U5a1f2.
Rozhdestvenno I, kurgan 5, grave 7 ! 10234 / SVP25 Rozhdestveno was another forest-steppe zone Srubnaya cemetery located west of the Volga. Kurgan 5 grave 7 contained an adult female (confirmed genetically) age 25-35, MtDNA type K1b2a, previously unusual in the steppes.
Rozhdestvenno I, kurgan 4, grave 4, skeleton 2 ! 10235 / SVP26 Rozhdestveno I, kurgan 4, grave 4, skeleton 2 was that of an adolescent female (confirmed genetically) age 15-17. Her MtDNA haplotype was I1a1, previously unusual is the steppes.
Barinovka I, kurgan 2, grave 24 ! 10422 / SVP30 Adult female (confirmed genetically) age 40-45, MtDNA type T1a1.
Barinovka I, kurgan 2, grave 17 ! 10423 / SVP31 Adult male (confirmed genetically) age 40-50 with Y-chromosome type R1a1a1b2; MtDNA type was J2b1a2a.
Uvarovka I, kurgan 2, grave 1 ! 10424 / SVP32 Adult male (confirmed genetically) age 40-50 with Y-chromosome type R1a1a1b2; MtDNA type was T2b4.
WWW.NATURE.COM/NATURE | 12
SUPPLEMENTARY INFORMATIONRESEARCHdoi:10.1038/nature

"
Spiridonovka IV, Spiridonovka IV was one of four Srubnaya kurgan cemeteries located on the southern bank of the Samara River, north and south of the village of Spiridonovka. Cemetery IV was located southeast of the village and contained 9 kurgans, two of which were excavated by Samara archaeologists in 1996, uncovering 24 Srubnaya individuals in kurgan 1 and 15 in kurgan 2, including 7 adult males, 5 adult females, 11 sub-adults, and 1 undetermined. About half the graves contained a pottery vessel and a few had beads or a bracelet of copper or bronze.
Spiridonovka IV, kurgan 1, grave 15 ! 10354 / SVP1 Adult female (confirmed genetically) age 35-45 with MtDNA type U5a1.
Spiridonovka IV, kurgan 2, grave 1 ! 10358 / SVP6 Adult female (confirmed genetically) age 35-35 with MtDNA haplotype H6a1a.
Spiridonovka IV, kurgan 1, grave 6 ! 10359 / SVP7 Adult female (confirmed genetically) age 25-35, MtDNA haplotype U5a2a1.
Spiridonovka IV, kurgan 1, grave 11 ! 10360 / SVP8 Male (confirmed genetically) of undetermined age; a secondary burial of bones exposed and only partially collected before burial. His Y-chromosome haplotype was R1a1; his MtDNA type was U5a1.
Spiridonovka IV, kurgan 2, grave 5 ! 10361 / SVP9 Adolescent male (confirmed genetically) age 15-17, Y-chromosome type R1a1a, MtDNA type H5b.
Spiridonovka II Spiridonovka II was the richest Srubnaya cemetery in the lower Samara River valley, located northwest of the village of Spiridonovka. At least 14 kurgans were counted, and four were excavated (1, 2, 10, 11). Kurgan 1 contained 17 graves and kurgan 2, 37 graves. Grave 1 in kurgan 1 contained a male age 17-25 with weapons—a dagger and a set of 12 lanceolate flint projectile points—and a bone clasp or belt ornament. Grave 2 contained an adolescent age 13-16, probably female, and a juvenile age 6-8 years, decorated with faience beads that were probably imported from outside the steppes, and numerous bronze bracelets, beads, and pendants, including a pair of long, dangling earrings made of leaf-like sets of pendants arranged in three rows. Grave 7 contained a bronze bracelet, ring, and bead, while Grave 13 contained an adult female age 25-35 with 16 tubular bronze beads and eight bronze medallions. In kurgan 2, grave 29 contained a child about 12 years of age buried with a copper-bronze bracelet and a pair of gold-silver pendants gilded using a technique known as depletion gilding, documented elsewhere before the first millennium BC only in the jewelry from the Royal Cemetery of Ur in Iraq. Samples 10421 and 10430 below, buried under different kurgans with distinct groups of graves, were first-degree relatives, and given their shared MtDNA types, they were either mother and son or brother and sister.
Spiridonovka II, kurgan 11, grave 12 ! 10421 / SVP29 Adult female (confirmed genetically) 35-45, MtDNA type H3g. She is a first degree relative of I0430. We exclude her data from population genetic and selection analyses because of the higher coverage of their first degree relative, who we use to represent the family.
WWW.NATURE.COM/NATURE | 13
SUPPLEMENTARY INFORMATIONRESEARCHdoi:10.1038/nature

"
Spiridonovka II, kurgan 1, grave 1 ! 10430 / SVP39 Adult male (confirmed genetically) age 17-25 buried with weapons, see above; Y-chromosome type R1a1a1b2a2a; MtDNA type H3g. He is a first degree relative of I0421.
Spiridonovka II, kurgan 1, grave 2 ! 10431 / SVP40 Adolescent age 13-16, female (confirmed genetically), MtDNA type H2b.
References
1 Roodenberg, J. in Life and Death in a Prehistoric Settlement in Northwest Anatolia. The Ilıpınar Excavations, Volume III (eds J. Roodenberg & S. Alpaslan Roodenberg) (The Netherlands Institute for the Near East, 2008).
2 Alpaslan Roodenberg, M. S., Todorova, N. & Petrova, V. The Human Burials of Yabalkovo. . Praehistorische Zeitschrift 88, 23-37 (2013).
3 Andrews, P., Molleson, T. & Boz, B. in Inhabiting Çatalhöyük: reports from the 1995–1999 seasons. (ed I. Hodder) (British Institute of Archaeology at Ankara, 2007).
4 Karul, N. & Avcı, B. Neolithic Communities in the Eastern Marmara : Aktopraklık C. Anatolica 37, 1-15 (2011).
5 Alpaslan Roodenberg, S. in Life and Death in a Prehistoric Settlement in Northwest Anatolia. The Ilıpınar Excavations, Volume III (eds J. Roodenberg & S. Alpaslan Roodenberg) (The Netherlands Institute for the Near East, 2008).
6 Roodenberg, J., van As, A., Jacobs, L. & Wijnen, M. H. Early Settlement in the Plain of Yeni!ehir (NW Anatolia). Anatolica 29, 17-59 (2003).
7 Alpaslan-Roodenberg, S., 2001 – Newly found human remains from Mente!e in the Yeni!ehir Plain: The season of 2000. Anatolica 27:1-14.
8 Groenhuijzen M, Kluiving S, Gerritsen FA, Künzel M. (2015) Geoarchaeological Research at Barcın Höyük: Implications for the Neolithisation of Northwest Anatolia. Quarternary International 367: 51-61
9 Gerritsen FA, Özbal R, Thissen L (2013) The Earliest Neolithic Levels at Barcın Höyük, Northwestern Turkey. Anatolica 39, 53-92.
10 Weninger B, Clare L, Gerritsen F, Horejs B, Krauß R, Özbal R, Rohling E. (2014) Neolithisation and Rapic Climate Change (6600-6000 cal BC) in the Aegean and Southeast Europe. Documenta Praehistorica 41, 1-31.
11 During BS (2013) Breaking the Bond: Investigating the Neolithic Expansion in Asia Minor in the Seventh Millennium BC. Journal or World Prehistory 26, 75-100.
12 Carbonell E et al. (2014) Sierra de Atapuerca archaeological sites, in: Sala, R. (Ed.): Pleistocene and Holocene hunter-gatherers in Iberia and the Gibraltar Strait: the current archaeological record. Universidad de Burgos / Fundación Atapuerca. Burgos, 534-560.
13 Cáceres I, Lozano M, Saladié P (2007) Evidence for bronze age cannibalism in El Mirador Cave (Sierra de Atapuerca, Burgos, Spain). Am J Phys Anthropol 133, 899–917.
14 Gómez-Sánchez D et al. (2014). Mitochondrial DNA from El Mirador cave (Atapuerca, Spain) reveals the heterogeneity of Chalcolithic populations. PLoS One 9, e105105.
15 Brandt G, et. Al (2013). Ancient DNA reveals key stages in the formation of central European mitochondrial genetic diversity. Science 342, 257-261.
16 Haak W et al. (2015) Massive migration from the steppe was a source for Indo-European languages in Europe. Nature 522, 207-11
17 Fritsch B, Claßen E, Müller U, Dresely V (2011) Die linienbandkeramischen Gräberfelder von Derenburg „Meerenstieg II“ und Halberstadt „Sonntagsfeld“, Lkr. Harz. Jahresschr. Mitteldt. Vorgesch. 92, 25-229.
WWW.NATURE.COM/NATURE | 14
SUPPLEMENTARY INFORMATIONRESEARCHdoi:10.1038/nature
18 Leinthaler, B., Bogen, C. & Döhle, H.-J. in Archäologie auf der Überholspur. Ausgrabungen an der A38 Vol. 5 Archäologie in Sachsen-Anhalt, Sonderband (eds V. Dresely & H. Meller) 59-82 (Landesamt für Archäologie Sachsen-Anhalt, Halle (Saale), 2006).
19 Koch, F. Die Glockenbecher- und Aunjetitzer Kultur zwischen Benzingerode und Heimburg - Befunde und Funde der Ausgrabungen an der B 6n. Jahresschrift fuer mitteldeutsche Vorgeschichte 93, 187-290 (2009)
20 Autze, T. in Quer-Schnitt. Ausgrabungen an der B 6n. Benzingerode-Heimburg Vol. 2 Archäologie in Sachsen-Anhalt (eds V. Dresely & H. Meller) 39-51 (Landesamt für Archäologie Sachsen-Anhalt, Halle (Saale), 2005).
21 Dalidowski, X. in Archäologie XXL. Archäologie an der B 6n im Landkreis Quedlinburg Vol. 4 (eds V. Dresely & H. Meller) 116-120 (Landesamt für Archäologie Sachsen-Anhalt, Halle (Saale), 2006).
22 Der Sarkissian, C. et al. Ancient DNA Reveals Prehistoric Gene-Flow From Siberia in the Complex Human Population History of North East Europe. PLoS Genetics 9, e1003296 (2013).
23 Anthony, D. W. (2007) The Horse the Wheel and Language. Princeton Univ. Press, Princeton; Agapov, S.A., I.B. Vasiliev, and V.I. Pestrikova (1990) Khvalynskii Eneoliticheskii Mogil’nik, Saratovskogo Universiteta, Saratov.
24 Vasiliev, I.B., P.F. Kuznetsov, and A.P. Semenova (1994) Potapovskii Kurgannyi Mogil’nik Indoiranskikh Plemen na Volge, Samarskii Universitet, Samara.
WWW.NATURE.COM/NATURE | 15
SUPPLEMENTARY INFORMATIONRESEARCHdoi:10.1038/nature
Supplementary Information section 2 Population interactions between Anatolia, mainland Europe, and the Eurasian steppe
Substantial progress has been made in the study of ancient European population history due to the ability to obtain genome-wide data from ancient skeletons1-15. The most recent synthesis of European prehistory 8,000-3,000 years ago5 presents the following reconstruction.
Before the advent of farming, Europe was populated by at least three different groups of hunter-gatherers. Western European hunter-gatherers7 (WHG) were widely distributed in Luxembourg7, Iberia8,11, and Hungary3. Eastern European hunter-gatherers (EHG) lived in far eastern Europe (Russia), including both the steppe (Samara region) and Karelia5. Scandinavian hunter-gatherers (SHG) from Sweden5,7,14 can be modeled as a mixture of WHG and EHG5 and persisted in Scandinavia until after ~5,000 years ago14,15. EHG are distinguished by a greater affinity than either WHG or SHG5 to Native Americans and to the ~24,000-year old Mal’ta (MA1) individual from Siberia10, making them a proximate source for the “Ancient North Eurasian” ancestry present in subsequent Europeans5,7,16,17. All European hunter-gatherers were outside the range of genetic variation in present-day Europeans5,7,8,11,14,15, but are genetically closest to present-day northern Europeans.
Both the Tyrolean Iceman6 and a Funnel Beaker individual from Sweden15 (both ~5,000 years old) were at the southern edge of present-day European genetic variation, resembling living Sardinians, rather than the present day populations of the Alps or Scandinavia. The Stuttgart female7 (~7,500 years ago) was an early European farmer (EEF) from the Linearbandkeramik (LBK) culture of central Europe and shared this affinity to Sardinians, documenting a relatively homogeneous population of early farmers since the Early Neolithic. The EEF traced part of their ancestry to the Near East but there is substantial uncertainty about the proportion due to a lack of an appropriate reference population7. Genome-wide data of Epicardial individuals from Spain5 proved that EEF in both Iberia and central Europe belonged to a common ancestral population, with the implication that they were descended from a common source prior to setting along different paths (Danubian and Mediterranean) into Europe. This finding was further confirmed by the analysis of a Cardial individual from Mediterranean Spain9.
During the Middle Neolithic period, European farmers in both central Europe and Iberia manifested a “resurgence” of WHG ancestry relative to their Early Neolithic predecessors5. The evidence of resurgence of WHG ancestry could reflect a history in which pockets of populations with substantial hunter-gatherer genetic heritage persisted across Europe long after the advent of farming18 and then mixed with local farmers in many locations. Alternatively, the resurgence could reflect large-scale population turnover within Europe, whereby at least one population that had a higher proportion of WHG ancestry than many preceding farmer populations, spread and replaced earlier groups.
Unlike Europeans from the Middle Neolithic period and earlier, present-day Europeans cannot be modeled as two-way mixtures of European hunter-gatherers and EEF in any proportions, but instead have at least three sources of ancestry7. The third source is related to the MA1 individual from Siberia. This ancestry was conveyed via the EHG and the later Yamnaya steppe pastoralist populations of ~5,000 years ago5. It is estimated that steppe
WWW.NATURE.COM/NATURE | 16
SUPPLEMENTARY INFORMATIONRESEARCHdoi:10.1038/nature

ancestry accounts for ~3/4 of the ancestry of early Corded Ware people of the Late Neolithic period ~4,500 years ago5 and a substantial portion of ancestry of other Late Neolithic/Bronze Age groups of central Europe (~4,500-3,000 years ago) and present-day Europeans throughout Europe, especially in the north5. By contrast, in the eastern expansion of steppe groups to the Altai, represented by the Afanasievo culture1, there seems to have been no admixture with local populations. The later Sintashta and Andronovo populations were descended from the earlier steppe populations, but despite living far to the east of the Yamnaya from Kalmykia1 and Samara5, they had an affinity to more western populations from central and northern Europe like the Corded Ware and associated cultures1. Here we co-analyze 147 previously unreported samples, with 83 samples reported for the first time here that span six archaeological cultures with no published ancient DNA data, to address open questions about the population history of Europe, the steppe, and Anatolia19. The Anatolian Neolithic is a likely source of the European Neolithic Our population sample from the Neolithic of Northwestern Anatolia (Fig. 1, Extended Data Fig. 2) has a clear affinity to early European farmers. However, EEF are shifted slightly towards the direction of the WHG in the PCA (Fig. 1) and share more alleles with them than do the Anatolian Neolithic samples (Extended Data Table 3). To quantify admixture, we used the method described in supplementary information section 9 of Ref. 5, which fits the model:
!! !"#$!!!!!!!!! ! !!!
!!!!! !"#! !!!!!!!!!
The Test population is modeled as an N-way mixture of !"#! populations in proportions !!, using f4-statistics that relate the Test and !"#! populations to a triple of outgroups !!!!!!!!.
For m outgroups, there are ! ! ! !! equations of the above form and the proportions !! are
estimated by least squares under the constraint that they sum up to 1 and are in [0, 1]. We use a set of 15 world outgroups5,7: “World Foci 15” set of outgroups: Ami, Biaka, Bougainville, Chukchi, Eskimo, Han, Ju_hoan_North, Karitiana, Kharia, Mbuti, Onge, Papuan, She, Ulchi, Yoruba To enhance this set’s ability to differentiate between reference populations, we can add to it populations that are differentially related to them. For example, when we study admixture in LBK_EN between Anatolia_Neolithic and WHG, we can add EHG as an additional outgroup, as f4(WHG, Anatolia_Neolithic; EHG, Mbuti)=!0.00823 (Z=22.2), so allele sharing with EHG helps distinguish between WHG and Anatolia_Neolithic as sources of ancestry. Extended Data Fig. 3C shows that Early Neolithic groups from Europe can be modeled as predominantly of Anatolia_Neolithic ancestry with only 7-11% WHG ancestry. This confirms the visual impression from the PCA (Fig. 1) and ADMIXTURE analysis (Extended Data Fig. 2) of the close relationship between Early Neolithic Europe and Neolithic Anatolia. The relationship is also supported by the low FST=0.005±0.00046 (Supplementary Data Table 2) between LBK_EN and Anatolia_Neolithic and 0.006±0.00054 between Hungary_EN and Anatolia_Neolithic. A direct link between Neolithic Europe and Anatolia is furnished by the fact that around half of the Y-chromosomes of Anatolia_Neolithic belong to haplogroup G2a
WWW.NATURE.COM/NATURE | 17
SUPPLEMENTARY INFORMATIONRESEARCHdoi:10.1038/nature

typical of ancient EEF samples5,20, and by the occurrence of mtDNA haplogroup N1a which is typical of EEF21,22 in Neolithic Anatolia (Supplementary Data Table 1). Our results add to the evidence in favor of the hypothesis that the Anatolian Neolithic was the source of the European Neolithic, but we add two notes of caution. First, the fact that our samples are from northwestern Anatolia should not be taken to imply that the Neolithic must have entered Europe from that direction: it simply places a plausible ancestor population at the doorstep of Europe and confirms the hypothesis that the genetic similarity between central European and Iberian farmers could be explained by such a common ancestor. Second, we do not know the geographical extent of people with this ancestry within Anatolia itself and across the Near East. If the population of which the Anatolian Neolithic was a part was sufficiently widespread this ancestry could have entered Europe from a different geographic route. To understand the geographic spread and deeper origin of the Anatolian farmers, it will be necessary to obtain ancient genomes from multiple locations within the Near East. Lack of steppe ancestry in the Iberian Chalcolithic Ancient North Eurasian ancestry is ubiquitous across present-day Europe5,7 but was absent in Early and Middle Neolithic Europe5, raising the question of when it spread there. When we add Yamnaya_Samara as a third ancestral population there is no improvement in fit for the Iberia_Chalcolithic population (Extended Data Fig. 3B), and this population can be modeled as a mixture of ~77%/23% Anatolia_Neolithic/WHG (Extended Data Fig. 3C). The Iberian Chalcolithic did not have more WHG ancestry than the earlier Middle Neolithic population, as the statistic f4(Iberia_MN, Iberia_Chalcolithic; WHG, Chimp) is not significantly different from zero (Extended Data Table 3). A recent analysis of a different Iberian Chalcolithic population also suggests that it had more hunter-gatherer ancestry than the earlier European farmers4. The Iberian Chalcolithic population lacks steppe ancestry, but Late Neolithic central and northern Europeans have substantial such ancestry (Extended Data Fig. 3E) suggesting that the spread of ANE/steppe ancestry did not occur simultaneously across Europe. All present-day Europeans have less steppe ancestry than the Corded Ware5, suggesting that this ancestry was diluted as the earliest descendants of the steppe migrants admixed with local populations. However, the statistic f4(Basque, Iberia_Chalcolithic; Yamnaya_Samara,Chimp)=0.00168 is significantly positive (Z=8.1), as is the statistic f4(Spanish, Iberia_Chalcolithic; Yamnaya_Samara, Chimp)=!0.00092 (Z=4.6). This indicates that steppe ancestry occurs in present-day southwestern European populations, and that even the Basques cannot be considered as mixtures of early farmers and hunter-gatherers without it4. Transformations of steppe populations Our paper presents a complete transect of the Samara region beginning with the Samara EHG hunter-gatherer (~5,600BCE)5 and ending with the Srubnaya culture (~1,850-1,200 BCE) and a singleton “Scythian” Iron Age individual (~300BCE). In eastern Europe outside the steppe, a new individual from the Karelia region resembles the two previously published EHG individuals5 autosomally, but surprisingly belongs to Y-chromosome haplogroup J usually associated with Near Eastern populations (Supplementary Data Table 1).
WWW.NATURE.COM/NATURE | 18
SUPPLEMENTARY INFORMATIONRESEARCHdoi:10.1038/nature
In a previous study5 it was shown that Yamnaya populations from the Samara region were a mixture of the EHG and a population of Near Eastern ancestry for whom present-day Armenians could be a surrogate. The Samara_Eneolithic from Khvalynsk II (~5,200-4,000BCE) predates the Yamnaya by at least 1,000 years but had already begun admixing with this population, although the individuals of this population appear to be heterogeneous (Fig. 1) between EHG and Yamnaya. Taken as a whole, we estimate that they have ~74% EHG and ~26% Armenian related ancestry. The three Eneolithic individuals belong to Y-chromosome haplogroups R1a, R1b, and Q1a; the last of these three is associated with present-day Siberian populations and Native Americans, while R1a and R1b were previously found in the two EHG hunter-gatherers5. These results suggest a great degree of continuity with the EHG for the Eneolithic population. The Yamnaya samples from Samara5 and Kalmykia1 and the Afanasievo1 population from the Altai form a tight cluster (Fig. 1, Extended Data Fig. 2). Our study includes new data from the later Middle Bronze Age population of the Poltavka culture (~2,900-2,200BCE), which cluster with the Yamnaya and Afanasievo. The Poltavka also possess R1b Y-chromosomes (Supplementary Data Table 1), continuing the dominant Y-chromosome type found in the Yamnaya1,5. This group of populations have even less EHG ancestry than the Eneolithic population (Extended Data Table 3), estimated to be ~42-52% (Extended Data Fig. 3D). Admixture into steppe populations continued with the Potapovka culture (~2,500-1,900BCE) and the Srubnaya culture (~1,850-1,200 BCE). Admixture in these later steppe populations is from a different source than in the earlier ones. For the Yamnaya/Afanasievo/Poltavka Steppe group, the statistics f4(EHG, Steppe; Armenian, LBK_EN) are negative, and the statistics f4(Steppe, Srubnaya; Armenian, LBK_EN) are positive, suggesting a different source of population change during the EHG!Steppe transition and the later Steppe!Srubnaya transition. The Steppe group had ancestry related to Armenians and the Srubnaya had an additional source related to European farmers. This is also clear from the PCA where the Srubnaya differ from the Steppe group in the direction of European farmers, and in the ADMIXTURE analysis (Extended Data Fig. 2), which shows them to have an EEF/Anatolia Neolithic-related component of ancestry not present in the Steppe group. Clearer evidence of this discontinuity is seen when we model different steppe populations as mixtures of Armenians and EHG (Extended Data Fig. 3A), and add Anatolia_Neolithic as a third ancestral population: this has no effect in fit for the earlier populations, but significantly improves fit for the Potapovka, Srubnaya, and eastern Sintashta and Andronovo populations. A discontinuity between earlier and later steppe populations is also suggested by the shift from an R1b Y-chromosome gene pool into an R1a-dominated one in the Srubnaya (Supplementary Data Table 1). We caution that this does not mean that new populations migrated into the steppe as R1a was also detected in Eneolithic Samara and an outlier Poltavka individual (Supplementary Data Table 1); it is possible that R1a males continued to abide in the Samara region but were not included in the rich burials associated with the Yamnaya and Poltavka elites in the intervening period. It is unclear how the Srubnaya acquired farmer ancestry. One possibility is that contact between early farmer and steppe populations produced populations of mixed ancestry that migrated eastward to the Samara district and further east to form the Sintashta/Andronovo populations. A different possibility suggested in Ref. 1 is that the Corded Ware population of central/northern Europe migrated into the steppe. Our new data document the existence of
WWW.NATURE.COM/NATURE | 19
SUPPLEMENTARY INFORMATIONRESEARCHdoi:10.1038/nature

farmer-admixed steppe populations in the European steppe and provide a plausible source for the more eastward migrations of such populations. Further evidence for a connection between the Srubnaya and populations of central/south Asia—which is absent in ancient central Europeans including people of the Corded Ware culture and is nearly absent in present-day Europeans23—is provided by the occurrence in four Srubnaya and one Poltavka males of haplogroup R1a-Z93 which is common in present-day central/south Asians and Bronze Age people from the Altai24 (Supplementary Data Table 1). This represents a direct link between the European steppe and central/south Asia, an intriguing observation that may be related to the spread of Indo-European languages in that direction. Our results on European steppe populations highlight the complexity of their interactions with surrounding populations. At the earliest period, gene flow from a population related to Armenians, presumably from the south, diluted their EHG ancestry and created the mix of ancestry of the Yamnaya/Afanasievo/Poltavka group. Later, gene flow from a population related to Anatolian and European farmers further diluted their EHG ancestry to create the Srubnaya/Sintashta/Andronovo group. This latter group resembled Late Neolithic/Bronze Age populations from mainland Europe (Fig. 1), and like them could be derived from both the farmers of Europe and Anatolia and the earlier steppe populations (Extended Data Fig. 3E). The population history of mainland Europe and the steppe could be summarized as: (i) the dilution of hunter-gatherer ancestry by migrations from different parts of the Near East, (ii) the formation of populations of mixed hunter-gatherer/Near Eastern ancestry (Middle Neolithic/Chalcolithic in mainland Europe, and Eneolithic/Yamnaya/Poltavka on the steppe), and (iii) the migration of steppe populations into Europe during the Late Neolithic (~2,500BCE) and of farmer populations into the steppe, leading to the formation of an array of populations of mixed ancestry encompassing both mainland Europe and the Eurasian steppe. Future research must elucidate how present-day populations emerged from the populations of the Bronze Age, and how populations from mainland Europe, the Eurasian steppe, and Anatolia influenced and were influenced by those from the Near East and Central/South Asia.
References 1. Allentoft, M. E. et al. Population genomics of Bronze Age Eurasia. Nature 522, 167-172,
(2015). 2. Fu, Q. et al. An early modern human from Romania with a recent Neanderthal ancestor.
Nature 524, 216-219, (2015). 3. Gamba, C. et al. Genome flux and stasis in a five millennium transect of European prehistory.
Nat. Commun. 5, 5257 (2014). 4. Günther, T. et al. Ancient genomes link early farmers from Atapuerca in Spain to modern-day
Basques. Proceedings of the National Academy of Sciences, (2015). 5. Haak, W. et al. Massive migration from the steppe was a source for Indo-European languages
in Europe. Nature 522, 207-211, (2015). 6. Keller, A. et al. New insights into the Tyrolean Iceman's origin and phenotype as inferred by
whole-genome sequencing. Nat. Commun. 3, 698, (2012). 7. Lazaridis, I. et al. Ancient human genomes suggest three ancestral populations for present-
day Europeans. Nature 513, 409-413, (2014).
WWW.NATURE.COM/NATURE | 20
SUPPLEMENTARY INFORMATIONRESEARCHdoi:10.1038/nature

8. Olalde, I. et al. Derived immune and ancestral pigmentation alleles in a 7,000-year-oldMesolithic European. Nature 507, 225-228, (2014).
9. Olalde, I. et al. A common genetic origin for early farmers from Mediterranean Cardial andCentral European LBK cultures. Mol. Biol. Evol., (2015).
10. Raghavan, M. et al. Upper Palaeolithic Siberian genome reveals dual ancestry of NativeAmericans. Nature 505, 87-91, (2014).
11. Sánchez-Quinto, F. et al. Genomic Affinities of Two 7,000-Year-Old Iberian Hunter-Gatherers. Curr. Biol. 22, 1494-1499, (2012).
12. Seguin-Orlando, A. et al. Genomic structure in Europeans dating back at least 36,200 years.Science 346, 1113-1118, (2014).
13. Sikora, M. et al. Population Genomic Analysis of Ancient and Modern Genomes Yields NewInsights into the Genetic Ancestry of the Tyrolean Iceman and the Genetic Structure ofEurope. PLoS Genet. 10, e1004353, (2014).
14. Skoglund, P. et al. Genomic Diversity and Admixture Differs for Stone-Age ScandinavianForagers and Farmers. Science 344, 747-750, (2014).
15. Skoglund, P. et al. Origins and genetic legacy of Neolithic farmers and hunter-gatherers inEurope. Science 336, 466-469, (2012).
16. Lipson, M. et al. Efficient moment-based inference of admixture parameters and sources ofgene flow. Mol. Biol. Evol. 30, 1788-1802, (2013).
17. Patterson, N. et al. Ancient admixture in human history. Genetics 192, 1065-1093, (2012).18. Bollongino, R. et al. 2000 Years of Parallel Societies in Stone Age Central Europe. Science
342, 479-481, (2013).19. Bellwood, P. First Farmers: The Origins of Agricultural Societies. (Wiley-Blackwell, 2004).20. Haak, W. et al. Ancient DNA from European early Neolithic farmers reveals their Near
Eastern affinities. PLoS Biol. 8, e1000536, (2010).21. Brandt, G. et al. Ancient DNA reveals key stages in the formation of central European
mitochondrial genetic diversity. Science 342, 257-261, (2013).22. Szécsényi-Nagy, A. et al. Tracing the genetic origin of Europe's first farmers reveals insights
into their social organization. Proceedings of the Royal Society of London B: BiologicalSciences 282, (2015).
23. Underhill, P. A. et al. The phylogenetic and geographic structure of Y-chromosomehaplogroup R1a. Eur. J. Hum. Genet. 23, 124–131, (2014).
24. Hollard, C. et al. Strong genetic admixture in the Altai at the Middle Bronze Age revealed byuniparental and ancestry informative markers. Forensic Science International: Genetics 12,199-207, (2014).
WWW.NATURE.COM/NATURE | 21
SUPPLEMENTARY INFORMATIONRESEARCHdoi:10.1038/nature