Embed Size (px)
Citation preview

Genome Sequencer 20 System First to the Finish
www.roche-applied-science.com

2 |
____________________________Technology ______________________________________4-5
____________________________Process Steps __________________________________8-11
DNA Library Preparation 8
emPCR Amplification 9
Sequencing-by-Synthesis 10-11
____________________________The Genome Sequencer 20 System ________________6-7
____________________________Software ______________________________________12-13
____________________________Applications___________________________________14-36
Whole Genome Sequencing 14-19
— Resequencing 14-15
— De Novo Sequencing 16-17
— Paired End Assembly 18-19
Transcriptome and Gene Regulation Studies 20-27
Amplicon Analysis 28-35
____________________________Ordering Information ___________________________37-39

| 3
The Genome Sequencer 20 System uses a revolutionary technology.■ Accurately decipher more than 20 million bases per 5.5-hour instrument run.■ Eliminate cloning and colony picking.■ Generate complete libraries with no cloning bias.
Perform innovative applications that are not possible with other techniques.
Whole Genome Sequencing (shotgun)■ De novo sequence or resequence microbial genomes
and BACs — in days, not weeks or months.
■ Prepare a Paired End library to order and orient the contigs from your de novo sequencing project.
Transcriptome/Gene Regulation Studies■ Perform gene identification and quantification
studies based on high-throughput sequencing of cDNA fragments (short tags, ESTs, miRNA).
■ Identify transcription factor binding sites (ChIP libraries).
■ Study DNA methylation patterns.
Amplicon Analysis■ Discover somatic mutations in complex
samples for cancer research.
■ Accelerate SNP discovery.
The Genome Sequencer 20 System The newest revolution in sequencing today

4 |
Technology
Technology – Workflow From DNA to bioinformatics
From library preparation to bioinformatics – experience this high-speed, complete solution forefficient high-throughput sequencing.
The Genome Sequencer 20 System, developed using the novel 454 technology,1 eliminates the need for large-scale robotics for traditional samplepreparation. Not only is clonal bias removed,but the need for colony picking and microplatehandling is reduced to a simple preparation step.
Through parallelization, state-of-the art image processing, and unique data analysis, tens of
GS DNA Library Preparation Kit Tissue Lyser
Appropriate GS emPCR Kit
DNA Library Preparation and Titration ■ Fragmentation (needed depending on the starting material) ■ Prepare sstDNA library with adaptors ■ One library provides enough DNA for thousands of sequence runs
■ Determine amount of sstDNA for the emPCR (titration)
emPCR ■ Emulsification ■ Clonal amplification of sstDNA on beads ■ Parallel amplification of the entire library in one PCR reaction ■ sstDNA ready to sequence
■ Ditag libraries■ ChIP fragments (low molecular weight DNA)
■ PCR products
■ Genomic DNA■ cDNA fragments■ BAC libraries
megabases of sequence data are now produced inhours from a single instrument run.
Finish your research project in record time withfast, accurate, and cost-effective high-throughputsequencing – a dramatic difference compared to the traditional Sanger technology (Figure 1).
Benefit from the versatility of this technology tosequence diverse sample types, such as genomicDNA, cDNA, BAC libraries, or PCR products(Figure 2), supporting multiple applications fromwhole genome sequencing to amplicon and transcriptome analysis.

* Assumes high-throughput robotics and several technicians are in place. † For example, 1 run (1 run/5.5 hours) for a 2-million-base genome ** For example, approximately 150 runs (1 run/2 hours) for a 2-million-base at 10x coverage.
genome at 6x coverage.
Figure 1: Comparison of Sanger technology with 454 technology for whole genome sequencing a two-million-base bacterium.
| 5
Technology
Sanger technology employs
■ shotgun fragmentation of the genome
■ cloning of the fragments into bacteria ■ colony picking, microplate handling ■ DNA purification from the clones
■ sequencing by dideoxy chain
termination ■ electrophoresis
■ whole genome mapping or assembly
454 technology employs
■ shotgun fragmentation of the genome ■ adaptor ligation on DNA fragments ■ titration/quantification
■ clonal amplification of DNA fragments
on beads (emPCR) ■ DNA-bead enrichment
■ sequencing-by-synthesis on a
PicoTiterPlate device ■ image and signal processing
■ whole genome mapping or assembly
Comparison of high-throughput Sanger technology to the 454 technology used by theGenome Sequencer 20 System, in whole genome sequencing
7 days*W
eeks**
2.5 days1 day
†
De novo sequencing
Resequencing
PicoTiterPlate device Flowgram
Genome Sequencer 20 Instrument
Sequencing ■ Loading PicoTiterPlate device ■ One bead per well
■ Sequencing-by-synthesis ■ Light signal proportional to incorporated nucleotide is captured by CCD camera ■ Image and signal processing to determine sequence and quality score
DNA Capture Bead containing millions of copies of a single clonally amplified fragment
Sulfurylase
Luciferase
APS
Signal image
PPI
ATP
Polymerase
Annealedprimer
Light + Oxy Luciferin
Bioinformatics Tools
Luciferin
Amplicon Sequencing
Publicly available tools
Figure 2: Genome Sequencer 20 System Workflow Overview

6 |
The Sequencing Technology Enhance your sequencing process — from genome to sequence in record time
Generate tens of millions of bases per run with the straightforward workflow of the GenomeSequencer 20 System (Figures 3-6).
DNA Library PreparationSample preparation is dependent on the type ofstarting material used. The preparation processcomprises a series of enzymatic steps to producesingle-stranded template DNA (sstDNA) incorpo-rating primer and binding adaptors. For example,genomic DNA (gDNA) is fractionated into smallerfragments (300-800 base pairs) that are subsequentlypolished (blunted). Short Adaptors (A and B) arethen ligated onto the ends of the fragments. Theseadaptors provide priming sequences for bothamplification (emPCR) and sequencing of the
ProcessSteps
DNA Library Preparation and Titration
4.5 hours 10.5 hours
emPCR
8 hours
Sequencing
5.5 hours
gDNA sstDNA library
■ Genome fragmented by nebulization■ No cloning; no colony picking ■ sstDNA library created with adaptors. The adaptors are used as primers, and for binding to beads.■ A/B fragments selected using streptavidin-biotin purification
Figure 3: DNA library preparation with the Genome Sequencer 20 System.
sample-library fragments, and contain a streptavidinbinding site for sample purification. Low molecularweight DNA is used without fragmentation andsample preparation begins with adaptor ligation.The A and B adaptors can also be added duringPCR by using the appropriate primers (provided inGS emPCR Kit II (Amplicon A, Paired End) and GS emPCR Kit III (Amplicon B). The sstDNAlibrary produced at the end of this preparation step is assessed for its quality, and the optimalamount (DNA copies per bead) needed for emPCRis determined by a titration run.
| 7
ProcessSteps
emPCR Amplification The sstDNA library is immobilized onto speciallydesigned DNA Capture Beads. Each bead carries asingle sstDNA library fragment. The bead-boundlibrary is emulsified with amplification reagents in a water-in-oil mixture. Each bead is separately
DNA Library Preparation and Titration
4.5 hours 10.5 hours
emPCR
8 hours
Sequencing
5.5 hours
sstDNA library Clonally-amplified sstDNA attached to bead (millions of copies per bead)
Anneal sstDNA to an excess of DNA Capture Beads
Emulsify beads and PCR reagents in water-in-oil microreactors
Clonal amplification occurs inside microreactors
Break microreactors, enrich for DNA-positive beads
Figure 4: Overview of emulsion-based clonal amplification (emPCR) with the Genome Sequencer 20 System.
captured within its own microreactor for PCRamplification. Amplification is performed in bulk,resulting in bead-immobilized, clonally amplifiedDNA fragments that are specific to each bead.

8 |
ProcessSteps
DNA Library Preparation and Titration
4.5 hours 10.5 hours
emPCR
8 hours
Sequencing
5.5 hours
Amplified sstDNA library beads Quality reads
■ Well diameter: average of 44 µm
■ A single clonally amplified sstDNA
bead is deposited per well
■ 200,000 reads obtained in parallel
on large-format PicoTiterPlate device
Figure 5: Deposition of DNA beads into the PicoTiterPlate device.
Sequencing-by-Synthesis Sequencing starts with the preparation of a PicoTiterPlate device; during this step, a combination of beads, sequencing enzymes,and an sstDNA library is deposited into the wells of the device. The bead-deposition process maximizes the number of wells that contain an individual sstDNA library bead.
The loaded PicoTiterPlate device is placed into the Genome Sequencer 20 Instrument. The fluidics subsystem flows sequencing reagents(containing buffers and nucleotides) across the wells of the plate. Each sequencing cycle consists of flowing individual nucleotides in afixed order (TACG) across the PicoTiterPlatedevice. During the nucleotide flow, each of thehundreds of thousands of beads with millions of copies of DNA is sequenced in parallel.
If a nucleotide complementary to the templatestrand is flowed into a well, the polymerase extends the existing DNA strand by addingnucleotide(s). Addition of one (or more)nucleotide(s) results in a reaction that generates a chemiluminescent signal that is recorded by the CCD camera in the Genome Sequencer 20Instrument. The signal strength is proportional to the number of nucleotides incorporated in a single nucleotide flow.
The Sequencing Technology Enhance your sequencing process — from genome to sequence in record time

| 9
ProcessSteps
DNA Library Preparation and Titration
4.5 hours 10.5 hours
emPCR
8 hours
Sequencing
5.5 hours
■ Bases (TACG) are
sequentially flowed
(42 times)
■ Chemiluminescent
signal generation
■ Signal processing
to determine base
sequence and
quality score
Amplified sstDNA library beads Quality reads
DNA Capture Bead containing millions of copies of a single clonally amplified fragment
Sulfurylase
Luciferase
APS
Signal image
PPI
ATP
Polymerase
Annealedprimer
Light + Oxy Luciferin
Luciferin
Figure 6: Sequencing reaction of the Genome Sequencer 20 System.

10 |
GenomeSequencer20 System
The Genome Sequencer 20 Instrument Perform ultra-high-throughput DNA sequencing
The Genome Sequencer 20 System revolutionizesDNA sequencing, delivering sequence data in amassively parallel fashion.
The Genome Sequencer 20 System includes:
■ Instrument and accessories
■ Reagents and consumables for library construction, amplification, and sequencing
■ Analysis software for resequencing, de novoassembly, and amplicon sequencing.
The instrument (Figure 7) is the centerpiece of theGenome Sequencer 20 System. It comprises bothoptics and fluidics subsystems, which are controlledby a computer subsystem.
The fluidics subsystem consists of a reagents cassette, a sipper manifold, pumps, valves, anddebubblers. It ensures accurate reagent dispensingand flows the sequencing reagents across the wellsof the PicoTiterPlate device.
The optics subsystem includes a CCD camera,which captures the light signal resulting from thesequencing reaction (Figure 8).
Figure 7: Open view of the Genome Sequencer 20Instrument.
Instrument space requirement: 30 in (77 cm) Wide x 36 in(92 cm) Deep x 69 in (176 cm) High (cart and instrument).
Optics—— Subsystem————————————
Fluidics————————-—Subsystem ——
Sipper ————————— Manifold
Reagents ———————————— Cassette
Pumps, Valves, and
——————————————– Debubblers
——————————— Keyboardand Mouse
in drawer
—————
Computer Subsystem
—————
Status Indicator ———————
CCD Camera Face ———————————
PicoTiter- ————— Plate Cartridge
Figure 8: Expanded view of the Genome Sequencer 20Instrument components. Arrows represent reagent flow.
PicoTiterPlate Device
Position of PicoTiterPlate Device in the Instrument
Reagents Cassette
CCD CameraSipper
Manifold
Peristaltic Pump

| 11
GenomeSequencer20 System
PicoTiterPlate Devices and Gaskets
Sequence more than 20 million bases in a single runwith the specially designed PicoTiterPlate device(Figure 9). Choose from two different plate sizesand five different gaskets to meet your specificsequencing throughput needs (Table 1).
■ The PicoTiterPlate device is created from fiberoptic bundles that are etched to produceindividual wells in picoliter format.
■ Each well is only able to accept a single DNA bead.
■ Signals generated by reactions in the wells arecaptured by the CCD camera.
■ Gaskets are used to divide the PicoTiterPlatedevice into separate regions and create loadingareas for different throughput needs.
Figure 9: PicoTiterPlate device and accompanyingaccessories.
Close-up view of a PicoTiterPlate
device.
Available formats of
PicoTiterPlatedevice gaskets.
Table 1: Sequencing throughput with various combinations of PicoTiterPlate devices and gaskets. * minimum achievable throughput Mbp = million base pairs
Loading region size
PicoTiterPlate device size
Number of regionsper PicoTiterPlate
deviceRun throughput*
per region
Run throughput per PicoTiterPlate
device
Large: 30 x 60 mm70 x 75 mm 2
10 Mbp20 Mbp
40 x 75 mm 1 10 Mbp
Medium: 14 x 43 mm 70 x 75 mm 4 3.3 Mbp 13 Mbp
Small: 2 x 53 mm70 x 75 mm 16
0.63 Mbp 10 Mbp
40 x 75 mm 8 5 Mbp

12 |
The combination of signal intensity and positionalinformation generated across the PicoTiterPlatedevice allows the Linux-based software to determinethe sequence of hundreds of thousands of individualreactions simultaneously, producing millions ofbases of sequence per hour from a single run(Figure 10).
ImageAcquisition
Run
-tim
e
■ Image capture for every flow (during sequencing run)
■ De novo assembly■ Mapping (resequencing) ■ Data output: FASTA and ace file formats ■ Amplicon analysis
Applications
■ Display of raw images
■ Graphic representations of metrics files
■ Assessment of the general quality of a run, (also for troubleshooting purposes)
■ Evaluation of the results of titration experiments
Pos
t-ru
n ■ Background subtraction■ Normalization■ Identification of wells■ Raw-signal extraction for all active wells (for all images)
■ Signal normalization across wells ■ Filtering by signal quality■ Trimming low-quality and primer sequence ends
ImageProcessing
SignalProcessing
■ Generation of flowgrams and base-called sequences with corresponding quality scores■ Probability that a measured signal corresponds to an ideal model signal (calculation of a Phred-like quality score) ■ Data output: FASTA, SFF file formats
Base-callQuality Score
GS Run Browser Software
Software Benefit from a fully integrated software package
Software
Figure 10: Data processing and analysis output of the Genome Sequencer 20 System.
Flowgrams and Base Calling
A Flowgram is the graphic representation of thesequence of flowgram signals from a single well ofthe PicoTiterPlate device, which will be translatedinto the nucleotide sequence for an individual read.
The signal intensity is proportional to the numberof nucleotides incorporated. The bases of the consensus sequence are called by averaging all flowgram signals of the individual reads.
| 13
Software
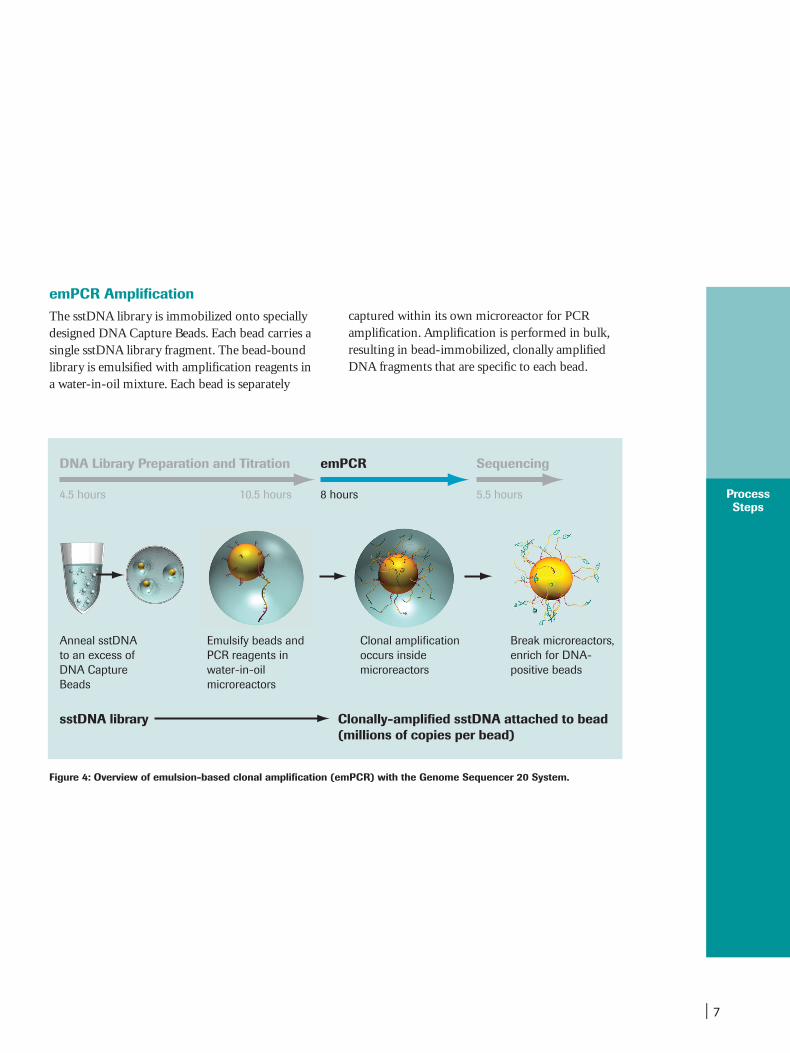
Data Processing and Analysis Output
After the signal is captured by the CCD camera, itundergoes image processing. The data-processingoutput for mapping and assembly includes normalized signals across the wells, flowgrams,and base-called sequences. In addition, a Phred-like quality score is calculated. The data-analysisoutput results in a consensus sequence based on the flowgram information from all wells of the runor a pool of runs, followed by base calling of theconsensus sequence. All raw data is accessible, andthe file formats are compatible with publicly available sequencing analysis tools (Figure 11).
Results Assessment
GS Run Browser software is part of the standardsoftware package provided with the GenomeSequencer 20 Instrument. It is an inter-active appli-cation that allows the user to view the results of aGS 20 sequencing run, and it displays raw imagesand graphic representations of various metrics files.
GS Run Browser software can be used to assess thegeneral quality of a run, and therefore is a usefultool for troubleshooting if problems are observed.The application also facilitates evaluation of theresults of titration experiments. Most of the datagenerated by GS Run Browser software can also beexported to an Excel spreadsheet.
Images
Reference Genome
GS Reference Mapper SoftwareGS De Novo Assembler Software
Reference Genome
Consensus Genome
ConsensusGenerator
Reference Genome
Consensus Genome
MutationDetector
Signal
Contig 1 Contig 2Overlap and ConsensusGenerator
Contig Ordering(Paired End Assembler)
Paired End Reads
Figure 11: Bioinformatics flow process.

Applications Expand your versatility
14 |
Applications
The Genome Sequencer 20 System uses a revolutionary technology, deciphering more than 20 megabases in 5.5 hours on a single instrument.This powerful system enables the following applications:
Whole genome sequencing ■ De novo whole genome shotgun sequencing and
resequencing of microbial genomes and BACclones
■ Organization of contigs into scaffolds by apaired-end assembly approach
Transcriptome and gene regulationstudies■ High-throughput transcriptome analysis based
on short tags, ESTs, ChIP, or GIS-PET sequencing,or the genome-wide identification of miRNAsequences
■ Investigation of gene regulation by studying DNAmethylation patterns
Amplicon analysis ■ Ultra-deep sequencing of PCR products
(resequencing for medical research) for
— Identification of somatic mutations in complex cancer samples
— High-confidence SNP discovery on a population level
Whole Genome Mapping (Resequencing)Introduction
An integrated software pipeline performs wholegenome mapping on the Genome Sequencer 20Instrument. This pipeline consists of three modules — GS Reference Mapper software,ConsensusGenerator, and a high-confidenceMutationDetector (Figure 11).
The GS Reference Mapper software allows users tomap individual reads to a reference genome up toone megabase in size. Runs can be combined: forexample, up to 200 million bases can be mapped,yielding up to 20x coverage of a 10-million-basegenome. The GS Reference Mapper software createsan ideal flowgram signal space genome from thereference genome for comparison with the reads.By operating in flowgram signal space, the mappingprocess is able to utilize the volume of informationcontained in the flowgram signals (such as theinformation inherent in the negative flows as well aspositive flows) that is partially lost after base calling(conversion to nucleotide space). After mapping theindividual reads, the ConsensusGenerator programcombines the individual read information to createa higher confidence base call using overlappingreads. The MutationDetector sorts through the consensus base calls to list high-confidence differences from the reference genome.
Resequencing – Applications
— Comparative genomics
• Identify single base mutations
• Identify mutation hotspots and conservedregions
• Identify inserted or deleted genes
• Assess gene correlations or sequence devia-tions with observable traits (e.g., understandthe genetic basis for drug resistance)2

Applications
| 15
• Study virulence prediction based on genesequence variation
• Perform epidemiological analysis
• Understand the genetic difference betweenindustrial producer strains and their corresponding parental strains as the basisfor producer strain development
• Perform metagenomic analysis based onshotgun sequencing of environmental DNAand subsequent mapping against knownmicrobial genome sequences3, 4, 5
• Sequence ancient DNA (e.g., shotgunsequencing of the woolly mammothgenome)6
Example: Resequencing of a variety of bacterial genomes
Resequencing results obtained with the GenomeSequencer 20 System across a variety of bacterialgenomes are presented in Table 2. After whole
genome sequencing of bacterial strains up to an x-fold coverage, consensus contigs were generatedbased on mapping of raw reads against the corresponding reference sequence. As the resultsdemonstrate, the Genome Sequencer 20 Systemachieves a high degree of coverage across thegenomes with a high degree of concordance withthe published genomes. This approach was used,for example, by Johnson & Johnson PharmaceuticalResearch and Development to find point mutationsin multiple bacteria.2 Breaks in the scaffold are the result of incomplete coverage of the genomedue to random chance and repeat regions that arelonger than the raw sequence reads, and thus cannotbe uniquely anchored. The contigs generated by the GS Reference Mapper software are provided instandard file formats and are readily incorporatedinto standard sequence viewers or assembly tools.
M. genitalium B. licheniformis E. coli S. pneumoniae S. coelicolor S. cerevisiae
Genome Size (bases) 580,069 4,222,645 4,639,675 2,160,837 8,667,507 12,070,820
Coverage Depth (x-fold) 20.9 22 23.1 21.6 19.8 21.1
Number of Contigs 8 86 119 116 349 694
Average Contig Size (kb) 72.404 48.54 38.293 17.71 24.468 16.547
Size of Largest Contig (kb) 168.532 256.696 327.137 109.203 160.315 266.004
Total Genomic Coverage (%) 99.86 98.88 98.22 95.95 98.52 95.14
Total Genomic Coverage 100.00 100.00 100.00 100.00 100.00 100.00of Non-Repeat Regions (%)
Total Accuracy of 99.9921 99.9954 99.9964 99.9960 99.9864 99.9439Consensus Sequence (%)
Number of Runs 0.3 2.5 3.0 1.5 6.0 11.0
Table 2: The uniformity of coverage — achieved with the Genome Sequencer 20 System — on a number of bacterialgenomes. The results shown are mapping of reads to a known genome. As Coverage of Non-Repeat Regions demonstrates, theGenome Sequencer 20 System process achieves a high degree of coverage across the genomes. The repeats are excluded fromthe mapping results, as they are not uniquely mapped with 100 bp reads.

16 |
Applications
Whole Genome Sequencing Expand your versatility
De Novo Assembly of Whole Genomes
GS De Novo Assembler software is the new de novoassembly software for use with the GenomeSequencer 20 Instrument. Exploiting the inherentadvantages of the GS 20 Instrument’s performance,the GS De Novo Assembler software operates inflowgram signal space, as opposed to the standardnucleotide space. By operating in flowgram signalspace, GS De Novo Assembler software is able to utilize the abundant information stored in the flowgram signals that is lost after base calling (conversion to nucleotide space).
GS De Novo Assembler software has three mainfunctions: overlap generation, contig layout, andconsensus generation. The overlap generator aligns raw reads in flowgram signal space using aproprietary algorithm. Consensus generation isbased on signal averaging where all aligned flowgram signals at each position are averaged and the final base call is performed on the averagedsignal. The signal averaging allows higher qualityconsensus base calls (Figure 11).
De novo Sequencing – Applications — Unknown microorganisms up to 50 Mb
• Generate an overview of the genome structure
• Study DNA sequence organization,distribution, and information content
• Conduct gene surveys: novelty, locations,and functions
• Compare to other organisms and correlatewith observable traits
— BACs, YACs
• Sequence BAC clones, for example, as thebasis for whole genome sequencing of plantsand animals
— Unknown viruses
— Paired End Assembly
Example: De novo sequencing of a variety ofbacterial genomes
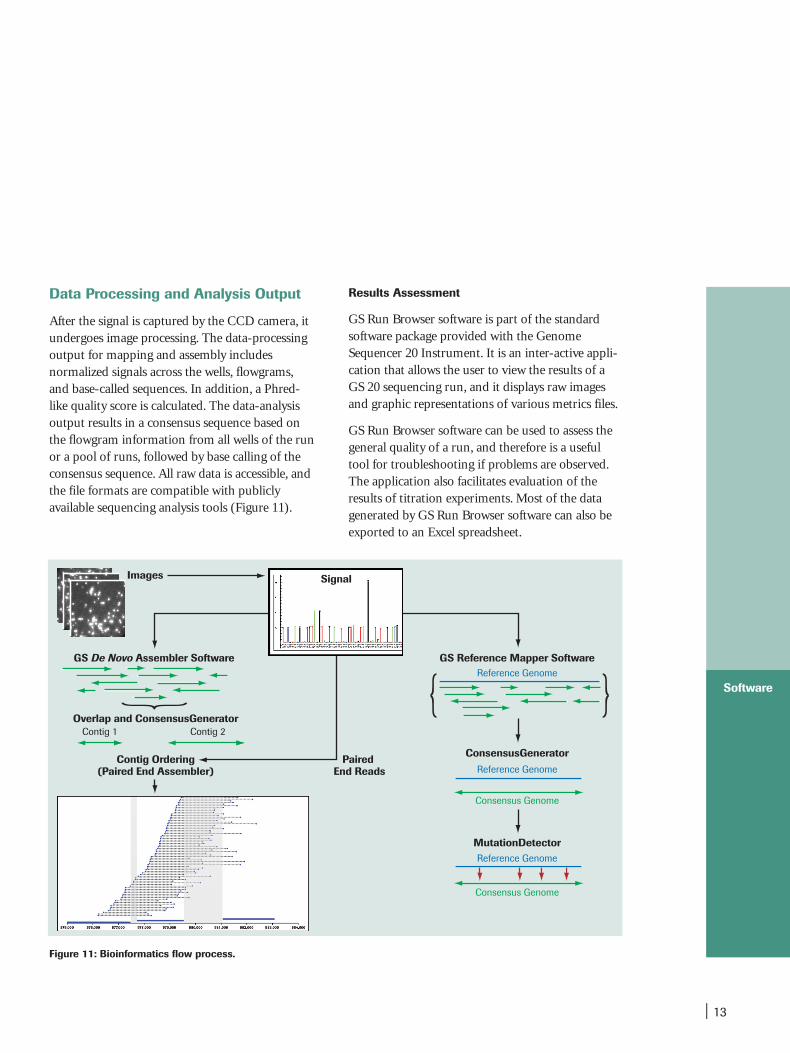
The results for de novo sequencing of a variety ofgenomes are shown in Table 3, page 17. The genome assemblies are nearly as comprehensive as the mapping results shown in Table 2, page 15, with thevast majority of bases in the assemblies correct (as measured by their concordance with the publishedreference genome). As with the mapping results,the breaks in the contigs occur as a result ofrandom chance and at the boundaries of repeats.The contigs generated by the GS De Novo Assemblersoftware are provided in standard file formats andare readily incorporated into standard sequenceviewers or assembly tools.
| 17
Applications
Table 3: The performance of GS De Novo Assembler software, the Genome Sequencer 20 System de novo assembler,for sequencing of several bacterial genomes. The genome sequences from all six bacteria are publicly available in GenBank.
Using the Genome Sequencer 20 System, de novosequencing of more than 100 bacterial artificialchromosomes (BACs) per month is feasible. Thismakes the system a perfect platform for performinglarge-scale BAC sequencing projects within theframework of
• metagenomics projects;
• resequencing portions of eukaryotic genomes;or
• whole genome sequencing based on a BAC-to-BAC approach (e.g., plant genomes) (Table 4).
M. genitalium B. licheniformis E. coli S. pneumoniae S. coelicolor S. cerevisiae
Genome Size (bases) 580,069 4,222,645 4,639,675 2,076,278 8,641,205 12,070,820
Coverage Depth (x-fold) 20.68 21.98 23.5 22.37 20.5 25
Number of Contigs 20 136 139 229 1013 717
Average Contig Size (kb) 28.008 30.657 32.603 8.802 8.383 15.817
Size of Largest Contig (kb) 154.741 200.162 163.595 59.578 70.534 98.656
Total Genomic Coverage (%) 96.57% 98.63% 97.45% 92.99% 96.96% 92.86%
Total Genomic Coverage 99.42 100.0000 100.0000 100.00 97.9097 100.00of Non-Repeat Regions (%)
Total Accuracy of 99.9940 99.9970 99.9990 99.9950 99.9920 99.9780Consensus Sequence (%)
Number of Runs 0.3 2.5 3 1.5 6 11
Misassemblies 0 2 3 4 36 16
Table 4: Performance of the Genome Sequencer 20 System — de novo sequencing of Brassica napa BACs.
BAC 1 BAC 2 BAC 3 BAC 4
Number of Contigs >500 bp 6 (9) 8 (18) 4 (9) 8 (12)(all contigs)
Total Contig Size (kb) 139.794 119.438 123.051 150.849
Average Contig Size (kb) 23.299 14.929 30.762 18.856
Largest Contig Size (kb) 102.356 35.375 78.305 51.957
Bases >PHRED 40 (%) 99.9 99.9 99.9 99.8
Coverage (%) 29.7 40.2 34.8 20.6
Benefits
■ Prepare a paired-end library to order and orient the contigs from your de novosequencing project.
■ Generate a paired-end DNA library for manysequencing runs.
■ Facilitate finishing of the high-quality draftsequence.
18 |
Applications
Whole Genome Sequencing Expand your versatility
Paired-End Assembly
Facilitate finishing of the high-quality draftsequence
Standard whole genome de novo assembly uses the GS De Novo Assembler software to assemble readsinto contigs. Thereafter, paired-end reads are usedto order and determine the relative positions ofcontigs produced by de novo shotgun sequencingand assembly.
The GS Paired End Adaptor Kit provides reagentsfor the creation of a paired-end library of fragmentsfrom a DNA sample. The generated paired-endreads are DNA fragments that have a 44-mer adaptor sequence in the middle flanked by a 20-mersequence on each side. The two flanking 20-mers are segments of DNA that were originally locatedapproximately 2.5 kb apart in the genome ofinterest (Figure 13). The ordering and orienting of contigs generates scaffolds which provide a high-quality draft sequence of the genome andsimultaneously facilitate finishing of the genome(Figures 12 and 14).
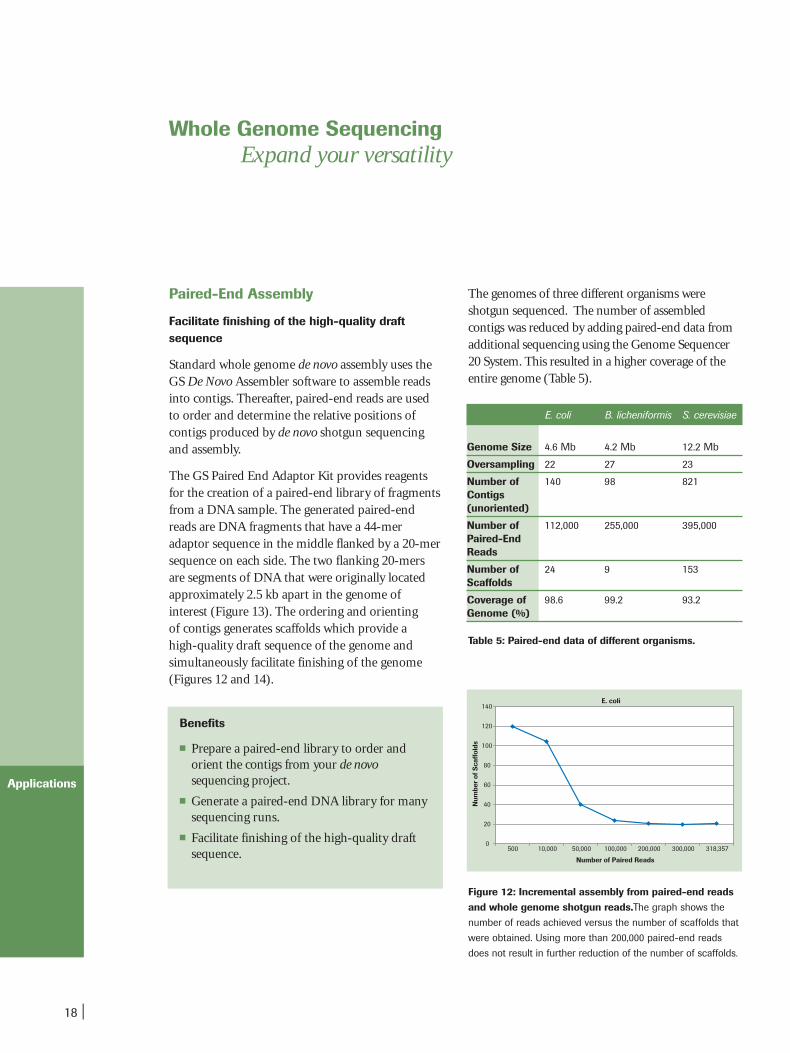
Figure 12: Incremental assembly from paired-end readsand whole genome shotgun reads.The graph shows the
number of reads achieved versus the number of scaffolds that
were obtained. Using more than 200,000 paired-end reads
does not result in further reduction of the number of scaffolds.
The genomes of three different organisms were shotgun sequenced. The number of assembled contigs was reduced by adding paired-end data fromadditional sequencing using the Genome Sequencer20 System. This resulted in a higher coverage of theentire genome (Table 5).
Table 5: Paired-end data of different organisms.
E. coli B. licheniformis S. cerevisiae
Genome Size 4.6 Mb 4.2 Mb 12.2 Mb
Oversampling 22 27 23
Number of 140 98 821Contigs (unoriented)
Number of 112,000 255,000 395,000Paired-End Reads
Number of 24 9 153Scaffolds
Coverage of 98.6 99.2 93.2Genome (%)
E. coli
0
20
40
60
80
100
120
140
500 10,000 50,000 100,000 200,000 300,000 318,357
Number of Paired Reads
Num
ber
of S
caff
olds

| 19
Applications
Figure 13: Generation of a paired-end library. Intact genomic DNA is fragmented to yield an average length of 2.5 kb usinghydroshearing). The fragmented genomic DNA is methylated with Eco RI methylase to protect the Eco RI restriction sites. The endsof the fragments are blunt-ended, polished, and an adaptor DNA oligo is blunt-end ligated onto both ends of the digested DNAfragments. Subsequent digestion with Eco RI cleaves a portion of the adaptor DNA, leaving sticky ends. The fragments are circu-larized and ligated, resulting in 2.5 kb circular fragments. The adaptor DNA contains biotin tags and two Mme I restriction sites;after treatment with Mme I, the circularized DNA is cleaved 20 nucleotides away from the restriction sites in the adaptor DNA. This digestion generates small DNA fragments that have the adaptor DNA in the middle and 20 nucleotides of genomic DNA thatwere once approximately 2.5 kb apart on each end. These small, biotinylated DNA fragments are purified from the rest of thegenomic DNA using streptavidin beads. The purified paired-end fragments are processed using the standard library-preparationprotocol for the Genome Sequencer 20 System (see page 6, Figure 3).
Figure 14: Schematic view of paired-end reads that are used to orient and order contigs and build scaffolds.

20 |
Applications
Transcriptome and Gene Regulation Studies Expand your versatility
Introduction
The Genome Sequencer 20 System enables the studyof transcriptomes with outstanding depth of coverageand sensitivity. This is due to the system’s massivelyparallel sequencing technology which generates ahigh number of sequence reads (minimum of200,000 ESTs per five-hour run). As a result,sequencing of transcriptomes is now possible up toa previously unattainable sequence coverage in avery short period of time, facilitating the identifica-tion of previously unknown transcripts.7 Anotherapplication using Genome Sequencer 20 technologyis the genome-wide identification of small non-coding RNAs. Several publications prove that thisnew technology offers a straightforward method forgenome-wide identification of completely unknowngroups of small non-coding RNAs.3, 8, 9
In addition, the Genome Sequencer 20 technologyfacilitates gene expression studies. Ditags or longertags (e.g., EST tags) can be sequenced very rapidlyat a very high throughput, providing informationon the types of genes expressed and alternative start or termination sites, as well as revealing information about expression levels.
Binding sites of DNA-binding proteins, such astranscription factors, can now be identified without the use of microarrays7; DNA fragmentsthat include binding-site sequences can be isolatedafter immunoprecipitation with their associatedtranscription factors and characterized using high-throughput sequencing.
Overview of Transcription and Gene Sequencing Applications using the Genome Sequencer 20 System
Identification and quantification of transcripts Gene regulation
- Sequence small cDNA tags or GIS-PET10 tags
- Sequence larger cDNA tags such as 5´ or 3´ ESTs(100 base pairs)
- Identify miRNAs, siRNAs, or other small non-codingRNAs (sncRNAs) on a genome-wide level
- Study changes in methylation patterns
- Identify transcription factor binding sites
- Identify chromatin binding sites
Sample preparation
At least 200,000 sequence reads can be generated ina five-hour run with the Genome Sequencer 20System; therefore, 200,000 ESTs can be sequencedduring a single run. Generally, the substrate usedfor sequencing consists of low molecular weightcDNA molecules (e.g., ditags or short PCR productscarrying the sequence information of the 5´ or the3´ end of mRNA molecules). For example, during
genome-wide identification and quantification of small non-coding RNA (sncRNA) molecules (e.g., miRNA or siRNA), short cDNA moleculesgenerated from small RNA (isolated using gel fractionation methods) are used as input.

| 21
Applications
Figure 15: Substrates for the high-throughput sequencing
pipeline are typically low molecular weight molecules
representing transcripts (in this case, paired-end tags [PETs]
carrying information on the 5´ and the 3´ end of mRNAs).
Once the Genome Sequencer 20-specific adaptors are ligated
to these tags, straightforward sequencing of hundreds of
thousands of these molecules is possible.
5' 3'
5' 3'
5' 3'
AAAAA
PETs ligated
diPETs ligated (80 bp)
Adaptor A+B ligation
emPCR and GS 20 Sequencing
5' 3'
5' 3'
5' 3'
AAAAA
Develop a Superior Understanding ofTranscriptomes — Benefits at a Glance
Make New Discoveries
■ Discover expressed genes in known andunknown genomes at an unprecedenteddegree of depth with low cost per clonal read.
■ Uncover altered start and termination sites,translocations, and trans-splicing productswith exceptional sensitivity and accuracy.
■ Perform gene identification and quantifica-tion studies simultaneously, accelerating the analysis of unknown transcriptomes.
Drive the understanding of gene regulation
■ Identify genome-wide transcription factorbinding sites with unprecedented efficiencyand sensitivity.
■ Analyze gene transcription control by identifying and characterizing DNA methylation patterns more accurately.
■ Generate a comprehensive genome-wide mapof small non-coding RNAs (e.g., miRNA) andtheir different classes in days.
Two methods can be employed to add the A and Badaptor sequences (needed for emulsion PCR andsequencing) to the cDNA molecules (Figure 15).
1. Ligation of the 44-mer standard A and B adaptors (included in the GS DNA LibraryPreparation Kit) to cDNA molecules
2. Incorporation of A and B adaptor sequencesduring cDNA generation

22 |
Applications
Figure 16: Overview of EST sequencing procedure. A specific oligo sequence (including the B adaptor sequence
at the 3' end of the oligo) is added to the 5' end of full-length
mRNAs by T4 RNA ligase (Oligo Capping). Subsequently,
cDNA synthesis is randomly primed by a hybrid oligonucleotide
where the 3' portion of the oligo consists of a random hexamer
sequence and the 5' end consists of the specific 19 bp
sequence identical to the A adaptor sequence. The resulting
single-stranded cDNA (sscDNA) is used directly in the emPCR
reaction to generate DNA beads for GS 20 sequencing.
Transcriptome and Gene Regulation Studies Expand your versatility
Identification and Quantification of Transcripts
I. Sequencing of ESTs (Expressed Sequence Tags)
The Genome Sequencer 20 System is perfectly suited for analysis of 5' as well as 3' ends of cDNAmolecules. The 5' sequencing of full-length cDNAmolecules was developed by Yutaka Suzuki(University of Tokyo, Department of MedicalGenome Science). This method extends the DNAtag sequencing and mapping strategy of short ditags by using the full-read capability of GS 20 to generate 100 bp ESTs at the 5' end of cDNA molecules (Figure 16). The advantages of havinglonger tags include
■ Improved mapping (sequence identification) of cDNAs to known reference sequences (quantification and genome annotation – mapping transcription start sites/splice variants)
■ Information on unknown expressed genes (protein functions) from unknown genomes ornewly identified transcripts
B
1. RNA Isolation
2. Decapping/Oligo Ligation with T4 RNA Ligase
3. cDNA Synthesis (random priming)
4. sscDNA
5' CAP AAAA 3'
AAAA
B
A
AAAA
CNNNNNN
B A

| 23
Applications
Figure 17: Schematic representation of Genome Identification Signature Sequencing with paired-end ditags (GIS-PET). Data provided by Chia-Lin Wei and Yijun Ruan — Genome Institute of Singapore.
5' 3'
5' 3'
5' 3'
AAAAA
PETs ligated (Poly [A] RNAs are converted to cDNA tags isolated from ends of transcripts and linked into PETs)
diPETs ligated (80 bp)
Adaptor A+B ligation
emPCR and GS 20 Sequencing
GS 20 sequencing read
5' 3'
5' 3'
5' 3'
AAAAA
333333333333333333 5555555555555555 333333333333333333 5555555555555555
GTCGGATCCGACCAGCCTAGGCTG
5555555555555555 333333333333333 5555555555555555 333333333333333333
II: Simultaneous sequencing of 5´ and 3´ ends of full-length cDNA molecules — GenomeIdentification Signature Sequencing (GIS-PET)
The Genome Identification Signature (GIS) technique was developed by the Singapore GenomeCenter10 (Figure 17). GIS is a DNA-tag sequencingand mapping strategy in which 5' and 3' signaturesof full-length cDNAs are accurately extracted intopaired-end ditags (PETs) that are concatenated forefficient sequencing. The PETs are subsequentlymapped to genome sequences to demarcate thetranscription boundaries of every gene. GIS analysisis potentially 30-fold more efficient than standard(Sanger) cDNA sequencing approaches or tran-scriptome characterization. Using this approach, itis also possible to uncover intergenically spliced andunusual fusion transcripts. Paired-end ditagging fortranscriptome analysis can also be applied to whole
genome analysis of cis-regulatory and other DNAelements and represents an important technologicaladvance for genome annotation.
Summary of Results
■ Mapping of GIS-PETs to the human genome— 462,626 PETs generated (single run on GS 20)— 22,992 PET clusters – 92% map to unique loci
■ Identification of altered start and termination sites— 125,986 selected PETs (100%) — 13% showed altered 3' or 5' start or termination
sites (alternative or truncated)
■ Identification of novel transcripts —21,153 (100%) unique PET clusters studied — 7% novel genes
Data provided by Chia-Lin Wei and Yijun Ruan — Genome Institute of Singapore.

24 |
Applications
Transcriptome and Gene Regulation Studies Expand your versatility
Gene Regulation Studies
I. Genome-wide identification of small non-coding (snc) RNAs
Two methods are used to prepare small RNAs forsequencing on the Genome Sequencer 20 Instrument.In one method (Figure 18, Method 1), described inthe publication by Henderson et al.,3 small RNA(after conversion into cDNA) is processed using thestandard GS library preparation protocol. The GSprocess-specific A and B adaptors (44-mer adaptors)are blunt-end ligated onto the double-strandedcDNA copy of the small RNA molecules. Afterwards,a single-stranded library is produced (page 6) andtransferred to the emPCR step for clonal amplifica-tion and subsequent sequencing.
The second method adds GS process-specific A andB adaptors onto the small RNA during a PCR step(Figure 18, Method 2).
During sequencing of sncRNAs using the Sangerapproach, double-stranded cDNA copies of the RNAare concatemerized in order to make sequencingmore economical. In comparison, the GS 20approach is much more straightforward because the often complicated concatemerization step can be omitted. Moreover, cost per clonal read is muchlower for the Genome Sequencer 20 System, thusproviding a real basis for screening for sncRNA on a genome-wide level.
For example, Girad et al.8 used the system in orderto characterize a new class of small RNAs, calledpiRNAs, in mouse testis. More than 87,000 readswere generated, approximately 53,000 of whichwould be classified as candidate piRNAs. Otherexamples where the GS 20 System has been success-fully used for the characterization of sncRNAsinclude the genome-wide analysis of an Arabidopsisthaliana dicer mutant3 or the characterization of thepiRNA complex from rat testes.9
II. Identification of binding sites of transcriptionfactors or other DNA-binding proteins
To gain a better understanding of the regulation oftranscription in the transcriptome, the ability toderive a whole-genome map of transcription factorbinding sites (TFBS) is crucial.
Using the Genome Sequencer 20 System, it is nowpossible to combine chromatin immunoprecipita-tion (ChIP) with high-throughput sequencing. Forthis application, cells are treated with formaldehydein order to crosslink genomic DNA and DNA binding proteins, such as transcription factors.The crosslinked cells are then lysed and sonicated.Subsequently, the transcription factors of interest(or other DNA binding proteins) are immunopre-cipitated together with the corresponding DNA(including the binding site) using transcription factor-specific monoclonal antibodies. Afterremoval of the proteins, paired-end tags of theremaining DNA fragments can be generated andsequenced in a high-throughput manner. Using this approach, 57 p53 binding sites were identifiedin HCT116 cells on the genome level.7

| 25
Applications
Method 1Method 2
5'
Total RNA
Size fractionation in denaturing polyacrylamide gel
Addition of 3' adaptor (T4 RNA Ligase)
Addition of 5' adaptor (T4 RNA Ligase)
Reverse Transcription
Size fraction containing small RNA
cDNA
PCR
44-mer adaptor ligationusing the GS Library Preparation Kit
Standard Pathwayusing Sanger technology
CloningSequencing Double-stranded cDNA
PCR with 19-mer tailed adaptors
GS emPCR Kit II (Amplicon A, Paired End)
and/or GS emPCR Kit III (Amplicon B)
Adaptor A (19-mer)
Adaptor B(19-mer)
GS emPCR Kit I (Shotgun)
5' 3'
Adaptor A (44-mer)
Adaptor B(44-mer)
Figure 18: Sequencing of small non-coding (snc) RNA.The figure illustrates two methods for preparing sncRNA for
sequencing. In each method, adaptors are added to the
sncRNA and transcribed into cDNA.
Method 1. The second strand is synthesized and Adaptors A
and B (included in the GS DNA Library Preparation Kit) are
ligated onto the double-stranded cDNA. Subsequently, emPCR
is performed using the GS emPCR Kit I (Shotgun).
Method 2. PCR is performed using cDNA, and primers that
include the sequences for the A and B Adaptors. Subsequently,
emPCR is performed with the GS emPCR Kit II (Amplicon A,
Paired End) or GS emPCR Kit III (Amplicon B), or both kits,
depending on application needs (see Table 7, page 37).
Each of the methods results in a clonally amplified
sstDNA fragment attached to a bead, ready for analysis
in a sequencing run.

26 |
Applications
HT29 untreated
HT29 treated
LNCaP untreated
LNCaP treated
Figure 19: Consensus assembly data from p16 ampliconsequencing from bisulfite-treated genomic DNA fromcancer-derived cell lines. The graphs represent the
sequencing results from untreated (A and C) and sodium
bisulfite-treated (B and D) genomic DNAs derived from an
LNCaP prostate cell line (A and B) and an HT29 CRC cell line
(C and D). Red bars represent C to T conversion as a result
of the bisulfite treatment, and their frequency in the sequence
is indicated on the left vertical axis. The horizontal axis is the
reference sequence for the p16 gene amplicons used in these
studies. The right vertical axis and the black horizontal line
indicate the number of sequences that were used in the
assembly, and thus cover a given position along the amplicon.
Absence of a converted C to T suggests protection from
bisulfite treatment due to methylation of the cytosine.
Comparison of D to B reveals several sites in D where there
is no conversion of cytosine to thymine, representing methyla-
tion of those cytosines. Note that the untreated samples
(A and C) show no conversion of C to T, demonstrating the
specificity of the sequencing. The red bars topped with
black stars (★) indicate the nucleotides within the primer
used in the PCR; a C to T change from the reference
sequence was engineered into those primers.
III. Analysis of DNA methylation patterns usingthe Genome Sequencer 20 System
Loss of methylation, as well as hypermethylation, ofCpG islands within promoter regions is known to bea very important regulation mechanism for manygenes. Genome methylation occurs at cytosineresidues located 5' to a guanosine in a CpG dinu-cleotide. Dense areas of CpG dinucleotides withinpromoter regions are organized into CpG islands.
Applying a known bisulfite-treatment procedure,454 Life Sciences Corporation has established asequencing-based technology to quantitatively characterize the methylation state of each CpG dinucleotide in a given target genomic sequence(Figure 20).
To better understand how the bisulfite chemistryand GS 20 sequencing perform with clinicalresearch samples, eight colorectal cancer (CRC)tumor samples and their matched normal adjacenttissue (NAT) were analyzed (Figure 21). The frequency of methylation is determined by the formula Fmeth=1-(FreqCtoT), where FreqCtoT is the frequency of conversion of the cytosine to athymine in a CpG island.
The results obtained in this experiment are supported by the published literature, and demonstrate that a significant percentage of CRCsshows methylation of the p16 CpG island.11, 12
This proves that the described GS 20 application,which is based on an open system without biascaused by CpG dinucleotides, is a straightforwardtechnique to obtain accurate data regarding thequantification of methylation at each CpG dinucleotide addressed. This data can then be analyzed using powerful statistical tools to determine what residues are important in the development and maintenance of cancer.
Transcriptome and Gene Regulation Studies Expand your versatility

| 27
Applications
TACGATGenomic DNA
Sense strand only
TACGATMethylated
TAUGATNot methylated
TACGATMethylated
TATGATNot methylated
Bisulfite conversion
PCR amplification
PCR amplification
Figure 20: Following extraction from tissue or cells,genomic DNA is treated with sodium bisulfite, whichprevents changes to the methylation status of the sample.Treatment of DNA with sodium bisulfite results in the
deamination of unmethylated cytosines to uracils, while
methylated cytosines remain unchanged. PCR amplification
of the converted cytosine (to uracil) results in the substitution
of thymine for the uracil. Comparison of the sequence
obtained from the bisulfite-treated amplicon to the published
sequence using the GS Amplicons Variant Analysis software
allows for identification of any differential methylation.
CRC methylation
0
0.2
0.4
0.6
0.8
1
1.2
41 46 48 52 56 59 65 87 91 94 112 115 118 139 157 161 163 168 174 189 193 205 211 221 226 236 240 247
CpG Position
Freq
CpG
Met
hyla
tion 1
2345678
Figure 21: CpG Methylation Frequency in the p16 CpG island in colorectal cancer (CRC) samples. This figure represents
the methylation frequencies for each of the CpG dinucleotides assayed in the p16 promoter region in eight separate CRC tumor
samples. Frequency of methylation is frequency of C to T conversion subtracted from 1.0, which would represent 100% conversion
of C to T when there is no protection of a C from the bisulfite treatment. Some positions (e.g., 139) show a nearly complete methy-
lation of CpG in all the samples, while others show almost no methylation (e.g., position 59). The variability in methylation between
the eight samples and from one CpG dinucleotide to another is striking (see positions 221 through 247).

28 |
Applications
Amplicon Analysis Expand your versatility
Introduction
The power of the Genome Sequencer 20 Systemderives from utilizing its novel technology to performmany different applications. The new ampliconsequencing tools address scientific questions inmedical research, such as the identification ofsomatic mutations in complex cancer samples or
Cancer Research Medical Research Population Genetics
Somatic mutations
— Discover rare somatic mutations in complex samples (e.g., cancerbiopsies) based on ultra-deep*sequencing of amplicons
SNP disovery
— Uncover SNPs in pools of genomicDNA using ultra-deep* sequencingof amplicons derived from thesepools
Genomic diversity
— Study genetic diversity in populations based on ultra-deep*sequencing of amplicons derivedfrom pools of genomic DNA
* High-coverage sequencing of PCR products: For example, a 100 bp PCR product is sequenced up to a 1,000-fold coverage if
1,000 single 100 bp reads are generated from this PCR product.
the analysis of genetic variability in microbial,human, animal, or plant populations. These andmost other applications using the new emPCR kitsfor amplicon analysis and corresponding softwaremodules could not be addressed before, due totechnical or economic reasons.
Amplicon Sequencing Technology
Generation of PCR products (sequencing templates)
During PCR with specially designed primers, A andB adaptors are incorporated into the amplicon, andare used as primers for the sequencing reactions.This construct enables sequencing in either A or Bdirection or in both directions (Figure 22).
Target-specific sequenceB primer sequence (19-mer)
Locus-specific PCR amplification
A BemPCR and sequencing
Hundreds to thousands of amplicon molecules are sequenced independently
A primer sequence (19-mer)
Figure 22: Schematic presentation of amplicon construction. First, the region of interest is amplified using
PCR primers containing target-specific sequences and A
and B sequences necessary for the sequencing process
(locus-specific PCR amplification). Subsequently, emPCR
and high-throughput sequencing of single molecules can
be performed (hundreds to thousands of amplicon molecules
are sequenced independently).
Overview of Amplicon Sequencing Applications using the Genome Sequencer 20 System

| 29
Applications
emPCR ensures sequencing from single molecules (clonal sequencing)
Typically, in order to detect low-frequency mutationsin complex samples such as cancer biopsies, the target (e.g., an exon) is amplified first. If the mutation frequency is expected to be less than 20%,subcloning of molecules of the PCR product priorto sequencing is mandatory — this is very tedious and expensive.
With the Genome Sequencer 20 System, moleculesof PCR products can be sequenced individually,without the need to subclone in E. coli (Figure 23).
Figure 23: Overview of the amplicon-sequencing process using the Genome Sequencer 20 System. Molecules of PCR
products are sequenced individually. This is ensured through separation of the molecules during emPCR, which replaces tedious
and expensive cloning in E. coli. Hence, the emPCR step provides the basis for massively parallel sequencing from single molecules
(clonal sequencing) and very rapid, cost-effective, highly sensitive, and accurate identification of sequence deviations at a single-
molecule level.
This is due to one of the main advantages of theemPCR process, which is that, while the entire procedure is performed batch-wise on the wholelibrary, clonality is achieved by the physical segregation of the DNA-carrying beads in an emulsion during in vitro amplification. As a result,the procedure does not require prior biologicalcloning of the template fragments. Moreover, theachieved clonality avoids the tedious and veryexpensive manual editing of mixed sequence chromatograms during resequencing projects for medical research, and provides the basis for haplotype identification without subcloning.
Sample Material
Experimental design
Separation of single molecules during emPCR (deconvolution of complexity)
Sequencing of single molecules (clonal sequencing)
Comparison of single sequences
PCR emPCR Sequencing Identification of mutations

30 |
Applications
Amplicon Analysis Expand your versatility
Amplicon Sequencing
The new GS emPCR kits for amplicon analysisenable the sequencing of a PCR product from bothdirections (Figure 24). Consequently, the total readlength per amplicon amounts to 200 bases.Sequencing from the A-sequence site toward the
bead is possible by using emPCR beads that carryoligonucleotides complementary to the B sequenceof the PCR product. Sequencing from the B-sequence site is ensured by using emPCR beads thatcarry an oligonucleotide which is complementary tothe A sequence on the strand to be sequenced.
During emPCR: B-Oligo on the bead
A-Sequencing Primer
Forward Sequencing fromA sequence
Polymerase
During emPCR: A-Oligo on the bead
B-Sequencing Primer
Reverse Sequencing fromB sequence
Polymerase
Figure 24: Schematic presentation of GS 20 amplicon sequencing. With the new GS emPCR (amplicon) kits, it is possible to
sequence a PCR product in either A or B direction or in both directions (200 base pairs per PCR product).

| 31
Applications
Experimental setup
The processing and sequencing of amplicons withthe Genome Sequencer 20 System is quite flexibleand allows for a wide range of experimental design.The researcher has many options regarding thelength of amplicons, the number of ampliconspooled together, the number of reads desired for agiven amplicon pool, and whether to read from theA end, the B end, or both. Although the setup for agiven experiment will depend on the specific projectgoals, there are a few general guidelines that willensure the best possible result:
■ Use a high-fidelity polymerase in the amplicon-generation step. Roche's FastStart High FidelityPCR System features high fidelity coupled withrobust amplification of a wide array of inputtemplates.
■ Obtain the highest confidence in low frequencyvariation by using bi-directional reads.
■ Perform amplification, pooling, and sequencingas described in the workflow overview below.
Workflow overview
■ Design overlapping PCR amplicons (if the region of interest is greater than 100 base pairs in length).
■ Generate each amplicon separately.
■ Purify and quantify the amplicons.
■ Dilute to 200,000 copies per microliter and poolin equimolar ratios.
■ Perform emPCR using the GS emPCR Kits II andIII in separate reactions.
■ Pool the GS emPCR Kit II and III emulsions after completion of the emPCR amplification,breaking, and enrichment procedures.
■ Sequence with a format that will generate thedesired number of reads/depth of coverage.
■ Use the amplicon software to identify and quantify known and de novo variations.
Sensitivity
In principle, there is no limit to the number ofamplicons that can be pooled. The level of multi-plexing and the sequencing format are determinedby the desired sensitivity. The following generalguidelines regarding desired sensitivity/depth ofcoverage will determine experimental setup:
■ 5% on single base changes and multi-base deletions— 1000x
■ 1% variation of single base changes and multi-base deletions — 5000x
As a result, somatic mutations in complex cancersamples can be identified with unprecedented sensitivity and speed. A recent publication reportedon the identification of somatic mutations that were completely missed using the classical Sangerapproach.13

32 |
Applications
Amplicon Analysis Expand your versatility
Amplicon Analysis Software
The Genome Sequencer 20 System includes a software module that is specifically designed foramplicon sequencing analysis. This GS AmpliconsVariant Analysis software compares the ampliconreads to a reference sequence. Based on this comparison, relative mutation frequencies can be calculated (e.g., 5% of all the sequence readsderived from a cancer biopsy research sample differs from the reference sequence, indicating certain mutations, insertions, or deletions).
Overview of the features of the GS AmpliconsVariant Analysis software
■ Variation plot for quick identification ofsequence variation
■ Summary table of variants and their frequencies
■ Ability to select each mutation in the variationplot and display the sequences supporting thereported frequency
— Ability to access the underlying data set andview the individual reads
— Ability to view the individual flowgram(s)
■ Enables importation of data into existing analysistools
— FASTA file format of trimmed or untrimmedsequence
— Base calls with Phred-equivalent quality scoring for individual reads
In the global alignment screen (Figure 25), the variation histogram plot shows the variations ofthe consensus sequence in comparison to a givenreference sequence. The percentage of the variationand the coverage can be easily identified.
In addition to viewing the consensus reads, userscan view the alignment of all individual sequencingreads to consensus reads.
The Tri-Flowgram view of an individual read can be displayed by selecting the read sequence andchoosing “open flowgrams”. The differences compared to a reference sequence can also be analyzed using the Tri-Flowgram screen (Figure 26).
Accelerate Amplicon Analysis — Benefits at a Glance
Accelerate cancer research
■ Identify and quantify somatic cancer muta-tions which were previously undetectable.
■ Identify and quantify somatic mutations withunprecedented speed and accuracy.
■ Investigate cancer development on thegenomic DNA level like never before.
Drive SNP discovery
■ Accelerate SNP discovery by screening pooledgenomic DNA samples.
■ Detect heterozygotes and identify haplotypeswithout subcloning PCR products.
■ Focus on the science as weeks of tediousmanual post-run analysis are eliminated.
Revolutionize population genetics
■ Uncover genetic variations in populations ofmicrobes, humans, animals, or plants withexceptional speed, accuracy, and sensitivity.Roche Applied Science has broken down thetechnological and economic hurdles for you.

| 33
Applications
Figure 25: Global Alignment Screen of GS Amplicons Variant Analysis software. The data in this histogram show the Del-4
mutation in exon 19 at a 3% abundance from the experiment described on page 34.
Figure 26: Tri-Flowgram Screen. In this screen, the flowgrams of the read and the reference sequences and the subtraction of
the reference from the read sequence are displayed. The data show the Del-4 mutation in exon 19 at a 3% abundance from the
experiment described on page 34.
Variation Histogram Plot
Multiple alignment ofconsensus sequences
Reference
Read
Arithmetic difference Read vs. reference
}
}}}
}

34 |
Applications
Amplicon Analysis Expand your versatility
Figure 27: Eleven PCR amplicons, ranging in size between 85 and 156 base pairs, were generated to cover exons 18-22of the EGF receptor. Each target region was individually amplified and quantified. Prior to emPCR amplification and sequencing,
all amplicons were pooled in equimolar ratios.
Examples of Amplicon Sequencing
I. Ultra-deep sequencing to analyze drug resistance in cancer research
Paraffin-embedded pleural effusion material (from a lung adenocarcinoma subject who initiallyresponded strongly to erlotinib treatment) was usedas starting material. Sequencing of EGFR exons 18-22, performed as shown in Figure 27, revealedan 18 bp deletion in exon 19 at a frequency of0.28%, which might account for the subject's earlystrong TKI response (data not shown).
Following 12.5 months of erlotinib treatment, thesubject relapsed with a massive pleural effusion.Pathological examination showed very low tumorcontent in the isolated sample.
A sample from the same subject was sequencedagain and revealed the Del-4 mutation at 3% abundance in exon 19 (Figures 25 and 26).
In addition, a T790M mutation (shown in previousstudies to confer resistance to TKI inhibitors) wasfound at 2% abundance in exon 20 (Figure 28).
The data demonstrates fast and accurate identificationof cancer-associated mutations from complex samplesat a sensitivity and speed that is unprecedented.13
Data provided by M. Meyerson, Department of Medical
Oncology, Dana-Faber Cancer Institute, Harvard Medical
School, Boston, in cooperation with 454 Life Sciences
Corporation.

| 35
Applications
Figure 28: Variation Histogram Plot. The histogram shows a substitution mutation in exon 20, T790M. It is present at a relative
allele frequency of approximately 2%. Figure published in Nature Medicine - 12, 852 - 855 (2006) 13
II: Example of acceleration of SNP discovery bypooling of samples
Typically, SNP discovery is performed based onresequencing of individually amplified genomicregions and direct sequencing of the resulting PCR products — a very time-consuming andexpensive approach. Using the Genome Sequencer20 System and its single-molecule sequencing capabilities, it is now possible to discover SNPs on the population level first (Figure 29). For thisapplication, genomic DNA samples from multiple(e.g., 100) test subjects are pooled. Subsequently,regions of interest, such as exons, are amplified andsequenced at a very high coverage (ultra deep) andsequence variations compared to reference sequenceare detected using the GS Amplicons VariantAnalysis software (Figure 30). Depending on thetype of project, the confirmation of SNPs on theindividual level can be performed using the GS 20System or a SNP genotyping platform such as theLightCycler® Real-Time PCR System.
Data provided by McPherson et al. (Human Genome
Sequencing Center, Baylor College of Medicine)
Figure 29: SNP discovery in a population of 92 individuals.The in-depth analysis revealed the corresponding haplotypes.
Figure 30: Detection of low frequency variants by ultra-deep sequencing.

Application
GS DNA LibraryPreparation
Kit**
GS Paired End
Adaptor Kit
GS emPCR
Kit I (Shotgun)**
GS emPCR
Kit II (Amplicon A, Paired End)
GS emPCR Kit III
(Amplicon B)
Genome Sequencing (including BACs, YACs, plasmids, cosmids, etc.)
Shotgun sequencing X X
Paired-end sequencing (no titration required) X X
Transcriptome/Gene Regulation Analysis
Small non-coding RNA
Protocol: direct ligation of cDNA X X
Protocol: PCR with tailed primers O O
ESTs (expressed sequence tags)
Protocol: direct ligation of cDNA X X
Protocol: PCR with tailed primers O O
DiTags
Protocol: direct ligation of cDNA X X
Protocol: PCR with tailed primers O O
ChIP fragments* ** X X
Protocol: direct ligation of cDNA X X
Amplicon Analysis
PCR fragments (no titration required)*
Up to 100 base pairs O O
200-500 base pairs O O
Long-Range PCR
PCR products over 1500 base pairs, nebulized X X
Table 6. Overview of applications using the Genome Sequencer 20 System and corresponding kits.
O = Option. Read length averages 100 base pairs. For targets shorter than 100 bp, select either GS emPCR Kit II (Amplicon A, Paired End) or GS emPCR Kit III (Amplicon B) and sequence from only one direction, or use both kits for forward and reversesequencing in order to increase accuracy. For targets longer than 100 bp, use both GS emPCR Kit II (Amplicon A, Paired End) and GS emPCR Kit III (Amplicon B) ( forward and reverse) to read sequence from both ends. As target length extends beyond 200 bases, the ability to sequence the entire length of the amplicon will be diminished.
* Use PCR products that are either shorter than 500 bp for direct use in emPCR, or longer than 1500 bp so they can be shearedusing the nebulization protocol prior to emPCR.
** The GS DNA Library Preparation Kit must be used in combination with the GS emPCR Kit I (Shotgun).
36 |
Applications
Applications Expand your versatility

| 37
The Genome Sequencer 20 System Ordering Information
Product Cat. No. Pack Size
Genome Sequencer 20 Instrument★ 04 760 085 001 1 instrument including accessories
Reagent Kits
GS DNA Library Preparation Kit 04 852 265 001 1 kit for 10 library preparations
GS Paired End Adaptor Kit 04 891 457 001 1 kit for 10 library preparations
GS emPCR Kit I (Shotgun) 04 852 290 001 1 kit for 16 amplification reactions
GS emPCR Kit II (Amplicon A, Paired End) 04 891 384 001 1 kit for 16 amplification reactions
GS emPCR Kit III (Amplicon B) 04 891 392 001 1 kit for 16 amplification reactions
GS 20 Sequencing Kit (70x75)★ 04 853 342 001 1 kit for 1 sequencing run
GS 20 Sequencing Kit (40x75)★ 04 852 419 001 1 kit for 1 sequencing run
GS PicoTiterPlate Kit (70x75)★ 04 852 427 001 1 plate with accessories
GS PicoTiterPlate Kit (40x75)★ 04 746 813 001 1 plate with accessories
GS 20 Maintenance Wash Kit 04 852 397 001 1 kit for 1 maintenance wash run
Additional Accessories
70x75 Bead Deposition Device 04 777 069 001 1 bottom plate and 1 top plate
(2 large regions)
70x75 Bead Deposition Device 04 840 712 001 1 bottom plate and 1 top plate
(4 medium regions)
70x75 Bead Deposition Device 04 840 682 001 1 bottom plate and 1 top plate
(16 small regions)
40x75 Bead Deposition Device 04 777 034 001 1 bottom plate and 1 top plate
(1 large region)
40x75 Bead Deposition Device 04 777 042 001 1 bottom plate and 1 top plate
(8 small regions)
Counterweight for 04 777 115 001 1 counterweight
Bead Deposition Devices
GS 20 Reagents Cassette 04 825 527 001 1 reagents cassette
GS 20 Reagent Insulator Cover 04 825 551 001 1 reagent insulator cover
Camera Faceplate Guard 04 777 018 001 1 faceplate guard
Nebulizer Holder 04 777 026 001 1 nebulizer holder
Pre-wash Tube Insert 04 865 227 001 1 pre-wash tube insert
OrderingInformation

38 |
OrderingInformation
References 1. Margulies, M. et al., “Genome sequencing in microfabricated
high-density picolitre reactors,” Nature 437 (2005): 376-380.
2. Andries, K. et al., “A diarylquinoline drug active on the ATPsynthase of Mycobacterium tuberculosis,” Science 307(2005):223-227.
3. Henderson, I.R. et al., “Dissecting Arabidopsis thaliana DICERfunction in small RNA processing, gene silencing and DNAmethylation patterning,” Nature Genetics 38, no. 6 (June 2006):721-725; advance online publication (doi:10.1038/ng1804).
4. Sogin, M.L. et al., “Microbial diversity in the deep sea and theunderexplored ‘rare biosphere’” PNAS 103, no. 32 (August2006):12115-12120.
5. Krause, L. et al., “Finding novel genes in bacterial communitiesisolated from the environment,” Bioinformatics 22, no. 14 (July 2006):e281-e289 (doi:10.1093/bioinformatics/btl247).
6. Poinar, H.N. et al., “Metagenomics to paleogenomics: large-scale sequencing of mammoth DNA,” Science 311, no. 5759(January 2006):392-394.
7. Ng, P. et al., “Multiplex sequencing of paired-end ditags (MS-PET): a strategy for the ultra-high-throughput analysis of transcriptomes and genomes,” Nucleic Acids Research 34,no. 12 (July 2006): e84; advance online publication(doi:10.1093/nar/gkl444).
8. Girard, A. et al., “A germline-specific class of small RNAs bindsmammalian Piwi proteins,” Nature 442 (July 2006):199-202;advance online publication (doi:10.1038/nature04917).
9. Lau, N.C. et al., “Characterization of the piRNA complex fromrat testes,” Science 313, no. 21 (July 2006):363-367; advanceonline publication June 15, 2006 (doi:10.1126/science.1130164).
10. Ng, P. et al., “Gene identification signature (GIS) analysis fortranscriptome characterization and genome annotation,”Nature Methods 2 (2005):105-111; advance online publication(doi:10.1038/nmeth733).
11. Kim, B.N. et al., “Methylation and expression of p16INK4tumor suppressor gene in primary colorectal cancer tissues,”Int J Oncol. 26 (2001):1217-1226.
12. Herman, J.G. et al., “Methylation-specific PCR: A novel PCRassay for methylation status of CpG islands,” Proc. Natl. AcadSci. 93 (1996):9821-9826.
13. Thomas, R.K. et al., “Sensitive mutation detection in heterogeneous cancer specimens by massively parallel picoliter reactor sequencing,” Nature Medicine 12, no. 7 (July 2006):852-855; advance online publication(doi:10.1038/nm1437).
| 39
OrderingInformation
For detailed information, references, multimedia presentation, etc., visit www.genome-sequencing.com
For additional information, call 800 262 4911(for U.S. customers only), or contact your local sales representative.
Limited Label Licenses, Disclaimers,and Trademarks
PICOTITERPLATE is a trademark of 454 Life SciencesCorporation, Branford, CT, USA.
FASTSTART and LIGHTCYCLER are trademarks of Roche.
Other brands or product names are trademarks of their respective holders.
The technology used for the LightCycler® System is licensedfrom Idaho Technology, Inc., Salt Lake City, UT, USA.
★ RESTRICTION ON USE: Purchaser is only authorized to usethe Genome Sequencer Instrument with PicoTiterPlate devicessupplied by 454 Life Sciences Corporation and in conformitywith the procedures contained in the Operator's Manual.
For life-science research only. Not for use in diagnosticprocedures.

Roche Diagnostics GmbHRoche Applied Science 68298 Mannheim Germany
© 2006 Roche Diagnostics GmbH. All rights reserved. 09/0
6-
04
86
645
299
0
www.roche-applied-science.com