Embed Size (px)
Citation preview

Genome Evolution. Amos Tanay 2009
Genome evolution
Lecture 10: Comparative genomics, non coding sequences
Genome Evolution. Amos Tanay 2009
Why larger genomes?
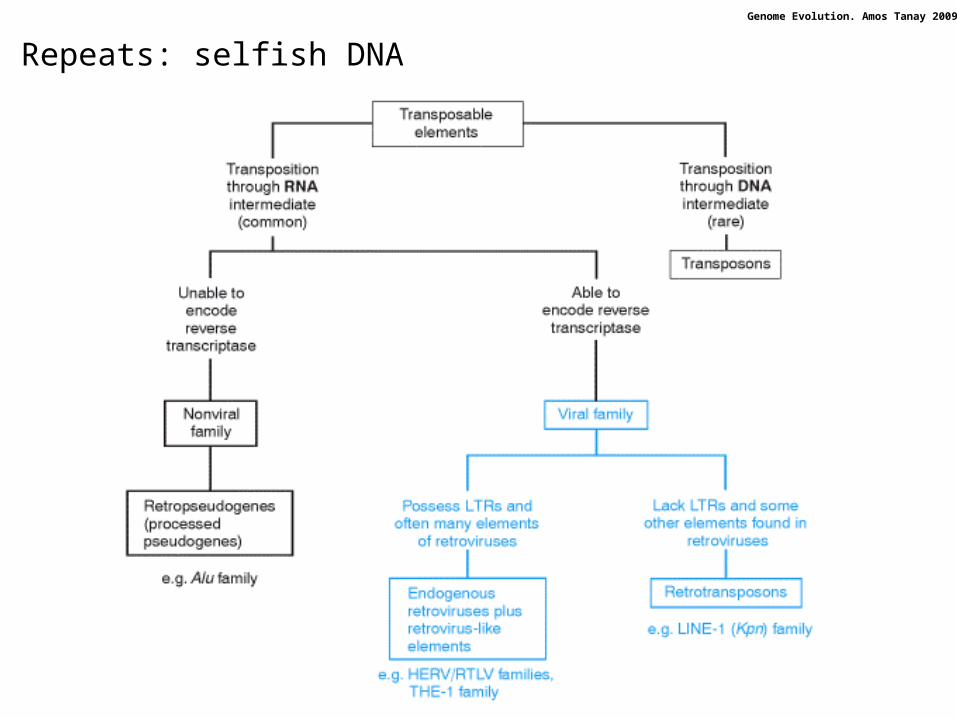
• Ameobe dubia – 670Gb! • S. cerevisae is 0.3% of human, D. melanogaster is 3%• Selflish DNA –
– larger genomes are a result of the proliferation of selfish DNA– Proliferation stops only when it is becoming too deleterious
• Bulk DNA– Genome content is a consequence of natural selection– Larger genome is needed to allow larger cell size, larger nuclear membrane etc.
Genome Evolution. Amos Tanay 2009
Why smaller genomes?
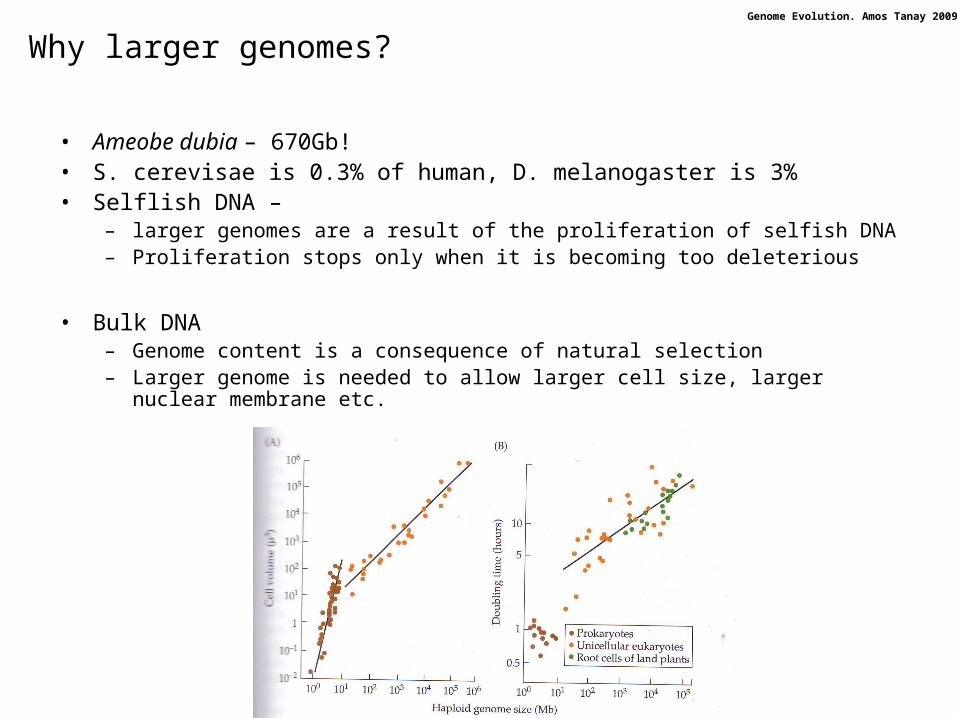
• Metabolic cost: maybe cells lose excess DNA for energetic efficiency– But DNA is only 2-5% of the dry mass– No genome size – replication time correlation in prokaryotes– Replication is much faster than transcription (10-20 times in E. coli)
Genome Evolution. Amos Tanay 2009
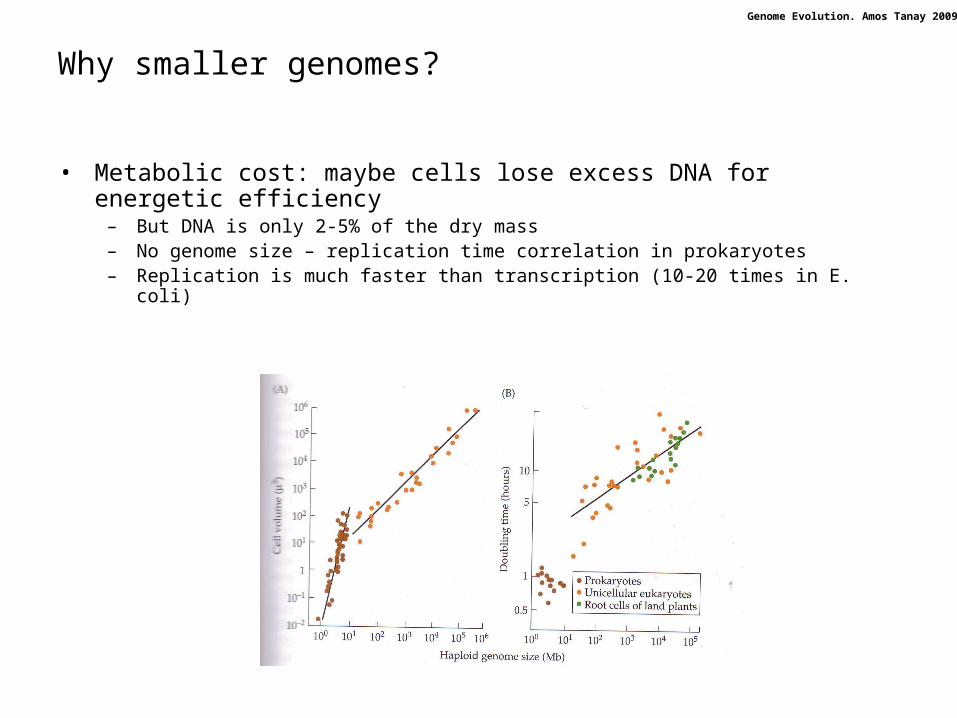
Mutational balance• Balance between deletions and insertions
– May be different between species– Different balances may have been evolved
• In flies, yeast laboratory evolution– 4-fold more 4kb spontaneous insertions
• In mammals – More small deletions than insertions
Mutational hazard• No loss of function for inert DNA
– But is it truly not functional?
• Gain of function mutations are still possible:– Transcription– Regulation
Differences in population size may make DNA purging more effective for prokaryotes, small eukaryotesDifferences in regulatory sophistication may make DNA mutational hazard less of a problem for metazoan
Genome Evolution. Amos Tanay 2009
Repeats: selfish DNA
Genome Evolution. Amos Tanay 2009
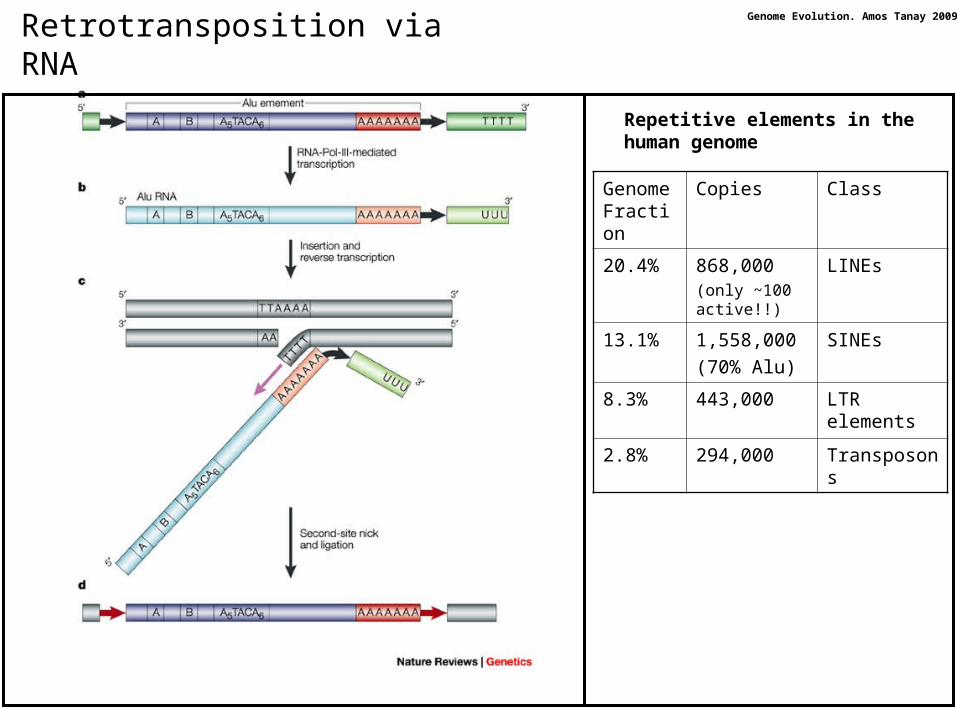
Retrotransposition via RNA
ClassCopiesGenome Fraction
LINEs868,000(only ~100 active!!)
20.4%
SINEs1,558,000
(70% Alu)
13.1%
LTR elements
443,0008.3%
Transposons294,0002.8%
Repetitive elements in the human genome
Genome Evolution. Amos Tanay 2009
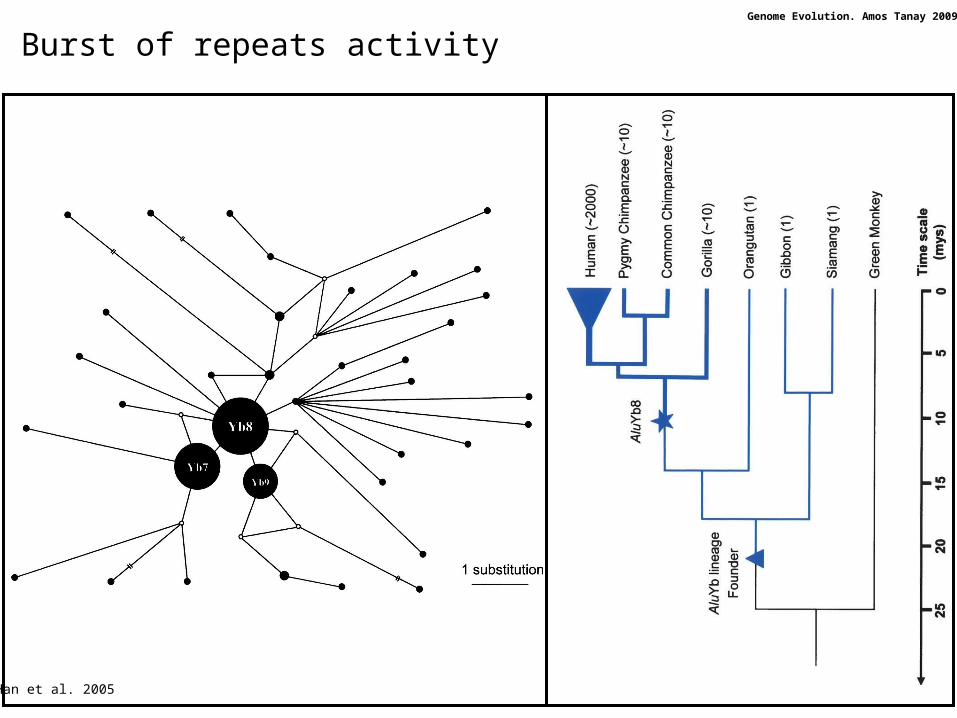
Burst of repeats activity
Han et al. 2005

Genome Evolution. Amos Tanay 2009
Age of repeats in the human genome

Genome Evolution. Amos Tanay 2009
DNA and gene distribution in the isochore families of the human genome
Bernardi G. PNAS 2007;104:8385-8390
These trends are quite clear. But the existence of distinct isochore classes can be questioned
Genome Evolution. Amos Tanay 2009
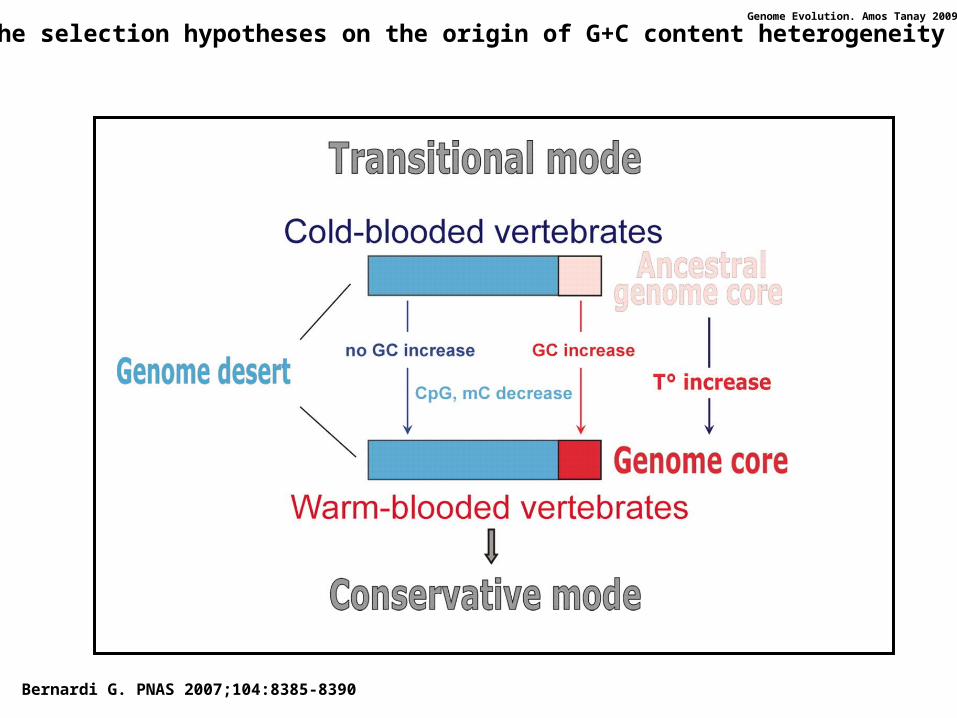
Bernardi G. PNAS 2007;104:8385-8390
The selection hypotheses on the origin of G+C content heterogeneity
Genome Evolution. Amos Tanay 2009
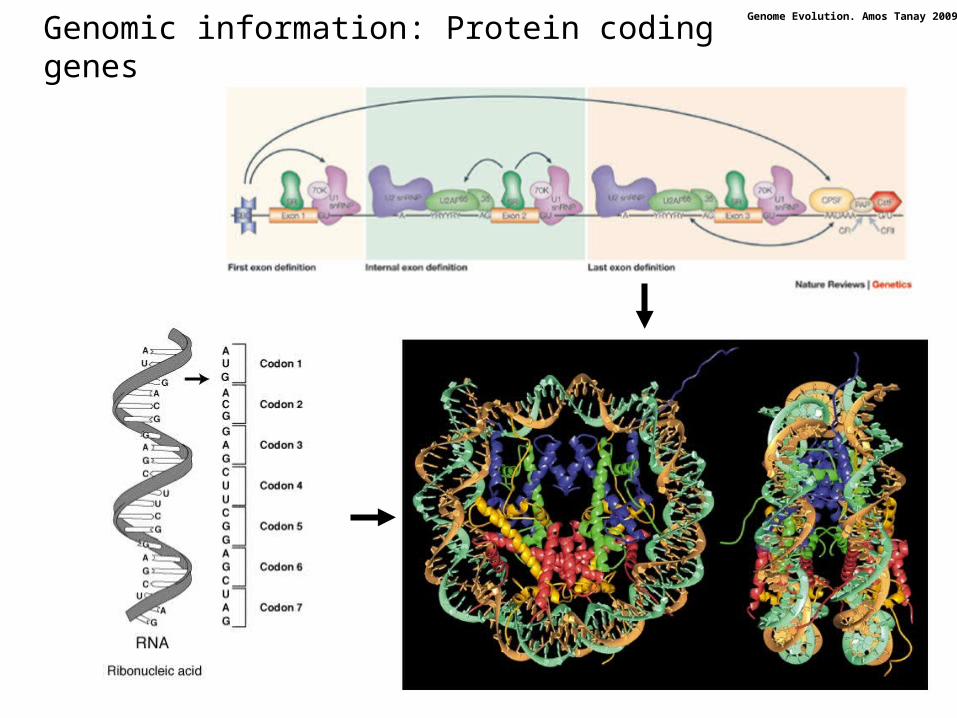
Genomic information: Protein coding genes
Genome Evolution. Amos Tanay 2009
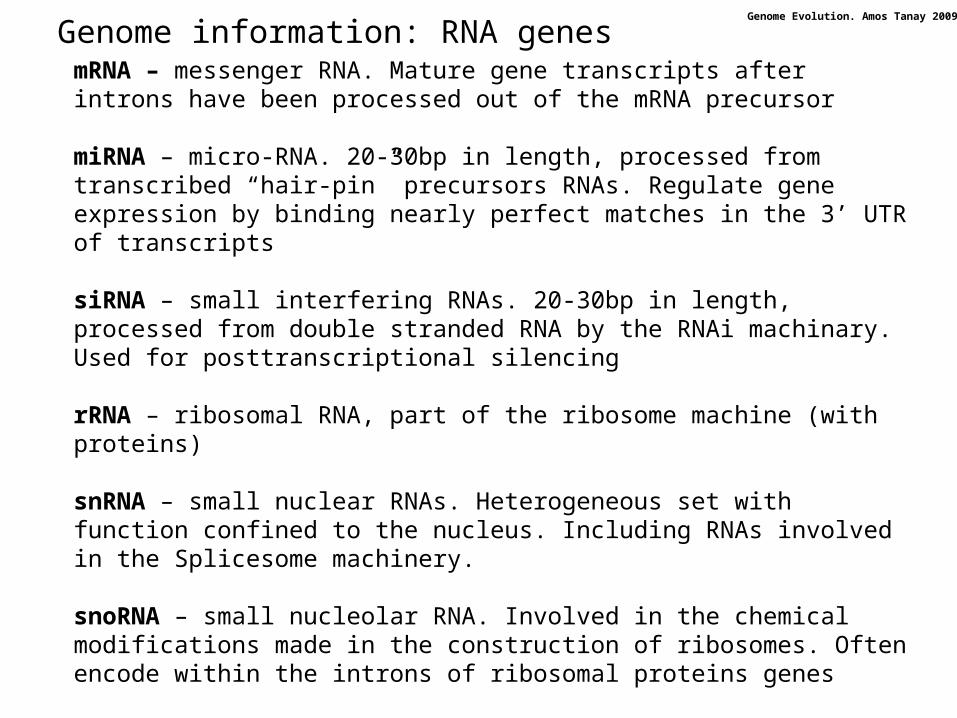
Genome information: RNA genesmRNA – messenger RNA. Mature gene transcripts after introns have been processed out of the mRNA precursor
miRNA – micro-RNA. 20-30bp in length, processed from transcribed “hair-pin” precursors RNAs. Regulate gene expression by binding nearly perfect matches in the 3’ UTR of transcripts
siRNA – small interfering RNAs. 20-30bp in length, processed from double stranded RNA by the RNAi machinary. Used for posttranscriptional silencing
rRNA – ribosomal RNA, part of the ribosome machine (with proteins)
snRNA – small nuclear RNAs. Heterogeneous set with function confined to the nucleus. Including RNAs involved in the Splicesome machinery.
snoRNA – small nucleolar RNA. Involved in the chemical modifications made in the construction of ribosomes. Often encode within the introns of ribosomal proteins genes
tRNA – transfer RNA. Delivering amino-acid to the ribosome.
piRNA – silencing repeats in the germline
Genome Evolution. Amos Tanay 2009
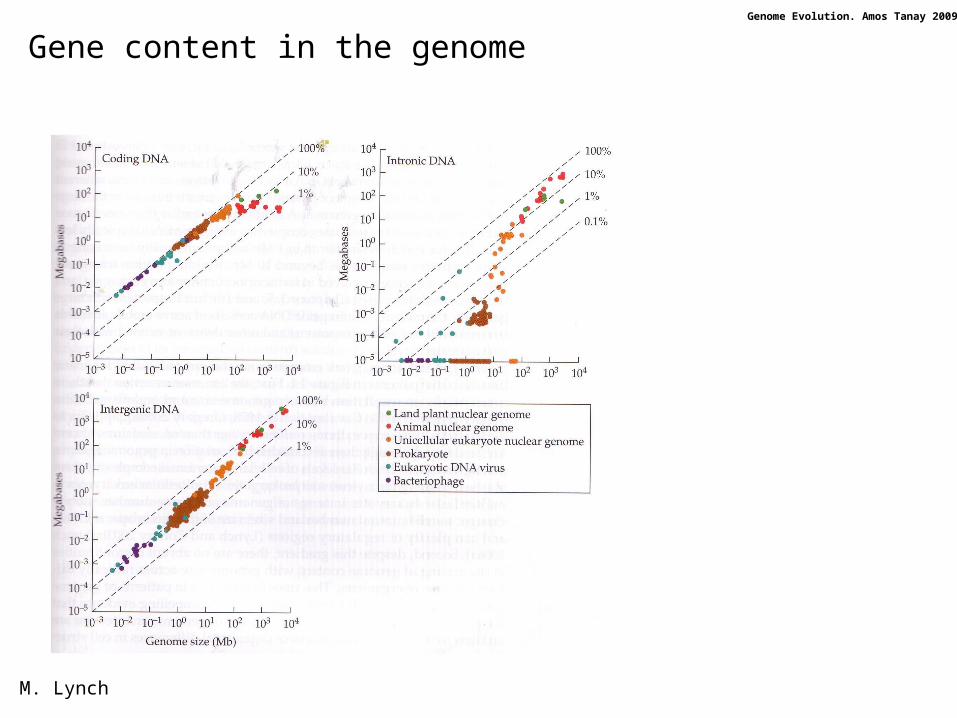
Gene content in the genome
M. Lynch
Genome Evolution. Amos Tanay 2009
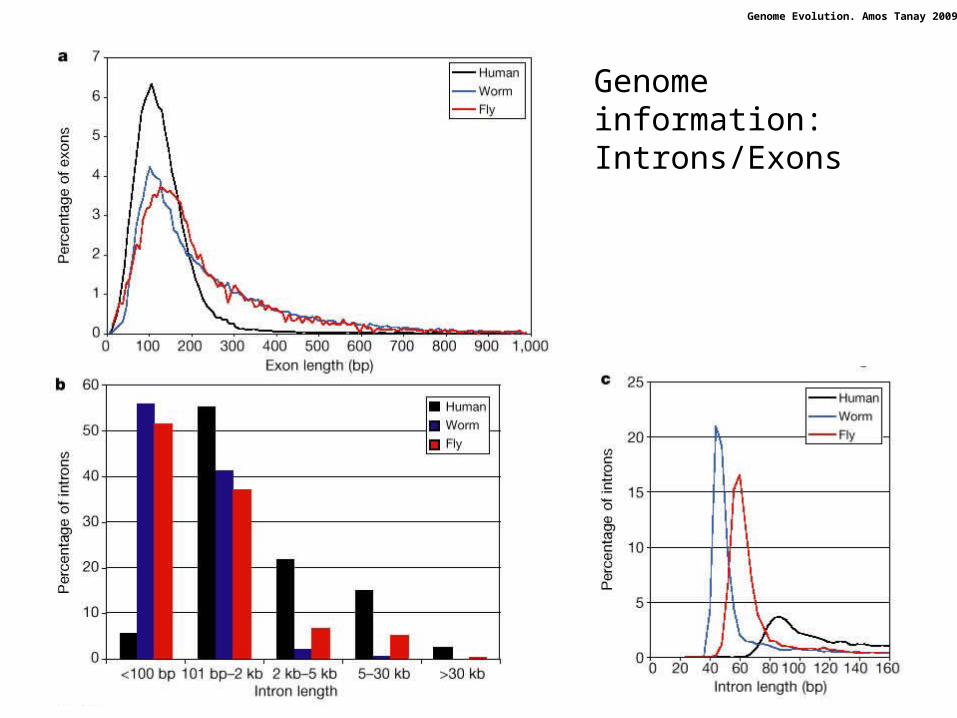
Genome information: Introns/Exons
Genome Evolution. Amos Tanay 2009
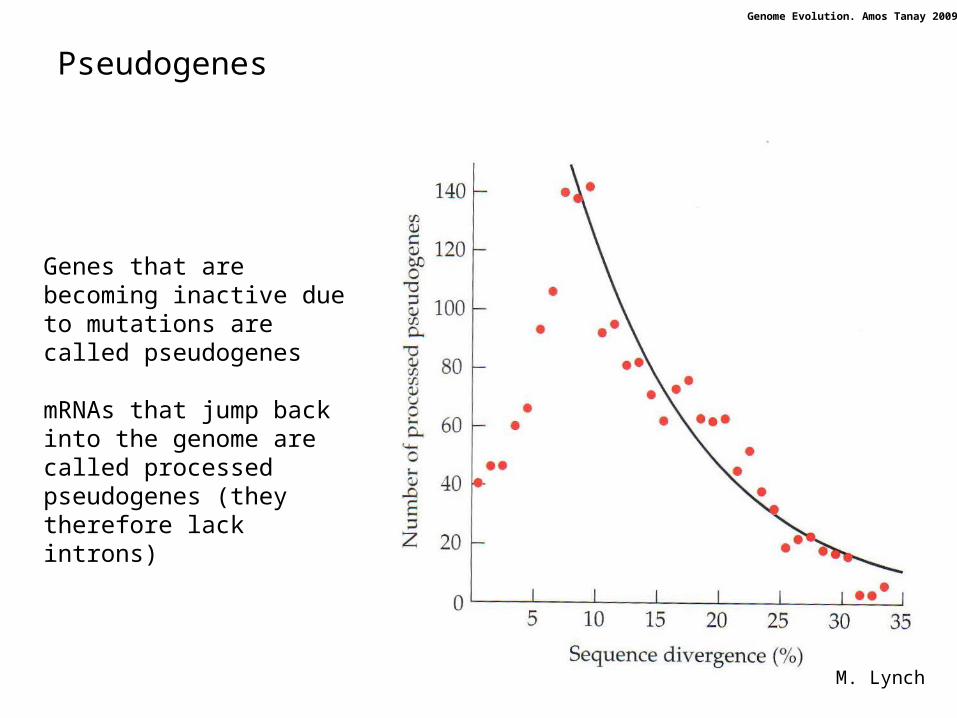
Pseudogenes
Genes that are becoming inactive due to mutations are called pseudogenes
mRNAs that jump back into the genome are called processed pseudogenes (they therefore lack introns)
M. Lynch
Genome Evolution. Amos Tanay 2009
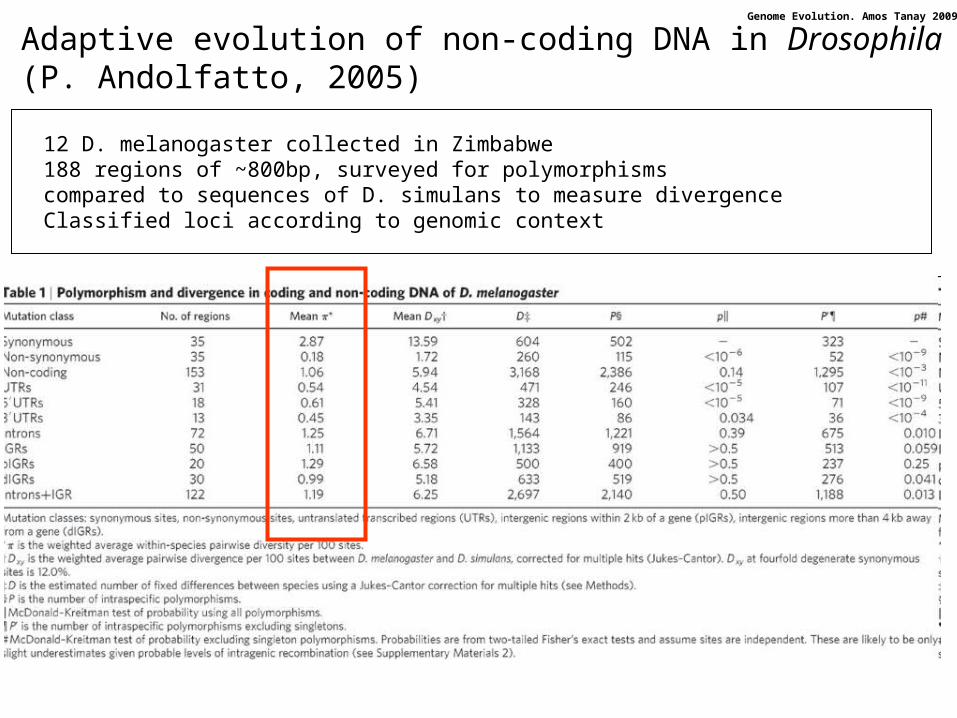
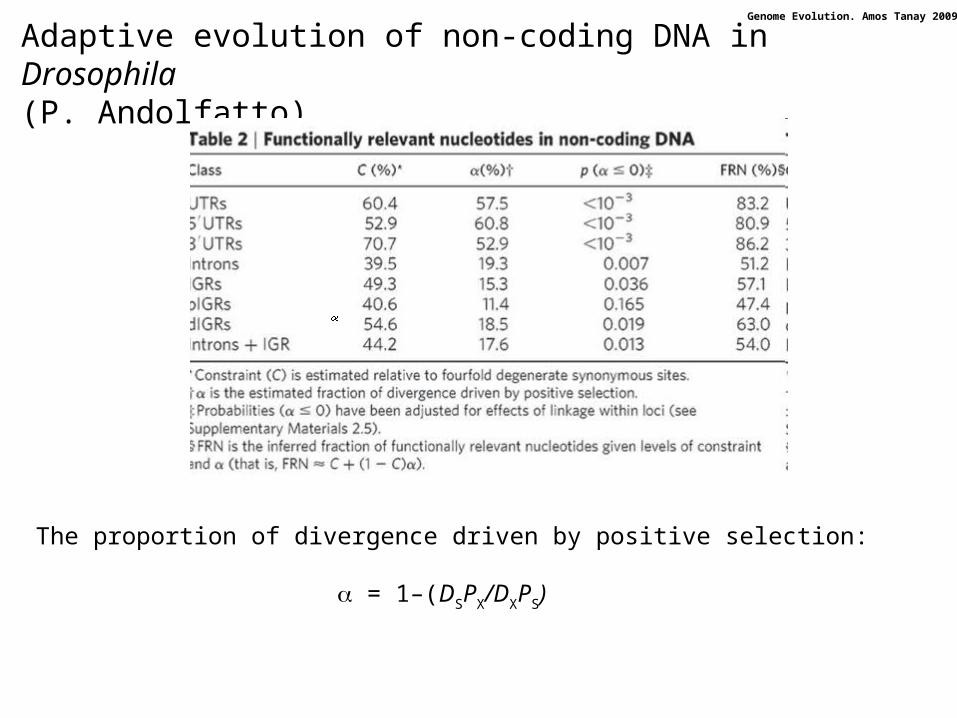
Adaptive evolution of non-coding DNA in Drosophila(P. Andolfatto, 2005)
12 D. melanogaster collected in Zimbabwe 188 regions of ~800bp, surveyed for polymorphisms compared to sequences of D. simulans to measure divergenceClassified loci according to genomic context
Genome Evolution. Amos Tanay 2009
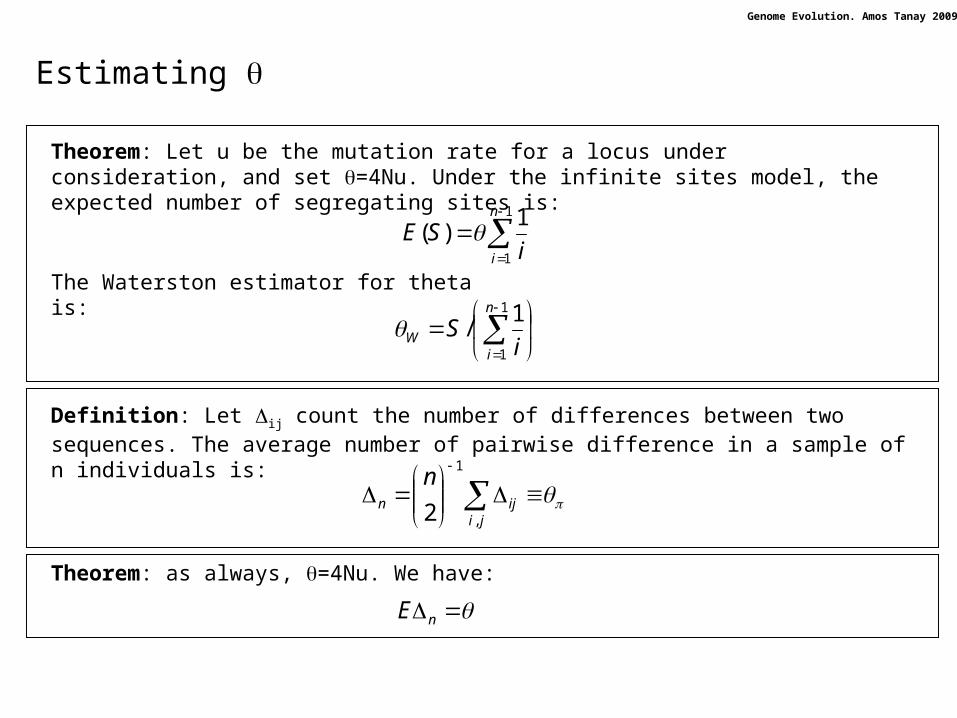
Estimating
Theorem: Let u be the mutation rate for a locus under consideration, and set =4Nu. Under the infinite sites model, the expected number of segregating sites is:
1
1
1)(
n
i iSE
1
1
1/
n
iW i
S
The Waterston estimator for theta is:
Definition: Let ij count the number of differences between two sequences. The average number of pairwise difference in a sample of n individuals is:
jiijn
n
,
1
2
Theorem: as always, =4Nu. We have:
nE

Genome Evolution. Amos Tanay 2009
Tajima’s D
Theorem: as always, =4Nu. We have:
nE
Proof:
)1/(1)41/(1 Nu
Going backwards. Coalescent is occuring before mutation in a rate of:
1
1
1)( 2
k
kP
After one mutation occurred, we again have the same rate so overall:
The expected value of this geometric series is and so is the average of all pairs.
Definition: Tajima’s D is the difference between two estimators of :
WD
Genome Evolution. Amos Tanay 2009
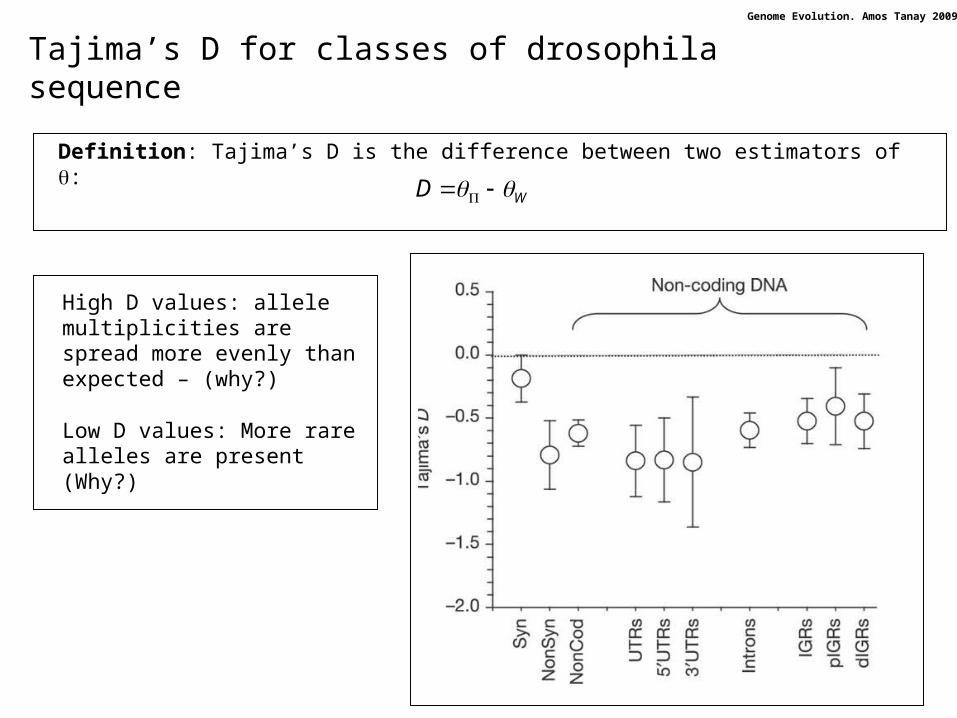
Tajima’s D for classes of drosophila sequence
Definition: Tajima’s D is the difference between two estimators of :
WD
High D values: allele multiplicities are spread more evenly than expected – (why?)
Low D values: More rare alleles are present (Why?)
Genome Evolution. Amos Tanay 2009
Adaptive evolution of non-coding DNA in Drosophila(P. Andolfatto)
The proportion of divergence driven by positive selection:
= 1–(DSPX/DXPS)
Genome Evolution. Amos Tanay 2009
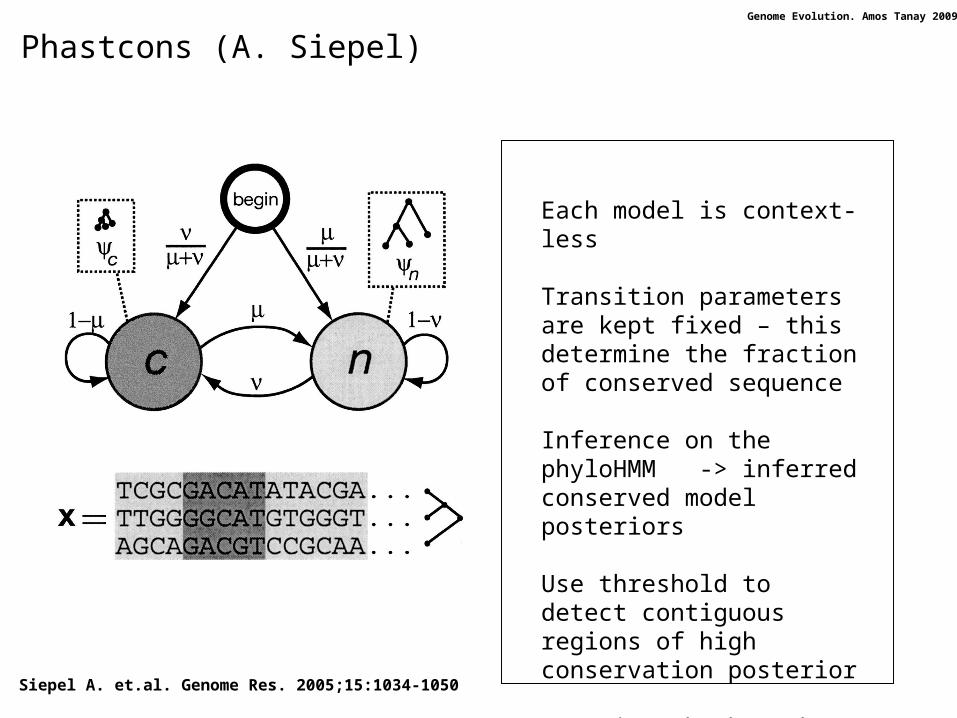
Phastcons (A. Siepel)
Siepel A. et.al. Genome Res. 2005;15:1034-1050
Each model is context-less
Transition parameters are kept fixed – this determine the fraction of conserved sequence
Inference on the phyloHMM -> inferred conserved model posteriors
Use threshold to detect contiguous regions of high conservation posterior
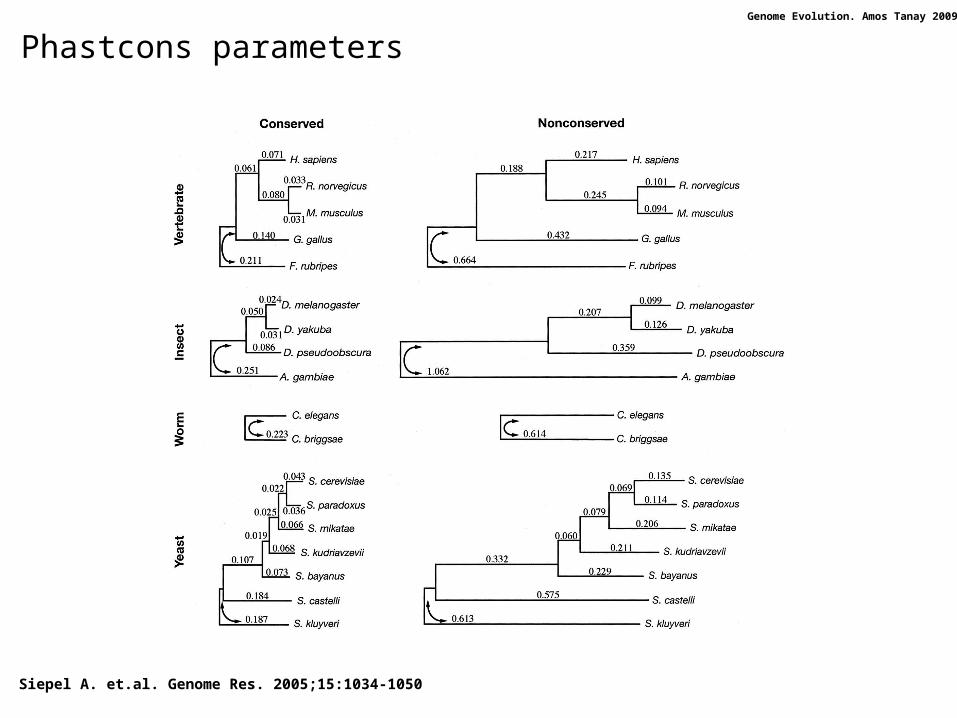
Learning the branch lengths
Genome Evolution. Amos Tanay 2009
Siepel A. et.al. Genome Res. 2005;15:1034-1050
Phastcons parameters
Genome Evolution. Amos Tanay 2009
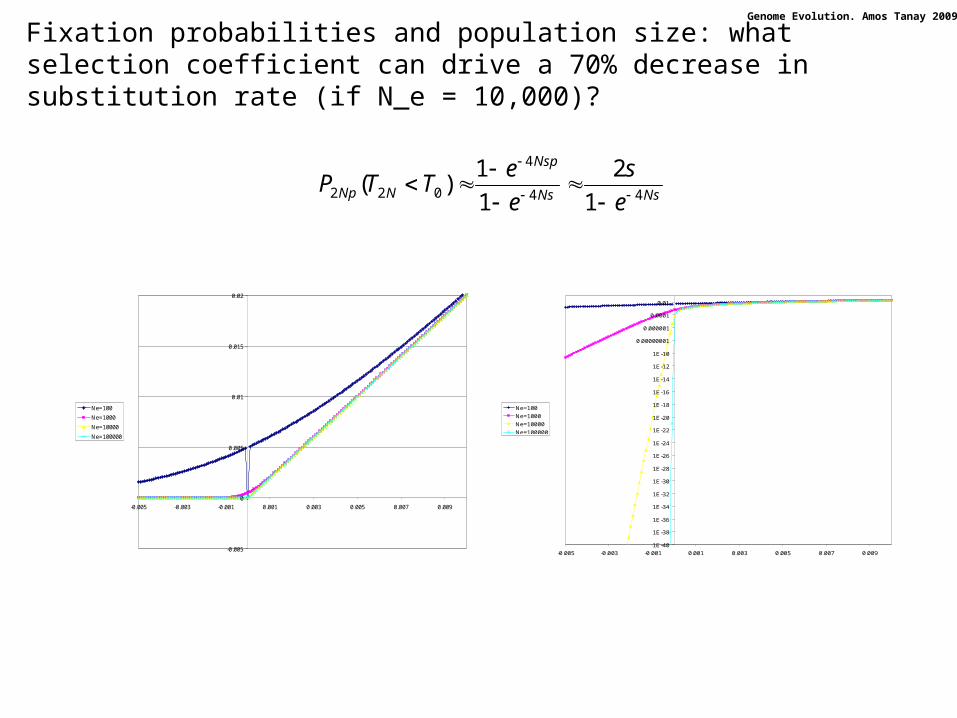
Fixation probabilities and population size: what selection coefficient can drive a 70% decrease in substitution rate (if N_e = 10,000)?
NsNs
Nsp
NNp e
s
e
eTTP
44
4
022 1
2
1
1)(
-0.005
0
0.005
0.01
0.015
0.02
-0.005 -0.003 -0.001 0.001 0.003 0.005 0.007 0.009
Ne=100
Ne=1000
Ne=10000
Ne=100000
1E-40
1E-38
1E-36
1E-34
1E-32
1E-30
1E-28
1E-26
1E-24
1E-22
1E-20
1E-18
1E-16
1E-14
1E-12
1E-10
0.00000001
0.000001
0.0001
0.01
-0.005 -0.003 -0.001 0.001 0.003 0.005 0.007 0.009
Ne=100
Ne=1000
Ne=10000
Ne=100000
Genome Evolution. Amos Tanay 2009
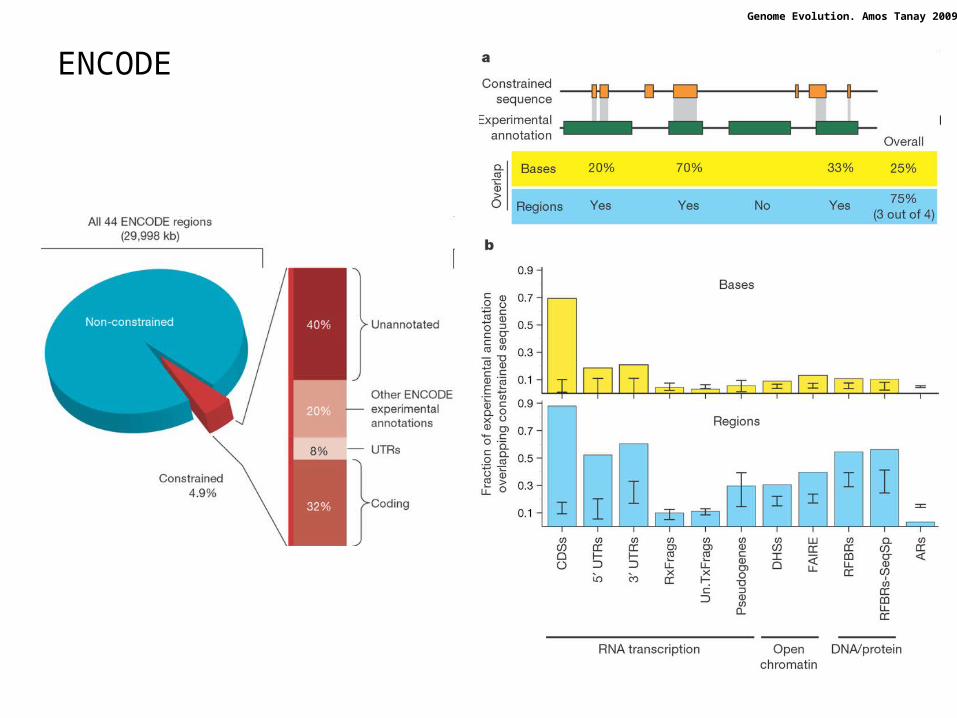
ENCODE
Genome Evolution. Amos Tanay 2009
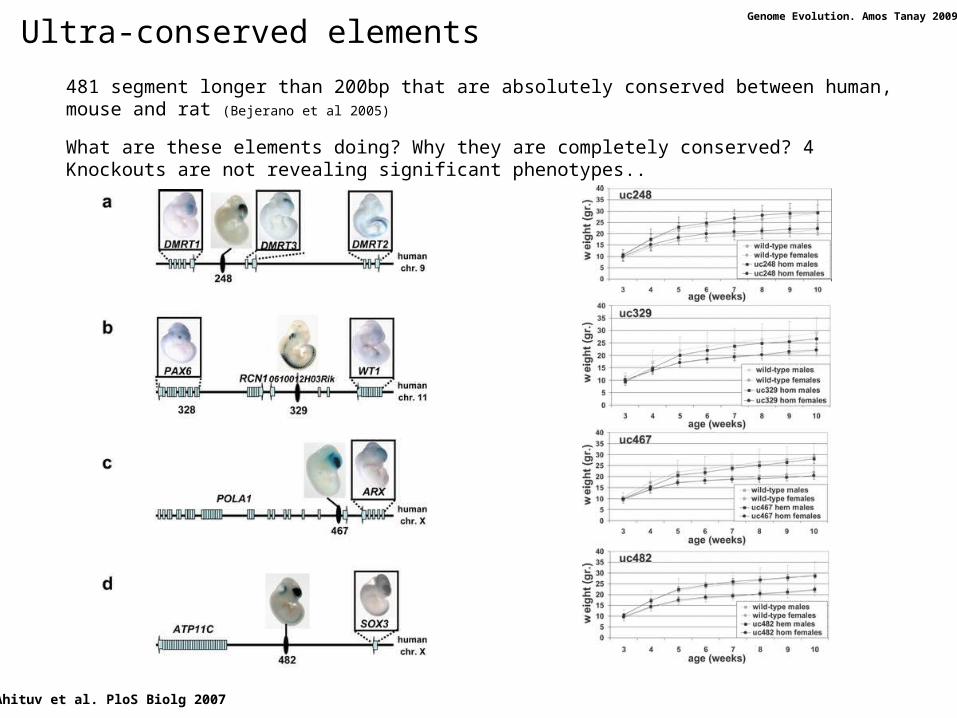
481 segment longer than 200bp that are absolutely conserved between human, mouse and rat (Bejerano et al 2005)
What are these elements doing? Why they are completely conserved? 4 Knockouts are not revealing significant phenotypes..
Ahituv et al. PloS Biolg 2007
Ultra-conserved elements
Genome Evolution. Amos Tanay 2009
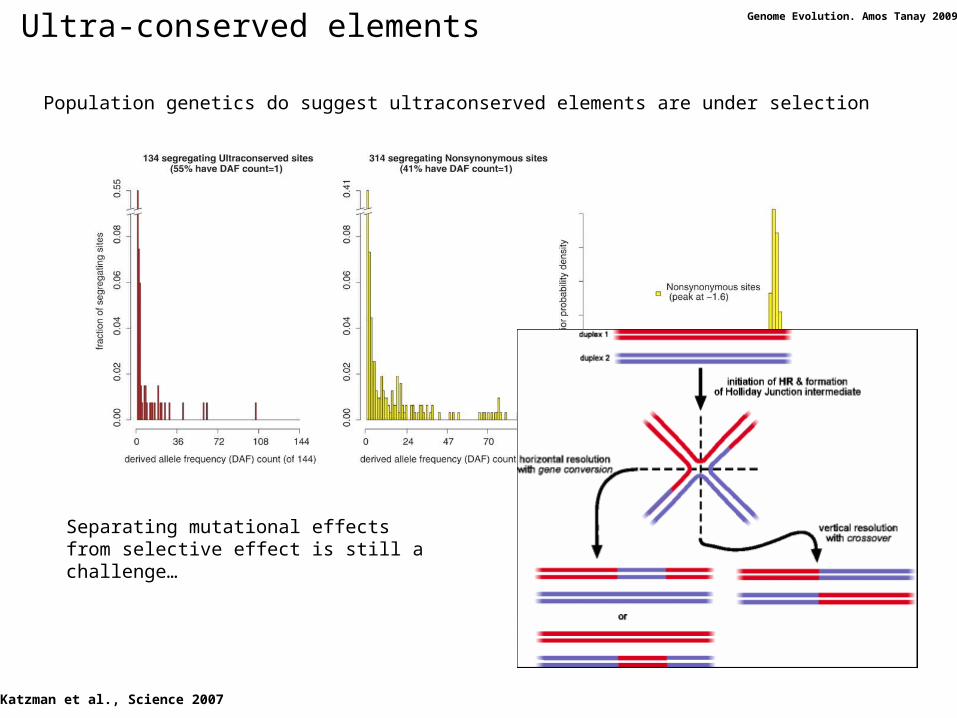
Katzman et al., Science 2007
Population genetics do suggest ultraconserved elements are under selection
Separating mutational effects from selective effect is still a challenge…
Ultra-conserved elements


![[HMG] 04 - Gene Evolution · Genome EvolutionGenome Evolution [Gene Evolution] Genome changes • Mutation • Recombination • Transposition • Gene transfer (e.g., between organelles](https://img.dokumen.tips/doc/110x75/5f1a27241c38cf435819dbb5/hmg-04-gene-evolution-genome-evolutiongenome-evolution-gene-evolution-genome.jpg)