Embed Size (px)
Citation preview
Genomic maps
Genomic Maps and Linkage AnalysisGenome 371, 1 and 5 Feb 2010, Lecture 7 and 8
Linkage maps
Physical maps

Question: Find the closest Thai food restaurant in theUniversity District

Question: Find the closest Thai food restaurant in theUniversity District

How can the principles of geneticlinkage be applied to constructing
linkage map?
What’s a linkage map?

As an undergraduatestudent in Morgan’s
lab, Sturtevantcreated the first
genetic maps
Sturtevant in his lab atCaltech
Alfred Sturtevant
A Humbling Digression…

Constructing a Linkage Map
Alfred Sturtevant’s major insight
If crossovers occurs at random:
Probability of crossover between twogenes is proportional to the distancebetween them
Crossover between A and B much more likely than betweenB and D

Constructing a Linkage Map (cont’d)
So…
Do testcross
Measure recombinant frequency…
= indicator of map distance betweenthe genes!
• 1 map unit = 1 centiMorgan (cM) = 1% of meioticproducts being recombinant
• Recombination frequency in adjacent intervals is additive
Recomb. freq. (A•D) = (A•B) + (B•D) …up to a point
Map distance = # of recombinant products : total # of products

Homework Practice ProblemIn corn…
Colored kernels (C) is dominant over colorless (c)Plump kernels (S) is dominant over shrunken (s)Starchy kernels (W) is dominant over waxy (w).
A trihybrid (Cc Ss Ww) plant is testcrossed and the following progeny are obtained:
2708 Colorless, plump, waxy2538 Colored, shrunken, starchy626 Colorless, plump, starchy601 Colored, shrunken, waxy116 Colorless, shrunken, starchy113 Colored, plump, waxy4 Colored, plump, starchy2 Colorless, shrunken, waxy
Determine linkage (including map distance) for the genes, and the phase in thiscross.

Practice Problem
Where do we begin?
Determine genotypes of offspring
Calculate map distance between pairs of loci
Determine map order
Identify parental types

* Crossing-over creates new combinations of traits
* The frequency of recombinant typesindicates the distance between linked genes
* Two Parental types in ≈ frequenciesTwo Recombinant types ≈ frequencies
* If genes are linked,Parental types > recombinant types
Summary

What is the Maximum Recombination FrequencyBetween Two Loci?
50% To convince yourself… think about independentassortment
Loci can appear to be unlinked because:
• They are on separate chromosomes
• They are so far apart on the same chromosome that they assortindependently
Unlinked Loci: r = 0.50
Linked Loci: r < 0.50
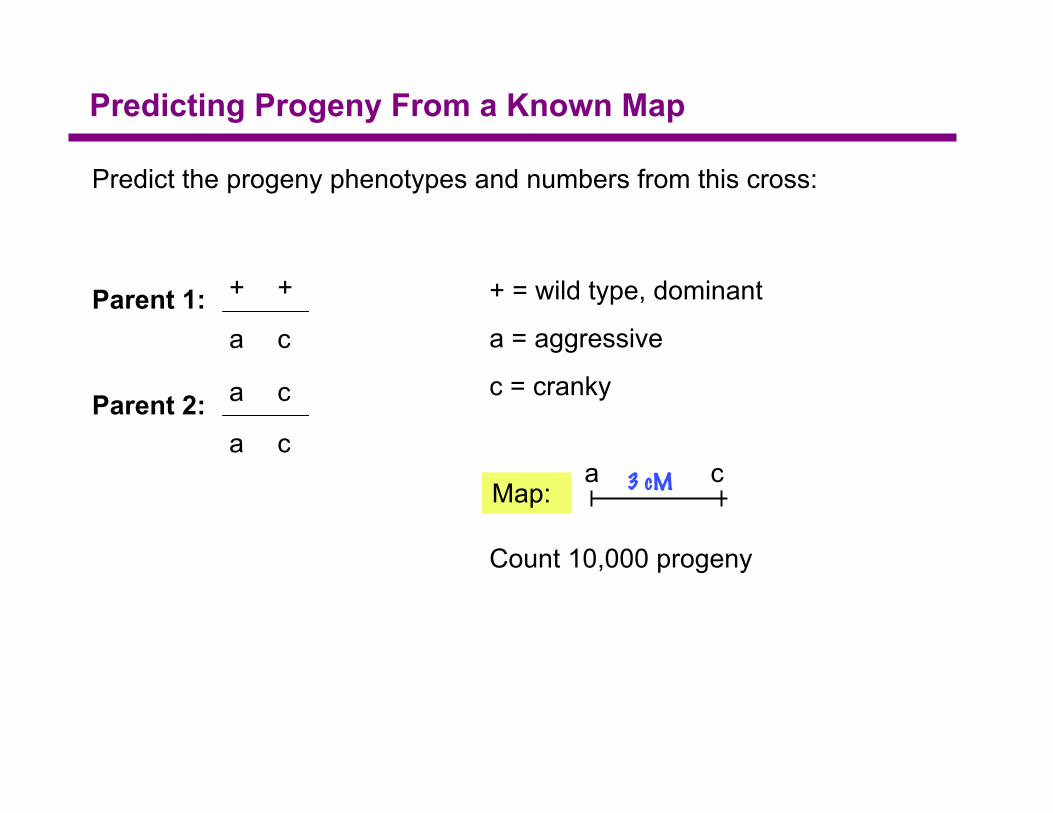
Predicting Progeny From a Known Map
Predict the progeny phenotypes and numbers from this cross:
Parent 1:
Parent 2:
+ + a
a c +
a c a
a c a
+ = wild type, dominant
a = aggressive
c = cranky
Map:a c a3 cM 7 cM
Count 10,000 progeny

Predicting Progeny From a Known Map
Predict the progeny phenotypes and numbers from this cross:
Parent 1:
Parent 2:
+ + a
a c +
a c a
a c a
+ = wild type, dominant
Map:a c a3 cM 7 cM
Predicted recombinantproducts in (a-c) = 3% = 0.03 x 10000 = 300
Count 10,000 progeny
Recombinant types =+ c
a +150 each
Parental types = + + and a c = 4850 each

Practice QuestionBrown seed pods (B) in a plant species is is dominant to green (b), and elongatedpods (E) is dominant over squished (e).
(a) A fully heterozygous plant has the dominant alleles linked in trans (i.e.,dominant alleles not on the same homologue) at a map distance of 20 cM. Whatwill be the genotypes of gametes produced by this plant, and in what frequencies(or percentages)?
(b) If this plant is self-pollinated, what progeny phenotypes will you expect to see,and in what frequencies? Use a Punnett square to illustrate your answer.
Heterozygote genotype =B e
b E
Recombinant gametes = B E and b e, 20% total = 10% each
Parental type gametes = B e and b E, 80% total = 40% each

Practice Question
0.4 Be 0.4 bE 0.1 BE 0.1 be
0.4 Be
0.4 bE
0.1 BE
0.1 be
gametes and frequencies
Be/Be0.16
bE/Be0.16
BE/Be0.04
be/Be0.04
Progenyphenotypes:
parental
non-parental
Be/bE0.16
bE/bE0.16
BE/bE0.04
be/bE0.04
Be/BE0.04
bE/BE0.04
BE/BE0.01
be/BE0.01
Be/be0.04
bE/be0.04
BE/be0.01
be/be0.01
BE0.51
Be0.24
bE0.24
be0.01

A map of the locations of polymorphic markers whereorder and distance is determined by recombination
frequency
A Genetic Map Is:
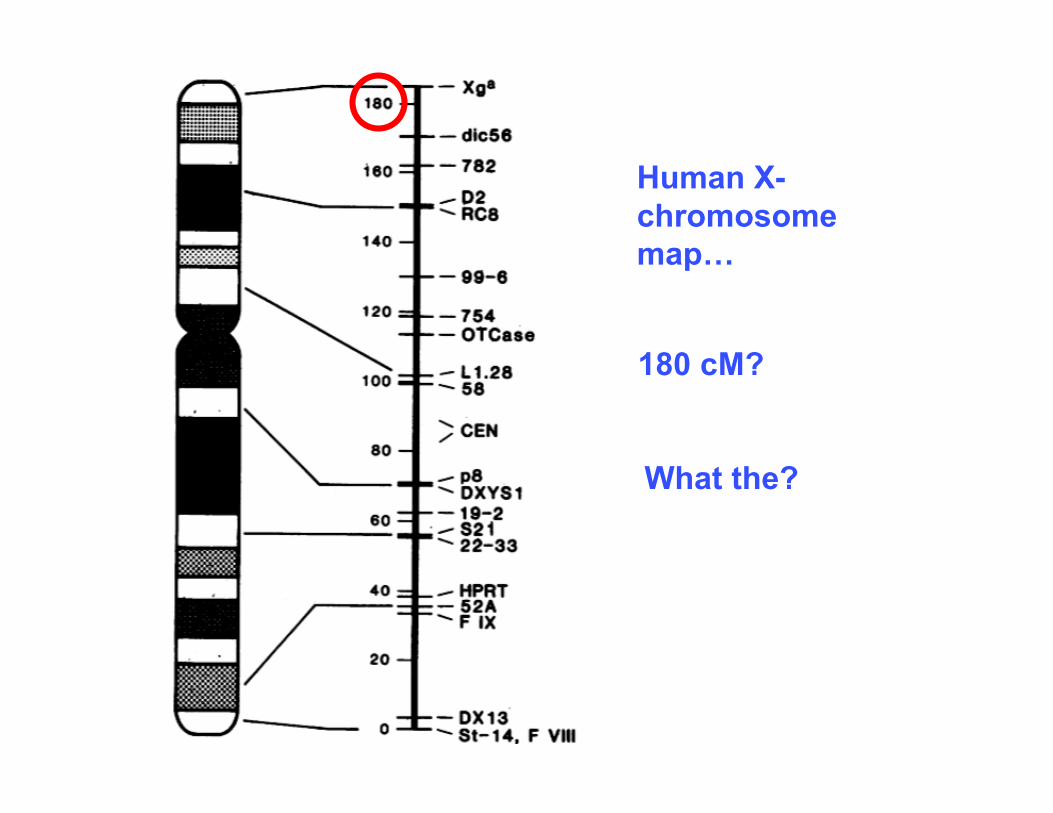
Human X-chromosomemap…
180 cM?
What the?

loci=plurallocus=singularthe location in thechromosome that is occupiedby alleles of a gene
Linkage Groups
Are the loci linked?
Linkage groups
How muchrecombination? → gene order and
map distance
Linkage group = group ofloci (genes) known to beassociated by linkage
1 linkage group,or 2? Just 1!

Physical Maps
• A map of the locations of identifiable landmarks in the genome
- many types of “landmarks” used

Low
High
Res
olut
ion
Cytogenetic (Chromosome) Map - Based on distinctive banding patternsobserved in stained chromosomes
cDNA Map - Locations of expressed DNA along the genome
Radiation Hybrid Map - Order of DNA markers (STS) that uniquelyoccur in the genome
Contig Map - Order of overlapping DNA fragments spanning thegenome
Restriction Map - Describes the order and distance between DNArestriction enzyme sites
Sequence Map - The complete DNA sequence of a genome
Types of Physical Maps

Physical Maps
• A map of the locations of identifiable landmarks in the genome
- many types of “landmarks” used
• Highest resolution physical map of a genome is its completeDNA sequence
• Primary distinction between genetic and physical map is theunits of distance:
Genetic map: recombination distance
Physical map: distanced measured in base pairs

Integrated Genetic and Physical Maps
DCA B
1 cM 1 cM 10 cM
genetic map (recombination)
physical map (DNA)
A B CD
- Order conserved between genetic and physical maps
~1 X bp ~1 X bp ~10 X bp
units = cM
units = bp
- Distance separating loci in genetic and physical maps is proportional

Integrated Genetic and Physical Map of the HumanX-Chromosome

Variation in Recombination Rates
Myers et al (2005) 310:321
Beyond the Basics

Linkage Analysis With MolecularMarkers

DNA Polymorphisms Are Genomic Landmarks
“Mile Markers” throughout the genome
if we can show that our trait is linked to a DNA polymorphism… we’dknow roughly where the gene is located!
We don’t know where the gene for our trait of interest lies, but…

DNA Polymorphisms… An Example
Sequencechromosome#3
5’..TCTTGATC..3’3’..AGAACTAG..5’
5’..TCTCGATC..3’3’..AGAGCTAG..5’
or
or
alleles at this locus(may not be coding for
anything!)
DM1T
DM1C
my names forthe alleles

DNA Marker Genotypes
Do a DNAtest for DM1
Supposeyou detectDM1T andDM1C
conclude?
Conclude:
One homologue had DM1T allele, onehomologue had DM1C allele…
this fly is heterozygous for this DNAmarker
..TCTTGATC..
..AGAACTAG....TCTCGATC....AGAGCTAG..
DM1T DM1C

How do we test for linkage in general?
What kind of a cross do we set up?
heterozygote x homozygous (recessive)

Testing for linkage
Step 1. Generate the heterozygous flies.
true-breeding red-eye
Genotype:
DNA test:DM1T only detected
pr+pr+
DM1T
DM1T
true-breeding purple-eyeDNA test:
DM1C only detectedprpr
DM1C
DM1Cx
pr+pr
DM1C
DM1Theterozygote!
When the heterozygote makes gametes… what wouldyou consider the parental types among these gametes?pr+ DM1T and pr DM1C
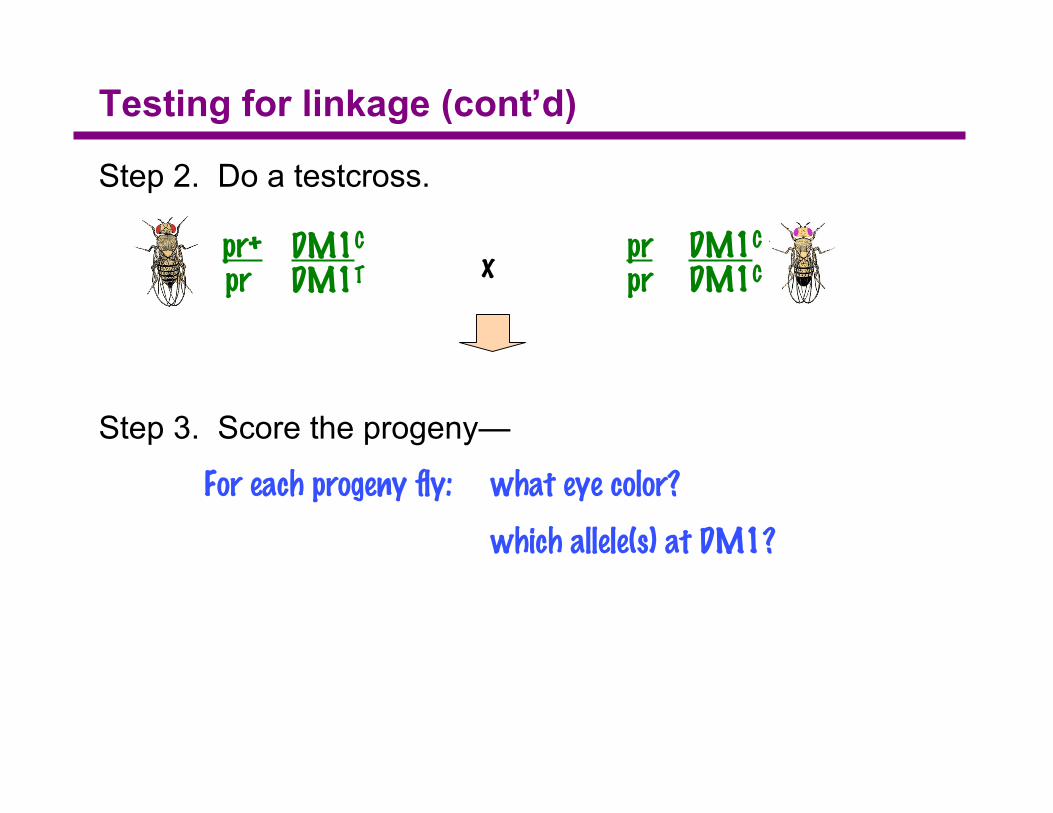
Testing for linkage (cont’d)
Step 2. Do a testcross.
pr+pr
DM1C
DM1Tprpr
DM1C
DM1Cx
Step 3. Score the progeny—
For each progeny fly: what eye color?
which allele(s) at DM1?

# of progeny
322
318
78
82
phenotype:
red, DM1T & DM1C
purple,DM1C & DM1C
red,DM1C & DM1C
purple,DM1T & DM1C
Sample results…
progenygenotype?
gamete? P/NP?
pr+pr
DM1C
DM1Tprpr
DM1C
DM1Cx
do lat
er

# of progeny
322
318
78
82
phenotype:
red, DM1T & DM1C
purple,DM1C & DM1C
red,DM1C & DM1C
purple,DM1T & DM1C
Sample results…
progenygenotype?
gamete? P/NP?
pr+ DM1T
pr DM1C
pr+ DM1C
pr DM1T
P
P
NP
NP
pr+pr
DM1C
DM1Tprpr
DM1C
DM1Cx
do lat
er

# of progeny
322
318
78
82
pr+pr
DM1T
DM1C
prpr
DM1C
DM1C
pr+pr
DM1C
DM1C
prpr
DM1T
DM1C
phenotype:
red, DM1T & DM1C
purple,DM1C & DM1C
red,DM1C & DM1C
purple,DM1T & DM1C
Sample results…
gamete? P/NP?
pr+ DM1T
pr DM1C
pr+ DM1C
pr DM1T
P
P
NP
NP
pr+pr
DM1C
DM1Tprpr
DM1C
DM1Cx
progenygenotype?

Testing for linkage (cont’d)
Step 4. Interpret the results.
Conclusion? The eye color gene is linked to the DM1 locus
Map distance =78 + 82
322 + 318 + 78 + 82= 20 cM
pr locus is somewherenear here!

Summary
Genes can be mapped relative to each other based onlinkage
Genes can also be mapped relative to known DNApositions (“DNA markers” or polymorphic sites) alongchromosomes
…and thus these DNA markers serve as landmarks toestablish the physical locations of genes in the genome

What’s the advantage of using DNAmarkers?
There are LOTS of them, throughoutthe genome!
Genetic Interactions
Genetic InteractionsGenome 371, 5 Feb 2010, Lecture 8
Epistasis

Genes Do Not Act In Isolation
Metabolic pathway Protein-Protein Network

A Digression into Human Blood Groups…
RBC
ABO blood type: determined by alleles of gene I
IA: enzyme that adds ‘A’ sugarA
IB: enzyme that adds ‘B’ sugarB
i: defective enzyme… no sugar addedIAi and IAIA: only ‘A’ sugar added → blood type AIBi and IBIB: only ‘B’ sugar added → blood type BIAIB: both sugars added → blood type ABii : no sugar added → blood type OIA and IB are co-dominant; both dominant to i
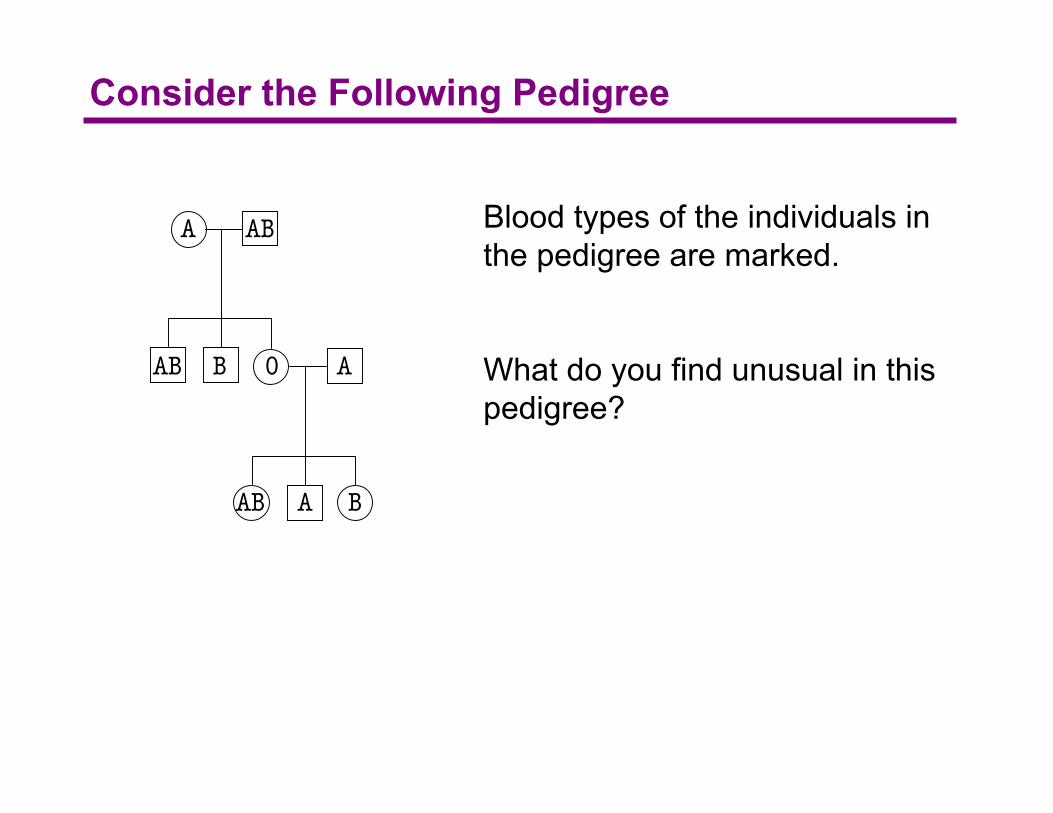
Consider the Following Pedigree
A AB
AB B O A
AB A B
Blood types of the individuals inthe pedigree are marked.
What do you find unusual in thispedigree?

Consider the Following Pedigree
A AB
AB B O A
AB A B
Blood types of the individuals inthe pedigree are marked.
What do you find unusual in thispedigree?
AO AB
AB BO AOOO

ABO Blood Groups… Some Extra Information
RBC
substance H
ABO blood type: determined by alleles of gene I
IA: enzyme that adds ‘A’ sugarA
IB: enzyme that adds ‘B’ sugarB
i: defective enzyme… no sugar added
H gene - enzyme that synthesizes the H substance
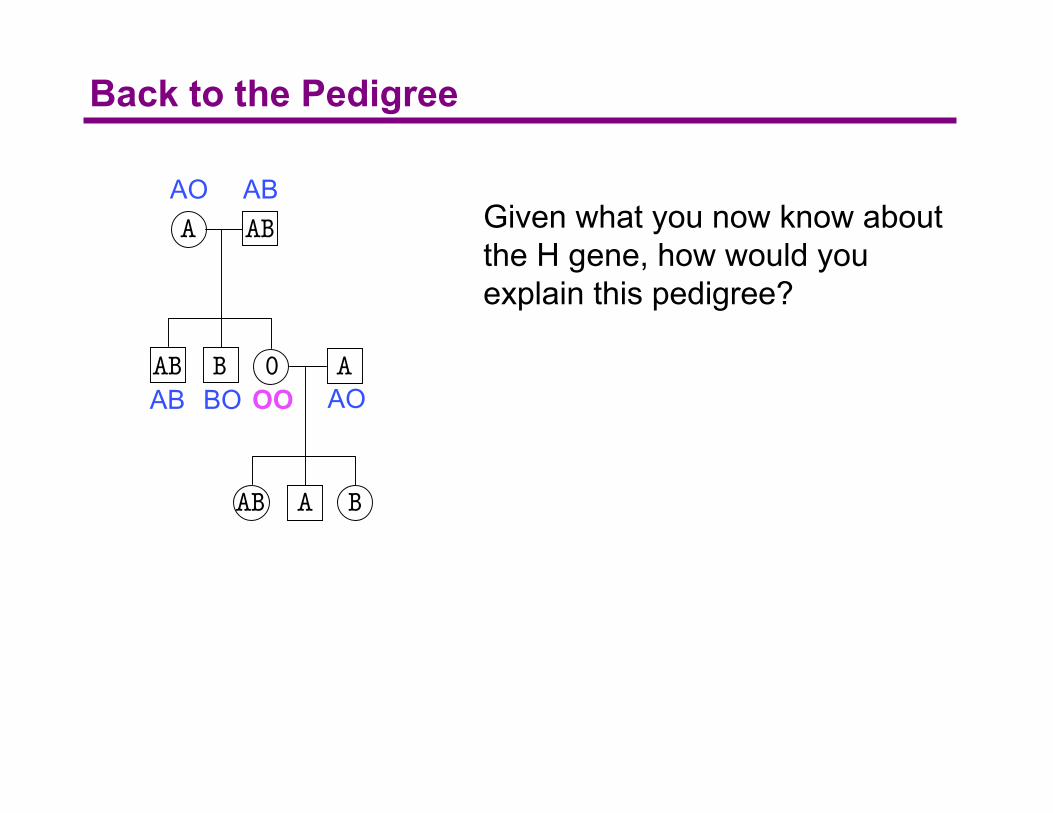
Back to the Pedigree
Given what you now know aboutthe H gene, how would youexplain this pedigree?
A AB
AB B O A
AB A B
AO AB
AB BO AOOO

Back to the Pedigree
A AB
AB B O A
AB A B
Given what you now know aboutthe H gene, how would youexplain this pedigree?
AO; Hh AB; Hh
AO;H-
-/-;hh
substance HH gene I gene A, B, AB, O
blood groups

Epistasis
The Bombay Phenotype is an example of epistasisThe effects of one gene modify the effects of a second gene
Epistasis is a form of gene interaction - the action oftwo or more genes in contributing to a phenotype
Genes H and I gene exhibit epistasis
The alleles that are masking the effect are called epistatic alleles
The alleles whose effect is being masked are called thehypostatic alleles

Summary
Epistasis describes the interaction of two (or more)genes
May lead to modified dihybrid ratios
Useful in inferring and ordering steps in a pathway