Embed Size (px)
Citation preview

Genetic Variation in Seedlings of Picea mariana (Mill.) BSP. I. Correlation with Ecological Factors
By E. K. MORGENSTERN')
(Received for publication May 10, 1968)
Introduction
Picea mariana, black spruce, is an interesting species of the boreal forests of North America. Its early evolution appears to be linked to the expansion of boreal elements from Alaska to the Atlantic Coast, following mountain building and development of continental climates during the cool Pliocene Epoch (HEER 1868, DORF 1960). The fossil record is younger and dates back to the Pleistocene Epoch, showing that the species was then widely distributed in central and eastern regions (LAMOTTE 1952, BRYAN 1954). The present range extends from Alaska southward to the Lake States, southern Ontario, New York and Pennsylva- nia, and eastward to the Atlantic (HEINSELMAN 1957). Throughout its boreal range black spruce is one of the most common species. It possesses great reproductive capacity by seed and layering, regenerates well after fires, is adapt- able to various soils and local climates, and is found in association with all other boreal species. Pure stands main- tain themselves only on shallow, poorly drained and cold soils where competitors are lacking (MILLAR 1936, LINTEAU
1955, ROWE 1959, Louc~s 1959-60, HORTON and LEES 1961, HEINSELMAN 1963, DAMMAN 1964, BAKUZIS and HANSEN 1965, VINCENT 1965). The large volumes of black spruce available and the high quality of its wood make this Canada's most important pulpwood species (BESLEY 1959, BASHAM and MORAWSICI 1964).
In recent years increased management of boreal forests has resulted in more artificial regeneration, a development which makes genetic studies more urgent. Particularly im- portant at this stage are studies of geographic variation to ensure that only well adapted populations are being estab- lished, and to test populatims for selection and breeding. Several field experiment with black spruce were established by HOLST (1962), but results from these are not yet avail- able. This paper presents the findings of more recent green- house and nursery experiments. In Part I an attempt is made to correlate physiological and morphological variation with ecological factors. Ecological factors, in controlling natural selection, are expected to influence some of the responses of this species to its environment. This influence is traditionally measured by correlation and regression but recently new methods have become available. One of these, principal component analysis, was employed here and simplified the recognition of the most important factors. In Part I I , a companion paper, the degree of subdivision of the species resulting from the combined effect of natural selection, mutation, recombination, migration and isolation is determined by a hierarchal analysis of variance showing differentiation at the level of populations, subpopulations, and half-sib families. Information on the variation of black
I ) Research Scientist, Department o f Fisheries and Forestry, Petawawa Forest Experiment Station, Chalk River, Ontario, Canada. Th i s paper i s based upon a dissertation for the degree o f Dr. rer. nat. submitted i n 1966 t o t h e Mathematisch-Naturwis- senschaftliche Fakultät, Universität Hamburg, Germany. T h e larger part o f t h e experimental work was performed at Institut für Forstgenetik und Forstpflanzenzüchtung, Bundesforschungsanstalt für Forst- und Holzwirtschaft, Schmaleiibcck, Germany.
spruce obtained in this way is important for the planning of further studies and basic for the development of breed- ing programs.
Ob jectives
The objectives of this study were to test two hypotheses concerning the genetic variation pattern of black spruce: 1. Genetic differentiation is mainly the result of natural
selection by continuous ecological factors such as regional temperatures and day length, leading to clinal variation.
2. Genetic differentiation is subject to discrete factors as well, such as local climate and soil moisture. The varia,- tion pattern is therefore clinal and ecotypic.
Methods
Seed Collection
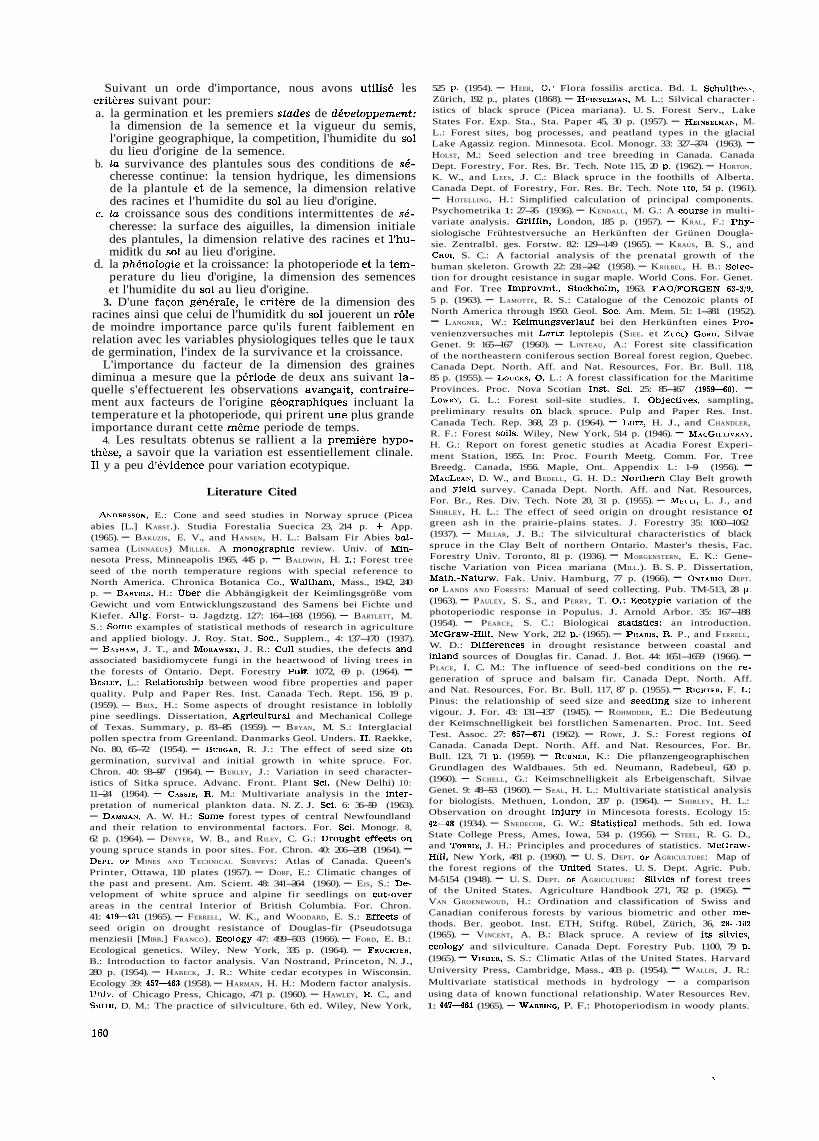
In September and October, 1963 seed was collected i n an area between 42 and 60 degrees o f N. latitude and 77 and 112 degrees o f W . longitude f r o m 9 forest regions, 24 stands, and 148 Single trees. Stands within regions were selected o n the basis o f 5 soil moisture regimes ranging f r o m moderately dry t o w e t (Fig. I - I , TabLe I - 1 ) . Collections i n Ontario included 21 o f the 24 stands and sampled that part o f each region where t h e greatest range o f soil moisture regimes and local climates could be found. B y concentrating each regional sample within a 20-kilometer radius, e f f ec t s o f clinal variation were greatly reduced, making i t possible i n t h e analysis
Figure I- 1 . - Map o f North America showing t h e range o f Picea mariana, black spruce (U. S. Dept. o f Agriculture 1965), and t h e origin o f the 9 seed populations that formed t h e basis o f this study.
t o attribute within-region variability largely t o ecotypic di f - ferentiation. Bu t this procedure m a y prohibit t h e extension o f in- ferences t o other regions (per. comm. from. Dr. D. M . BROWN, Biometrics Research Services, Department o f Fisheries and For- estry).
Collection i n Wisconsin was arranged b y Dr. H. NIENSTAEDT, U . S. Department o f Agriculture; i n Manitoba b y Mr. C. C. T HOMPSON, Department Fisheries and Forestry; and i n the Northwest Ter- ritories b y Mr. R. H. KENDALL, Department o f Inidian A f fa i r s and Northern Development.
In order t o obtain un i form seed for physiological experiments, collection was generally limited t o the 1963 crop and made i n a south-to-north sequence, i n conformity wi th t h e progression o f seed maturation (Ontario Dept. o f Lands and Forests 1963). All seed lots were extracted manually t o avoid selection o f d i f f e ren t

Table I-1. - Origin of seed. Populations correspond to regions, subpopulations to Stands. Regions are based upon Rowa (1959) and U. S. Dept. of Agriculture (1948). The soil moisture regimes recognized were: 1 - moderately dry; 2 - fresh; 3 - very fresh; 4 - moist; 5 - wet.
P o p u l a t i o n Subpopu la t ion S i n g l e t r e e s
P r o v i n c c L a t i t u d e Long i tude E l e v a t i o n S o i l Ground Vege ta t ion No. F o r e s t Region No. o r S t a t e ON "W m Mois tu re Land t y p e S t a n d t y p e t y p e Number
1 Deciduous 1 O n t a r i o 42'42' 80°20 ' 200 4 Swamp Thu ja o c c i d e n t a l i s Hypnum spp . 9 - D . 1 lowland P i c e a mar i ana Cornus c a n a d e n s i s
------------------------------------------------------------.----------------------------------------------.-----------------------------------------------------
G r e a t Lakes - 2 S t . Lawrcnce
-L .1 3
O n t a r i o
O n t a r i o
O n t a r i o
----------.
O n t a r i o
O n t a r i o
O n t a r i o
O n t a r i o
O n t a r i o
Swamp lowland S wamp lowland Swamp lowland
P i c e a mar i ana P i c e a g l a u c a Thuja o c c i d e n t a l i s P i c e a mar i ana Thu ja o c c i d e n t a l i s P i c e a mar i ana
Hypnum s p p . L innaea b o r e a l i s Hypnum s p p . Graminae Hypnum s p p . C o p t i s g r o e n l a n d i c a
. . . . . . . . . . . . . . . . . . . . . . . . . . .
Grea t Lakes - 5 S t . Lawrence
-L.4c 6
7
8
9
S andy h i l l s Bog - up land b o r d e r Creek v a l l e y S wamp lowland Bog lowland
P i c e e mar i ana P i c e a g l a u c a P i c e a mar i ana L a r i x l a r i c i n a P i c e a mar i ana L a r i x l a r i c i n a P i c e a mar i ana L a r i x l a r i c i n a P i c e a mar i ana
Vaccinium s p p . Comptonia p e r e g r i n a Vaccinium spp . Sphagnum s p p . Sphagnum s p p . Hypnum spp . Alnus rugosa Sphagnum s p p . Ledum groenlandicum Sphagnum s p p .
Borea l
------.-----.
O n t a r i o
O n t a r i o
O n t a r i o
O n t a r i o
O n t a r i o
. - - . - - - - - - - . .
Bog P i c e a mar i ana lowland Bog P i c e a mar i ana lowland S andy P i n u s banks iana h i l l s P i c e a mar i ana S andy P inus banks i a n a p l a i n P i c e a mar i ana Bog - up land P i c e a mar i ana borde r P i n u s banks i a n a
Sphagnum s p p . Hypnum s p p . Sphagnum s p p . G a u l t h e r i a h i s p i d u l a Vaccinium spp . Cornus c a n a d e n s i s P leu roz ium s c h r e b e r i Ledum groenlandicum P leu roz ium s c h r e b e r i Sphagnum spp . .--------------------------.
Borea 1 15 -B.4
16
O n t a r i o
O n t a r i o
O n t a r i o
O n t a r i o
O n t a r i o
. - - - - - - - - - - -
Sandy p l a i n S andy s l o p e Loamy h i l l s Bog lowland Bog lowland
P i c e a mar i ana P i n u s banks i a n a P i c e a mar i ana Be tu la p a p y r i f e r a Abies balsamea P i c e a mar i ana P i c e a mar i ana
Vaccinium myrt i l l o i d e s Oryzops i s a s p e r i f o l i a P leu roz ium s c h r e b e r i Ledum groenlandicum Alnus rugosa Cornus canadens i s Sphagnum spp . Alnus rugosa Ledum groenlandicum Sphagnum spp .
P i c e a mar i ana
6 Borea l 20 O n t a r i o 51'16' 80'46' 50 4 R ive r P i c e a mar i ana Sphagnum s p p . 6 -B.5 s h o r e L a r i x l a r i c i n a Ca lamagros t i s s p .
21 O n t a r i o 51°06 ' 80'52' 50 3 R ive r P i c e a mar i ana Hypnum spp . 6 t c r r a c e P leu roz ium s c h r e b e r i
. . . . . . . . . . . . . . . . . . . . . . . . . . . . . . . . . . . . . . . . . . . . . . . . . . . . . . . . . . . . . . . . . . . . . . . . . . . . . . . . . . . . . . . . . . . . . . . . . . . . . . . . . . . . . . . . . . . . . . . . . . . . . . . . . . . . . . . . . . . . . . . . . . . . . . . . . . . . . . . . .
7 Nor the rn 22 Wiscons in 45'25' 88'40' 400 4 Swamp P i c e a mar i ana Not de te rmined 9 lowland Abies balsamea
. . . . . . . . . . . . . . . . . . . . . . . . . . . . . . . . . . . . . . . . . . . . . . . . . . . . . . . . . . . . . . . . . . . . . . . . . . . . . . . . . . . . . . . . . . . . . . . . . . . . . . . . . . . . . . . . . . . . . . . . . . . . . . . . . . . . . . . . . . . . . . . . . . . . . . . . . . . . . . . . .
8 Borea l 23 Manitoba 51'53' 100'51' 800 3 Moraine P i c e a mar i ana P leu roz ium s c h r e b e r i 7 -B. 18a P i c e a g l a u c a Hylocomium s p l e n d e n s
-----. -----------------------------------------------------------------------------------------------------------------------------------------------------------
9 Borea l 24 Northwest 60'03' 112'46' 2 50 2 Not known P i c e a mar i ana Not de te rmined 6 -B.23a T e r r i - L a r i x l a r i c i n a
t o r i e s
portions of the seed populations by sieves and air currents (MAC- GILLIVRAY 1956).
of seed from 4 trees. This experiment was begun in De- cember, 1963. Empty seeds were removed by flotation in absolute ethyl alcohol. From the full seeds, lots of 50 each were stratified by placing them on moist fungicide-treated absorbent paper in Petri dishes at 2O C for 3 weeks. A randomized block layout with 8 replications was generally used, containing 118 plots in the first and fewer plots in the last replications as a result of the small seedlots from southern regions. Following stratification the seeds in each dish were sown into a sand-humus mixture in a plastic pot and placed into a greenhouse. Here each pot represent- ed a plot in a randomized block layout, with blocks arrang- ed to reduce the effects of variation in light and tempera- ture. Soil temperatures at seed level averaged 10° C during nights and 16O C at day time. Illumination with artificial light of 4500 lux intensity extended the photoperiod to 20 hours. Germination began 10 days after sowing and was recorded every second day until the 24th day, and again on the 31st day when survival of the germinant seedlings was also noted. Hypocotyl length and cotyledon number were subsequently determined. The long-day treatment
Experimental Program
Four experiments were conducted, each investigating a different stage in seedling development. Following an estimate of the total amount of seed available per single- tree collection and the weighing of 1000 seeds from each, the seed material was allotted to the four experiments. This involved considerations of greenhouse and nursery space and the particular purpose of each experiment. Choice of single-tree seedlots was at random with the restriction that large lots contained enough seed for all experiments but small lots for only one or two. Experiment No. 1 : - Germination and early development in a greenhouse at the Petawawa Forest Experiment Sta- tion, latitude 46O N, longitude 77O W.
Seed from all 9 regions was included in this experiment: 115 single-tree collections from the 6 regions in Ontario plus 3 stand collections, one from each of the 3 western regions; each stand collection consisted of equal amounts

was concluded in August and the experiment terminated with a height measurement in October, 1964. Experiment No. 2: - Survival of six-weeks-old seedlings under continuous drought conditions in a greenhouse at Institut für Forstgenetik in Schmalenbeck, Germany, lati- tude 54O N, longitude 10° E.
This experiment was concerned with the central regions only where the species occupies a wide range of sites. Thirty-seven single-tree progenies from 5 moisture regimes in regions B.4 and B.7 (Table I-I), were germinated in July, 1964. They were then planted at a regular spacing into trays according to a standard randomized block design with 6 replications, 20 seedlings constituting a plot, with 37 plots per block. After hardening for one month in the Open, 4 replications were taken back into the greenhouse and kept dry to induce drought conditions. Survival was noted every second day in the initial and every day in the final stages of the test until all plants had died. The trays were weighed on the Same days. The remaining 2 replications, kept outside, were then harvested, root and shoot lengths measured, dried at 104O C and weighed. The data obtained from these 2 replications were used for correlation with this and the following experiment. Experiment No. 3: - Dry-matter production of first-year seedlings under intermittent drought conditions in a green- house at Institut für Forstgenetik in Schmalenbeck.
Plants of the Same origin as in Experiment No. 2 with 4 replications, 18 plants per plot, and 37 plots per block were tested in a randomized block design during the period October 15, 1964 to March 30, 1965. Three drought periods were induced by omitting watering until needle mortality occurred, each drought treatment taking about six weeks for completion. The trays were then re-watered by insert- ing them into plastic tubs to attain a uniform moisture con- tent approximating field capacity (LUTZ and CHANDLER 1946, p. 316). Greenhouse temperatures ranged from 10° to 30° C. Artificial illumination at an intensity of 450 lux during nights was necessary to weaken the tendency for terminal bud formation and growth cessation. After each drought period a measurement of shoot lenghts was made and the number of plants with terminal buds was counted. Follow- ing the last drought period, shoot and root lengths, and dry weights were determined. Experiment No. 4. - Phenology and growth of first and second-year seedlings in the nursery at Institut für Forst- genetik in Schmalenbeck.
In May, 1964 seed from 121 single trees in all 9 regions was sown on ~eedle-litter seedbeds in a modified lattice design with 4 replications. Plots consisted of plant rows 1.2 meters long, 11 centimeters apart, and were numbered in sequence to avoid bias owing to original collection num- bers. Plots were not arranged by rows and columns but side by side; a complete replication thus required about 13.2 meters of seedbed length. Sowing was aimed at keep- ing density low to avoid competition over the two-year testing period. Within each plot, about 25-100 seeds were sown and 20 seedlings were marked at random with plastic rings for observation and measurement. Germination and growth were satisfactory. Growth initiation occurred much earlier and cessation later than in native habitats, in re- sponse to the longer growing season of North Germany. Over the range of provenances this required long observa- tion periods. In August, 1964 the percentage of seedlings with proleptic shoots was determined, including those with shoot extension from both terminal and lateral buds. From August 29th to November 25th, 1964 the number of seed-
lings with visible terminal buds was counted at two-day intervals as an indicator of the cessation of height growth. From April 21st, 1965 to May 29th, 1965 the number of seedlings with bursting buds was counted at two-day in- tervals to measure initiation of height growth, and frorii July 20th to November 15th the number of terminal buds was again recorded as in 1964. Height measurements con- cluded this experiment.
Analysis Experimental results were computed on the basis of plot
and progeny means using methods that would lead to ap- proximately normal distributions. Germination and sur- vival rates were calculated as the rate index devised by BARTLETT (1937) and percentage values transformed by arcsin. A test of normality (SNEDECOR 1956, P. 201) applied in one doubtful case showed that after transformation there was no detectable departure from normality in the distribution. For the calculation of missing values a randomized blocl; layout was assumed for all experiments and the procedure then followed was that of STEEL and TORRIE (1960).
For correlation with ecological factors, climatic data were obtained from the Climatic Atlas of the United States (VISHBR 1954) and the Atlas of Canada (Dept. of Mines and Technical Surveys 1957). Day length values were taken from WITHROW (1959). These data, and soil moisture regime, although only approximately normal, were not transform- ed. The results thus obtained are approximations and apply particularly to the sample included in this study.
The data were analysed by correlation, simple and multiple regression, and principal component analyses (MORGENSTERN 1966). The correlation and principal compo- nent analyses summarized the data in the simplest manner and only these will therefore be given in this Paper. Cor- relation analysis is a standard procedure and requires no explanation. The mathematical basis of principal com- ponent analysis is gWen by HOTELLING (1936), HARMAN (19601, KENDALL (1957)) and SEAL (1964) while biological applica- tions with detailed explanations of the procedure are of- fered by FRUCHTER (1954), KRAUS and CHOI (1958), WILLIAMSON (1961)) CASSIE (1963)) PEARCE (1965), and VAN GROENEWOUD
(1965). Only a brief non-mathematical outline will be given here to explain the terms used in the discussion.
The problem to be dealt with is as follows: A set of variates has been observed on each of a number of trees and the matrix of correlation coefficients between all variates has been calculated. In contrast to regression, all variates are considered equal and no distinction between dependent and independent variates is made. The analysis then aims to examine the relationship among the variates, to look for components in order to reduce the dimension of variation, and, if possible, to interpret the components found in terms of real physical or biological factors (KEN- DALL 1957).
The computations begin with the formation of the char- acteristic equation of the Square matrix of correlatim coef- ficients by substracting from the diagonal, i. e. the ones, a value designated as A, which is chosen so that the deter- minant of the new equation is equal to Zero. The various A's are called eigenvalues, characteristic roots, or latent roots. The numerical solution of the equation for these is much facilitated by the use of a computer. These eigen- values are found in descending ordr-r of magnitude, Al > L, > L, etc. The sum of all eigenvalues is equal to the number of varieties in the correlation matrix. Each eigen- value has an eigenvector associated with it.
What has been done mathernatically is to find the linear

function which has the largest variance, then the linear function orthogonal i. e. uncorrelated with the first, again with the largest variance, and so On. In geometrical terms. axes are fitted to a series of points in multidimensional space, first finding the longest axis of the appropriate el- lipsoid, then the longest axis which is at right angles to the first, etc. The length of each axis is indicated by its eigenvalue and the direction of that axis by the correspond- ing eigenvector. Eigenvalues indicate the percentage of total variance accounted for by individual axes.
In Summary, what the analysis accomplishes is a trans- formation of the old correlated variates into new variates or components (i. e. linear combinations of old variates) which are uncorrelated, and independent, if based on an underlying normal multivariate distribution. This usually results in a great reduction in the dimension of variation. For example, a set of 10 variates requiring a 10-dimensional space initially may be reduced to 2-4 dimensions account- ing for the most essential part of total variation. But whether the axes representing the components are merely convenient mathematical artefacts or have a physical or biological meaning, remains to be Seen. The investigator's familiarity with his subject is essential for an interpreta- tion of the components (KENDALL 1957, WALLIS 1965).
In this study the analysis was performed on the TR4 computer of the Universität Hamburg, Germany. The pro- gram was written in the Algol language and utilized the JACOBI method of matrix diagonalization (WHITE 1958). The analysis included several features of factor analysis by printing factor loadings (WALLIS 1965) instead of eigen- vector coefficients and by continuing with a varimax rotation (HARMAN 1960) after a standard principal compo- nent analysis. Significantly, the interpretation of the com- ponents before and after rotation was the Same, and their order was also the Same except in one case. But rotation had simplified the factor loadings by concentrating load- ings more strongly on some variables, thus making the interpretation easier. The results from the rotated axes will therefore be given in this Paper. - Although principal component and factor analysis are based upon different mathematical models, they can be usefully applied in suc- cession (KENDALL 1957, SEAL 1964E aS in this case. For simplicity the present analysis will be termed principal component analysis which conforms with the description of the computer program.
Results and Discussion
Experiment No. I : - Germination und Early Development The correlation analysis (Table 1-2) showed that both
germination rate and germination percent increased with
seed weight and latitude but decreased with increasing so11 moisture regime of the place of seed origin. Survival per- cent increased with latitude and decreased with soil mois- ture. Cotyledon number and hypocotyl length increasecl with seed weight and decreased with latitude. The height of the ten-months-old seedlings decreased with a higher germination percent.
Although many of the correlations are temptingly sug- gestive and known from other experiments (WRIGIIT and BULL 1962, BURGAR 1964, BURLEY 1964, ANDERSSON 1965), no cause-and-effect relationship can be derived from them. Because correlation is strictly an association analysis (STEEL and TORRIE 1960), conclusions will be based upon the principal component analysis which is more reliable.
The results of the principal component analysis are shown in Table I-3. Here results were grouped on the basis of the principal axes about which the variance is maximum, and the eigenvalues refer to the sum of Squares of loadings for each axis. The three highest loadings have been under- lined and will be used to identify the component. Compo- nents will be termed factors in recognition of the purposes of this study.
The highest loadings for the first four axes were as follows: Axis 1: cytoledon number, hypocotyl length, seed weight; Axis 2: germination rate, survival percent, soil moisture
regime ; Axis 3: hypocotyl length, latitude, longitude; Axis 4: germination rate, germination percent, ten-months
height.
It is clear that Axis 1 involved a morphological relation- ship, namely size, and the underlying factor was designatecl as seed size. The importance of seed size and weight for germination and early growth is known at least since Pro- fessor BÜHLER'S studies in 1891 (BALDWIN 1942). That the number of cotyledons and hypocotyl length depend upon seed size or weight has already been shown by BARTELS (1956), MACGILLIVRAY (1956), and YEATMAN (1966 a, 1966 b).
Axis 2 involved mainly physiological relationships and the underlying factor was termed vigour. The negative loading for soil moisture regime confirmed the dependence of germination rate and survival percent upon soil mois- ture: germination rate and survival percent decreased with increasing soil moisture, measured by soil moisture regime of the locality of origin. This result parallels the findings of MACLEAN and BEDELL (1955) who have shown that in natural stands of black spruce dominant heights decrease from the moist through the wet to the very wet sites. Similarly, HORTON and LEES (1961) and LOWRY (1964) in- dicated that heights decrease from fresh to wet sites, in consequence of higher water tables and thicker humus
Table 1-2. - Correlation coefficients of Experiment No. 1 based upon pooled data from 115 single-tree progenies and 3 stands in Populations 1 to 9.')
- Variables XI "2 X4 X6 X7 X8 X9 X1O
Germination rate +1.00 +0.59*** +0.53*** +0.01 +0.31** - 0.15 +0.33*** -0.27** +0.25* -i-0.07 X2 Germination percent 4-1.00 +0.13 +0.01 +0.27** -0.40*** +0.26** -0.19* +0.19* +O.OO X3 Survival percent i-1.00 -0.24** - 0.11 i-0.12 - 0.05 -0.27** +0.21* +0.07 X4 Cotyledon number +1.00 +0.62*** 4 . 0 8 +0.62*** 4 . 0 1 4 . 4 4 * * * -0.25** X5 Hypocotyl length +1.00 - 0.01 +0.63*** - 0.01 4 . 5 2 * * * -0.27** X6 Ten-months height +1.00 - 0.15 i-0.04 - 0.08 +0.08 X7 Seed weight +1.00 - 0.09 -0.25** - 0.12 X8 Soil moisture regime +L00 - 4.14 - 0.09 X9 Latitude N +1.00 -1-0.62***
X1O Longitude W +1.00
Sipificance levels in all correlation tables: *, 5O/o; **, 1°/o; ***, 0.l'Vo.

..ole 1-3: - Results of the principal component analysis of Experiment No. 1. The three highest loadings for each axis have been marked to identify the underlying factor. Axis 5, with an eigen- value smaller than 1, was not printed after varimax rotation and is here given from the earlier
standard analysis.
Axis 1 2 3 5 Eigenvalue 2.45 1.93 1.60 1.5; 1 0.84 Percent of total variance 25 19 16 15 8
Variables I Loadings
Germination rate
Germination percent
Survival percent
Cotyledon number
Hypocotyl length
Ten-months height
Seed weight
Soil moisture regime
Latitude N
Longitude W
layers on the moist and wet sites. The studies of WEETMAN (1962) suggest that nitrogen is more easily available on the drier sites, largely as a result of more favourable tem- peratures for humus decomposition. YOUNGBERG (1952) has shown that soil fertility influences seed composition, i. e. the content of nitrogen, phosphorus, potassium and mag- nesium, and that large differences in germination percent exist between seed grown on fertile and infertile soils. Other causes of variation such as seed age and maturity (LANGNER 1960, SCHELL 1960, ROHMEDER 1962) were eliminated or their magnitude reduced by the collection procedure and stratification applied in this study. Beyond these environ- mental causes for differences in early vigour, there are those of genetic origin, praticularly inbreeding (RIGHTEII 1945).
Next, axis 3 was mainly characterized by large loadings for the variables longitude and latitude and it was there- fore most closely related to the factor geographic origin. Hypocotyl length and cotyledon number were also linked to this axis, and negative values indicated that they de- creased with higher latitudes, but the loadings were too small to be of much significance.
Finally, axis 4 carried large loadings for the variables germination percent and ten-months height. Here thc tallest plots were those with the smallest number of ger-
minating seeds and the underlying factor was therefore designated as competition.
All four axes together accounted for 75 percent of the total variance. A fifth axis, calculated prior to rotation, was related to soil moisture of the place of origin and added 8 percent to total variance.
Soil moisture
Seed Vigour Geographic Factor interpretation 1 size 1 origin
Experiment No. 2: - Survival under Continuous Drought Conditions
Competition
The correlation analysis (Table I - 4 ) showed that survival was significantly related to lengths and dry weights of roots and shoots, to seed weight, and to water loss of the trays in which the plants were growing.
The principal component analysis (Table I-5) revealed that the first five axes were most closely related to factors interpreted here as water stress, plant size, relative root size, seed size and soil moisture of the place of seed origin.
The factor water stress ranked first in importance as shown by the large loadings for survival.
Plant size and seed size were secondary factors. Althougli the axes with which they were associated accounted for nearly the Same amount of total variance as the first factor, loadings for the survival criteria were smaller. Observa- tions and the data indicated that plant size played a role because larger plants were capable of drawing water from
Table 1-4. - Correlation coefficients of Experiment No. 2 based upon 37 single-tree progenies from each of 5 soil mois- ture regimes in Populations 4 and 5.
Variables X1 X2 X3 X4 X5 X6 X7 X8 X9 XIO
X1 Survival: Bartlett Index X2 Survival: days to 50 percent X3 Root dry weight X4 Shoot dry weight X5 Root length "6 Shoot length X7 Shoot-root ratio, dry-weight "8 Seed weight X9 Soil moisture regime X10 Percent water loss of trays

Shoot-root ratio, dry-weight 4-0.07 + 0.03 + 0.98 + 0.00 -0.04
Seed weight -0.29 +0.39 -0.01 +0.87 + 0.04 Soil moisture regime +0.05 -0.06 -0.01 +0.03 +0.99
-
Percent water loss of trays -0.93 +0.31 --0.09 +0.09 -0.00
Table I-5. - Results of the principal component analysis of Experiment No. 2.
Axis 1 2 3 4 5 Eigenvalue 3.14 2.87 1.37 1.09 1.05 Percent of total variance 3 1 29 14 11 10
Variables
moister and deeper soil layers than smaller plants. These larger plants were more vigorous than the smaller plants; they were not initially larger than the rest. This is so be- cause seed size, determining initial plant size, was ex- tracted separately.
The factors relative root size and soil moisture of the place of seed origin were not important for survival.
The five axes mentioned accounted for 95 percent of total variance in this experiment.
Loadings
Factor interpretation 1 Water 1 ztz:t 1 Relative 1 Sekt
stress root size (Vigour)
Experiment No. 3: - Dra-matter Production under Inter- mittent Drought Conditions
Survival: Bartlett Index -0.87 +0.33 -0.07 +0.24 -0.09 -
Survival: days to 50 percent -0.94 + 0.29 -0.09 + 0.12 -0.05 -
Root dry weight -0.43 $0.77 -0.27 +0.32 -0.04 - - -
Shoot dry weight -0.40 4-0.81 + 0.15 +0.36 -0.06
Root length -0.34 + 0.64 -0.54 + 0.08 -0.19 -
Shoot length -0.29 4-0.88 +- 0.06 +0.13 -0.05
Soil moisture
The correlation analysis (Table I-6) showed that total dry weight after the third drought period was positively correlated with shoot length at the various drought periods, with total dry weight at the beginnins of the experiment, with seed weight. Total dry weight and shoot dry weight were negatively correlated with terminal bud percent, i. e. the lighter plants were often those which had stopped growing earlier. The correlations with soil moisture regime were usually negative and not significant.
The principal component analysis (Table 1-7) gave load- ings for the first four axes and these were interpreted as
being most closely related to needle surface, initial plant size, relative root size, and soil moisture of the place of seed origin.
Needle surface, here suggested by large loadings for shoot length at the three experimental stages, was the most important factor and clearly linked with total dry weight. The role of the assimilating leaf or crown surface in deter- mining growth is well known from silvicultural studies (HAWLEY and SMITH 1954). Initial plant size was next and this factor was again closely related to total dry weight. Relative root size, based upon shoot-root ratio, was in third position and affected total dry weight after the third drought period to a lesser degree.
Soil moisture of the place of seed origin was in the last position and not related to the growth criteria of this ex- periment.
The combined variance from these four axes was 86 per- cent of total. The analysis has indicated factors similar to those in Experiment No. 2.
Experiment No. 4: - Phenology and Growth
The correlation analysis (Table I-8) showed that there were very highly significant correlations between the date
Table I-6. - Correlation coefficients of Experiment No. 3 based upon 37 single-tree progenies from each of 5 moisture regimes in Populations 4 and 5. Numbers in parentheses refer to measurements in the following stages of the experiment: (0) - before first drought period; (1) - after first drought period; (2) - after second drought period; and (3) - after third drought period.
Variables XI X2 X4 X5 X6 X7 "8 XIO "11 "12 X13
Total dry weight (3) +1.00 +0.99*** +0.93*** "2 Shoot dry weight (3) + 1.00 +0.86*** X3 Root dry weight (3) + 1.00 "4 Shoot-root ratio (3) X5 Terminal bud percent (3) X6 Terminal bud percent (2) X7 Shoot length (3) X8 Shoot length (2) X9 Shoot length (1)
X1O Total dry weight (0) Xll Shoot length (0) X12 Seed weight X13 Soil moisture regime

periment No. 3. Table I-7. - Results of the principal component analysis of Ex-
Axis 1 2 3 4 Eigenvalue 4.68 3.49 2.03 1.07 Percent of total variance 36 27 16 8
Shoot dry weight (3) + 0.76 -0.57 +0.21 -0.09
Variables
Root dry weight (3) +0.71 -0.62 -0.22 -0.03
Loadings
Total dry weight (3) f 0 . 7 6 -0.60 +0.08 -0.07
of the last spring frost and growth initiation, day length and growth cessation, and degree-days and height growth.
Shoot-root ratio (3) +0.05 +0.13 f 0 . 8 3 -0.14 - -
Terminal bud percent (3) -0.49 - 0 . 1 0 -0.76 -0.10 .-P
Terminal bud percent (2) + 0.43 + 0.17 -0.70 4- 0.09
Shoot lerigth (3) -I-0.85 -0.35 +0.33 -0.02
Shoot length (2) 4-0.85 -0.38 + 0.08 -0.06 -
Shoot length (1) t-0.91 -0.28 -0.03 -0.20 -
Total dry weight (0) i-0.33 -0.89 -0.09 -0.08 -
Shoot length (0) $0.28 -0.81 +0.08 -0.09
Seed weight +0.34 -0.75 -0.17 +0.11 -
Soil moisture regime -0.12 +0.01 -0.11 +0.98 -
Most of the climatic variables were correlated with each other as well as with latitude and longitude. Growth in- itiation, growth cessation, and height growth were also cor-
Factor interpretation
related with soil moisture regime, but only 6 percent of total variance could be explained by this factor as indicated by the coefficient of determination.
The principal component analysis (Table I - 9 ) suggested that the first three axes were most closely related to the factors day length, temperature, and seed size.
Day length ranked first because of the large loadings for day length, longitude and latitude. The physiological re- sponses consistently coupled with this factor were growth cessation and duration of growth. That growth cessation largely depends upon day length is in agreement with the findings of other investigators (WAREING 1956).
Temperature, or temperature timing, was next as shown
Needle surface
by the loadings for date of last spring frost, lengths of grow- ing and frost-free seasons, and degree-days. The best tie here was with growth initiation. The close relationship be-
Initial
plant size
Relative root size
tween growth initiation in the spring and temperature has
Soil mois- ture
been reported from many species (PAULEY and PERRY 1954, RUBNER 1960).
Seed size was last and related to prolepsis and height growth.
The total variance associated with the first three axes amounted to 85 percent. Another 5 percent were contribut- ed by the fourth non-rotated axis which was related to soil moisture of the place of seed origin.
General Discussion
The physiological response and morphological characters of black spruce in experiments dealing with germination, drought resistance, growth and phenology were well cor- related with population characteristics such as seed weight, with the test environment, and with native habitats. Prin-

Table I-9. - Results of the principal component analysis of Experiment No. 4. Axis 4 is from the earlier standard analysis, i. e. before varimax rotation.
Prolepsis, Ist year
Axis 1 2 4 Eigenvalue 7.08 5.05 1.38 Percent of total variance 44 32
Growth cessation, Ist year
Growth initiation, 2nd year
Growth cessation, 2nd year
Variables
Duration of growth, 2nd year
Loadings
Height growth until 2nd year
Seed weight
Soil moisture regime
Latitude N
Longitude W
Mean date of last spring frost
Length of growing season (days above + 6O C)
Length of frost-free season
Degree-days above + 6O C
Day length June 21st
Weekly reduction of day length, June 21st to September 21st
Factor interpretation Temperature Seed Soil 1 length 1 1 size 1 moisture
cipal component analysis proved useful in extracting the most important factors from the numerous correlations.
Several properties of principal component analysis must be considered before evaluating the results. It is clear that component analysis explores only the linear relationships, depends upon the method of sampling, the sample size, and the accuracy of experiments. The variance associated with each axis in this analysis made it possible to rank the proposed underlying factors, but the factors found may depend upon the variables initially chosen for measure- ment in each experiment (WALLIS 1965). The eigenvalues and variances contributed by each axis are therefore com- parable mainly within the Same experiment and analysis, constituting a relative scale to measure the effect of the proposed underlying factors in that analysis. In a final evaluation of the main factors, i. e. those of greatest re- levance to the hypotheses being tested, it is therefore best to consider both the contribution to total variance and the loadings for morphological and physiological variables (Tables I-10) .
Soil moisture of origin ranked last in all four experi- ments. The axes most closely related to this factor, i. e. the fourth or fifth axis in each analysis, contributed from 5 to 10 percent of total variance. The loadings for phy- siological and morphological variables were small and ranged from 0.02 to 0.31. This is a factor of minor import- ance.
This result is confirmed by evidence from other sources. It is obvious that adaptation to soil moisture and the development of drought resistance are not isolated proces- Ses, but depend upon a number of interacting factors in the total environment. Intense selection of drought resistant genotypes would probably take place in the year of ger-
mination when soil moisture is most critical (PLACE 1955, EIS 1965), but at that stage seed size and seedling vigour are still major factors. As the germination experiment in- dicated, seedlings of seed from dry and fresh sites were more vigorous than those fmm moist and wet sites, pos- sibly due to the greater availability of nitrogen at drier locations discussed by WEETMAN (1962). Some moist and wet sites, on the other hand, may develop drought condi- tions because trees growing there have a shallow root system and may not reach the water table lowered in a dry season (SHIRLEY 1934, DENYER and RILEY 1964). As a re-
Table I-10. - Summary of main factors showing contributions t@ total variance, and range of loadings for morpholocial and phy- siological variables. Loadings are giver, in absolute values, i. e.
neglecting signs.
Soil moisture
Factor 1 Experiment
I No.
Relative root size
Seed size
Vigour Plant size Needle surface Geographic origin Day length Temperature
Related axis
Variance percent
Range of loadings

su!i, dry and wet sites may differ less than is usually ex- pected. Even if drought resistant genotypes are selected on dry upland sites, populations must be sufficiently isolated to accumulate gene differences (FORD 1964). None of the stands tested for drought resistance in this study were isolated. In other species where drought resistance was related to local soil conditions, isolation was either par- tially or completely developed (HABECK 1958, BRIX 1959, FERRELL and WOODARD 1966). However, most studies dealing with drought resistance in forest trees show that this had developed in responce to regional climates (MEULI and SHIRLEY 1937, KRIEBEL 1963, KRAL 1965, PHARIS and FERRELL 19661.
Relative root size ranked next in importance. The third axes in Experiments No. 2 and 3, to which this factor was related, contributed 14 and 16 percent of total variance. Loadings ranged from 0.03 to 0.76 but were rather low for the survival and growth criteria of main interest. Therefore the influence of this factor was rather limited.
Seed size varied in importance. It was most closely re- lated to the first axis in Experiment No. 1, the fourth axis in Experiment No. 2, and the third axis in Experiment No. 4, contributing 25, 11, and 9 percent of total variance, re- spectively. The loadings of physiological and morphological variables ranged from 0.00 to 0.85. This was a very im- portant factor initially, but its role declined from the time of germination to the completion of the second growing season. This trend is well recorded in the literature (BALD- WIN 1942).
Several similar factors constitute the following group: vigour, second axis of Experiment No. 1, contributing 19 percent of total variance; plant size, second axis of Ex- periment No. 2, contributing 29 percent; and needle surface, first axis of Experiment No. 3, contributing 36 percent. Loadings for physiological and morphological variables ranged from 0.03 to 0.91. These factors carry considerablc weight, particularly in early growth and survival. They were more important than root size and much more im- portant than soil moisture of origin.
A significant position was occupied by geographic origin. In Experiment No. 1 this factor was represented by the third axis, accounting for 16 percent of total variance; in Experiment No. 4 by the first and second, including the effects of day length and temperature, with 76 percent of total variance. The loadings for morphological and physio- logical variables ranged from 0.04 to 0.90. Thus the role of geographic origin was relatively small during germina- tion and early growth, but it increased greatly during the two-year period and dominated in the nursery stage.
In conclusion, the analyses show that black spruce de- velopment from seed to two-year-old seedling is influenc- ed by the following factors: Seed size and germinant seed- ling vigour dominate during the earliest period. Subse- quent drought resistance and development is a function of plant size, vigour, and particularly duration of growth which is controlled by regional climates.
Because natural selection would tend to favour geno- types best adapted to regional climates which are more consistent from year to year than are local climates and soil moisture, a clinal variation pattern should develop. The results of this study therefore support the first hypo- thesis, namely, that variation is essentially clinal in re- sponse to continuous ecological factors. The problem will be further investigated in Part I I of this Paper.
Summary
1. Picea mariana is a species adaptable to various soils and climates with a transcontinental range from Alaska to Pennsylvania. To test the two hypotheses that variation in this species is either clinal, or clinal and ecotypic, seed from 9 forest regions, 24 stands, and 148 single trees was collected between 42 and 60 degrees of N. latitude and 77 and 112 degrees of W. longitude. Experiment No. 1 dealt with germination and early development, Experiment No. 2 with survival of seedlings during their first growing season under continuous drought conditions, Experiment No. 3 with first-season growth under intermittent drought conditions, and Experiment No. 4 with phenology and growth to the end of the second growing season. Measure- ments were evaluated by correlation and principal compo- nent analyses.
2. The principal component analysis based on correla- tions of all measured variables extracted uncorrelated factors related to characteristics of the population, of the test environment, and of the native habitat. Given in order of importance they were: a. for germination und early development: seed size, vig-
our, geographic origin, competition, and soil moisture of the place of seed origin;
b. for survival under cmtinuous drought conditions: water stress, plant size, seed size, relative root size, and soil moisture of origin;
C. for growth under intermittent drought conditions: needle surface, initial plant size, relative root size, and soil moisture of origin;
d. for phenologg und growth: day length of origin, tem- perature of origin, seed size, and soil moisture of origin.
3. In general, root size and soil moisture played a minor role because they were only weakly related to physiological variables such as germination rate, survival index, and growth. The importance of seed size declined over the two- year testing period while that of geographic origin, in- cluding day length and temperature, increased.
4. The results support the first hypothesis that variation is essentially clinal. There is little evidence for ecotypic variation.
ResumS
Titre de l'article: Variation genetique des semis de Picea mariana. I. Corrklations avec les facteurs kcologiques.
1. Picea mariana represente Une espece ligneuse qui s'adapte facilement aux differentes conditions edaphiques et climatiques de son aire transcontinentale qui s'etend de 1'Alaska a la Pennsylvanie.
Dans le but de verifier les deux hypotheses, a savoir que la variation au sein de cette espece peut Gtre soit clinale, soit clinale et ecotypique, un certain nombre de semences furent recoltees dans 9 regions forestieres, groupant 24 peuplements et 148 individus, situes entre les 42e et 60e degr6s de latitude nord et entre 77e et 112e degr6s de longi- tude ouest.
La premiere experience consista en Une etude sur la germination et les premiers stades de developpement; la deuxieme experience tint compte de la survivance des semis durant la premiere saison de croissance SOUS des conditions de skcheresse constante; a la troisieme ex- perience, des semis d'une premiere saison de croissance furent soumis a des conditions intermittentes de secheres- Se; finalement la quatrieme experience traita de la ph6- nologie et de la croissance jusqu'a la fin de la seconde saison de vegetation. Les mesures furent calculees par correlation et l'analyse des composantes principales.
2. L'analyse des composantes principales s'appuyant sur les correlations etablies entre toutes les variables numeri- ques, mis en relief les fccteurs non-correlatifs se rapportant aux caracteristiques de la population, l'environnement de l'experience, et de l'habitat naturel.
Suivant un orde d'importance, nous avons utilise les criteres suivant pour: a. la germination et les premiers stades de developpement:
la dimension de la semence et la vigueur du semis, l'origine geographique, la competition, l'humidite du so1 du lieu d'origine de la semence.
b. la survivance des plantules sous des conditions de se- cheresse continue: la tension hydrique, les dimensions de la plantule et de la semence, la dimension relative des racines et l'humidite du so1 au lieu d'origine.
C. la croissance sous des conditions intermittentes de s& cheresse: la surface des aiguilles, la dimension initiale des plantules, la dimension relative des racines et l'hu- miditk du so1 au lieu d'origine.
d. la phenologie et la croissance: la photoperiode et la tem- perature du lieu d'origine, la dimension des semences et l'humidite du so1 au lieu d'origine.
3. D'une facon generale, le critere de la dimension des racines ainsi que celui de l'humiditk du so1 jouerent un rdle de moindre importance parce qu'ils furent faiblement en relation avec les variables physiologiques telles que le taux de germination, l'index de la survivance et la croissance.
L'importance du facteur de la dimension des graines diminua a mesure que la periode de deux ans suivant la- quelle s'effectuerent les observations avancait, contraire- ment aux facteurs de l'origine geographiques incluant la temperature et la photoperiode, qui prirent Une plus grande importance durant cette meme periode de temps.
4. Les resultats obtenus se rallient a la premiere hypo- these, a savoir que la variation est essentiellement clinale. I1 y a peu d'evidence pour variation ecotypique.
Literature Cited
ANDERSSON, E.: Cone and seed studies in Norway spruce (Picea abies [L.] KARST.). Studia Forestalia Suecica 23, 214 p. + App. (1965). - BAKUZIS, E. V., and HANSEN, H. L.: Balsam Fir Abies bal- samea (LINNAEUS) MILLER. A monographic review. Univ. of Min- nesota Press, Minneapolis 1965, 445 p. - BALDWIN, H. 1.: Forest tree seed of the north temperature regions with special reference to North America. Chronica Botanica Co., Waltham, Mass., 1942, 240 p. - BARTELS, H.: Uber die Abhängigkeit der Keimlingsgröße vom Gewicht und vom Entwicklungszustand des Samens bei Fichte und Kiefer. Allg. Forst- U. Jagdztg. 127: 164--168 (1956). - BARTLETT, M. S.: Some examples of statistical methods of research in agriculture and applied biology. J. Roy. Stat. Soc., Supplem., 4: 137-170 (1937). - BASHAM, J. T., and MORAWSKI, J . R.: Cu11 studies, the defects anrl associated basidiomycete fungi in the heartwood of living trees in the forests of Ontario. Dept. Forestry PUB. 1072, 69 p. (1964). - BESLEY, L.: Relationship between wood fibre properties and paper quality. Pulp and Paper Res. Inst. Canada Tech. Rept. 156, 19 p. (1959). - BRIX, H.: Some aspects of drought resistance in loblolly pine seedlings. Dissertation, Agricultural and Mechanical College of Texas. Summary, p. 83-85 (1959). - BRYAN, M. S.: Interglacial pollen spectra from Greenland. Danmarks Geol. Unders. 11. Raekke, No. 80, 65-72 (1954). - BURGAR, R. J.: The effect of seed size 0x1 germination, survival and initial growth in white spruce. For. Chron. 40: 93-97 (1964). - BURLEY, J.: Variation in seed character- istics of Sitka spruce. Advanc. Front. Plant Sci. (New Delhi) 10: 11-24 (1964). - CASSIE, R. M.: Multivariate analysis in the inter- pretation of numerical plankton data. N. Z. J. Sci. 6: 36-59 (1963). - DAMMAN, A. W. H.: Some forest types of central Newfoundland and their relation to environmental factors. For. Sci. Monogr. 8, 62 p. (1964). - DENYER, W. B., and RILEY, C. G.: Drought effects On young spruce stands in poor sites. For. Chron. 40: 206-208 (1964). - DEPT. OE MINES A ND TECHNICAL SURVEYS: Atlas of Canada. Queen's Printer, Ottawa, 110 plates (1957). - DORF, E.: Climatic changes of the past and present. Am. Scient. 48: 341-364 (1960). - EIS, S.: De- velopment of white spruce and alpine fir seedlings on cut-over areas in the central Interior of British Columbia. For. Chron. 41: 419-431 (1965). - FERRELL, W. K., and WOODARD, E. S.: Effects of seed origin on drought resistance of Douglas-fir (Pseudotsuga menziesii [MIRB.] FRANCO). Ecology 47: 499-503 (1966). - FORD, E. B.: Ecological genetics. Wiley, New York, 335 p. (1964). - FRUCHTER, B.: Introduction to factor analysis. Van Nostrand, Princeton, N. J., 280 p. (1954). - HABECK, J. R.: White cedar ecotypes in Wisconsin. Ecology 39: 457463 (1958). - HARMAN, H. H.: Modern factor analysis. Irniv. of Chicago Press, Chicago, 471 p. (1960). - HAWLEY, R. C., and S\IIIII , D. M.: The practice of silviculture. 6th ed. Wiley, New York,
525 P. (1954). - HEER, 0: Flora fossilis arctica. Bd. 1. Schulthei.. Zürich, 192 p., plates (1868). - H~INSELMAIV, M. L.: Silvical character - istics of black spruce (Picea mariana). U. S. Forest Serv., Lake States For. Exp. Sta., Sta. Paper 45, 30 p. (1957). - HEINSELMAN, M. L.: Forest sites, bog processes, and peatland types in the glacial Lake Agassiz region. Minnesota. Ecol. Monogr. 33: 327-374 (1963). - HOLST, M.: Seed selection and tree breeding in Canada. Canada Dept. Forestry, For. Res. Br. Tech. Note 115, 20 P. (1962). - HORTON. K. W., and LEES, J. C.: Black spruce in the foothills of Alberta. Canada Dept. of Forestry, For. Res. Br. Tech. Note 110, 54 p. (1961). - HOTELLING, H. : Simplified calculation of principal components. Psychometrika 1: 27-35 (1936). - KENDALL, M. G.: A Course in multi- variate analysis. Griffin, London, 185 p. (1957). - KRAL, F.: ~ h y - siologische Frühtestversuche an Herkünften der Grünen Dougla- sie. Zentralbl. ges. Forstw. 82: 129-149 (1965). - KRAUS, B. S., and CHOI, S. C.: A factorial analysis of the prenatal growth of the human skeleton. Growth 22: 231-242 (1958). - KRIEBEL, H. B.: Selec- tion for drought resistance in sugar maple. World Cons. For. Genet. and For. Tree ImprOVmt., Stockholm, 1963. FAOIFORGEN 63-319, 5 p. (1963). - LAMOTTE, R. S.: Catalogue of the Cenozoic plants oi North America through 1950. Geol. Soc. Am. Mem. 51: 1-381 (1952). - LANGNER, W.: Keimungsverlauf bei den Herkünften eines Pro- venienzversuches mit Larix leptolepis (SIEE. et Zucc) GORD. Silvae Genet. 9: 165-167 (1960). - LINTEAU, A.: Forest site classification of the northeastern coniferous section Boreal forest region, Quebec. Canada Dept. North. Aff. and Nat. Resources, For. Br. Bull. 118, 85 p. (1955). - Louc~s, 0. L.: A forest classification for the Maritime Provinces. Proc. Nova Scotian In&. Sci. 25: 85-167 (1959-60). - LOWRY, G. L.: Forest soil-site studies. I. Objectives, sampling, preliminary results On black spruce. Pulp and Paper Res. Inst. Canada Tech. Rep. 368, 23 p. (1964). - LUTZ, H. J., and CHANDLER, R. F.: Forest soils. Wiley, New York, 514 p. (1946). - MACGILLIVRAY, H. G.: Report on forest genetic studies at Acadia Forest Experi- ment Station, 1955. In: Proc. Fourth Meetg. Comm. For. Tree Breedg. Canada, 1956. Maple, Ont. Appendix L: 1-9 (1956). - MACLEAN, D. W., and BEDELL, G. H. D.: Northern Clay Belt growth and yield survey. Canada Dept. North. Aff. and Nat. Resources, For. Br., Res. Div. Tech. Note 20, 31 p. (1955). - Mnu~r, L. J., and SHIRLEY, H. L.: The effect of seed origin on drought resistance o l green ash in the prairie-plains states. J. Forestry 35: 1060-1062 (1937). - MILLAR, J. B.: The silvicultural characteristics of black spruce in the Clay Belt of northern Ontario. Master's thesis, Fac. Forestry Univ. Toronto, 81 p. (1936). - MORGENSTERN, E. K.: Gene- tische Variation von Picea mariana (MILL.). B. S. P. Dissertation, Math.-Naturw. Fak. Univ. Hamburg, 77 p. (1966). - ONTARIO DEPT. OP LANDS AND FORESTS: Manual of seed collecting. Pub. TM-513, 28 p. (1963). - PAULEY, S. S., and PERRY, T. 0.: Ecotypic variation of the photoperiodic response in Populus. J. Arnold Arbor. 35: 167-188 (1954). - PEARCE, S. C.: Biologicai statistics: an introduction. McGraw-Hili, New York, 212 P.. (1965). - PHARIS, R. P., and FERRELL, W. D.: Differences in drought resistance between coastal and inland sources of Douglas fir. Canad. J . Bot. 44: 1651-1659 (1966). - PLACE, I. C. M.: The influence of seed-bed conditions on the re- generation of spruce and balsam fir. Canada Dept. North. Aff. and Nat. Resources, For. Br. Bull. 117, 87 p. (1955). - RICHTER, F. 1.: Pinus: the relationship of seed size and seedling size to inherent vigour. J. For. 43: 131-137 (1945). - ROHMDDER, E.: Die Bedeutung der Keimschnelligkeit bei forstlichen Samenarten. Proc. Int. Seed Test. Assoc. 27: 657-671 (1962). - ROWE, J. S.: Forest regions OE
Canada. Canada Dept. North. Aff. and Nat. Resources, For. Br. Bull. 123, 71 P. (1959). - RUBNER, K.: Die pflanzengeographischen Grundlagen des Waldbaues. 5th ed. Neumann, Radebeul, 620 p. (1960). - SCHELL, G.: Keimschnelligkeit als Erbeigenschaft. Silvae Genet. 9: 48-53 (1960). - SEAL, H. L.: Multivariate statistical analysis for biologists. Methuen, London, 207 p. (1964). - SHIRLEY, H. L.: Observation on drought injury in Mincesota forests. Ecology 15: 4248 (1934). - SNEDECOR, G. W.: Statistizal methods. 5th ed. Iowa State College Press, Ames, Iowa, 534 p. (1956). - STEEL, R. G. D., and TORRIE, J. H.: Principles and procedures of statistics. McGraw- Hill, New York, 481 p. (1960). - U. S. DEPT. OP AGRICULTURE: Map of the forest regions of the United States. U. S. Dept. Agric. Pub. M-5154 (1948). - U. S. DEPT. OP AGRICULTURE: Silvics of forest trees of the United States. Agriculture Handbook 271, 762 p. (1965). - VAN GROENEWOUD, H.: Ordination and classification of Swiss and Canadian coniferous forests by various biometric and other me- thods. Ber. geobot. Inst. ETH, Stiftg. Rübel, Zürich, 36, 2&li)% (1965). - VINCENT, A. B.: Black spruce. A review of its silvics, ecology and silviculture. Canada Dept. Forestry Pub. 1100, 79 P. (1965). - VISHER, S. S.: Climatic Atlas of the United States. Harvard University Press, Cambridge, Mass., 403 p. (1954). - WALLIS, J. R.: Multivariate statistical methods in hydrology - a comparison using data of known functional relationship. Water Resources Rev. 1: 447461 (1965). - WAREING, P. F.: Photoperiodism in woody plants.

Ann. Rev. Plant Physiol. 7: 191-214 (1956). - WEETMAN, G. F.: Nitrogen relations in a black spruce (Picea mariana MILL.) stand subject to various fertilizer and soil treatments. Pulp and Paper Res. Inst. Canada. Woodl. Res. Index No. 129, 112 p. (1962). - WHITE, P. A.: The computation of eigenvalues and eigenvectors of a matrix. J. Soc. Industr. Appl. Math. 6: 393437 (1958). - WILLIAM- SON, M. H.: An ecological survey of a Scottish herring fishery. Part IV: Changes in the plankton during the period 1949 to 1959. Bull. Mar. Eco~. 5: 208-229 (1961). - WITHROW, R. B., (ed.): Photo-
periodism and related phenomena in plants and animals. Am. Assoc. Adv. Sci. Pub. 55, 903 p. (1959). - WRICHT, J. W., and Bu1.1, W. 1.: Geographic variation in European black pine - two-year results. For. Sci. 8: 3242 (1962). - YEATMAN, C. W.: Geographie variation in jack pine (Pinus banksiana LAMI~.) seedlings. Ph. D. thesis, Yale Univ., 231 p. (1966 a). - YEATMAN, C. W.: Germinant size of jack pine in relation to seed size and geographic origin. In: U. S. For. Serv. Res. Paper NC-6: 28-36 (1966 b). - YOUN<:BERC, C. T.: Effect of soil fertility on the physical and chemical prop- erties of tree seed. J. For. 50: 850-852 (1952).
Genetic Variation in Seedlings of Picea mariana (Mill.) BSP. 11. Variation Patterns
By E. K. MORGENSTERN')
(Received for publication May 10, 1968)
Introduction
The genetic processes of mutation, recombination, migra- tion, isolation and selection change the frequency of genes in natural populations and lead to the development of certain variation patterns. For each species this pattern is complex in origin but may be explained in a simplified manner by assuming that natural selection is the dominant genetic process. By making this assumption, the pattern can be related to environmental factors, and it is then possible to define the factors which are most important. This approach has been taken in Part I of this paper (MOR- GENSTERN 1969).
The combined effect of all genetic processes must be measured in a different manner. The expected subdivision of the species can be investigated by means of hierarchal sampling and analysis of variance. Thus the total variance can be divided into the components associated with popula- tions (among regions), subpopulations (among stands within regions), half-sib families (among single-tree progenies within stands), and within half-sib families (among re- plications of the Same single-&ee progenies). The study was continued in this way and the results are given in the present paper.
Methods
Experiments
The four experiments carried out in this study dealt with germination and early development, survival and dry- matter production under drought conditions, and growth and phenology. Details of the experimental procedure were outlined elsewhere (MORGENSTERN 1966, 1969). Thirteen phy- siological and morphological characters are considered in this paper to test certain black spruce populations for the presence of a clinal or clinal and ecotypic variation pattern.
Criteria for Classification
Clinal variation (HUXLEY 1938) is defined as a gradation in measurable characters of organisms. It is thought that
I ) Research Scientist, Department of Fisheries and Forestry, Petawawa Forest Experiment Station, Chalk River, Ontasio, Canada. Second paper based upon a dissertation for the degree of Dr. rer. nat. submitted in 1966 to the Mathematisch-Naturwis- senschaftliche Fakultät, Universität Hamburg, Germany. The kirger part of the experimental work was performed at Institut für Forst- genetik und Forstpflanzenzüchtung, Bundesforschungsanstalt für Forst- und Holzwirtschaft, Schmalenbeck, Germany.
this type of variation may develop after an initial dis- ruptive selection (MATHER 1953) in the base population migrating from the centre of origin of a species, which is then followed by stabilizing selection and gene exchange among adjacent populations over the species range (HALDANE
1948, FISHER 1950). Ecotypic variation (TURESSON 1922) is marked by an ab-
rupt pattern change resulting from disruptive selection within populations where habitats are discontinuous and from stabilizing selection within subpopulations. Therefore, both clinal and ecotypic variation are similar in that they are forms of adaptive genetic variation, but they differ in the underlying evolutionary mechanisms. Thus their distinction is important (STERN 1964). Furthermore, it must be recognized that subpopulation differences may also arise in non-adaptive fashion by migration from different re- fugia (BOUVAREL 1939J;:random drift in small populations (WRIGHT and BULL 1963), and inbreeding (MAYR 1963).
The variation pattern found in this study will be clas- sified in the following manner: If the population compo- nent of variance is larger than the subpopulation and family component, variation will be considered clinal. If the subpopulation component is larger than the population and family component, variation will be considered eco- typic regardless of the genetic processes involved. Direct comparisons of the variance components can also be made provided that a similar sampling system has been used (STERN 1964, SQUILLACE 1966).
Statistical Analysis
The statistical analysis was based upon the model
Yijkl = + Pi + Sij + fijk + Wijkl
where Yijki represents the plot mean of a particular char- acter measured in replication 1 of the k-th family in the j-th subpopulation and the i-th population; p the overall mean of the experiment; pi, sij, and fi jk the effects of the i-th population, j-th subpopulation in population i, and k-th half-sib family in the j-th subpopulation of popula- tion i, respectively; and wijki the within-family deviation including error and the effect of replication 1. Although randomized block and modified lattice square designs were used in the physical layout of experiments, the preceding model assumes a completely randomized structure. This simplified the presentation of results and the calculation of mean square coefficients, without resulting in large dis- advantages. All experimental units were considered ro n -