Embed Size (px)
Citation preview

PertanikaJ. Trop. Agric. Sci. 18(1): 63-69(1995) ISSN: 0126-6128© Universiti Pertanian Malaysia Press
Genetic Variability, Correlations and Path Coefficient Analysis ofComponents of Seed Yield in Cowpea (Vigna unguiculata)
OJ. ARIYODepartment of Plant Breeding and Seeed Technology
University of AgriculturePM.B. 2240, Abeokuta
Ogun State, Nigeria
Keywords: Vigna unguiculata, cowpea, genetic diversity, correlations, path analysis
ABSTRAK
26 varieti kacang duduk (Vigna unguiculata L. Walp) telah dinilai di medan untuk mengkaji kebotehubahangenetik, hubungan antara-ciri dan juga analisa laluan komponen hasil biji benih. Hasil biji benih adalah ciripaling banyak berubah dengan pekali variasi genotip (gcv) dan pekali variasi penotip (pcv) masing-masing22.11 dan 35.25 peratus. Hari-hari pengeluaran bunga adalah paling kurang berubah dengan gcv dan pcvmasing-masing 1.93 dan 2.30 peratus. Berat bagi 100 biji benih mempunyai anggaran keterwarisan tertinggi29.33 peratus, sementara bilangan peduksi bagi setiap tanaman menunjukkan anggaran ketewarisan terendah30Jl peratus. Bilangan pedunkel dan cabang setiap tanaman serta bilangan pod pedunkel menunjukkansignifikan dan genotip positif korelasi dengan hasil biji benih. Hanya bilangan pedunkel dan bilangan cabangsetiap tanaman menunjukkan penotip positif korelasi dengan hasil biji biji benih. Analisis pekali laluanmenunjukkan hasil biji benih dipengaruhi oleh berat 100 biji benih, bilangan biji benih setiap pod, bilangancabang setiap tanaman dan jumlah pod bagi setiap pedunkel.
ABSTRACT
Tiventy-six varieties of cowpea (Vigna unguiculata /.. Walp.) were evaluated in the field to study geneticvariability, inter-character relationships as well as the path analysis of components of seed yield. Seed yield wasthe most variable character with genotypic coefficient of variation (gvc) and phenotypic coefficient of variation(pvc) of 22.11 and 35.25%, respectively. Days to flowering was the least variable with gvc and pvc of 1.93and 2.30%, respectively. Weight of 100 seeds had the highest heritability estimate of 9233% while number ofpeduncles per plant exhibited the lowest heritability estimate of 30.11 %. Number of peduncles per plant, numberof branches per plant and number of branches per peduncle showed signjicant and positive phenotypic correlationwith seed yield. Only number of peduncles per plant and number of branches per plant showed positive phenotypiccorrelation with seed yield. Path coefficient analysis revealed that seed yield was affected by weight of 100 seeds,number of seeds per pod, number of branches per plant and number of pods per peduncle.
INTRODUCTION
Cowpea {Vigna unguiculata ) is a grain legumewhich constitutes a major dietary protein in thehumid and subhumid tropics. The protein con-tent is about 24% (Elias et al. 1964) and thequantity is a function of the genotype and theenvironment (Bliss 1975).
Phenotypic variability and the heritability ofcharacter determine, to a large extent, the rate
of genetic advance. Hence, it is essential topartition the overall variability into its heritableand non-heritable components in order to de-termine the most effective breeding procedures.The response of correlated characters can bepredicted if the genetic correlations andheritabilities of the characters can be predictedif the genetic correlations and heritabilities ofthe characters are known. But as more charac-

O. J. ARIYO
ters are involved in correlation studies, the indi-rect associations between characters becomemore complex. In such a situation, path-coeffi-cient analysis has been of great value in identi-fying direct and indirect associations (Deweyand Lu 1959).
Several investigations have shown thatnumber of seeds per pod, pod length andweight of 100 seeds were moderately to highlyheritable (Singh and Mehndiratta, 1969; Leleji1975; Tikka et al 1977; Erskine and Khan1978). Erskine and Khan (1978) also reportedmoderate and low heritabilities for seed yieldand number of seeds per pod, respectively.Kheradnam and Niknejad (1974) observed sig-nificant positive phenotypic correlations of seedyield with the number of pods per plant andnumber of seeds per pod.
The objectives of this study were to deter-mine (a) genetic variability, (b) inter-characterassociations, and (c) the components of podyield in cowpea.
MATERIALS AND METHODS
Twenty-six cowpea varieties were utilized forthis study; 25 of these were obtained fromthe Grain Legume Improvement Programmeof the International Institute of Tropical Ag-riculture, Ibadan, Nigeria.
The varieties were grown at the Universityof Agriculture Teaching and Research Farm,Abeokuta, during the late rainy season (Septem-ber) of 1991. The varieties were grown inrandomized complete block design with threereplications. Each variety was grown in 2 x 2 mplots, each containing 44 plants. The plantswere spaced 50 cm between rows and 20 cmapart within the row to give 11 plants per row.With the exception of the varieties at the bor-ders, which had five rows to offset the bordereffect, each variety had four rows. Plants weresprayed with Cymbush (Cypermethrin) at therate of 1.5ml/l every 2 weeks to control insectpests, while weeding was done when necessary.
From the competitive plants in the harvestarea of 4m2 data were collected on the followingcharacters: seed yield per square met, weight of100 seeds, number of seeds per pod, pod length,number of pods per peduncle, number ofbranches per plant, number of peduncles perplant and number of days to flowering.
The plot means were subjected to analysisof variance and covariance according to the
procedures outlined by Snedecor and Cochran(1967) and Kemphorne (1973).
A random model was assumed. Genotypicand phenotypic coefficients of variation wereestimated using the formula suggested by Burton(1952). Broad-sense heritability estimates werecalculated according to the formula suggestedby Allard (1960). Genotypic and phenotypiccoefficients of correlation were also calculatedfrom the genotypic and phenotypic variancesand covariances and of the characters. Environ-mental correlations were calculated as outlinedby Falconer (1960).
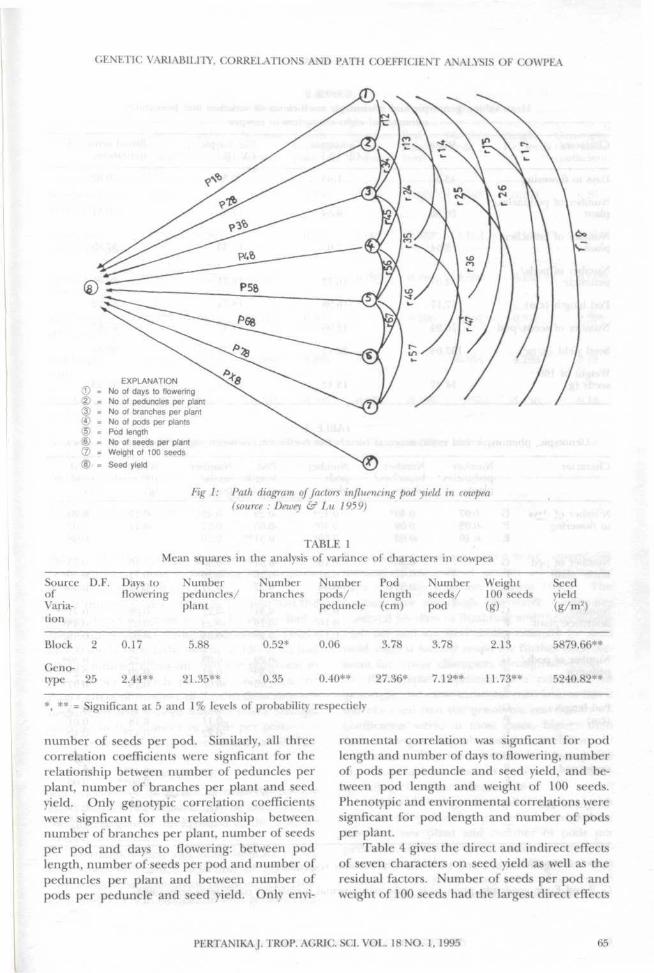
Path-coefficients were calculated using thegenotypic coefficients of correlations as outlinedby Dewey and Lu (1959). The nature of thecausal scheme, including characters and seedyield, is presented in Fig. 1.
RESULTS
Table 1 shows the analysis of variance and therange of the eight characters evaluted. The vari-eties were different from each other for all thecharacters evaluated except for number ofbranches per plant.
Table 2 presents the means, genotypic andphenotypic coefficients of variation and herit-ability estimates for the eight characters. Seedyield was the most variable character with geno-typic coefficient of variation (gvc) and phenotypiccoefficient of variation (pvc) of 22.11 and35.25%, respectively. Number of days to flower-ing was the least variable exhibiting gcv and pcvof 1.93 and 2.30%, respectively. The othercharacters showed intermediate variation.
Weight of 100 seeds, which had intermediategcv and pcv had the highest heritability estimateof 92.23%, followed by pod length, which hadthe heritability estimate of 82.12%. Number ofpods per peduncle and number of days to flow-ering also exhibited high heritability estimatesof 80.00 and 70.62%, respectively. Other char-acters showed low to intermediate heritabilityestimates.
Table 3 shows the genotypic, phenotypicand environmental correlation coefficientsamong the eight characters. Significant geno-typic, phenotypic and environmental correla-tion coefficients were observed between numberof peduncles per plant and number of branchesper plant, number of pods per plant and days toflowering and between weight of 100 seeds and
64 PERTANIKAJ. TROP. AGRIC. SCI. VOL. 18 NO. 1, 1995
GENETIC VARIABILITY, CORRELATIONS AND PATH COEFFICIENT ANALYSIS OF COWPEA
1
iD
EXPLANATIONNo of days to floweringNo of peduncles per plantNo of branches per plantNo of pods per plantsPod lengthNo of seeds per plantWeight of 100 seedsSeed yield
Fig 1: Path diagram of factors influencing pod yield in cowpea(source : Dewey & Lu 1959)
TAM.K 1Mean squares in the analysis of variance of characters in cowpea
SourceofVaria-tion
D.F. Days toflowering
Numberpeduncles/plant
Numberbranches
Numberpods/peduncle
Podlength(cm)
Numberseeds/pod
Weight100 seeds(g)
Seedyield(g/ma)
Block 2 0.17 5.88 0.52* 0.06 3.78 3.78
Geno-type 25 2.44** 21.35** 0.35
2.13 5879.66**
0.40** 27.36* 7.12** 11.73** 5240.82**
*, ** * Significant at 5 and 1% levels of probability respectiely
number of seeds per pod. Similarly, all threecorrelation coefficients were signficant for therelationship between number of peduncles perplant, number of branches per plant and seedyield. Only genotypic correlation coefficientswere signficant for the relationship betweennumber of branches per plant, number of seedsper pod and days to flowering: between podlength, number of seeds per pod and number ofpeduncles per plant and between number ofpods per peduncle and seed yield. Only envi-
ronmental correlation was signficant for podlength and number of days to flowering, numberof pods per peduncle and seed yield, and be-tween pod length and weight of 100 seeds.Phenotypic and environmental correlations weresignficant for pod length and number of podsper plant.
Table 4 gives the direct and indirect effectsof seven characters on seed yield as well as theresidual factors. Number of seeds per pod andweight of 100 seeds had the largest direct effects
PERTANIKAJ. TROP. AGRIC. SCI. VOL. 18 NO. 1, 1995

O. J. ARIYO
TABLE 2Mean values, genotypic and phenotypic coefficients of variation and heritability
estimates of eight characters in cowpea
Character
Days to flowering
Mean
43.6
Number of peduncles/plant 20.36
Number of branches/plant
Number of pods/peduncle
Pod length (cm)
Number of seeds/pod
Seed yield (g/nr)
Weight of 100seeds (g)
3.54
2.07
17.17
10.94
153.64
14.47
Genotypic, phenotypic and environmental
Character
Number of daysto flowering
Number of ped-uncle/plant
Number ofbranches/plant
Number of pods/peduncle
Pod length(cm)
Number ofseeds/ pod
Weight of 100seeds (g)
GPE
GPE
GPE
GPE
GPE
GPE
GPE
Numberpeduncles/plant
0.07-0.03-0.10
Numberbranches/plant
0.39*0.09
-0.03
0.58**0.41*0.52
GenotypicCV (%)
1.93
9.84
7.0
16.73
16.98
12.06
22.11
13.47
PhenotypicCV (%)
TABLE 3correlation coefficients 1
Numberpods/plant
0.42*0.40*0.66*
0.100.01
-0.04
0.340.160.17
Podlength(cm)
2.30
17.92
11.33
18.71
18.74
17.45
35.35
14.47
Broad sense (%)heritability
between eight characters
NumberI seeds/
pod
-0.29 0.45*-0.05 0.270.51** 0.30
-0.51*-0.260.37
-0.31-0.19-0.28
* -0.46*-0.26-0.31
-0.22-0.23-0.34
-0.29 0.08-0,39* 0.01-1.05** -0.06
-0.13-0.11-0.22
70.62
30.11
37.89
80.00
82.12
47.67
39.34
92.23
I in cowpea
Weight Seed100 seeds yield/m2
(g) (s)
-0.17•0.11
0.100.110.11
-0.08-0,03-0.01
-0.22-0.20-0.13
0.170.180.43*
0.200.02
-0.08
0.73**0.39*0.46**
0.71**0.43*0.53*
0.39*0.280.37*
-0.15-0.010.12
-0.67** -0.18-0.40* 0.06-0.50** 0.06
0.290.160.25
* ** = Significant at 5 and 1% levels of probability respectively
G, P and E are genotypic, phenotypic and environmental correlation coefficients respectively
PERTANIKAJ. TROP. AGRIC. SCI. VOL. 18 NO. 1, 1995

GENETIC VARIABILITY, CORRELATIONS AND PATH COEFFICIENT ANALYSIS OF COWPEA
TABLE 4Direct and indirect effects of some characters on seed yield in cowpea
Character Directeffecton seedyield
Numberdays toflowering
Numberped-uncles/plant
Numberbranches/plant
Numberpodspeduncle
Podlength(cm)
Numberseeds
Weight100 seeds(g)
Genotypiccorrelationcoefficient
Number of days -1.218to flowering
0.117 0.350
Number of 1.667 -0.085 0.524peduncles/plant
Number of 0.903 -0.475 -0.967branches/plant
Number of 0.870 -0.511 0.167 0.307pods/peduncle
Pod length 0.916 0.353 -0.850 -0.280(cm)
Number of 2.539 -0.548 -0.767 -0.199seeds/pod
Weight of 100 1.725 0.207 0.167 -0.072seeds (g)
0.365 -0.324 LI 43 -0.293 0.20
0.087 -0.467 -1.168 0.173 0.73**
0.296 -0.284 -0.559 -0.138 0.71**
-0.266 0.203 -0.378 0.39*
0.252 -0.534 0.293 -0.15
0.070 -0,199 -1.156 -0.18
0.191 0.156 -L701 0.29
*, ** = Significant at 5 and 1% levels respectively.Residual Factors = -0.579.
on seed yield in spite of their low correlations.Only number of days to flowering had negativedirect effect on seed yield.
Although number of seeds per pod had thelargest direct effect on seed yield, it also had alarge indirect effect through reduction in weightof 100 seeds. Similarly, weight of 100 seeds hada large indirect effect through the reduction inthe number of seeds per pod. Although thedirect effect of number of days to flowering wasnegative, it had a large indirect effect throughincrease in the number of seeds per pod.
The residual factors accounted for -0.579.
DISCUSSIONThe wide range of variability observed for theeight characters evaluated may be attributed tothe diverse genetic background of the varietiesstudied.
Heritability estimates alone indicate the ef-fectiveness with which selection of genotypescan be based on phenotypic performance. How-ever, heritability in conjuction with genetic coef-
ficient of variation provides a more dependablemeasure of amount of genetic advance to beexpected from selection (Burton 1952). Themedium gcv and high heritability estimatesobserved for days to flowering and the relativelyhigh gcv and low heritablility estimate for seedyield suggest limited scope for further improve-ment for these characters through selection.
Phenotypic correlation is a composite ofgenotypic and environmental correlations but itwas observed that the genotypic correlationcoefficients were, in most cases, higher thantheir corresponding phenotypic correlationcoefficients. This has been ascribed to negativeenvironmental correlations between the corre-sponding characters (Searle 1961).
Seed yield was genotypically correlated withnumber of peduncles per plant, number ofbranches per plant and number of pods perpeduncle, indicating the reliability of these char-acters in selecting for yield. However, onlynumber of peduncle per plant werephenotypically correlated with seed yield. Char-
PERTANIKAJ. TROP. AGRIC. SCI. VOL. 18 NO. 1, 1995 m

O.J. ARIYO
acters which are phenotypically correlated butnot genotypically correlated will not producerepeatable estimates of inter-character associa-tions and any selection based on the relation-ship is likely to result in little, if any, geneticgain. This is true of the relationship betweennumber of pods per peduncle and pod length.Also, characters that are genotypically correlatedbut not phenotypically correlated will not be ofpractical value in selection since selection isoften based on the phenotypic performance ofthe characters. This is true of the relationshipbetween number of days to flowering andnumber of branches per plant, between podlength and number of peduncles per plant,between number of peduncles per plant andnumber of seeds per pod, and between numberof pods per peduncle and seed yield.
The positive correlation between seed yieldand number of branches per plant may be re-lated to greater photosynthetic capacity providedby more leaves since the branches bear most ofthe leaves. Also, more branches imply morepod-bearing peduncles and hence number ofdays to flowering, and number of branches perplant suggests that early-flowering varieties pro-duce fewer branches and thus yield less thanvarieties that flower late.
Negative correlation between pod lengthand number of peduncles per plant indicatedthat the varieties with long pods produced lowernumbers of peduncles. Unless the length of thepod can compensate for the low number ofpeduncles, such varieties are likely to yield less.However, since the number of seeds per podand the number of peduncles per plant werenegatively correlated, it appears that selectingfor high number of peduncles will result in alow number of seeds per pod. The fact thatweight of 100 seeds and number of seeds perpod were negatively correlated indicates that byst lr< ting for a high number of seeds per pod,one is indirectly selecting for light seeds. Sincethere was significant association between numberof peduncles per plant, number of branches perplant, number of pods per peduncle and seedyield, such characters should be selected forwhenever high seed yield is the objective.
Generally, low environmental correlationindicates that phenotypic correlation will be agood index of genotypic correlation (Falconer1960). The signficant environmental correla-tion observed between number of peduncles per
plant, number of branches per plant, number ofpods per plant and seed yield indicates thatselection for yield on the basis of the phenotypicperformances of these characters will not beeffective. However, the high environmental cor-relation and low genotypic correlation betweenweight of 100 seeds, number of pods per plantand pod length suggests that environmentalcorrelation would be a more reliable index ofphenotypic correlation.
Correlation measures mutual association withno regard to causation, whereas path analysisspecifies causes and measures their relative im-portance (Dewey and Lu 1959). That thenumber of seeds per pod and weight of 100seeds had the largest direct effects on seed yieldin spite of their low correlation with it, indicatesthe defects of selecting on the basis of inter-character correlations alone. The path coefficientanalysis revealed that the poor association be-tween number of seed per pod, weight of 100seeds and seed yield was largely due to indirecteffects through reduction of weight of 100 seedsand number of seeds per pod respectively. Thefact that number of peduncles per plant, numberof branches per plant and number of pods perpeduncles were positively correlated with seedyield, with relatively large direct effects on seedyield, indicates that these characters are alsoimportant when selecting for high seed yield.
On the basis of path analysis, it is estab-lished that seed yield in cowpea is affected byweight of 100 seeds, number of seeds per pod,pod length, number of branches per plant andnumber of pods per peduncle. For selectionpurposes, however, emphasis should be placedon those characters with high heritability inorder to produce repeatable results. There-fore weight of 100 seeds, number of seeds perpod and number of pods per peduncle shouldbe selected for whenever high yield is theobjective.
ACKNOWLEDGEMENTThe author is grateful to the Grain LegumeImprovement Programme of the InternationalInstitute of Tropical Agriculture (IITA), Ibadan,for making available the cowpea varieties.
REFERENCESAI.IARD, R.W. 1960. Principles of Plant Breeding. Lon-
don: Wiley.
PERTANIKAJ. TROP. AGR1C. SCI. VOL. 18 NO. 1, 1995
GENETIC VARIABILITY, CORRECTIONS AND PATH COEFFICIENT ANALYSIS OF COWPEA
BLISS, F. A. 1975. Cowpeas in Nigeria. In Proceed-ings of a Symposium on Nutritional Improvement ofFood by Breeding, 3 - 5 July, 1972, ed. M. Milnerp. 151-158. New York: United Nations ProteinAdvisory Group.
BURTON, G.N. 1952. Quantitative inheritance in
grasses. In Proc. 6th International Grass Congress1: 277-283.
DKUKY, D.R. and F.H. Lu. 1959. A correlation and
path-coefficient analysis of components ofcrested wheat grain seed production. AgronomyJournal SI: 575-578.
ELIAS, L.G., R. CoUNDRES and R. BKSSAI. 1964. The
nutritive value of eight varieties of cowpea(Vigna sinensis). Journal of Food Science 29: 118-122.
ERSKINE, W. and T.N. KHAN. 1978. Inheritance of
cowpea yields under different soil conditionsin Papua New Guinea. Experimental Agriculture14:
FALCONER, D.S. I960. Introduction to QuantitativeGenetics. London: Oliver 8c Boyd.
KEMPTHORNE, O . 1973. An Introduction to Genetic
Statistics. Ames, Iowa: Iowa State UniversityPress.
KHERADNAM, M. and M. NIKNEJAD. 1974. Heritahility
estimates and correlation of agronomic char-acters in cowpea (Vigna sinensis L.j. Journal ofAgricultural Science 82: 207-208.
LELEJI, O.I. 1975. Inheritance of three agronomiccharacters in cowpeas (Vigna sinenasis L. (Savi).Madras Agricultural Journal 62: 95-97.
SEARLE, S. R. 1961. Phenotypic, genotypic and envi-ronmental correlations. Biometrics 17: 474-480.
SINGH, JLB. and P.D, MEHNDIRATTA. 1969. Genetic
variability and correlation studies in cowpeas.Indian Journal of Genetics and Plant Breeding 29:104-109.
SNEDEGOR, G.W. and W.G. COCHRAN. 1967. Statistical
Methods. Ames: Iowa State University Press.
TIKKA, S.B.S., S.N. JAIMINI, B.M. ASAWA and J.R.
MATHi R. 1977. Genetic variability, interrela-tionships, and discriminant function analysisin cowpea (Vigna unguiculale (L) Walp.). In-dian Journal of Heredity 9: 1-9.
(Received 22 June 1994)
PERTANIKAJ. TROP. AGRIC. SCI. VOL. 18 NO. 1, 1995