Embed Size (px)
Citation preview

This file is part of the following reference:
Harrison, Hugo B. (2012) Genetic parentage analysis as
a tool for measuring larval connectivity in a network of
marine reserves. PhD thesis, James Cook University.
Access to this file is available from:
http://researchonline.jcu.edu.au/34418/
The author has certified to JCU that they have made a reasonable effort to gain
permission and acknowledge the owner of any third party copyright material
included in this document. If you believe that this is not the case, please contact
[email protected] and quote
http://researchonline.jcu.edu.au/34418/
ResearchOnline@JCU

GENETIC PARENTAGE ANALYSIS AS A TOOL FOR
MEASURING LARVAL CONNECTIVITY IN A NETWORK OF
MARINE RESERVES
Thesis submitted by
Hugo B. Harrison BSc (Hons), GCertSc
in November 2012
for the degree of Doctor of Philosophy
within the School of Marine & Tropical Biology
James Cook University
and
in the École doctoral Systèmes Intégrés, Environment et Biodiversité
Specialty: Ecology & Population Genetics
École Pratique des Hautes Études


MÉHODES DE PARENTÉ GÉNÉTIQUE COMME OUTIL POUR
MESURER LA CONNECTIVITÉE LARVAIRE DANS UN
RÉSEAUX DE RESERVES MARINES
Thèse soumise par
Hugo B. Harrison BSc (Hons), GCertSc
en Novembre 2012
Thèse pour l’obtention du grade de docteur en Écologie
de la School of Marine & Tropical Biology
James Cook University
et
de l’École doctoral Systèmes Intégrés, Environment et Biodiversité
Specialité: Ecologie & Génétique des Populations
École Pratique des Hautes Études


v
STATEMENT OF CONTRIBUTION OF OTHERS
This project was funded by research grants from the Australian Research
Council and the Marine and Tropical Sciences Research Facility to GP Jones, and a
Graduate Research Scheme grant to HB Harrison. A James Cook University
Postgraduate Research Scholarship supported me throughout the duration of my
thesis. P Saenz-‐Agudelo provided assistance in designing the simulations in
Chapter 2. KA Feldheim developed the microsatellite libraries for Chapter 3. DH
Williamson and RD Evans oversaw the field component at the heart of Chapters 4
and 5, including the underwater visual census data. Field sampling was conducted
under Marine Parks permit No. G06/17981.1 and Queensland General Fisheries
permit No. 87381. The work was conducted under JCU Ethics approval A1001.


vii
ACKNOWLEDGMENTS
As with any great journey, it is the people that we encounter that make it
such a memorable experience.
First and foremost, I would like to thank my advisors, Geoffrey Jones, David
Williamson, Garry Russ, Serge Planes and Lynne van Herwerden for having
provided continuous support throughout my dissertation and for giving me the
freedom to pursue my own interests. I was also very fortunate to receive support
from Richard Evans, Glenn Almany and Michael Berumen, who took me under
their wing, taught me the ropes, and with whom I shared incredible adventures.
This work would not have been possible without generous financial support from
Geoffrey Jones, the School of Marine and Tropical Biology and the Graduate
Research School at JCU.
I owe a great deal to the fishermen and volunteers who generously offered
their time, their boats, and their expertise to catch the many thousands of fish that
are at the heart of this work. I also wish to thank Irene Fuertes-‐Jerez, Teresea
Lambrick and Laura Stoltenberg for assistance in the lab, Thomas Mannering and
Paul Costello for their work ageing juvenile fish, Alexia Pihier and James Moloney
for their work with GIS.
A special thanks to Rene Abesamis, J Howard Choat, Severine Choukroun,
Renata Ferrari-‐Legorreta, Whitney Goodell, Jonathan Kool, Ian McLeod, Mae Noble,
Mark Priest, Pablo Saenz-‐Agudelo, Maya Srinivasan, Brett Taylor, Simon Thorrold,
Colin Wen and “La Maison du Bonheur”: Jorge Alvarez-‐Romero, Alexander
Anderson, Emmanuelle Botte, Clément Fay, Vanessa Messmer, Morena Mills,
Véronique Mocellin, Jean-‐Baptiste Raina, and Rebecca Weeks for their support and
stimulating discussions over the years.
Finally, I am grateful to Clive, Denise and Claire Harrison for encouraging me
along this path, not knowing where it would lead. I am forever indebted to Stephen
Simpson for opening my eyes to what lies beneath the ocean swell.


ix
GENERAL ABSTRACT
Networks of no-‐take marine reserves are widely advocated as a means to
conserve biodiversity and manage coastal fisheries. Reserves not only deliver
rapid and long-‐term benefits within their boundaries, they also provide a broader
framework that augments the resilience of coral reef ecosystems. Understanding
the level of demographic connectivity between discreet populations is essential to
determine a network’s efficacy to supplement fisheries and protect biodiversity. In
theory, the larger biomass of exploited fishes within reserves, and higher
reproductive capacity, increase recruitment to nearby populations due to larval
export, and connectivity between reserves support stable populations. However,
for large exploited fishes, it has been seemingly impossible to determine where the
larvae from populations within reserves go or assess the relative importance of the
supply of juveniles from reserves. One of the major challenges is identifying
methods that can be applied to large species at the scale at which reserve networks
have been implemented. Recent developments in genetic parentage analysis show
that this is possible for small reef species, but techniques have not been tested on
and applied to important fishery species. The overall aim of this thesis was to
develop and apply parentage analysis to assess the conservation and fisheries
objectives of a network of no-‐take marine reserves of the Great Barrier Reef Marine
Park (GBRMP), Australia. It focuses on two of the most important inshore fishery
species on the GBRMP, the coral trout (Plectropomus maculatus) and stripey
snapper (Lutjanus carponotatus), and provides the first empirical description of
the dispersal of larvae from marine reserves.
The use of parentage analysis has become an increasingly popular approach
to investigate ecological processes in animal populations. While this is an
extremely powerful technique, one aspect of parentage studies has received
limited attention: How accurate are they, and what errors are they most likely to
encounter? A number of different assignment methods have emerged in common
use, and the accuracy of each may differ in relation to the number of loci examined,
allelic diversity, incomplete sampling of all candidate parents, and the presence of
genotyping errors. In Chapter 2, I examine how these factors affect the accuracy of
three popular parentage inference methods to resolve true parent-‐offspring pairs.

x
Using simulated data, I was able to capture a wide diversity of conditions that are
commonly encountered in parentage studies and identified key factors for the
identification of true parent-‐offspring pairs in natural populations. The findings of
this study clearly demonstrate that the number and diversity of loci were the most
important factors in obtaining accurate assignments, while the proportion of
candidate parents sampled had only a small impact on the susceptibility of each
method to either false positive or false negative assignments.
Recent technical advances in the isolation of molecular markers and the high
throughput screening of multi-‐locus genotypes have made it possible to screen
large numbers of individuals with unprecedented resolution. Microsatellite
markers, short tandem repeats in the nuclear genome, have become a marker of
choice in parentage studies for their high level of allelic diversity (polymorphism).
As identified in the previous chapter, this is an important factor in obtaining
accurate parentage assignments. In Chapter 3, I develop novel sets of
microsatellite loci specifically designed for parentage analyses in natural
populations of coral trout (P. maculatus) and stripey snapper (L. carponotatus).
This resulted in a panel of 11 and 13 highly polymorphic microsatellite markers
for P. maculatus and L. carponotatus, respectively. These unique marker sets
resulted in an exclusion power of over 99.98% for assignments to single parents,
thus providing a high level of accuracy for parentage studies.
Our understanding of the spatial scale of dispersal in coral reef fishes has
certainly altered our perception of how populations are regulated, however our
knowledge-‐base largely stems from unique study systems involving small habitat-‐
specialised species with high site fidelity. For large exploited species of commercial
value and greatest need of effective management, it has been seemingly impossible
to identify where or how far larvae go. In Chapter 4, I describe the first conclusive
field evidence that larval supply from marine reserves benefits both fish and
fisheries, which fills a major knowledge gap that has impeded wider acceptance of
marine reserve networks as an effective fisheries management strategy. Over the
course of an extensive field study, tissue samples were collected from adult coral
trout and adult stripey snapper within three focal no-‐take marine reserves in the
Keppel Island group, an inshore island archipelago of the GBRMP. During the
following 15 months, juveniles of both species were collected throughout the

xi
island group up to 30 km from focal reserves. Using DNA parentage analysis, I
assigned juveniles collected in both fished and protected locations throughout the
island group back to their parents sampled inside reserves. Based on the observed
dispersal trajectories, I was able to show that populations within reserves were
responsible for supplying approximately half of all juvenile recruitment within
30km of reserves. These findings settle a 20-‐year long debate as to whether marine
reserves actually work as a fisheries management tool in reef systems.
In Chapter 5, I build on previous chapters to explore some of the majors
assumptions in our understanding of population dynamics for the management of
coral reef fishes: (1) whether the spatial patterns of recruitment are persistent
over time; (2) whether patterns of larval supply are consistent across multiple
cohorts; (3) whether larger adult fishes account for a greater proportion of local
recruitment (settlement) than smaller adult fish; (4) whether fish below the legal
length limit contribute to local recruitment; and (5) whether the more abundant
and larger fish in reserves are important to local recruitment. By combining
genetic and demographic data, this study offers a rare insight into the demographic
processes of wild reef fish populations and provides critical information for the
management of two commercially and recreationally important fish species. Over
the course of three successive cohorts of juvenile coral trout and stripey snapper,
recruitment was unevenly distributed throughout the Keppel Islands with three
main ‘recruitment hotspots’. However, spatial patterns were temporally consistent
and successive cohorts were genetically homogeneous, suggesting that the adult
source population supplying juvenile recruitment was consistent and largely local.
Using genetic parentage analysis I identified which specific adults had contributed
to local recruitment, providing a unique perspective on the reproductive success of
individual size classes for these species and the influence of reserves on local
recruitment.
In summary, this thesis provides a unique perspective on the accuracy of
parentage studies in natural populations and identifies key recommendations for
the development of microsatellite marker sets for parentage analysis. It provides
the first conclusive evidence that larval supply from marine reserves benefits both
fish and fisheries, and fills a major knowledge gap that has impeded wider

xii
acceptance of marine reserve networks as a viable and effective fisheries
management strategy.

xiii
RÉSUMÉ GÉNÉRAL
Les réseaux de réserves marines sont préconisés comme un moyen de conserver la
biodiversité et administrer la gestion des ressources halieutique. La mise en place
de réserves favorise non seulement des améliorations à cours et à long terme au
sein de leurs frontières, mais fournissent également de manière plus générale un
moyen d’augmenté la résilience des écosystèmes coralliens. Comprendre le niveau
de connectivité démographique entre les populations est essentiel pour
déterminer l'efficacité de ces réseaux afin d’accroître le rendement des pêcheries
tout en protégeant la biodiversité marine. En théorie, l’augmentation de la
biomasse et de la capacité reproductive des poissons à valeur commerciale au sein
des réserves augmenterait le recrutement dans les populations avoisinantes en
raison de l'exportation des larves. En outre, la connectivité entre réserves
soutiendrait la stabilité de ces populations. Cependant, identifier où se dispersent
les larves de poissons dans le milieu marin s’est avéré un défi de longue date. Le
développement de méthode de parenté génétique démontre qu’il est possible de
suivre la trajectoire de certain poisson de récifs. L’objectif principal de cette thèse
est de développer et d'appliquer les analyses de parenté génétique afin d’évaluer la
valeur des réseaux de réserve marine pour la gestion des ressources halieutique de la
Grande Barrière de Corail en Australie. Cette thèse se concentre sur deux espèces
de poissons à valeur commercial sur l’ensemble du parc : le mérou à point bleu
(Plectropomus maculatus) et le vivaneau (Lutjanus carponotatus).
L'utilisation de l'analyse de parenté génétique est devenue une approche de
plus en plus rependue permettant d’enquêter sur les processus écologiques dans
les populations animales. Différente méthodes d'assignation sont fréquemment
utilisées, et la précision de chacune peut différer en fonction du nombre de
marqueurs génétiques examinés, de la diversité allélique, de l'échantillonnage de
la population et de la présence d'erreurs de séquençage. Dans le Chapitre 2,
j’examine comment ces facteurs affectent la précision de trois méthodes
d’assignation pour identifier les relations de parenté. En utilisant des données
simulées, j'ai été capable de capturer une grande diversité des conditions qui sont
couramment rencontrés dans les études de parenté. Les résultats de cette étude
démontrent clairement que le nombre et la diversité des marqueurs génétiques

xiv
sont les facteurs les plus importants pour l'obtention de résultats précis, tandis
que la proportion de parents candidats échantillonnés n'a qu'un faible impact sur
la sensitivité de chaque méthode.
Les microsatellites sont devenus le marqueur de choix dans les études de
parenté a cause de leur grande diversité allélique. Comme il est indiqué dans le
chapitre précédent, il s'agit d'un facteur important dans l'obtention de résultat
précis. Dans le Chapitre 3, je développe de nouveaux marqueurs microsatellites
spécialement conçus pour les analyses de parenté dans les populations naturelles
de mérou à pointe bleu (P. maculatus) et de vivaneau (L. carponotatus). Cela s'est
traduit par le développement de 11 et 13 marqueurs pour P. maculatus et L.
carponotatus, respectivement. Cet ensemble de marqueurs abouti à une valeur
d'exclusion de 99,99%, offrant ainsi un haut niveau de précision pour les études de
parenté.
Notre compréhension de l'échelle spatiale de la dispersion des poissons de
récifs a certainement changé notre perception de la règlementation des
populations marines. Cependant notre base de connaissances provient en grande
partie des systèmes d'études portant sur des espèces uniques utilisant des habitats
spécialisées. Pour les espèces à valeur commerciale qui ont le plus besoin d'une
gestion efficace, identifier où et dans quelle mesure les larves se dispersent reste
un obstacle important. Le Chapitre 4 démontre que les populations de poisson
dense présentes dans les réserves marines contribuent au recrutement de
juvéniles dans les populations avoisinantes. Au cours d'une étude de terrain
approfondie, des échantillons de tissus ont été prélevés à partir de mérous et de
vivaneaux adultes dans trois réserves marines des iles Keppel, un archipel côtier
de la Grande Barrière de Corail. Au cours des 15 mois suivants, les juvéniles des
deux espèces ont été recueillies tout autour de l'archipel jusqu’à 30 km des
réserves. En utilisant une analyse de parenté, j’ai pu identifier les juvéniles qui
provenaient de parents à l'intérieur des réserves. Basé sur leurs trajectoires de
dispersion, je montre que les populations dans les réserves ont fourni environ la
moitié de tout le recrutement dans l’archipel.
Dans le Chapitre 5, j’explore plusieurs hypothèses dans notre
compréhension de la dynamique des populations de poissons récifaux: (1) si les
structures spatiales de recrutement dérivée des adultes dans les réserves persistes

xv
au fil du temps, (2) si les l'approvisionnement des larves sont uniformes à travers
plusieur cohortes de recrutement; (3) si la taille de poissons adultes a un effet au
niveau du recrutement local ; (4) si les limites actuelles de taille de captures sont
efficaces pour protéger la biomasse reproductive, et (5) si l’abondance et la taille
de poissons dans les réserves sont importantes pour le recrutement local.
En combinant les données génétiques et démographiques, cette étude offre
un aperçu dans les processus démographiques des populations sauvages de
poissons récifaux et fournit des informations essentielles pour la gestion de ces
espèces de poisson. Au cours des trois cohortes successives, le recrutement a été
inégalement répartie à travers les îles Keppel avec trois sites de recrutement
principaux. Toutefois, les tendances spatiales étaient régulières avec une
homogénéité génétique entre les trois cohortes. Cela suggère que la population
locale était une source important du recrutement local. En utilisant les analyses de
parenté génétique j’identifie les adultes qui ont contribué au recrutement localqui
offrant une perspective unique sur le succès de reproduction des différentes taille
de poisson pour ces espèces.
En résumé, cette thèse offre une perspective unique sur la précision des
études de parenté dans les populations naturelles et identifie les points les plus
importants à prendre en compte lors du design de nouveaux marqueurs
microsatellites pour les analyses de parenté. Il fournit la première preuve
concluante que l'approvisionnement en larves de réserves marines est un gain à la
fois pour les stocks de poissons et pour les pêcheries, et comble une lacune
majeure qui a empêché une plus large acceptation des réseaux de réserves marines
comme stratégie viable et éfficace pour la gestion de la pêche.


xvii
TABLE OF CONTENTS
CHAPTER 1 -‐ GENERAL INTRODUCTION ................................................................... 27 DISPERSAL AND CONNECTIVITY ....................................................................................................................... 27 MARINE RESERVES IN FISHERIES MANAGEMENT .......................................................................................... 31 ASSESSING THE EFFECTIVENESS OF MARINE RESERVES IN THE GREAT BARRIER REEF MARINE PARK ................................................................................................................................................................................ 32
CHAPTER 2 -‐ RELATIVE ACCURACY OF THREE COMMON METHODS OF PARENTAGE ANALYSIS IN NATURAL POPULATIONS ..................................................................... 35 ABSTRACT ............................................................................................................................................................. 35 INTRODUCTION .................................................................................................................................................... 36 MATERIALS AND METHODS ............................................................................................................................... 40 Simulated datasets ...................................................................................................................... 40 Exclusion-‐Bayes’ Theorem – Christie method ................................................................. 43 Pairwise-‐Likelihood -‐ FAMOZ .................................................................................................. 44 Full-‐Likelihood -‐ COLONY ........................................................................................................... 44 Assignment errors ....................................................................................................................... 45
RESULTS ................................................................................................................................................................ 45 Relative accuracy of the three methods ............................................................................ 45 Trends in error types .................................................................................................................. 51
DISCUSSION .......................................................................................................................................................... 54 CONCLUSION ........................................................................................................................................................ 57
CHAPTER 3 -‐ DEVELOPMENT OF MULTIPLEX ASSAYS FOR PARENTAGE ANALYSIS FOR TWO CORAL REEF FISHES .................................................................................... 59 ABSTRACT ............................................................................................................................................................. 59 INTRODUCTION .................................................................................................................................................... 60 MATERIAL AND METHODS ................................................................................................................................ 62 Marker development -‐ Plectropomus maculatus .......................................................... 62 Microsatellite development -‐ Lutjanus carponotatus ................................................. 63 Microsatellite enrichment protocol ..................................................................................... 63 Multiplex reactions ..................................................................................................................... 64 Population genetics statistics ................................................................................................. 65
RESULTS ................................................................................................................................................................ 69 Microsatellites development ................................................................................................... 69 Multiplex PCR assays for parentage analyses ................................................................. 69
DISCUSSION .......................................................................................................................................................... 73 CONCLUSION ........................................................................................................................................................ 74
CHAPTER 4 -‐ LARVAL EXPORT FROM MARINE RESERVES AND THE RECRUITMENT BENEFIT FOR FISH AND FISHERIES ............................................................................ 75 ABSTRACT ............................................................................................................................................................. 75 INTRODUCTION .................................................................................................................................................... 76 MATERIAL AND METHODS ................................................................................................................................. 79 Natural history and fishery information ........................................................................... 79 Study location and sample collection ................................................................................. 80 Population and density estimates ........................................................................................ 81 Analysis of juvenile otoliths ..................................................................................................... 82 Measuring available coral reef area ................................................................................... 83 Parentage analysis ...................................................................................................................... 83 Estimating the total recruitment contribution of marine reserves ....................... 84
RESULTS ................................................................................................................................................................ 85

xviii
Dispersal trajectories from reserves ................................................................................... 85 Recruitment contribution of the reserve network ........................................................ 90
DISCUSSION ........................................................................................................................................................... 91 CHAPTER 5 – CONSISTENT SPATIAL, TEMPORAL AND ONTOGENETIC PATTERNS IN THE RECRUITMENT OF JUVENILE FISHES SOURCED FROM MARINE RESERVES 95 ABSTRACT ............................................................................................................................................................. 95 INTRODUCTION .................................................................................................................................................... 96 MATERIALS AND METHODS ................................................................................................................................ 99 Spatial and temporal patterns in local recruitment .................................................... 99 Genetic composition and source of successive juvenile cohorts ........................... 100 Relative recruitment contribution of different size classes of adult fish .......... 100 Relative recruitment contribution from no-‐take reserves and fished areas .. 101
RESULTS ............................................................................................................................................................. 102 Spatial and temporal patterns in local recruitment ................................................. 102 Genetic composition and source of successive cohorts ............................................ 104 Relative recruitment contribution of different size classes ................................... 109 Relative recruitment contribution protected and fished populations .............. 110
DISCUSSION ........................................................................................................................................................ 112 Consistent spatial recruitment patterns ........................................................................ 113 Temporal trajectories of juvenile recruitment ............................................................ 114 Bigger fish provide greater contribution to local recruitment ............................ 114 Legal catch size limits ............................................................................................................. 115 The role of marine reserves in fisheries management ............................................. 116
CONCLUSION ...................................................................................................................................................... 117 CHAPTER 6 -‐ GENERAL DISCUSSION ....................................................................... 119 INDIVIDUAL LEVEL GENETIC ANALYSES FOR CONNECTIVITY RESEARCH ................................................ 120 DEMOGRAPHIC CONNECTIVITY AND THE DESIGN OF MARINE RESERVE NETWORKS ............................ 121 FUTURE DIRECTIONS IN CONNECTIVITY RESEARCH .................................................................................... 123 CONCLUDING REMARKS ................................................................................................................................... 124
BIBLIOGRAPHY .............................................................................................................. 127 APPENDIX -‐ PUBLICATIONS ARISING FROM THIS THESIS ............................... 143
xix
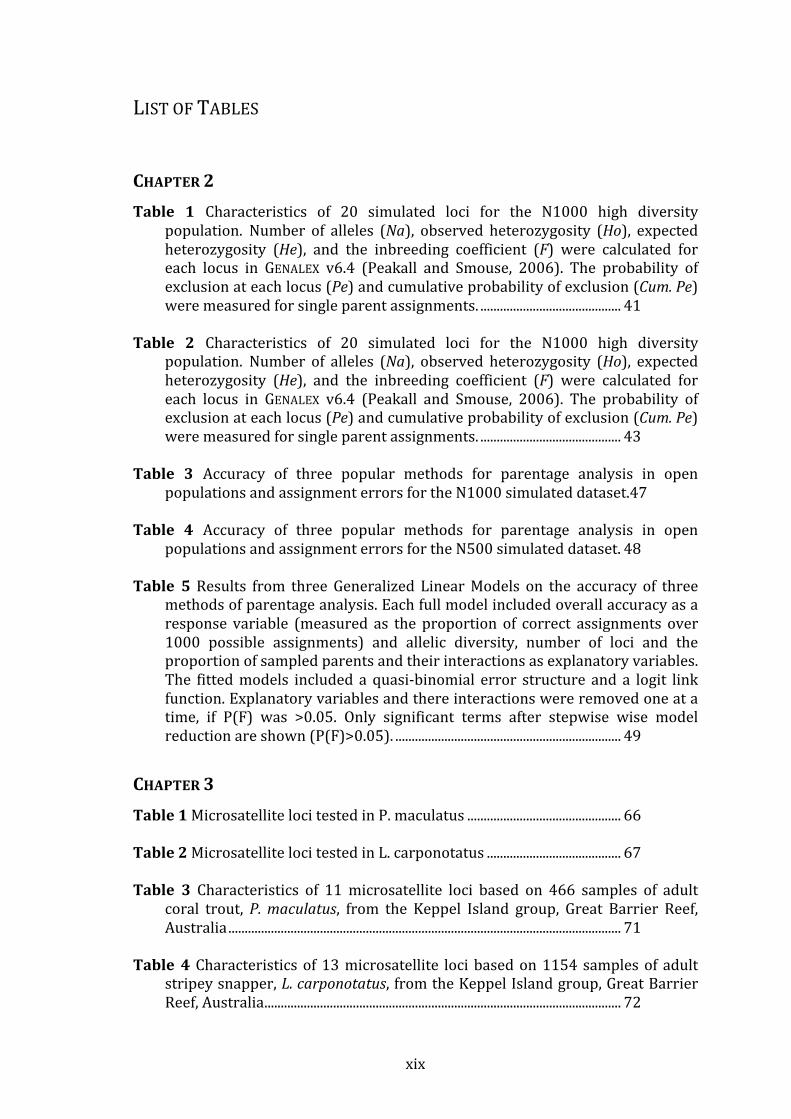
LIST OF TABLES
CHAPTER 2 Table 1 Characteristics of 20 simulated loci for the N1000 high diversity
population. Number of alleles (Na), observed heterozygosity (Ho), expected heterozygosity (He), and the inbreeding coefficient (F) were calculated for each locus in GENALEX v6.4 (Peakall and Smouse, 2006). The probability of exclusion at each locus (Pe) and cumulative probability of exclusion (Cum. Pe) were measured for single parent assignments. ........................................... 41
Table 2 Characteristics of 20 simulated loci for the N1000 high diversity
population. Number of alleles (Na), observed heterozygosity (Ho), expected heterozygosity (He), and the inbreeding coefficient (F) were calculated for each locus in GENALEX v6.4 (Peakall and Smouse, 2006). The probability of exclusion at each locus (Pe) and cumulative probability of exclusion (Cum. Pe) were measured for single parent assignments. ........................................... 43
Table 3 Accuracy of three popular methods for parentage analysis in open
populations and assignment errors for the N1000 simulated dataset.47 Table 4 Accuracy of three popular methods for parentage analysis in open
populations and assignment errors for the N500 simulated dataset. 48 Table 5 Results from three Generalized Linear Models on the accuracy of three
methods of parentage analysis. Each full model included overall accuracy as a response variable (measured as the proportion of correct assignments over 1000 possible assignments) and allelic diversity, number of loci and the proportion of sampled parents and their interactions as explanatory variables. The fitted models included a quasi-‐binomial error structure and a logit link function. Explanatory variables and there interactions were removed one at a time, if P(F) was >0.05. Only significant terms after stepwise wise model reduction are shown (P(F)>0.05). ..................................................................... 49
CHAPTER 3 Table 1 Microsatellite loci tested in P. maculatus ............................................... 66 Table 2 Microsatellite loci tested in L. carponotatus ......................................... 67 Table 3 Characteristics of 11 microsatellite loci based on 466 samples of adult
coral trout, P. maculatus, from the Keppel Island group, Great Barrier Reef, Australia ........................................................................................................................ 71
Table 4 Characteristics of 13 microsatellite loci based on 1154 samples of adult
stripey snapper, L. carponotatus, from the Keppel Island group, Great Barrier Reef, Australia ............................................................................................................. 72

xx
CHAPTER 4 Table 1 Juvenile sampling locations and the distribution of coral reef area in
reserves and fished locations in the Keppel Islands. ................................. 82 Table 2 Number of juvenile P. maculatus that were assigned to each of the three
source populations within marine reserves. All assignments were to a single parent. ............................................................................................................................. 88
Table 3 Number of juvenile L. carponotatus that were assigned to each of the three
source populations within marine reserves. Three juvenile L. carponotatus were assigned to both parents (indicated in brackets); all other assignments were to a single parents. ......................................................................................... 88
Table 4 Proportion of the total number of juvenile P. maculatus (N = 58) assigned
to adults in four protected populations in the Keppel Island group. 103
CHAPTER 5 Table 1 Proportion of the total number of juvenile P. maculatus (N = 58) assigned
to adults in four protected populations in the Keppel Island group. .................................................................................................................................................. 103 Table 2 Proportion of the total number of juvenile L. carponotatus (N = 74)
assigned to adults in four protected populations in the Keppel Island group. ................................................................................................................................ 104103
Table 2 Number of juvenile P. maculatus in three successive recruitment cohorts
in the Keppel Islands. ............................................................................................ 107 Table 3 Number of juvenile L. carponotatus in three successive recruitment
cohorts in the Keppel Islands. ........................................................................... 108 Table 4 Locus statistic for three successive juvenile P. maculatus cohorts. Number
of alleles (N), observed heterozygosity (Ho), expected heterozygosity (He), and the inbreefing coefficient (Fis) with associated p-‐values (P) were calculated for each locus in FSTAT. ................................................................... 109
Table 5 Locus statistic for three successive juvenile L. carponotatus cohorts.
Number of alleles (N), observed heterozygosity (Ho), expected heterozygosity (He), and the inbreefing coefficient (Fis) with associated p-‐values (P) were calculated for each locus in FSTAT. ................................................................... 109

xxi
LIST OF FIGURES
CHAPTER 2 Figure 1 There are only two correct decisions with regards to single parent
assignments, assigning the true parent when it is present in the sample (True assignment), and assigning no parent when the true parent is not in the sample (True exclusion). Assignment errors can be either false positive (falsely assigning an individual to a parent that is not its true parent) or false negative (falsely excluding a true parent). These are commonly referred to as Type I (false positive) and Type II (false negative) errors, respectively and can be estimated from simulations. False positives fall into two categories, falsely assigning to a parent when the true parent is in the sample, or when the true parent is not in the sample. To distinguish these from error estimates, I refer to these here as Type Ia and Type Ib errors, respectively. I refer to false negatives, falsely excluding a parent when it was in the sample as a Type II error. These errors cannot be calculated in real datasets unless the full pedigree is available. ............................................................................................... 39
Figure 2 Proportion of accurate assignments of three approaches to parentage
analyses. Each method was tested on high and low diversity simulated microsatellite datasets with high (1%) and low (0.1%) levels of genotyping error for varying levels of number loci and proportion of candidate parents sampled. Continuous lines correspond to the results from the full-‐likelihood method implemented in COLONY v2.0 (Wang 2004), dashed lines are the results from the pairwise-‐likelihood implemented in FAMOZ (Gerber et al. 2003), and dotted lines from the Christie method (Christie 2010). ........................... 46
Figure 3 Susceptibility of three popular methods of parentage analysis to Type Ia
errors under 60 independent scenarios. Number of false parent-‐offspring pairs where an offspring was assigned to a parent that was not its true parent when the true parent was in the sample varied with the number of loci (y-‐axis), allelic diversity in two simulated populations (N1000 & N500) level of genotyping error (0.1% & 1.0%). Continuous lines correspond to the results from the full-‐likelihood method implemented in COLONY v2.0, dashed lines are the results from the pairwise-‐likelihood implemented in FAMOZ, and dotted lines from the Christie method. .......................................................................... 52
Figure 4 Susceptibility of three popular methods of parentage analysis to Type Ib
errors under 60 independent scenarios. Number of false parent-‐offspring pairs where an offspring was assigned to a parent that was not its true parent when the true parent was not in the sample varied with the number of loci (y-‐axis), allelic diversity in two simulated populations (N1000 & N500) level of genotyping error (0.1% & 1.0%). Continuous lines correspond to the results from the full-‐likelihood method implemented in COLONY v2.0, dashed lines are the results from the pairwise-‐likelihood implemented in FAMOZ, and dotted lines from the Christie method. .......................................................................... 53

xxii
Figure 5 Susceptibility of three popular methods of parentage analysis to Type II errors under 60 independent scenarios. Number of false parent-‐offspring pairs where an offspring was not assigned when the true parent was in the sample varied with the number of loci (y-‐axis), allelic diversity in two simulated populations (high & low diversity) level of genotyping error (0.1% & 1.0%). Continuous lines correspond to the results from the full-‐likelihood method implemented in COLONY v2.0, dashed lines are the results from the pairwise-‐likelihood implemented in FAMOZ, and dotted lines from the Christie method. .......................................................................................................................... 54
CHAPTER 4 Figure 1 Sampling locations of adult and juvenile fish. The Keppel Islands includes
six no-‐take marine reserves (Marine National Park zones – shaded green) protecting 28% of coral reefs. Adult P. maculatus and L. carponotatus were sampled within three no-‐take reserves (dashed line borders) and juveniles were sampled from 19 locations (red stars) within both reserves and areas open to fishing (See also Table 1). Conservation Park zones (yellow) permit limited recreational hook-‐and-‐line and spear fishing. Habitat Protection zones (dark blue) exclude demersal trawling but permit hook-‐and-‐line and spear fishing. General Use zones (light blue) allow all types of fishing. ......... 77
Figure 2 Relative fish biomass in protected and fished areas. Mean biomass (kg
per 1000m2) of P. maculatus and L. carponotatus within no-‐take marine reserves (green bars) and fished areas (blue bars) in the Keppel Islands study area as estimated from December 2007 UVC surveys. The mean biomass of both species was significantly greater inside no-‐take reserves than in adjacent areas which are open to fishing (ANOVA: F1,20 = 12.87, P = 0.002 for P. maculatus, and F1,20 = 6.97, P = 0.016 for L. carponotatus). Error bars indicate ± 1 SE. .............................................................................................................................. 78
Figure 3 Realised dispersal patterns of juvenile fish from a network of marine
reserves. The three focal marine reserves (green boxes) were an important source of juvenile recruitment for local fished areas. 48 juvenile P. maculatus (A) and 41 juvenile L. carponotatus (B) that had recruited to fished areas were assigned to adults from one of three focal reserves (see also Table 2 and Table 3). Coral reef areas are represented in grey, and arrow thickness is relative to the number of juveniles that were assigned to each focal reserve. Local retention within focal reserves and connectivity between reserves (dotted green boxes) also made an important contribution to juvenile recruitment in reserves. 10 juvenile P. maculatus (C) and 33 juvenile L. carponotatus (D) that had recruited in reserves were assigned to adults from one of three focal reserves (see also Table 2 and Table 3). .......................................................... 87
Figure 4 Dispersal distance of assigned juvenile from natal reserves. The
frequency distributions of realised dispersal distances indicate that within the Keppel Islands, assigned juvenile P. maculatus (A) and L. carponotatus (B) were collected between 100’s of meters and 28 km from the location where

xxiii
their parents were sampled (average observed dispersal distance is indicated by the dashed vertical lines: 8.6 km ± 1.0 km SE for P. maculatus and 7.4 km ± 0.6 km SE for L. carponotatus). Each histogram bar is divided according to the number of assigned juveniles that returned to natal reserves (white), the number that dispersed from one reserve to another reserve (gray) and the number that dispersed from reserves to fished areas (black). (C) The distribution of available reef area open to fishing that surrounds each of the six marine reserves is within the mean dispersal range of both species (dashed vertical lines). ........................................................................................... 89
Figure 5 Local recruitment contribution from the reserve network. Observed
(dark green) and estimated (light green) contribution of six marine reserves to local recruitment of coral trout and stripey snapper in fished and protected areas of the Keppel Islands. Proportions are based on the number of assigned juveniles relative to the total number of juveniles (N) collected in reserves and fished area. The estimated proportion of additional recruitment accounts for both unsampled adults in the three focal reserves and the three unsampled reserves. Pie charts are scaled relative to the size of available coral reef habitat in reserves (28%) and fished areas (72%). ................................... 90
CHAPTER 5 Figure 1 The Keppel Islands include six no-‐take marine reserves protecting 28%
of coral reefs. Adult P. maculatus and L. carponotatus were sampled in three focal reserves represented by green boxes and juvenile fish of each species were collected in 19 locations throughout the island group. The size of pie charts is relative to the number of juveniles collected for each cohort and recruitment hotspots are present in dark circles. Grey areas represent coral reefs and green dashed lines represent other reserves in the island group. ......................................................................................................................................... 102
Figure 2 Time of spawn of sampled juvenile fish between May 2007 and February
2009. A total of 493 juvenile P. maculatus (A) and 465 juvenile L. carponotatus (B) were collected during two collection events in March 2008 and February 2009 (indicated by arrows). Time of spawning was inferred from daily ring counts of juvenile otoliths suggesting that three cohorts of each species settled during the study period. Parentage assignments identified 58 P. maculatus (C) and 74 L. carponotatus (D) as the progeny of adult fish collected in three focal reserves in the Keppel Islands. Time of spawning was inferred from daily ring counts of juvenile otoliths suggesting that three cohorts of each species settled during the study period. ....................................................................................... 105
Figure 3 Overall length frequency distribution of sampled and assigned adults in
populations of P. maculatus (A) and L. carponotatus (B) in no-‐take marine reserves of the Keppel Islands. For The number of sampled (NS) and assigned (NA) adults is shown for each location. Dashed lines represent the minimum legal catch length for each species. .................................................................. 109

xxiv
Figure 4 Length frequency distribution of sampled and assigned adults in
populations of P. maculatus and L. carponotatus in no-‐take marine reserves of the Keppel Islands. Four populations of P. maculatus (A) and L. carponotatus (B) are represented in three reserves of the island group. The number of sampled (NS) and assigned (NA) adults is shown for each location. Dashed lines represent the minimum legal catch length for each species. Locations are (a) Middle island; (b) Halfway island; (c) Clam bay; (d) Egg rock. ... 111
Figure 5 Relative reproductive success of mature size classes in fished and no-‐take
areas. The per capita reproductive success was infered from the number of adults assigned as parents, and therefore known to have contributed to local recruitment. Assuming that the relative proportion of mature coral trout (A) and stripey snapper (B) were representative of the populations in fished an no-‐take areas in the Keppel Islands, I measured their relative recruitment contribution from the per capita reproductive success for individual size classes of P. maculatus (C) and L. carponotatus (D). ............................... 112


27
CHAPTER 1 -‐ GENERAL INTRODUCTION
DISPERSAL AND CONNECTIVITY
Dispersal is a crucial ecological process, driving population dynamics and defining
the structure and persistence of populations across ecological and evolutionary
timescales (Krebs and Davies 1997; Hanski 1999; Clobert et al. 2001). At small
spatial scales, the movement of individuals can greatly impact the spatial dynamics
of local populations, connecting populations in fragmented landscapes and
allowing for the replenishment of harvested populations (Clobert et al. 2001). Over
larger spatial scales, dispersal drives the spread of invasive species (Mooney and
Hobbs 2000; Gaither et al. 2010, 2011), enables species range shifts in response to
environmental stressors (Simpson et al. 2011) and permits the re-‐colonisation of
disturbed and depleted populations (Trakhenbrot et al. 2005; Lotze et al. 2011).
Resolving patterns of connectivity and understanding the processes that influence
dispersal are therefore fundamental to our understanding of population dynamics
in all organisms.
The concept of population connectivity is broad and its definition remains
discreetly linked to the scale at which it is considered and the method employed to
measure it (Clobert et al. 2001; Lowe and Allendorf 2010). Genetic methods are
commonly used to infer the magnitude of connectivity at large spatial scales. They
rely on estimates of allelic frequency and diversity within subpopulations to
estimate the degree of historical gene flow between subpopulations. Genetic
connectivity is thus the degree to which gene flow affects evolutionary process
within populations (Lowe and Allendorf 2010). In contrast, on ecologically
relevant or contemporary timescales, connectivity refers to the degree to which
population growth is affected by the dispersal of individuals among them (Sale et
al. 2005; Lowe and Allendorf 2010). Unlike genetic connectivity, demographic

28
connectivity is a measure of migration between discreet populations and its
relative contribution to the replenishment and growth of focal populations.
New genetic tools, such as genetic parentage analysis, are now being
developed and applied to directly measure ecologically important levels of
migration between populations (Hellberg et al. 2002; Hedgecock et al. 2007). At
large spatial scales, or where gene flow is restricted, genetic assignment tests can
identify the origin of individuals provided that discreet populations are genetically
distinct and that all populations have been sampled (Cornuet et al. 1999; Pritchard
et al. 2000; Guillot 2005). At smaller spatial scales, parentage studies and family
reconstructions have become increasingly popular to investigate a range of
ecological processes in natural populations, including dispersal. Furthermore,
recent technical advances in both the isolation of molecular markers and the high-‐
throughput screening of multi-‐locus genotypes have made parentage studies more
widely accessible to ecologists (Selkoe and Toonen 2006; Guichoux et al. 2011;
Gardner et al. 2011). However, despite a proliferation of statistical approaches to
infer pedigree structure or kinship in natural populations (Blouin 2003; Jones and
Ardren 2003; Jones et al. 2010), parentage analysis remains a relatively new
procedure and has successfully been applied to only a small range of species.
LARVAL CONNECTIVITY IN CORAL REEF FISH POPULATIONS
Coral reefs are inherently patchy and fragmented, consisting of spatially
heterogeneous populations linked primarily by larval dispersal. In recent years,
substantial effort has been made to identify patterns of connectivity in coral reef
fishes to understand how fragmented reef populations are sustained (Sale 2004;
Steneck et al. 2009), with the aim of informing conservation efforts (Kinlan et al.
2005; Trakhtenbrot et al. 2005; Jones et al. 2009, McCook et al. 2009) and better
manage exploited fishes (Roberts et al. 2001; Sale et al. 2005; Steneck and Wilson
2010). Since the large majority of coral reef fish are site-‐attached as adults,
connectivity between discreet populations depends on the successful migration of
planktonic larvae (Shanks 2009). However, tracking their dispersal trajectories has

29
remained a long-‐standing challenge, leaving the dispersal potential of pelagic
larvae largely unknown (Jones et al. 2009; Levin 2006).
While direct measures of demographic connectivity remain challenging,
several approaches have been applied to track the dispersal of coral reef fish
larvae. Capture-‐mark-‐recapture, perhaps one of the oldest methods to study the
movement of animals, provides unequivocal individual dispersal patterns. The
challenge is identifying ways to tag individual larvae, which are too small for
physical tags and disperse in the thousands from their source of origin. One of the
first attempts to obtain empirical measures of larval dispersal used mass marking
of post-‐natal eggs using a tetracycline ‘dye’. These could later be traced in the core
of larval otoliths (Jones et al. 1999). Though ideal for small populations of benthic
spawners, it has since been replaced by a new technique that allows trans-‐
generational mass marking of pre-‐natal eggs (Jones et al. 2005; Thorrold et al.
2006) and has a wider range of applications. The approach is based on the in vivo
transmission of natural elements to eggs from mothers that were injected with a
saline solution of natural isotopes (Thorrold et al. 2006). Isotopic ratios in the core
of the otolith can then trace the source of juvenile fish back to their natal
population. Different source populations can be branded with different isotopic
ratios allowing multiple populations to be targeted (Almany et al. 2007; Planes et
al. 2009). While these techniques have altered our perceptions of how far larvae
disperse, they are essentially mass-‐marking methods that provide no additional
information on the dispersal trajectories of individual larvae.
Genetic parentage analysis offers a powerful alternative for quantifying
dispersal and population connectivity in coral reef fishes (Jones et al. 2005; Planes
et al. 2009). It was first used in conjunction with tetracycline tagging to establish
local self-‐recruitment in clownfish populations (Jones et al. 2005; Saenz Agudelo et
al. 2009), and later with trans-‐generational isotope labelling to measure the
relative magnitude of self-‐recruitment and connectivity among populations
(Planes et al. 2009). Applications of genetic parentage analysis have since been
expanded to investigate the dispersal trajectories of larvae that encompass a range
of other species (Christie et al. 2010a; Saenz-‐Agudelo et al. 2011; Berumen et al.
2012; Saenz-‐Agudelo et al. 2012). Parentage studies and sibship reconstructions
have also given us unique insights into the mating behaviour and reproductive

30
success of coral reef fish (Araki et al. 2007; Beldade et al. 2012), and kin
association of recruiting larvae (Buston et al. 2007; Piyapong et al. 2011; Bernardi
et al. 2012). While it promises to be an extremely powerful approach to elucidating
dispersal trajectories and community structure for coral reef fish, its performance
in identifying long-‐distance dispersal has not been fully evaluated.
To date, evidence for long-‐distance dispersal (100-‐1000s km) comes from
studies of evolutionary processes that measure historical gene flow (Purcell et al.
2006), while attempts to infer large-‐scale patterns of dispersal using
oceanographic models (Cowen et al. 2006; Kool et al. 2011; Foster et al. 2012) are
as yet, unvalidated estimates of demographic connectivity. However, the
behavioural and ontogenetic characteristics of coral reef fish larvae (Shanks 2009;
Leis et al. 2007, 2009), broad-‐scale genetic homogeneity (Purcell et al. 2006; Mora
et al. 2011) and coupled-‐biophysical models (Roberts 1997; Cowen et al. 2006;
Treml et al. 2008) all suggest larvae also have the potential to undertake long
migrations during their pelagic phase. The application of parentage analysis over
ever-‐greater spatial scales and novel approaches using a combination of genetic
analyses and oceanographic data (Gerlach et al. 2007; Galarza et al. 2009; White et
al. 2010; Schunter et al. 2011) now have the potential to validate other approaches
to investigate broad-‐scale connectivity patterns.
Our understanding of the spatial scale of dispersal in coral reef fishes has
certainly altered our perception of how populations are regulated (Cowen et al.
2000; Swearer et al. 2002; Mora and Sale 2002; Warner and Cowen 2002; Jones et
al. 2009). While population were once considered largely ‘open’, the ubiquity of
self-‐recruitment demonstrates that coral reef fish population are at least partially
regulated by local demographic processes. Levels of self-‐recruitment, typically
reported within the range of 30-‐60% (Jones et al. 2009), have important
implications for fish conservation and fisheries management. However, our
knowledge-‐base largely stems from unique study systems involving habitat-‐
specialised species with high site fidelity. For large exploited species of commercial
value and greatest need of effective management, it has been seemingly impossible
to identify where or how far larvae go. Addressing this knowledge gap remains an
important challenge in fisheries management that limits our understanding of the
processes that regulate the replenishment of fished and protected populations.

31
MARINE RESERVES IN FISHERIES MANAGEMENT
Coral reefs are extremely fragile ecosystems, threatened by a rapidly changing
environment, increasing coastal pollution, and overexploitation of natural
resources (Pandolfi et al. 2003; Hughes et al. 2005; Hoegh-‐Guldberg et al. 2007;
De’ath et al. 2012). Effective conservation and management of coral reef
ecosystems is vital to mitigate the impacts of human activities and ensure the
future of coral reefs. While there is no single solution to alleviate such impacts, no-‐
take marine reserves represent one management action that can deliver tangible
and often rapid benefits (Pauly et al. 2002; Gell and Roberts 2003; Lubchenco et al.
2003; Gaines et al. 2010). Thousands of marine reserves have been implemented
globally in hope of restoring and sustaining fisheries and conserving biodiversity
(Mora et al. 2006; Wood et al. 2008). While studies universally demonstrate that
exploited fish are larger and more abundant within adequately protected reserves
(Halpern 2003; Lester et al. 2009; Babcock et al. 2010; Russ et al. 2008), such
benefits do little to sustain fisheries or protect populations at large, unless the
benefits extend beyond individual reserve boundaries (Gell and Roberts 2003; Sale
et al. 2005). Understanding the extent of larval dispersal is critical for the success
of fisheries management and conservation policies (Palumbi 2003; Roberts 1997;
Cowen et al. 2000; Sale et al. 2005).
Marine reserves certainly have the potential to simultaneously benefit both
unfished and fished populations. In theory, the increased abundance, size and
reproductive output of individuals inside reserves can provide substantial benefits
to neighbouring fished areas through the ‘spillover’ of adults and the export of
larval progeny. While there is evidence that both these processes occur (Russ et al.
2004; Abessamis and Russ 2005; Roberts et al. 2005; Pelc et al. 2010; Russ and
Alcala 2011), adult spillover alone is unlikely to offset the displacement of fishing
effort and the local recruitment contribution from larval export has yet to be
quantified. The implementation of no-‐take marine reserves thus creates the
possibility of a conflict between fishery and conservation objectives, where there is
a compromise between maximising their conservation benefits (Almany et al.
2009) and minimising their impact on fisheries. Connectivity is increasingly
recognised as a central tenet of this debate. In order to fulfil both conservation and

32
fisheries objectives, reserves must simultaneously enhance populations within
reserves, through larval retention or dispersal amongst reserves, and provide
substantial larval export to fished areas. To be considered as a viable fisheries
management tool, no-‐take reserves must also provide demonstrable benefits to
neighbouring areas open to fishing.
In 2004, the Great Barrier Reef Marine Park (GBRMP) was restructured in a
comprehensive network of marine protected areas with the premise of (1)
providing grounds for sustainable exploitations, which assumed ‘spillover’ from
reserves, and (2) biodiversity conservation, which assumed some migration
between reserves. In the re-‐zoning process, 33.4% of the Great Barrier Reef (GBR)
was designated in no-‐take zones, creating the largest network of no-‐take marine
reserves in the world. If the effectiveness of marine parks is fundamentally
dependent on the dispersal of pelagic larvae then there is great incentive to
understand processes of larval dispersal and introduce networks of marine
reserves that encompass the full life cycles of target species and the diversity of
habitats they require.
ASSESSING THE EFFECTIVENESS OF MARINE RESERVES IN THE GREAT BARRIER
REEF MARINE PARK
This thesis is a first attempt at understanding the dispersal patterns and spatio-‐
temporal recruitment dynamics of two important fisheries species within a
network of no-‐take marine reserve on the Great Barrier Reef: the coral trout,
Plectropomus maculatus, and the stripey snapper, Lutjanus carponotatus. This is an
extremely challenging and demanding endeavour, which requires bridging the
fundamentals of coral reef ecology and fisheries science, while developing new
applications for individual level genetic profiling. Applying methods of parentage
analysis to such species has never before been attempted. These are highly mobile
species as adults and cryptic as juveniles and obtaining representative proportions
of focal populations requires a large investment in sampling. Furthermore, as non-‐
model organisms, it entails the development of novel genetic markers that are
sufficiently informative to distinguish between individuals and identify true

33
parent-‐offspring pairs from erroneous assignments. Since a compromise must be
made between the costs of developing and processing a large number of markers
and sampling effort, it is also necessary to ensure that the methods we apply do
not infringe on the accuracy of parentage assignments.
Parentage studies and family reconstructions have become increasingly
popular for investigating a range of evolutionary, ecological and behavioural
processes in natural populations. However, in natural populations where
exhaustive sampling is prohibitive, variation in the proportion of sampled parents
can have a significant impact on the accuracy of parentage reconstructions
(Hadfield et al. 2006; Kock et al. 2008; Nielsen et al. 2001). Furthermore, a number
of different assignment methods have emerged in common use, and the accuracy
of each may differ in relation to the number of loci examined, allelic diversity,
incomplete sampling of all candidate parents, and the presence of genotyping
errors. I start in Chapter 2, by exploring how these different factors affect the
accuracy of three distinct parentage inference methods to resolve true parent-‐
offspring pairs. Using simulated data, I was able to capture a wide diversity of
conditions that are commonly encountered in parentage studies and identified key
factors for the identification of true parent-‐offspring pairs in natural populations.
Designing microsatellite markers for non-‐model organisms can be
challenging. In Chapter 3, I describe the development of a novel suite of
microsatellite markers for P. maculatus and L. carponotatus and their integration
to multiplex PCRs for parentage analysis. Markers were selected from previously
published marker sets developed for congeneric species or described here from
species-‐specific cloning libraries. As identified in the previous chapter, the number
and diversity of loci are the most important factors in obtaining accurate
parentage assignments. I therefore preferentially selected highly polymorphic
markers and maximised the number of loci given available technologies. I further
describe their integration into multiplex PCRs for high-‐throughput genotyping, and
their application to parentage analysis.
Identifying the extent to which larval offspring are exported and the relative
contribution of reserves to recruitment in both fished and protected areas
represent some of the major challenges of marine reserve research for the last 20
years. Chapter 4 provides the first conclusive evidence that larval supply from

34
marine reserves benefits both fish and fisheries, and fills a major knowledge gap
that has impeded wider acceptance of marine reserve networks as a viable and
effective fisheries management strategy. This large field based study hinges on
previous chapter to track the dispersal pathways of juvenile coral trout and stripey
snapper throughout a network of no-‐take marine reserves in the Great Keppel
islands, an island archipelago of the southern Great Barrier Reef. Using parentage
analysis, I assigned juveniles collected in both fished and protected location
throughout the island group back to their parents sampled inside reserves. Based
on the observed dispersal trajectories, I was able to show that populations within
reserves were responsible for supplying approximately half of all juvenile
recruitment within 30km of reserves.
As a major source of local recruitment, no-‐take marine reserve networks are
likely to play an important role in shaping local population dynamics. In Chapter
5, I explore some of the majors assumptions in our understanding of population
dynamics for the management of coral reef fishes: (1) whether the spatial patterns
of recruitment derived from adults in reserves are persistent over time; (2)
whether patterns of larval supply are consistent across multiple cohorts; (3)
whether larger adult fishes account for a greater proportion of local recruitment
(settlement) than smaller adult fish; (4) whether fish below the legal length limit
contribute to local recruitment; and (5) whether the more abundant and larger fish
in reserves are important to local recruitment. This study represents the first
explicit assessment of reproductive success and stock-‐recruitment relationships
for these commercially targeted fish.

35
CHAPTER 2 -‐ RELATIVE ACCURACY OF THREE COMMON METHODS OF
PARENTAGE ANALYSIS IN NATURAL POPULATIONS
ABSTRACT
Parentage studies and family reconstructions have become increasingly popular
for investigating a range of evolutionary, ecological and behavioural processes in
natural populations. However, a number of different assignment methods have
emerged in common use and the accuracy of each may differ in relation to the
number of loci examined, allelic diversity, incomplete sampling of all candidate
parents, and the presence of genotyping errors. Here I examine how these factors
affect the accuracy of three popular parentage inference methods (COLONY, FAMOZ
and an exclusion-‐Bayes’ theorem approach by Christie (2010)) to resolve true
parent-‐offspring pairs using simulated data. Our findings demonstrate that
accuracy increases with the number and diversity of loci. These were clearly the
most important factors in obtaining accurate assignments explaining 75-‐90% of
variance in overall accuracy across 60 simulated scenarios. Furthermore, the
proportion of candidate parents sampled had a small but significant impact on the
susceptibility of each method to either false positive or false negative assignments.
Within the range of values simulated, COLONY outperformed FAMOZ, which
outperformed the exclusion-‐Bayes’ theorem method. However, with 20 or more
highly polymorphic loci, all methods could be applied with confidence. Our results
show that for parentage inference in natural populations, careful consideration of
the number and quality of markers will increase the accuracy of assignments and
mitigate the effects of incomplete sampling of parental populations.

36
INTRODUCTION
Our ability to infer genealogical relationships among individuals has become an
effective approach to investigate a wide variety of evolutionary, ecological and
behavioural questions. Pedigrees, often based on a combination of observation and
molecular data, have given us invaluable insights into mating systems, revealing
the prevalence of extra-‐pair paternities and cooperative breeding in the wild (e.g.
Richardson et al. 2001; Magrath et al. 2009), mating behaviour and reproductive
success (Araki et al. 2007; Kanno et al. 2011; Rodrigues-‐Munoz et al. 2010; Ford et
al. 2011; Beldade et al. 2012), and kin association (e.g. Reeve et al. 1990; Buston et
al. 2007; Piyapong et al. 2010) in diverse animal groups. Parentage studies and
sibship reconstructions have also become increasingly popular approaches to
estimate population parameters such as self-‐recruitment (Jones et al. 2005; Saenz-‐
Agudelo et al. 2009; Saenz-‐Agudelo et al. 2012), fine scale population structure
(e.g. Nussey et al. 2005; Slavov et al. 2010) and population connectivity in the form
of migration (Nathan et al. 2003; Harrison et al. 2010) or dispersal (e.g. Garcia et
al. 2005, 2007; Jordano et al. 2007; Planes et al. 2009; Christie et al. 2010a; Saenz-‐
Agudelo et al. 2011, 2012; Berumen et al. 2012). Parentage studies have also
revealed new aspects of inbreeding and trait heritability (Ritland 2000; Garant and
Kruuk 2005; Pemberton 2008; Nielsen et al. 2012), genetic adaptation of wild
species to captivity (Christie et al. 2012) and assisted in the restoration of captive
and endangered populations (Keller and Waller 2002; Herbinger et al. 2006).
Individual level analyses can resolve family relationships in a wide range of taxa
where this information has proven difficult to obtain from direct observations.
Recent technical advances in both the isolation of molecular markers, notably
microsatellites or SNPs, and the high-‐throughput screening of multi-‐locus
genotypes are likely to make parentage studies more widely accessible to
ecologists studying wild populations (Selkoe and Toonen 2006; Guichoux et al.
2011; Gardner et al. 2011). However, despite a proliferation of statistical
approaches to infer pedigree structure or kinship relationships among pairs of
individuals in natural populations (reviewed in Blouin 2003; Jones and Ardren
2003; Jones et al. 2010), parentage analysis remains a relatively new procedure. A

37
number of different approaches are currently being used, but the factors affecting
the relative accuracy of the different approaches have received little attention.
The methods used to identify parent-‐offspring relationships can be broadly
divided into four categories: strict exclusion, categorical assignment, fractional
assignment and pedigree reconstruction (Jones et al. 2010). Among these, the most
commonly used methods are strict exclusion and categorical assignment, whereby
the genotype of each offspring is compared to the genotype of all candidate
parents. For strict exclusion methods, any parent failing to share at least one allele
at a given locus is excluded. If more than one parent cannot be excluded,
categorical assignments measure the likelihood of each putative parent-‐offspring
pair of being true given their respective multi-‐locus genotype and the observed
allelic frequencies in the population (Marshall et al. 1998; Nielsen et al. 2001,
Gerber et al. 2003; Kalinowski et al. 2007). Categorical assignment approaches
offer several advantages over strict exclusion methods (Danzmann 1997;
Goodnight and Queller 1999) as they can more easily accommodate scoring errors,
missing data or null alleles that commonly occur in microsatellite datasets
(Pemberton et al. 1995; Dakin and Avise 2004; Pompanon et al. 2005; Wang 2010).
However, in the right circumstances, strict exclusion can be a powerful approach,
and could prove useful to detect parent-‐offspring pairs in large open populations
(Christie 2010). Recently, full-‐probability approaches for parental or sibship
reconstructions have also become more accessible and widely applied. Rather than
simply evaluating pairwise relationships, individuals are clustered into family
groups and the likelihood of different clusters is evaluated to identify the most
parsimonious configuration (Almudevar and Field 1999; Thomas and Hill 2002;
Wang 2004; Hadfield et al. 2006; Wang and Santure 2009; Jones and Wang 2010a;
Almudevar and Anderson 2012). In turn, accounting for the presence of family
groups provides valuable information that significantly enhances the accuracy of
assignments (Wang 2007; Walling et al. 2010).
All the above methods are subject to incorrect assignments that may be
affected by the number and allelic diversity of loci examined (Bernatchez and
Duchesne 2000; Nielsen et al. 2001), the proportion of the population sampled
(Oddou-‐Muratorio et al. 2003; Koch et al. 2008), genotyping errors, mutations,
allelic dropouts and miscalling (Bernatchez and Duchesne 2000; Hoffman and

38
Amos 2005). However, having only a limited number of genetic markers and
incomplete sampling of all candidate parents are thought to have the largest effects
on the accuracy of assignments (Marshall et al. 1998; Nielsen et al. 2001; Wilson
and Ferguson 2002; Oddou-‐Muratorio et al. 2003; Jones et al. 2010). Some
likelihood-‐based approaches such as CERVUS (Marshall et al. 1998; Kalinowski et al.
2007) and full likelihood methods such as COLONY (Wang 2004; Jones and Wang
2010a) account for incomplete sampling by defining a priori the probability that
the true parent is present in the sample. This probability can be estimated from the
proportion of putative parents sampled from the entire parental population, which
requires prior knowledge, or approximation, of the size of the population. While
COLONY is robust to uncertainty in this sampling rate (Wang and Santure 2009;
Jones and Wang 2010b), mis-‐specification of this parameter in CERVUS can have
significant impact on assignments made (Nielsen et al. 2001; Hadfield et al. 2006;
Koch et al. 2008).
Other approaches have been developed to infer parentage without prior
knowledge of population size or the proportion of candidate parents in the sample.
Such methods have been favoured to assess population connectivity in large
populations (mostly plants and marine fish) where accurate estimates of the
breeding population size are often difficult to obtain. For instance, the pairwise-‐
likelihood method implemented in FAMOZ (Gerber et al. 2003) estimates the
likelihood ratios (LOD scores) of putative parent-‐offspring pairs being true and
determines critical thresholds to accept or reject assignments by simulating true
and false parent-‐offspring pairs. The calculation of LOD scores is based on the
same approach as CERVUS (Meagher and Thompson 1986; Marshall et al. 1998;
Gerber et al. 2000), however FAMOZ does not require a priori information of the
proportion of candidate parents in the sample to determine critical LOD
thresholds. The exclusion-‐Bayes’ theorem approach by Christie (2010) is another
method that follows in this category. It consists of calculating the probability of
false parent-‐offspring pairs in a dataset to determine if all putative parent-‐
offspring pairs can be accepted with strict exclusion. In situations where the
dataset lacks sufficient power, Bayes’ theorem is used to determine the probability
of putative parent-‐offspring pairs being false given the frequencies of shared
alleles. This approach was designed for situations where only a small fraction of all

39
candidate parents can be sampled, and does not require a priori information of the
proportion of candidate parents in the sampled population or other demographic
parameters (Christie 2010). While the effects of the mis-‐specification of the
proportion of sampled candidate parents in CERVUS has been evaluated and
discussed elsewhere (Hadfield et al. 2006; Koch et al. 2008; Nielsen et al. 2001), it
is unclear how the absence of this parameter may affect the performance of
exclusion and categorical assignment approaches, such as those implemented in
FAMOZ and exclusion based approaches, especially under different sampling rates.
Figure 1 There are only two correct decisions with regards to single parent assignments, assigning the true parent when it is present in the sample (True assignment), and assigning no parent when the true parent is not in the sample (True exclusion). Assignment errors can be either false positive (falsely assigning an individual to a parent that is not its true parent) or false negative (falsely excluding a true parent). These are commonly referred to as Type I (false positive) and Type II (false negative) errors, respectively and can be estimated from simulations. False positives fall into two categories, falsely assigning to a parent when the true parent is in the sample, or when the true parent is not in the sample. To distinguish these from error estimates, I refer to these here as Type Ia and Type Ib errors, respectively. I refer to false negatives, falsely excluding a parent when it was in the sample as a Type II error. These errors cannot be calculated in real datasets unless the full pedigree is available.
The aim of the present study was to assess the accuracy of three popular
methods of parentage analysis and investigate their susceptibility to error under
60 different scenarios that incrementally simulate the number of loci, allelic
False positiveType Ib
False positiveType Ia
False assignmentTrue assignment
OFFSPRING
True exclusion
EXCLUDEDASSIGNED
False negativeType II
Was the true parent in the sample?
Was it assigned to its true parent? Was the true parent in the sample?
Was it assigned?
yes no yes no
yes no
yes no

40
diversity, adult sample size and genotyping error. Simulated offspring were
assigned to single parents using the exclusion-‐Bayes’ theorem approach developed
by Christie (2010) (hereafter referred to as ‘the Christie method’), the pairwise-‐
likelihood method implemented in FAMOZ (Gerber et al. 2003), and the full
probability approach implemented in version 2.0 of COLONY (Wang 2004). Putative
parent-‐offspring pairs were validated against known true parents and assignment
errors were classified as described in Figure 1. I then examined how the number of
assignment errors was correlated with the number of loci, allelic diversity and
proportion of adults sampled from the population.
MATERIALS AND METHODS
Simulated datasets
Two parental datasets, of different population sizes, were generated in EASYPOP
(Balloux 2001) in order to achieve different levels of allelic diversity while
maintaining all remaining simulation parameters constant. While the difference in
population size between both datasets has little relevance to the accuracy of
assignments, this procedure allowed us to explore the effects of allelic diversity on
assignments. The two parental datasets were based on a finite island model with 5
subpopulations, each of constant size and equal sex ratio. The first dataset
consisted of 500 reproductive individuals with 100 individuals per subpopulation.
The second dataset consisted of 1000 reproductive individuals with 200
individuals per subpopulation. These will subsequently be referred to as the N500
(low diversity) and N1000 (high diversity) populations, respectively. For both
datasets, random mating was simulated to produce diploid genotypes at 20
independent loci for 5000 generations to approximate mutation-‐drift equilibrium
(Waples and Gaggiotti 2006). Migration between subpopulations occurred with a
probability of 0.15 to simulate high gene flow and demographic connectivity
among subpopulations. This is equivalent to 15 and 30 migrants per generation for
the N500 and N1000 populations, respectively. All loci had the same mutation
dynamics, which occurred according to the K-‐allele model (each mutation equally
likely to occur at any of K possible sites). Mutation rate (µ=1x10-‐4) and number of
41
allelic states (20 possible allelic states) were considered to represent highly
polymorphic markers, such as microsatellites, within the ranges published in
eukaryotic genomes (Buschiazzo and Gemmel 2006). Our simulated datasets
represented an assorted array of loci akin to most microsatellite datasets.
Individual locus characteristics for each simulated dataset were calculated in
GENALEX v6.4 (Peakall and Smouse 2006). The N1000 population represented a
more diverse and, therefore, informative dataset with an average of 14.9 (11 to 18)
alleles per locus and average observed heterozygosity of 0.769 ± 0.070 S.D. (0.650
to 0.877) per locus (Table 1). In comparison, the N500 populations had lower
allelic diversity with an average of 10.7 alleles per loci (7 to 14) and an observed
heterozygosity of 0.655 ± 0.144 S.D. (0.396 to 0.874; Table 2). The probability of
exclusion of each locus and the cumulative probability of exclusion of each dataset
were calculated according to Jamieson and Taylor (1997) as the probability of
excluding a single parent (Table 1-‐2).
For each of the two parental datasets, 1000 offspring genotypes were
generated using the software package P-‐LOCI (Matson et al. 2008). Adults were
paired randomly within each subpopulation and four offspring were generated for
each adult pair under a monogamous mating system. This resulted in 250 adult
pairs, which was necessary to keep offspring sample size equal between datasets
and reduce computation time of parentage analyses. Offspring were generated
following Mendelian inheritance with 0.1% and 1% genotyping error, which are
typical of microsatellite loci (Pompanon et al. 2005). Each parental population was
randomly sampled into samples representing 20, 40, 60, 80, and 100 per cent of
the parental population and the resulting datasets were further subset taking the
first 10, 15 and 20 loci, totalling 60 independent datasets. All datasets were
deposited in the Dryad digital repository. Each of these datasets was then analysed
using the following three freely available software packages to identify parent-‐
offspring pairs.
Table 1 Characteristics of 20 simulated loci for the N1000 high diversity population. Number of alleles (Na), observed heterozygosity (Ho), expected heterozygosity (He), and the inbreeding coefficient (F) were calculated for each locus in GENALEX v6.4 (Peakall and Smouse, 2006). The probability of exclusion at each locus (Pe) and cumulative probability of exclusion (Cum. Pe) were measured for single parent assignments.

42
N1000 Na Ho He F Pe Cum. Pe
Locus-‐1 16 0.679 0.675 -‐0.007 0.2897 0.2897 Locus-‐2 15 0.821 0.837 0.019 0.5133 0.6543 Locus-‐3 11 0.767 0.779 0.016 0.3930 0.7902 Locus-‐4 12 0.755 0.759 0.005 0.3988 0.8738 Locus-‐5 14 0.785 0.786 0.001 0.4288 0.9279 Locus-‐6 13 0.773 0.775 0.003 0.3953 0.9564 Locus-‐7 18 0.814 0.810 -‐0.005 0.4593 0.9764 Locus-‐8 18 0.819 0.827 0.010 0.4912 0.9880 Locus-‐9 18 0.844 0.837 -‐0.008 0.5249 0.9943 Locus-‐10 11 0.815 0.799 -‐0.020 0.4455 0.9968 Locus-‐11 15 0.667 0.679 0.017 0.2948 0.9978 Locus-‐12 17 0.827 0.840 0.015 0.5339 0.9990 Locus-‐13 17 0.797 0.821 0.030 0.4874 0.9995 Locus-‐14 15 0.650 0.658 0.012 0.2636 0.9996 Locus-‐15 17 0.877 0.871 -‐0.006 0.5952 0.9998 Locus-‐16 17 0.817 0.825 0.010 0.4936 0.9999 Locus-‐17 14 0.817 0.817 0.000 0.4586 1.0000 Locus-‐18 12 0.721 0.726 0.007 0.3385 1.0000 Locus-‐19 14 0.650 0.662 0.018 0.2719 1.0000 Locus-‐20 15 0.683 0.694 0.015 0.3004 1.0000
Average 14.95 0.769 0.774 0.007 0.4189 SD 2.305 0.070 0.068 0.012 0.0984

43
Table 2 Characteristics of 20 simulated loci for the N1000 high diversity population. Number of alleles (Na), observed heterozygosity (Ho), expected heterozygosity (He), and the inbreeding coefficient (F) were calculated for each locus in GENALEX v6.4 (Peakall and Smouse, 2006). The probability of exclusion at each locus (Pe) and cumulative probability of exclusion (Cum. Pe) were measured for single parent assignments. N500 Na Ho He F Pe Cum. Pe
Locus-‐1 13 0.774 0.781 0.009 0.3980 0.3980 Locus-‐2 11 0.626 0.639 0.020 0.2381 0.5414 Locus-‐3 9 0.624 0.637 0.020 0.2509 0.6564 Locus-‐4 12 0.482 0.504 0.043 0.1395 0.7043 Locus-‐5 7 0.590 0.617 0.044 0.2251 0.7709 Locus-‐6 13 0.670 0.674 0.006 0.2807 0.8352 Locus-‐7 13 0.874 0.868 -‐0.006 0.5749 0.9299 Locus-‐8 10 0.810 0.821 0.013 0.4646 0.9625 Locus-‐9 9 0.396 0.389 -‐0.017 0.0817 0.9656 Locus-‐10 10 0.526 0.552 0.048 0.1590 0.9710 Locus-‐11 12 0.808 0.774 -‐0.044 0.4000 0.9826 Locus-‐12 12 0.434 0.430 -‐0.009 0.1075 0.9845 Locus-‐13 11 0.418 0.437 0.043 0.1088 0.9862 Locus-‐14 13 0.772 0.785 0.017 0.4284 0.9921 Locus-‐15 9 0.720 0.714 -‐0.009 0.3168 0.9946 Locus-‐16 7 0.634 0.643 0.014 0.2278 0.9958 Locus-‐17 14 0.832 0.829 -‐0.004 0.4994 0.9979 Locus-‐18 9 0.676 0.669 -‐0.011 0.2601 0.9985 Locus-‐19 10 0.696 0.716 0.028 0.3133 0.9989 Locus-‐20 10 0.728 0.699 -‐0.042 0.2829 0.9992
Average 10.7 0.655 0.659 0.008 0.288 S.D. 2.029 0.144 0.138 0.026 0.138
Exclusion-‐Bayes’ Theorem – Christie method
The method described by Christie (2010) is an unbiased exclusion probability
designed to identify true parent-‐offspring pairs in large populations where the
proportion of sampled parents is low. For each dataset I calculated the probability
of observing shared alleles between unrelated individuals using 1,000 simulations,
then calculated the probability of each putative parent-‐offspring pair being false
given the frequency of shared alleles. This method does not explicitly account for
genotyping error or marker specific error rates, but allows for mismatches
between parent-‐offspring pairs. Assignments are made to single parents only and
parent pairs in the sample are not considered. When assigned, each parent-‐
offspring pair is given a probability and several adults may be assigned to the same
offspring. When two or more putative parents were assigned to the same offspring,

44
only the parent with the highest probability of assignment was kept for further
analyses. This method was implemented in R v2.14.0 (R Development Core Team).
Pairwise-‐Likelihood -‐ FAMOZ
The software program FAMOZ (Gerber et al. 2003) allows for the categorical
allocation of parent-‐offspring pairs based on a maximum likelihood approach. The
program computes log of the odds ratio (LOD) scores for assigning individuals to
candidate parents based on the observed allelic frequencies at each locus. I
allowed for genotyping errors by introducing an error rate of 0.01% in the LOD
score calculation, which produces the lowest Type I and II error rates (Gerber et al.
2000; Morissey and Wilson 2005; Saenz-‐Agudelo et al. 2011; Harrison et al. 2012).
For each dataset, 10,000 parent-‐offspring pairs were simulated based on the
observed allelic frequencies at each locus and 10,000 parent-‐offspring pairs were
generated from the putative parental genotypes. The frequency distributions of the
two simulations were compared and the intersection was defined as the minimum
threshold to accept a given parent-‐offspring pair or parent-‐pair trio. When two or
more putative parents were assigned to the same offspring, only the parent with
the highest LOD score was retained. When two parents were assigned as a parent
pair, both were retained for further analyses.
Full-‐Likelihood -‐ COLONY
The software program COLONY (Wang 2004; Jones and Wang 2010a) implements a
full-‐likelihood approach to parentage analysis. In our analyses I considered both
parent-‐offspring relationships and sibship amongst offspring samples. Adult
samples were separated by sex and I assumed a polygamous mating system for
diploid organisms. The prior probability that the true parent was present in the
sample was considered in the assignment of parent-‐offspring pairs in accordance
with the proportion of candidate parents included in the simulated datasets. Allelic
frequencies were determined from the sample dataset, but did not take into
account the relationship between individuals or inbreeding. All results were based
on a single short run with high precision to maximise the accuracy of assignment
whilst reducing the length of individual runs. This approach accounts for
genotyping error at each locus of each sampled individual when estimating the

45
likelihood of a particular family cluster, and simulated error rates were taken into
account in each analysis. Only the parent or parent pair with the highest likelihood
is assigned, and all assigned parents were retained for further analysis.
Assignment errors
For each offspring, the assigned parent or parent-‐pairs were compared to the
known true parents. When an offspring was assigned to a parent that was not its
true parent or not assigned (excluded), I determined if the true parent was in the
sample and identified it as either false positive (Type Ia or Type Ib) or false
negative (Type II) errors (Figure 1). The overall accuracy is the sum of all errors
over the total number of possible assignments. I then used a Generalized Linear
Model (GLM) framework to quantify the effect of allelic diversity, number of loci,
percentage of sampled parents, genotyping error and their possible interaction on
the proportion of correct assignments of each method. Since the response variable
was a proportion, GLMs were fitted using a logit link function (as fitted values are
bounded between 0 and 1) and quasi-‐binomial errors (to account for non-‐normally
distributed errors, non-‐constant variance and over-‐dispersion) (Crawley 2007).
For each method I first fitted a maximal model (4 parameters and their
interactions) and then removed non-‐significant terms until a minimal adequate
model was reached (Crawley 2007). Processing of all software outputs and all
model fitting were performed in R with scripts deposited in the Dryad digital
repository (http://dx.doi.org/10.5061/dryad.2ht96).
RESULTS
Relative accuracy of the three methods
Given high diversity (N1000) and sufficient number of loci, all methods tested
identified parent-‐offspring pairs with over 90% accuracy, regardless of the
proportion of the population sampled or the presence of genotyping error (Figure
2 and Table 3). However, the performance of each method varied, with accuracy
affected by the number and allelic diversity of loci, and the proportion of sampled
parents. The full-‐likelihood method implemented in COLONY (Wang 2004; Jones and

46
Wang 2010a) outperformed the other two methods with a mean (± SD) accuracy
across all scenarios of 98.4% ± 4.0 compared to 89.0% ± 11.3 for the pairwise-‐
likelihood method (Gerber et al. 2003), and 65.3% ± 28.3 for the Christie method
(Christie 2010). For each method, the number of loci and differences in allelic
diversity between the low and high diversity populations had the largest effect on
the overall accuracy of assignments. For most scenarios analysed, COLONY
performed best, FAMOZ was intermediate and the Christie method was least
accurate, with the disparity between methods increasing with increasing
proportions of the population sampled (Figure 2).
Figure 2 Proportion of accurate assignments of three approaches to parentage analyses. Each method was tested on high and low diversity simulated microsatellite datasets with high (1%) and low (0.1%) levels of genotyping error for varying levels of number loci and proportion of candidate parents sampled. Continuous lines correspond to the results from the full-‐likelihood method implemented in COLONY v2.0 (Wang 2004), dashed lines are the results from the pairwise-‐likelihood implemented in FAMOZ (Gerber et al. 2003), and dotted lines from the Christie method (Christie 2010).
20
40
60
80
100
20
40
60
80
100
20
40
60
80
100Ove
rall
accu
racy
(%)
20 40 60 80 100 20 40 60 80 100 20 40 60 80 100 20 40 60 80 100
Adults sampled (%)
High diversity Low diversity0.1% 1.0%
1020
15
0.1% 1.0%
Number of loci

�36�
�
� � � t� � . � � � � UO� � h� LG� MNO � YLYUP� O� A MNL F� GLO� Y� O RM� E � � R� PhFTF� TR� LY R� YLYUP� MTLRF� � R � � FFTERA RM� OOLOF� GLO� MN � � j ’ ’ ’ � FTA UP� M � � M� F Mf�
� � � � � � � � � � � � � � � � � � � � � � � � � �� � � � �
Popu
latio
n siz
ePe
rcen
t err
or
No. l
oci
Perc
ent a
dult
sam
pled
Type
Ia
Type
Ib
Type
II
Accu
rate
As
signm
ents
Accu
rate
Ex
clusio
nO
vera
ll Ac
cura
cy
Type
Ia
Type
Ib
Type
II
Accu
rate
As
signm
ents
Accu
rate
Ex
clusio
nO
vera
ll Ac
cura
cy
Type
Ia
Type
Ib
Type
II
Accu
rate
As
signm
ents
Accu
rate
Ex
clusio
nO
vera
ll Ac
cura
cy
Hig
h di
vers
ity (N
1000
)
0.1
10
20 80 246 2 278 394 0.672 12 61 49 295 583 0.878 12 61 49 295 583 0.87840 232 184 1 407 176 0.583 48 84 60 295 238 0.808 48 84 60 295 238 0.80860 356 107 2 462 73 0.535 54 58 68 690 130 0.820 54 58 68 690 130 0.82080 457 31 0 503 9 0.512 80 9 50 834 28 0.861 80 9 50 834 28 0.861
100 444 0 0 556 0 0.556 44 0 11 945 0 0.945 44 0 11 945 0 0.94520 2 14 3 355 626 0.981 5 18 3 348 626 0.974 5 18 3 348 626 0.97440 19 21 1 620 339 0.959 8 28 11 637 316 0.953 8 28 11 637 316 0.95360 40 13 2 778 167 0.945 8 18 4 800 170 0.970 8 18 4 800 170 0.97080 55 0 0 905 40 0.945 6 0 7 951 36 0.987 6 0 7 951 36 1
100 50 0 0 950 0 0.95 1 0 1 998 0 0.998 1 0 1 998 0 120 1 2 3 356 638 0.994 0 10 1 355 634 0.989 0 10 1 355 634 140 5 1 2 633 359 0.992 1 10 2 653 335 0.987 1 10 2 653 335 160 5 4 3 812 176 0.988 4 4 1 807 184 0.991 4 4 1 807 184 180 6 0 0 954 40 0.994 5 0 1 958 36 0.994 5 0 1 958 36 1
100 7 0 0 993 0 0.993 0 0 1 999 0 0.999 0 0 1 999 0 120 81 264 16 263 376 0.639 16 71 54 246 613 0.859 16 71 54 246 613 0.85940 230 204 24 386 156 0.542 57 84 82 485 292 0.777 57 84 82 485 292 0.77760 355 102 12 453 78 0.531 83 48 85 652 132 0.784 83 48 85 652 132 0.78480 458 25 15 487 15 0.502 84 18 59 809 30 0.839 84 18 59 809 30 0.839
100 428 0 3 569 0 0.569 65 4 26 903 2 0.905 65 4 26 903 2 0.90520 5 14 30 325 626 0.951 1 25 13 302 659 0.961 1 25 13 302 659 0.96140 23 26 44 573 334 0.907 8 17 24 592 359 0.951 8 17 24 592 359 0.95160 31 10 43 746 170 0.916 5 13 20 795 167 0.962 5 13 20 795 167 0.96280 59 3 34 867 37 0.904 6 2 17 929 46 0.975 6 2 17 929 46 0.975
100 53 0 13 934 0 0.934 1 0 4 995 0 0.995 1 0 4 995 0 120 0 1 41 319 639 0.958 0 11 8 308 673 0.981 0 11 8 308 673 0.98140 0 1 55 585 359 0.944 0 11 6 618 365 0.983 0 11 6 618 365 0.98360 2 0 57 761 180 0.941 2 3 6 812 177 0.989 2 3 6 812 177 180 4 0 46 910 40 0.95 0 1 7 945 47 0.992 0 1 7 945 47 0.992
100 3 0 17 980 0 0.98 0 0 1 999 0 0.999 0 0 1 999 0 1
Hig
h di
vers
ity (N
1000
)
0.1
10
15
20
1.0
10
15
20

�3/�
�
� � � t� � 7� � � � UO� � h� LG� MNO � YLYUP� O� A MNL F� GLO� Y� O RM� E � � R� PhFTF� TR� LY R� YLYUP� MTLRF� � R � � FFTERA RM� OOLOF� GLO� MN � � 4’ ’ � FTA UP� M � � M� F M�
� � � � � � � � � � � � � � � � � � � � � � � � � �� � � � �
Popu
latio
n siz
ePe
rcen
t err
or
No. l
oci
Perc
ent a
dult
sam
pled
Type
Ia
Type
Ib
Type
II
Accu
rate
As
signm
ents
Accu
rate
Ex
clusio
nO
vera
ll Ac
cura
cy
Type
Ia
Type
Ib
Type
II
Accu
rate
As
signm
ents
Accu
rate
Ex
clusio
nO
vera
ll Ac
cura
cy
Type
Ia
Type
Ib
Type
II
Accu
rate
As
signm
ents
Accu
rate
Ex
clusio
nO
vera
ll Ac
cura
cy
Low
div
ersit
y (N
500)
0.1
10
20 122 293 149 81 355 0.436 53 257 27 256 407 0.663 15 80 51 286 568 0.85440 288 161 270 82 199 0.281 155 216 19 458 152 0.610 34 89 31 575 271 0.84660 396 52 372 108 72 0.180 186 89 68 590 67 0.657 15 29 18 843 95 0.93880 446 16 428 98 12 0.110 180 20 77 699 24 0.723 6 15 2 964 13 0.977
100 460 0 439 101 0 0.101 177 0 47 776 0 0.776 1 0 0 999 - 0.99920 49 153 109 194 495 0.689 13 140 4 319 524 0.843 0 6 0 352 642 0.99440 133 101 217 290 259 0.549 34 134 8 590 234 0.824 0 4 0 640 356 0.99660 222 39 328 326 85 0.411 47 58 26 771 98 0.869 0 2 1 875 122 0.99780 255 12 344 373 16 0.389 53 12 11 892 32 0.924 0 0 0 972 28 1
100 274 0 363 363 0 0.363 26 0 3 971 0 0.971 0 0 0 1000 - 120 11 48 46 295 600 0.895 6 43 1 329 621 0.950 0 0 0 352 648 140 39 32 140 461 328 0.789 5 50 7 620 318 0.938 0 0 0 640 360 160 83 11 194 599 113 0.712 13 16 34 797 140 0.937 0 0 0 876 124 180 82 5 192 698 23 0.721 12 7 2 942 37 0.979 0 0 0 972 28 1
100 102 0 142 756 0 0.756 3 0 0 997 0 0.997 0 0 0 1000 - 120 117 267 153 82 381 0.463 53 219 33 274 421 0.695 13 88 43 296 560 0.85640 267 175 293 80 185 0.265 127 212 64 439 158 0.597 45 94 33 562 266 0.82860 394 54 392 90 70 0.160 187 73 84 580 76 0.656 36 28 15 825 96 0.92180 439 18 450 83 10 0.093 198 29 78 672 23 0.695 14 20 3 955 8 0.963
100 444 0 464 92 0 0.092 185 0 52 763 0 0.763 2 0 0 998 - 0.99820 46 144 106 200 504 0.704 16 115 11 333 525 0.858 0 13 5 347 653 0.98240 141 101 268 231 259 0.490 36 118 29 567 250 0.817 0 9 1 639 351 0.99060 225 28 357 294 96 0.390 48 45 27 777 103 0.880 0 3 0 876 121 0.99780 280 15 375 317 13 0.330 43 14 22 883 38 0.921 1 3 0 971 25 0.996
100 286 0 387 327 0 0.327 26 0 9 965 0 0.965 0 0 0 1000 - 120 13 36 74 265 612 0.877 3 26 9 348 614 0.962 0 2 0 352 646 0.99840 37 34 185 418 326 0.744 7 44 17 608 324 0.932 0 3 0 640 357 0.99760 68 14 241 567 110 0.677 12 23 13 827 125 0.952 0 0 0 876 124 180 68 11 242 662 17 0.679 7 10 13 928 42 0.970 0 4 0 972 24 0.996
100 85 0 197 718 0 0.718 3 0 1 996 0 0.996 0 0 0 1000 - 1
Low
div
ersit
y (N
500)
0.1
1.0
10
15
20
10
15
20

�37�
���
Factors Deviance explained by each term d.f. F Significance
Null deviance 59Prop. Adult sample 835.3 58 41.7 ***Number of loci 10641.4 57 531.7 ***Allelic diversity 10309.2 56 515.1 ***Prop. Adult sample: Number of Loci 38.6 55 1.9 NSProp. Adult sample: Allelic diversity 613 54 30.6 ***Number of Loci: Allelic diversity 438.6 53 21.9 ***
Null deviance 59Prop. Adult sample 370 58 40.6 ***Number of loci 5000.1 57 548.5 ***Allelic diversity 1500.1 56 164.6 ***Prop. Adult sample: Number of Loci 89.5 55 9.8 **Number of Loci: Allelic diversity 57.5 54 6.3 *
Null deviance 59Prop. Adult sample 574.3 58 97.2 ***Number of loci 1690.9 57 286.1 ***Allelic diversity 758.5 56 128.3 ***
Significance codes: ‘***’ 0.001; ‘**’ 0.01; ‘*’ 0.05; ‘NS’ not significant
������ 3258.6
2684.2993.4234.9
���
7532.97162.92162.9662.8573.3515.8
Residual deviance in model
Excl
usio
n –B
ayes
Th
eore
m
2377722941.712300.31991.11952.41339.4900.8
� � � t� � V� � FUPMF� GOLA � MNO � � R O� PTe � TR � O� � L PF� LR� MN � � � � UO� � h� LG� MNO � A MNL F� LG� Y� O RM� E � � R� PhFTFf� � � � N� GUPP� A L P�TR� PU � LV O� PP� � � � UO� � h� � F� � � O FYLRF � V� OT� � P � èA � FUO � � F� MN � YOLYLOMTLR� LG� � LOO � M� � FFTERA RMF� LV O� j ’ ’ ’ � YLFFT� P � � FFTERA RMFé�� R � � PP PT� � TV OFTMh2� RUA � O� LG� PL� T� � R � MN � YOLYLOMTLR� LG� F� A YP � Y� O RMF� � R � MN TO� TRM O� � MTLRF� � F� KYP� R� MLOh� V� OT� � P Ff� � N � GTMM �A L PF� TR� PU � � � SU� FTD� TRLA T� P� OOLO� FMOU� MUO � � R � � � PLETM� PTRC� GUR� MTLRf� � KYP� R� MLOh� V� OT� � P F� � R � MN O � TRM O� � MTLRF� W O � O A LV �LR � � M� � � MTA 2� TG� � è� é� W� F� ” ’ f’ 4f� � RPh� FTERTGT� � RM� M OA F� � GM O� FM YWTF � WTF � A L P� O U� MTLR� � O � FNLWR� è� è� é” ’ f’ 4éf�

50
The number of loci was always the most important single factor in
determining the accuracy of assignments for all three methods investigated
(Figure 2 and Tables 3-‐5). Across all scenarios, the Christie method was the most
affected with an overall reduction of 47% in overall accuracy when reducing the
number of loci from 20 to 10. However, this only determined ~45% of the variance
in overall accuracy (GLM: F1,57 = 531.7, p < 0.001), suggesting other factors are
influencing the discrimination of true parent-‐offspring pairs. In contrast, the
accuracy of the pairwise-‐likelihood method was reduced by only 21% overall, and
represented ~66% of the variance in overall accuracy (F1,57 = 548.5, p < 0.001). For
the full-‐likelihood method, overall accuracy was only reduced by 4% between 20
and 10 loci, which represented ~52% of variance (F1,57 = 286.1, p < 0.001).
Differences in allelic diversity between the two simulated populations
further accentuated the effect of the number of loci on the overall accuracy of
assignment, with a significant interaction between these two factors (Table 5). The
performance of both the Christie method and the pairwise-‐likelihood methods was
most severely affected by their combined effect (as the sum of variances explained
by each variable and their interaction), explaining a total of 90% and ~87% of
variance in overall accuracy, respectively. For both methods, this included a low
but significant interaction between the number of loci and allelic diversity (1.8%:
F1,53 = 21.9, p < 0.01 and 0.8%: F1,54 = 6.3, p < 0.05, respectively). In contrast, these
two factors explained ~75% of the overall variance in accuracy of the full-‐
likelihood method, and there was no significant interaction between the two on the
overall accuracy of assignment. Though the accuracy of the full-‐likelihood method
was high overall, it is likely that the presence of full-‐sibs in our simulated data
increased the accuracy of assignment for this method.
The proportion of sampled parents had a small but significant effect on the
accuracy of all methods, which were only exacerbated by variation in the number
and allelic diversity of loci. Variation in the proportion of sampled parents
explained only ~6% of variance in overall accuracy of both the Christie method
and the pairwise-‐likelihood methods (Table 5). This included a small but
significant interaction with allelic diversity (2.6%: F1,54 = 30.6, p < 0.001) for the
Christie method and a small but significant interaction with the number of loci
(1.2%: F1,55 = 9.8, p < 0.01) for the pairwise-‐likelihood method. In contrast,

51
proportion of sampled parents explained ~17.6% of the overall variance in
accuracy of the full-‐likelihood method, and showed no significant interaction with
other variables.
Overall, the presence of genotyping error had negligible impact on the
accuracy of assignments (Figure 2 and Tables 3-‐5). For each method, I compared
the average accuracy in the high and low diversity datasets with either 0.1% or 1%
genotyping error. Overall, a 10-‐fold increase in genotyping error, resulted in a 2-‐
3% reduction in accuracy for the Christie methods and less than 1% reduction for
the pairwise-‐ and full-‐likelihood methods.
Trends in error types
The relative accuracy of each method was reflected in their susceptibility to Type
Ia, Type Ib and Type II errors (Figure 1), and though incomplete sampling of
candidate parents was not highly descriptive of the variance in overall accuracy
(<10% for all methods), it was highly significant (p < 0.001) and defined clear
trends in error rates, irrespective of the number of loci and allelic diversity.
For both the Christie method and pairwise-‐likelihood methods, the number
of Type Ia errors (falsely assigning to a parent when the true parent is in the
sample) increased as the proportion of candidate parents in the sample increased
(Figure 3). In most scenarios investigated, the Christie method was the most
susceptible to Type Ia errors, which represented 45% of all false assignments. The
susceptibility of the pairwise-‐likelihood approach to Type Ia errors, though not as
sensitive as the Christie method with fewer errors representing 38% of all errors
overall, also increased with increasing proportion of the adult sample. While the
number of Type Ia errors appears to asymptote when the proportion of adults
reached 60% and 80% for the pairwise-‐likelihood approach and Christie method,
respectively, it did not necessarily decrease beyond that point.
Furthermore, both the Christie methods and the pairwise-‐likelihood
method were also susceptible to Type Ib errors (falsely assigning to a parent when
the true parent is not in the sample), with the number of errors decreasing as the
proportion of sampled parents increased (Figure 4). These were the most common
form of error for the pairwise-‐likelihood method (39%) and, while the overall
trend and susceptibility was similar between the two approaches, these were the

52
least likely error for the Christie method (15% of errors overall). Given the
accuracy of the full-‐likelihood method, clear trends were not easily identified. Low
number and diversity of loci did appear to increase the susceptibility of this
approach to both Type Ia and Type Ib errors, representing 20% and 57% of all
errors, respectively. Both error types decreased with over 40% of the adult
population sampled.
The occurrence of Type II errors (falsely excluding a parent when it was in
the sample) remained low for both the pairwise-‐likelihood and full-‐likelihood
methods, representing 22% and 23% of false assignments overall (Figure 5).
However, these increased sharply with sample size for the Christie method under
scenarios with low allelic diversity, representing 40% of false assignments overall.
Furthermore, high genotyping error resulted in an increase in Type II errors for
this method.
Figure 3 Susceptibility of three popular methods of parentage analysis to Type Ia errors under 60 independent scenarios. Number of false parent-‐offspring pairs where an offspring was assigned to a parent that was not its true parent when the true parent was in the sample varied with the number of loci (y-‐axis), allelic diversity in two simulated populations (N1000 & N500) level of genotyping error (0.1% & 1.0%). Continuous lines correspond to the results from the full-‐likelihood method implemented in COLONY v2.0, dashed lines are the results from the pairwise-‐likelihood implemented in FAMOZ, and dotted lines from the Christie method.
0100200300400
0100200300400
0100200300400
No. T
ype I
a erro
rs
20 40 60 80 100 20 40 60 80 100 20 40 60 80 100 20 40 60 80 100
Adults sampled (%)
High diversity Low diversity0.1% 1.0%
1020
15
0.1% 1.0%
Number of loci

53
Figure 4 Susceptibility of three popular methods of parentage analysis to Type Ib errors under 60 independent scenarios. Number of false parent-‐offspring pairs where an offspring was assigned to a parent that was not its true parent when the true parent was not in the sample varied with the number of loci (y-‐axis), allelic diversity in two simulated populations (N1000 & N500) level of genotyping error (0.1% & 1.0%). Continuous lines correspond to the results from the full-‐likelihood method implemented in COLONY v2.0, dashed lines are the results from the pairwise-‐likelihood implemented in FAMOZ, and dotted lines from the Christie method.
050
100150200250
050
100150200250
050
100150200250
No. T
ype I
b er
rors
20 40 60 80 100 20 40 60 80 100 20 40 60 80 100 20 40 60 80 100
Adults sampled (%)
High diversity Low diversity0.1% 1.0%
1020
15
0.1% 1.0%
Number of loci
0
100
200
300
400
0
100
200
300
400
0
100
200
300
400
No. b
eta
erro
rs
20 40 60 80 100 20 40 60 80 100 20 40 60 80 100 20 40 60 80 100
Adults sampled (%)
High diversity Low diversity0.1% 1.0%
1020
15
0.1% 1.0%
Number of loci

54
Figure 5 Susceptibility of three popular methods of parentage analysis to Type II errors under 60 independent scenarios. Number of false parent-‐offspring pairs where an offspring was not assigned when the true parent was in the sample varied with the number of loci (y-‐axis), allelic diversity in two simulated populations (high & low diversity) level of genotyping error (0.1% & 1.0%). Continuous lines correspond to the results from the full-‐likelihood method implemented in COLONY v2.0, dashed lines are the results from the pairwise-‐likelihood implemented in FAMOZ, and dotted lines from the Christie method.
DISCUSSION
This study evaluates the performance of three popular approaches to parentage
analysis using microsatellite loci in open populations. In these simulated scenarios
I was able to capture a wide diversity of conditions that are commonly
encountered in parentage studies and identified key factors for the identification of
true parent-‐offspring pairs in natural populations. I also identify the three main
error types that lead to false assignments. Our results show that with many highly
diverse loci, all three methods investigated identified true parent-‐offspring pairs
with high levels of accuracy. However, as I reduced the number and allelic
diversity of loci, and the proportion of parents sampled, the performance of each
method responded differently. In general, accuracy declined with reduced number
of loci and allelic diversity, while the response to the proportion of population
sampled and effects of genotyping error varied with each method. In these
simulated settings, the full-‐likelihood approach implemented in COLONY (Wang
2004; Jones and Wang 2010a), consistently outperformed both the pairwise-‐
likelihood method implemented in FAMOZ (Gerber et al. 2003), and the Christie
method (Christie 2010), which was subject to the most erroneous assignments.
Accounting simultaneously for parent-‐offspring pairs and full-‐ and half-‐sibs
clearly increases the accuracy of assignments for the full-‐likelihood approach
implemented in COLONY (Wang 2007; Walling et al. 2010). While the inclusion of
full-‐sibs in our simulated datasets was necessary to reduce the computational
demands of this method, these may not be present at such frequencies in natural
populations. Furthermore, low allelic diversity or the absence of many candidate
parents makes the identification of family clusters much more difficult. While the
most informative datasets (20 loci with 100% sampled parents and high allele

55
diversity) took several hours to complete, the least informative datasets (10 loci
with 20% sampled parents and low allele diversity) took up to four months to
complete (single run with high precision on a single CPU). For larger natural
populations with mixed generations and complex genealogical relationships, it
would take considerably longer. Consequently, the performance of COLONY may be
reduced if the presence of large family groups is infrequent, a common
characteristic of both terrestrial and marine systems (Selkoe et al. 2006; Buston et
al. 2009). How the presence of full-‐sibs in the sample, as candidate parents or as
offspring, affects performance remains unclear and requires further investigation.
The computation time remains the major drawback of this method and thus its
application may be restricted to studies with small sample sizes. However, during
the development of this study, a new likelihood method was released (Wang 2012)
that is less computationally demanding than the full-‐likelihood method and may
overcome this limitation.
Though the pairwise-‐likelihood method implemented in FAMOZ (Gerber et al.
2003) was sensitive to the number and allelic diversity of loci used in the analysis,
it is a good compromise to the full-‐likelihood approach. While it did not perform as
well, it is well suited for parentage studies in large natural populations where
knowledge of biological or demographic parameters is limited or unavailable,
where sample sizes are large, or where the number and diversity of loci is limited.
Furthermore, prior knowledge of the proportion of candidate parents sampled did
not appear to be an important factor in determining true parent offspring pairs.
The pairwise-‐likelihood method is also far less computationally intensive, with
each run taking only minutes to complete on a standard laptop computer. The
flexibility of FAMOZ allows for a broad range of applications and has made it an
attractive approach to investigate mating patterns and dispersal in a variety of
taxa where demographic parameters are often difficult to obtain.
The performance of the Christie method (Christie 2010) was clearly affected
by the number and allelic diversity of molecular markers chosen in these
simulated scenarios. However, provided that enough highly diverse markers are
available, the accuracy of this method increases substantially. Low allelic diversity
combined with large sample sizes increases the probability of false parent-‐
offspring pairs in the sample, and would explain the susceptibility of this method

56
to Type II errors in low diversity datasets (Christie 2010). Setting a threshold
whereby putative assignments are only accepted if the probability of false
assignments is less than 0.10 or 0.05 was attempted to reduce the number of false
positives, however the increase in false negatives outweighed the benefits and did
not increase the overall accuracy of assignments. Overall, I found the approach
computationally intensive, especially in scenarios where the number and diversity
of loci was low, perhaps due to the standardised number of simulations I chose.
One potential constraint of this approach is the inability to identify parent pairs,
limiting its application for ecological studies if no demographic or mating
information is available. Nevertheless, this method is well suited for situations
where only small proportions of large populations can be sampled (e.g. Christie et
al. 2010a) and has been successfully applied to infer reproductive success in a
captive breeding program (Christie et al. 2011; Christie et al. 2012).
In natural populations where exhaustive sampling is prohibitive, variation in
the proportion of sampled parents can have a significant impact on the accuracy of
parentage reconstructions (Hadfield et al. 2006; Kock et al. 2008; Nielsen et al.
2001). Our results show that sampling higher proportions of the population
decreases the likelihood of falsely assigning to a parent when the true parent was
not in the sample (Type Ib). This is simply because more true parents are present
in the sample. On the other hand, sampling higher proportions of the population
increases the likelihood falsely assigning to a parent (Type Ia) or falsely excluding
a parent (Type II) when the true parent was in fact in the sample. Sampling larger
proportions of adults leads to exponential increases in the number of possible
pairwise comparisons and limited genetic information leads to erroneous
assignments. Nevertheless, our results showed that for all methods, increasing the
number and allelic diversity of loci reduced the effects of incomplete sampling to
the point where they became negligible.
Depending on the objectives of the study, different types of errors will have
different consequences on the interpretation of the results. For example, if the
objective is simply to assign offspring to a population or a group of individuals (e.g.
to estimate self recruitment rates at the population level), Type Ia errors will have
little bearing on the conclusions of a study because they will not affect the
proportion of assignments. On the other hand, if one was to measure individual

57
reproductive success (e.g. Rodriguez-‐Muñoz et al. 2010; Beldade et al. 2012), any
error type can have adverse consequences and assignments may not necessarily
reflect true ecological processes. Regardless of the method used, performing
simulations to estimate different error rates could help to identify the number of
markers required to address specific questions. Striking a balance will be
necessary to achieve the best performance or satisfy the objectives of a given
parentage study.
CONCLUSION
This study highlights how the number and diversity of loci, the proportion of
candidate parents sampled and the level of genotyping error can affect the
accuracy of parentage assignments in three common methods of parentage
analysis. Within the range of values simulated, COLONY outperformed FAMOZ, which
outperformed the Christie method. However, with 20 or more highly polymorphic
loci, all methods could be applied with confidence, though which method is most
suitable is likely to depend on the size of the dataset and the size of the population
investigated. When using fewer loci or less diverse loci, it is vital to be aware of the
potential for assignments errors and the nature of these errors when choosing
which method to apply. Parentage studies in natural populations are a challenging
endeavor and obtaining accurate assignments is crucial to obtaining accurate
representations of ecological processes. Whilst most studies will seek to minimise
false assignments, a compromise between the cost of developing and processing a
large number of loci and sampling effort is often necessary. Obtaining larger
sample sizes of potential adults obviously increases the number of possible
assignments. However, I found that increasing the number of loci, or selecting loci
with greater allelic diversity can compensate for incomplete sampling of the
parental population and still achieve high levels of accuracy.

58

59
CHAPTER 3 -‐ DEVELOPMENT OF MULTIPLEX ASSAYS FOR PARENTAGE
ANALYSIS FOR TWO CORAL REEF FISHES
ABSTRACT
Recently, microsatellite loci have been used to track individual patterns of
dispersal and identify inter-‐generational relationships between individuals.
However, to apply these methods accurately requires the development of
numerous, highly polymorphic markers. Here, I describe the development of a
novel set of 11 microsatellite loci for coral trout, Plectropomus maculatus, and 13
microsatellite loci for stripey snapper, Lutjanus carponotatus, two significant
fishery species of the Great Barrier Reef (Australia). Markers were selected from a
panel of microsatellite loci previously described for closely related species or
species-‐specific, and described here following the development of novel libraries.
Markers were integrated into multiplex PCRs for high-‐throughput genotyping of
466 and 1154 adult coral trout and stripey snapper, respectively. Each set of
marker is composed of highly polymorphic loci delivering an overall exclusion
power of over 99.98%. These provide a strong and robust basis with which to
investigate parentage and other genealogical relationships in natural populations
for these important fisheries species.

60
INTRODUCTION
Classical genetic analyses have been used for several decades to measure gene
flow and estimate migration between discreet populations (Slatkin 1981; Hartl and
Clark 1989). Each new genetic markers, first allozymes, then microsatellites, and
more recently single nucleotide polymorphisms brought major advances in the
efficiency, power and flexibility of genetic analyses, thus widening the use of
genetics in the study of ecology and evolution (Cruzan 1998; Manel et al. 2005).
After their discovery in the early 1990’s, microsatellite markers were rapidly
recognised as more versatile than allozyme markers and remain today the most
popular marker type for ecological applications. Microsatellites commonly exhibit
high levels of allelic diversity, therefore providing more information and power to
describe demographic processes and the relationship between individuals.
Developments in molecular techniques along with advances in computing
technology continue to improve and broaden the scope of their application in
ecology (Manel et al. 2005; Selkoe and Toonen 2006).
Microsatellite markers provide numerous advantages in ecological studies.
Their high information content and mutation rate can provide insight into
ecological processes over short spatial and temporal scales. Furthermore, unique
genetic profiles can be generated for each individual in a population with relatively
few markers, thus providing an effective approach to infer genealogical
relationships among individuals. For example, microsatellite markers have been
used to track the movement of individuals (e.g. Nathan 2003; Harrison et al. 2010),
their reproductive behaviour and mating patterns (e.g. Araki et al. 2007; Kanno et
al. 2011; Rodrigues-‐Munoz et al. 2010; Ford et al. 2011; Beldade et al. 2012) and,
the dispersal and survivorship of their offspring (e.g. Garcia et al. 2005, 2007;
Jordano et al. 2007; Planes et al. 2009; Christie et al. 2010a; Saenz-‐Agudelo et al.
2011; Berumen et al. 2012; Saenz-‐Agudelo et al. 2012). Individual level genetic
analyses are an important tool in ecological studies as they can often be the only
means with which to identify and track the movement of individuals. While several
analytical approaches exist, obtaining unique genetic profiles for each individual in
a population requires numerous markers. Identifying the relationship between

61
these individuals requires even more, with parent-‐offspring and full-‐sibs being the
easiest relationships to identify.
Despite the many advantages and versatility of microsatellite markers, their
application has, until recently, been limited by the time and expense of developing
novel markers for non-‐model organisms and screening large numbers of
individuals (Selkoe and Toonen 2006). In order to develop a novel set of markers
for a given target species, markers can either be obtained from pre-‐existing
microsatellite libraries for closely related species, or isolated de novo. The success
rate of each approach will depend on whether species are closely related or the
abundance of microsatellite in the target genome (Zane et al. 2002). Once
candidate markers are identified, they must also satisfy certain characteristics that
will ensure reliable PCR amplification across multiple samples. Markers that suffer
from non-‐amplification, mispriming, artifacts, excessive stutter or low yield can
result in poor data quality. When processing a large number of samples it is also
necessary to minimise the number PCR reactions by ‘multiplexing’ several markers
into a single PCR reaction. It can often take several rounds of optimisation before a
set of markers amplifies successfully in multiplex reactions.
Depending on whether markers are intended for classical population
genetics or individual level genetic analyses, the ideal marker will have very
distinct characteristics. In general, the allelic diversity of markers should reflect
the size of target populations and the number of individuals sampled in each
population. For classical population genetics, the objective is often to obtain an
accurate representation of allelic frequencies with which to distinguish target
populations. The sample of each population should capture the full diversity of
alleles, therefore small sample sizes require marker with small allelic diversity. For
individual level genetic analyses, such as parentage analyses, markers with high
allelic diversity are preferred as these increase the accuracy of parentage
assignments (see Chapter 2). However, parentage analyses measure the likelihood
of each assignment against the frequency of alleles in the target population.
Therefore, it is also necessary that the sample of individuals is sufficiently large to
provide an accurate representation of allelic frequencies in the population.
The aim of this chapter was to develop multiplex PCR assays for parentage
analysis in two species of coral reef fish, the bar-‐cheeked coral trout Plectropomus

62
maculatus, and stripey snapper Lutjanus carponotatus. Microsatellite markers
were selected from pre-‐existing microsatellite libraries for closely related species
and isolated from a novel genomic DNA library enriched for microsatellites.
Markers were selected based on the quality of amplification and the level of allelic
polymorphism in order to maximise the accuracy of subsequent parentage
analyses. For each marker, I measured the number of alleles and allelic richness,
the level of heterozygosity, and tested for departure from Hardy-‐Weinberg
equilibrium as evidence of null alleles or inbreeding. I used the polymorphic
information content and probability of exclusion of each marker as an indication of
their suitability for parentage analyses.
MATERIAL AND METHODS
Marker development -‐ Plectropomus maculatus
A total of 34 microsatellite loci were tested in Plectropomus maculatus (Table 1).
This included 29 primer pairs previously described for P. maculatus (Zhu et al.
2005) or for 4 congeneric or closely related fish species: P. leopardus (Ding et al.
2009) and P. laevis (van Herwerden et al. 2000), and Lethrinus miniatus (van
Herwerden et al. 2000). A further 14 microsatellite loci were tested from a cloning
library developed using an enrichment protocol described below. Loci obtained
from congenerics were sequenced to confirm the presence of uninterrupted simple
sequence repeats.
Novel primer pairs were selected in PrimerSelect (DNASTAR) on the basis of
fragment size, hetero-‐dimer duplexing and complementarity of melting
temperatures. Each locus was first tested in simplex with each PCR reaction
containing 4µl 5x buffer (Kapataq, 10mM Tris-‐HCl, 50mM KCl, pH 8.3), 0.2 mM
each dNTPs, 1.5 mM MgCl2 and 1 U of Hotstart Taq (Kapataq). PCR cycling
conditions began with an initial denaturation step at 94°C for 4 min followed by 20
cycles at 94°C for 30 s, 20 s at 58°C reducing the annealing temperature by 0.1°C
every cycle, 72°C for 20 s, a further 5 cycles were then performed at an annealing
temperature 56°C to maximize product amplification followed by a final extension
step at 72°C for 15 min.

63
Microsatellite development -‐ Lutjanus carponotatus
A total of 52 microsatellite loci were tested in Lutjanus carponotatus (Table 2).
This included 39 microsatellite primer pairs previously described for 5 congeneric
or closely related fish species: Lutjanus russelli (Guo et al. 2007), L.
argentimaculatus (Zhang et al. 2006), L. erythropterus (Lo et al. 2006), and two
Western Atlantic species L. campechanus (Gold et al. 2001), and Rhomboplites
aurorubens (Bagley and Geller 1998). A further 13 microsatellite loci were tested
from a cloning library developed using an enrichment protocol described by Glenn
and Schable (2005). Loci obtained from congenerics and closely related species
were sequenced to confirm the presence of uninterrupted simple sequence
repeats.
Novel primer pairs were selected in PrimerSelect (DNASTAR) on the basis of
fragment size, hetero-‐dimer duplexing and complementarity of melting
temperatures. Each locus was first tested in simplex with each PCR reaction
containing 4µl 5x buffer (Kapataq, 10mM Tris-‐HCl, 50mM KCl, pH 8.3), 0.2 mM
each dNTPs, 1.5 mM MgCl2 and 1 U of Hotstart Taq (Kapataq). PCR cycling
conditions began with an initial denaturation step at 94°C for 4 min followed by 20
cycles at 94°C for 30 s, 20 s at 58°C reducing the annealing temperature by 0.1°C
every cycle, 72°C for 20 s, a further 5 cycles were then performed at an annealing
temperature 56°C to maximise product amplification followed by a final extension
step at 72°C for 15 min.
Microsatellite enrichment protocol
Microsatellite markers were developed using an enrichment protocol developed
by Glenn and Schable (2005). Approximately 4mg of genomic DNA (gDNA) from
one individual was digested with RsaI and XmnI, and SuperSNX24 linkers were
ligated onto the ends of gDNA fragments. Linkers act as priming sites for
polymerase chain reactions (PCR) in subsequent steps. Five biotinylated
tetranucleotide probes were hybridised to gDNA: (AAAT)8, (AACT)8, (AAGT)8,
(ACAT)8 and (AGAT)8 in the case of P. maculatus, and (ACAT)8, (AGAT)8, (ACCT)6,
and (ACAG)6 for L. carponotatus. The biotinylated probe-‐gDNA complex was added
to magnetic beads coated with steptavidin (Dynabeads M-‐280 Invitrogen,
64
Carlsbad, California). This mixture was washed twice with 2xSSC, 0.1% SDS and four
times with 1xSSC, 0.1% SDS at 52 oC. For the final two washes, the mixture was
incubated for 1 minute in a 52°C water bath. Between washes, a magnetic particle-‐
collecting unit was used to capture the magnetic beads, which are bound to the
biotin-‐gDNA complex. Enriched fragments were removed from the biotinylated
probe by denaturing at 95°C and precipitated with 95% ethanol and 3M sodium
acetate.
To increase the amount of enriched fragments, a “recovery” PCR was
performed in 25ml reactions containing 1x PCR buffer (10mM Tris-‐HCl, 50mM KCl,
pH 8.3), 1.5mM MgCl2, 0.16mM of each dNTP, 10X BSA, 0.52mM of the SuperSNX24
forward primer, 1U Taq DNA polymerase, and approximately 25ng enriched gDNA
fragments. Thermal cycling was performed in an MJ Research DYAD as follows: 95°C
for 2min followed by 25 cycles of 95°C for 20s, 60°C for 20s, and 72°C for 90s, and a
final elongation step of 72°C for 30min.
Subsequent PCR fragments were cloned using the TOPO-‐TA Cloning kit
(Invitrogen) following the manufacturer’s protocol. Bacterial colonies containing a
vector with gDNA (i.e. white colonies) were used as a template for subsequent PCR in
a 25ml reaction containing 1x PCR buffer (10mM Tris-‐HCl, 50mM KCl, pH 8.3),
1.5mM MgCl2, 0.12 mM of each dNTP, 10x BSA, 0.25mM of the M13 primers, and 1U
Taq DNA polymerase. Thermal cycling was as follows: an initial denaturing step of 95
C for 7 min was followed by 35 cycles of 95°C for 20s, 50 °C for 20s, and 72°C for 90s.
These PCR products were cleaned using MultiScreen-‐PCR Filter Plates following the
manufacturer’s protocol (Millipore, Billerica, Massachusetts).
DNA sequencing was performed using the BigDye Terminator v3.1 Cycle
Sequencing Kit (Applied Biosystems, Foster City, California). Sequencing reactions
were precipitated with ethanol and 125mM EDTA and run on an ABI 3730 DNA
Analyzer.
Multiplex reactions
DNA extractions were optimised for fish fin tissue (Gentra Puregen, QIAGEN) and
eluted to 200 µl TE buffer (pH 8.0). Primers were fluorescently labelled (TET, HEX,
FAM) and pooled in multiple multiplex PCR reactions taking into account fragment
overlaps, primer complementarity and optimal annealing temperatures. In the

65
case of P. maculatus, three multiplex PCRs were designed with similar conditions,
all contained 10-‐40ng of genomic DNA, primer concentrations ranged from 0.08 –
0.6 µM. For L. carponotatus, loci were initially pooled in three multiplex reactions,
which were later reduced to two. I report here only the final PCR protocol. All
multiplex PCRs successfully amplified using the Type-‐it Microsatellite PCR kit
(QIAGEN) following the manufacturer’s protocol with annealing temperatures
ranging from 59°C to 53°C and 28 to 30 cycles. All PCR products were purified
using Sephadex G-‐50 chromatography and screened on a MegaBACE 1000
sequencer (GE Healthcare) at the Genetics Analysis Facility, Advanced Analytical
Centre, James Cook University. Allele sizes were verified visually in the fragment
analysis software FRAGMENT PROFILER 1.2 (GE Healthcare) and binning of alleles was
done manually, taking into account allelic drift for larger fragments.
Population genetics statistics
A total of 466 adult P. maculatus and 1154 adult L. carponotatus were genotyped
with a panel of 11 and 13 microsatellite markers respectively, resulting in unique
genotype profiles for each individual (see Chapter 4 for sample collection details).
Observed genotypes were tested for departures from Hardy-‐Weinberg equilibrium
due to heterozygote deficiency at each locus as implemented in FSTAT v. 2.9.3.2
(Goudet 1995). Significance of multiple P-‐values (α = 0.05) was assessed with
strict Bonferroni correction applied for multiple comparisons (P < 0.005) (Rice
1989). Nei’s unbiased expected and observed heterozygosity (Nei 1987) was
calculated over all samples in FSTAT. The number of alleles, allelic richness and
Weir & Cockerham’s (1984) estimator of the inbreeding coefficient FIS were also
computed in FSTAT across all samples. Allelic richness was assessed relative to the
Egg Rock sample, for which we had the smallest number of adult samples. The
occurrence of null alleles and large allele drop-‐outs were assessed at each locus
using MICROCHECKER v.2.2.3 (van Oosterhout et al. 2004). Genotyping error was
estimated at each locus by pairwise comparisons of 20 P. maculatus and 92 L.
carponotatus recaptured individuals. Polymorphic information content for each
locus was estimated in CERVUS v. 3.0.3 (Marshall et al. 1998; Kalinowski et al. 2007)
based on the frequency of alleles per locus (𝑃𝐼𝐶 = 1− ∑ 𝑥!! , where xi is the
frequency of the ith allele). The probability of exclusion of each locus and the

66
cumulative probability of exclusion of each multiplex panel were calculated
according to Jamieson and Taylor (1997) as the probability of excluding a single
parent and parent pair.
Table 1 Microsatellite loci tested in P. maculatus
Species Locus Repeat motif Forward primer (5'-‐3') Reverse primer (5'-‐3')
P. maculatus
(published libraries)
Pm01 TG CTCGCTGCTTTGGAGGCAGTATA TGGCTCAGTAGGTGGTTAAATTTTAGG Pm02 CA GATCAGCCTGTTAGCCCTGGATAA CCCCCTGGCCAAGTCACAG Pm03 CA AGCTGCATAAGCACTTACCGTCACTG CACGACCCCCAGAGCAAACAC Pm05 CA TCAAGGGACACAGAAATGGTTCA CCTGCGCTGACCCTGTTTTA Pm06 CA AGCTACTGTCCGCCTCTGTTAATGCTA AACAGGATGCTGAAATAGAATTTGG Pm08 TG CTTAGGGAGCAGAAATGGGAACA AGCAGATGCACAGGACTTGACA Pm10 TG GCGGACAGGCTGGAAAACTG CCGCTGACTGTGATCTCCCAA Pm11 CT-‐CA CGAGCTTGGCACGAATGTATA ACAGGCGATGTGAGATGTTGTC Pm12 TG AGAAAAAGCTCCACAACACAACAA GAGCCCCAGTCCCAAATATTG
P. maculatus
(developed here)
Pma036 TAGA GGGTCTGCAGGCAACACAAAGACAT TGGAGAAAATTGTTGAGTGAAGAGTGG Pma063 TATC AGCTACCCATGTGTGTCGTATGTCCA TGTGTGCTGGCCCTTAACCCTATCA Pma067 TATC ACCCAAGTCTAACTCTCAATGTGGA GCTGGTTGCGAGGTAGCTAGATAAG Pma082 TATC TCCCATACAGGCCGTTATATTGCAC GCGACACTCACAGCAAGTTAGAAAGA Pma093 ATAG GATGAGGGCGCTCTTGCCTTTGTAG GCAGTTCCTGACAGTGCCCAGTAGA Pma097 ATCT AGTGGGGCCATGTTTAACAACAGCA ACGAGTTTTGTGAGATGGATGGGTGGA Pma101 TATC TGCCCGACTCGATTTGTAACAGTGC GGGGATAGACAAGAGGAAAGAGAGGGGA Pma104 TATC CCATAACGGGGACTTTGGCCAATCA CTGCACTTGTAGAACAGCCATGGGA Pma106 GATA CAGGAGCCATTGAGACAGGGAGAGG AGTGTTGGTGGTTTCGCTGATGCTT Pma112 TATC GGGGGTCTGTTTGCACTTTTTATTACG AACCAGCCACCTTTTAAGCCTCTGC Pma114 TATC CTTGAACAGGCAGTGTAAAGGGGGC ACCTGGAGCCAGTCATGTTCATGGT Pma121 ATAG GCCTTGGGCACACACATATGCACTT TTGCCATTATAGTTGCCAGGGACGC Pma128 TATC TTGTGTCCTCTAGTCGGGTTGCACA TTGTGGTTGCAGCTCTCTGTTAGCC Pma133 TATC TGTTCTTACTGCATGGCGCTGCTAC CCCCCTAAACCCTACACACTCAACC
P. leopardus PL03 CA TTTGTAGTTCAGTTCAGAAGAGC AACTAAGGTTCAATCCAAGTCCAAT
PLL04 GT ACCCATCCACCTCCCATCCCTAA TGTCTGCGTGCTCCAATCTATCT PLL05 CA GCTGCCATTTATTTCGGCTTGA TTCAATTTAGCTCCACTTGCTT PLL12 AC CTTGATGACTCGGGCTCCTTTC GTGTTTGGCAGGACCTTGAGTG
P. leavis
2.22 CA GGTCCTCGTGGATGTGTAACC CACATGGGATGAACTTCAGC 3.62 CA TTTGTGCAGCCAGACTTAAGC ACATGCTGATTGGATCCTAGG 7.90 TG ATCCTAATCCACACAGAATGC GGTTTAATCGTGTTTATGACCG
L. miniatus 19RTE AC CAGCCAGGTTCCTCTTCATCC TGTACTCTATCAATGACAGACG
58RTE TG TGCCAGTGTGTGGGCAGTAGG TTCGACAAATTGTTTACTAATTTGC 67RTE GT TGGCTTTGAACAGATCCAGC TTTGGGCTATTAATGCCTTGG 95TGRTE TG TCTGTATTTGGTATTCCAACG TCAGTGTCAGAGAGACAGC
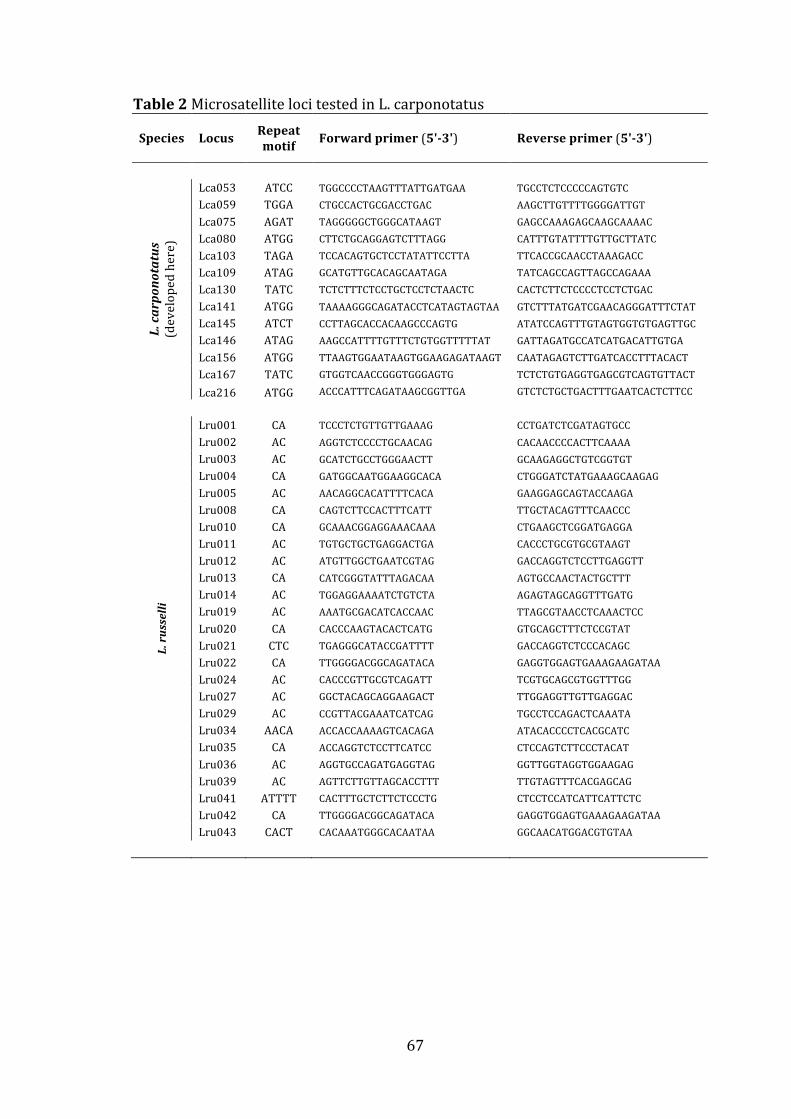
67
Table 2 Microsatellite loci tested in L. carponotatus
Species Locus Repeat motif Forward primer (5'-‐3') Reverse primer (5'-‐3')
L. carponotatus
(developed here)
Lca053 ATCC TGGCCCCTAAGTTTATTGATGAA TGCCTCTCCCCCAGTGTC Lca059 TGGA CTGCCACTGCGACCTGAC AAGCTTGTTTTGGGGATTGT Lca075 AGAT TAGGGGGCTGGGCATAAGT GAGCCAAAGAGCAAGCAAAAC Lca080 ATGG CTTCTGCAGGAGTCTTTAGG CATTTGTATTTTGTTGCTTATC Lca103 TAGA TCCACAGTGCTCCTATATTCCTTA TTCACCGCAACCTAAAGACC Lca109 ATAG GCATGTTGCACAGCAATAGA TATCAGCCAGTTAGCCAGAAA Lca130 TATC TCTCTTTCTCCTGCTCCTCTAACTC CACTCTTCTCCCCTCCTCTGAC Lca141 ATGG TAAAAGGGCAGATACCTCATAGTAGTAA GTCTTTATGATCGAACAGGGATTTCTAT Lca145 ATCT CCTTAGCACCACAAGCCCAGTG ATATCCAGTTTGTAGTGGTGTGAGTTGC Lca146 ATAG AAGCCATTTTGTTTCTGTGGTTTTTAT GATTAGATGCCATCATGACATTGTGA Lca156 ATGG TTAAGTGGAATAAGTGGAAGAGATAAGT CAATAGAGTCTTGATCACCTTTACACT Lca167 TATC GTGGTCAACCGGGTGGGAGTG TCTCTGTGAGGTGAGCGTCAGTGTTACT
Lca216 ATGG ACCCATTTCAGATAAGCGGTTGA GTCTCTGCTGACTTTGAATCACTCTTCC
L. russelli
Lru001 CA TCCCTCTGTTGTTGAAAG CCTGATCTCGATAGTGCC Lru002 AC AGGTCTCCCCTGCAACAG CACAACCCCACTTCAAAA Lru003 AC GCATCTGCCTGGGAACTT GCAAGAGGCTGTCGGTGT Lru004 CA GATGGCAATGGAAGGCACA CTGGGATCTATGAAAGCAAGAG Lru005 AC AACAGGCACATTTTCACA GAAGGAGCAGTACCAAGA Lru008 CA CAGTCTTCCACTTTCATT TTGCTACAGTTTCAACCC Lru010 CA GCAAACGGAGGAAACAAA CTGAAGCTCGGATGAGGA Lru011 AC TGTGCTGCTGAGGACTGA CACCCTGCGTGCGTAAGT Lru012 AC ATGTTGGCTGAATCGTAG GACCAGGTCTCCTTGAGGTT Lru013 CA CATCGGGTATTTAGACAA AGTGCCAACTACTGCTTT Lru014 AC TGGAGGAAAATCTGTCTA AGAGTAGCAGGTTTGATG Lru019 AC AAATGCGACATCACCAAC TTAGCGTAACCTCAAACTCC Lru020 CA CACCCAAGTACACTCATG GTGCAGCTTTCTCCGTAT Lru021 CTC TGAGGGCATACCGATTTT GACCAGGTCTCCCACAGC Lru022 CA TTGGGGACGGCAGATACA GAGGTGGAGTGAAAGAAGATAA Lru024 AC CACCCGTTGCGTCAGATT TCGTGCAGCGTGGTTTGG Lru027 AC GGCTACAGCAGGAAGACT TTGGAGGTTGTTGAGGAC Lru029 AC CCGTTACGAAATCATCAG TGCCTCCAGACTCAAATA Lru034 AACA ACCACCAAAAGTCACAGA ATACACCCCTCACGCATC Lru035 CA ACCAGGTCTCCTTCATCC CTCCAGTCTTCCCTACAT Lru036 AC AGGTGCCAGATGAGGTAG GGTTGGTAGGTGGAAGAG Lru039 AC AGTTCTTGTTAGCACCTTT TTGTAGTTTCACGAGCAG Lru041 ATTTT CACTTTGCTCTTCTCCCTG CTCCTCCATCATTCATTCTC Lru042 CA TTGGGGACGGCAGATACA GAGGTGGAGTGAAAGAAGATAA Lru043 CACT CACAAATGGGCACAATAA GGCAACATGGACGTGTAA
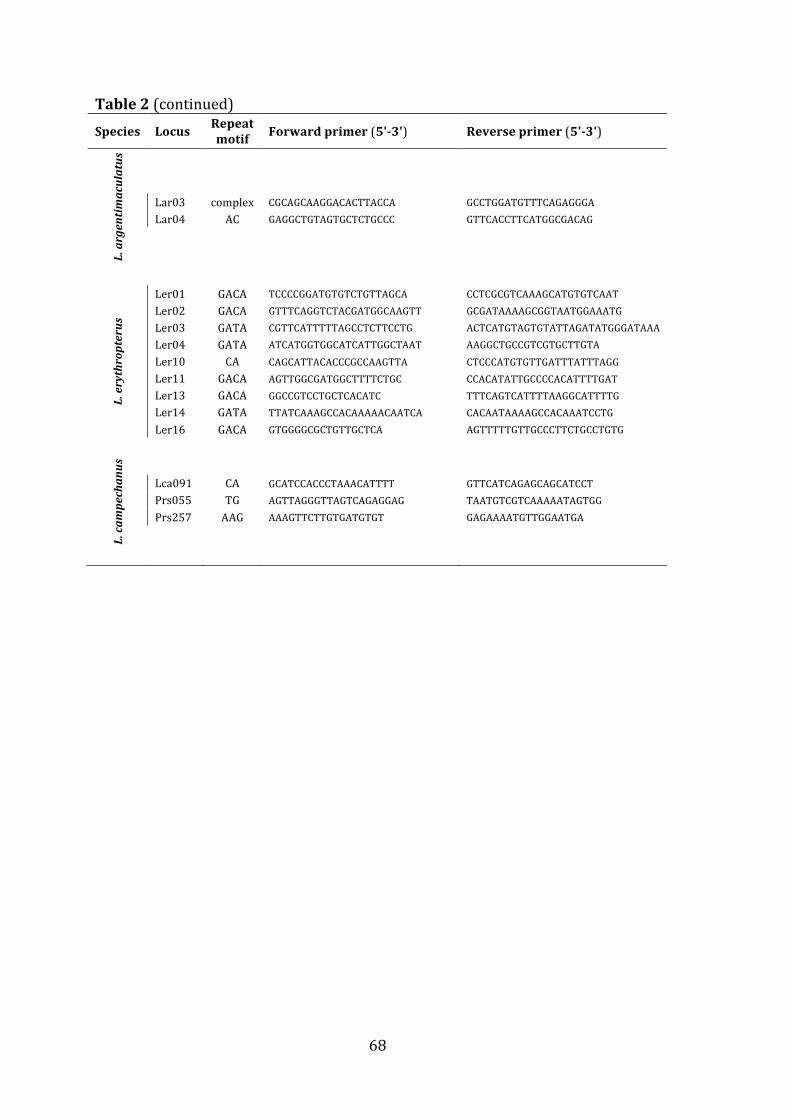
68
Table 2 (continued) Species Locus Repeat
motif Forward primer (5'-‐3') Reverse primer (5'-‐3') L. argentimaculatus
Lar03 complex CGCAGCAAGGACACTTACCA GCCTGGATGTTTCAGAGGGA Lar04 AC GAGGCTGTAGTGCTCTGCCC GTTCACCTTCATGGCGACAG
L. erythropterus
Ler01 GACA TCCCCGGATGTGTCTGTTAGCA CCTCGCGTCAAAGCATGTGTCAAT Ler02 GACA GTTTCAGGTCTACGATGGCAAGTT GCGATAAAAGCGGTAATGGAAATG Ler03 GATA CGTTCATTTTTAGCCTCTTCCTG ACTCATGTAGTGTATTAGATATGGGATAAA Ler04 GATA ATCATGGTGGCATCATTGGCTAAT AAGGCTGCCGTCGTGCTTGTA Ler10 CA CAGCATTACACCCGCCAAGTTA CTCCCATGTGTTGATTTATTTAGG Ler11 GACA AGTTGGCGATGGCTTTTCTGC CCACATATTGCCCCACATTTTGAT Ler13 GACA GGCCGTCCTGCTCACATC TTTCAGTCATTTTAAGGCATTTTG Ler14 GATA TTATCAAAGCCACAAAAACAATCA CACAATAAAAGCCACAAATCCTG Ler16 GACA GTGGGGCGCTGTTGCTCA AGTTTTTGTTGCCCTTCTGCCTGTG
L. cam
pechanus
Lca091 CA GCATCCACCCTAAACATTTT GTTCATCAGAGCAGCATCCT Prs055 TG AGTTAGGGTTAGTCAGAGGAG TAATGTCGTCAAAAATAGTGG Prs257 AAG AAAGTTCTTGTGATGTGT GAGAAAATGTTGGAATGA

69
RESULTS
Microsatellites development
Overall, 23 (68%) microsatellite markers for P. maculatus and 39 (75%) markers
for L. carponotatus that were tested failed to meet the desired requirements
multiplex PCR or parentage analysis. While the large majority of these markers
successfully amplified microsatellite loci for each target species, the development
of these markers was discontinued due to either excessive stutter, amplification
artifact, low yield or insufficient polymorphism. Several markers showed
promising results but could not be included in the multiplex reactions due to
fragment size overlap (e.g. Lca075, Pma093, and Pma097) or excessive hetero-‐
dimer duplexing (Lru039, Lru001, Lru020, Ler13, 3.62, and Pm01). Others were
included in multiplexes but were later found to have an excess of homozygotes,
suggesting null alleles were present (Pma082, Lru004, Lru041, Lru013, and Ler10).
Eleven and thirteen microsatellites were retained and successfully integrated to
multiplex PCR reactions for the analysis of parentage in P. maculatus (Table 3) and
L. carponotatus (Table 4), respectively.
Multiplex PCR assays for parentage analyses
Each microsatellite panel was characterised for a total of 466 adult P. maculatus
and 1154 adult L. carponotatus. Each panel was composed of highly polymorphic
microsatellite loci that showed no signs of null alleles, or significant departure
from Hardy-‐Weinberg expectations. Missing data accounted for 0.2% in the P.
maculatus dataset and 0.8% in the L. carponotatus dataset. Genotyping error rates
across all loci were estimated as less than 2% in the P. maculatus dataset and less
than 1% in the L. carponotatus dataset. All novel sequences were submitted to
GenBank (Accession no. JN222550-‐JN222555).
Among 466 P. maculatus, the mean number of alleles and allelic richness per
locus was 24.8 and 17.4, respectively, with an average observed heterozygosity of
0.753 ± 0.067 SE across all samples (Table 3). Most loci showed considerable
polymorphic information content (PIC) with only two loci with PIC < 0.5 (Pm10
and Pm12). This also resulted in a low probability of exclusion for these loci.
However, across the panel of 11 loci, the average PIC per locus was 0.734 ± 0.070

70
SE with an exclusion probability of single and parent pair assignments of 0.4772 ±
0.0811 SE and 0.7662 ± 0.0755 SE, respectively. These exceptionally high levels
polymorphism in the marker panel resulted in a cumulative exclusion probability
above 99.98%. In other words, the probability that an individual is falsely
identified as the parent of an offspring based strict Mendelian incompatibilities is
less than 1 in 5,000.
Among 1154 L. carponotatus, the mean number of alleles and allelic richness
per locus was 24.0 and 15.5, respectively, with average observed heterozygosity of
0.760 ± 0.048 SE across all samples (Table 4). Among 1154 L. carponotatus, the
mean number of alleles and allelic richness per locus was 24.0 and 15.5,
respectively, with average observed heterozygosity of 0.760 ± 0.048 SE across all
samples (Table 4). Most loci showed considerable polymorphic information
content (PIC) with only two loci with PIC < 0.5 (Lru019 and Lru024). This also
resulted in a low probability of exclusion for these loci. However, across the panel
of 13 loci, the average PIC per locus was 0.738 ± 0.061 SE with an exclusion
probability of single and parent pair assignments of 0.4585 ± 0.0784 SE and
0.7400 ± 0.0728 SE, respectively. These exceptionally high levels polymorphism in
the marker panel resulted in a cumulative exclusion probability above 99.99%. In
other words, the probability that an individual is falsely identified as the parent of
an offspring based strict Mendelian incompatibilities is less than 1 in 10,000.
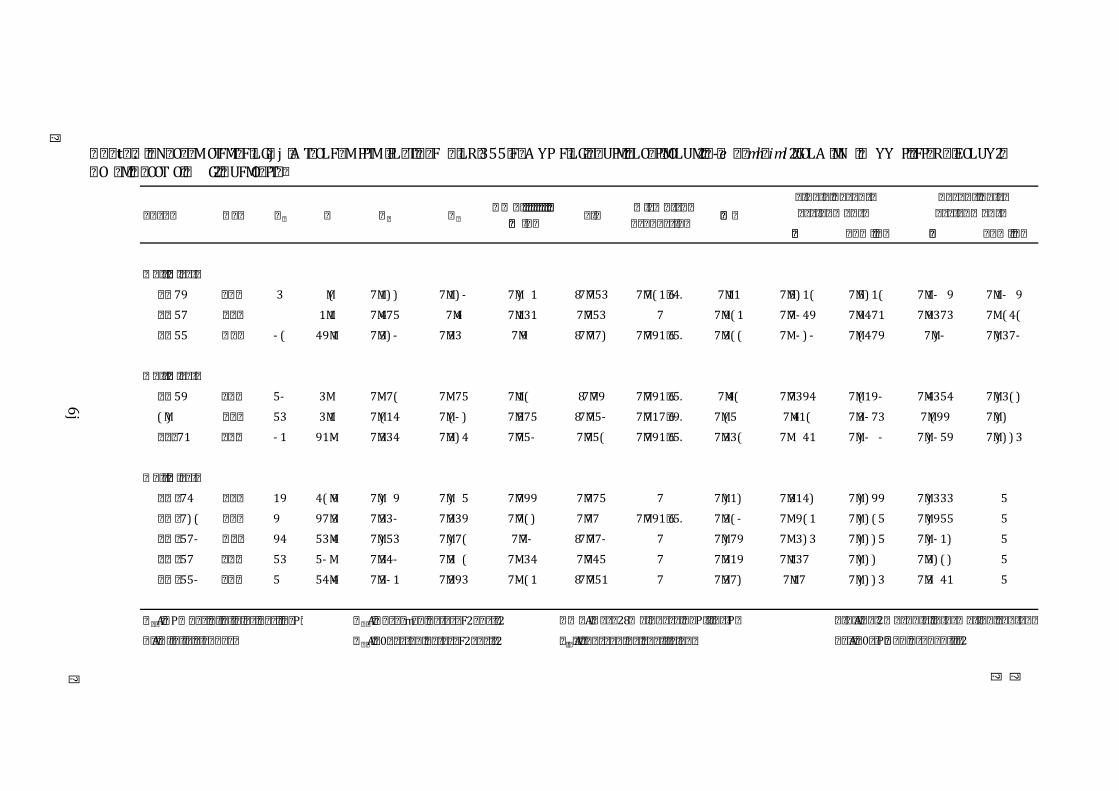
��
6j�
��
� � � t� � . � � N� O� � M OTFMT� F� LG� j j � A T� OLF� M PPTM � PL� T� � � F � LR� 355� F� A YP F� LG� � UPM� � LO� P� MOLUM2� � -‐� e � � mh� iml2� GOLA � MN � � YY P� FP� R � EOLUY2�� O � M� � � OOT O� � G2� � UFMO� PT� �
�� � � � � � � � �� � � � � � � �
� � 79 � � � 3 1 M( 7M1) ) 7M1) / 7M) 1 1 87M753 7M7( 1� 64. 7M11 7M5) 1( 7M5) 1( 7M1/ 1 9 7M1/ 1 9
� � 57 � � � 1 1M1 7M475 7M4 7M131 7M753 7 7M9( 1 7M7/ 49 7M9471 7M9373 7M1 ( 4(
� � 55 � � � / ( 49M1 7M3) / 7M331 7M91 87M77) 7M791� 65. 7M3( ( 7M1 / ) / 7M( 479 7M) / 7M) 37/
� � 59 � � � 5/ 3M1 7M/ 7( 7M/ 75 7M1( 1 87M79 7M791� 65. 7M4( 7M7394 7M( 19/ 7M4354 7M) 3( )
(M) � � � 53 3M1 7M( 14 7M( / ) 7M575 87M75/ 7M717� 69. 7M( 51 7M41( 7M3/ 73 7M( 99 7M) ) 1 1
� � � 71 � � � / 1 91M/ 7M334 7M3) 4 7M75/ 7M75( 7M791� 65. 7M33( 7M1 1 41 7M) / 1 / 7M) / 59 7M) ) ) 3
� � � 741 � � � 19 4(M9 7M) 1 9 7M) 1 5 7M799 7M775 7 7M) 1) 7M314) 7M) ) 99 7M) 333 5
� � � 7) ( � � � 91 97M3 7M33/ 7M339 7M7( ) 7M771 7M791� 65. 7M3( / 7M1 9( 1 7M) ) ( 5 7M) 955 5
� � � 57/ � � � 94 53M4 7M) 53 7M) 7( 7M7/ 87M77/ 7 7M) 79 7M1 3) 3 7M) ) ) 5 7M) / 1) 5
� � � 571 � � � 53 5/ M1 7M34/ 7M31 ( 7M/ 34 7M745 7 7M319 7M1371 7M) ) ) 1 7M3) ( ) 5
� � � 55/ � � � 51 54M4 7M3/ 1 7M393 7M/ ( 1 87M751 7 7M37) 7M171 7M) ) ) 3 7M31 41 5
� � � A� � � � � 28 � � � � � � � � � � P� � � � � � P� � � � � A� � � � 2� � � � � � � � � � � � � � � � � � � � � � � �
� � A� � � � � � � � � � � � � � � � � � � �A� � 0� � � � � � � � � � � F2� � � � 2 � � � A� � � � � � � � � � � � � � � � � � � � � � � � � A� � 0� � P�� � � � � � � � � � � � � 2
� � � �� � � � � �
� � � �� � � � � �
� � � �� � � � � �
� �A� P� � � � � � � � � � � � � � � � � � � � � � � P� � � �A� � � � � m� � � � � � � � F2� � � � 2
� � � � � � � � � � � � � ���� � � � � � � � � � � � � � �
� � � � � � � � � � �� �� � � � � � � � � � � � � � � � � � � � �
� � � � � � � � � � � � � � � � � �� � � � � � � � � � � �

��
6z�
��
� � � t� � 7� � N� O� � M OTFMT� F� LG� j -‐ � A T� OLF� M PPTM � PL� T� � � F � LR� j j 43� F� A YP F� LG� � UPM� FMOTY h� FR� YY O2� � -‐� � � avo oi � iml2� GOLA � MN � � YY P� FP� R �EOLUY2� � O � M� � � OOT O� � G2� � UFMO� PT� �
�� � � � � � � � �� � � � � � � �
� � L. 3 � � � 8. 2A( . A23( . A22 3 . A1 67 M. A. . 8 . A. . 2� 185 . A2. ( . A81 2( . A81 2( . A32 2 ( . A32 2 (
� � L73 � � � ) 2A7 . A31 8 . A32 1 . A) 2( . A. . 6 . A. . 2� 185 . A6) 3 . A8. 21 . A726) . A6286 . A1 1 87
� � L7) � � � 83 2 A6 . A1 1 . A1 2 ) . A1 22 M. A. . 8 . A. 77� 135 . A1 . 2 . A73 . A366 . A21 . ) . A( 286
� � L8) � � � 1 6A7 . A272 . A283 . A21 7 M. A. 8( . . A6) 2 . A87) ) . A2. 1 1 . A6861 . A( ) 2 )
� � L36 � � � 77 8( A2 . A( 1 1 . A( 26 . A3) 7 M. A. 8 . A. . 2� 185 . A( 6) . A222 8 . A2 ( 82 . A( ( 33 . A) ( ( 7
� � L8. � � � 6) 8) A7 . A2 67 . A2 32 . A888 . A. 88 . A. 81 � 165 . A2 8( . A62 . 8 . A( 1 76 . A2 28) . A) ) 2 8
� � L83 � � � 61 83A( . A2 27 . A2 2 7 . A. 26 . A. . 2 . . A2 67 . A6( 71 . A) 82 . A2 223 . A) ) ) 6
� � � 8. 6 � � � 3. 7( A( . A) 3) . A) 2 . A377 . . A. 88� 175 . A) 31 . A( 8. 3 . A) ( 6) . A) ( . 2 8
� � � 8. ) � � � 72 7. A7 . A) 77 . A) 73 . A377 . A. . ( . A. 81 � 165 . A) 8( . A2 6. 1 . A) ) 22 . A) 2) 1 8
� � � . 2) � � � 8) 86A7 . A2 87 . A2 . 2 . A62 7 M. A. 8 . A. . 2� 185 . A1 2 6 . A682 2 . A) ) 2 . A2 7 8
� � � 86. � � � 72 8( A) . A( ( 6 . A) . 1 . A323 . A. 7( . A. 88� 175 . A( ) 2 . A1 2 7 . A) ) ) . A) 6( 2 8
� � � . 26 � � � 61 76A2 . A) 62 . A) 7 . A2 2 6 M. A. 8 . A. 81 � 165 . A) 83 . A2 73 . A) ) ) 2 . A) 2( 6 8
� � � 81 2 � � � 7) 77A3 . A) 67 . A) 68 . A7) 6 M. A. . 8 . . A) 72 . A2 23) . A) ) ) ) . A) 1 1 ) 8
� � � � � � � � � � � � � � � � � �� � � � � � � � � � � �
� � � F� � � � � 0M � � � � � � � � � � L� � � � � � L�
� � � � � � � � � � � � � � � ��� � � � � � � � � � � � � � �
� � � � � � � � � � �� �� � � � � � � � � � � � � � � � � � � � �
� � � � F� � � � 0� � � � � � � � � � � � � � � � � � � � � � � �
� � F� � � � � � � � � � � � � � � � � � � �F� � u� � � � � � � � � � � 40� � � � 0 � � � F� � � � � � � � � � � � � � � � � � � � � � � � � F� � u� � L�� � � � � � � � � � � � � 0
� � � �� � � � � �
� � � �� � � � � �
� �F� L� � � � � � � � � � � � � � � � � � � � � � � L� � � �F� � � � � r � � � � � � � � 40� � � � 0

73
DISCUSSION
In this chapter, I described the characterization of a novel set of microsatellite loci
for the resolution of parentage in populations of coral trout, P. maculatus, and
stripey snapper, L. carponotatus. Markers were selected based on the quality of
amplification and the level of allelic polymorphism in order to maximise the
accuracy of subsequent parentage analyses. Suitable markers were pooled into
multiplex PCR reaction for high-‐throughput screening and characterised for
several hundred individuals in each species. Overall, each set of markers showed
high levels of polymorphism, which resulted in a cumulative probability of
exclusion of at least 99.98%. While the power of exclusion is not directly relevant
to all parentage methods (e.g. categorical assignments), it indicates that each set of
markers is suitable to distinguish parent-‐offspring pairs with a high level of
confidence.
The ideal marker set for parentage studies will depend entirely on the size of
the target population, the proportion of individuals sampled and the level of
polymorphism in the population. For small population, with less than 100
individuals, markers with low allelic diversity should be favoured to ensure
accurate representation of allelic frequencies. Increasing the number of markers
can compensate for the reduction in the accuracy of subsequent parentage
analyses (see Chapter 2). In large populations, where large numbers of individuals
can be sampled, it is possible to obtain accurate allelic frequencies for markers
with a much greater allelic diversity. These are ideal for parentage studies as they
greatly increase the accuracy of parentage assignments (see Chapter 2). Given the
high polymorphism of markers developed here, fewer markers were necessary to
achieve a Pe > 99.9 than those simulated in Chapter 2 (Tables 1 & 2), and thus
providing a high level of accuracy and confidence in parentage assignments.
While these highly diverse loci greatly increase the power of exclusion, the
presence of rare alleles and uneven distribution of alleles may also increase the
likelihood of false positive assignments (see Chapter 2). Where two individuals
share the same rare alleles, these may be identical in state but not by descent and
mis-‐representation of allelic frequencies can artificially increase the likelihood that
the two individuals are related. Though this is not likely to be the case in our

74
populations, where a large proportion of adults have been sampled, this marker
set may be of limited value to studies that do not sample large proportions of focal
populations. What constitutes a representative proportion of a given population,
and how this may affect the allelic frequencies at a particular locus, has not yet
been adequately addressed (but see Neff et al. 2000; Bernatchez and Duschesne
2000; Kalinowski 2005, Hale et al. 2012). Assuming our sample of the adult
population for P. maculatus (466 individuals) and L. carponotatus (1154
individuals) in the Keppels captured the full allelic distribution at each locus, we
can measure the proportion of alleles that are likely to be represented in a subset
of the population. If only 50 individuals were sampled, which is common for most
studies investigating population structure and gene flow, the mean number of
alleles sampled across all loci (± exact pooled variance) is only 67% ± 8% and
~52% ± 8% of all known alleles in the P. maculatus and L. carponotatus datasets,
respectively. Small sample sizes are therefore likely to have significant effect on
the accuracy of allelic frequencies for these marker set. What constitutes a large
enough sample remains to be determined, however, it clear that there is an
optimum sample size for any given number of alleles per locus.
CONCLUSION
In conclusion, the multiplex assays developed for coral trout, P. maculatus, and
stripey snapper, L. carponotatus, provide a strong and robust basis with which to
investigate parentage and other genealogical relationships in natural populations.
While their application to classical population genetics analysis may be limited to
studies with large sample size, they serve as an important baseline for future
microsatellite development for these species. With the advent of next generation
sequencing, the development of large sets of microsatellite loci has become easier,
faster, and creates additional flexibility for the development of multiplex assays.
The technical developments in both isolating molecular markers and high
throughput screening of multi-‐locus genotypes have laid the foundation for a new
era linking genetic approaches to ecological research.

75
CHAPTER 4 -‐ LARVAL EXPORT FROM MARINE RESERVES AND THE
RECRUITMENT BENEFIT FOR FISH AND FISHERIES
ABSTRACT
Marine reserves, areas closed to all forms of fishing, continue to be advocated and
implemented to supplement fisheries and conserve populations. However, while
the reproductive potential of important fishery species can dramatically increase
inside reserves, the extent to which larval offspring are exported and the relative
contribution of reserves to recruitment in fished and protected populations are
unknown. Using genetic parentage analyses, we resolve patterns of larval dispersal
for two species of exploited coral reef fish within a network of marine reserves on
the Great Barrier Reef. In a 1,000km2 study area, populations resident in three
reserves exported 83% (coral trout – Plectropomus maculatus) and 55% (stripey
snapper -‐ Lutjanus carponotatus) of assigned offspring to fished reefs, with the
remainder having recruited to natal reserves or other reserves in the region. We
estimate that reserves, which account for just 28% of the local reef area, produced
approximately half of all juvenile recruitment to both reserve and fished reefs
within 30km. This is commensurate with an observed two-‐fold greater adult
biomass within reserves. Our results provide compelling evidence that adequately
protected reserve networks can make a significant contribution to the
replenishment of populations on both reserve and fished reefs at a scale that
benefits local stakeholders.

76
INTRODUCTION
Coastal marine ecosystems have been subjected to a long history of human impacts
that are predicted to escalate over the next century (Jackson et al. 2001; Halpern et
al. 2008). While there is no single solution to alleviate such impacts, no-‐take
marine reserves represent one management action that can deliver tangible and
rapid benefits (Pauly et al. 2002; Gell and Roberts 2003; Lubchenco et al. 2003;
Gaines et al. 2010). Thousands of marine reserves have been implemented globally
in the hope of restoring and sustaining fisheries, and conserving biodiversity
(Mora et al. 2006; Wood et al. 2008). Hundreds of studies have demonstrated that
exploited species have higher abundance, biomass and reproductive potential
within adequately protected reserves (Halpern 2003; Lester et al. 2009; Babcock et
al. 2010; Russ et al. 2008). In theory, the elevated populations in reserves can
simultaneously provide both fisheries and conservation benefits, as long as there is
both substantial larval export from reserves to fished areas, and either self-‐
recruitment within or dispersal among reserves (Gaines et al. 2010; Sale et al.
2005; Botsford et al. 2003; Hastings and Botsford 2006; Pelc et al. 2010). In
practice, there is little concrete evidence that reserves provide recruitment
benefits beyond their immediate boundaries (Gell and Roberts 2003; Sale et al.
2005; Steneck et al. 2009). Recent breakthroughs in larval tagging and genetics
have shown that it is possible to track the dispersal trajectories of larvae for small
marine fishes over increasingly large distances (Swearer et al. 2002; Jones et al.
2005; Planes et al. 2009; Jones et al. 2009; Almany et al. 2007; Saenz-‐Agudelo et al.
2010; Christie et al. 2010a; Berumen et al. 2012; Hogan et al. 2012). However, for
large exploited fishes, it has been seemingly impossible to determine where the
larvae from populations within reserves go, or to assess the relative importance of
the supply of juveniles from reserves. These are critical knowledge gaps that limit
our understanding of the wider benefits of marine reserve networks for fish
conservation and fisheries management.

77
Figure 1 Sampling locations of adult and juvenile fish. The Keppel Islands includes six no-‐take marine reserves (Marine National Park zones – shaded green) protecting 28% of coral reefs. Adult P. maculatus and L. carponotatus were sampled within three no-‐take reserves (dashed line borders) and juveniles were sampled from 19 locations (red stars) within both reserves and areas open to fishing (See also Table 1). Conservation Park zones (yellow) permit limited recreational hook-‐and-‐line and spear fishing. Habitat Protection zones (dark blue) exclude demersal trawling but permit hook-‐and-‐line and spear fishing. General Use zones (light blue) allow all types of fishing.
We applied DNA parentage analysis to provide a unique assessment of the
importance of reserves as a source of juveniles to both fished and protected
populations in a coastal archipelago of the Great Barrier Reef (GBR). Here, 28% of
coral reefs are protected in a network of six no-‐take marine reserves (Keppel
Island group; Figure 1). Our field study focused on two commercially and
recreationally targeted fish species: the coral trout, Plectropomus maculatus

78
(Serranidae), and stripey snapper, Lutjanus carponotatus (Lutjanidae), for which
the mean biomass of reproductive adults was approximately twice as high on no-‐
take reserve reefs than on surrounding fished reefs (Figure 2). Over 4 weeks
during the peak reproductive season (Austral summer), we collected tissue
samples from 466 adult P. maculatus and 1154 adult L. carponotatus within three
focal reserves (Figure 1) representing 26.9% ± 8.3% SE and 35.7% ± 7.1% SE of
focal populations, respectively. During the following 15 months, juveniles of both
species were collected from 19 protected and fished locations up to 30 km from
the focal reserves (Figure 1; Table 1). By recording the sampling locations of all
adult and juvenile fishes, and assigning offspring to one or both parents, we were
able to establish the dispersal distance and direction of juveniles spawned in the
focal reserves.
Figure 1 Relative fish biomass in protected and fished areas. Mean biomass (kg per 1000m2) of P. maculatus and L. carponotatus within no-‐take marine reserves (green bars) and fished areas (blue bars) in the Keppel Islands study area as estimated from December 2007 UVC surveys. The mean biomass of both species was significantly greater inside no-‐take reserves than in adjacent areas which are open to fishing (ANOVA: F1,20 = 12.87, P = 0.002 for P. maculatus, and F1,20 = 6.97, P = 0.016 for L. carponotatus). Error bars indicate ± 1 SE.

79
MATERIAL AND METHODS
Natural history and fishery information
Coral trout, Plectropomus maculatus (Serranidae, Bloch 1790), and stripey snapper
Lutjanus carponotatus (Lutjanidae, Richardson 1842), occur throughout the Great
Barrier Reef Marine Park (GBRMP), the north and west coast of Australia, and most
of the western tropical Pacific. Within the GBRMP, P. maculatus are predominantly
found on inner-‐continental-‐shelf reefs, whereas L. carponotatus are widely
distributed across both inshore and offshore reefs. Coral trout are protogynous
hermaphrodites (change sex from female to male) that form small haremic social
groups consisting of a single larger male and several smaller females (Heemstra
and Randall 1993), whereas stripey snapper are gonochoristic (determinate sex
throughout life history), typically occurring in 50:50 sex ratios (Kritzer 2004) and
forming schools of several to tens of individuals (Allen 1985). Our underwater
observations of the two species in the study area indicate that adult coral trout
were most abundant on reef slopes, particularly in areas of high habitat
complexity, whereas adult stripey snapper were commonly found on both reef
flats and slopes. Extensive searches in all reef habitats revealed that the juveniles
of both species were predominantly confined to reef flats and shallow lagoon areas
(1-‐3m depth) with patch reefs dispersed within expanses of coral rubble and sand.
Juvenile coral trout were also encountered in much lower densities in rubble-‐
dominated habitats at the base of reef slopes, particularly in the vicinity of small
patch reefs.
Both coral trout and stripey snapper are highly exploited in Australia and
throughout the Indo-‐Pacific region. The commercial coral reef hook and line
fishery in Queensland waters currently generates $39.5 million annually (DEEDI).
During 2008/09, the total commercial catch of coral trout (Plectropomus spp.)
from Queensland waters was 1230 tonnes (61% of the total catch of all species),
while 44 tonnes of stripey snapper were harvested during the same period
(DEEDI). Both species are also targeted by the recreational fishing sector,
particularly on the inner-‐shelf reefs of the GBRMP. The total recreational catch of
coral trout or stripey snapper has not been determined, but it can be stated with
confidence that levels of recreational fishing effort are high enough to significantly

80
reduce the mean density, size and biomass of these species in areas that are open
to fishing on inshore reefs of the GBRMP (Russ et al. 2008; McCook et al. 2010;
Williamson et al. 2004).
Study location and sample collection
This study was carried out in the Keppel Island group (23°10´ S, 150°57´ E) within
the Great Barrier Reef Marine Park, Australia (Figure 1). There are six no-‐take
marine reserves in the island group, which had been protected for between 3 and
19 years at the time of the present study (Figure 1; Table 1). Adults were sampled
between November 2007 and February 2008 from four coral reefs in three focal
marine reserves (Figure 1; Table 1). A total of 466 adult coral trout and 1154 adult
stripey snapper were sampled from the three focal marine reserves (Table 2; Table
3) and all individuals were released alive at the capture site. Fish were captured
using baited, barbless hooks and line. Each fish was measured to the nearest
centimetre and a uniquely-‐numbered, brightly-‐coloured t-‐bar tag (Hallprint,
Australia) was inserted into the dorsal musculature. A small section of the pectoral
fin was removed from each fish and stored in 85% ethanol for genotyping and
parentage analysis. Juveniles were sampled in May 2008 and February 2009 from
19 locations scattered throughout the study area (Figure 1; Table 1). A total of 493
juvenile coral trout and 474 juvenile stripey snapper were collected, with slightly
fewer samples collected in fished areas compared to reserves relative to the
available reef area (P. maculatus: 1:1.04; L. carponotatus: 1:1.52). Juveniles of both
species were predominantly found in specific reef habitats, however all reef
habitats within the study area were searched. Juveniles were collected on SCUBA
using a variety of methods, including spears, barrier nets, hand nets and clove oil
(as an anesthetic). Each juvenile was measured to the nearest millimetre using dial
callipers, otoliths (ear bones) were removed for age-‐determination, and a tissue
sample was preserved in 85% ethanol for parentage analysis. During adult
sampling, there were 109 recaptures of tagged adult P. maculatus and 471
recaptures of tagged adult L. carponotatus within the focal reserves. Over 80% of
the P. maculatus recaptures and 90% of the L. carponotatus recaptures were within
500 m of their original tagging location, suggesting that adults were largely
resident within reserves during the sampling period.

81
Population and density estimates
Underwater visual census (UVC) surveys were conducted at 22 sites within the
Keppel Island group in December 2007 to estimate population density, size
structure and biomass of P. maculatus and L. carponotatus within no-‐take reserves
and fished zones (Figure 2). Eleven of the UVC sites were located within reserves
and eleven sites were located in areas that were open to fishing. At each site, five
replicate 50 m x 6 m transects were surveyed along the reef slope, oriented
parallel to the reef crest. The total length (TL) of all sighted P. maculatus and L.
carponotatus was estimated to the nearest 5 cm. In December 2007, the mean
biomass of adult P. maculatus within Keppel Island group reserves was 2.3 times
higher than it was in adjacent areas that were open to fishing. Similarly, the mean
biomass of L. carponotatus was 1.9 times higher in reserves than in fished areas
(Figure 2). For both species, the approximately two-‐fold differential in mean
biomass between reserve and fished zones of the Keppel Islands in 2007, was
consistent with the findings of previous studies that have examined the effects of
reserves on hectares (~ 28%) was within six no-‐take reserves (Table 1). The three
focal reserves from which adults were sampled contained 100.65 hectares of coral
reef and accounted for 51.3% of these species on inshore reefs of the GBRMP (Russ
et al. 2008; McCook et al. 2010; Williamson et al. 2004). In December 2007, the
mean TL (± SE) of P. maculatus in Keppel Island group reserves was 355.4 mm ±
6.1 mm, while in fished areas the mean TL was 334.5 mm ± 6.1 mm. For L.
carponotatus, the mean TL (± SE) was 261.1 mm ± 3.4 mm in reserves and 236.1
mm ± 4.5 mm in fished areas.

82
Table 1 Juvenile sampling locations and the distribution of coral reef area in reserves and fished locations in the Keppel Islands.
At the conclusion of adult fish sampling in February 2008, repeated timed
swim UVC surveys were conducted within the three focal reserves to quantify the
relative proportion of tagged to untagged individuals. A minimum of three 45-‐
minute timed UVC swims were conducted by a single observer within each of the
three focal reserves (10 replicate UVC swims in total). Replicate UVC counts of
tagged and untagged fish were averaged to produce an overall estimate of the
proportion of tagged (sampled) individuals within each of the focal reserves. The
total adult population size for P. maculatus and L. carponotatus within each focal
reserve was estimated using a modified Lincoln–Petersen tag-‐release-‐resight
Juvenile sampling site Reef status & year established
Total reef area (ha)
Number of juveniles collected
P. maculatus L. carponotatus
Clam Bay & Halfway Island (East) Reserve (1988 & ‘04) 60.21 98 118
Egg Rock Reserve (1988) 4.07 0 0
Middle Island Reserve (1988) 36.36 42 53
Monkey Bay Reserve (2004) 17.67 2 5
North Keppel Island (East) Reserve (2004) 59.67 0 0
North Keppel Island (West) Reserve (2004) 18.06 0 0
Bald Rock Fished 3.34 1 5
Barren Island Fished 41.06 0 2
Big Penninsula Fished 17.60 0 2
Corroboree Island Fished 32.58 9 5
Divided Island Fished 13.20 1 4
Halfway Island Fished 29.96 159 109
Humpy Island Fished 66.10 31 29
Miall Island Fished 17.12 7 20
North Keppel Island Fished 160.85 132 100
Outer Rocks Fished 5.69 2 2
Pelican Island Fished 16.81 0 3
Wedge Island Fished 19.16 2 8
Wreck Bay Fished 23.27 7 9
Other (not sampled) Fished 58.04 0 0
Total Reserves 196.04 142 176
Total Fished 504.78 351 298
Grand Total 700.83 493 474

83
method (Seber 2002). The proportion of each reserve population sampled was
calculated by dividing the total number of fish sampled by the estimated
population size within each of the focal reserves.
Analysis of juvenile otoliths
Sagittal otoliths (ear bones) were removed from each juvenile, cleaned and dried
for age determination. Preparation of otoliths and determination of juvenile ages
using daily growth increments was conducted in accordance with previously
established protocols (Stevenson and Campana 1992). One of each pair of sagittal
otoliths was individually mounted on glass slides using thermoplastic cement and
then ground and polished to the point where daily growth increments were clearly
visible. Analysis of daily otolith increments and identification of the ‘settlement
mark’ from collected juvenile fish revealed that planktonic larval durations (PLDs)
were between 24-‐29 days for P. maculatus and 21-‐27 days for L. carponotatus. The
age-‐length relationship derived from the ageing analysis indicated that all
collected juveniles had settled and recruited to the reefs between August 2007 and
February 2009. Average fork length (± 1 SE) of the 58 assigned juvenile P.
maculatus was 152.0 mm ± 9.2 SE, which corresponds to an age range of 179-‐206
days. Average fork length (± 1 SE) of the 74 assigned juvenile L. carponotatus was
123.8 mm ± 6.1 mm, corresponding to an age range of 256-‐296 days.
Measuring available coral reef area
The available coral reef area at each location was calculated from satellite imagery
in ArcGIS (ESRI, Redlands). The total reef area within the study area was 700.83
hectares, of which 196.04 no-‐take reserve reefs within the study area. Concentric
rings were drawn from the perimeter of each of the six reserves in ArcGIS (ESRI,
Redlands) to calculate the available reef area with increasing distance (up to
30km) from reserves (Figure 4).
Parentage analysis
Samples were genotyped with a panel of 11 to 13 microsatellite loci previously
described in Chapter 3. Categorical allocation of parent-‐offspring relationships was
assessed based on a maximum likelihood approach implemented in the software

84
program FAMOZ (Gerber et al. 2003), the only method for which assignments of
marine species have been independently verified using chemical markers (Jones et
al. 2005). The program computes log of the odds ratio (LOD) scores for assigning
individuals to candidate parents based on the observed allelic frequencies at each
locus. We simulated 10,000 parent-‐offspring pairs based on the observed allelic
frequencies to determine a minimum threshold beyond which the probability of
incorrectly assigning juveniles to candidate parents was less than 5%. Genotyping
error was introduced to simulate inconsistencies in the data (0.01%) and though
this may underestimate true error in the data, it reduces both Type I and Type II
errors in parentage assignments (Gerber et al. 2000; Morrisey and Wilson 2005).
Minimum LOD score thresholds for single-‐parent assignments were identified as
5.55 for P. maculatus and 6.00 for L. carponotatus and 15.00 for the assignment to
parent-‐pairs in both species. The resulting probability of assigning a juvenile to a
parent that was not its true parent knowing that the true parent was not sampled
was less than 5% (Type II error). Conversely, the probability of a true parent-‐
offspring pair not being identified knowing that the true parent was sampled was
less than 1% (Type I error). All collected juveniles were screened against the total
pool of adult samples to identify parent-‐offspring relationships. No more than 2
mismatches were ever allowed to occur to accommodate for genotyping error, de
novo marker mutations or missing data (Gerber et al. 2000; Morrisey and Wilson
2005; Marshall et al. 1998).
Estimating the total recruitment contribution of marine reserves
To estimate the proportion of total recruitment (PRT) in our study area supplied by
the six marine reserves, we assumed that all adult P. maculatus and L. carponotatus
within the reserves had an equal probability of contributing to local recruitment
and that our juvenile sample represented a random sample of all juveniles in the
study area at the time of sampling. Since we sampled only a fraction of the
reproductive adults within focal reserves, the observed proportion of assigned
juveniles (nA/ NJS) represents only a fraction of the total progeny of focal reserves
(PRS). An estimate of the proportion of missed assignments can be calculated based
on the probability that neither parent of unassigned juveniles were sampled
(Jamieson and Taylor 1997), or (1-‐PAS)2, where PAS is the proportion of the
85
population sampled. From the observed number of assigned juveniles (nA) and the
total number of juveniles sampled (NJS), we then calculated the proportion of the
juveniles that we would have expected to assign to the three focal reserves had we
sampled 100% of the population:
𝑃!" =𝑛!𝑁!"
× 1
1− (1− 𝑃!")! (𝑒𝑞. 1)
Where:
PRS = Proportion of recruitment provided by focal reserves in the Keppel
islands
PAS = Proportion of adults sampled in focal reserves
nA = Number of assigned juveniles
NJS = Total number of juveniles sampled
Assuming mean fecundity per unit area of reef was equal in both sampled (AFR)
and unsampled reserves (ATR), we then accounted for the additional reproductive
contribution to local recruitment from the three unsampled reserves:
𝑃!" = 𝑃!" × 𝐴!"𝐴!"
(𝑒𝑞. 2)
Where:
PRT = Proportion of total recruitment from all reserves in the Keppel islands
ATR = Total reef area within all reserves in the Keppel islands
AFR = Total reef area within focal (sampled) reserves
RESULTS
Dispersal trajectories from reserves
Our study revealed that adult fishes in reserves exported a significant proportion
of their offspring to fished areas outside reserve boundaries. We identified 58

86
juvenile coral trout (Figure 2; Table 2) and 74 juvenile stripey snapper (Figure 2;
Table 3) as the progeny of adults sampled within the three focal reserves. Overall,
83% (48 of 58) of assigned coral trout juveniles and 55% (41 of 74) of assigned
stripey snapper juveniles were collected from reefs that were open to fishing,
representing a clear demonstration of larval export from reserves (Figure 2A, B).
For coral trout, 7% (4 of 58) of assigned juveniles were retained in natal reserves
(self-‐recruitment) and 10% (6 of 58) were exchanged among reserves, while for
stripey snapper, 22% (16 of 74) were retained in natal reserves and 23% (17 of
74) were exchanged between reserves (Figure 2C, D). Hence, for these two species,
adults in reserve populations were not only exporting substantial numbers of
offspring to nearby fished areas, they were also contributing to population
replenishment within the reserve network.
The observed frequency distribution of dispersal distances within 30km of
sampled reserves was remarkably similar for the two species (Figure 3A, B).
Approximately 30% of assigned juveniles were collected within 1-‐2 km of their
parents, and it is evident that the different modes in dispersal distance reflected
the geographic distance between reefs (Figure 3C). For both species, the shortest
dispersal mode (1-‐2km) was predominantly associated with an area of retention at
the largest of the islands (Great Keppel), while longer dispersal modes were
associated with dispersal among islands (Figure 2). Across the entire 1,000 km2
sampling area, over 90% of reefs that are open to fishing were within the mean
observed dispersal range of both species, suggesting that the spacing of reserves is
small enough to benefit most fished areas (Figure 3C). Clearly, successful dispersal
may also have extended to unsampled reefs beyond the Keppel Island group, and
the full spatial extent of the benefits of larval export from reserves remains to be
determined.

87
Figure 3 Realised dispersal patterns of juvenile fish from a network of marine reserves. The three focal marine reserves (green boxes) were an important source of juvenile recruitment for local fished areas. 48 juvenile P. maculatus (A) and 41 juvenile L. carponotatus (B) that had recruited to fished areas were assigned to adults from one of three focal reserves (see also Table 2 and Table 3). Coral reef areas are represented in grey, and arrow thickness is relative to the number of juveniles that were assigned to each focal reserve. Local retention within focal reserves and connectivity between reserves (dotted green boxes) also made an important contribution to juvenile recruitment in reserves. 10 juvenile P. maculatus (C) and 33 juvenile L. carponotatus (D) that had recruited in reserves were assigned to adults from one of three focal reserves (see also Table 2 and Table 3).

88
Table 2 Number of juvenile P. maculatus that were assigned to each of the three source populations within marine reserves. All assignments were to a single parent.
Plectropomus maculatus
Source populations Clam Bay &
Halfway Is. (East) N = 272
Middle Is. N = 124
Egg Rock N = 70
Total N= 466
Larval export from reserves Halfway Is. (West) 13 6 4 23 North Keppel Is. 5 8 4 17 Humpy Is. 4 -‐ 2 6 Corroboree Is. -‐ -‐ 1 1 Miall Is. -‐ -‐ 1 1
Larval retention and exchange between reserves Clam Bay & Halfway Is. (East) 4 1 2 7 Middle Is. 3 -‐ -‐ 3
Total 29 15 14 58 N = Number of adults sampled
Table 3 Number of juvenile L. carponotatus that were assigned to each of the three source populations within marine reserves. Three juvenile L. carponotatus were assigned to both parents (indicated in brackets); all other assignments were to a single parents.
Lutjanus carponotatus Source populations
Clam Bay & Halfway Is. (East)
N = 582
Middle Is. N = 458
Egg Rock N = 114
Total N = 1154
Larval export from reserves North Keppel Is. 10 4 1 15 Halfway Is. (West) 4 6 3 13 Miall Is. 6 1 -‐ 7 Humpy Is. 2 1 -‐ 3 Barren Is. -‐ 1 -‐ 1 Corroboree Is. -‐ 1 -‐ 1 Wedge Is. -‐ 1 -‐ 1
Larval retention and exchange between reserves Clam Bay & Halfway Is. (East) 11 8 2 21 Middle Is. 6 (3) 5 1 12
Total 39 28 7 74 N = Number of adults sampled
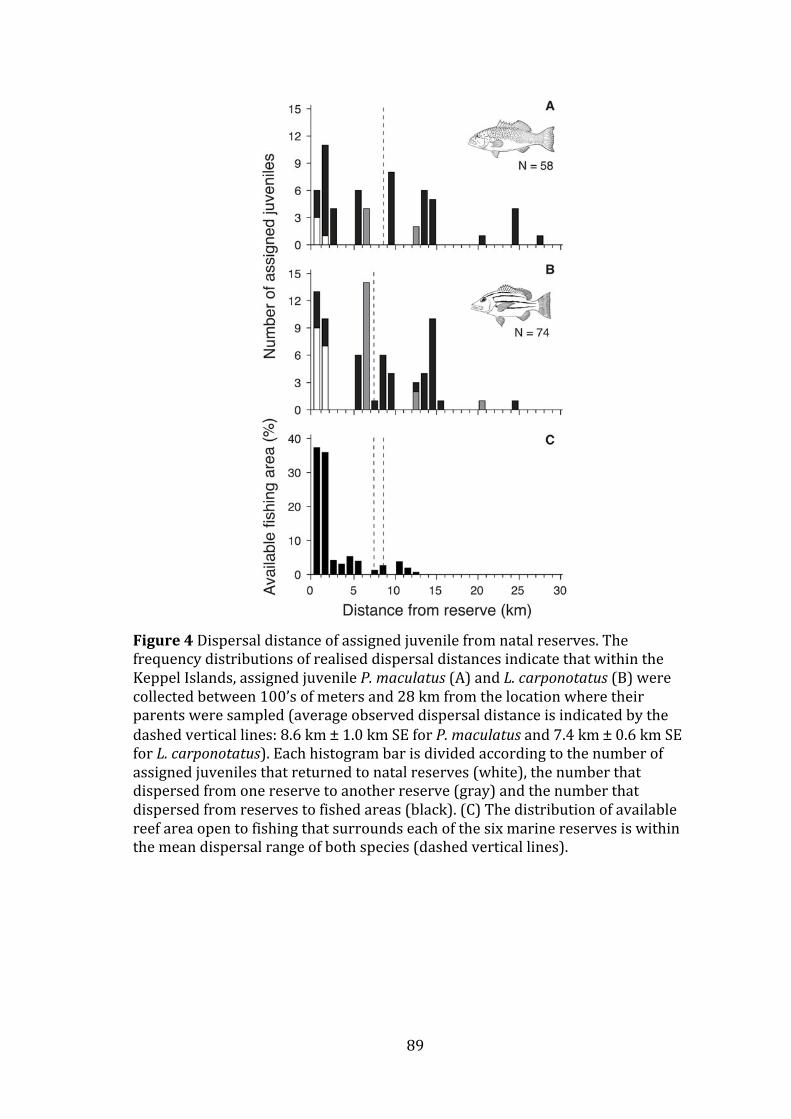
89
Figure 4 Dispersal distance of assigned juvenile from natal reserves. The frequency distributions of realised dispersal distances indicate that within the Keppel Islands, assigned juvenile P. maculatus (A) and L. carponotatus (B) were collected between 100’s of meters and 28 km from the location where their parents were sampled (average observed dispersal distance is indicated by the dashed vertical lines: 8.6 km ± 1.0 km SE for P. maculatus and 7.4 km ± 0.6 km SE for L. carponotatus). Each histogram bar is divided according to the number of assigned juveniles that returned to natal reserves (white), the number that dispersed from one reserve to another reserve (gray) and the number that dispersed from reserves to fished areas (black). (C) The distribution of available reef area open to fishing that surrounds each of the six marine reserves is within the mean dispersal range of both species (dashed vertical lines).

90
Figure 5 Local recruitment contribution from the reserve network. Observed (dark green) and estimated (light green) contribution of six marine reserves to local recruitment of coral trout and stripey snapper in fished and protected areas of the Keppel Islands. Proportions are based on the number of assigned juveniles relative to the total number of juveniles (N) collected in reserves and fished area. The estimated proportion of additional recruitment accounts for both unsampled adults in the three focal reserves and the three unsampled reserves. Pie charts are scaled relative to the size of available coral reef habitat in reserves (28%) and fished areas (72%).
Recruitment contribution of the reserve network
We estimated that the six reserves in the Keppel Islands, which represent ~28% of
the reef habitat in the Keppel Islands, supplied ~50% of the total recruitment in
the region. This estimate accounted for both the expected contribution of
unsampled adults in the three focal reserves and the additional reef area within
the three other unsampled reserves. We assigned 11.8% (58 of 493) of juvenile
coral trout and 15.6% (74 of 474) of juvenile stripey snapper to known parents in
the focal reserves. However, given that we sampled ~26.9% of adult coral trout

91
and ~35.7% of adult stripey snapper within the focal reserves, a significant
number of the unassigned juveniles would have been the progeny of unsampled
adults within those reserves. Taking these additional adult fish into consideration,
we estimate that the three focal reserves accounted for ~25% of juvenile coral
trout and ~27% of juvenile stripey snapper in our samples. Furthermore, if we
also consider that the three focal reserves represented ~51.3% of total coral reef
habitat within all six reserves, and assume that the three unsampled reserves
made the same proportional contribution to recruitment per unit area as the
sampled reserves, then the six reserves would have accounted for ~49% of coral
trout and ~52% of stripey snapper recruitment in the region (see eq. 1 & 2).
The contribution of reserves to total regional recruitment for the two species
was further subdivided to estimate the relative contribution to both fished areas
and reserves (Figure 4). Applying the same calculations as above, our findings
indicate that adults in reserves were making a large contribution to the
replenishment of populations on both reserve and fished reefs in the Keppel
Islands. Of the 353 juvenile coral trout and 303 juvenile stripey snapper that were
collected from reefs that are open to fishing, we estimate that the six reserves
accounted for ~57% of coral trout and ~46% of stripey snapper recruitment
(Figure 4). Similarly, we estimate that within reserves, 29% of coral trout
recruitment and 62% of stripey snapper recruitment was supplied through self-‐
recruitment to natal reserves or through larval exchange between reserves (Figure
4). The remaining juveniles are likely to be the progeny of unsampled adults within
fished areas of the Keppel Island group or immigrants from distant reefs outside
the island group.
DISCUSSION
Our study confirms that effective reserve networks can provide a significant
source of recruitment to populations in both fished and protected areas on a
regional scale. Not only were adults in reserves exporting a high proportion of
their offspring to adjacent fished areas, there was also significant larval retention
within natal reserves and connectivity among neighbouring reserves.

92
Furthermore, the proportion of observed dispersal trajectories less than 30km is
consistent with recent studies demonstrating that coral reef fish larvae may
disperse relatively short distances despite spending several weeks in the pelagic
environment (Jones et al. 2009).
The estimate that reserves contribute about half of the total recruitment in
the Keppel Islands is clearly important, given that only 28% of reef area in the
region is protected. This represents a ~1.8 fold increase in recruitment over that
expected based simply on the area of reef within reserves. The significant role of
reserves as sources of juvenile recruits in both fished areas and in reserves is likely
due to the approximately two-‐fold greater adult biomass inside reserves (Figure
2), the larger average adult size inside reserves, and as a consequence, greater per
capita and per unit area fecundity relative to adjacent fished populations (Evans et
al. 2008).
Theoretical considerations highlight the importance of both self-‐recruitment
and connectivity in ensuring metapopulation persistence in reserve networks
(Botsford et al. 2003; Hastings and Botsford 2006; Steneck et al. 2009; Almany et
al. 2009). It is therefore encouraging that our study documented both self-‐
recruitment to natal reefs and connectivity among reserves. Although the observed
magnitude of the reserve contribution to recruitment in fished areas is consistent
with modelling scenarios (Pelc et al. 2010), the magnitude of larval supply from
reserves may not be sufficient to offset a substantial increase in fishing pressure
outside reserves (Hilborn et al. 2004). We recommend that reserves continue to be
coupled with traditional harvest restrictions including fish size and catch limits,
and seasonal spawning closures (McCook et al. 2010) to ensure that current yields
for these fishes are sustainable.
While the proportion of coral reef habitat in our GBR study area designated
as no-‐take reserve is comparatively high in global terms (Mora et al. 2006; Wood et
al. 2008; McCook et al. 2010), it is important to note that our results clearly
demonstrate that reserves can provide significant fishery and conservation
benefits on a scale as small as 10 km. In many places where people rely heavily on
coral reefs for their livelihoods, this scale is typical of reef tenure areas and the
only scale at which marine reserves can realistically be applied (McCook et al.
2009). The fact that stakeholder communities can directly benefit from a source of

93
recruitment from their local reserves is the strongest support yet that reserve
networks can be an effective tool for sustaining future generations of both fish and
fishers.

94

95
CHAPTER 5 – CONSISTENT SPATIAL, TEMPORAL AND ONTOGENETIC
PATTERNS IN THE RECRUITMENT OF JUVENILE FISHES SOURCED FROM
MARINE RESERVES
ABSTRACT
With time, no-‐take marine reserves typically result in greater densities and larger
sizes of targeted fishery species within their boundaries. Consequently, they
generate a significant source of juvenile recruitment to adjacent fished areas and
other reserves. The benefits of networks of marine reserves are greatest if the
supply of juveniles is consistent with the growth of populations in reserves.
However, little is known of the spatial and temporal patterns of larval supply from
reserves, or the relationship between adult body size and reproductive success of
any fish species. Here, I investigate spatial and temporal recruitment dynamics of
coral trout (Plectropomus maculatus) and stripey snapper (Lutjanus carponotatus)
throughout the Keppel Island group, a 1,000 km2 archipelago of the Great Barrier
Reef, Australia. During the 15-‐month study period, three juvenile cohorts of both
species recruited to the island group of which a large proportion were known to
have originated from local no-‐take marine reserves. I show that cohorts were
genetically homogeneous, spatially consistent and largely locally sourced
throughout the duration of the study. Although adult fish of all mature size classes
contributed to local recruitment, I show for the first time that larger individuals
were responsible for a greater proportion of local recruitment. Based on the
relative abundance and size distributions of reproductively mature fish in reserves
and fished areas, I conclude that reserves made a two-‐fold greater contribution to
recruitment. These findings emphasise the value of combining current fisheries
management measures with networks of no-‐take marine reserves to sustain
juvenile recruitment.
96
INTRODUCTION
It is now widely appreciated that for many large, exploited fishes, establishing no-‐
take marine reserves can lead to higher densities and larger size of fish in
protected areas (Halpern et al. 2003; Russ et al. 2008; Lester et al. 2009; Babcock
et al. 2010). As a major source of juvenile fish (Chapter 4), reserves play an
important role in the long–term conservation of fish populations within reserves
and in sustaining fish stocks in areas open to fishing (Pauly et al. 2002; Gell and
Roberts 2003; Lubchenco et al. 2003; Gaines et al. 2010). Networks of marine
reserve continue to be designed and implemented on the basis that juveniles
sourced from reserves can be retained in natal reserves (Almany et al. 2007;
Chapter 4), exported to fished areas (Christie et al. 2010a; Chapter 4) and
exchanged between reserves (Planes et al. 2009; Chapter 4). However, the
effectiveness of reserves as sources of recruitment assumes that they are located
at important source sites, and the supply of juveniles is consistent with the growth
of populations in reserves. Some empirical evidence is accumulating that patterns
of larval retention and connectivity in small reef fishes may be persistent over time
(Berumen et al. 2012; Saenz-‐Agudelo et al. 2012). However, virtually nothing is
known of the relationship between the demographic distribution of source
populations and the spatial or temporal patterns of larval supply.
Coral reef fish populations are distributed over a patchy seascape, and it is
now recognised that populations on individual reefs are maintained by both self-‐
recruitment and larval connectivity between reefs (Almany et al. 2009; Jones et al.
2009). Optimizing spatial management systems for both conservation and fishery
management objectives require that reserves are placed at important source sites
(Jones et al 2007; 2009) and that the recruitment contribution of reserves persists
over time (Steneck and Wilson 2010). Juvenile recruitment is a major driver of reef
fish dynamics (Doherty and Williams 1988; Doherty 2002), though the successful
dispersal and recruitment (settlement to the reef) of pelagic larvae are reliant on
the reproductive success of adult fishes (Robertson 1988; Meekan et al. 1993;
Marshall and Morgan 2011). However, relatively little is known of spatial origin of
larval cohorts that regulate population dynamics in coral reef fish populations.
Recruitment in reef fishes is inherently variable (Fogarty et al. 1991; Caley et al.

97
1996; Doherty 2002; Armsworth 2002), and therefore the source and identity of
adults contributing to recruitment may also be highly variable (Hedgecock 1994;
Hedgecock and Pudovkin 2011).
Few studies have investigated parental and genetic variation in the
composition of successive juvenile cohorts in coral reef fishes. Recruitment that is
driven by only a few successfully breeding individuals would result in high
variance in reproductive success, otherwise known as ‘sweepstakes reproductive
success’ (Hedgecock 1994; Hedgecock and Pudovkin 2011). In theory, large
variance in reproductive success would lead to temporal genetic differentiation
between cohorts of recruits and the breeding population. A number of studies have
documented lower allelic diversity between recruits and adults (Hegdecock 1994;
Flowers et al. 2002), reduced effective breeding population sizes (Hedgecock
1994; Turner et 2002; Hedgecock et al 2007; Lee and Boulding 2007; Liu and Ely
2009), higher relatedness within cohorts (Planes and Lenfant 2002), or high
variance between cohorts of newly settle recruits (Hedgecock 1994; Flowers et al.
2002; Christie et al. 2010b). However, few studies have examined the contribution
of known adults in marine reserves to multiple cohorts of juveniles recruiting to
the population.
Since fecundity in reef fishes increases with body length, it is generally
assumed that larger fish make a disproportionate contribution to juvenile
recruitment (Jennings 2001; Sadovy 2001). Because marine reserves allow fishes
to reach larger sizes (Halpern et al. 2003; Russ et al. 2008; Lester et al. 2009;
Babcock et al. 2010), they may provide benefits above and beyond the simple
increases in fish density. However, whether larger adults in marine reserves
account for a great proportion of total recruitment than smaller adults remains
unknown. Furthermore size selective targeting of larger fishes may have a
disproportionate impact on juvenile recruitment (Sadovy 2001; Anderson et al.
2008; Fenberg and Roy 2008). Fisheries management strategies often include a
minimum legal length limit that is usually set above the size at maturity. The
objective is to ensure that a proportion of the spawning stock biomass is protected
from fishery mortality, and assumes that adults below the legal catch size limit also
contribute to recruitment. However, the relative contribution to recruitment of
adults from above and below the size limit has never been established.

98
The Coral Reef Fin Fish Fishery (CRFFF) on the Great Barrier Reef (GBR)
arguably employs one of the world’s most comprehensive fisheries management
strategies. It includes limits on the number of commercial licenses, fishing capacity
(boat size, number of dories and number of fishers), individual catch quotas for
commercial fishers, minimum size limits, possession limits for recreational fishers,
and seasonal spawning closures (focused on coral trout). In addition, the GBR
Marine Park is managed using multiple-‐use zoning plan that includes a network of
no-‐take areas covering approximately 33% of the coral reef area. All extractive
activities (primarily fishing) are thus restricted to 67% of all available reef habitat
in the Marine Park. The no-‐take reserves are the only means to protect the full
demographic length and age distribution of adult fishes and this may have an
important influence on shaping local demographic processes of coral reef fishes.
The paucity of dispersal and connectivity information has hindered efforts to
effectively design networks of no-‐take reserves, and subsequently, to evaluate the
effectiveness of reserves in meeting conservation objectives. Recent applications of
genetic parentage analysis have shown that it is possible to match newly recruited
juvenile individuals to their parents, and thus the relationship between adult body
length (and/or age) and the successful supply of juveniles to populations can now
be addressed. Here, I examine the spatial and temporal patterns of recruitment
and their relationship with adult body size for the bar-‐cheek coral trout
(Plectropomus maculatus) and the stripey snapper (Lutjanus carponotatus), two
important fisheries species in the Indo-‐Pacific region. Focusing on three marine
reserves as a source of recruits for each of the species, I examine the following
questions: (i) Are the observed spatial and temporal patterns of recruitment
derived from adults in reserves persistent over time? (ii) Does the genetic
composition of multiple cohorts indicate consistent patterns of larval supply? (iii)
Do larger adult fishes account for a greater proportion of local recruitment
(settlement) than smaller adult fish? (iv) Do fish below the legal length limit
contribute to local recruitment? (v) How important are the more abundant and
larger fish in reserves to local recruitment? These questions were addressed by
applying genetic parentage to relate juveniles collected throughout the Keppel
Island group, a 1,000 km2 archipelago of the Great Barrier Reef, Australia.

99
MATERIALS AND METHODS
Spatial and temporal patterns in local recruitment
This study was carried out in the Keppel Island group (23°10´ S, 150°57´ E) in the
Great Barrier Reef Marine Park, Australia. Sampling of adult coral trout
(Plectropomus maculatus) and stripey snapper (Lutjanus carponotatus) focused on
four reefs within three no-‐take marine reserves in the Keppel Island group. A total
of 439 mature adult coral trout and 1145 stripey snapper of known length were
captured between November 2007 and February 2008. Sampling effort was
broadly representative of the abundance of adult fish at each location. The
majority of fish were obtained by hook and line fishing (using barbless hooks),
though a subset of 86 coral trout from Clam bay were obtained with the use of
tissue biopsy probes (Evans 2008). Each captured fish was measured to the
nearest millimeter and a small section of the dorsal or anal fin was removed prior
to the fish being released alive. The total length (TL) of individuals sampled with
biopsy probes underwater was estimated to the nearest centimetre by trained
observers. Tissue samples were preserved in 85% ethanol for subsequent genetic
analyses.
Following the sampling of adult fishes, 491 juvenile coral trout and 465
juvenile stripey snapper were collected from 19 locations throughout the island
group. As with the adults, the sampling effort and the resulting number of samples
was broadly representative of the abundance of juvenile fish at each location. The
total length (TL) and fork length (FL) of each juvenile fish was measured to the
nearest millimeter. Juvenile tissue samples were stored in 85% ethanol for genetic
analyses. Sagittal otoliths (ear bones) were removed for ageing analysis and to
determine the approximate spawn date of each juvenile fish. The age distributions
indicated three distinct juvenile cohorts in the samples.

100
Genetic composition and source of successive juvenile cohorts
All adult and juvenile coral trout and stripey snapper were genotyped with a panel
of 11 and 13 microsatellite markers, respectively, as described in Chapter 3. In
each juvenile cohort, observed genotypes were tested for departures from Hardy-‐
Weinberg equilibrium due to heterozygote deficiency at each locus as
implemented in FSTAT v. 2.9.3.2 (Goudet 1995). Significance of multiple P-‐values (α
= 0.05) was assessed with strict Bonferroni correction applied for multiple
comparisons (P < 0.005; Rice 1989). The number of alleles, Nei’s unbiased
expected and observed heterozygosity (Nei 1987), and Weir & Cockerham’s (Weir
and Cockerham 1984) estimator of the inbreeding coefficient FIS were calculated in
FSTAT for each locus in each cohort. The occurrence of null alleles and large allele
drop-‐outs were assessed at each locus using MICROCHECKER v.2.2.3 (van Oosterhout
2004). Analyses of molecular variance between cohorts were performed in
ARLEQUIN v3.11 (Excoffier et al. 2005). The program GENECLASS 2 (Piry et al. 2004)
was used to estimate the likelihood that juveniles originated from a population
other than the local populations in the Keppel island group. I used the Bayesian
assignment method of Rannala and Mountain (1997) and 10,000 simulations with
the Monte Carlo re-‐sampling method of Paetkau et al. (2004) and calculated the
mean probability of assignment across 5 runs, using a threshold of 0.05 below
which individuals were considered as likely immigrants.
For both coral trout and stripey snapper, parent-‐offspring relationships were
identified in each cohort against the total pool of sampled adults to determine the
recruitment contribution of reserves to successive cohorts. Parentage was
assessed based on a maximum likelihood approach implemented in the software
FaMoz (Gerber et al. 2003) as described in Chapter 4. The time of spawning for
each assigned juvenile was then compared to the total pool of juveniles for each
species.
Relative recruitment contribution of different size classes of adult fish
The contribution of adult fish to local recruitment was estimated based on the
number of juvenile assignments to different size classes. The size frequency
distributions of sampled and assigned adults in each population were compared
using two-‐way Kolmogorov-‐Smirnov tests performed in R v 2.15.0 (R Development

101
Core Team) to determine the relative recruitment contribution of individual size
classes. The size of first reproduction, where 50% of individuals reach maturity, is
~31.5 cm TL for coral trout, P. maculatus (Ferreira 1993), and ~20, cm TL for
stripey snapper, L. carponotatus (Kritzer 2004). In Queensland, the minimum legal
catch size for coral trout is 38 cm (TL) and for stripey snapper it is 25 cm (TL).
Relative recruitment contribution from no-‐take reserves and fished areas
To estimate the relative contribution of each size class to the overall juvenile
recruitment (RRec) in the Keppel island group, I first measured the reproductive
success of adult fish as the number of adults to which offspring were assigned to
(NA) relative to the number of adults sampled (NS) in each size class. Based on the
underwater visual census of fish population at 22 sites in fished and protected
populations in the Keppel Island (see Chapter 4 for details), I then estimated the
proportion of adult fish of each size class in fished and protected populations
(NObs/NTotal). Assuming that the per capita recruitment contribution was the same
in both fished areas and reserves, we then calculated the relative recruitment
contribution from each size class of adults in fished areas and reserves.
𝑹𝑹𝒆𝒄 =𝑵𝑨
𝑵𝑺×𝑵𝑶𝒃𝒔
𝑵𝑻𝒐𝒕𝒂𝒍
Where:
NA = Number of assigned adults in individual size classes
NS = Number of sampled adults in individual size classes
NObs = Number of observed adults in individual size classes in either fished
of protected areas
NTotal = Total number of observed adults in both fished and protected areas

102
RESULTS
Spatial and temporal patterns in local recruitment
Juvenile coral trout and stripey snapper were collected throughout the island
group from all locations with suitable recruitment habitat. For each species,
samples were unevenly distributed with the majority of juveniles collected from
three key recruitment locations (‘hotspots’). Collectively, Clam Bay, Halfway Island
and North Keppel Island represented 79% of sampled juvenile coral trout (Table
1) and 69% of sampled juvenile stripey snapper (Table 2). Other important areas
of juvenile recruitment included Middle Island and Humpy Island, which together,
represented 15% of sampled juvenile coral trout (Table 1) and 17% of sampled
juvenile stripey snapper (Table 2). The remainder of each sample was distributed
across 8 and 10 locations, respectively.
Figure 1 The Keppel Islands include six no-‐take marine reserves protecting 28% of coral reefs. Adult P. maculatus and L. carponotatus were sampled in three focal reserves represented by green boxes and juvenile fish of each species were collected in 19 locations throughout the island group. The size of pie charts is relative to the number of juveniles collected for each cohort and recruitment hotspots are represented in dark circles. Grey areas represent coral reefs and green dashed lines represent other reserves in the island group.
2 km
N
P. maculatus (N = 491)L. carponotatus (N = 465)
Cohort-1Cohort-2Cohort-3
10080604020
Clam Bay
Miall Is
Corroboree Is
Halfway Is
Humpy Is
Monkey Bay
Wreck Bay
Big Peninsula
Barren IsBald Rock
Outer Rock
Wedge Is
Pelican Is
Middle Is
North Keppel Is
Divided Is
Egg Rock

103
Based on the estimated time of spawning of each juvenile fish, three distinct
recruitment cohorts were identified within the juvenile sample for both species. All
major recruitment hotspots persisted throughout successive cohorts, thus spatial
patterns of recruitment in the Keppel Islands were unevenly distributed between
locations but temporally consistent within locations. The time and duration of
spawning events varied between species. For coral trout, each cohort was
generated over the course of 3 to 5 months with a peak in December 2007,
May/June 2008 and September/October 2008 (Figure 2A). The average fork length
of the 491 sampled juvenile coral trout was 153.2 mm ± 3.1 SE, which
corresponded to an age of 183 days ± 4 SE. For stripey snapper, each cohort was
generated over the course of 56 to 10 months with a peak in August/September
2007, February through to April 2008 and November 2008 (Figure 2B). The
average fork length of the 465 sampled juvenile stripey snapper was 119.4 mm ±
2.4 SE, which corresponded to an age of 208 days ± 5 SE.
Table 1 Proportion of the total number of juvenile P. maculatus (N = 58) assigned to adults in four protected populations in the Keppel Island group.
Middle Is (N = 115)
Halfway Is (N = 105)
Clam Bay (N = 153)
Egg Rock (N = 66) Total
Cohort 1 6.9 6.9 15.5 5.2 34.5
Cohort 2 12.1 3.4 8.6 15.5 39.6
Cohort 3 6.9 5.2 10.3 3.4 25.9
Total 25.9 15.5 34.5 24.1 Table 2 Proportion of the total number of juvenile L. carponotatus (N = 74) assigned to adults in four protected populations in the Keppel Island group.
Middle Is (N = 430)
Halfway Is (N = 374)
Clam Bay (N = 165)
Egg Rock (N = 66) Total
Cohort 1 16.2 14.9 6.8 1.4 39.2
Cohort 2 13.5 16.2 8.1 5.4 43.2
Cohort 3 10.8 4.1 1.4 1.4 17.6
Total 40.5 35.2 16.2 8.1

104
Using parentage analysis, 58 juvenile coral trout were assigned to 56 adults,
and 74 juvenile stripey snapper were assigned to 77 adults resident in the three
focal reserves. In each cohort, the number of assignments was proportional to the
number of sampled juveniles. Overall, the parent, or parents of 11.3% ± 0.9% SE of
juvenile coral trout (Figure 2C) and 15.0% ± 1.7% SE of juvenile stripey snappers
(Figure 2D) were identified across all three cohorts. Across the three sampled
cohorts, the greatest proportion (34.5%) of assigned juvenile coral trout were
identified as the progeny of adults in the Clam Bay reserve. Similarly, adults at
Middle Island accounted for 40.5% of assigned juvenile stripey snapper. However,
relative to the number of adults sampled at each location, adult coral trout from
Egg Rock generated nearly twice as many juvenile assignments than other
locations. Across the three sampled cohorts, 21.2% of adults sampled at Egg Rock
were identified as parents of assigned juvenile coral trout, compared to 11.6% ±
1.5% SE averaged across all other locations. In contrast, the relative recruitment
contribution of adult stripey snapper was similar across all source populations
with 6.8% ± 0.3% SE of sampled adults assigned as parents of juvenile fish.
Genetic composition and source of successive cohorts
The genetic composition of successive coral trout and stripey snapper recruitment
cohorts suggests that the majority of juvenile fish were locally sourced with
minimal immigration to the Keppel islands. Across all P. maculatus cohorts, the
mean number of alleles and allelic richness per locus was 21.2 ± 0.5 SE and 20.4 ±
0.5, respectively, with average observed heterozygosity of 0.745 ± 0.004 SE and
expected heterozygosity of 0.745 ± 0.004 SE (Table 3). Across all L. carponotatus
cohorts, the mean number of alleles and allelic richness per locus was 15.7 ± 0.6 SE
and 14.6 ± 0.1 SE, respectively, with average observed heterozygosity of 0.745 ±
0.003 SE and expected heterozygosity of 0.756 ± 0.006 SE (Table 4). No departure
from Hardy-‐Weinberg expectations was detected after correcting for multiple
comparisons in any of the cohorts or when samples were pooled for each species.
Differences in genetic diversity between recruitment cohorts were low (FST <
0.001) and largely insignificant (p > 0.1). Only coral trout cohorts 2 and 3 were
significantly different from one another (FST = 0.001, p = 0.029), though these
differences were not confirmed by an analysis of molecular variance (FST < 0.0001,

105
p = 0.417). Furthermore, assignment tests identified 31 juvenile coral trout and 4
juvenile stripey snapper as unlikely to have originated from populations in the
Keppel Island group, representing a likely immigration rate of 6.4% ± 0.9% per
cohort for coral trout and 0.8% ± 0.2% per cohort for stripey snapper. The low
genetic diversity between cohorts and low immigration rates indicate that the
large majority of juvenile coral trout and stripey snapper in the Keppel islands
were likely to be the progeny of local adult populations.
Figure 2 Time of spawn of sampled juvenile fish between May 2007 and February 2009. A total of 493 juvenile P. maculatus (A) and 465 juvenile L. carponotatus (B) were collected during two collection events in March 2008 and February 2009 (indicated by arrows). Time of spawning was inferred from daily ring counts of juvenile otoliths suggesting that three cohorts of each species settled during the study period. Parentage assignments identified 58 P. maculatus (C) and 74 L. carponotatus (D) as the progeny of adult fish collected in three focal reserves in the Keppel Islands. Time of spawning was inferred from daily ring counts of juvenile otoliths suggesting that three cohorts of each species settled during the study period.
M J A MMFJDNOSAJ J DNOSAJ
0
10
20
30
40
50
60
01
3
5
0
5
10
15
20
01
3
5
FJ M J A MMFJDNOSAJ J DNOSAJ FJ
No.
sam
pled
juve
nile
sN
o. a
ssig
ned
juve
nile
s
A B
DC
Cohort 1 Cohort 2 Cohort 3 Cohort 1 Cohort 2 Cohort 3

�j’5�
���
� � � t� � . � L� UF� FM� MTFMT� � GLO� MNO � FU� � FFTV � IUV RTP � � -‐� e � � mh� iml � � LNLOMFf� � UA � O� LG� � PP P F� è� é2� L� F OV � N M OLehELFTMh� è oé2� KY � M �N M OLehELFTMh� è � é2� � R � MN � TR� O GTRE� � L GGT� T RM� è� � lé� WTMN� � FFL� T� M � YDV� PU F� è� é� W O � � � P� UP� M � GLO� � � N� PL� UF� TR� � � � � � f�
� � � � � � � � � � � � � � � � � � � � � � � � � � � � � � � � � � � � � � � � � � � � �
� � � � � � � � � � � � � � � � � � � � � � � � �� � � � � � � � � � � � � � � � � � � � � � � � � � � � � � � � � � � � � � � � � � � � � � � � � �� � � � � � � � � � � � � � � � � � � � � � � � � � � � � � � � � � � � � � � � � � � � � �� � � � � � � � � � � � � � � � � � � � � � � � � � � � � � � � � � � � � � � � � � � � � � � � � � � � � � � � � � � � � � � � � � � � � � � � � � � � � � � � � � � � � � � � �� � � � � � � � � � � � � � � � � � � � � � � � � � � � � � � � � � � � � � � � � � � � � � � � � � � � �� � � � � � � � � � � � � � � � � � � � � � � � � � � � � � � � � � � � � � � � � � � � � � � � �� � � � � � � � � � � � � � � � � � � � � � � � � � � � � � � � � � � � � � � � � � � � � � � � � � � �� � � � � � � � � � � � � � � � � � � � � � � � � � � � � � � � � � � � � � � � � � � � � � � � � � � � � �� � � � � � � � � � � � � � � � � � � � � � � � � � � � � � � � � � � � � � � � � � � � � � � � � � � � � � � � � � � � � � � � � � � � � � � � � � � � � � � � � � � � � � � � � � � � � � � � � � � � � � � � �� � � � � � � � � � � � � � � � � � � � � � � � � � � � � � � � � � � � � � � � � � � �

�j’6�
���
� � � t� � 7� L� UF� FM� MTFMT� � GLO� MNO � FU� � FFTV � IUV RTP � � -‐� � � avo oi � iml � � LNLOMFf� � UA � O� LG� � PP P F� è� é2� L� F OV � N M OLehELFTMh� è oé2� KY � M � N M OLehELFTMh� è � é2� � R � MN � TR� O GTRE� � L GGT� T RM� è� � lé� WTMN� � FFL� T� M � YDV� PU F� è� é� W O � � � P� UP� M � GLO� � � N� PL� UF� TR� � � � � � f�
� � � � � � � � � � � � � � � � � � � � � � � � � � � � � � � � � � � � � � � � � � � � � � � �
� � � � � � � � � � � � � � � � � � � � � � � � � �� � � � � � � � � � � � � � � � � � � � � � � � � � � � � � � � � � � � � � � � � � � � � � � � � � � � � � � � � � � � � � �� � � � � � � � � � � � � � � � � � � � � � � � � � � � � � � � � � � � � � � � � � � � � � � � � � � � � � � � � � �� � � � � � � � � � � � � � � � � � � � � � � � � � � � � � � � � � � � � � � � � � � � � � � � � � � � � � � � �� � � � � � � � � � � � � � � � � � � � � � � � � � � � � � � � � � � � � � � � � � � � � � � � � � � � � � �� � � � � � � � � � � � � � � � � � � � � � � � � � � � � � � � � � � � � � � � � � � � � � � � � � � � � � � � � � � � � �� � �� � � � � � � � � � � � � � � � � � � � � � � � � � � � � � � � � � � � � � � � � � � � � � � � � � � � � � � � � �� � � � � � � � � � � � � � � � � � � � � � � � � � � � � � � � � � � � � � � � � � � � � � � � � � � � � � �� � � � � � � � � � � � � � � � � � � � � � � � � � � � � � � � � � � � � � � � � � � � � � � � � � � � � � � � � � � � �� � � � � � � � � � � � � � � � � � � � � � � � � � � � � � � � � � � � � � � � � � � � � � � � � � � � � � � � � � � � � � �� � � � � � � � � � � � � � � � � � � � � � � � � � � � � � � � � � � � � � � � � � � � � � � � � � � � � � � � � � � � � � � � �� � � � � � � � � � � � � � � � � � � � � � � � � � � � � � � � � � � � � � � � � � � � � � � � � � � � � � � � � �� � � � � � � � � � � � � � � � � � � � � � � � � � � � � � � � � � � � � � � � � � � � � � � � � � � � � � � � � � �� � � � � � � � � � � � � � � � � � � � � � � � � � � � � � � � � � � � � � � � � � � � � � � � � � � � � � � � � � � � � � � � �

108
Table 5 Number of juvenile P. maculatus in three successive recruitment cohorts in the Keppel Islands.
Location Cohort Grand
Total 1 2 3 Bald Rock
1
1
Clam Bay 31 53 14 98 Corroboree Is
9 9
Divided Is 1
1 Halfway Is 64 41 54 159 Humpy Is 22 8
30
Miall Is 5 1
6 Middle Is 17 8 17 42 Monkey Bay
1 1 2
North Keppel Is 47 47 37 131 Outer Rocks
2 1 3
Wedge Is 2
2 Wreck Bay 1 3 3 7
Grand Total 190 165 136 491
Table 6 Number of juvenile L. carponotatus in three successive recruitment cohorts in the Keppel Islands.
Location Cohort Grand
Total 1 2 3 Bald Rock
5
5
Barren Is 2
2 Big Penninsula 1 1
2
Clam Bay 31 67 18 116 Corroboree Is
4 4
Divided Is 3 1
4 Halfway Is 34 45 28 107 Humpy Is 13 13 2 28 Miall Is 16 4
20
Middle Is 19 22 12 53 Monkey Bay 1 3 1 5 North Keppel Is 24 33 40 97 Outer Rocks
2
2
Pelican Is 2 1
3 Wedge Is 5 3
8
Wreck Bay 2 4 3 9
Grand Total 153 204 108 465

109
Relative recruitment contribution of different size classes
Comparing the size frequency distributions of all sampled adults with adults that
were assigned offspring revealed that larger individuals clearly generated a
greater proportion of recruitment in the Keppel Islands. Overall, a third of all
assigned juveniles were produced from the top quarter of the demographic size
distribution suggesting that, where present, larger individuals tended to have
greater reproductive success. For coral trout, 35.7% of assigned juvenile fish were
the progeny of adults that were larger than 53 cm TL, which represented 27.6% of
the total adult population sampled within reserves (Figure 3A). Comparatively, for
stripey snapper, 36.4% of assigned juveniles were the progeny of adults larger
than 35 cm TL, which represented 25.9% of the total adult population sampled in
reserves (Figure 3B). Furthermore, 87.9% ± 8.3% SE of juvenile coral trout were
assigned to adults larger than 38 cm TL, and 99.2% ± 0.8% SE of juvenile stripey
snapper were assigned to adults larger than 25 cm TL, the respective legal catch
lengths for these species in Queensland (Figure 3). However, it is notable that all
individuals of reproductive size made some contribution to recruitment.
Figure 3 Overall length frequency distribution of sampled and assigned adults in populations of P. maculatus (A) and L. carponotatus (B) in no-‐take marine reserves of the Keppel Islands. For The number of sampled (NS) and assigned (NA) adults is shown for each location. Dashed lines represent the minimum legal catch length for each species.
B
0
10
20
30
+380
+680
+480
+580
+280
+430
+730
+530
+630
+330
NS = 439
NA = 56
0
10
20
30
40
50
+250
+400
+300
+350
+200
NS = 1070
NA = 56
Adult size class (mm)
Adults assigned as parentsSampled adults
Perc
ent P
. mac
ulat
us
A
Perc
ent L
. car
pono
tatu
s
Adult size class (mm)
110
The length-‐frequency distributions of sampled adults were significantly
different amongst the four reefs in the three focal reserves (Figure 4; 2-‐way
Kolmogorov-‐Smirnov test, p < 0.05). However, in all but one location, length-‐
frequency distributions of assigned adults were not only distributed across all size
classes but were also representative of the distribution of adults sampled (Figure
4; KS: p > 0.1). These results would suggest that the reproductive success of
populations is influenced by the their demographic distribution. At Halfway Island,
the distribution of assigned stripey snapper was significantly different from the
distribution of sampled adults (Figure 4B-‐b; KS: D = 0.25, p = 0.03), clearly
demonstrating that larger fish contributed disproportionately to local recruitment.
This skew in reproductive success may also be observed at Egg rock (Figure 4A-‐d),
where coral trout are much larger, which resulted in the greatest per-‐capita
contribution to local recruitment relative to the number of individuals sampled.
Relative recruitment contribution protected and fished populations
Assuming that adult fish within both fished areas and reserves had equal
probability of contributing to local recruitment, I estimated the relative
recruitment contribution of fished and protected areas in the island group based
on their overall demographic distributions. At the time of sampling, the abundance
of mature coral trout and stripey snapper was 2-‐fold greater in reserves than in
fished areas (Figure 5). Furthermore, the abundance of mature fish in reserves
relative to fished areas increased for larger size classes. Based on the relative
length-‐frequency distribution and the per capita recruitment contribution for each
size class, I estimated that, for coral trout, a ~1.70-‐fold greater overall abundance
of mature fish in reserves translated into an overall ~1.72-‐fold greater recruitment
contribution to local reefs (Figure 5C). Similarly, for stripey snapper a ~1.90-‐fold
greater abundance of mature fish in reserves translated into a ~1.99-‐fold greater
recruitment contribution to local reefs (Figure 5D).

111
Figure 4 Length frequency distribution of sampled and assigned adults in populations of P. maculatus and L. carponotatus in no-‐take marine reserves of the Keppel Islands. Four populations of P. maculatus (A) and L. carponotatus (B) are represented in three reserves of the island group. The number of sampled (NS) and assigned (NA) adults is shown for each location. Dashed lines represent the minimum legal catch length for each species. Locations are (a) Middle island; (b) Halfway island; (c) Clam bay; (d) Egg rock.
B
015304560
015304560
015304560
015304560
015304560
015304560
015304560
015304560
NS = 115NA = 15
a
d
c
b
+380
+680
+480
+580
+280
NS = 105NA = 7
NS = 66NA = 14
NS = 153NA = 20
A
+250
+400
+300
+350
+200
a
d
c
b
NS = 430NA = 30
NS = 374NA = 28
NS = 101NA = 7
NS = 165NA = 12
Prop
ortio
n of
sam
pled
and
ass
igne
d ad
ults
Adult size class (mm)
Adults assigned as parentsSampled adults
*

112
Figure 5 Relative reproductive success of mature size classes in fished and no-‐take areas. The per capita reproductive success was infered from the number of adults assigned as parents, and therefore known to have contributed to local recruitment. Assuming that the relative proportion of mature coral trout (A) and stripey snapper (B) were representative of the populations in fished an no-‐take areas in the Keppel Islands, I measured their relative recruitment contribution from the per capita reproductive success for individual size classes of P. maculatus (C) and L. carponotatus (D).
DISCUSSION
This study provides a unique insight into the spatial, temporal and ontogenetic
patterns of recruitment for two commercially and recreationally important fish
species. Our findings suggest that the supply of juveniles from the focal reserves
was consistent over three successive cohorts of both species, with most recruits
settling at back reef “recruitment hotspots”. Successive cohorts were genetically
homogeneous, suggesting that the adult source population supplying most of the
juvenile recruitment was consistent and likely to be largely local. Furthermore
genetic parentage demonstrated that larger adults in reserves generated the
greatest proportion of local recruitment than smaller adults. Although catch
length limits were effective at protecting a proportion of the reproductively active
individuals in the population, individuals above the minimum catch length
0.00
0.05
0.10
0.15
0.20
0.25
05
101520253035
28.1
- 38
38.1
- 43
43.1
- 53
53.1
- 63
63.1
- 78
Rel
ativ
ve p
ropo
rtion
of m
atur
e in
divi
dual
s
0
2
4
6
8
Fished No-take
Rec
ruitm
ent c
ontri
butio
n in
dex
63.1 - 78 cm53.1 - 63 cm43.1 - 53 cm38.1 - 43 cm28.1 - 38 cm
0.00
0.05
0.10
0.15
05
1015202530
22.5
- 27
.4
27.5
- 32
.4
32.5
- 37
.4
37.5
- 47
.4
Per c
apita
recr
uitm
ent c
ontri
butio
n
Size class (cm)
0
1
2
3
4
Fished No-take
37.5 - 47.4 cm32.5 - 37.4 cm27.5 - 32.4 cm22.5 - 27.4 cm
A
DB
C
FishedNo-take

113
supplied the vast majority of local recruitment. Our results indicate that reserves
in the Keppel islands provide a refuge to spawning stocks, which provide regular
and consistent recruitment to the island group.
Consistent spatial recruitment patterns
This study provides the first empirical assessment of dispersal and recruitment
patterns for two important fisheries species of the GBR at the scale of a single
island archipelago. Overall, observed patterns of larval dispersal were spatially
consistent between species and among successive cohorts. Juvenile recruitment of
both coral trout and stripey snapper was concentrated in the same three
recruitment hotspots: Clam Bay, the western side of Halfway island, and the
southern side of North Keppel island. These are all sheltered locations, with reef
flat habitat and areas that are dominated by small patch reefs amongst rubble and
sand. Other work has identified patchy reef habitats to be the preferred
recruitment habitat for coral trout and stripey snapper (Wen et al. 2013a, 2013b).
While these recruitment hotspots are clearly important for the replenishment of
local populations, smaller numbers of juveniles were found and collected wherever
suitable habitat existed throughout the island group. The spatial distribution of
recruitment and the habitat preferences of juveniles of both species suggest that
sustained replenishment of these populations is limited by both the supply of
juvenile fish and the availability of suitable recruitment habitat.
Spawning activity for coral trout and stripey snapper, as indicated by the
back calculation of juvenile fish ages, was recorded across three periods that each
lasted several weeks. These observations are consistent with spawning periods
from September to December previously described for these species at other
inshore island groups of the central and northern GBR (Ferreira 1993; Kritzer
2004). For most coral reef fish, spawning is triggered by increases in water
temperatures, typically during the warmer austral summer. However, in this study,
spawning activity was also recorded during the austral winter. While the
reproductive stage of sampled female and male individuals was not directly
assessed, the juvenile fish ageing results combined with the parentage analyses
clearly confirms that coral trout and stripey snapper in the Keppel Islands were
generating local recruitment during both summer and winter. Queensland fishery

114
spawning closures that are in effect for 5 days around the new moons in October
and November may therefore be insufficient to protect periodic spawning activity
in the Keppel Islands and additional spawning closures in April, March and June
may be beneficial for long-‐term population persistence and enhance local fisheries.
Temporal trajectories of juvenile recruitment
No genetic differences were identified between juvenile cohorts and the adult
population, suggesting that all cohorts were primarily sourced from local
populations. In addition, local marine reserves were projected to have generated
the majority of juvenile recruitment across successive cohorts (see Chapter 4).
While regular immigration from other inshore and mid-‐shelf reefs is possible, only
a small number of individuals in each cohort were genetically distinguishable from
the local populations and may also be the progeny of resident immigrant adults. It
is clear from these results that local demographic processes and persistent self-‐
recruitment at the scale of the island group are the most important factors
regulating the replenishment of local populations.
The high level of local recruitment and the temporal stability of recruitment
patterns observed during the course of this study indicate that the processes that
drive the replenishment of populations at the scale of the island group are
temporally persistent, at least over the 15-‐month duration of this study. Other
studies have made similar observations for species with distinct reproductive
strategies and at similar scales (Berumen et al. 2012; Saenz-‐Agudelo et al. 2012).
However, at larger spatial scales, these same studies and others (Hogan et al. 2012;
Christie et al. 2010b) also noted strong fluctuations in connectivity patterns. The
scale at which these processes remain stable, and the intensity of fluctuations over
larger distances has important implications for the management and conservation
of coral reef fishes and the design of marine reserve networks. Assessing
connectivity patterns over increasingly large spatial and temporal scales will be
essential to provide a mechanistic understanding of larval connectivity for
fisheries management and conservation planning.
Bigger fish provide greater contribution to local recruitment
Our results demonstrate that the contribution of coral trout and stripey snapper to

115
local recruitment increased with the body size of individuals. However, the
relationship between size and reproductive success for either coral trout or stripey
snapper varied amongst locations, suggesting that differences in the reproductive
strategies may influence local recruitment patterns. Coral trout (P. maculatus)
generally first mature as females and change sex to males later in life (protogynous
hermaphroditism), although initial males are also known to occur (Ferreira 1993).
In contrast, the sex of stripey snapper (L. carponotatus) is genetically
predetermined (gonochorism) and individuals remain male or female throughout
their lives. Male stripey snapper have been shown to grow faster and larger than
females (Newman et al. 2000; Kritzer 2004), thus the patterns observed here may
be partly attributed to a sex-‐biased differential in reproductive success (lottery
polygyny; Nunney 1993). However, we do not know the sex of individual fish or
whether the sex-‐ratio differed between the three focal reserves. Nevertheless,
these are important factors that need to be considered in connectivity research
and in the management of coral reef fisheries.
Of particular interest was the demographic distribution of sampled adults at
Egg Rock, where mature coral trout and stripey snapper were on average much
larger than in other reserves in the island group. While this translated into a
greater recruitment contribution for coral trout, it was not significantly different
from other reserves in the island group for stripey snapper. Since coral trout larger
than 63 cm were likely to have been male (Ferreira 1993), the larger recruitment
contribution of Egg Rock could be associated with a greater reproductive success
of male individuals through some individuals spawning with several females.
Alternatively, the larger mean length and greater abundance of large coral trout
may increase the size of sex change from male to female. As large females are
known to produce exponentially more eggs than smaller females, the overall
reproductive output may increase several times overs. In contrast stripey snapper
at Egg Rock did not make a disproportionately higher contribution to local
recruitment than other reserves in the island group.
Legal catch size limits
Many fisheries impose a minimum legal size limit to allow individuals to reproduce
at least once before they enter the fishery (Berkeley et al. 2004). However,
116
whether or not fish at this early stage of maturation actually contribute to
recruitment has never been demonstrated. Here we show, that at least for coral
trout, smaller individuals are making a sizeable contribution. However, overall,
individuals above the legal size contributed the majority of local recruitment in the
island group. Clearly, it is the populations in reserves, with full size and age
distributions, which were essential in generating a regular supply of juvenile fishes
to the Keppel Island group.
The role of marine reserves in fisheries management
Reproductive productivity is intrinsically linked to adult fish body size at an
individual level, and spawning stock biomass at the scale of populations (Evans et
al. 2008). Results presented here demonstrate that the size-‐distribution of local
populations was an important factor in determining reproductive output from
source populations. Clearly, the larger density and biomass of both coral trout and
stripey snapper in reserves were responsible for generating the majority of local
recruitment over three successive cohorts (see also Chapter 4). However, large
differences in the abundance of smaller size-‐classes with low per capita
reproductive success did not necessarily yield greater recruitment contributions. It
appears that the accumulation of larger and older size classes of target fish in
reserves was largely responsible for the approximately two-‐fold difference in the
recruitment contribution of reserves relative to fished areas. The accumulation of
larger and older size classes of target fish in reserves is clearly an important factor
in generating a regular supply of juvenile fish in both fished and reserve areas of
the island group and an important safeguard against recruitment overfishing in
these populations.
Given the scarcity of information regarding source-‐sink dynamics of coral
reef fish populations, the design and implementation of networks of marine
reserves have been largely based on theoretical predictions of connectivity
(McCook et al. 2010; Pelc et al. 2010). To fulfill both conservation and fishery
objectives, a reserve network should ensure regular recruitment to both protected
and fished areas. While it remains difficult to identify a general pattern of dispersal
in the Keppel Islands, or determine whether reserves have altered source-‐sink
dynamics, it is clear that the greater density and larger size of fish in reserves

117
represent important sources of juvenile fish for the island group. Critically, all
recruitment ‘hotspots’ benefited from a regular supply of juvenile fish from
multiple sources, thus enhancing the resilience of fish populations and fulfilling
key objectives of the reserve network.
CONCLUSION
Understanding the relationship between the reproductive potential of adults, the
dispersal trajectories of larvae, and the formation of cohorts that will subsequently
join the fishable population is central for the effective management of coral reef
fisheries, yet the processes that influence the success of any particular life history
stage on another remain poorly understood. No-‐take marine reserves are currently
the only management strategy that protects the full demographic structure of coral
reef fish populations and should be considered an integral component of fisheries
management strategies to fulfill both fishery and conservation objectives.
Traditional fishery management approaches have not always been successful in
preventing the decline of fish stocks (Pauly et al. 1998; Watling and Norse 1998;
Jackson et al. 2001; Myers and Worm 2003; Beddington et al. 2007), and a more
concerted effort that incorporates ecosystem processes is required (Roberts et al.
2005). Since there appears to be little insurance that distant populations can
effectively replenish local populations in the Keppel Islands, reserves provide a
critical safeguard against local recruitment failure.

118
119
CHAPTER 6 -‐ GENERAL DISCUSSION
In this thesis, I have used genetic parentage analysis to resolve patterns of larval
dispersal for two important fishery species in a network of no-‐take marine
reserves within the Great Barrier Reef Marine Park (GBRMP), Australia. This
required, in the first instance, an assessment of the suitability of different
approaches to parentage analysis in large natural populations of coral reef fish,
where complete sampling of adult populations was not possible. In Chapter 2, I
measured the accuracy of three distinct approaches to parentage analysis where I
found that the number and allelic diversity of microsatellite loci were the most
important factors in identifying true parent-‐offspring pairs. These principles were
applied in Chapter 3 for the development of novel sets of microsatellite loci for
Plectropomus maculatus and Lutjanus carponotatus, two significant fisheries
species of the GBRMP. Chapter 4 describes the first application of parentage
analysis to identify the dispersal trajectory of commercially and recreationally
targeted fish species from a network of no-‐take marine reserves in the Keppel
Island group. The results provide the first conclusive evidence that adequately
protected reserve networks can make a significant contribution to the
replenishment of populations on both protected and fished reefs up to 30km from
reserves. Chapter 5 demonstrates that these reserves were a regular source of
juvenile fish to the island group, where larger fish inside reserves made a
disproportionate contribution to recruitment over three successive cohorts
spanning 15 months. This thesis represents an important case study, which fills a
major knowledge gap that has impeded wider acceptance of marine reserve
networks as an effective strategy for biodiversity conservation and fisheries
management.

120
INDIVIDUAL LEVEL GENETIC ANALYSES FOR CONNECTIVITY RESEARCH
Individual level genetic analyses, such as parentage analysis, have become an
important tool in connectivity research. In Chapter 2, I consider some of the
applications of parentage analysis, review different approaches to identify parent-‐
offspring pairs, and identify key principles to maximise the accuracy of parentage
studies in natural populations. The simulation framework demonstrates the
capacity of parentage analysis to investigate ecological processes with high levels
of accuracy. While incomplete sampling is considered an important limiting factor
in likelihood-‐based parentage analysis, increasing the number and diversity of loci
can reduce the susceptibility of these approaches to negligible levels. Nevertheless,
obtaining large numbers of individuals remains an important challenge in applying
individual level genetics in the marine environment. For most parentage studies,
only ~10-‐15% of juveniles are assigned, suggesting that a large majority of parents
remain unknown. Obtaining larger sample sizes of candidate parents obviously
increases the number of possible assignments, but more importantly it offers a
greater potential of identifying the full spatial scale of dispersal and demographic
connectivity for any given species.
Since the inception of this thesis, methods to isolate microsatellite loci for
non-‐model organisms have become faster and cheaper. Using available
technologies, I characterise a novel suite of microsatellite loci for multiplex PCRs in
P. maculatus and L. carponotatus (Chapter 3). For both focal species, several loci
showed very high levels of polymorphism (> 30 alleles per locus), much higher
than those simulated in Chapter 2. This allowed for fewer loci to be used in the
parentage analyses and a greater number of individuals to be processed without
compromising the accuracy of assignments. However, recent technical advances in
the isolation of molecular markers, notably 454 sequencing, and the high-‐
throughput screening of multi-‐locus genotypes allow for a much greater resolution
of genealogical relationships among individuals. Parent-‐offspring pairs are the
simplest and easiest of these relationships to identify since they share half of their
genetic information and generations are easily distinguished. However, with
greater genetic resolutions, full pedigree relationships within populations are not
unfeasible. Individual level genetic analyses allow us to investigate demographic

121
processes, such as mating behaviour and reproductive success or ‘intraspecific
community structure’ through kin-‐association, that have remained largely
unknown for coral reef fishes. Simulations, as presented in Chapter 2, provide a
simple framework within which to test these applications and identify the
limitations of different genetic analyses.
DEMOGRAPHIC CONNECTIVITY AND THE DESIGN OF MARINE RESERVE NETWORKS
Recent advances in our understanding of the ontogenetic development of marine
larvae indicate that they have the morphological and sensory aptitude to influence
their own dispersal (Kingsford et al. 2002; Leis 2006). Larvae are capable of using
both auditory (Simpson et al. 2005; Montgomery et al. 2006) and olfactory cues
(Atema et al. 2002; Gerlach et al. 2007; Dixson et al. 2008) to identify suitable
recruitment habitat (Lechini et al. 2005). Even after pelagic phases lasting days to
weeks, some larvae are able to settle close to home (Jones et al. 1999; Swearer et
al. 1999; Jones et al. 2005; Almany et al. 2007; Planes et al. 2009; White et al. 2010;
Saenz-‐Agudelo et al. 2011, 2012), while others disperse to more distant reefs
(Planes et al. 2009; Christie et al. 2010a). While these critical milestones have
shaped current paradigms of population dynamics and connectivity of marine
populations, there remains a lack of robust information with which to inform
management strategies and achieve conservation goals (Willis et al. 2003; McCook
et al. 2009).
As the main driver of connectivity in coral reef ecosystems, understanding
the spatial scale of larval dispersal is essential to understanding how populations
are regulated, but also to balance conservation and fishery objectives in the design
of marine reserve networks. Marine reserves continue to be advocated and
implemented to conserve biodiversity, restore degraded habitats, protect
exploited populations, and in some cases, to supplement fisheries. However, the
extent to which larval offspring are exported and the relative contribution of
reserves to recruitment in fished and protected populations are unknown.
Chapter 4 and Chapter 5 address these critical knowledge gaps that have so far
limited our appreciation of the wider benefits of marine reserve networks. Results

122
from Chapter 4 demonstrate that it is possible not only to investigate patterns of
connectivity for large commercially important species, but also to measure the
relative recruitment contribution of discreet populations. This study is the first to
demonstrate an unequivocal link between adult populations of exploited reef
fishes in reserves and juvenile fish within local reserves and fished areas. No-‐take
marine reserves were shown to be providing an important source of local
recruitment within the Keppel Islands, and it was evident that local management
measures were directly benefiting local stakeholders.
It is likely that the disproportionate contribution of reserves to local
recruitment observed in Chapter 4 was largely due to a two-‐fold greater adult
biomass in reserves. In theory, the larger average adult size inside reserves can
dramatically increase the per capita and per unit area fecundity of reserves
relative to adjacent fished areas (Evans et al. 2008). However the relationship
between reproductive potential and the formation of juvenile cohorts that will
subsequently join the fishable population remains unclear. Chapter 5 is the first
study to investigate this relationship and measure the relative reproductive
success of individual adult size classes for large commercially exploited reef fishes.
One of the main assumptions of size-‐selective fisheries that impose a minimum
catch-‐size limit, is that mature adults will reproduce at least once before they reach
the minimum legal length limit. Although it is assumed to occur, the degree to
which sub-‐legal size fishes actually contribute to the replenishment of populations
has not been empirically demonstrated and is generally not a realistic
consideration of fishery management practices. It was encouraging that this study
identified sub-‐legal sized coral trout and stripey snapper that had contributed to
local recruitment, even though a large majority of assigned recruits were identified
as the progeny of fish that were above the legal catch size. In addition, this study
demonstrated that the large majority of recruitment in the Keppel Island group is
generated from local populations, either protected or fished, with limited supply
from populations further afield. This pattern persisted through three successive
cohorts spanning a 15-‐month period. As a major and consistent source of local
recruitment, reserves in the Keppel Islands represent an important safeguard that
may complement current fishery management practices in the region.

123
FUTURE DIRECTIONS IN CONNECTIVITY RESEARCH
Otolith microchemistry, genetics and biophysical modelling have all become
commonly employed tools in connectivity research. While each approach has
received a great deal of attention, the rapid progress and technological innovations
in the field of genetics make it an attractive option for future research. Recent
technical advances in the identification and isolation of molecular markers have
facilitated the development of large marker sets for non-‐model organisms.
Furthermore, improved PCR chemistry and new genotyping technologies now
allow high throughput screening of multi-‐locus genotyping at minimal cost. These
advances not only broaden the scope of species that can be investigated and the
number of samples that can be processed, but also opens the possibility of new
applications and new questions to be explored. Ultimately, the goal of connectivity
research for the next decade will be in providing empirical measures of
connectivity to refine and validate indirect measures of connectivity, such as
biophysical models, and generate a mechanistic understanding of larval dispersal
and connectivity in coral reef fishes.
No study to date has been able to fully explain recruitment patterns and
dynamics in coral reef fishes. There are always a large proportion of juveniles for
which no source populations can be attributed. Characterising the full dispersal
kernel and understanding the mechanisms that favour long distance dispersal over
local retention remain major priorities in the field. These will require expanding
both the spatial and temporal scale of field and laboratory studies to identify the
factors affecting larval quality and dispersal potential. While these are important
questions to address, more pressing questions remain regarding the role of marine
reserves in achieving global conservation and fisheries objectives. While it is clear
from this thesis that marine reserves can provide an important recruitment benefit
to neighbouring fished areas, whether this represents a net increase in local
fisheries output remains to be determined. Identifying whether reserves can offset
displaced fishing effort will require careful consideration of ecological and socio-‐
economic factors, notably catch effort, but also natural fluctuations in population
sizes. Densities of top predators such as coral trout fluctuate in response to other
factors, including habitat degradation (Williamson in prep). Hence, the

124
effectiveness of reserves is contingent on both biological and physical attributes of
the reserve network that remain poorly constrained. Unlocking the full potential of
marine reserves will require a more concerted effort that accounts for all these
factors.
CONCLUDING REMARKS
Coral reefs ecosystems are facing an extensive array of cumulative impacts from
both acute and chronic disturbances that, for the most part, can be attributed to
human influence on the environment (Pandolfi et al. 2003; Hoegh-‐Guldberg et al.
2007; De’ath et al. 2012). While no-‐take marine reserves are unlikely to provide
any protection from acute impacts such as crown of thorn outbreaks, coral
bleaching, storm damage or flood plumes, they can reduce some of the chronic
stressors such as commercial and recreational fishing, and provide refuges that
enhance population recovery. This thesis represents a critical assessment of the
effectiveness of marine reserves in generating larval subsidies to neighbouring
fished areas through larval export. It is the first attempt at correlating the
increased fish biomass in reserves, reproductive output, and recruitment dynamics
for exploited fish species in both space and time. It demonstrates that marine
reserves are not only critical conservation tools, but can also complement existing
fisheries management practices to boost the sustainability of exploited fish
populations.

125

126

127
BIBLIOGRAPHY
Abesamis, R. A., Russ, G. R. (2005). Density-‐dependent spillover from a marine
reserve: long-‐term evidence. Ecological applications, 15, 1798–1812. Allen, G. R. (1985). FAO Species Catalogue Vol. 6. Snappers of the world. An
annotated and illustrated catalogue of Lutjanid species known to date. Fish Synopsis, 125, 208.
Almany, G. R., Berumen, M. L., Thorrold, S. R., Planes, S., Jones, G. P. (2007). Local replenishment of coral reef fish populations in a marine reserve. Science, 316, 742-‐744.
Almany, G. R., Connolly, S. R., Heath, D. D., Hogan, J. D., Jones, G. P., McCook, L. J., Mills, M., Pressey, R. L., Williamson, D. H. (2009). Connectivity, biodiversity conservation and the design of marine reserve networks for coral reefs. Coral Reefs, 28, 339-‐351.
Almudevar, A., Field, C. (1999). Estimation of single-‐generation sibling relationships based on DNA markers. Journal of Agricultural, Biological, and Environmental Statistics, 4, 136–165.
Almudevar, A., Anderson, E. C. (2012). A new version of PRT software for sibling groups reconstruction with comments regarding several issues in the sibling reconstruction problem. Molecular Ecology Resources, 12, 164–178.
Anderson, C. N. K., Hsieh, C.-‐H., Sandin, S. A., Hewitt, R., Hollowed, A., Beddington, J., May, R. M., Sugihara, G. (2008). Why fishing magnifies fluctuations in fish abundance. Nature, 452, 835–839.
Armsworth, P. R. (2002). Recruitment limitation, population regulation, and larval connectivity in reef fish metapopulations. Ecology, 83, 1092–1104.
Araki, H., Cooper, B., Blouin, M. S. (2007). Genetic effects of captive breeding cause a rapid, cumulative fitness decline in the wild. Science, 318, 100-‐103.
Atema, J., Kingsford, M. J., Gerlach, G. (2002). Larval reef fish could use odour for detection, retention and orientation to reefs. Marine Ecology Progress Series, 241, 151–160.
Babcock, R. C., Shears, N. T., Alcala, A. C., Barrett, N. S., Edgar, G. J., Lafferty, K. D., McClanahan, T. R., Russ, G. R. (2010). Decadal trends in marine reserves reveal differential rates of change in direct and indirect effects. Proceeding of the National Academy of Science of the United States of America, 107, 18256-‐18261.

128
Bagley, M. J., Geller, J. B. (1998). Characterization of microsatellite loci in the vermilion snapper Rhomboplites aurorubens (Percoidei: Lutjanidae). Molecular Ecology, 7, 1089-‐1090
Balloux, F. (2001). EASYPOP (Version 1.7): a computer program for population genetics simulations. Journal of Heredity, 92, 301–302.
Beddington, J. R., Agnew, D. J., Clark, C. W. (2007). Current Problems in the Management of Marine Fisheries. Science, 316, 1713–1716.
Beldade, R., Holbrook, S. J., Schmitt, R. J., Planes, S., Malone, D., Bernardi, G. (2012). Larger female fish contribute disproportionately more to self-‐replenishment. Proceedings of the Royal Society B Biological Sciences, 279, 2116-‐2121.
Berkeley, S. A., Hixon, M. A., Larson, R. J., Love, M. S. (2004). Fisheries Sustainability via protection of age structure and spatial distribution of fish populations. Fisheries, 29, 23–32.
Bernardi, G., Beldade, R., Holbrook, S. J., Schmitt, R. J. (2012). Full-‐sibs in cohorts of newly settled coral reef fishes. PLoS ONE, 7, e44953.
Bernatchez, L., Duchesne, P. (2000). Individual-‐based genotype analysis in studies of parentage and population assignment: how many loci, how many alleles? Canadian Journal of Fisheries and Aquatic Sciences, 57, 1–12.
Berumen, M. L., Almany, G. R., Planes, S., Jones, G. P., Saenz-‐Agudelo, P., Thorrold, S. R. (2012). Persistence of self-‐recruitment and patterns of larval connectivity in a marine protected area network. Ecology and Evolution, 2, 444-‐452.
Blouin, M. S. (2003) DNA-‐based methods for pedigree reconstruction and kinship analysis in natural populations. Trends in Ecology and Evolution, 18, 503–511.
Botsford, L.W., Micheli, F., Hastings, A. (2003). Principles for the design of marine reserves. Ecological Applications, 13, S25-‐S31.
Buschiazzo, E., Gemmell, N. J. (2006). The rise, fall and renaissance of microsatellites in eukaryotic genomes. Bioessays, 28, 1040–1050.
Buston, P. M., Bogdanowicz, S. M., Wong, A., Harrison, R. G. (2007). Are clownfish groups composed of close relatives? An analysis of microsatellite DNA variation in Amphiprion percula. Molecular Ecology, 16: 3671–3678.
Buston, P. M., Fauvelot. C., Wong, M. Y., Planes, S. (2009). Genetic relatedness in groups of the humbug damselfish Dascyllus aruanus: small, similar-‐sized individuals may be close kin. Molecular Ecology, 18, 4707–4715.
Caley, M. J., Carr, M. H., Hixon, M. A., Hughes, T. P., Jones, G. P., Menge, B. A. (1996). Recruitment and the local dynamics of open marine populations. Annual Review of Ecology and Systematics, 27, 477–500.
Clobert J., Dnachin E., Dhondt A.A., Nichols J.D. (2001). Dispersal. Oxford University Press, Oxford.
Cornuet, J.-‐M., Piry, S., Luikart, G., Estoup, A., Solignac, M. (1999). New methods employing multilocus genotypes to select or exclude populations as origins of individuals. Genetics, 153, 1989-‐2000.
Cowen, R. K., Lwiza, K. M., Sponaugle, S., Paris, C. B., Olson, D. B. (2000). Connectivity of marine populations: open or closed? Science, 287, 857–859.

129
Cowen, R. K., Paris, C. B., Srinivasan, A. (2006). Scaling of connectivity in marine populations. Science, 311, 522–527.
Christie, M. R. (2010). Parentage in natural populations: novel methods to detect parent-‐offspring pairs in large data sets. Molecular Ecology Resources, 10, 115–128.
Christie, M. R., Tissot, B. N., Albins, M. A., Beets, J. P., Jia, Y., Ortiz, D. M., Thompson, S. E., Hixon, M. A. (2010a). Larval connectivity in an effective network of marine protected areas. PLoS ONE, 5, e15715.
Christie, M. R., Johnson, D. W., Stallings, C. D., Hixon, M. A. (2010b). Self-‐recruitment and sweepstakes reproduction amid extensive gene flow in a coral-‐reef fish. Molecular Ecology, 19, 1042–1057.
Christie, M. R., Marine, M. L., Blouin, M. S. (2011). Who are the missing parents? Grandparentage analysis identifies multiple sources of gene flow into a wild population. Molecular Ecology, 20, 1263-‐1276.
Christie, M. R., Marine, M. L., French, R. A., Blouin, M. S. (2012). Genetic adaptation to captivity can occur in a single generation. Proceedings of the National Academy of Sciences of the United States of America, 109, 238-‐242.
Crawley, M. J. (2007). The R Book. Wiley & Sons Ltd, Chichester. Cruzan, M. B. (1998). Genetic markers in plant evolutionary ecology. Ecology, 79,
400–412. Dakin, E. E., Avise, J. C. (2004). Microsatellite null alleles in parentage analysis.
Heredity, 93, 504–509. DEEDI. Annual status report (2010). Coral Reef Fin Fish Fishery. The State of
Queensland, Department of Employment, Economic Development and Innovation. 21 pp. URL: http://www.dpi.qld.gov.au/documents/Fisheries_SustainableFishing/CRFFF-‐ASR-‐2009.pdf
Danzmann, R. G. (1997). PROBMAX: a computer program for assigning unknown parentage in pedigree analysis from known genotypic pools of parents and progeny. Journal of Heredity, 88, 333.
De'ath, G., Fabricius, K. E., Sweatman, H., Puotinen, M. (2012). The 27-‐year decline of coral cover on the Great Barrier Reef and its causes. Proceedings of the National Academy of Sciences of the United States of America, doi: 10.1073/pnas.1208909109.
Ding, S., Zeng, H., Wang, Y., Pan, Y., Shi, X. (2009). Characterization of eight polymorphic microsatellite loci for the leopard coral grouper (Plectropomus leopardus, Lacepède). Molecular Ecology Resources, 9, 1485-‐1487.
Dixson, D. L., Jones, G. P., Munday, P. L., Planes, S., Pratchett, M. S., Srinivasan, M., Syms, C., Thorrold, S. R. (2008). Coral reef fish smell leaves to find island homes. Proceedings of the Royal Society B Biological Sciences, 275, 2831–2839.
130
Doherty, P. J.,Williams, D. McB.. (1988). The replenishment of coral reef fish populations. Oceanography and Marine Biology: An Annual Review, 26, 487-‐551.
Doherty, P. J. (2002). Variable replenishment and the dynamics of reef fish populations. In Sale P. F. (ed.) Coral reef fishes: dynamics and diversity in a complex ecosystem, 327-‐355 . Academic Press, San Diego, California.
Evans, R. (2008). Assessment of an underwater biopsy probe for collecting teleost fish tissue samples. Marine Ecology Progress Series, 368, 305–308.
Evans, R. D., Russ, G. R., Kritzer, J. P. (2008). Batch fecundity of Lutjanus carponotatus (Lutjanidae) and implications of no-‐take marine reserves. Coral Reefs, 27, 179-‐189.
Excoffier, L., Laval, G., Schneider, S. (2005). Arlequin ver. 3.0: An integrated software package for population genetics data analysis. Evolutionary Bioinformatics Online, 1, 47-‐50.
Fenberg, P., Roy, K. (2008). Ecological and evolutionary consequences of size-‐selective harvesting: how much do we know? Molecular Ecology, 17, 209–220.
Ferreira, B. (1993). Reproduction of the inshore coral trout Plectropomus maculatus (Perciformes: Serranidae) from the central Great Barrier Reef, Australia. Journal of Fish Biology, 42, 831–844.
Flowers, J. M., Schroeter, S. C., Burton, R. S. (2002). The recruitment sweepstakes has many winners: genetic evidence from the sea urchin Strongylocentrotus purpuratus. Evolution, 56, 1445–1453.
Fogarty, M. J., Sissenwine, M. P., Cohen, E. B. (1991). Recruitment variability and the dynamics of exploited marine populations. Trends in Ecology and Evolution, 6, 241–246.
Ford, M. J., Hanson, M. B., Hempelmann, J. A., Ayres, K. L., Emmons, C. K., Schorr, G. S., Baird, R. W., Balcomb, K. C., Wasser, S. K., Parsons, K. M., Balcomb-‐Bartok, K. (2011). Inferred paternity and male reproductive success in a killer whale (Orcinus orca) population. Journal of Heredity, 102, 537–553.
Foster, N. L., Paris, C. B., Kool, J. T., Baums, I. B., Stevens, J. R., Sanchez, J. A., Bastidas, C., Agudelo, C., Bush, P., Day, O., Ferrari, R., Gonzalez, P., Gore, S., Guppy, R., McCartney, M. A., McCoy, C., Mendes, J., Srinivasan, A., Steiner, S., Vermeij, M. J. A., Weil, E., Mumby, P. (2012). Connectivity of Caribbean coral populations: complementary insights from empirical and modelled gene flow. Molecular Ecology, 21, 1143–1157.
Gaines, S. D., White, C., Carr, M. H., Palumbi, S. R. (2010). Designing marine reserve networks for both conservation and fisheries management. Proceedings of the National Academy Science of the United States of America, 107, 18286-‐18293.
Gaither, M. R., Bowen, B. W., Toonen, R. J., Planes, S., Messmer, V., Earle, J., Robertson, D. R. (2010). Genetic consequences of introducing allopatric lineages of bluestriped snapper (Lutjanus kasmira) to Hawaii. Molecular Ecology, 19, 1107–1121.
131
Gaither, M. R., Jones, S. A., Kelley, C., Newman, S. J., Sorenson, L., Bowen, B. W. (2011). High Connectivity in the deepwater snapper Pristipomoides filamentosus (Lutjanidae) across the Indo-‐Pacific with isolation of the Hawaiian archipelago. PLoS ONE, 6, e28913.
Galarza, J. A., Carreras-‐Carbonell, J., Macpherson, E., Pascual, M., Roques, S., Turner, G. F., Rico, C. (2009). The influence of oceanographic fronts and early-‐life-‐history traits on connectivity among littoral fish species. Proceedings of the National Academy of Sciences of the United States of America, 106, 1473–1478.
Garant, D., Kruuk, L. E. B. (2005). How to use molecular marker data to measure evolutionary parameters in wild populations. Molecular Ecology, 14, 1843–1859.
Garcia, C., Arroyo, J. M., Godoy, J. A., Jordano, P. (2005). Mating patterns, pollen dispersal, and the ecological maternal neighbourhood in a Prunus mahaleb L. population. Molecular Ecology, 14, 1821–1830.
Garcia, C., Jordano, P., Godoy, J. A. (2007). Contemporary pollen and seed dispersal in a Prunus mahaleb population: patterns in distance and direction. Molecular Ecology, 16, 1947–1955.
Gardner, M. G., Fitch, A. J., Bertozzi, T., Lowe, A. J. (2011). Rise of the machines: recommendations for ecologists when using next generation sequencing for microsatellite development. Molecular Ecology Resources, 11, 1093–1101.
Gell, F. R., Roberts, C. M. (2003). Benefits beyond boundaries: the fishery effects of marine reserves. Trends in Ecology and Evolution, 18, 448-‐455.
Gerber, S., Mariette, S., Streiff, R., Bodenes, C., Kremer, A. (2000). Comparison of microsatellites and amplified fragment length polymorphism markers for parentage analysis. Molecular Ecology, 9, 1037–1048.
Gerber, S., Chabrier, P., Kremer, A. (2003). FAMOZ: a software for parentage analysis using dominant, codominant and uniparentally inherited markers. Molecular Ecology Notes, 3, 479–481.
Gerlach, G., Atema, J., Kingsford, M. J., Black, K. P., Miller-‐Sims, V. (2007). Smelling home can prevent dispersal of reef fish larvae. Proceedings of the National Academy of Sciences of the United States of America, 104, 858–863.
Glenn, T. C., Schable, N. A. (2005). Isolating microsatellite DNA loci. Methods in Enzymology, 395, 202-‐222.
Gold, J., Pak, E., Richardson, L. (2001). Microsatellite variation Among red snapper (Lutjanus campechanus) from the Gulf of Mexico. Marine Biotechnology, 3, 293–304.
Goodnight, K. F., Queller, D. C. (1999). Computer software for performing likelihood tests of pedigree relationship using genetic markers. Molecular Ecology, 8, 1231–1234.
Goudet, J. (1995). FSTAT (version 1.2): a computer program to calculate F-‐statistics. Journal of Heredity, 86, 485-‐486.

132
Guichoux, E., Lagache, L., Wagner, S., Chaumeil, P., Léger, P., Lepais, O., Lepoittevin, C., Malausa, T., Revardel, E., Salin, F., Petit, R. J. (2011). Current trends in microsatellite genotyping. Molecular Ecology Resources, 11, 591–611.
Guillot, G. (2005). A spatial statistical model for landscape genetics. Genetics, 170, 1261–1280.
Guo, Y., Wang, Z., Liu, C., Liu, L., Liu, Y. (2007). Isolation and characterization of microsatellite DNA loci from Russell's snapper (Lutjanus russellii). Molecular Ecology Notes, 7, 1219-‐1221.
Hadfield, J. D., Richardson, D. S., Burke, T. (2006). Towards unbiased parentage assignment: combining genetic, behavioural and spatial data in a Bayesian framework. Molecular Ecology, 15, 3715–3730.
Hale, M. L., Burg, T. M., Steeves, T. E. (2012). Sampling for microsatellite-‐based population genetic studies: 25 to 30 individuals per population is enough to accurately estimate allele frequencies. PLoS ONE, 7, e45170.
Halpern, B. S. (2003). The impact of marine reserves: Do reserves work and does reserve size matter? Ecological Applications, 13, S117-‐S137.
Halpern, B. S., Walbridge, S., Selkoe, K. A., Kappel, C. V., Micheli, F., D'Agrosa, C., Bruno, J. F., Casey, K.S , Ebert, C., Fox, H. E., Fujita, R., Heinemann, D., Lenihan, H. S., Madin, E. M. P., Perry, M. T., Selig, E. R., Spalding, M., Steneck, R., Watson, R. (2008). A global map of human impact on marine ecosystems. Science, 319, 948-‐952.
Hanski, I. (1999). Metapopulation ecology, Oxford University Press, Oxford. Harrison, X. A., Tregenza, T., Inger, R., Colhoun, K., Dawson, D. A., Gudmundsson, A.,
Hodgson, D. J., Horsburgh, G. J., McElwaine, G., Bearhop, S. (2010). Cultural inheritance drives site fidelity and migratory connectivity in a long-‐distance migrant. Molecular Ecology, 19, 5484–5496.
Hartl, D. L., Clark, A. G. (1989). Principles of population genetics. Sinauer Associates, Sunderland, Massachussets.
Hastings, A., Botsford, L.W. (2006). Persistence of spatial populations depends on returning home. Proceedings of the National Academy Science of the United States of America, 103, 6067-‐6072.
Hedgecock, D. (1994). Does variance in reproductive success limit effective population size of marine organisms? Pp. 122–134 in A. Beaumont, ed. Genetics and evolution of aquatic organisms. Chapman and Hall, London.
Hedgecock, D., Barber, P. H., Edmands, S. (2007). Genetic approaches to measuring connectivity. Oceanography, 20. 22-‐31.
Hedgecock, D., Launey, S., Pudovkin, A. I., Naciri, Y., Lapegue, S., Bonhomme, F. (2007). Small effective number of parents (Nb) inferred for a naturally spawned cohort of juvenile European flat oysters (Ostrea edulis). Marine Biology, 150, 1173–1182.
Hedgecock, D., Pudovkin, A. I. (2011). Sweepstakes Reproductive Success in Highly Fecund Marine Fish and Shellfish: A Review and Commentary. Bulletin of Marine Science, 87, 971–1002.
133
Heemstra, P. C., Randall, J. E. (1993). FAO Species Catalogue Vol. 16. Groupers of the world (family Serranidae, subfamily Epinephelinae). An annotated and illustrated catalogue of the grouper, rockcod, hind, coral grouper and lyretail species known to date. FAO Fish Synopsis, 125, 382.
Hellberg, M. E., Burton, R. S., Neigel, J. E., Palumbi, S. R. (2002). Genetic assessment of connectivity among marine populations. Bulletin of Marine Science, 70, 273-‐290.
Herbinger, C. M., O’Reilly, P. T., Verspoor, E. (2006). Unravelling first-‐generation pedigrees in wild endangered salmon populations using molecular genetic markers. Molecular Ecology, 15, 2261–2275.
van Herwerden, L., Benzie, J., Peplow, L., Davies, C. (2000). Microsatellite markers for coral trout (Plectropomus laevis) and red throat emperor (Lethrinus miniatus) and their utility in other species of reef fish. Molecular Ecology Notes, 9, 1929-‐1931.
Hilborn, R., Stokes, K., Maguire, J.-‐J., Smith, T., Botsford, L. W., Mangel, M., Orensanz, J., Parma, A, Rice, J., Bell, J., Cochrane, K. L., Garcia, S., Hall, S. J., Kirkwood, G. P., Sainsbury, K., Stefansson, G., Walters, C. (2004). When can marine reserves improve fisheries management? Ocean & Coastal Management, 47, 197-‐205.
Hoegh-‐Guldberg, O., Mumby, P. J., Hooten, A. J., Steneck, R. S., Greenfield, P., Gomez, E., Harvell, C. D., Sale, P. F., Edwards, A. J., Caldeira, K., Knowlton, N., Eakin, C.M., Iglesias-‐Prieto, R., Muthiga, N., Bradbury, R. H., Dubi, A., Hatziolos, M.E. (2007). Coral reefs under rapid climate change and ocean acidification. Science, 318, 1737–1742.
Hoffman, J. I., Amos, W. (2005). Microsatellite genotyping errors: detection approaches, common sources and consequences for paternal exclusion. Molecular Ecology, 14, 599–612.
Hogan, J. D., Thiessen, R. J., Sale, P. F., Heath, D. D. (2012). Local retention, dispersal and fluctuating connectivity among populations of a coral reef fish. Oecologia, 168, 61-‐71.
Hughes, T. P., Bellwood, D. R., Folke, C., Steneck, R. S., Wilson, J. (2005). New paradigms for supporting the resilience of marine ecosystems. Trends in Ecology and Evolution, 20, 380–386.
Jackson, J. B., Kirby, M. X., Berger, W. H., Bjorndal, K. A., Botsford, L. W., Bourque, B. J., Bradbury, R. H., Cooke, R., Erlandson, J., Estes, J. A., Hughes, T. P., Kidwell, S., Lange, C. B., Lenihan, H. S., Pandolfi, J. M., Peterson, C. H., Steneck, R. S., Tegner, M. J., Warner, R. R. (2001). Historical overfishing and the recent collapse of coastal ecosystems. Science, 293, 629–637.
Jamieson, A., Taylor, S. S. (1997). Comparisons of three probability formulae for parentage exclusion. Animal Genetics, 28, 397-‐400.
Jennings, S., Kaiser, M.J., Reynolds, J.D. (2001) Marine fisheries ecology. Blackwell Science, Oxford.
Jones, A. G., Ardren, W. R. (2003). Methods of parentage analysis in natural populations. Molecular Ecology, 12, 2511–2523.

134
Jones, A. G., Small, C. M., Paczolt, K. A., Ratterman, N. L. (2010). A practical guide to methods of parentage analysis. Molecular Ecology Resources, 10, 6–30.
Jones, G. P., Milicich, M. J., Emslie, M. J., Lunow, C. (1999). Self-‐recruitment in a coral reef fish population. Nature, 402, 802–804.
Jones, G. P., Planes, S., Thorrold, S. R. (2005). Coral reef fish larvae settle close to home. Current Biology, 15, 1314-‐1318.
Jones, G. P., Srinivasan, M., Almany, G. R. (2007). Population connectivity and conservation of marine biodiversity. Oceanography, 20, 100–111.
Jones, G. P., Almany, G. R., Russ, G. R., Sale, P. F., Steneck, R. S., van Oppen, M. J. H, Willis, B. L. (2009). Larval retention and connectivity among populations of corals and reef fishes: history, advances and challenges. Coral Reefs, 28, 307-‐325.
Jones, O. R., Wang, J. (2010a). COLONY: a program for parentage and sibship inference from multilocus genotype data. Molecular Ecology Resources, 10, 551–555.
Jones, O. R., Wang, J. (2010b). Molecular marker-‐based pedigrees for animal conservation biologists. Animal Conservation, 13, 26–34.
Jordano, P., Garcia, C., Godoy, J. A., García-‐Castaño, J. L. (2007). Differential contribution of frugivores to complex seed dispersal patterns. Proceedings of the National Academy of Sciences of the United States of America, 104, 3278–3282.
Kalinowski, S. (2005). Do polymorphic loci require large sample sizes to estimate genetic distances? Heredity, 94, 33–36.
Kalinowski, S. T., Taper, M. L., Marshall, T. C. (2007). Revising how the computer program CERVUS accommodates genotyping error increases success in paternity assignment. Molecular Ecology, 16, 1099–1106.
Kanno, Y., Vokoun, J. C., Letcher, B. H. (2011). Sibship reconstruction for inferring mating systems, dispersal and effective population size in headwater brook trout (Salvelinus fontinalis) populations. Conservation Genetics, 12, 619–628.
Keller, L. F., Waller, D. M. (2002). Inbreeding effects in wild populations. Trends in Ecology and Evolution, 17, 230–241.
Kingsford, M. J., Leis, J. M., Shanks, A., Lindeman, K., Morgan, S., Pineda, J. (2002). Sensory environments, larval abilities and local self recruitment. Bulletin of Marine Science, 70, 309–340.
Kinlan, B. P., Gaines, S. D., Lester, S. E. (2005). Propagule dispersal and the scales of marine community process. Diversity and Distributions, 11, 139–148.
Koch, M., Hadfield, J.D., Sefc, K. M., Sturmbauer, C. (2008). Pedigree reconstruction in wild cichlid fish populations. Molecular Ecology, 17, 4500–4511.
Kool, J. T., Paris, C. B., Barber, P. H., Cowen, R. K. (2011). Connectivity and the development of population genetic structure in Indo-‐West Pacific coral reef communities. Global Ecology and Biogeography, 20, 695–706.
Krebs, J. R., Davies, N. B. (1997). Behavioural ecology: an evolutionary approach, 4th ed. Blackwell Science, Oxford.

135
Kritzer, J. (2004). Sex-‐specific growth and mortality, spawning season, and female maturation of the stripey bass (Lutjanus carponotatus) on the Great Barrier Reef. Fisheries Bulletin, 104, 94-‐107.
Lecchini, D., Shima, J., Banaigs, B., Galzin, R. (2005). Larval sensory abilities and mechanisms of habitat selection of a coral reef fish during settlement. Oecologia, 143, 326–334.
Lee, H. J., Boulding, E. G. (2007). Mitochondrial DNA variation in space and time in the northeastern Pacific gastropod, Littorina keenae. Molecular Ecology, 16, 3084–3103.
Leis, J. M. (2006). Are larvae of demersal fishes plankton or nekton? Advances in Marine Biology, 51, 57–141.
Leis, J., Wright, K., Johnson, R. (2007). Behaviour that influences dispersal and connectivity in the small, young larvae of a reef fish. Marine Biology, 153, 103–117.
Leis, J., Hay, A., Howarth, G. (2009). Ontogeny of in situ behaviours relevant to dispersal and population connectivity in larvae of coral-‐reef fishes. Marine Ecology Progress Series, 379, 163–179.
Lester, S. E., Halpern, B. S., Grorud-‐Colvert, K., Lubchenco, J., Ruttenberg, B. I., Gaines, S. D., Airamé, S., Warner, R. R. (2009). Biological effects within no-‐take marine reserves: a global synthesis. Marine Ecology Progress Series, 384, 33-‐46.
Levin, L. A. (2006). Recent progress in understanding larval dispersal: new directions and digressions. Integrative and Comparative Biology, 46, 282–297.
Liu, J. X., Ely, B. (2009). Sibship reconstruction demonstrates the extremely low effective population size of striped bass Morone saxatilis in the Santee-‐Cooper system, South Carolina, USA. Molecular Ecology, 18, 4112–4120.
Lo, L., Zhu, Z., Yue, G. (2006). Multiplex genotyping of novel tetranucleotide microsatellites from a marine foodfish species crimson red snapper (Lutjanus erythropterus). Molecular Ecology Notes, 6, 524–526.
Lotze, H. K., Coll, M., Magera, A. M., Ward-‐Paige, C., Airoldi, L. (2011). Recovery of marine animal populations and Ecosystems. Trends in Ecology and Evolution, 26, 595-‐605.
Lowe, W. H., Allendorf, F. W. (2010). What can genetics tell us about population connectivity? Molecular Ecology, 19, 3038–3051.
Lubchenco, J., Palumbi, S. R., Gaines, S. D., Andelman, S. (2003). Plugging a hole in the ocean: The emerging science of marine reserves. Ecological Applications, 13, S3-‐S7.
Magrath, M. J. L., Vedder, O., van der Velde, M., Komdeur, J. (2009). Maternal effects contribute to the superior performance of extra-‐pair offspring. Current Biology, 19, 792-‐797.

136
Manel, S., Gaggiotti, O. E., Waples, R. S (2005). Assignment methods: matching biological questions with appropriate techniques. Trends in Ecology and Evolution, 20, 136–142.
Marshall, T. C., Slate, J., Kruuk, L. E. B., Pemberton, J. M. (1998). Statistical confidence for likelihood-‐based paternity inference in natural populations. Molecular Ecology, 7, 639–655.
Marshall, D. J., Morgan, S. G. (2011). Ecological and evolutionary consequences of linked life-‐history stages in the sea. Current Biology, 21, R718–R725.
Matson, S. E., Camara, M. D., Eichert, W., Banks, M. A. (2008). P-‐LOCI: a computer program for choosing the most efficient set of loci for parentage assignment. Molecular Ecology Resources, 8, 765–768.
Meagher, T. R., Thompson, E. (1986). The relationship between single parent and parent pair genetic likelihoods in genealogy reconstruction. Theoretical Population Biology, 29, 87–106.
Meekan, M. G., Milicich, M. J., Doherty, P. J. (1993). Larval production drives temporal patterns of larval supply and recruitment of a coral reef damselfish. Marine Ecology Progress Series, 93, 217–217.
McCook, L. J. Almany, G. R., Berumen, M. L., Day, J. C., Green, A. L., Jones, G. P, Leis, J. M, Planes, S., Russ, G. R., Sale, P. F., Thorrold, S. R. (2009). Management under uncertainty: guide-‐lines for incorporating connectivity into the protection of coral reefs. Coral Reefs, 28, 353-‐366.
McCook, L. J., Ayling, T., Cappo, M., Choat, J. H., Evans, R. D., De Freitas, D., Heupel, M., Hughes, T. P., Jones, G. P., Mapstone, B., Marsh, H., Mills, M., Molloy, F. J., Pitcher, C. R., Pressey, R. L., Russ, G. R., Sutton, S., Sweatman, H., Tobin, R., Wachenfeld, D. R., Williamson, D. H. (2010). Adaptive management of the Great Barrier Reef: A globally significant demonstration of the benefits of networks of marine reserves. Proceedings of the National Academy of Sciences of the United States of America, 107, 18278-‐18285.
Mooney H. A., Hobbs, R. .J. (2000). Invasive species in a changing world. Island Press, Washington DC.
Montgomery, J. C., Jeffs, A., Simpson, S. D., Meekan, M., Tindle, C. (2006). Sound as an Orientation Cue for the Pelagic Larvae of Reef Fishes and Decapod Crustaceans. Advances in Marine Biology, 51, 143–196.
Mora, C., Sale, P. F. (2002). Are populations of coral reef fish open or closed? Trends in Ecology and Evolution, 17, 422-‐428.
Mora, C., Andréfouët, S., Costello, M. J., Kranenburg, C., Rollo, A., Veron, J., Gaston, K. J., Myers, R. A. (2006). Coral reefs and the global network of marine protected areas. Science, 312, 1750-‐1751.
Mora, C., Treml, E. A., Roberts, J., Crosby, K., Roy, D., Tittensor, D. P. (2011). High connectivity among habitats precludes the relationship between dispersal and range size in tropical reef fishes. Ecography, 35, 89–96.

137
Morrissey, M. B., Wilson, A. J. (2005). The potential costs of accounting for genotyping errors in molecular parentage analyses. Molecular Ecology, 14, 4111-‐4121.
Myers, R. A., Worm, B. (2003). Rapid worldwide depletion of predatory fish communities. Nature, 423, 280–283.
Nathan, R., Perry, G., Cronin, J. T., Strand, A. E, Cain, M. L. (2003). Methods for estimating long-‐distance dispersal. Oikos, 103, 261–273.
Neff, B. D., Repka, J., Gross, M. R. (2000). Statistical confidence in parentage analysis with incomplete sampling: how many loci and offspring are needed? Molecular Ecology, 9, 529–539.
Nei, M. (1987). Molecular Evolutionary Genetics, Columbia University Press, New York.
Newman, S. J., Cappo, M., Williams, D. McB. (2000). Age, growth and mortality of the stripey, Lutjanus carponotatus (Richardson) and the brown-‐stripe snapper, L. vitta (Quoy and Gaimard) from the central Great Barrier Reef, Australia. Fisheries Research, 48, 263–275.
Nielsen, J. F., English, S., Goodall-‐Copestake, W. P., Wang, J., Walling, C. A., Bateman, A. W., Flower, T. P., Sutcliffe, R. L, Samson, J., Thavarajah, N. K., Kruuk, L. E. B., Clutton-‐Brock, T. H., Pemberton, J. M. (2012). Inbreeding and inbreeding depression of early life traits in a cooperative mammal. Molecular Ecology, 21, 2788-‐2804.
Nielsen, R., Mattila, D. K., Clapham, P. J., Palsboll, P. J. (2001). Statistical approaches to paternity analysis in natural populations and applications to the North Atlantic humpback whale. Genetics, 157, 1673-‐1682.
Nunney, L. (1993). The influence of mating system and overlapping generations on effective population size. Evolution, 47, 1329– 1241.
Nussey, D. H., Coltman, D. W., Coulson, T., Kruuk, L. E. B., Donald, A., Morris, S. J., Clutton-‐Brock, T. H., Pemberton, J. M. (2005). Rapidly declining fine-‐scale spatial genetic structure in female red deer. Molecular Ecology, 14, 3395–3405.
Oddou-‐Muratorio, S., Houot, M.-‐L., Demesure-‐Musch, B., Austerlitz, F. (2003). Pollen flow in the wildservice tree, Sorbus torminalis (L.) Crantz. I. Evaluating the paternity analysis procedure in continuous populations. Molecular Ecology, 12, 3427–3439.
van Oosterhout, C., Hutchinson, W., Wills, D., Shipley, P. (2004). MICRO-‐CHECKER: software for identifying and correcting genotyping errors in microsatellite data. Molecular Ecology Notes, 4, 535-‐538.
Paetkau, D., Slade, R., Burden, M., Estoup, A. (2004). Genetic assignment methods for the direct, real-‐time estimation of migration rate: a simulation-‐based exploration of accuracy and power. Molecular Ecology, 13, 55–65.
Palumbi, S. (2003). Population genetics, demographic connectivity, and the design of marine reserves. Ecological Applications, 13, 146–158.

138
Pandolfi, J. M., Bradbury, R. H., Sala, E., Hughes, T. P., Bjorndal, K. A., Cooke, R. G., McArdle, D., McClenachan, L., Newman, M. J. H., Paredes, G., Warner, R. R., Jackson, J. B. C. (2003). Global trajectories of the long-‐term decline of coral reef ecosystems. Science, 301, 955–958.
Pauly, D., Christensen, V., Dalsgaard, J., Froese, R., Torres, F. (1998). Fishing down marine food webs. Science, 279, 860–863.
Pauly, D., Christensen, V., Guénette, S., Pitcher, T. J., Rashid Sumaila, U., Walters, C. J., Watson, R., Zeller, D. (2002). Towards sustainability in world fisheries. Nature, 418, 689-‐695.
Peakall, R., Smouse, P. E. (2006). GENALEX 6: genetic analysis in Excel. Population genetic software for teaching and research. Molecular Ecology Notes, 6, 288–295.
Pelc, R. A., Warner, R. R., Gaines, S. D., Paris, C. B. (2010). Detecting larval export from marine reserves. Proceedings of the National Academy of Sciences of the United States of America, 107, 18266-‐18271.
Pemberton, J. M., Slate, J., Bancroft, D. R., Barrett, J. A. (1995). Nonamplifying Alleles at microsatellite loci: a caution for parentage and population Studies. Molecular Ecology, 4, 249–252.
Pemberton, J. M. (2008). Wild pedigrees: the way forward. Proceedings of the Royal Society B Biological Sciences, 275, 613–621.
Piyapong, C., Butlin, R. K., Faria, J. J., Scruton, K. J., Wang, J., Krause, J. (2011). Kin assortment in juvenile shoals in wild guppy populations. Heredity, 106, 749–756.
Piry, S., Alapetite, A., Cornuet, J. M., Paetkau, D., Baudouin, L., Estoup, A. (2004). GENECLASS2: a software for genetic assignment and first-‐generation migrant detection. Journal of Heredity, 95, 536–539.
Planes, S., Lenfant, P. (2002). Temporal change in the genetic structure between and within cohorts of a marine fish, Diplodus sargus, induced by a large variance in individual reproductive success. Molecular Ecology, 11, 1515–1524.
Planes, S., Jones, G. P., Thorrold, S. R. (2009). Larval dispersal connects fish populations in a network of marine protected areas. Proceedings of the National Academy of Sciences of the United States of America, 106, 5693-‐5697.
Pompanon, F., Bonin, A., Bellemain, E., Taberlet, P. (2005). Genotyping errors: causes, consequences and solutions. Nature Reviews Genetics, 6, 847–846.
Pritchard, J. K., Stephens, M., Donnelly, P. (2000). Inference of population structure using multilocus genotype data. Genetics, 155, 945–959.
Purcell, J., Cowen, R., Hughes, C., Williams, D. (2006). Weak genetic structure indicates strong dispersal limits: a tale of two coral reef fish. Proceedings of the Royal Society B Biological Sciences, 273, 1483-‐1490.
R Development Core Team (2011). R: a language and environment for statistical computing. R Foundation for Statitical Computing, Vienna, Austria. ISBN 3-‐900051-‐07-‐0, URL http://www.R-‐project.org.
139
Rannala, B., Mountain, J. L. (1997). Detecting immigration by using multilocus genotypes. Proceedings of the National Academy of Sciences of the United States of America, 94, 9197–9201.
Reeve, H. K., Westneat, D. F., Noon, W. A., Sherman, P. W., Aquadro, C. F. (1990). DNA “fingerprinting” reveals high levels of inbreeding in colonies of the eusocial naked mole-‐rat. Proceedings of the National Academy of Sciences of the United States of America, 87, 2496–2500.
Rice, W. R. (1989). Analyzing tables of statistical tests. Evolution, 43, 223-‐225. Richardson, D. S., Jury, F. L., Blaakmeer, K., Komdeur, J., Burke, T. (2001). Parentage
assignment and extra-‐group paternity in a cooperative breeder: the Seychelles warbler (Acrocephalus sechellensis). Molecular Ecology, 10, 2263–2273.
Ritland, K. (2000). Marker-‐inferred relatedness as a tool for detecting heritability in nature. Molecular Ecology, 9, 1195-‐1204.
Roberts, C. (1997). Connectivity and management of caribbean coral reefs. Science, 278, 1454–1457.
Roberts, C. M., Bohnsack, J. A., Gell, F., Hawkins, J. P., and Goodridge, R. (2001). Effects of marine reserves on adjacent fisheries. Science, 294, 1920–1923.
Roberts, C. M., Hawkins, J. P., Gell, F. R. (2005). The role of marine reserves in achieving sustainable fisheries. Philosophical Transactions of the Royal Society of London Series B Biological Sciences, 360, 123–132.
Robertson, D. R. (1988). Abundances of surgeonfishes on patch-‐reefs in Caribbean Panamá: due to settlement, or post-‐settlement events? Marine Biology, 97, 495–501.
Rodriguez-‐Munoz, R., Bretman, A., Slate, J., Walling, C. A., Tregenza, T. (2010). Natural and sexual selection in a wild insect population. Science, 328, 1269–1272.
Russ, G. R., Alcala, A. C., Maypa, A. P., Calumpong, H. P., White, A. T. (2004). Marine reserve benefits local fisheries. Ecological Applications, 14, 597–606.
Russ, G. R., Cheal, A. J., Dolman, A. M., Emslie, M. J., Evans, R. D., Miller, I., Sweatman, H., Williamson, D. H. (2008). Rapid increase in fish numbers follows creation of world's largest marine reserve network. Current Biology, 18, R514-‐R515.
Russ, G. R., Alcala, A. C. (2011). Enhanced biodiversity beyond marine reserve boundaries: the cup spillith over. Ecological applications, 21, 241–250.
Sadovy, Y. (2001). The threat of fishing to highly fecund fishes. Journal of Fish Biology, 59, 90–108.
Saenz-‐Agudelo, P., Jones, G. P., Thorrold, S. R., Planes, S. (2009). Estimating connectivity in marine populations: an empirical evaluation of assignment tests and parentage analysis at different spatial scales. Molecular Ecology, 18, 1765-‐1776.
Saenz-‐Agudelo, P., Jones, G. P., Thorrold, S. R., Planes, S. (2011). Connectivity dominates larval replenishment in a coastal reef fish metapopulation. Proceedings of the Royal Society B Biological Sciences, 278, 2954–2961.

140
Saenz-‐Agudelo, P., Jones, G. P., Thorrold, S. R., Planes, S. (2012). Patterns and persistence of larval retention and connectivity in a marine fish metapopulation. Molecular Ecology, 21, 4695-‐4705.
Sale, P. F. (2004). Connectivity, recruitment variation, and the structure of reef fish communities. Integrative and Comparative Biology, 44, 390–399.
Sale, P. F., Cowen, R. K., Danilowicz, B. S., Jones, G. P., Kritzer, J. P., Lindeman, K. C., Planes, S., Polunin, N. V. C., Russ, G. R., Sadovy, Y. J., Steneck, R. S. (2005). Critical science gaps impede use of no-‐take fishery reserves. Trends in Ecology and Evolution, 20, 74-‐80.
Schunter, C., Carreras-‐Carbonell, J., Macpherson, E., Tintoré, J., Vidal-‐Vijande, E., Pascual, A., Guidetti, P., Pascual, M. (2011). Matching genetics with oceanography: directional gene flow in a Mediterranean fish species. Molecular Ecology, 20, 5167–5181.
Seber, G. A. F. (2002). The estimation of animal abundance and related parameters, Second Edition, Blackburn Press, Caldwell, New Jersey.
Selkoe, K. A., Toonen, R. J. (2006). Microsatellites for ecologists: a practical guide to using and evaluating microsatellite markers. Ecology Letters, 9, 615–629.
Selkoe, K. A., Gaines, S. D., Caselle, J. E., Warner, R. R. (2006). Current shifts and kin aggregation explain genetic patchiness in fish recruits. Ecology, 87, 3082-‐3094.
Shanks, A. (2009). Pelagic larval duration and dispersal distance revisited. The Biological Bulletin, 216, 373.
Simpson, S. D., Meekan, M., Montgomery, J., McCauley, R., Jeffs, A. (2005). Homeward sound. Science, 308, 221.
Simpson, S. D., Jennings, S., Johnson, M. P., Blanchard, J. L., Schön, P.-‐J., Sims, D. W., Genner, M. J. (2011). Continental shelf-‐wide response of a fish assemblage to rapid warming of the sea. Current Biology, 21, 1565–1570.
Slatkin, M. (1981). Estimating levels of gene flow in natural populations. Genetics, 99, 323-‐335.
Slavov, G. T., Leonardi, S., Adams, W. T., Strauss, S. H., DiFazio, S. P. (2010). Population substructure in continuous and fragmented stands of Populus trichocarpa. Heredity, 105, 348–357.
Steneck, R. S., Paris, C. B., Arnold, S. N., Ablan-‐Lagman, M. C., Alcala, A. C., Butler, M. J., McCook, L. J., Russ, G. R., Sale, P. F. (2009). Thinking and managing outside the box: coalescing connectivity networks to build region-‐wide resilience in coral reef ecosystems. Coral Reefs, 28, 367-‐ 378.
Steneck, R. S., Wilson, J. A. (2010). A fisheries play in an ecosystem theater: challenges of managing ecological and social drivers of marine fisheries at multiple spatial scales. Bulletin of Marine Science, 86, 387–411.
Stevenson, D. K., Campana, S. E. (1992). Otolith microstructure examination and analysis. Canadian Special Publication of Fisheries and Aquatic Sciences, 117, 126.

141
Swearer, S. E., Caselle, J. E., Lea, D. W., Warner, R. R. (1999). Larval retention and recruitment in an island population of a coral-‐reef fish. Nature, 402, 799–802.
Swearer, S. E., Shima, J. S, Hellberg, M. E., Thorrold, S. R., Jones, G. P., Robertson, R. D., Morgan, S. G., Selkoe, K. A., Ruiz, G. M., Warner, R. R. (2002). Evidence of self-‐recruitment in demersal marine populations. Bulletin of Marine Science, 70, 251-‐271.
Thomas, S. C., Hill, W. G. (2002). Sibship reconstruction in hierarchical population structures using Markov chain Monte Carlo techniques. Genetic Research, 79, 227–234.
Thorrold, S., Jones, G., Planes, S., Hare, J. (2006). Transgenerational marking of embryonic otoliths in marine fishes using barium stable isotopes. Canadian Journal of Fisheries and Aquatic Sciences, 63, 1193–1197.
Trakhtenbrot, A., Nathan, R., Perry, G., Richardson, D. M. (2005). The importance of long-‐distance dispersal in biodiversity conservation. Diversity and Distributions, 11, 173–181.
Treml, E., Halpin, P., Urban, D., Pratson, L. (2008). Modeling population connectivity by ocean currents, a graph-‐theoretic approach for marine conservation. Landscape Ecology, 23, 19-‐36.
Turner, T. F., Wares, J. P., Gold, J. R. (2002). Genetic effective size is three orders of magnitude smaller than adult census size in an abundant, estuarine-‐dependent marine fish (Sciaenops ocellatus). Genetics, 162, 1329–1339.
Walling, C. A., Pemberton, J. M., Hadfield, J. D., Kruuk, L. E. B. (2010). Comparing parentage inference software: reanalysis of a red deer pedigree. Molecular Ecology, 19, 1914–1928.
Wang, J. (2004). Sibship reconstruction from genetic data with typing errors. Genetics 166, 1963-‐1979.
Wang, J. (2007). Parentage and sibship exclusions: higher statistical power with more family members. Heredity, 99, 205–217.
Wang, J., Santure, A. W. (2009). Parentage and sibship inference from multilocus genotype data under polygamy. Genetics, 181, 1579-‐1594.
Wang, J. (2010). Effects of genotyping errors on parentage exclusion analysis. Molecular Ecology, 19, 5061–5078.
Wang, J. (2012). Computationally efficient sibship and parentage assignment from multilocus marker data. Genetics, 191, 183–194.
Waples, R. S., Gaggiotti, O. (2006). What is a population? An empirical evaluation of some genetic methods for identifying the number of gene pools and their degree of connectivity. Molecular Ecology, 15, 1419–1439.
Warner, R. R., Cowen, R. K. (2002). Local retention of production in marine populations: evidence, mechanisms, and consequences. Bulletin of Marine Science, 70, 245–249.
Watling, L., Norse, E. A. (1998). Disturbance of the seabed by mobile fishing gear: a comparison to forest clearing. Conservation Biology, 12, 1180-‐1197.

142
Weir, B., Cockerham, C. (1984). Estimating F-‐statistics for the analysis of population structure. Evolution, 38, 1358-‐1370.
Wen, C. K., Pratchett, M. S., Almany, G. R., Jones, G. P. (2013a). Patterns of recruitment and microhabitat associations for three predatory coral reef fishes on the southern Great Barrier Reef, Australia. Coral Reefs, DOI 10.1007/s00338-‐012-‐0985-‐x.
Wen, C., Pratchett, M. S., Almany, G. R., Jones, G. P. (2013b). Role of prey availability in microhabitat preferences of juvenile coral trout (Plectropomus: Serranidae). Journal of Experimental Marine Biology and Ecology, 443, 39–45.
White, C., Selkoe, K. A., Watson, J., Siegel, D. A., Zacherl, D. C., Toonen, R. J. (2010). Ocean currents help explain population genetic structure. Proceedings of the Royal Society B Biological Sciences, 277, 1685–1694.
Willis, T., Millar, R., Babcock, R. C., Tolimieri, N. (2003). Burdens of evidence and the benefits of marine reserves: putting Descartes before des horse. Environmental Conservation, 30, 97–103.
Wilson, A. J., Ferguson, M. M. (2002). Molecular pedigree analysis in natural populations of fishes: approaches, applications, and practical considerations. Canadian Journal of Fisheries and Aquatic Sciences, 59, 1696–1707.
Williamson, D. H., Russ, G. R., Ayling, A. M. (2004). No-‐take marine reserves increase abundance and biomass of reef fish on inshore fringing reefs of the Great Barrier Reef. Environmental Conservation, 31, 149-‐159.
Williamson, D. H., Ceccarelli, D. M., Evans, R. D., Russ, G. R. (in prep). Coral declines impact fish abundance and diversity in both marine reserves and fished areas.
Wood, L. J., Fish, L., Laughren, J., Pauly, D. (2008). Assessing progress towards global marine protection targets: shortfalls in information and action. Oryx, 42, 340-‐351.
Zane, L., Bargelloni, L., Patarnello, T. (2002). Strategies for microsatellite isolation: a review. Molecular Ecology, 11, 1–16.
Zhang, J., Cai, Z., Huang, H. (2006). Isolation and characterization of microsatellite loci from mangrove red snapper Lutjanus Argentimaculatus. Molecular Ecology Notes, 6, 408–411.
Zhu, Z., Lo, L., Lin, G., Xu, Y., Yue, G. (2005). Isolation and characterization of polymorphic microsatellites from red coral grouper (Plectropomus maculatus). Molecular Ecology Notes, 5, 579-‐581.
143
APPENDIX -‐ PUBLICATIONS ARISING FROM THIS THESIS
Harrison, H. B., Williamson D. H., Evans R. D., Almany G. R., Thorrold S. R., Russ G.
R., Feldheim K. A., van Herwerden L., Planes S., Srinivasan M., Berumen M.
L., Jones G. P. (2012). Larval export from marine reserves and the
recruitment benefit for fish and fisheries. Current Biology, 22, 1023-‐1028.
Harrison, H. B., Saenz-‐Agudelo, S., Planes, S., Jones, G. P., Berumen, M. L. (2013).
Relative accuracy of three common methods of parentage analysis in
natural populations. Molecular Ecology, 22, 1158-‐1170.