Embed Size (px)
Citation preview
Genetic evaluation of the ratio of calf weaning weight to cow weight1,2,3
M. D. MacNeil4
ARS, USDA, Fort Keogh Livestock and Range Research Laboratory, Miles City, MT 59301
ABSTRACT: The phenotypic ratio of a calf’s weaningweight to its dam’s weight is thought to be an indicatorof efficiency of the cow. Thus, the objectives of thisresearch were to 1) estimate genetic parameters forthe ratio of 200-d calf weight to mature-equivalent cowweight at weaning, its components, and other growthtraits; and 2) evaluate responses to selection based onthe ratio. Phenotypes evaluated were the ratio (100 kg/kg; n = 4,184), birth weight (kg; n = 5,083), 200-d weight(kg; n = 4,902), 365-d weight (kg; n = 4,626), and mature-equivalent cow weight at weaning (kg; n = 4,375). In1989, a randomly selected and mated control line anda line selected for greater values of the ratio were estab-lished. Average generation intervals were 3.39 ± 0.05and 3.90 ± 0.08 yr in the ratio selected line and controlline, respectively. The ratio selection line (n = 895) accu-mulated approximately 4.7 SD more selection differen-tial than the control line (n = 912) over 2.5 generations.Data were analyzed with a multiple-trait Gibbs sam-pler for animal models to make Bayesian inferences.Heritability estimates (posterior mean ± SD) for directeffects were 0.20 ± 0.03, 0.46 ± 0.04, 0.48 ± 0.03, 0.58± 0.04, and 0.76 ± 0.02 for ratio, birth weight, 200-
Key Words: Beef Cattle, Cow Indexes, Genetic Gain, Selection Responses
2005 American Society of Animal Science. All rights reserved. J. Anim. Sci. 2005. 83:794–802
Introduction
Nutritional cost of maintaining females is a substan-tial portion of input to a production unit (Fitzhugh,1978). The phenotypic ratio of weaning weight of a calf
1This research was conducted under a cooperative agreement be-tween ARS, USDA and the Montana Agric. Exp. Stn.
2Mention of a proprietary product does not constitute a guaranteeor warranty of the product by USDA, Montana Agric. Exp. Sta. orthe authors and does not imply its approval to the exclusion of otherproducts that may also be suitable.
3Several people, including W. L. Reynolds, J. J. Urick, R. A. Bel-lows, R. E. Short, R. B. Staigmiller, B. W. Knapp, and S. Newman,made significant contributions to the design and/or initial implemen-tation of this research. Their contributions are greatly appreciated.
4Correspondence: 243 Fort Keogh Rd. (phone: 406-232-8213; fax:406-232-8209; e-mail: [email protected]).
Received November 12, 2004.Received January 5, 2005.
794
d weight, 365-d weight, and cow weight, respectively.Estimates for heritability of maternal effects were 0.58± 0.05, 0.10 ± 0.02, 0.13 ± 0.02, and 0.10 ± 0.02 for ratio,birth weight, 200-d weight, 365-d weight, respectively.Significant response to selection was limited to mater-nal effects: 1.32 ± 0.38 ratio units per generation. Asthe ratio was a trait of the calf, estimated maternalgenetic effects on the ratio contained both genetic ef-fects due to dams that environmentally affected prog-eny performance and direct effects on the reciprocal ofcow weight. In the control line, genetic trends in directand maternal 200-d weight were −1.28 ± 0.91 and 0.62± 0.92 kg/generation, respectively, and the genetic trendin direct effects on cow weight was −5.72 ± 2.80 kg/generation. In the selection line, genetic trends in directand maternal 200-d weight were 1.43 ± 0.79 and 2.90± 0.80 kg/generation and the genetic trend in cowweight was −2.79 ± 2.43 kg/generation. Significant cor-related responses were observed in direct effects onbirth weight and maternal effects on 365-d weight. Re-sults contraindicate use of the ratio of calf weaningweight to cow weight as a selection criterion.
to weight of its dam may be an indicator of efficiency, andCunningham (1974) postulated a reasonable measure ofeconomic utility of a commercial beef cow. The numera-tor indicates output, and the denominator indicates in-put through a commonly accepted association of cowweight and feed requirements. Dinkel and Brown (1978)evaluated this ratio as an indicator of efficiency andfound little advantage of the ratio over weaning weightin predicting TDN consumed by cow and calf divided bythe weaning weight of the calf. However, Davis et al.(1983) found cow weight correlated to efficiency, withsmaller cows being more efficient in production of wean-ing weight. The relationship between cow size and effi-ciency may result from complementarity (Cartwright,1970), although this basis also has been challenged (Din-kel, 1988).
To justify using a ratio to express information abouttwo quantities, three conditions should be satisfied: 1)the relationship between components is linear; 2) the
Calf weight to cow weight ratio 795
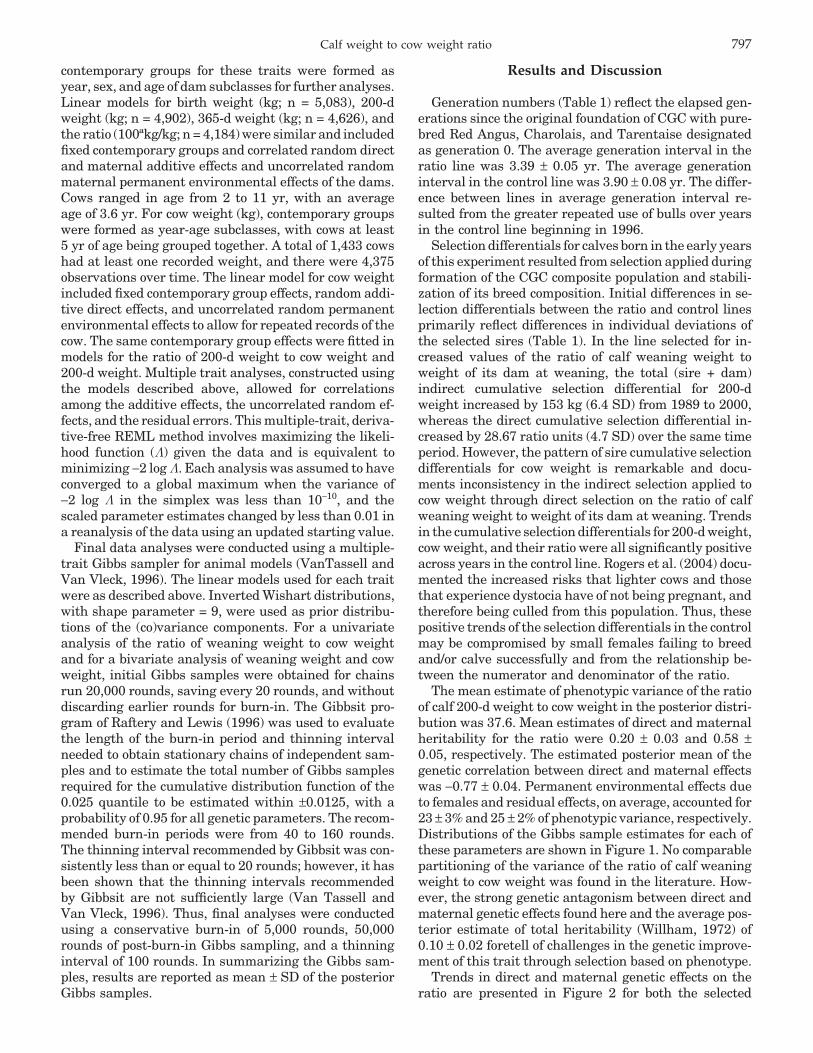
Table 1. Numbers of calves, generation numbers (Gn), and selection differentials accumulated over generations forweaning weight, cow weight, and their ratio reflecting selection applied, by year of birth and line
Ratio line Control line
200-d wt, kg Cow wt, kg Ratio 200-d wt, kg Cow wt, kg Ratio
Year No. Gn Sire Dam Sire Dam Sire Dam No. Gn Sire Dam Sire Dam Sire Dam
1989 29 4.1 54.9 75.8 46.3 83.9 6.76 3.89 29 4.0 71.7 68.9 97.5 84.4 2.12 3.861990 50 4.1 40.8 64.9 15.0 68.0 8.83 3.66 52 4.1 52.6 61.7 86.1 64.0 1.73 3.191991 88 4.1 97.5 58.1 67.6 74.8 12.17 2.12 85 4.2 47.6 57.1 90.3 83.5 −0.12 1.371992 104 4.2 65.3 54.9 16.8 78.0 9.20 1.73 97 4.3 48.5 54.9 109.8 78.5 −1.36 1.911993 97 4.8 134.7 70.3 90.7 93.4 15.65 3.76 96 4.8 60.3 61.7 163.7 103.9 −4.16 1.581994 99 4.8 99.3 73.0 40.4 103.4 12.77 3.63 99 5.1 98.4 64.4 183.3 116.1 1.66 1.571995 93 5.5 129.7 94.8 44.9 112.0 20.82 7.42 110 5.4 68.0 70.8 121.6 147.0 1.07 0.381996 78 5.7 110.2 98.4 11.8 119.3 19.53 7.22 59 5.8 99.3 80.7 202.3 171.9 0.53 0.031997 63 6.1 149.2 113.9 102.5 125.6 19.55 10.65 58 6.1 83.9 83.0 147.0 168.7 3.35 1.141998 86 6.3 127.9 115.7 20.9 143.8 22.80 9.42 60 6.2 84.8 93.0 137.0 182.3 4.48 1.951999 99 6.5 133.4 113.9 29.5 121.6 22.67 10.98 115 6.3 83.0 86.1 138.8 194.1 3.84 −0.202000 77 6.6 153.3 130.2 54.9 116.6 24.09 15.23 116 6.3 96.6 88.9 160.1 197.3 4.52 0.03
intercept of the linear regression of numerator on denom-inator should be the origin; and 3) the variance of theratio should increase with increasing values of numera-tor and denominator (Weil, 1962). In addition, a ratioof two normally distributed variables is not normallydistributed (Fieller, 1932; Hinkley, 1969). Thus, concernwas raised for the traditional concept of heritability ofa ratio (Gunsett, 1987).
Despite theoretical issues with the ratio of calf wean-ing weight to cow weight, continuing interest in its usein selection and a need to improve the efficiency of beefproduction points to a need for genetic evaluation of thisratio and its components. Thus, the objectives of thisresearch were to estimate genetic parameters for theratio, its components, and other growth traits, and toevaluate responses to selection based on the ratio.
Materials and Methods
This research made use of a composite population ofbeef cattle (CGC) developed by USDA-ARS at FortKeogh Livestock and Range Research Laboratory, MilesCity, MT (Newman et al., 1993a,b). The general intentin forming the composite was to develop a strain of beefcattle with improved adaptation to the Northern GreatPlains rangeland environment and greater potentialprofitability than existing breeds. The CGC populationwas initiated by mating Charolais (n = 14) and Taren-taise (n = 12) sires to Red Angus dams (n = 300). Thesefoundation matings were made from 1979 to 1983. Sub-sequently (1981 to 1987), F1 bulls were mated to F1females to produce progeny that were ¹⁄₂ Red Angus,¹⁄₄ Charolais, and ¹⁄₄ Tarentaise. Animals of this breedcomposition were inter se mated in all subsequent gener-ations. No additional germplasm has been introducedinto CGC since the foundation matings. Thus, directbreed effects were stabilized in the F2 generation, directheterosis and maternal breed effects were stabilized inthe F3 generation, and maternal heterosis effects werestabilized in the F4 generation. Additional details de-
scribing the formation of the CGC population can befound in Newman et al. (1993a).
In 1988, the population was divided randomly intothree lines. Bulls for the first line were selected basedon the index I = 365-d weight − 3.2(birth weight) (Dick-erson et al., 1974). Response to selection for the indexproposed by Dickerson et al. (1974) has been previouslyreported (MacNeil, 2003). Bulls for the second line wereselected based on 100 times the ratio of their age-of-dam-adjusted 200-d weight to the coincident matureequivalent weight of their dam. Selection decisions werebased on phenotypic performance within year. Virtuallyall selection pressure was applied to males, and mostfemales were exposed for breeding as yearlings. Bullsfor the third line were selected at random. All bulls wererequired to pass a breeding soundness examination asyearlings before being used for breeding.
In 1988 and 1989, the process of stabilizing the geneticcomposition of CGC was ongoing. Only cows belongingto generations subsequent to the F2 contributed to theselection experiment. Hence, the numbers of calves inthe control and ratio selection lines were less than thenumbers of calves in subsequent years (Table 1). In 1989and 1990, yearling heifers and bulls were sent to theU.S. Sheep Exp. Stn., Dubois, ID, for use with sheep ina mixed-species grazing trial. Mating occurred duringthe trial and all animals were returned to Miles Cityin late August. Thus, yearling heifers were mated todifferent bulls than the remainder of the cows in thoseyears. Except during the mixed-species grazing trial,mating assignments were subject to the constraint thatapproximately equal numbers of like-aged females wereassigned to each sire. In 1995 to 1997, a sample of cowswas removed from the experiment (primarily from thecontrol line) to initiate a project for mapping QTL (Mac-Neil and Grosz, 2002). Except as described below, fouryearling bulls were used as sires in each line during eachbreeding season, with one sire from each line, selected atrandom, used the next year. In the control line: nineyearling bulls were used in the 1989 and 1990 breeding

M. D. MacNeil796
seasons and the same six bulls were used in the 1996to 1998 breeding seasons; in the 1999 breeding season,four of the six bulls used in 1998 were used again, andthe other two bulls used in 1998 were replaced by sons.In the ratio selection line, nine yearling bulls were usedin the 1989 and 1990 breeding seasons, and in the 1992and 1996 to 1999 breeding seasons, five yearling bullswere used each year. Increasing the number of bullsused per year, while decreasing the number of cows,allowed the effective population size of the control lineto remain approximately equal to that of the ratio selec-tion line during the latter years of this research. Withinline, bulls selected for breeding were assigned to cowsto avoid inbreeding of the progeny produced in thenext generation.
At Fort Keogh Livestock and Range Research Labora-tory, annual precipitation averages 34 cm, with 21 cmreceived from March to July. Average temperaturesrange from −9°C in January to 23°C in July. The terrainis broken badlands and plains rangelands that are typi-cal of the northern Great Plains of the United States.Vegetation is predominantly western wheatgrass, bluegrama, needle-and-thread, annual brome grasses,threadleaf sedge, greasewood, big and silver sagebrush,and fringed sagewort. Stocking rate on these rangelandsis approximately 1 cow/14 ha, with supplemental feedrequired during winter.
A 45-d breeding season began on approximately June15 of each year. Cows were exposed for breeding in sin-gle-sire pastures until approximately August 1, with theassignment to breeding pastures at random with respectto line. After the breeding season, cows were groupedby geographic proximity of the breeding herds into twolarger herds, and grazed native rangeland until vegeta-tion was covered by snow. Cows were weighed and preg-nancy tested when their calves were weaned in earlyOctober. Nonpregnant females were culled. Cows andheifers were managed separately through winter, withapproximately 1.4 kg of alfalfa pellets per animal pro-vided daily when forage was available and hay fed whenthe forage was covered by snow. In preparation for calv-ing, cows were moved to small pastures and fed approxi-mately 9 kg of alfalfa hay per cow daily. As calvingapproached, first-calf heifers were observed periodicallythroughout the day. Older cows were observed only dur-ing daylight. Cow weights were adjusted to a mature (5-yr-old) equivalent basis using multiplicative adjustmentfactors derived from the data first in 1987 and subse-quently in 1990. The adjustment factors were 1.197,1.110, and 1.045 for 2-, 3-, and 4-yr-old cows, respec-tively.
Most calves were born during April and May of eachyear. Male calves were not castrated, and no creep feedwas offered to the calves. Calves were weaned at anaverage age of approximately 180 d. After weaning, thecalves were moved to a feedlot for a 140-d evaluation ofpostweaning growth. Before the test period began, thecalves were allowed a pretest adjustment period of 2 to4 wk following weaning. Bull calves were fed a diet that
was formulated to support an average growth rate of 1.4kg/d. The energy density of the diet was approximately2.7 Mcal of ME/kg of DM, and the CP content was approx-imately 12% of DM. Primary ingredients in the diet werecorn silage, barley, and a protein and mineral supple-ment. Heifer calves were fed to gain 0.8 kg/d. The approx-imate energy density and CP content of the diet were2.4 Mcal of ME/kg of DM and 9% of DM, respectively.The calves were weighed on Monday and Wednesday ofthe weeks at the beginning and end of the postweaningtest period, and the pairs of weights were averaged tocalculate initial and final weights, respectively. Birthweight and gain from birth to weaning were adjustedfor differences in age of dam following the results ofNewman et al. (1993b). Weaning and yearling weightswere then adjusted to age-constant bases as recom-mended by the BIF (1996).
Selection applied and turnover of generations weremonitored for each line, separately. Individual selectiondifferentials (ID) were computed for the ratio and compo-nent traits within year-sex-line subclasses based on theadjusted phenotypes. Cumulative selection differentialswere calculated following the methodology of Newman etal. (1973), with differences in selection applied betweensires and dams summarized by year-line subclass follow-ing Koch et al. (1994). Performance records were notavailable for the original purchased females and theircontemporaries or for the purebred bulls used by AIand their contemporaries. Therefore, in calculating thecumulative selection differentials, the deviation of a phe-notype of an individual from the contemporary groupmean was assumed to be zero for all animals born before1980. For an animal, the cumulative selection differen-tial (CS) was calculated recursively as:
CS = ID + (CSs +CSd)/2
where CSs = cumulative sire differential and CSd = cu-mulative dam differential. The generation number (GN)of each animal was calculated similarly as:
GN = (GNs + GNd)/2 +1
where GNs and GNd = generation numbers of the sireand dam, respectively (Brinks et al., 1964). Generationnumber also was assumed to be zero for all animals bornbefore 1980.
Preliminary analyses to derive estimates of parame-ters of the prior distribution for a Bayesian analysis ofthese data were conducted using multiple-trait, deriva-tive-free REML (Smith and Graser, 1986; Graser et al.,1987) methods as implemented by Boldman et al. (1995).Genetic parameters were estimated from phenotypes re-corded from all animals born between 1980 and 2000.Pedigree information was extended to the founding pure-breds, which were assumed to be unrelated. Earlier re-sults indicated that year of birth, sex of calf, age of dam,and a variety of two-factor interactions among thesetraits affected birth, 200-d, and 365-d weights. Hence,
Calf weight to cow weight ratio 797
contemporary groups for these traits were formed asyear, sex, and age of dam subclasses for further analyses.Linear models for birth weight (kg; n = 5,083), 200-dweight (kg; n = 4,902), 365-d weight (kg; n = 4,626), andthe ratio (100ªkg/kg; n = 4,184) were similar and includedfixed contemporary groups and correlated random directand maternal additive effects and uncorrelated randommaternal permanent environmental effects of the dams.Cows ranged in age from 2 to 11 yr, with an averageage of 3.6 yr. For cow weight (kg), contemporary groupswere formed as year-age subclasses, with cows at least5 yr of age being grouped together. A total of 1,433 cowshad at least one recorded weight, and there were 4,375observations over time. The linear model for cow weightincluded fixed contemporary group effects, random addi-tive direct effects, and uncorrelated random permanentenvironmental effects to allow for repeated records of thecow. The same contemporary group effects were fitted inmodels for the ratio of 200-d weight to cow weight and200-d weight. Multiple trait analyses, constructed usingthe models described above, allowed for correlationsamong the additive effects, the uncorrelated random ef-fects, and the residual errors. This multiple-trait, deriva-tive-free REML method involves maximizing the likeli-hood function (Λ) given the data and is equivalent tominimizing −2 log Λ. Each analysis was assumed to haveconverged to a global maximum when the variance of−2 log Λ in the simplex was less than 10−10, and thescaled parameter estimates changed by less than 0.01 ina reanalysis of the data using an updated starting value.
Final data analyses were conducted using a multiple-trait Gibbs sampler for animal models (VanTassell andVan Vleck, 1996). The linear models used for each traitwere as described above. Inverted Wishart distributions,with shape parameter = 9, were used as prior distribu-tions of the (co)variance components. For a univariateanalysis of the ratio of weaning weight to cow weightand for a bivariate analysis of weaning weight and cowweight, initial Gibbs samples were obtained for chainsrun 20,000 rounds, saving every 20 rounds, and withoutdiscarding earlier rounds for burn-in. The Gibbsit pro-gram of Raftery and Lewis (1996) was used to evaluatethe length of the burn-in period and thinning intervalneeded to obtain stationary chains of independent sam-ples and to estimate the total number of Gibbs samplesrequired for the cumulative distribution function of the0.025 quantile to be estimated within ±0.0125, with aprobability of 0.95 for all genetic parameters. The recom-mended burn-in periods were from 40 to 160 rounds.The thinning interval recommended by Gibbsit was con-sistently less than or equal to 20 rounds; however, it hasbeen shown that the thinning intervals recommendedby Gibbsit are not sufficiently large (Van Tassell andVan Vleck, 1996). Thus, final analyses were conductedusing a conservative burn-in of 5,000 rounds, 50,000rounds of post-burn-in Gibbs sampling, and a thinninginterval of 100 rounds. In summarizing the Gibbs sam-ples, results are reported as mean ± SD of the posteriorGibbs samples.
Results and Discussion
Generation numbers (Table 1) reflect the elapsed gen-erations since the original foundation of CGC with pure-bred Red Angus, Charolais, and Tarentaise designatedas generation 0. The average generation interval in theratio line was 3.39 ± 0.05 yr. The average generationinterval in the control line was 3.90 ± 0.08 yr. The differ-ence between lines in average generation interval re-sulted from the greater repeated use of bulls over yearsin the control line beginning in 1996.
Selection differentials for calves born in the early yearsof this experiment resulted from selection applied duringformation of the CGC composite population and stabili-zation of its breed composition. Initial differences in se-lection differentials between the ratio and control linesprimarily reflect differences in individual deviations ofthe selected sires (Table 1). In the line selected for in-creased values of the ratio of calf weaning weight toweight of its dam at weaning, the total (sire + dam)indirect cumulative selection differential for 200-dweight increased by 153 kg (6.4 SD) from 1989 to 2000,whereas the direct cumulative selection differential in-creased by 28.67 ratio units (4.7 SD) over the same timeperiod. However, the pattern of sire cumulative selectiondifferentials for cow weight is remarkable and docu-ments inconsistency in the indirect selection applied tocow weight through direct selection on the ratio of calfweaning weight to weight of its dam at weaning. Trendsin the cumulative selection differentials for 200-d weight,cow weight, and their ratio were all significantly positiveacross years in the control line. Rogers et al. (2004) docu-mented the increased risks that lighter cows and thosethat experience dystocia have of not being pregnant, andtherefore being culled from this population. Thus, thesepositive trends of the selection differentials in the controlmay be compromised by small females failing to breedand/or calve successfully and from the relationship be-tween the numerator and denominator of the ratio.
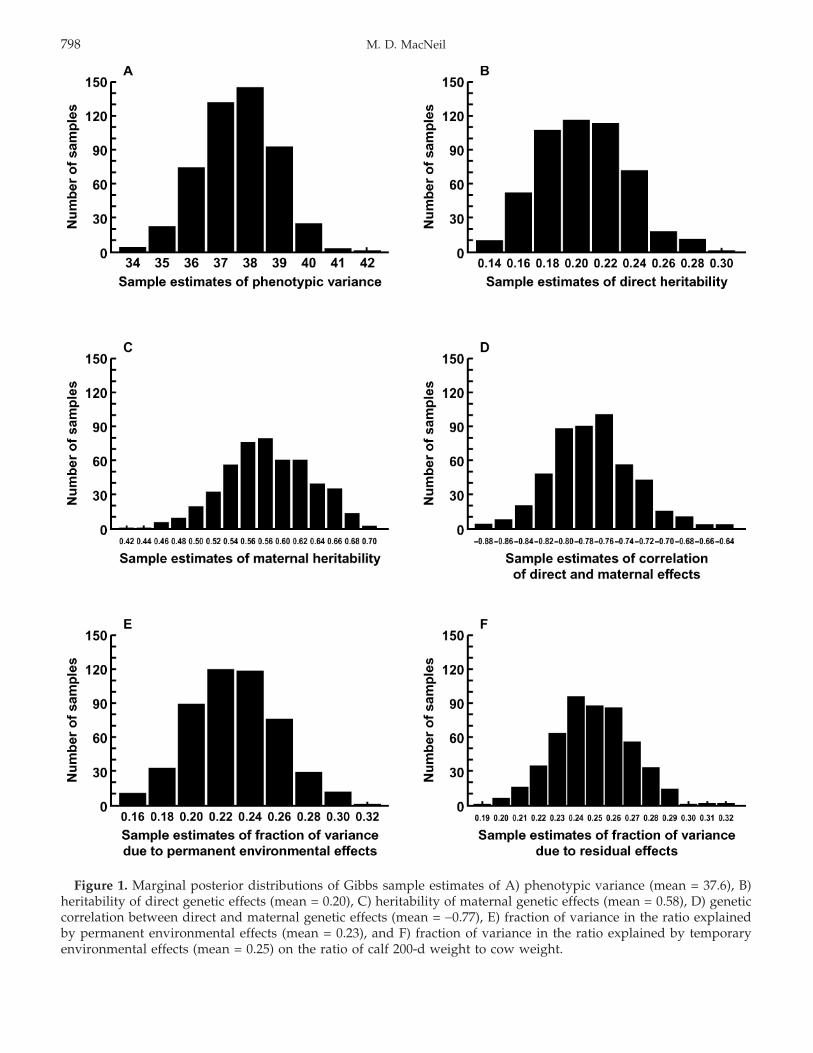
The mean estimate of phenotypic variance of the ratioof calf 200-d weight to cow weight in the posterior distri-bution was 37.6. Mean estimates of direct and maternalheritability for the ratio were 0.20 ± 0.03 and 0.58 ±0.05, respectively. The estimated posterior mean of thegenetic correlation between direct and maternal effectswas −0.77 ± 0.04. Permanent environmental effects dueto females and residual effects, on average, accounted for23 ± 3% and 25 ± 2% of phenotypic variance, respectively.Distributions of the Gibbs sample estimates for each ofthese parameters are shown in Figure 1. No comparablepartitioning of the variance of the ratio of calf weaningweight to cow weight was found in the literature. How-ever, the strong genetic antagonism between direct andmaternal genetic effects found here and the average pos-terior estimate of total heritability (Willham, 1972) of0.10 ± 0.02 foretell of challenges in the genetic improve-ment of this trait through selection based on phenotype.
Trends in direct and maternal genetic effects on theratio are presented in Figure 2 for both the selected
M. D. MacNeil798
Figure 1. Marginal posterior distributions of Gibbs sample estimates of A) phenotypic variance (mean = 37.6), B)heritability of direct genetic effects (mean = 0.20), C) heritability of maternal genetic effects (mean = 0.58), D) geneticcorrelation between direct and maternal genetic effects (mean = −0.77), E) fraction of variance in the ratio explainedby permanent environmental effects (mean = 0.23), and F) fraction of variance in the ratio explained by temporaryenvironmental effects (mean = 0.25) on the ratio of calf 200-d weight to cow weight.
Calf weight to cow weight ratio 799
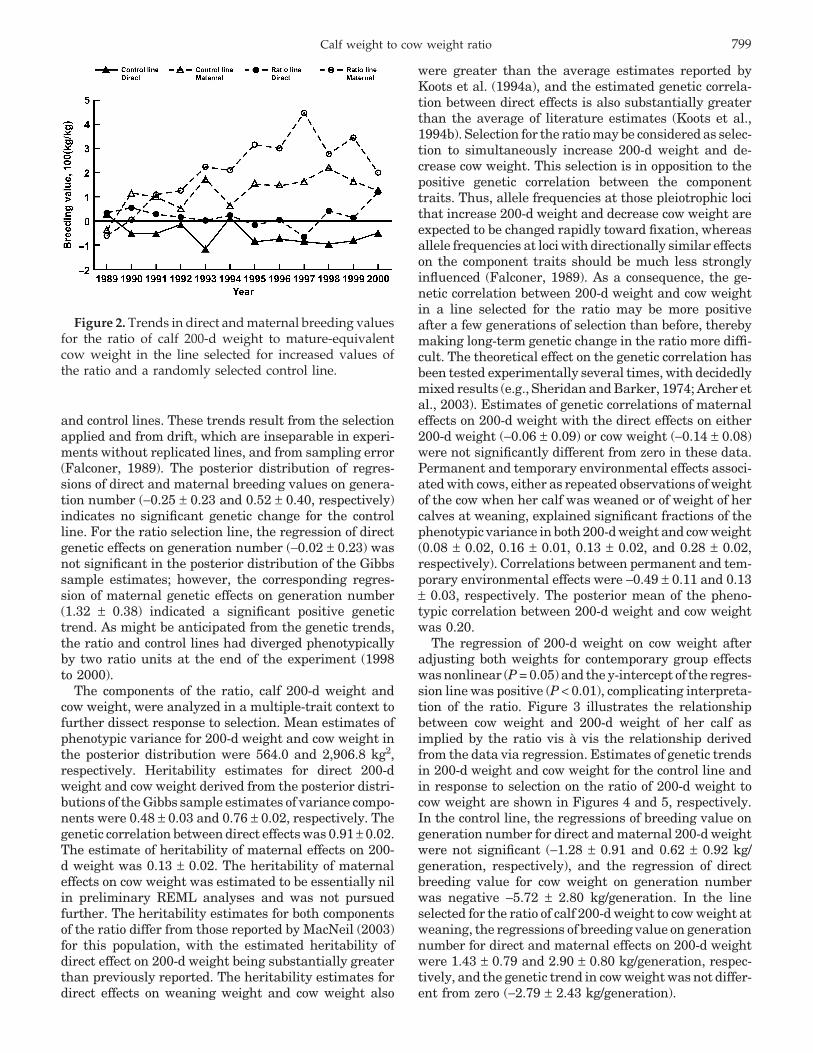
Figure 2. Trends in direct and maternal breeding valuesfor the ratio of calf 200-d weight to mature-equivalentcow weight in the line selected for increased values ofthe ratio and a randomly selected control line.
and control lines. These trends result from the selectionapplied and from drift, which are inseparable in experi-ments without replicated lines, and from sampling error(Falconer, 1989). The posterior distribution of regres-sions of direct and maternal breeding values on genera-tion number (−0.25 ± 0.23 and 0.52 ± 0.40, respectively)indicates no significant genetic change for the controlline. For the ratio selection line, the regression of directgenetic effects on generation number (−0.02 ± 0.23) wasnot significant in the posterior distribution of the Gibbssample estimates; however, the corresponding regres-sion of maternal genetic effects on generation number(1.32 ± 0.38) indicated a significant positive genetictrend. As might be anticipated from the genetic trends,the ratio and control lines had diverged phenotypicallyby two ratio units at the end of the experiment (1998to 2000).
The components of the ratio, calf 200-d weight andcow weight, were analyzed in a multiple-trait context tofurther dissect response to selection. Mean estimates ofphenotypic variance for 200-d weight and cow weight inthe posterior distribution were 564.0 and 2,906.8 kg2,respectively. Heritability estimates for direct 200-dweight and cow weight derived from the posterior distri-butions of the Gibbs sample estimates of variance compo-nents were 0.48 ± 0.03 and 0.76 ± 0.02, respectively. Thegenetic correlation between direct effects was 0.91 ± 0.02.The estimate of heritability of maternal effects on 200-d weight was 0.13 ± 0.02. The heritability of maternaleffects on cow weight was estimated to be essentially nilin preliminary REML analyses and was not pursuedfurther. The heritability estimates for both componentsof the ratio differ from those reported by MacNeil (2003)for this population, with the estimated heritability ofdirect effect on 200-d weight being substantially greaterthan previously reported. The heritability estimates fordirect effects on weaning weight and cow weight also
were greater than the average estimates reported byKoots et al. (1994a), and the estimated genetic correla-tion between direct effects is also substantially greaterthan the average of literature estimates (Koots et al.,1994b). Selection for the ratio may be considered as selec-tion to simultaneously increase 200-d weight and de-crease cow weight. This selection is in opposition to thepositive genetic correlation between the componenttraits. Thus, allele frequencies at those pleiotrophic locithat increase 200-d weight and decrease cow weight areexpected to be changed rapidly toward fixation, whereasallele frequencies at loci with directionally similar effectson the component traits should be much less stronglyinfluenced (Falconer, 1989). As a consequence, the ge-netic correlation between 200-d weight and cow weightin a line selected for the ratio may be more positiveafter a few generations of selection than before, therebymaking long-term genetic change in the ratio more diffi-cult. The theoretical effect on the genetic correlation hasbeen tested experimentally several times, with decidedlymixed results (e.g., Sheridan and Barker, 1974; Archer etal., 2003). Estimates of genetic correlations of maternaleffects on 200-d weight with the direct effects on either200-d weight (−0.06 ± 0.09) or cow weight (−0.14 ± 0.08)were not significantly different from zero in these data.Permanent and temporary environmental effects associ-ated with cows, either as repeated observations of weightof the cow when her calf was weaned or of weight of hercalves at weaning, explained significant fractions of thephenotypic variance in both 200-d weight and cow weight(0.08 ± 0.02, 0.16 ± 0.01, 0.13 ± 0.02, and 0.28 ± 0.02,respectively). Correlations between permanent and tem-porary environmental effects were −0.49 ± 0.11 and 0.13± 0.03, respectively. The posterior mean of the pheno-typic correlation between 200-d weight and cow weightwas 0.20.
The regression of 200-d weight on cow weight afteradjusting both weights for contemporary group effectswas nonlinear (P = 0.05) and the y-intercept of the regres-sion line was positive (P < 0.01), complicating interpreta-tion of the ratio. Figure 3 illustrates the relationshipbetween cow weight and 200-d weight of her calf asimplied by the ratio vis a vis the relationship derivedfrom the data via regression. Estimates of genetic trendsin 200-d weight and cow weight for the control line andin response to selection on the ratio of 200-d weight tocow weight are shown in Figures 4 and 5, respectively.In the control line, the regressions of breeding value ongeneration number for direct and maternal 200-d weightwere not significant (−1.28 ± 0.91 and 0.62 ± 0.92 kg/generation, respectively), and the regression of directbreeding value for cow weight on generation numberwas negative −5.72 ± 2.80 kg/generation. In the lineselected for the ratio of calf 200-d weight to cow weight atweaning, the regressions of breeding value on generationnumber for direct and maternal effects on 200-d weightwere 1.43 ± 0.79 and 2.90 ± 0.80 kg/generation, respec-tively, and the genetic trend in cow weight was not differ-ent from zero (−2.79 ± 2.43 kg/generation).

M. D. MacNeil800
Figure 3. Relationships between 200-d weight of a calfand mature equivalent weight of the dam as measuredby their phenotypic ratio (---) and by regression of calfweight on cow weight (—).
Because the ratio was considered a trait of the calf,the estimated maternal genetic effects on the ratio con-tain both genetic effects due to dams that environmen-tally affect performance of their progeny and direct ge-netic effects on the reciprocal of cow weight. Thus, thepositive trend in maternal genetic effects on the ratio(Figure 2) observed in the selected line may arise fromboth the positive genetic trend in maternal effects on200-d weight and the nonsignificant, but complimentary,negative trend in direct effects on cow weight. However,no maternal genetic trend was observed for the ratio inthe control line, as the significant negative trend in directeffects on cow weight was offset in part by a nonsignifi-cant positive trend in maternal effects on 200-d weight.Similar caution is relevant when interpreting parameterestimates relating other phenotypes to the ratio.
Figure 4. Trends in direct and maternal breeding valuesfor calf 200-d weight in a line selected for increased valuesof the ratio of calf 200-d weight to mature-equivalent cowweight and a randomly selected control line.
Figure 5. Trends in direct breeding values for mature-equivalent cow weight in a line selected for increasedvalues of the ratio of calf 200-d weight to mature-equiva-lent cow weight and a randomly selected control line.
To further examine the relationships between the ra-tio and it components, additional bivariate analyses wereconducted with the ratio and its numerator and denomi-nator. When the relationship between the ratio and its200-d weight was examined in these data, correlationsbetween direct, permanent environmental, and residualeffects were all large (0.95 ± 0.01, 0.82 ± 0.03, and 0.79± 0.02, respectively). The correlation between maternaleffects was smaller, 0.53 ± 0.6, perhaps due in part tothe negative covariance of maternal genetic effects on200-d weight and direct effects on cow weight. The poste-rior mean phenotypic correlation between the ratio andits numerator was 0.62. Correlations of direct effects oncow weight with both direct and maternal effects on theratio were −0.87 ± 0.02 and −0.80 ± 0.03, respectively.Likewise, the correlations between permanent and tem-porary environmental effects on cow weight and the ratiowere also large and negative: −0.81 ± 0.04 and −0.55 ±0.02, respectively. The correlation between direct effectson cow weight and the ratio, largely reflective of thecorresponding correlation between direct effects on cowweight and 200-d weight, was 0.82 ± 0.02. Thus, theposterior mean phenotypic correlation between cowweight and the ratio was −0.62, which is approximatelyequivalent to that predicted following Sutherland (1965).
The mean estimate of phenotypic variance for birthweight in the posterior distribution was 32.0 kg2. Esti-mates of heritability for direct and maternal genetic ef-fects on birth weight were 0.46 ± 0.04 and 0.10 ± 0.02,somewhat greater and less than the corresponding aver-age estimates from the literature reported by Koots etal. (1994a), and similar to those reported for this popula-tion by MacNeil et al. (2003). Genetic correlations be-tween direct effects on birth weight and both direct andmaternal effects on the ratio were large: 0.72 ± 0.05and −0.60 ± 0.05, respectively. Genetic correlations ofmaternal genetic effects on birth weight with direct and

Calf weight to cow weight ratio 801
Figure 6. Trends in direct and maternal breeding valuesfor birth weight in a line selected for increased values ofthe ratio of calf 200-d weight to mature-equivalent cowweight and a randomly selected control line.
maternal genetic effects on the ratio and with directgenetic effects on birth weight were small, 0.15 ± 0.11,−0.03 ± 0.10, and −0.05 ± 0.11, respectively. As in Mac-Neil et al. (2003), permanent environmental effects onbirth weight due to dams were essentially nil, and tempo-rary environmental effects accounted for 45 ± 3% of totalvariance. Correlations of permanent and temporary en-vironmental effects on the ratio and birth weight were0.19 ± 0.24 and 0.18 ± 0.04, respectively. Genetic trendsin birth weight for the control line and in response toselection on the ratio of 200-d weight of the calf to theweight of its dam at weaning are shown in Figure 6.Only the regression of direct genetic effects on generationnumber in the selected line (0.13 ± 0.06 kg/generation)differed from zero.
The mean estimate of phenotypic variance for 365-d weight in the posterior distribution was 1,467 kg2.Estimates of heritability for direct and maternal geneticeffects on 365-d weight were 0.58 ± 0.04 and 0.10 ± 0.02.These estimates of the heritability of direct and maternalgenetic effects on 365-d weight are greater than andsimilar to, respectively, the average of literature esti-mates reported by Koots et al. (1994a). Genetic correla-tions between direct effects on 365-d weight and bothdirect and maternal effects on the ratio were large, 0.87± 0.02 and −0.77 ± 0.03, respectively. Genetic correlationsof maternal genetic effects on 365-d weight with directeffects on the ratio and on 365-d weight were both small,−0.13 ± 0.11 and −0.22 ± 0.09, respectively. However,the genetic correlation between maternal effects wassizeable, 0.48 ± 0.08, perhaps owing to the relative smallvariance in maternal genetic effects on 365-d weight.Permanent and temporary environmental effects on 365-d weight due to dams accounted for 0.06 ± 0.01 and0.33 ± 0.03 of total variance, respectively. Correlationsof permanent and temporary environmental effects onthe ratio and 365-d weight were 0.82 ± 0.05 and 0.56 ±
Figure 7. Trends in direct and maternal breeding valuesfor calf 365-d weight in a line selected for increased valuesof the ratio of calf 200-d weight to mature-equivalent cowweight and a randomly selected control line.
0.03, respectively. Trends in direct and maternal geneticeffects on 365-d weight resulting as correlated responsesto selection for the ratio are shown in Figure 7. Onlythe regression of maternal genetic effects on generationnumber in the selected line (0.95 ± 0.32 kg/generation)differed from zero.
Use of Bayesian methods in this research was origi-nally motivated by the anticipated nonnormal distribu-tion of the ratio phenotype (Fieller, 1932; Hinkley, 1969)and the potential for differences in inference to resultfrom using Bayesian vs. frequentist approaches (Blasco,2001). However, means of the parameter estimates andtheir associated standard deviations from the posteriordistribution of Gibbs samples were generally similar tothose produced using REML, with standard errors ap-proximated following Dodenhoff et al. (1988), either inpreliminary analyses or reported previously by MacNeil(2003). The difference in heritability estimate for directeffects on 200-d weight reported here vs. the one reportedby MacNeil (2003), 0.48 ± 0.03 vs.0.30 ± 0.04, is moststriking. However, the present estimate was consistentwith the preliminary REML results, and the differencebetween models used in the two REML analyses lies inmature-equivalent cow weight used as a correlated traithere vs. the function 365-d weight − 3.2(birth weight)used previously.
The ratio of calf weaning weight to cow weight is likelynot the contemporary phenotype of choice on which tobase a selection program. Its use arose during an erawhen genetic improvement programs were based on aculture of only measuring weights and trying to extractthe most information from them. The ratio undoubtedlyhad and continues to have some intuitive appeal due toits ease of measurement and perceived relationship withefficiency. In this research, phenotypic selection for theratio of a calf’s 200-d weight to the mature equivalentweight of its dam resulted in a significant genetic trend

M. D. MacNeil802
being established for maternal effects on the ratio. Inaddition, significant correlated responses were observedin direct effects on birth weight, direct and maternaleffects on 200-d weight, and maternal effects on 365-dweight. No significant genetic trend in mature equiva-lent cow weight was observed. However, a significantnegative genetic trend in direct effects on cow weightwas observed in the control line, and if this trend resultedfrom natural selection, rather than drift, it might beinferred that selection for the ratio would affect cowweight positively.
Implications
Selection for a ratio is complicated by shifting empha-sis given to the component traits. Phenotypic selectionfor the ratio of calf weaning weight to cow weight isfurther complicated by measurement of the two compo-nent phenotypes on different individuals and the conse-quent confounding of direct and maternal genetic effectson these phenotypes. Thus, selection index procedureswould seemingly yield a more defined criterion, withclear and consistent emphasis on the traits and theirgenetic components. Results of this experiment illus-trated the complexity of anticipating response to selec-tion when the criterion is a ratio.
Literature Cited
Archer, M. A., J. P. Phelan, K. A. Beckman, and M. R. Rose. 2003.Breakdown in correlations during laboratory evolution. II. Selec-tion on stress resistance in Drosophila populations. Evolution57:536–543.
BIF. 1996. Guidelines for Uniform Beef Improvement Programs. 7thed. C. Bailey, ed. Beef Improv. Fed., Colby, KS.
Blasco, A. 2001. The Bayesian controversy in animal breeding. J. Anim.Sci. 79:2023–2046.
Boldman, K. G., L. A. Kriese, L. D. VanVleck, C. P. VanTassell, andS. D. Kachman. 1995. A Manual for use of MTDFREML. A setof programs to obtain estimates of variances and covariances(DRAFT). ARS, USDA, Washington, DC.
Brinks, J. S., R. T. Clark, N. M. Kieffer, and J. J. Urick. 1964. Estimatesof genetic, environmental and phenotypic parameters in rangeHereford females. J. Anim. Sci. 20:903. (Abstr.)
Cartwright, T. C. 1970. Selection criteria for beef cattle for the future.J. Anim. Sci. 30:706–711.
Cunningham, E. P. 1974. Breeding goals for beef cattle. Ann. Genet.Sel. Anim. 6:219–226.
Davis, M. E., J. J. Rutledge, L. V. Cundiff, and E. R. Hauser. 1983.Life cycle efficiency of beef production: II. Relationship of cowefficiency ratios to traits of the dam and progeny weaned. J. Anim.Sci. 57:852–866.
Dickerson, G. E., N. Kunzi, L. V. Cundiff, R. M. Koch, V. H. Arthaud,and K. E. Gregory. 1974. Selection criteria for efficient beef pro-duction. J. Anim. Sci. 39:659–673.
Dinkel, C. A. 1988. The interaction of cow size with growth potentialof the service sire. Can. J. Anim. Sci. 68:129–137.
Dinkel, C. A., and M. A. Brown. 1978. An evaluation of the ratio ofcalf weaning weight to cow weight as an indicator of cow efficiency.J. Anim. Sci. 46:614–617.
Dodenhoff, J., L. D. Van Vleck, S. D. Kachman, and R. M. Koch. 1988.Parameter estimates for direct, maternal, and grandmaternal
effects for birth weight and weaning weight in Hereford cattle.J. Anim. Sci. 76:2521–2527.
Falconer, D. S. 1989. Introduction to Quantitative Genetics. 3rd ed.Longham Scientific and Technical, Essex, U.K.
Fieller, E. C. 1932. The distribution of the index in a normal bivariatepopulation. Biometrika 24:428–440.
Fitzhugh, H. A. 1978. Animal size and efficiency, with special referenceto the breeding female. Anim. Prod. 27:393–401.
Graser, H.-U., S. P. Smith, and B. Tier. 1987. A derivative free approachfor estimating variance components in animal models by re-stricted maximum likelihood. J. Anim. Sci. 64:1362–1370.
Gunsett, F. C. 1987. Merit of utilizing the heritability of a ratio topredict genetic change of a ratio. J. Anim. Sci. 65:936–942.
Hinkley, D. V. 1969. On the ratio of two correlated normal randomvariables. Biometrika 56:635–639.
Koch, R. M., L. V. Cundiff, and K. E. Gregory. 1994. Cumulativeselection and genetic change for weaning or yearling weight orfor yearling weight plus muscle score in Hereford cattle. J. Anim.Sci. 72:864–885.
Koots, K. R., J. P. Gibson, C. Smith, and J. W. Wilton. 1994a. Analysesof published genetic parameter estimates for beef productiontraits. 1. Heritability. Anim. Breed. Abstr. 62:309–338.
Koots, K. R., J. P. Gibson, and J. W. Wilton. 1994b. Analyses of pub-lished genetic parameter estimates for beef production traits. 2.Phenotypic and genetic correlations. Anim. Breed. Abstr.62:825–853.
MacNeil, M. D. 2003. Genetic evaluation of an index of birth weightand yearling weight to improve efficiency of beef production. J.Anim. Sci. 81:2425–2433.
MacNeil, M. D., and M. D. Grosz. 2002. Genome-wide scans for QTLaffecting carcass traits in Hereford × composite double backcrosspopulations. J. Anim. Sci. 80:2316–2324.
Newman, J. A., G. W. Rahnefeld, and H. T. Fredeen. 1973. Selectionintensity and response to selection for yearling weight in beefcattle. Can. J. Anim. Sci. 53:1–12.
Newman, S., M. D. MacNeil, W. L. Reynolds, B. W. Knapp, and J. J.Urick. 1993a. Fixed effects in the formation of a composite lineof beef cattle: I. Experimental design and reproductive perfor-mance. J. Anim. Sci. 71:2026–2032.
Newman, S., M. D. MacNeil, W. L. Reynolds, B. W. Knapp, and J. J.Urick. 1993b. Fixed effects in the formation of a composite lineof beef cattle: II. Pre- and postweaning growth and carcass compo-sition. J. Anim. Sci. 71:2033–2039.
Raftery, A. E., and S. M. Lewis. 1996. Implementing MCMC. Pages115–130 in Markov Chain Monte Carlo in Practice. W. R. Gilks,D. J. Spiegelhalter and S. Richardson, ed. Chapman and Hall,London, U.K.
Rogers, P. L., C. T. Gaskins, K. A. Johnson, and M. D. MacNeil. 2004.Evaluating longevity of composite beef females using survivalanalysis techniques. J. Anim. Sci. 82:860–866.
Sheridan, A. K., and J. S. Barker. 1974. Two-trait selection and thegenetic correlation. II. Changes in the genetic correlation duringtwo-trait selection. Aust. J. Biol. Sci. 27:89–101.
Smith, S. P., and H.-U. Graser. 1986. Estimating variance componentsin a class of mixed models by restricted maximum likelihood. J.Dairy Sci. 69:1156–1165.
Sutherland, T. M. 1965. The correlation between feed efficiency andrate of gain, a ratio and its denominator. Biometrics 21:739–749.
Van Tassell, C. P., and L. D. Van Vleck. 1996. Multiple-trait Gibbssampler for animal models: Flexible programs for Bayesian andLikelihood-based (co)variance component inference. J. Anim. Sci.74:2586–2597.
Weil, W. B. 1962. Adjustment for size—A possible misuse of ratios.Am. J. Clin. Nutr. 11:249–252.
Willham, R. L. 1972. The role of maternal effects in animal breeding:III. Biometrical aspects of maternal effects in animals. J. Anim.Sci. 35:1288–1293.