Embed Size (px)
Citation preview

ORIGINAL ARTICLE
Genetic Diversity and Population Structure of a Medicinal HerbHouttuynia cordata Thunb. of North-East India
Sushmita Gupta1,2 & Raju Bharalee3
Received: 22 July 2019 /Accepted: 6 November 2020# Springer Science+Business Media, LLC, part of Springer Nature 2020
AbstractIntra-species genetic variability assessment is an effective tool in formulating genetic improvement and germplasm conservationstrategies.Houttuynia cordata Thunb. is a semidomesticatedmedicinal herb consumedwidely in traditional diet in North-EasternIndia. In the present study, an effort has been made to assess the genetic diversity ofH. cordata Thunb. from Brahmaputra valleyof North-East India. A total of 545 genotypes from 18 populations of H. cordata Thunb. from four different regions, i.e. North-East, North-West, South-East and South-West, with respect to river Brahmaputra were collected and population genetic diversityand structure were analysed using ISSR molecular markers. Population genetic structure analysis using unweighted pair groupmethod with averages (UPGMA)-based hierarchical cluster analysis, principal coordinate analysis (PCoA) and model-basedclustering in STRUCTURE program revealed that the population of H. cordata Thunb. grouped according to regional distribu-tion and forms four genetically distinct clusters. The analysis of molecular variance showed that differentiation among regionswas significant with 60% genetic variation among region, 3% genetic variation among population within region and 37% geneticvariation within population.We found wide variation in Nei’s gene diversity (Hj) ranging from 0.07782 inMargherita populationto 0.13634 in Barapani population. Furthermore, Nei’s gene diversity within population (Nei’s Hs) and total gene diversity (Ht)were found to be 0.1081 and 0.1769 respectively. The genetic differentiation among 18 population was high (Fst = 0.3894;p < 0.001) with relatively restricted gene flow (Nm = 0.6564). Based on the result of this study, we suggest ex situ conservationcould be an appropriate measure to adequately capture the total genetic diversity ofH. cordata Thunb. populations of North-EastIndia by selecting few individuals from different populations.
Keywords Houttuynia cordataThunb. . Genetic diversity . Population structure .Medicinal plants . ISSRmarkers
Introduction
Houttuynia cordata Thunb. is a perennial herbaceous medic-inal plant distributed in Japan, China, Korea, and SoutheastAsia and the Himalayas. In India, it is mainly distributed inNorth-Eastern states including Assam, Meghalaya, Manipur,Tripura, Mozoram, Arunachal Pradesh and Sikkim(Bhattacharyya and Sharma 2010). The plant prefers to growin moist and shady habitat (Alves et al. 2013; Wei and Wu2012). A study conducted in North-East India has indicatedthat the plant requires a special moist habitat having clay loamsoil with higher organic carbon (0.85 ± 0.05%), average soilpH 5.9 and 78% soil moisture (Bhattacharyya and Sharma2010). It is the only member of the genus Houttuynia underthe family Saururaceae (Fang 1981; Tseng 1982). The plant ispopularly known by different common names like Chameleonplant, fish wort or heart leaf, and Chinese lizard tail. It iswidely used for ornamental (Frank and Dana 2012), culinary
Key Message• Higher genetic diversity was observed between populations of differentregions compared to same region.• Studied populations are grouped into four clusters according to theirgeographical regions.
• Low gene flow was observed among studied populations.
* Raju [email protected]
1 Present address: Environment and Industrial BiotechnologyDivision, The Energy and Resources Institute, North EasternRegional Centre, Guwahati, Assam, India
2 Life Science Division, Institute of Advanced Study in Science andTechnology, Paschim Boragaon, Garchuk, Guwahati, Assam, India
3 Department of Molecular Biology and Biotechnology, CottonUniversity, Guwahati, Assam, India
https://doi.org/10.1007/s11105-020-01260-9
/ Published online: 14 November 2020
Plant Molecular Biology Reporter (2021) 39:434–442

and medicinal purposes (Wu et al. 2002). Mature plants ofH. cordata Thunb. are 30–60 cm tall, with horizontal rhi-zomes or stolons that connect the erect aerial stems. The ter-minal inflorescences consist of dense spikes (1.5–2.5 cm long)of very small flowers without petals, but each inflorescencehas four bracts at the base which resembles a single flower.The leaves are heart-shaped, cordate with a sheathing base,measuring up to 10 cm long and 6 cm wide, usually green butcan turn into purplish colour when exposed to sunlight. Thefruits are tiny (2–3 mm long) with 9 to 18 apomictic seeds ineach (Alves et al. 2013). Sexual reproduction has not beenreported for this plant (Wei and Wu 2012). It mainly repro-duces through vegetative propagation by producing abundantrhizomes or stolons and by parthenogenesis (Mihara 1960;Shibata and Miyake 1908).
All parts of the plants are edible with high medicinal prop-erties and have been used traditionally for curing various hu-man diseases (Bhattacharyya and Sharma 2010). Differentstudies indicate that H. cordata Thunb. contains abundantnutrients and active components including volatile oils, flavo-noids and water-soluble polysaccharides (Li et al. 2005; Caoand Wang 2005). In addition, H. cordata Thunb. exhibits awide range of pharmaceutical activities including antibacterial(Lu et al. 2006a; Kim et al. 2008), antiviral (Hayashi et al.1995; Liu et al. 2010; Chen et al. 2011; Yin et al. 2011), anti-inflammatory (Lu et al. 2006b; Shin et al. 2010; Li et al. 2011;Kim et al. 2012), immunologic (Lau et al. 2008), anticancer(Zhou et al. 2012; Lai et al. 2010), antioxidative (Chen et al.2003; Toda 2005) and anti-mutagenic (Chen et al. 2004) ef-fects. The extract ofH. cordata Thunb. has been demonstratedto have immunomodulatory and anti-SARS (severe acute re-spiratory syndrome) activities (Lu et al. 2006b; Lau et al.2008). Also, it was reported to inhibit human immunodefi-ciency virus type 1 (HIV-1) and herpes simplex virus type 1(HSV-1) (Hayashi et al. 1995). In North-East India, it is widelyused by local tribes as ethno medicine (Sarkar 1993; Bora2001; Khongsai et al. 2011). It is eaten raw by local tribalpeople for lowering blood sugar level (Marles andFarnsworth 1995). The juices of leaf are traditionally usedfor treatment of diseases like cholera, dysentery and anaemiaand purification of blood (Laloo and Hemalatha 2011).
There is no record of organized cultivation of this medici-nal plant, and therefore, it is mostly harvested from its wildhabitat. With the growth of commercial demand in the recentyears, the plant is being indiscriminately harvested from wildresulting in habitat destruction, population decrease and re-duction in its genetic diversity (Zhong et al. 2009). Manystudies from China have reported genetic diversity ofH. cordata Thunb. based on morphological features, isozyme,chromosome number and ISSR markers (Wu et al. 2002,2003; Wei and Wu 2012; Zhong et al. 2016). But until now,no study has targeted the genetic diversity and populationstructure of this important medicinal plant in North-East
India, although this information is essential for the formula-tion of any effective conservation strategies. In the presentwork, 18 populations of H. cordata Thunb. from differentregions of North-East India were analysed using ISSR markerto study their genetic diversity, differentiation and structure.We then used these results to describe genetic diversity andpopulation structure and to infer whether any gene flowamong these populations occurs. The information generatedin the present study on population genetics of H. cordataThunb. could be used to plan adequate conservation actions.
Materials and Methods
Population Sampling and DNA Extraction
In the present study, 18 populations of H. cordata Thunb.(28–32 individuals per population) were sampled from 18locations of North-East India during 2012 and 2013 (Fig. 1,Table 1). All these collection sites are largely distributed onNorthern and Southern bank of river Brahmaputra. We divid-ed our sampling areas into four regions with respect to theriver Brahmaputra. These regions are (1) North-Eastern regionwhich includes Nalbari (NB), Dhemaji (DM), Itanagar (IN),Kokrajhar (KJ) and North Lakhimpur (NL); (2) South-Western region which includes Cherapunji (CP), ShoraShella (SS), Mawlai (ML), Barapani (BP) and Laitryngew(LG); (3) South-Eastern region which includes Nagaon(NG), Margherita (MR), Golaghat (GG), Tinsukia (TS),Guwahati (GW) and Jeypore (JP) and (4) North-Western re-gion which includes Kalimpong (KP) and Gangtok (GT).From each of the sampling site, random sampling was donecovering an area of about 2-km radius. While collecting theleaf samples from each of the population, care was taken tomaintain a minimum distance of at 0.3 km among sampledindividuals to avoid sampling clonal relatives. Young leavesfor DNA extraction were collected in zip-lock polybags, tem-porarily stored on ice until brought to the laboratory for stor-age at − 80 °C. The DNA from leaf was extracted followingthe procedure described by Doyle (1991).
ISSR Fingerprinting
ISSR fingerprinting was done according to Wu et al. (2005),with minor modifications. Twenty-two ISSR primers werescreened against 18 populations, taking two individuals ran-domly from each population. The PCR reaction was set in a10 μl reaction volume using 20 ng of template DNA. ThePCR reaction mixture contains 10× reaction buffer—1 μl,2.5 mM dNTPs—0.6 μl, 10 mM primers—2 μl, templateDNA—20 ng, Taq DNA polymerase (1 U/μl)—0.5 μl andnuclease-free water—to make the final volume 10 μl. ThePCR profile used include initial denaturation at 94 °C for
435Plant Mol Biol Rep (2021) 39:434–442

Fig. 1 Distribution of the field sampling sites in North-East India.Sampling area was divided into four regions: North-Western; North-Eastern; South-Western; South-Eastern, with respect to river
Brahmaputra. The pie diagrams on the left shows the results ofAMOVA where AP = among populations, WP = within populations,AR = among regions. Full name of the populations is given in Table 1
Table 1 Localities and sizes of the 18 H. cordata Thunb. populations sampled in this study
Sampling locality Population ID Latitude (N) Longitude (E) Altitude (m) Sample size Region
Nalbari, Assam NB 26.468° 91.418° 50.697 32 North-East
Dhemaji, Assam DM 27.491° 94.547° 105.879 32 North -East
Itanagar, Arunachal Pradesh IN 27.092° 93.612° 342.662 32 North-East
Kokrajhar, Assam KJ 26.404° 90.293° 45.000 29 North-East
North Lakhimpur, Assam NL 27.229° 94.125° 89.701 31 North-East
Cherapunji, Meghalaya CP 25.300° 91.700° 1487.867 30 South-West
Shora Shella, Meghalaya SS 25.166° 91.646° 60.849 29 South-West
Mawlai, Meghalaya ML 25.607° 91.880° 1390.885 28 South-West
Barapani, Meghalaya BP 25.688° 91.914° 1042.133 29 South-West
Laitryngew, Meghalaya LG 25.234° 91.732° 1138.626 29 South-West
Gangtok, Sikkim GT 27.342° 88.597° 1218.575 29 North-West
Kalimpong (Teesta Valley), Sikkim KP 27.119° 88.488° 460.615 30 North-West
Margherita, Assam MR 27.295° 95.684° 138.394 30 South-East
Tinsukia, Assam TS 27.449° 95.328° 120.456 31 South-East
Golaghat, Assam GG 26.508° 93.969° 101.504 31 South-East
Nagaon, Assam NG 26.268° 92.672° 62.358 29 South-East
Jeypore, Assam JP 27.146° 95.362° 135.848 32 South-East
Guwahati, Assam GW 26.161° 91.660° 52.053 32 South-East
436 Plant Mol Biol Rep (2021) 39:434–442
3 min followed by 35 cycles of 94 °C for 1 min, 50 °C for1 min and 72 °C for 2 min and a final extension of 72° for10 min. After PCR, the amplified products were resolved in1.3% agarose gel and photograph was taken in a gel doc forscoring. Low Range DNA Ruler Plus (Genie, Cat. No.2662770501730) was used to determine the fragments sizesfor scoring. To create a binary matrix, amplified fragments of100 to 1200 bp were scored visually from printed gel photosas having present (1), absent (0), or ambiguous (?). Only dis-tinct bands were scored as present, and the manual scoringprocedure was repeated twice on separate occasions to reducescoring errors.
Genetic Data Analysis
In the present study, all the genetic diversity and differentia-tion statistics were computed using AFLP-SURV v 1.0 pro-gram (Vekemans 2002; Vekemans et al. 2002). Bayesianmethod with non-uniform prior distribution of allele frequen-cies was used to estimate band frequency distribution(Zhivotovsky 1999) followed by genetic diversity analysiswithin and between population (Lynch and Milligan 1994).Banding pattern across population, proportion of polymorphicloci (PPL) at 5% level, Nei’s gene diversity (Hj), Shannondiversity index (I), Wright fixation index, Fst (Weir andCockerham 1984), population differentiation (Gst) and geneflow (Nm = 0.5(1 − Gst)/Gst) were also computed inGenAlEx V6.5 (Peakall and Smouse 2006, 2012) andPOPGENE v1.32 (Yeh et al. 1997).
To differentiate among populations, AMOVA was com-puted in GenAlEx v6.5 using 9999 permutations. TheUPGMA (Sokal and Michener 1958) method was used forcluster analysis among populations. Nei’s minimum distancematrix (Nei 1972, 1978) as obtained from AFLP-SURV v1.0was used for computing UPGMA clustering analysis with10,000 bootstrap analysis of cluster relationships usingNEIGHBOR module in the PHYLIP v 3.695 (Felsenstein2008) software package.
Principal coordinate analysis (PCoA) was performed basedon Nei’s minimum distance matrix (Nei 1978) in GenAlEx v6.5. Population structure was determined using the programSTRUCTURE v 2.3.3 (Falush et al. 2007) which statisticallydetermines the probability of an individual to be included in ahomogenous cluster (K populations) without prior populationinformation. The correlated band frequencies and admixedmodel were applied with a burn-in-period of 100,000 and1,000,000 MCMC replicates after burn-in. The range of clus-ters (K) was given from 1 to 18. FromK = 1 toK = 10, ten runswere performed, whereas for K > 10, five runs were per-formed. The detection of the most-likely K was done accord-ing to Evanno et al. (2005), which uses LnP(D) to get infor-mation about most probable number of groups and calculate
height of the modal value of the ΔK distribution to detect themost-likely K (Evanno et al. 2005).
Results
Understanding of the genetic diversity and population struc-ture is very much essential to plan any conservation or geneticimprovement program for any species. A total of ten bestISSR primers (S1 Table) that showed reproducible polymor-phic amplification during screening step were used to analyse545 individual genotypes of H. cordata Thunb. covering 18populations, resulted in 137 markers. The number of bandsamplified ranged from 28 to 47 with an average of 40.7 bandsper population. The band pattern across these 18 populationsis given in supplementary information 2 and Fig. 2.
Population Genetic Structure
Hierarchical cluster analysis (UPGMA) revealed that popula-tions sampled from South-West, North-West and North-Eastregions of Brahmaputra valley were grouped separately(Fig. 3). Cluster I, with a bootstrap value of 100%, includedall the populations of South-West region of Bramaputra val-ley. Cluster I can be divided into two groups, viz., group Icontains two populations (CP and LG), whereas group II con-tains the remaining 3 populations (ML, BP, SS). Cluster II,with a bootstrap value of 100%, included all the populationssampled from North-East region of the Brahmaputra valley.Cluster III, with a bootstrap value of 100%, contained the twopopulations (GT andKP) sampled fromNorth-Western regionof the valley. The UPGMA clustering also revealed that all thepopulations from Northern Region were well separated fromthe populations of Southern region of Brahmaputra valley.The remaining South-Eastern populations could not begrouped into a single cluster where population MRwas foundto be grouped with NG. The principal coordinate analysis alsorevealed that populations of H. cordata Thunb. grouped ac-cording to regional distribution with Northern populations(KJ, NB, DM, IN and NL) well separated from Southern pop-ulations (BP, ML, CP, LG and SS) (Fig. 4), which is consis-tent with the results of UPGMA-based cluster analysis.Furthermore, our model-based clustering analysis using pro-gram STRUCTURE (Pritchard et al. 2000; Falush et al. 2003;Evanno et al. 2005) showed likelihood of LnP(D) was greatestwhenK = 4.We found that forK > 4, LnP(D) increased slight-ly but more or less plateaued (Fig. 5a), i.e. ΔK reached itsmaximum at K = 4 (Fig. 5b), thus indicating that all our se-lected populations can be included into one of the four clus-ters, which interestingly corresponds to the geographic distri-bution of these populations (Fig. 1).
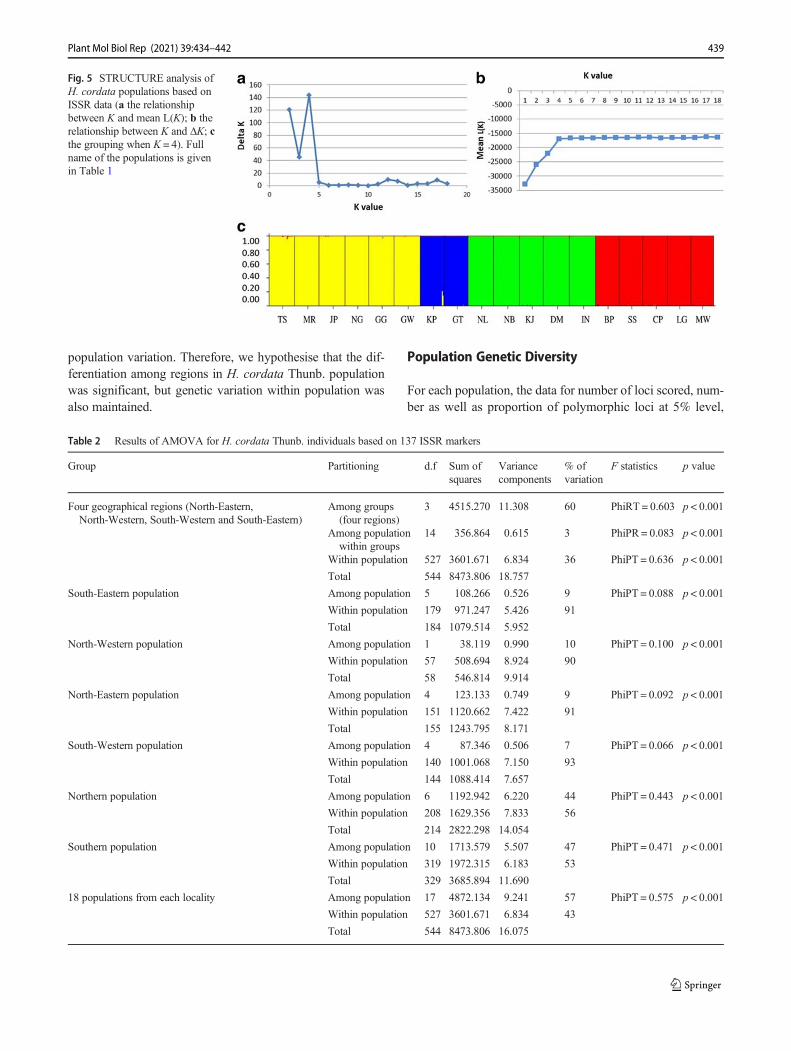
The analysis of molecular variance indicated that majorityof genetic variation (60%) occurred among regions, while
437Plant Mol Biol Rep (2021) 39:434–442

variations among population within region and within popu-lation were found to be 3% and 37% respectively (Fig. 1).Interestingly, AMOVA showed high genetic variation withinpopulation (91%) than that of among populations (9%) when
the South-Eastern population was treated as one group. Also,similar type of result was observed for the North-Western,North-Eastern and South-Western populations (Table 2),which may be one of the reasons for populations getting clus-tered together based on their regions. When the North-Western and North-Eastern populations were pooled together,AMOVA calculated higher genetic variation within popula-tion (56%), while variation among population was 44%.Similar types of results were also obtained when South-Western and South-Eastern populations were pooled togetherwith variation within population (53%) more than variationsamong populations (47%). Moreover, when we pooled all the18 populations together as one group and estimated variationamong and within population, we found Fst value to be 0.575(P < 0.001) with 57% variation among populations and 43%within populations. This finding thus suggests that inter-population variation was comparatively more than intra-
Fig. 2 Total band patterns across populations of H. cordata. no. Bands,number of different bands; No. Bands Freq. >=5%, number of differentbands with a frequency ≥ 5%; no. Private Bands, number of bands uniqueto a single population; no. LComm Bands (<=25%), number of locallycommon bands (Freq. ≥ 5%) found in 25% or fewer populations; no.
LComm Bands (<=50%), number of locally common bands (Freq. ≥50%) found in 50% or fewer populations; He, expected gene diversity;uHe, unbiased expected gene diversity. Full name of the populations isgiven in Table 1
Fig. 3 UPGMA tree of 18 H. cordata populations (numbers indicatebootstrap support values). Full name of the populations is given inTable 1
Fig. 4 Principal coordinate analysis of 18 H. cordata populations, basedon Nei’s unbiased genetic distances. Horizontal and vertical scalesrepresent the first and second principal axes of variation respectively(the two axes that explain the most variations among populations). Herethe first principal axis represents a large 60.61% of variation, the secondaxis represents 23.59% of variation. Full name of the populations is givenin Table 1
438 Plant Mol Biol Rep (2021) 39:434–442
population variation. Therefore, we hypothesise that the dif-ferentiation among regions in H. cordata Thunb. populationwas significant, but genetic variation within population wasalso maintained.
Population Genetic Diversity
For each population, the data for number of loci scored, num-ber as well as proportion of polymorphic loci at 5% level,
Table 2 Results of AMOVA for H. cordata Thunb. individuals based on 137 ISSR markers
Group Partitioning d.f Sum ofsquares
Variancecomponents
% ofvariation
F statistics p value
Four geographical regions (North-Eastern,North-Western, South-Western and South-Eastern)
Among groups(four regions)
3 4515.270 11.308 60 PhiRT = 0.603 p < 0.001
Among populationwithin groups
14 356.864 0.615 3 PhiPR = 0.083 p < 0.001
Within population 527 3601.671 6.834 36 PhiPT = 0.636 p < 0.001
Total 544 8473.806 18.757
South-Eastern population Among population 5 108.266 0.526 9 PhiPT = 0.088 p < 0.001
Within population 179 971.247 5.426 91
Total 184 1079.514 5.952
North-Western population Among population 1 38.119 0.990 10 PhiPT = 0.100 p < 0.001
Within population 57 508.694 8.924 90
Total 58 546.814 9.914
North-Eastern population Among population 4 123.133 0.749 9 PhiPT = 0.092 p < 0.001
Within population 151 1120.662 7.422 91
Total 155 1243.795 8.171
South-Western population Among population 4 87.346 0.506 7 PhiPT = 0.066 p < 0.001
Within population 140 1001.068 7.150 93
Total 144 1088.414 7.657
Northern population Among population 6 1192.942 6.220 44 PhiPT = 0.443 p < 0.001
Within population 208 1629.356 7.833 56
Total 214 2822.298 14.054
Southern population Among population 10 1713.579 5.507 47 PhiPT = 0.471 p < 0.001
Within population 319 1972.315 6.183 53
Total 329 3685.894 11.690
18 populations from each locality Among population 17 4872.134 9.241 57 PhiPT = 0.575 p < 0.001
Within population 527 3601.671 6.834 43
Total 544 8473.806 16.075
Fig. 5 STRUCTURE analysis ofH. cordata populations based onISSR data (a the relationshipbetween K and mean L(K); b therelationship between K and ΔK; cthe grouping when K = 4). Fullname of the populations is givenin Table 1
439Plant Mol Biol Rep (2021) 39:434–442
Nei’s gene diversity (Hj) etc. are given in supplementary in-formation 3. The Nei’s gene diversity (Hj) ranged from0.07782 (PLP = 21.2%) in population MR to 0.13634(PLP = 32.1%) in population BP. Thus, high variability wasobserved in all populations collected from South-West regionwhereas low variability was recorded in population fromSouth-East region of Brahmaputra valley. The mean Nei’sgene diversity within population (or Nei Hs) was found tobe 0.1081 (supplementary information 4). Moreover, totalgene diversity (Ht), i.e. gene diversity among population,was found to be 0.1769 (supplementary information 5). Theaverage gene diversity within population (Hw) and averagegene diversity among population (Hb) or genetic differentia-tion among population were found to be 0.1081 and 0.0689respectively. Furthermore, Wright fixation index (Fst) show-ing the proportion of the total gene diversity that occursamong as opposed to within population was found to be0.3894. When the populations were divided into four clustersbased on STRUCTURE analysis (supplementary information6), Nei’s gene diversity (Hj) was found to be 0.0776, 0.1199,0.1057 and 0.1257 respectively for South-Eastern, North-Western, North-Eastern and South-Western populations.Similarly, Shannon diversity index (I value) for the four clus-ters was found to be 0.1174, 0.1866, 0.1588 and 0.1829 re-spectively for South-Eastern, North-Western, North-Easternand South-Western populations. When North-Western andNorth-Eastern populations were pooled together, Nei’ genediversity (Hj) was found to be 0.1492 with the Shannon di-versity index value of 0.2393. Furthermore, when South-Eastern and South-Western populations were pooled together,Nei’s gene diversity (Hj) was found to be 0.1296 with theShannon diversity index value of 0.2049.
Population Genetic Distance and Gene Flow
The 18 populations of H. cordata Thunb. in the present studyshowed high and significant genetic differentiation (Fst =0.3894, P < 0.001; Gst = 0.4324). However, the estimatedgene flow, Nm (Nm = 0.5(1 −Gst)/Gst), was found to be0.6564 which suggests that although the genetic differentia-tion among studied populations is significant, there may below migration rate among populations. We also calculatedgenetic differentiation and gene flow for the four groups sep-arately (based on UPGMA tree, PCoA and STRUCTUREanalysis results) and found that Gst, among all South-Eastern populations, was 0.0715 and Nm was 6.4974.Similarly, Gst among North-Western population was 0.0825and Nm was 5.5591. The Gst among North-Eastern andSouth-Western populations was 0.0764 and 0.0586 with Nmvalue of 6.0474 and 8.0384 respectively. These results indi-cate weak genetic differentiation and frequent gene flow with-in the genotypes of all the regions. When the North-Westernand North-Eastern populations were pooled together, the Gst
value among population was 0.3263 and Nm was 1.0324which indicates that there is significant genetic differentiationamong the populations of North-Eastern and North-Westernregions and that the gene flow is restricted. We also pooled theSouth-Eastern and South-Western populations together andcalculated their respective Gst and Nm values. Interestingly,we found Gst to be 0.2868 and Nm value was 1.2433. Thus,gene flow was slightly more among South-Eastern and South-Western populations compared to between North-Eastern andNorth-Western populations.
Discussion
Population Genetic Diversity
In the present study, ISSR-based analysis of H. cordataThunb. populations revealed overall high genetic diversity(Ht = 0.1769). This corroborates with results obtained byWei and Wu (2012) in which they reported genetic variationand population differentiation of 15 populations ofH. cordataThunb. in central, South Eastern and South Western China.Generally, it is believed that genetic diversity of asexuallyreproducing plants is low (Hamrick and Golt 1990).However, several studies on asexually reproducing plantssuch as Leymus ch inens i s (Zu and Cui 2002) ,Cyclobalanopsis glauca (Chen and Song 1997) andPotamogeton malianus (Chen et al. 2006) suggest that geneticdiversity of asexually reproducing plants can also be veryhigh. Moreover, we observed comparatively high averagegene diversity within population (Hw = 0.1081) than amongpopulations (Hb = 0.0689). Similar results were also obtainedby Wei and Wu (2012) using ISSR marker and Wu et al.(2002) using RAPD marker.
Population Structure and Gene Flow
The results of the hierarchical and model-based cluster analy-ses of ISSR data strongly suggested that the 18 sampled pop-ulations of H. cordata Thunb. could be grouped into fourclusters based on the regions of sample collection—South-Western, North-Eastern, North-Western and South-Eastern re-gions of Brahmaputra river regardless of the approach used forgenetic structure analyses. AMOVA also clearly indicated thatthe genetic variation within population among regions wasmuch higher than that among populations within region.This similarity between the clustering pattern and geographi-cal distribution of populations of H. cordata Thunb. suggestscontinued gene flow among populations of the same region(Schaal et al. 1998) and restricted gene flow between popula-tions of different regions. We found high genetic differentia-tion but restricted gene flow between populations which weregeographically fragmented (Gst = 0.4324, Nm = 0.6564) due
440 Plant Mol Biol Rep (2021) 39:434–442
to the river Brahmaputra. Since H. cordata Thunb. is a short,small plant and reported to propagate mostly by formation andseparation of underground stems or parthenogenesis (Mihara1960), the probability of gene flow via seed and pollen dis-persal is very low. Moreover, polyploidy complex ofH. cordata Thunb. with 36 to 126 chromosomes (Wu et al.2002) will hinder gene exchanges among populations withdifferent chromosome numbers (Wu et al. 2005). These factssuggest that the observed pattern of genetic differentiation andpopulation structure may not be due to ongoing gene flowrather due to historical association among populations.Earlier studies have suggested that during late tertiary to earlyquaternary period, H. cordata Thunb. survived and adaptedthrough asexual reproduction in the central and southern areasof the Northern hemisphere (Liang 1995). Furthermore, dur-ing glacial maxima,H. cordata Thunb. was restricted in smallclimatically stable refugia areas in small population size(Liang 1995), the genetic consequence of which may be highlevel of genetic drift (Barrett and Kohn 1991; Ellstrand andElam 1993). This could be one reason for observed high ge-netic variation between regions and low genetic variationamong population within region. Similar explanation was alsosuggested by Zhong et al. 2016, where they investigated ge-netic diversity and population structure of H. cordata Thunb.from China using sequence-related amplified polymorphism(SRAP) marker.
Conclusion
In conclusion, we observe that the total genetic diversity ofH. cordata Thunb. was high with higher genetic differentia-tion between populations of different regions compared topopulation of the same region in North-East India. The ob-served genetic structure may probably be due to genetic driftof small isolated populations promoting high genetic variationbetween population of different regions than between popula-tion of same region. Therefore, it is important for conservationplanners to devise conservation strategies for conservation ofmaximum possible numbers of population from all the regionsrather than focusing on a few targeted populations. We, there-fore, suggest to target genotypes from as many populationspossible rather than few selected populations for ex situ or insitu conservation of wild populations of H. cordata Thunb. inthe North-Eastern region of India.
Supplementary Information The online version contains supplementarymaterial available at https://doi.org/10.1007/s11105-020-01260-9.
Acknowledgements The authors are thankful to Director, IASST,Paschim Boragaon, Guwahati, Assam, for providing laboratory facilitiesand Dr. T Bandyopadhyay for proof-reading of the manuscript.
Funding This work received funding from the Department ofBiotechnology, Govt. of India under DBT-RA Scheme.
References
Alves RJV,MedeirosD,Moura RL, Gusmao LCT, SilvaNG,AntunesK,Matozinhos C, Blanco MA (2013) First report of naturalization ofHouttuynia cordata Thunb. 1783 (Piperales: Saururaceae) in SouthAmerica. Check List 9(3):642–644
Barrett SCH, Kohn JK (1991) Genetic and evolutionary consequences ofsmall population size in plants: implications for conservation. In:Falk DA, Holsinger KE (eds) Genetics and conservation of rareplants. Oxford University Press, New York
Bhattacharyya N, Sharma S (2010) Assessment of availability, ecologicalfeature, and habitat preference of the medicinal herb Houttuyniacordata Thunb. in the Brahmaputra Valley of Assam, India.Environ Monit Assess 160:277–287
Bora C (2001) Ethnobotany of lower Subansiri District (Nishi Tribe) ofArunachal Pradesh, India. Ph.D. Thesis, Gauhati University, Assam,India
Cao H, Wang SY (2005) The chemical constituent of H. cordata and theprospect of development. J Southeast Guizhou Natl Teach Coll 23:20–22
Chen XY, Song YC (1997) Clonal diversity in Cyclobalanopsis glaucapopulations and its relationship with environmental factors. Chin JPlan Ecol 21(4):342–348
Chen YY, Liu JF, Chen CM, Chao PY, Chang TJ (2003) A study of theantioxidative and antimutagenic effects of Houttuynia cordataThunb. using an oxidized frying oil-fed model. J Nutr SciVitaminol 49:327–333
Chen L, Wu W, Zheng YL (2004) HPLC analysis on dissociative aminoacids of Houttuynia. Amino Acids Biot Resour 1:20–24
Chen Y, Li Q, WuW, Li W (2006) Genetic diversity and clonal structureof Potamogeton malaianus populations. Ying Yong Sheng Tai XueBao 17:2034–2040
Chen X,Wang Z, Yang Z,Wang J, Xu Y, Tan R, Li E (2011)Houttuyniacordata blocks HSV infection through inhibition of NF-kB activa-tion. Antivir Res 92:341–345
Doyle J (1991) DNA protocols for plants. In: Hewitt GM, JohnstonAWB, Young JPW (eds) Molecular techniques in taxonomy.Springer, Berlin, Heidelberg, pp 283–293
Ellstrand NC, ElamDR (1993) Population genetic consequences of smallpopulation size: implication for plant conservation. Annu Rev EcolSyst 24:217–242
Evanno G, Regnaut S, Goudet J (2005) Detecting the number of clustersof individuals using the software STRUCTURE: a simulation study.Mol Ecol 14:2611–2620
Falush D, StephensM, Pritchard JK (2003) Inference of population struc-ture using multilocus genotype data: linked loci and correlated allelefrequencies. Genet 164(4):1567–1587
Falush D, StephensM, Pritchard JK (2007) Inference of population struc-ture using multilocus genotype data: dominant markers and nullalleles. Mol Ecol Notes 7:574–578
Fang WP (1981) Flora Sichuanica. Sichuan People Press, Chengdu, pp126–127
Felsenstein J (2008) PHYLIP: phylogeny inference package, version3.68, Seattle, WA: University of Washington. Available: http://evolution.gs.washington.edu/phylip.html. Accessed on 19 Jul 2019
Frank KA, Dana MN (2012) Spreading ornamental plants: virtues &vices. Lands Hort 1:1–4
Hamrick JL and Golt MJW (1990) Allozyme diversity in plant species.In: Plant population genetics, breeding and genetic resources
441Plant Mol Biol Rep (2021) 39:434–442
(BrownAHD, CleggMJ and Kahler AL, eds.). Sinauer, Sunderland,43–63
Hayashi K, Kamiya M, Hayashi T (1995) Virucidal effects of the steamdistillate from Houttuynia cordata and its components on HSV-1,influenza virus, and HIV. Planta Med 61:237–241
Khongsai M, Saikia SP, Kayang H (2011) Ethnomedicinal plants used bydifferent tribes of Arunachal Pradesh. Indian J Tradit Knowl 10(3):541–546
Kim GS, Kim DH, Lim JJ, Lee JJ, Han DY, Lee WM, Jung WC, MinWG, Won CG, Rhee MH, Lee HJ, Kim S (2008) Biological andantibacterial activities of the natural herb Houttuynia cordata waterextract against the intracellular bacterial pathogen salmonella withinthe RAW 264.7 macrophage. Biol Pharm Bull 31:2012–2017
Kim D, Park D, Kyung J, Yang YH, Choi EK, Lee BY, Kim HK, HwangBY, Kim YB (2012) Anti-inflammatory effects of Houttuyniacordata supercritical extract in carrageenan-air pouch inflammationmodel. Lab Anim Res 28:137–140
Lai KC, Chiu YJ, Tang YJ, Lin KL, Chiang JH (2010) Houttuyniacordata Thunb. extract inhibits cell growth and induces apoptosisin human primary colorectal cancer cells. Anticancer Res 30:3549–3556
Laloo D, Hemalatha S (2011) Ethnomedicinal plants used for diarrhea bytribals of Meghalaya, Northeast India. Pharmacogn Rev 5(10):147–154
Lau KM, Lee KM, Koon CM, Cheung CS, Lau CP et al (2008)Immunomodulatory and anti-SARS activities of Houttuyniacordata. J Ethnopharmacol 118:79–85
Li GZ, Chai OH, Lee MS, Han EH, Kim HT, Song CH (2005) Inhibitoryeffects of Houttuynia cordata water extracts on anaphylactic reac-tion and mast cell activation. Biol Pharm Bull 28:1864–1868
Li W, Zhou P, Zhang Y, He L (2011) Houttuynia cordata, a novel andselective COX-2 inhibitor with anti-inflammatory activity. JEthnopharmacol 133:922–927
Liang HX (1995) On the evolution and distribution in Saururaceae. ActaBot Yunnanica 17(3):255–267
Liu FZ, Shi H, Shi YJ, Liu Y, Jin YH, Gao YJ, Guo SS, Cui XL (2010)Pharmacodynamic experiment of the antivirus effect of Houttuyniacordata injection on influenza virus in mice. Acta Pharm Sin 45(3):399–402
Lu H, Wu X, Liang Y, Zhang J (2006a) Variation in chemical composi-tion and antibacterial activities of essential oils from two species ofHouttuynia cordata Thunb. Chem Pharm Bull 54:936–940
Lu HM, Liang YZ, Yi LZ, Wu XJ (2006b) Anti-inflammatory effect ofHouttuynia cordata injection. J Ethnopharmacol 104:245–249
Lynch M, Milligan BG (1994) Analysis of population genetic structurewith RAPD markers. Mol Ecol 3:91–99
Marles RJ, Farnsworth NR (1995) Antidiabetic plants and their activeconstituents. Phytomedicine 2:137–189
Mihara T (1960) On the reduction division ofHouttuynia cordata Thunb.Bot Mag Tok 73:498–498
Nei M (1972) Genetic distance between populations. Am Nat 106(949):283–292
Nei M (1978) Estimation of average heterozygosity and genetic distancefrom a small number of individuals. Genet 89(3):583–590
Peakall R, Smouse PE (2006) GenAlEx 6 - Genetic analysis in Excel.Population genetic software for teaching and research. Mol EcolNotes 6:288–295
Peakall R, Smouse PE (2012) GenAlEx 6.5: Genetic analysis in Excel.Population genetic software for teaching and research – an update.Bioinf 28:2537–2539
Pritchard JK, Stephens M, Donnelly P (2000) Inference of populationstructure using multilocus genotype data. Genet 155(2):945–959
Sarkar S (1993) Studies on herbaceous plants of Karbi Anglong Districtof Assamwith reference to their taxonomy and economic utilization.Ph.D. Thesis, Gauhati University, Assam, India
Schaal BA, Hayworth DA, Olsen KM, Rauscher JT, Smith WA (1998)Phylogeographic studies in plants: problems and prospects. MolEcol 7:465–474
Shibata K, Miyake H (1908) Ueber Parthenogenesis bei Houttuyniacordata. Bot Mag Tok 22:141–144
Shin S, Joo SS, Jeon JH, Park DS, Jang MJ, Kim TO, Kim HK, HwangBY, Kim KY, Kim YB (2010) Anti-inflammatory effects of aHouttuynia cordata supercritical extract. J Vet Sci 11(3):273–275
Sokal RR, Michener CD (1958) A statistical method for evaluating sys-tematic relationships. Univ Kansas Sci Bull 38:1409–1438
Toda S (2005) Antioxidative effects of polyphenols in leaves ofHouttuynia cordata on protein fragmentation by copper-hydrogenperoxide in vitro. J Med Food 8:266–268
Tseng YC (1982) Florae Reipublicae Popularis Sinicae. Science Press,Beijing, p 8
Vekemans X (2002) AFLP-SURV version 1.0. Distributed by the author.Laboratoire de Genetique et Ecologie Vegetale, Universite Libre deBruxelles, Belgium. Available:http://www.ulb.be/sciences/lagev/aflp-surv.html
Vekemans X, Beauwens T, Lemaire M, Roldan-Ruiz I (2002) Data fromamplified fragment length polymorphism (AFLP) markers showindication of size homoplasy and of a relationship between degreeof homoplasy and fragment size. Mol Ecol 11:139–151
Wei L,Wu X (2012) Genetic variation and population differentiation in amedical herb Houttuynia cordata in China revealed by inter-simplesequence repeats (ISSRs). Int J Mol Sci 13:8159–8170
Weir BS, CockerhamCC (1984) Estimating F-statistics for the analysis ofpopulation structure. Evolution 38(6):1358–1370
Wu W, Zheng Y, Chen L, Yang R, Yan Z, Wei Y (2002) Isozymesvariations among the germplasm resources of Houttuynia inSichuan. J Chin Med Mat 25:695–698
Wu W, Zheng YL, Yang RW, Chen L, Wei YM (2003) Variation of thechromosome number and cytomixis of Houttuynia cordata fromChina. Acta Phytotaxonomica Sin 41(3):245–257
Wu W, Zheng YL, Chen L, Wei YM, Yang RW, Yan ZH (2005)Evaluation of genetic relationships in the genus HouttuyniaThunb. in China based on RAPD and ISSR markers. BiochemSyst Ecol 33:1141–1157
Yeh FC, Yang RC, Boyle T (1997) POPGENE version 1.31, the user-friendly shareware for population genetic analysis. MolecularBiology and Biotechnology Center, University of Alberta,Edmonton, Canada. Available: http://www.ualberta.ca/fyeh/index.htm. Accessed 19 Jul 2019
Yin J, Li G, Li J, Yang Q, Ren X (2011) In vitro and in vivo effects ofHouttuynia cordata on infectious bronchitis virus. Avian Pathol 40:491–498
Zhivotovsky LA (1999) Estimating population structure in diploids withmultilocus dominant DNA markers. Mol Ecol 8:907–913
Zhong J, Wang K, Qiu P (2009) Genetic diversity of populations ingermplasm resources of Houttuynia cordata Thunb. Acta AgricBoreali-Sin 24:94–100
Zhong J, Wu FC, Qiu P, Dai LJ (2016) Correlation analysis of geneticdiversity and population structure of Houttuynia cordata Thunbwith regard to environment. Genet Mol Res 15(3)
Zhou NN, Tang J, Chen WD, Feng GK, Xie BF, Liu ZC, Yang D, ZhuXF (2012) Houttuyninum, an active constituent of Chinese herbalmedicine, inhibits phosphorylation of HER2/neu receptor tyrosinekinase and the tumor growth of HER2/neu overexpressing cancercells. Life Sci 90:770–775
Zu YG, Cui JZ (2002) Clonal diversity in Leymus chinensis populations.Acta Phytoecol Sin 26:157–162
Publisher’s Note Springer Nature remains neutral with regard to jurisdic-tional claims in published maps and institutional affiliations.
442 Plant Mol Biol Rep (2021) 39:434–442