Embed Size (px)
Citation preview

HAL Id: pasteur-02082203https://hal-pasteur.archives-ouvertes.fr/pasteur-02082203
Submitted on 28 Mar 2019
HAL is a multi-disciplinary open accessarchive for the deposit and dissemination of sci-entific research documents, whether they are pub-lished or not. The documents may come fromteaching and research institutions in France orabroad, or from public or private research centers.
L’archive ouverte pluridisciplinaire HAL, estdestinée au dépôt et à la diffusion de documentsscientifiques de niveau recherche, publiés ou non,émanant des établissements d’enseignement et derecherche français ou étrangers, des laboratoirespublics ou privés.
Distributed under a Creative Commons Attribution| 4.0 International License
Genetic determinants of anti-malarial acquiredimmunity in a large multi-centre study
Jennifer Shelton, Patrick Corran, Paul Risley, Nilupa Silva, ChristinaHubbart, Anna Jeffreys, Kate Rowlands, Rachel Craik, Victoria Cornelius,
Meike Hensmann, et al.
To cite this version:Jennifer Shelton, Patrick Corran, Paul Risley, Nilupa Silva, Christina Hubbart, et al.. Genetic deter-minants of anti-malarial acquired immunity in a large multi-centre study. Malaria Journal, BioMedCentral, 2015, 14, pp.333. �10.1186/s12936-015-0833-x�. �pasteur-02082203�

Shelton et al. Malar J (2015) 14:333 DOI 10.1186/s12936-015-0833-x
RESEARCH
Genetic determinants of anti-malarial acquired immunity in a large multi-centre studyJennifer M G Shelton1, Patrick Corran2,3, Paul Risley3, Nilupa Silva3, Christina Hubbart1, Anna Jeffreys1, Kate Rowlands1, Rachel Craik1, Victoria Cornelius1, Meike Hensmann1, Sile Molloy1, Nuno Sepulveda2, Taane G Clark2, Gavin Band1, Geraldine M Clarke1, Christopher C A Spencer1, Angeliki Kerasidou5, Susana Campino4, Sarah Auburn1, Adama Tall6, Alioune Badara Ly6, Odile Mercereau‑Puijalon7, Anavaj Sakuntabhai8,9, Abdoulaye Djimdé10, Boubacar Maiga10, Ousmane Touré10, Ogobara K Doumbo10, Amagana Dolo10, Marita Troye‑Blomberg11, Valentina D Mangano12, Frederica Verra12, David Modiano12, Edith Bougouma13, Sodiomon B Sirima13, Muntaser Ibrahim14, Ayman Hussain14, Nahid Eid14, Abier Elzein14, Hiba Mohammed14, Ahmed Elhassan14, Ibrahim Elhassan14, Thomas N Williams15,16, Carolyne Ndila15, Alexander Macharia15, Kevin Marsh15, Alphaxard Manjurano2,17, Hugh Reyburn2,17, Martha Lemnge18, Deus Ishengoma18, Richard Carter19, Nadira Karunaweera20, Deepika Fernando20, Rajika Dewasurendra20, Christopher J Drakeley2,17, Eleanor M Riley2,17, Dominic P Kwiatkowski1,4*, Kirk A Rockett1,4* and In collaboration with the MalariaGEN Consortium1,4,21
Abstract
Background: Many studies report associations between human genetic factors and immunity to malaria but few have been reliably replicated. These studies are usually country‑specific, use small sample sizes and are not directly comparable due to differences in methodologies. This study brings together samples and data collected from mul‑tiple sites across Africa and Asia to use standardized methods to look for consistent genetic effects on anti‑malarial antibody levels.
Methods: Sera, DNA samples and clinical data were collected from 13,299 individuals from ten sites in Senegal, Mali, Burkina Faso, Sudan, Kenya, Tanzania, and Sri Lanka using standardized methods. DNA was extracted and typed for 202 Single Nucleotide Polymorphisms with known associations to malaria or antibody production, and antibody levels to four clinical grade malarial antigens [AMA1, MSP1, MSP2, and (NANP)4] plus total IgE were measured by ELISA techniques. Regression models were used to investigate the associations of clinical and genetic factors with antibody levels.
Results: Malaria infection increased levels of antibodies to malaria antigens and, as expected, stable predictors of anti‑malarial antibody levels included age, seasonality, location, and ethnicity. Correlations between antibodies to blood‑stage antigens AMA1, MSP1 and MSP2 were higher between themselves than with antibodies to the (NANP)4 epitope of the pre‑erythrocytic circumsporozoite protein, while there was little or no correlation with total IgE levels. Individuals with sickle cell trait had significantly lower antibody levels to all blood‑stage antigens, and recessive homozygotes for CD36 (rs321198) had significantly lower anti‑malarial antibody levels to MSP2.
© 2015 Shelton et al. This article is distributed under the terms of the Creative Commons Attribution 4.0 International License (http://creativecommons.org/licenses/by/4.0/), which permits unrestricted use, distribution, and reproduction in any medium, provided you give appropriate credit to the original author(s) and the source, provide a link to the Creative Commons license, and indicate if changes were made. The Creative Commons Public Domain Dedication waiver (http://creativecommons.org/publicdomain/zero/1.0/) applies to the data made available in this article, unless otherwise stated.
Open Access
*Correspondence: [email protected]; [email protected] 4 Wellcome Trust Sanger Institute, Wellcome Trust Genome Campus, Hinxton, Cambridge CB10 1SA, UKFull list of author information is available at the end of the article

Page 2 of 18Shelton et al. Malar J (2015) 14:333
BackgroundDespite many years of research and intervention, malaria remains a major global health concern. Approximately half of the world’s population is at risk, and in 2013 there were 207 million estimated cases of malaria and 627,000 deaths [1]. Malaria has been described as the strongest evolutionary force in the recent history of the human genome (reviewed in [2]) and exerts a selective pressure that has resulted in a number of genetic adaptations. These adaptations predominantly cause erythrocyte defects, which affect the binding, invasion and growth of malaria parasites; however, there is also evidence to sug-gest that genetic factors influencing humoral immune responses may account for differences in susceptibility to malaria [3].
A number of studies have investigated the heritability of antibody responses against specific malaria antigens. For example, Sjoberg et al. [4] found that antibody response to ring-infected erythrocyte surface antigen (RESA) is more concordant between monozygotic twins than either dizygotic twins or age- and sex-matched siblings in Libe-ria and Madagascar. In Burkina Faso sibling correlations were observed for IgG and IgG subclass responses to RESA, merozoite surface protein 1 (MSP1), MSP2 and Plasmodium falciparum extract, whilst parent-offspring correlations were observed for IgG responses to MSP2 [5]. A study in Papua New Guinea found substantial her-itability for IgG subclass responses to RESA and MSP2 and showed that this genetic variation was not domi-nated by a single major gene, suggesting multifactorial inheritance for IgG responses to malaria antigens [6–8].
Genetic variability in host immune response genes may account for differences in susceptibility to malaria between sympatric ethnic groups. For example, Luoni et al. [9] found in Mali that the IL4-524 T allele, associ-ated with immunoglobulin (Ig) switching from IgG/IgM to IgE, is significantly more common in Fulani than in Mossi or Rimaibe and is associated with significantly higher IgG levels to CSP and Pf332 malaria antigens [9]. Also in Mali, differences in IgG sub-class levels have been seen between the Fulani and Dogon [10, 11] for the immunoglobulin receptor FcRIIa 131 (R/H) and the IL4-590 polymorphisms.
Many such immune-epidemiological studies are coun-try-specific and have involved relatively small sample
sizes providing different lines of evidence that have not always been independently replicated. To address this problem a large multi-centre study was undertaken to explore the associations between host genetic factors and their immune responses to malaria antigens at ten locations in Senegal, Mali (2 sites), Burkina Faso, Sudan, Kenya, Tanzania (3 sites), and Sri Lanka. Each site pro-vided serum, DNA and clinical data. Standardized meth-ods were used to genotype 202 polymorphisms (with previous malaria or antibody associations) and four IgG antibody levels to the malaria antigens AMA1, MSP1, MSP2, (NANP)4, plus total IgE levels. Despite the chal-lenges of combining data from these heterogeneous study designs and backgrounds, a resource of 13,299 individu-als was created to look for consistent genetic effects on anti-malarial antibodies.
MethodsEthical approvalEthical approval was granted separately for each study by their respective Ethics Review Committee (see Addi-tional file 1) Ethical approval was also granted to Malaria-GEN by the Oxford Tropical Research Ethics Committee. Informed consent was obtained from all participants before data or samples were collected.
Study designsStudies were conducted at ten sites in seven countries across West Africa, East Africa and Asia; details of study design at individual sites and local epidemiological con-ditions including malaria endemicity are described else-where (see [12–18]). Each site provided a DNA sample, serum sample and clinical data for participants collected at a single time point; at several sites these were pro-vided as part of an ongoing study, while at others these were provided from a new study or as an extension to an earlier study. The clinical parameters measured at each site were influenced by study design, which varied con-siderably (Additional files 1 and 2). Sites either collected cross-sectional data only, longitudinal data only or a combination of both.
Clinical data collectionAt the outset investigators selected a core set of clini-cal parameters to be collected by all sites, taking into
Conclusion: Although the most significant finding with a consistent effect across sites was for sickle cell trait, its effect is likely to be via reducing a microscopically positive parasitaemia rather than directly on antibody levels. How‑ever, this study does demonstrate a framework for the feasibility of combining data from sites with heterogeneous malaria transmission levels across Africa and Asia with which to explore genetic effects on anti‑malarial immunity.
Keywords: Malaria, Antibody, Sickle cell trait, HbAS, CD36, Genotype

Page 3 of 18Shelton et al. Malar J (2015) 14:333
account variations in study design and implementa-tion, and agreed on methods for recording these clini-cal measurements to encourage uniformity across the data. These clinical parameters were chosen based on their previous association with malaria infection or anti-malarial immune responses (Additional file 2). Data were submitted to the MalariaGEN resource centre where it was uploaded into a secure central database (no per-sonal information was stored by MalariaGEN or used in any analyses). Once uploaded the data were converted to standardized units, formatted and combined with clini-cal data from other sites to create a full normalized and consistent dataset.
Sample collectionBlood samples were collected from participants by veni-puncture into plain tubes for serum separation or EDTA-coated tubes for DNA extraction. The volume of blood collected varied from <1 ml to 10 ml depending on the clinical settings and ethical permissions of the indi-vidual sites. Clinical data were also collected from each participant at the time of sampling and each participant was assigned a unique identification code to allow their samples and clinical records to be matched for statistical analysis.
DNA extraction and genotypingDNA extraction was performed at each site using the local method of choice; either Nucleon™ BACC Genomic Extraction Kits (GE Lifesciences, [19]) or Qia-gen DNeasy Blood Kits (Qiagen, Crawley, UK, [20]), and DNA samples were then shipped frozen to the Malaria-GEN resource centre in Oxford. Sequenom iPLEX Gold (Agena Bioscience, CA, USA) was chosen for genotyp-ing because of its high-throughput capacity, flexibility for assay design and ability to genotype up to 40 SNPs (Sin-gle Nucloetide Polymorphisms) in one reaction. Multi-plexes were designed using MassARRAY® Assay Design software (Agena Bioscience) and assays with poor perfor-mance or concordance were removed from the multiplex during testing. A total of 202 SNP-assays were designed. These included a set of 65 that have been analysed in a severe malaria case–control study across 11 countries [21] plus a further 137 autosomal SNPs selected in genes associated with or described as playing a role in malaria and antibody production (Additional file 3 contains details of the gene regions and SNPs assay multiplexes; Additional file 4 contains further details of the genotyp-ing methodology).
Measurement of immune responsesAll study sites supplied serum or plasma samples to a central repository established at the National Institute
for Biological Standards and Control (NIBSC). Samples were divided into two aliquots and stored at −80 °C in individually barcoded tubes (Matrix systems, Thermo Fisher Scientifics, Horsham, UK) and racks. Before stor-age, a 5-µl aliquot was removed and diluted to 50 µl in PBS-0.2 % (w/v) sodium azide in a storage plate in order to characterize each sample. This characterization took the form of assaying specific antibody levels to the recombinant P. falciparum erythrocytic stage parasite proteins apical membrane antigen 1 (AMA1), merozoite surface protein 2 (MSP2) and merozoite surface protein 1, 19 kDa fragment (MSP119). In addition, antibodies to a synthetic peptide (NANP)4 representing the major B cell epitope repeat of the circumsporozoite protein (CSP) of P. falciparum, and the amount of total IgE, were meas-ured. Assays were carried out using a single uniform combined protocol for all samples.
AntigensRecombinant AMA1 (3D7 sequence) [22], MSP2 (3D7 sequence) [23] and MSP119 (Wellcome sequence) [24] were all of vaccine quality. AMA1 was kind gift of Alan Saul (Malaria Vaccine Development Unit, NIAID, USA), MSP2 of Robin Anders (La Trobe University, Melbourne, Australia) and MSP119 of Shirley Longacre (Pasteur Insti-tute, Paris, France). The 16 residue synthetic peptide (Asn-Ala-Asn-Pro)4 (NANP)4 was a kind gift of Eric Ton-gren (CDC, Atlanta, USA).
Serum referencesA reference plasma pool obtained from 20 malaria-exposed adults in the Gambia (Brefet4 pool) [25] was used as a P. falciparum standard on each plate coated with malaria antigen and the IgE reference serum, 75/502 (NIBSC), was used for IgE determinations. The negative control serum was a pool of 40 European individuals who had never been exposed to malaria.
ELISAELISA was carried out as previously described [25] and as detailed in Additional file 4 Briefly, ELISA plates (Immu-lon 4-HBX, Fisher Scientific UK Ltd, Loughborough, UK) were coated with antigen (50 µl in 0.05 M sodium car-bonate pH 9.6) at a concentration of 0.5 µg/ml (AMA1, MSP2 and IgE) or 1 µg/ml (MSP119 and (NANP)4) or anti-human IgE MAb (M107 from Mabtech AB, Nacka Strand, Sweden) (50 µl of 1 µg/ml), incubated overnight at 4 °C, washed three-fold with PBS-0.05 % Tween 20 (PBS/T) (Sigma, Gillingham, Dorset, UK), blocked with 200 µl of blocking solution (2 % skimmed milk powder in PBS/T) for 3 h at ambient temperature and washed three times with PBS/T. Samples of each characteriza-tion sample (see above) were diluted in blocking solution

Page 4 of 18Shelton et al. Malar J (2015) 14:333
and aliquots added in duplicate to plates as follows : 50 µl of 1:200 final dilution for (NANP)4-coated plates; 50 µl of 1:1,000 final dilution for MSP119, MSP2 and IgE and 100 µl of 1:2,000 for AMA1 plates. After overnight incubation at 4 °C, plates were washed six times with PBS/T, 50 µl of horseradish peroxidise-conjugated rab-bit anti-human IgG (DAKO) (1:5,000 in PBS/T) added to each well and plates incubated for 3 h at room tem-perature. Following six-fold washing in PBS/T, 100 µl of Sigma-Fast o-phenylenediamine dihydrochloride (OPD) reagent solution (Sigma) was added to each well. Plates were developed at room temperature for 10–15 min (20–30 min for (NANP)4 ELISA), the reaction stopped by addition of 25 µl 2 M H2SO4 and plates read in a plate reader (Molecular Devices, Wokingham, Berkshire, UK) at 492 nm. A standard curve was fitted to the reference serum data obtained for each antigen as previously out-lined [25] with the reference serum assigned an arbitrary concentration of 1,000 U/ml for all antigens. Plate values were normalized using the standard curves, and sample antibody concentrations (in U/ml) were calculated (see Additional file 4). For the Tanzania (Moshi) ELISAs, only three values were obtained, those for AMA1, MSP119 and MSP2, using independently expressed preparations of the same antigens (see Additional file 4).
Determination of malaria statusThick and/or thin blood films were used to determine malaria status and all data were transformed to a stand-ard parasites/µl.
Data cleaningTo create the final dataset for analysis the clinical, genetic and antibody data were merged based on the unique ID code assigned to each participant at the time of sam-pling. Entries that did not contain all three data compo-nents after merging were removed. Duplicated ID codes were resolved if the correct entry could be identified, otherwise both entries were removed. This gave a data-set with 15,216 individuals. Records where gender miss-matched between clinical and genetic gender or DNA samples with <90 % pass rate across 65 core SNP assays [21] were also removed (540 miss-matched gender, 1,237 <90 % pass-rate and 140 both miss-matched gender and pass-rate), leaving 13,299 individuals in the merged data-set eligible for analysis. This dataset was then used to quality control the remaining 137 SNP-assays, removing assays with pass rates <80 % across all samples (n = 3). Assays for SNPs monomorphic across all sites (n = 18) or Amelogenin [gender determining (n = 3)] were also removed from further analysis leaving a total of 178 SNPs for analysis (65 core and 113 extra).
Antibody titres were log base 10 transformed to obtain approximate normal distributions for parametric analy-ses. Once logged all anti-malarial antibodies showed some evidence of a bimodal distribution, while IgE lev-els showed a negatively skewed distribution (Additional file 5). In the MSP-1 data (Additional file 5) a number of individuals were identified (log10 titre of 4.85, n = 216) that were not measured correctly due to technical diffi-culties. These were removed and excluded from further analyses. Plots of the residuals from the regression anal-yses (see below) were made (Additional file 6) in order to check that the antibody data were normally distributed.
Statistical analysisAll analyses were carried out using the statistical package R [26, 27]. Standard linear regression models were used to investigate associations between non-genetic factors and antibody levels at all sites combined. Covariates were included in the main analyses if they were collected by all sites and were associated with antibody levels; parasite density and bed-net use were not covariates in this model as they were not measured at all sites; separate regres-sion models were run for the subset of sites that provided these data. Details of the linear regression models used are given in Additional file 7.
Tests of association between each SNP and antibody levels with adjustment for age, gender, malaria status, ethnicity, village, and sample month were run using standard linear regression models at each site under a variety of modes of inheritance: additive, dominant, recessive, and heterozygote (Additional file 7). Results at each site were meta-analysed to obtain the effect of genotype on antibody level. Meta-analysis provided a beta coefficient and p-value for each SNP-antibody asso-ciation using each model. A standard Bonferroni correc-tion based on analysis of association between 178 SNPs and antibody levels to 5 antigens would give threshold for significance of 6 × 10⁻⁵. A more accurate signifi-cance threshold would need to take into account the level of linkage disequilibrium between SNPs, but this is difficult to estimate across multiple different popu-lations. The Bonferroni significance threshold should, therefore, be regarded as an approximation and probably over-conservative.
Logistic regression was used to investigate the effect of SNPs with significant SNP-antibody associations on microscopic malaria infection, adjusted for relevant clini-cal parameters (Additional file 7). Data from Senegal, Mali (Pongonon), Sudan and Sri Lanka were not included in this analysis as their study populations were either entirely microscopically negative or entirely microscopi-cally positive for malaria at the time of sampling.

Page 5 of 18Shelton et al. Malar J (2015) 14:333
Linear regression was used to investigate the effect of SNPs with significant SNP-antibody associations on parasite density, adjusted for relevant clinical parameters (Additional file 7). Data from Senegal, Kenya, Sudan, and Sri Lanka were not included in this analysis as parasite density was not recorded at these sites.
In all regression models, age was included as a grouped rather than continuous variable to allow for a non-linear relationship with antibody levels. Sample month was included as a covariate in regression models as a proxy for rainy season, the timing of which varied between sites.
ResultsEpidemiological factorsA number of study designs were used across sites; Mali (Manteourou), Burkina Faso and Tanzania studies col-lected data during their malaria transmission season, Mali (Pongonon) included only individuals positive for
malaria, Senegal and Sudan based data collection on active case detection, Kenya collected data as part of a birth cohort study at aged 7 years-old, and Sri Lanka fol-lowed up individuals that had been malaria positive in 1992/93. Further details can be found in Table 1, Addi-tional file 1 and the MalariaGEN Website [18]. After data curation and quality control (see “Methods”), 13,299 individuals were included for analysis (Table 1) for five antibodies and 178 SNPs. At all sites the ratio of males to females was approximately 1:1. The number of ethnic groups within a site varied, and individuals belonging to the Fulani ethnic group (referred to here as Peulh) were collected in Senegal, Manteourou in Mali and Burkina Faso. Altitude ranged from sea level (0 m) in the coastal town of Kilifi in Kenya to 1,845 m in the mountain-ous areas of Moshi in Tanzania, and reported bed net usage ranged from 16.5 % in Burkina Faso to 95.7 % in Sri Lanka. In Senegal, Sudan and Mali (Pongonon) the malaria prevalence given in Table 1 was affected by data
Fig. 1 Proportion of individuals microscopically Plasmodium falciparum positive. Data shown are for the six sites for which surveys sampled across different age groups. Studies not included here include: Mali (Pongonon) where only malaria positive were included, Kenya (where only one age group was sampled) and Sudan and Sri Lanka were all negative at the time of survey.

Page 6 of 18Shelton et al. Malar J (2015) 14:333
Tabl
e 1
Det
ails
of
part
icip
atio
n, g
ende
r ra
tio,
age
dis
trib
utio
n, e
thni
city
bre
akdo
wn,
alt
itud
e ra
nge,
bed
net
usag
e, m
alar
ia p
reva
lenc
e an
d st
udy
desi
gn
for e
ach
site
that
pro
vide
d da
ta to
the
stud
y
Stud
y lo
catio
nN
umbe
r of
part
icip
ants
aG
ende
r (%
)A
ge (%
)Et
hnic
ityb (%
)A
ltitu
de
rang
e (m
)Be
dnet
us
age
(%)
Mal
aria
pre
vale
nce
(%)
Tim
ings
of
clin
ical
da
ta c
olle
c-tio
nM
ale
<11–
22–
55–
1515
–30
>30
NA
Slid
e-po
sitiv
eN
A
Sene
gal
497
45.7
1.8
3.4
10.7
37.6
21.5
24.9
–W
olof
:Se
rer:
Peul
h:Se
rer N
iom
inka
:M
andi
gue:
Oth
er:
35.6
33.4
10.7
10.1
6.0
4.2
15–5
1–
14.7
85.3
cLS
with
A
CD
; TS;
20
06/2
007
Mal
i (P
ongo
non)
312
53.5
–3.
236
.254
.52.
23.
8–
Dog
on:
Oth
er:
95.2
4.8
49–3
52–
100
–C
S &
CES
; TS;
20
06/2
007
Mal
i (M
ante
ouro
u)64
343
.4–
–10
.637
.621
.524
.9–
Dog
on:
Peul
h:51
.248
.826
7–28
0–
24.6
–C
S; T
S;
2006
/200
7
Burk
ina
Faso
1,89
743
.42.
73.
113
.234
.923
.822
.3–
Peul
h:M
ossi
:Ri
mai
be:
Oth
er:
38.9
32.4
27.4
1.3
304–
305
16.5
44.3
2.5
CS;
TS
& ID
S;
2007
/200
8
Suda
n84
36.6
––
–44
.034
.520
.21.
2H
ausa
:M
asal
it:51
.248
.818
3–38
1–
–10
0cLS
& C
S;
TS &
IDS;
20
07/2
008
Keny
a1,
809
52.0
––
–10
0–
––
Giri
ama:
Cho
nyi:
Kaum
a:M
jiken
da:
Oth
er:
78.3
13.1
5.4
1.3
1.9
090
.816
.6–
BCS
Tanz
ania
(M
oshi
)6,
084
40.7
6.2
4.8
16.8
33.9
21.2
16.7
0.4
Pare
:W
asam
baa:
Cha
gga:
Wab
onde
i:O
ther
:
40.9
36.1
14.3
7.9
0.8
196–
1,84
5–
15.6
0.5
CS;
TS;
20
06/2
007
Tanz
ania
(T
anga
SP1
)62
343
.20.
32.
625
.763
.87.
5–
–W
asam
baa:
Mzi
gua:
Muh
a:O
ther
:
65.8
10.8
3.4
20.0
223–
700
54.6
22.6
–C
S; T
S;
2001
/200
2

Page 7 of 18Shelton et al. Malar J (2015) 14:333
Tabl
e 1
cont
inue
d
Stud
y lo
catio
nN
umbe
r of
part
icip
ants
aG
ende
r (%
)A
ge (%
)Et
hnic
ityb (%
)A
ltitu
de
rang
e (m
)Be
dnet
us
age
(%)
Mal
aria
pre
vale
nce
(%)
Tim
ings
of
clin
ical
da
ta c
olle
c-tio
nM
ale
<11–
22–
55–
1515
–30
>30
NA
Slid
e-po
sitiv
eN
A
Tanz
ania
(T
anga
SP2
)55
247
.53.
42.
09.
251
.623
.710
.0–
Was
amba
a:M
digo
:M
mak
onde
:M
zigu
a:M
segu
ju:
Wab
onde
i:Pa
re:
Oth
er:
35.0
30.2
5.4
5.1
4.7
4.2
4.2
11.2
0–1,
009
28.6
37.7
–C
S; T
S; 2
004
Sri L
anka
798
49.5
––
–0.
537
.162
.20.
399
.4O
ther
: 0.6
99.4
0.6
55–3
9795
.70
–LS
with
AC
D;
1992
/199
3;
sam
ples
co
llect
ed
2006
/200
7
NB:
ACD
act
ive
case
det
ectio
n, B
CS b
irth
coho
rt s
tudy
, CES
chl
oroq
uine
effi
cacy
stu
dy, C
S cr
oss-
sect
iona
l stu
dy, I
DS
inte
rmitt
ent d
ry s
easo
n, L
S lo
ngitu
dina
l stu
dy, T
S tr
ansm
issi
on s
easo
n.a N
umbe
r of p
artic
ipan
ts fo
r who
m c
linic
al d
ata,
gen
etic
dat
a an
d an
tibod
y da
ta c
ould
be
mat
ched
.b E
thni
c gr
oups
with
few
er th
an 2
0 in
divi
dual
s ar
e re
code
d as
“oth
er”.
c The
se s
tudi
es o
btai
ned
data
on
mic
rosc
opic
-det
ecta
ble
infe
ctio
n in
few
(n =
81;
Sen
egal
) or n
one
(Sud
an) o
f the
ir pa
rtic
ipan
ts a
t the
tim
e of
sam
plin
g.

Page 8 of 18Shelton et al. Malar J (2015) 14:333
availability or study design and thereby did not necessar-ily reflect malaria prevalence in the general population at the time of sampling; at remaining sites the prevalence of microscopically detectable infection ranged from 0 % in Sri Lanka to 44.3 % in Burkina Faso. The prevalence of microscopically positive malaria infection is shown in Fig. 1 for the six sites having age-distributed commu-nity data. Overall there was a general increase in preva-lence from the <1 year-old age group to a peak in the 5–15 years-old age group (OR = 3.49, P < 0.001; Table 2) with a decrease thereafter; the lowest prevalence was seen in those aged >30 years-old (OR = 0.63, P = 0.01). Compared to the <1 year-old group, parasite density increased in the 1–2 years-olds (beta = 0.26, P = 0.041) was similar in the 2–5 years-old group and was signifi-cantly lower in the older age groups with the lowest den-sity seen in >30 years-olds (beta = −0.62, P = <0.001; Additional file 8). No significant difference were found in the odds of having a microscopically positive blood smear between males and females (OR males vs female = 1.09, P = 0.109), although males had a marginally higher para-site density than females (beta males vs females = 0.09, P = 0.005, Additional file 8).
Correlations between antibody levelsThe greatest correlations were seen between antibodies to merozoite antigens (r2 range = 0.21–0.35), followed by correlations between these antibodies and anti-(NANP)4 (r2 range = 0.11–0.24), with total IgE showing little or no correlation with any of the anti-malarial antibod-ies (r2 range = 0–0.01, Fig. 2 ‘Combined’ panel). Similar trends were observed at individual sites (Fig. 2), although some variation between sites was visible. This pattern of correlations remained after accounting for other clini-cal variables as shown by the residuals from the regres-sion analyses (Additional file 9). It is possible that the strengths of correlation between antibodies might depend on the level of infection, and thus depend on study site and the age of the individuals. Therefore, a lin-ear regression model was applied using both age-groups and sites as categorical variables and no significant asso-ciations were observed with study-site or for age-group (Additional files 10, 11).
Factors influencing antibody levelsIndividuals living in malaria-endemic areas are known to acquire immunity with age, this can be observed in
Table 2 Results of logistic regression analysis investigating the effect of age, gender and HbS genotype on malaria status as determined by microscopya using combined data.
Data from Senegal, Mali (Pongonon), Sudan and Sri Lanka are not included as participants are either entirely microscopically malaria-positive or malaria-negative.
Reference category is “negative” (n = 7261).
Results significant at 0.05 level are highlighted in italics.
ND: Results not shown as unable to obtain estimates for HbSS without any infected individuals.
NB: CI confidence interval, OR odds ratio.a Also adjusted for altitude, village (>20), ethnicity (>20), sample month (>20) and study; results not shown.
Factor Adjusted OR (95 % CI) p-value Malaria status by microscopy
Individuals positive (total = 1,966)
Individuals negative (total = 7,261)
N (%) N (%)
Age (years)
<1 1 37 (10.9) 303 (89.1)
1–2 1.33 (0.87–2.05) 0.191 47 (17.2) 225 (82.7)
2–5 2.65 (1.88–3.72) <0.001 311 (26.7) 854 (73.3)
5–15 3.49 (2.53–4.86) <0.001 1,141 (25.6) 3,314 (74.4)
15–30 1.21 (0.87–1.70) 0.263 281 (17.1) 1,365 (82.9)
>30 0.63 (0.44–0.90) 0.010 147 (11.1) 1,177 (88.9)
Gender
Female 1 1,044 (20.1) 4,142 (79.9)
Male 1.09 (0.98–1.21) 0.109 922 (22.8) 3,119 (77.2)
HbS
11 1 1,824 (21.4) 6,718 (78.6)
12 0.75 (0.61–0.92) 0.005 136 (21.1) 508 (78.9)
22 ND ND 0 (0) 8 (100)

Page 9 of 18Shelton et al. Malar J (2015) 14:333
Fig. 3 as the increase in antibody titres to AMA1, MSP1, MSP2, and (NANP)4 across the different age groups. The trend for increasing anti-malarial antibody levels with age was confirmed using regression analysis on combined data across all sites, adjusting for gender, malaria infec-tion, altitude, month, village, and ethnicity (Table 3). All anti-malarial antibodies showed significant increases with each age group compared to the <1 year-old group. However, no overall significant change was observed in IgE levels with age, apart from the 15–30 years-old group (beta = 0.22, P = 0.034). Gender was a significant factor for all antibodies (although anti-AMA1 was marginal, Table 3).
Across all sites, antibody levels to AMA1, MSP1 and MSP2 were significantly increased in individuals with microscopically detectable infection (Table 3); whilst at the six sites that quantified parasitaemia, increasing para-site density was significantly associated with decreased
antibody levels to AMA1, MSP1 and MSP2 (Additional file 12). There was no significant association of micro-scopic positivity or parasite density on anti-(NANP)4 levels. Total IgE levels were slightly raised in infected individuals (beta = 0.06, P = 0.021; Table 3) but did not differ significantly with increasing parasite density (Addi-tional file 12). Similar trends were observed when this analysis was run for each site separately, although signifi-cance was influenced by sample size (Additional file 13). At five sites that recorded bed-net use at the time of sam-pling, no observed significant effect was seen for anti-body levels (Additional file 14).
Allele frequency of SNPsAllele frequencies in Sri Lanka were generally different to those observed at African sites (Additional file 15). Most notably, the DARC gene SNP-derived allele (rs2814778) was not observed in Sri Lanka but was at a frequency
Fig. 2 Heatmap matrix plot of correlations between logged antibody titres at each site. Pairwise correlations between logged anti‑AMA1, anti‑MSP1, anti‑MSP2, anti‑NANP, and total IgE calculated as R‑squared. Strongest correlations shown in red and weakest correlations shown in yellow. Correlations of antibodies with themselves shown here in grey.

Page 10 of 18Shelton et al. Malar J (2015) 14:333
>0.99 in the African populations. Differences in allele frequencies between East and West African populations were also observed: the CD36 gene SNP (rs3211938) had a mean derived allele frequency of 28.9 % (range 0.7–61.9 %) in West Africa compared to 7.2 % (range 2.7–9.8 %) in East Africa; the HBB gene SNPs (rs334; HbS and rs33930165; HbC) had mean derived allele frequencies of 3.5 % (range 1.5–4.6 %) and 5.5 % (range 0.7–10.2 %), respectively, in West Africa compared to 5.9 % (range 1.6–7.7 %) and 0.006 % (range 0.0–0.003 %) respectively in East Africa. SNPs that were polymorphic in East
Africa but not in West Africa included three RAD50 gene SNPs (rs28903086, rs28903088, rs28903092), one IL4 SNP (rs4986964), one IFNGR1 gene SNP (rs11575936) and two STAT6 gene SNPs (rs3024978, rs3024952). An FCER2 gene SNP (rs35825847) was the only SNP poly-morphic in West Africa but not in East Africa.
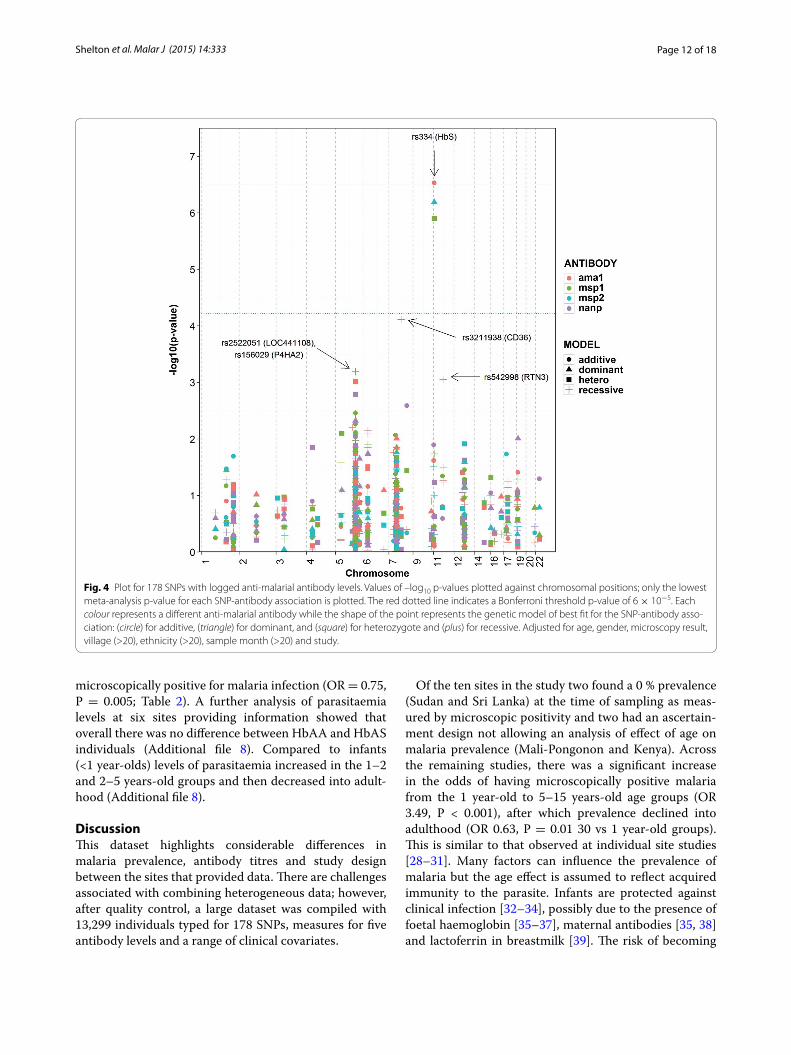
SNP-antibody association analysesFigure 4 shows the nominal P values from analysis of the SNP-antibody associations across all sites. The only candidate SNP that met the Bonferroni-corrected
Fig. 3 Mean logged antibody titre for the five measured antibodies, for each age‑group for each site. Each colour represents a different antibody while the shape of the point represents the antibody type: (triangle) for anti‑merozoite, (square) for anti‑sporozoite, and (circle) for total IgE.

Page 11 of 18Shelton et al. Malar J (2015) 14:333
significance threshold (P = 6 × 10⁻⁵, see Methods) was rs334 in HBB, encoding sickle haemoglobin. Compared to HbAA, HbAS individuals had lower concentrations of antibodies to merozoite antigens AMA1 (beta = −0.17, P = 2.9 × 10⁻⁷), MSP1 (beta = −0.15, P = 1.3 × 10⁻⁶) and MSP2 (beta = -0.14, P = 6.5 × 10⁻⁷). No association of HbAS was seen for anti-(NANP)4 antibodies.
A candidate SNP in CD36 came close to the Bon-ferroni-corrected threshold, which is probably over-conservative. Compared to ancestral homozygotes and heterozygotes combined, recessive homozygotes at rs3211938 (CD36) had significantly lower concentrations of antibodies to MSP2 (beta = −0.23, P = 7.7 × 10⁻⁵).
Weaker associations were observed at three other loci and, while they are not considered here to be significant, for completeness they were included in the meta-analysis. r2522051 (LOC441108) showed a recessive association with anti-MSP1 levels (beta = −0.06, P = 6.4 × 10⁻⁴). rs156029 (P4HA2) showed heterozygous association with anti-AMA1 levels (beta = −0.05, P = 9.7×10⁻⁴). rs542998 (RTN3) showed recessive association with anti-MSP1 levels (beta = 0.06, P = 8.8 × 10⁻⁴). No
associations were found for antibody levels to (NANP)4 (Additional file 16). Including parasite density in the model did not appreciably change these findings (Addi-tional file 17).
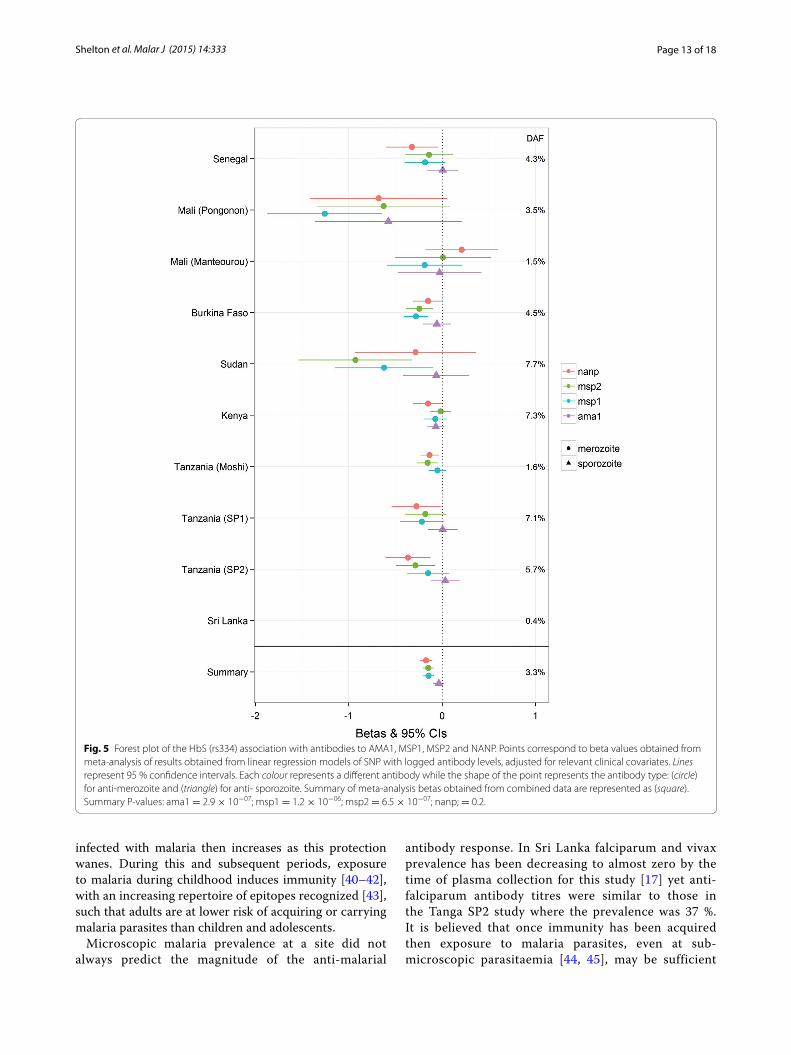
In order to look at the consistency of effect we have made forest plots of the betas. Figure 5 shows the beta values, 95 % confidence intervals and p-values for the effect of HbAS on the four anti-malarial antibodies at each site. The direction of effect is mostly consistent across sites for the three merozoite antibodies but no effect was seen at any site for anti-(NANP)4 antibodies, except in Mali (Pongonon). The results of meta-analysis for the 4 marginal genes (CD36 and LOC441108, P4HA2 and RTN3) are shown in Additional file 18 as forest plots along with their p-values.
Association of HbAS and malaria infectionGiven the association between sickle and anti-malar-ial antibody levels (see above), a regression analyses was conducted between malaria infection (microscopy result and parasite density) and sickle cell trait. HbAS individuals were significantly protected from becoming
Table 3 Results of linear regression analysis investigating the effect of age, gender and malaria status as determined by microscopyb on logged antibody levels to AMA1, MSP1, MSP2, NANP and IgE
Results shown as betas, which indicate the direction of effect of the clinical covariate on antibody levels. Beta < 0 indicate a decrease in antibody levels and beta > 0 indicate an increase in antibody levels. 95 % confidence intervals that do not span 0 indicate an effect that is significant at p = 0.05.
NB: CI confidence interval; results significant at 0.05 level are highlighted in italics.a Data not available for Tanzania (Moshi).b Also adjusted for village (>20), ethnicity (>20), sample month (>20) and study; results not shown but ANOVA p-values were <0.001 for all antibodies.
Factor Anti-AMA1 levels (n = 10,137)
Anti-MSP1 levels (n = 10,200)
Anti-MSP2 levels (n = 10,283)
Anti-NANP levels (n = 5,531)a
Total IgE levels (n = 4,961)a
Beta (95 % CI) p-value Beta (95 % CI) p-value Beta (95 % CI) p-value Beta (95 % CI) p-value Beta (95 % CI) p-value
Age (years)
<1 0 0 0 0 0
1–2 0.04 (−0.09 to 0.17)
0.576 −0.10 (−0.22 to 0.01)
0.083 0.16 (0.05 to 0.28) 0.006 0.30 (0.04 to 0.55) 0.023 0.09 (−0.17 to 0.35)
0.508
2–5 0.25 (0.15 to 0.35) <0.001 0.08 (−0.01 to 0.17)
0.087 0.29 (0.20 to 0.38) <0.001 0.50 (0.30 to 0.71) <0.001 0.09 (−0.12 to 0.30)
0.398
5–15 0.57 (0.47 to 0.67) <0.001 0.37 (0.28 to 0.45) <0.001 0.61 (0.52 to 0.69) <0.001 0.87 (0.67 to 1.07) <0.001 0.19 (−0.01 to 0.40)
0.066
15–30 0.55 (0.46 to 0.65) <0.001 0.65 (0.57 to 0.74) <0.001 0.72 (0.63 to 0.81) <0.001 1.43 (1.23 to 1.63) <0.001 0.22 (0.02 to 0.43) 0.034
>30 0.53 (0.43 to 0.63) <0.001 0.81 (0.72 to 0.90) <0.001 0.72 (0.63 to 0.81) <0.001 1.61 (1.40 to 1.81) <0.001 0.14 (−0.07 to 0.35)
0.179
Gender
Female 0 0 0 0 0
Male −0.03 (−0.07 to 0)
0.058 −0.08 (−0.11 to −0.05)
<0.001 −0.05 (−0.07 to −0.02)
0.002 −0.07 (−0.11 to −0.03)
0.004 0.12 (0.09 to 0.16) <0.001
Microscopy result
Negative 0 0 0 0 0
Positive 0.17 (0.13 to 0.22) <0.001 0.15 (0.11 to 0.19) <0.001 0.21 (0.18 to 0.25) <0.001 −0.03 (−0.08 to −0.02)
0.263 0.06 (0.01 to 0.11) 0.021
Page 12 of 18Shelton et al. Malar J (2015) 14:333
microscopically positive for malaria infection (OR = 0.75, P = 0.005; Table 2). A further analysis of parasitaemia levels at six sites providing information showed that overall there was no difference between HbAA and HbAS individuals (Additional file 8). Compared to infants (<1 year-olds) levels of parasitaemia increased in the 1–2 and 2–5 years-old groups and then decreased into adult-hood (Additional file 8).
DiscussionThis dataset highlights considerable differences in malaria prevalence, antibody titres and study design between the sites that provided data. There are challenges associated with combining heterogeneous data; however, after quality control, a large dataset was compiled with 13,299 individuals typed for 178 SNPs, measures for five antibody levels and a range of clinical covariates.
Of the ten sites in the study two found a 0 % prevalence (Sudan and Sri Lanka) at the time of sampling as meas-ured by microscopic positivity and two had an ascertain-ment design not allowing an analysis of effect of age on malaria prevalence (Mali-Pongonon and Kenya). Across the remaining studies, there was a significant increase in the odds of having microscopically positive malaria from the 1 year-old to 5–15 years-old age groups (OR 3.49, P < 0.001), after which prevalence declined into adulthood (OR 0.63, P = 0.01 30 vs 1 year-old groups). This is similar to that observed at individual site studies [28–31]. Many factors can influence the prevalence of malaria but the age effect is assumed to reflect acquired immunity to the parasite. Infants are protected against clinical infection [32–34], possibly due to the presence of foetal haemoglobin [35–37], maternal antibodies [35, 38] and lactoferrin in breastmilk [39]. The risk of becoming
Fig. 4 Plot for 178 SNPs with logged anti‑malarial antibody levels. Values of –log10 p‑values plotted against chromosomal positions; only the lowest meta‑analysis p‑value for each SNP‑antibody association is plotted. The red dotted line indicates a Bonferroni threshold p‑value of 6 × 10⁻⁵. Each colour represents a different anti‑malarial antibody while the shape of the point represents the genetic model of best fit for the SNP‑antibody asso‑ciation: (circle) for additive, (triangle) for dominant, and (square) for heterozygote and (plus) for recessive. Adjusted for age, gender, microscopy result, village (>20), ethnicity (>20), sample month (>20) and study.
Page 13 of 18Shelton et al. Malar J (2015) 14:333
infected with malaria then increases as this protection wanes. During this and subsequent periods, exposure to malaria during childhood induces immunity [40–42], with an increasing repertoire of epitopes recognized [43], such that adults are at lower risk of acquiring or carrying malaria parasites than children and adolescents.
Microscopic malaria prevalence at a site did not always predict the magnitude of the anti-malarial
antibody response. In Sri Lanka falciparum and vivax prevalence has been decreasing to almost zero by the time of plasma collection for this study [17] yet anti-falciparum antibody titres were similar to those in the Tanga SP2 study where the prevalence was 37 %. It is believed that once immunity has been acquired then exposure to malaria parasites, even at sub-microscopic parasitaemia [44, 45], may be sufficient
Fig. 5 Forest plot of the HbS (rs334) association with antibodies to AMA1, MSP1, MSP2 and NANP. Points correspond to beta values obtained from meta‑analysis of results obtained from linear regression models of SNP with logged antibody levels, adjusted for relevant clinical covariates. Lines represent 95 % confidence intervals. Each colour represents a different antibody while the shape of the point represents the antibody type: (circle) for anti‑merozoite and (triangle) for anti‑ sporozoite. Summary of meta‑analysis betas obtained from combined data are represented as (square). Summary P‑values: ama1 = 2.9 × 10−07; msp1 = 1.2 × 10−06; msp2 = 6.5 × 10−07; nanp; = 0.2.

Page 14 of 18Shelton et al. Malar J (2015) 14:333
to boost antibody levels through long-term memory [46–48], therefore, helping to maintain antibody titres in regions (Sri Lanka and Sudan) of low endemicity in this study.
As expected, antibody titres to asexual blood stage antigens were most highly correlated with each other (r2 > 0.3), and showed less correlation with anti-(NANP)4 antibodies (r2 between 0.2 and 0.3) which are reflective of exposure to pre-erythrocytic parasites (sporozoites and liver stages). All anti-malarial antibodies showed similar distributions and peak titres from 1:100 to 1:1,000. Total IgE levels were not correlated with any of the other antibody levels. Although there was a margin-ally significant increase in total IgE levels with malaria infection, it was not possible to corroborate whether this was due to polyclonal induction of IgE antibodies dur-ing malaria infection [49–51] or changes in specific anti-malarial IgE.
A regression model was used to investigate the associa-tion of clinical variables with antibody titres. As reported previously [52–54] increasing age was found to be signifi-cantly associated with increased levels of antibodies to AMA1, MSP1, MSP2, and (NANP)4. A plateau effect was also seen with anti-AMA1, anti-MSP1 and anti-MSP2 in the older age groups similar to Calissano et al. [55].
As reported previously, being male was associated with decreased antibody levels to malarial antigens. Two contributing factors reported to explain this gender dif-ference are the differential transcription and translation of IFN-γ between males and females [56] or an immu-nosuppressive effect of testosterone in males [57]. Con-versely, being male was significantly associated with an increase in total IgE levels, which is consistent with other studies [58–60]. One other likely explanation is due to the different habits of males and females and their exposure to helminth and other parasitic infections [61–63].
As expected [49, 53], microscopically positive infection was significantly associated with increased antibody lev-els to the merozoite antigens AMA1, MSP1 and MSP2. Furthermore, the presence of these asexual stages was not associated with antibody titres to the pre-erythro-cytic antigen (NANP)4 [64].
A regression model was used to investigate SNP associations with antibody levels that included several covariates for parameters that were identified as influ-encing antibody levels. Of all the SNPs and antibodies the most significant effect was seen for rs334 (HbS) with reduced antibody titres to merozoite antigens. Previous research has been inconsistent regarding the relationship between sickle cell trait and IgG responses to malaria: some studies have reported higher antibody levels in HbAS compared to HbAA individuals [65],
whilst others have reported lower antibody levels in HbAS individuals [30], or even no difference between the two [54]. Miura et al. [30] found that HbAS children in Mali had significantly lower IgG levels to EBA175 and MSP2 compared to their HbAA counterparts and also tended to have lower IgG levels to AMA1 and MSP1, although these latter findings were not statis-tically significant. Several studies measured tetanus toxoid-specific IgG titres in HbAA and HbAS children and found no differences [30, 65], which Verra et al. [65] used to infer that HbAS children had lower IgG titres specifically to merozoite antigens. This specificity is confirmed in this study by finding significant differ-ences in anti-AMA1, anti-MSP1 and anti-MSP2 levels but not in anti-(NANP)4 or total IgE levels. Verra et al. [65] concluded that the lowered IgG levels in HbAS children found in their study suggest that the malaria-protective effects of HbAS are not due to malaria-spe-cific IgG responses.
The most likely mechanism for lowered antibody lev-els in HbAS individuals is by reducing the net expo-sure of the immune system to parasites; for example, by reducing invasion and development of parasites in HbAS erythrocytes [30, 54], enhancing phagocytosis of infected HbAS erythrocytes [30, 54, 65, 66], or by accelerating the removal of parasitized erythrocytes by the spleen through sickling [66]. These are all consist-ent with the observation (n = 9,227 individuals) that HbAS significantly reduced the odds of being micro-scopically positive compared to HbAA. Taken together with a significant reduction in anti-merozoite antibod-ies and no change in antibodies to pre-erythrocytic stages, the data suggest that HbAS affects asexual blood-stages only. One possible explanation would be for HbAS to exert its effect early after the release of merozoites from the liver by blocking or delaying growth in infected erythrocytes. If this were the case, then the time to establish a patent infection would be increased/extended thereby reducing exposure to the immune system. However, once a blood-stage infection is established the data (n = 2,272) suggest that HbAS erythrocytes are no longer able to attenuate parasite growth.
Indeed across 21 published studies, the majority having less than 1,000 individuals, there is no con-sensus on the effect of HbAS on parasite density or prevalence, although the weight of evidence is prob-ably for no effect (review and meta-analysis [67]). It is still unknown whether parasites infecting HbAS and HbAA erythrocytes differ in virulence, but it is clear that in the absence of controlling parasitaemia, HbAS is highly protective against severe malaria phenotypes [21, 67].

Page 15 of 18Shelton et al. Malar J (2015) 14:333
There are several features of this study that increase the reliability of the associations found between HbAS and merozoite antibodies. Firstly, a large dataset was generated with over 13,000 individuals, 12,380 of whom were HbAA and 868 HbAS. Sec-ondly, a similar effect size was found for HbS in asso-ciation with anti-AMA1, anti-MSP1 and anti-MSP2 levels, using the heterozygote model. Thirdly, the p-values for each HbAS-antibody association were similar and highly significant even after adjusting for multiple testing. Finally, not including an interac-tion term between SNP and study in the model meant that all significant outcomes represented effects that were consistent across sites, as demonstrated in the Forest plots for HbAS with the merozoite antibod-ies. The only exceptions were the Manteourou study in Mali and the Sri Lanka study, which had oppo-site directions of effect to the other sites for anti-AMA1. Neither of these associations were significant and were likely due to relatively small sample sizes (Mali = 643, Sri Lanka = 497) combined with low derived allele frequencies for HbAS (Mali = 1.5 %; Sri Lanka = 0.4 %).
One SNP was found to be marginally associated with antibody levels to merozoite antigens. The SNP in CD36 (rs3211938) on chromosome 7 was associated with a reduction in anti-MSP2 levels using the recessive genetic model, which is consistent with the reduced anti-MSP1 levels observed in individuals recessive homozygous for this SNP in another area of Tanzania [68]. None of the other loci tested here showed evidence of association with antibodies in this multi-centre analysis with a sig-nificance of P < 10−4.
ConclusionA major strength of this study was its large sample size (n = 13,299), which enabled the detection of an effect of SNPs on antibody levels even at a signifi-cance level adjusted for multiple testing. The sample size also allowed adjustment for a multitude of poten-tial confounding factors, and having participants from ten sites in seven different countries sampled using standardized methodologies allowed an analysis for consistency of SNP effect across sites. This study finds an association of HbS (rs334) carriage with lowered antibody levels to merozoite antigens AMA1, MSP1 and MSP2, that is highly significant and consistent across study sites. This study demonstrates the feasi-bility of combining data from heterogeneous sources and the findings support the notion that genetic fac-tors can determine an individual’s immune response to malaria.
Additional files
Additional file 1: Additional Table ST1 Details of Principal Investigators and Ethics Review Committees for each site. Details of Principal Investiga‑tors and Ethics Review Committees for each site.
Additional file 2: Additional Table ST2: Details of covariates adjusted for in linear regression analysis of non‑genetic factors with logged antibody levels, their relevance to the study and their previous association(s) with malaria or anti‑malarial antibodies. Information on the covariates used in this study as con‑variates in the various analyses.
Additional file 3: Additional File LFST1A: Details of gene regions selected for genotyping and the SNP assay design details. This file con‑tains a list of the genes from which SNPs were selected and typed for this study. Information is provided on the gene and its genomic location with respect to the Human Reference genome build GRCh37. Also provided is a table containing the assay design details for each SNP used in this study for the Agena Biosciences iPLEX genotyping platform. SNPs are grouped into multiplexes as assigned by the assay design software.
Additional file 4: MalariaGEN Supplementary Sample Handling Procedures. This file includes more detail on sample handling proce‑dures including extracting DNA, genotyping methodology, ELISA proto‑cols with ELISA data processing.
Additional file 5: Additional Figure SF1: Histograms of logged antibody levels before further manipulations were made. Histograms of the logged antibody titres across all samples for each antibody measured in this study.
Additional file 6: Additional Figure SF2: Histograms of residuals from antibody linear regression models with non‑genetic factors. Histograms of the residuals from the antibody linear regression model analysis with non‑genetic factors.
Additional file 7: Additional Table ST3A‑D: Details of the linear regres‑sion models used in this study. Model formulae for the various linear regression analyses showing how the different co‑variates were used.
Additional file 8: Additional Table ST4: Results of linear regression analy‑sis investigating the effect of age, gender and HbS genotype on parasite density in malaria‑positive individuals using combined site data. Results of linear regression analysis investigating the effect of age, gender and HbS genotype on parasite density in malaria‑positive individuals using combined data. This is an extension to that shown in the main text and is a reduced dataset as not all sites provided parasitaemia data.
Additional file 9: Additional figure SF3: Heatmap matrix plot of the correlations between residuals from the antibody linear regression models with non‑genetic factors at each site. Matrix plot of the pairwise correla‑tions as r2 between antibody titres using data from all sites.
Additional file 10: Additional figure SF4: Scatter plot of the correlations between residuals from the antibody linear regression models with non‑genetic factors at each site and age‑group. This plot shows the pairwise correlations (as r2) for each malaria–malaria antibody pair as a function of each study site. The sites are ordered according to malaria microscop‑ically‑positive‑prevalence recorded at sample collection (low to high). Several panels are shown according to age‑group.
Additional file 11: Additional table ST5: Linear regression analysis of the correlations between residuals from the malaria antibody pairs. This data shows the results of the analysis of the correlations between antibodies.
Additional file 12: Additional Table ST6: Results of linear regression analysis investigating the effect of age, gender and parasite density on logged antibody levels to AMA1, MSP1, MSP2, NANP and IgE. Results of linear regression analysis investigating the effect of age, gender and parasite density using combined data for each antibody measured in this study. This is an extension to that shown in the main text and is a reduced dataset as not all sites provided parasitaemia data.
Additional file 13: Additional Table ST7A–E: Results of site‑specific linear regression analysis investigating the effect of age, gender and

Page 16 of 18Shelton et al. Malar J (2015) 14:333
Authors’ contributionsRCa, PC, ADj, OKD, CJD, MI, NK, DPK, ML, KM, DM, OMP, HR, ER, KAR, AS, SBS, AT, MTB, and TNW designed the study; RD, ADo, EB, NE, AElh, IE, AElz, DF, AH, DI, ABL, AMac, BM, VDM, AMan, HM, CN, HR, AT, OT, and FV undertook the surveys and sample collection; PC, CJD, PR and NSi performed the ELISAs; SA, SC, RCr, CH, AJ, KAR, and KR designed and undertook the genotyping; PC, RCr, MH, CH, AJ, SM, KAR, KR, and JMGS curated the clinical data, ELISA data and genotype data; SM, KAR and JMGS, conducted the analyses with input from GB, GMC, TGC, PC, MH, DPK, NSe, and CCAS; DPK, KAR and JMGS drafted the manuscript with input from VC, PC, MH, AK, and SM. All authors read and approved the final manuscript.
Author details1 Wellcome Trust Centre for Human Genetics, University of Oxford, Roosevelt Drive, Oxford, UK. 2 London School of Hygiene and Tropical Medicine, Keppel Street, London, UK. 3 National Institute for Biological Standards and Controls, South Mimms, Hertfordshire, UK. 4 Wellcome Trust Sanger Institute, Wellcome Trust Genome Campus, Hinxton, Cambridge CB10 1SA, UK. 5 Nuffield Depart‑ment of Population Health, The Ethox Centre, University of Oxford, Richard Doll Building, Old Road Campus, Oxford OX3 7LF, UK. 6 Infectious Diseases Epidemiology Unit, Institut Pasteur, BP 220, Dakar, Senegal. 7 Parasite Molecular Immunology Unit, Institut Pasteur, 28 rue du Docteur Roux, 75724 Paris Cedex 15, France. 8 Unité de Génétique Fonctionnelle des Maladies Infectieuses, Institut Pasteur, 28 rue du Docteur Roux, 75724 Paris Cedex 15, France. 9 Cen‑tre National de la Recherche Scientifique, URA3012, 28 rue du Docteur Roux, 75724 Paris Cedex 15, France. 10 Department of Epidemiology of Parasitic Diseases, Faculty of Medicine, Pharmacy and Odonto‑Stomatology, Malaria Research and Training Center, USTTB, BP 1805, Bamako, Mali. 11 Department of Molecular Biosciences, Wenner‑Gren Institute, Stockholm University, Svante Arrheniusväg 20B, 106 91 Stockholm, Sweden. 12 Department of Public Health and Infectious Diseases, Sapienza University of Rome, Piazzale Aldo Moro 5, 00185 Rome, Italy. 13 Centre de Recherche et de Formation sur le Paludisme, Ouagadougou, Burkina Faso. 14 Institute of Endemic Diseases, University
of Khartoum, Medical Sciences Campus, Qasser Street, Khartoum, Sudan. 15 KEMRI‑Wellcome Trust Research Programme, CGMRC, PO Box 230‑80108, Kilifi, Kenya. 16 Department of Medicine, Imperial College, St Mary’s Campus, Norfolk Place, London W2 1PG, UK. 17 Kilimanjaro Christian Medical College, Tumaini University, Moshi, Tanzania. 18 National Institute for Medical Research, Ocean Road, Dar es Salaam, Tanzania. 19 Division of Biological Sciences, Ash‑worth Laboratories, University of Edinburgh, West Mains Rd., Edinburgh EH9 3JT, UK. 20 Department of Parasitology, Faculty of Medicine, University of Colombo, Kynsey Road, Colombo, Sri Lanka. 21 http://www.malariagen.net/projects/host/consortium‑members.
AcknowledgementsWe thank the all participants and communities who made this study pos‑sible; and the healthcare workers who assisted with this work. MalariaGEN is supported by the Wellcome Trust (077383/Z/05/Z) and by the Foundation for the National Institutes of Health (566) as part of the Bill & Melinda Gates Grand Challenges in Global Health Initiative. The Resource Centre for Genomic Epidemiology of Malaria is supported by the Wellcome Trust (090770/Z/09/Z). Support was also provided by the Medical Research Council (G0600718). DPK receives support from the Medical Research Council (G19/9). CCAS was sup‑ported by a Wellcome Trust Career Development Fellowship (097364/Z/11/Z). The Wellcome Trust also provides core awards to The Wellcome Trust Centre for Human Genetics (075491/Z/04; 090532/Z/09/Z) and the Wellcome Trust Sanger Institute (077012/Z/05/Z). We thank all our Senegalese colleagues who have contributed to establish the field studies and carried the associated clinical work and data management, in particular J Faye, A Badiane, F D Sarr, J Trape, C Sokhna, A Toure‑Balde and C Rogier. We thank the participants of the Manteourou and Pongonon communities in Mali who made this study possible, and the healthcare workers who assisted with this work. We also thank and are grateful to the MRTC‑BMP staff in Bandiagara for their logistic support. MTB and BM received funding through the EU Network of Excellence EviMalar. We wish to thank the entire staff of physicians, nurses and laboratory technicians as well as data management staff at Centre National of Research and Formation sur le Paludisme for their invaluable skilled work. VDM was funded by a Biomalpar (European Community’s Sixth Framework Programme) PhD fellowship. FV was funded by the Italian Malaria Network, sponsored by Compagnia di San Paolo, Turin, Italy. TNW is supported by a Senior Research Fellowship from the Wellcome Trust (091758/Z/10/Z). This manuscript is published with the permission of the Director of KEMRI, Kilifi. This study was conducted as part of the Joint Malaria Programme, a collaboration between the National Institute for Medical Research (NIMR), Kilimanjaro Christian Medical College (KCMC), the London School of Hygiene and Tropical Medicine (LSHTM) and the Centre for Medical Parasitology, University of Copenhagen (CMP) with funding from the UK Medical Research Council (GG9901439) and the Danish International Development Agency. CJD is supported by the Wellcome Trust (091924). We wish to thank the participants and communities in Tanga, Tanzania along with all the field, laboratory and data management teams who made this study possible. We wish to thank the Kataragama com‑munities for participating in these studies and the staff of the Malaria Research Unit, Department of Parasitology, University of Colombo and the Malaria Research Station, Kataragama for their technical support. RD is supported by the University of Colombo Research Grants 2011 (AP/3/2011/PG/15). AMA1 was kind gift of Alan Saul (Malaria Vaccine Development Unit, NIAID, USA), MSP2 of Robin Anders (La Trobe University, Melbourne, Australia), MSP119 of Shirley Longacre (Pasteur Institute, Paris, France) and the 16 residue synthetic peptide (Asn‑Ala‑Asn‑Pro)4 (NANP)4 from Eric Tongren (CDC, Atlanta, USA).
Compliance with ethical guidelines
Competing interestsThe authors declare that they have no competing interests.
Ethical standardDetails of ethical procedures are provided in the Methods and in Additional file 1.
Received: 23 March 2015 Accepted: 3 August 2015
malaria status as determined by microscopy on antibody levels to the different antibodies measured in the study. This data shows the site‑specific analyses of the various epidemiological parameters and antibody measurements.
Additional file 14: Additional Table ST8: Results of linear regression anal‑ysis investigating the effect of age, gender, malaria status as determined by microscopy and bednet use* on logged antibody levels to AMA1, MSP1, MSP2, NANP and IgE. This table shows the results of the analysis of antibody levels with bednet use. Results shown as betas indicating the direction of effect of the clinical covariates on antibody levels.
Additional file 15: Additional Table ST9: Details of 196 genotyped SNPs and their derived allele frequencies at each site. This table shows allele fre‑quencies for each SNP analysed in this study according to each study site.
Additional file 16: Additional Table ST10: Meta‑analysis p‑values obtained for 178 SNPs passing QC criteria detailed in materials and meth‑ods. Details of the analyses for each SNP and antibody across all sites for different genetic inheritance models.
Additional file 17: Additional Figure SF5: Plot for 178 SNPs with logged anti‑malarial antibody levels. Plot for the P‑values of the analyses of 178 SNPs with logged anti‑malarial antibody levels Adjusted for age, gender, parasite density, village (>20), ethnicity (>20), sample month (>20) and study. This is an extension to that shown in the main text and is a reduced dataset as not all sites provided parasitaemia data.
Additional file 18: Additional Figure SF6: Forest plot of the association of A: CD36 (rs3211938), B: LOC441108 (rs2522051), C: RTN3 (rs542998) and D: P4HA2 (rs156029) with antibody levels to AMA1, MSP1, MSP2 and NANP. Forest plots of the betas obtained from meta‑analysis of results obtained from linear regression models of SNP with logged antibody levels, adjusted for relevant clinical covariates.
Page 17 of 18Shelton et al. Malar J (2015) 14:333
References 1. WHO (2013) World Malaria Report 2013, vol 1. World Health Organization,
Geneva, p 284 2. Kwiatkowski DP (2005) How malaria has affected the human genome
and what human genetics can teach us about malaria. Am J Hum Genet 77:171–192
3. Modiano D, Luoni G, Sirima BS, Lanfrancotti A, Petrarca V, Cruciani F et al (2001) The lower susceptibility to Plasmodium falciparum malaria of Fulani of Burkina Faso (west Africa) is associated with low frequencies of classic malaria‑resistance genes. Trans R Soc Trop Med Hyg 95:149–152
4. Sjoberg K, Lepers JP, Raharimalala L, Larsson A, Olerup O, Marbiah NT et al (1992) Genetic regulation of human anti‑malarial antibodies in twins. Proc Natl Acad Sci USA 89:2101–2104
5. Aucan C, Traore Y, Fumoux F, Rihet P (2001) Familial correlation of immu‑noglobulin G subclass responses to Plasmodium falciparum antigens in Burkina Faso. Infect Immun 69:996–1001
6. Stirnadel HA, Beck HP, Alpers MP, Smith TA (2000) Genetic analysis of IgG subclass responses against RESA and MSP2 of Plasmodium falciparum in adults in Papua New Guinea. Epidemiol Infect 124:153–162
7. Afridi S, Atkinson A, Garnier S, Fumoux F, Rihet P (2012) Malaria resistance genes are associated with the levels of IgG subclasses directed against Plasmodium falciparum blood‑stage antigens in Burkina Faso. Malar J 11:308
8. Brisebarre A, Kumulungui B, Sawadogo S, Afridi S, Fumoux F, Rihet P (2015) Genome‑wide significant linkage to IgG subclass responses against Plasmodium falciparum antigens on chromosomes 8p22‑p21, 9q34 and 20q13. Genes Immun 16:187–192
9. Luoni G, Verra F, Arca B, Sirima BS, Troye‑Blomberg M, Coluzzi M et al (2001) Antimalarial antibody levels and IL4 polymorphism in the Fulani of West Africa. Genes Immun 2:411–414
10. Israelsson E, Vafa M, Maiga B, Lysen A, Iriemenam NC, Dolo A et al (2008) Differences in Fcgamma receptor IIa genotypes and IgG subclass pattern of anti‑malarial antibodies between sympatric ethnic groups in Mali. Malar J 7:175
11. Vafa M, Israelsson E, Maiga B, Dolo A, Doumbo OK, Troye‑Blomberg M (2009) Relationship between immunoglobulin isotype response to Plas-modium falciparum blood stage antigens and parasitological indexes as well as splenomegaly in sympatric ethnic groups living in Mali. Acta Trop 109:12–16
12. Maiga B, Dolo A, Toure O, Dara V, Tapily A, Campino S et al (2013) Human candidate polymorphisms in sympatric ethnic groups differing in malaria susceptibility in Mali. PLoS One 8:e75675
13. Maiga B, Dolo A, Toure O, Dara V, Tapily A, Campino S et al (2014) Fc gamma receptor IIa‑H131R polymorphism and malaria susceptibility in sympatric ethnic groups, Fulani and Dogon of Mali. Scand J Immunol 79:43–50
14. Elhassan AA, Hussein AA, Mohamed HS, Rockett K, Kwiatkowski D, Elhas‑san AM et al (2013) The 5q31 region in two African populations as a facet of natural selection by infectious diseases. Genetika 49:279–288
15. Drakeley CJ, Carneiro I, Reyburn H, Malima R, Lusingu JP, Cox J et al (2005) Altitude‑dependent and ‑independent variations in Plasmodium falcipa-rum prevalence in northeastern Tanzania. J Infect Dis 191:1589–1598
16. Manjurano A, Okell L, Lukindo T, Reyburn H, Olomi R, Roper C et al (2011) Association of sub‑microscopic malaria parasite carriage with transmis‑sion intensity in north‑eastern Tanzania. Malar J 10:370
17. Dewasurendra RL, Suriyaphol P, Fernando SD, Carter R, Rockett K, Corran P et al (2012) Genetic polymorphisms associated with anti‑malarial anti‑body levels in a low and unstable malaria transmission area in southern Sri Lanka. Malar J 11:281
18. Genetic determinants of the immune response to malaria (CP2) (http://www.malariagen.net/projects/cp2)
19. GE Healthcare Life Sciences (http://www.gelifesciences.com) 20. QIAGEN (https://www.qiagen.com/) 21. Malaria Genomic Epidemiology Network (2014) Reappraisal of
known malaria resistance loci in a large multicentre study. Nat Genet 46:1197–1204
22. Kennedy MC, Wang J, Zhang Y, Miles AP, Chitsaz F, Saul A et al (2002) In vitro studies with recombinant Plasmodium falciparum apical membrane antigen 1 (AMA1): production and activity of an AMA1 vaccine and generation of a multiallelic response. Infect Immun 70:6948–6960
23. Saul A, Lawrence G, Smillie A, Rzepczyk CM, Reed C, Taylor D et al (1999) Human phase I vaccine trials of 3 recombinant asexual stage malaria antigens with Montanide ISA720 adjuvant. Vaccine 17:3145–3159
24. Garraud O, Diouf A, Holm I, Perraut R, Longacre S (1999) Immune responses to Plasmodium falciparum‑merozoite surface protein 1 (MSP1) antigen, II. Induction of parasite‑specific immunoglobulin G in unsensi‑tized human B cells after in vitro T‑cell priming with MSP119. Immunol‑ogy 97:497–505
25. Corran PH, Cook J, Lynch C, Leendertse H, Manjurano A, Griffin J et al (2008) Dried blood spots as a source of anti‑malarial antibodies for epide‑miological studies. Malar J 7:195
26. R Development Core Team (2008) R: A language and environment for statistical computing.: R Foundation for Statistical Computing
27. The R Project (http://www.r‑project.org) 28. Doolan DL, Dobano C, Baird JK (2009) Acquired immunity to malaria. Clin
Microbiol Rev 22:13–36 29. Nguyen HV, van den Eede P, van Overmeir C, Thang ND, le Hung X,
D’Alessandro U et al (2012) Marked age‑dependent prevalence of symp‑tomatic and patent infections and complexity of distribution of human Plasmodium species in central Vietnam. Am J Trop Med Hyg 87:989–995
30. Miura K, Diakite M, Diouf A, Doumbia S, Konate D, Keita AS et al (2013) Relationship between malaria incidence and IgG levels to Plasmodium falciparum merozoite antigens in Malian children: impact of hemoglobins S and C. PLoS One 8:e60182
31. Trape JF, Rogier C, Konate L, Diagne N, Bouganali H, Canque B et al (1994) The Dielmo project: a longitudinal study of natural malaria infection and the mechanisms of protective immunity in a community living in a holoendemic area of Senegal. Am J Trop Med Hyg 51:123–137
32. Macdonald G, Cuellar CB, Foll CV (1968) The dynamics of malaria. Bull World Health Organ 38:743–755
33. Snow RW, Nahlen B, Palmer A, Donnelly CA, Gupta S, Marsh K (1998) Risk of severe malaria among African infants: direct evidence of clinical protection during early infancy. J Infect Dis 177:819–822
34. Klein Klouwenberg PM, Oyakhirome S, Schwarz NG, Glaser B, Issifou S, Kiessling G et al (2005) Malaria and asymptomatic parasitaemia in Gabo‑nese infants under the age of 3 months. Acta Trop 95:81–85
35. Amaratunga C, Lopera‑Mesa TM, Brittain NJ, Cholera R, Arie T, Fujioka H et al (2011) A role for fetal hemoglobin and maternal immune IgG in infant resistance to Plasmodium falciparum malaria. PLoS One 6:e14798
36. Cao A, Melis MA, Galanello R (1977) Fetal haemoglobin and malaria. Lancet 1:202
37. Pasvol G, Weatherall DJ, Wilson RJ, Smith DH, Gilles HM (1976) Fetal haemoglobin and malaria. Lancet 1:1269–1272
38. Logie DE, McGregor IA, Rowe DS, Billewicz WZ (1973) Plasma immuno‑globulin concentrations in mothers and newborn children with special reference to placental malaria: studies in the Gambia, Nigeria, and Switzerland. Bull World Health Organ 49:547–554
39. Kassim OO, Ako‑Anai KA, Torimiro SE, Hollowell GP, Okoye VC, Martin SK (2000) Inhibitory factors in breastmilk, maternal and infant sera against in vitro growth of Plasmodium falciparum malaria parasite. J Trop Pediatr 46:92–96
40. Aponte JJ, Menendez C, Schellenberg D, Kahigwa E, Mshinda H, Vounat‑sou P et al (2007) Age interactions in the development of naturally acquired immunity to Plasmodium falciparum and its clinical presenta‑tion. PLoS Med 4:e242
41. Baird JK (1995) Host age as a determinant of naturally acquired immunity to Plasmodium falciparum. Parasitol Today 11:105–111
42. Schwartz E, Sadetzki S, Murad H, Raveh D (2001) Age as a risk factor for severe Plasmodium falciparum malaria in nonimmune patients. Clin Infect Dis 33:1774–1777
43. Osier FH, Fegan G, Polley SD, Murungi L, Verra F, Tetteh KK et al (2008) Breadth and magnitude of antibody responses to multiple Plasmodium falciparum merozoite antigens are associated with protection from clini‑cal malaria. Infect Immun 76:2240–2248
44. Giha HA, Nasr A, Iriemenam NC, Balogun HA, Arnot D, Theander TG et al (2010) Age‑dependent association between IgG2 and IgG3 subclasses to Pf332‑C231 antigen and protection from malaria, and induction of protective antibodies by sub‑patent malaria infections, in Daraweesh. Vaccine 28:1732–1739

Page 18 of 18Shelton et al. Malar J (2015) 14:333
45. Proietti C, Verra F, Bretscher MT, Stone W, Kanoi BN, Balikagala B et al (2013) Influence of infection on malaria‑specific antibody dynamics in a cohort exposed to intense malaria transmission in northern Uganda. Parasite Immunol 35:164–173
46. Riley EM, Morris‑Jones S, Blackman MJ, Greenwood BM, Holder AA (1993) A longitudinal study of naturally acquired cellular and humoral immune responses to a merozoite surface protein (MSP1) of Plasmodium falciparum in an area of seasonal malaria transmission. Parasite Immunol 15:513–524
47. Akpogheneta OJ, Dunyo S, Pinder M, Conway DJ (2010) Boosting anti‑body responses to Plasmodium falciparum merozoite antigens in children with highly seasonal exposure to infection. Parasite Immunol 32:296–304
48. Fowkes FJ, McGready R, Cross NJ, Hommel M, Simpson JA, Elliott SR et al (2012) New insights into acquisition, boosting, and longevity of immunity to malaria in pregnant women. J Infect Dis 206:1612–1621
49. Duarte J, Deshpande P, Guiyedi V, Mecheri S, Fesel C, Cazenave PA et al (2007) Total and functional parasite specific IgE responses in Plasmodium falciparum‑infected patients exhibiting different clinical status. Malar J 6:1
50. Perlmann P, Perlmann H, ElGhazali G, Blomberg MT (1999) IgE and tumor necrosis factor in malaria infection. Immunol Lett 65:29–33
51. Bereczky S, Montgomery SM, Troye‑Blomberg M, Rooth I, Shaw MA, Färnert A (2004) Elevated anti‑malarial IgE in asymptomatic individuals is associated with reduced risk for subsequent clinical malaria. Int J Parasitol 34:935–942
52. Egan AF, Morris J, Barnish G, Allen S, Greenwood BM, Kaslow DC et al (1996) Clinical immunity to Plasmodium falciparum malaria is associated with serum antibodies to the 19‑kDa C‑terminal fragment of the merozo‑ite surface antigen, PfMSP‑1. J Infect Dis 173:765–769
53. McGregor IA, Rowe DS, Wilson ME, Billewicz WZ (1970) Plasma immuno‑globulin concentrations in an African (Gambian) community in relation to season, malaria and other infections and pregnancy. Clin Exp Immunol 7:51–74
54. Tan X, Traore B, Kayentao K, Ongoiba A, Doumbo S, Waisberg M et al (2011) Hemoglobin S and C heterozygosity enhances neither the magni‑tude nor breadth of antibody responses to a diverse array of Plasmodium falciparum antigens. J Infect Dis 204:1750–1761
55. Calissano C, Modiano D, Sirima BS, Konate A, Sanou I, Sawadogo A et al (2003) IgE antibodies to Plasmodium falciparum and severity of malaria in children of one ethnic group living in Burkina Faso. Am J Trop Med Hyg 69:31–35
56. Cernetich A, Garver LS, Jedlicka AE, Klein PW, Kumar N, Scott AL et al (2006) Involvement of gonadal steroids and gamma interferon in sex differences in response to blood‑stage malaria infection. Infect Immun 74:3190–3203
57. Krucken J, Dkhil MA, Braun JV, Schroetel RM, El‑Khadragy M, Carmeliet P et al (2005) Testosterone suppresses protective responses of the liver to blood‑stage malaria. Infect Immun 73:436–443
58. Becklake MR, Kauffmann F (1999) Gender differences in airway behaviour over the human life span. Thorax 54:1119–1138
59. Kerkhof M, Droste JH, de Monchy JG, Schouten JP, Rijcken B (1996) Distribution of total serum IgE and specific IgE to common aeroallergens by sex and age, and their relationship to each other in a random sample of the Dutch general population aged 20–70 years. Dutch ECRHS Group, European Community Respiratory Health Study. Allergy 51:770–776
60. Omenaas E, Bakke P, Elsayed S, Hanoa R, Gulsvik A (1994) Total and spe‑cific serum IgE levels in adults: relationship to sex, age and environmental factors. Clin Exp Allergy 24:530–539
61. Abebe F, Gaarder PI, Petros B, Gundersen SG (2001) Age‑ and sex‑related differences in antibody responses against Schistosoma mansoni soluble egg antigen in a cohort of school children in Ethiopia. APMIS 109:816–824
62. Pinot de Moira A, Fulford AJ, Kabatereine NB, Ouma JH, Booth M, Dunne DW (2010) Analysis of complex patterns of human exposure and immu‑nity to Schistosomiasis mansoni: the influence of age, sex, ethnicity and IgE. PLoS Negl Trop Dis 4:e820
63. Mazzucco W, Lacca G, Cusimano R, Provenzani A, Costa A, Di Noto AM et al (2012) Prevalence of sensitization to Anisakis simplex among professionally exposed populations in Sicily. Arch Environ Occup Health 67:91–97
64. Del Giudice G, Verdini AS, Pinori M, Pessi A, Verhave JP, Tougne C et al (1987) Detection of human antibodies against Plasmodium falciparum sporozoites using synthetic peptides. J Clin Microbiol 25:91–96
65. Verra F, Simpore J, Warimwe GM, Tetteh KK, Howard T, Osier FH et al (2007) Haemoglobin C and S role in acquired immunity against Plasmo-dium falciparum malaria. PLoS One 2:e978
66. Williams TN, Mwangi TW, Roberts DJ, Alexander ND, Weatherall DJ, Wam‑bua S et al (2005) An immune basis for malaria protection by the sickle cell trait. PLoS Med 2:e128
67. Taylor SM, Parobek CM, Fairhurst RM (2012) Haemoglobinopathies and the clinical epidemiology of malaria: a systematic review and meta‑analysis. Lancet Infect Dis 12:457–468
68. Kajeguka D, Mwanziva C, Daou M, Ndaro A, Matondo S, Mbugi E et al (2012) CD36 c.1264 T > G null mutation impairs acquisition of IgG anti‑bodies to Plasmodium falciparum MSP1(1)(9) antigen and is associated with higher malaria incidences in Tanzanian children. Scand J Immunol 75:355–360
Submit your next manuscript to BioMed Centraland take full advantage of:
• Convenient online submission
• Thorough peer review
• No space constraints or color figure charges
• Immediate publication on acceptance
• Inclusion in PubMed, CAS, Scopus and Google Scholar
• Research which is freely available for redistribution
Submit your manuscript at www.biomedcentral.com/submit


![Immunity [Innate and Acquired Immunity]. Biotechnology RED: Medical Area GREEN: Agriculture/Food Science WHITE: Bioprocess Engineering](https://img.dokumen.tips/doc/110x75/56649ef45503460f94c06f15/immunity-innate-and-acquired-immunity-biotechnology-red-medical-area-green.jpg)