Embed Size (px)
Citation preview
GENETIC COMBINING ABILITY OF LIGHT AND HEAVY INBRED LINES IN SINGLE CROSSES OF POULTRYIJ
E. J. EISEN3, B. B. BOHREN, H. E. McKEAN4, AND S. C. KING5
Purdue University Agricultural Experiment Station, Lafayette, Indiana 47907
Received June 27, 1966
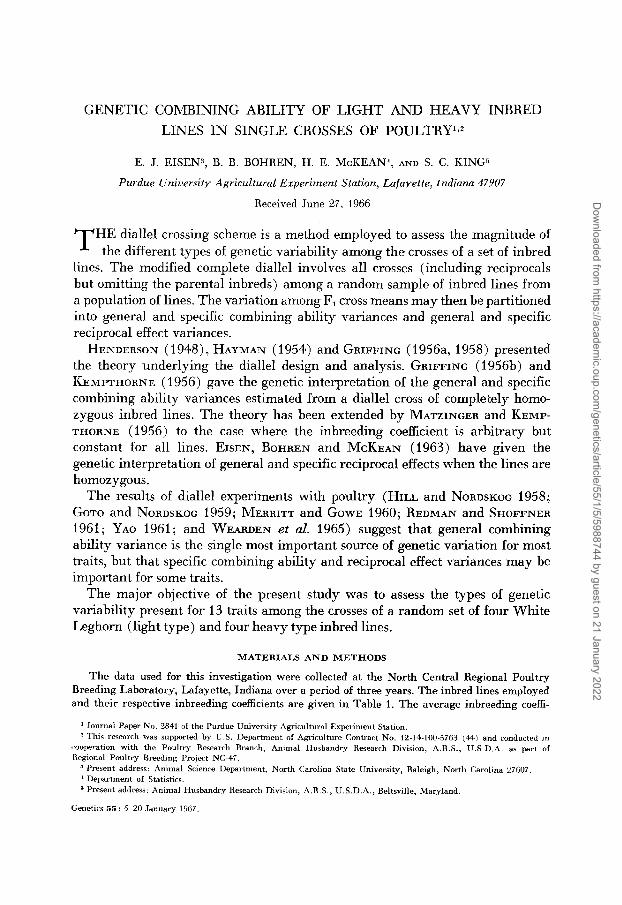
iallel crossing scheme is a method employed to assess the magnitude of TqFeddif€erent types of genetic variability among the crosses of a set of inbred lines. The modified complete diallel involves all crosses (including reciprocals but omitting the parental inbreds) among a random sample of inbred lines from a population of lines. The variation among F, cross means may then be partitioned into general and specific combining ability variances and general and specific reciprocal effect variances.
HENDERSON (1948), HAYMAN (1954) and GRIFFING (1956a, 1958) presented the theory underlying the diallel design and analysis. GRIFFING (1956b) and KEMPTHORNE (1956) gave the genetic interpretation of the general and specific combining ability variances estimated from a diallel cross of completely homo- zygous inbred lines. The theory has been extended by MATZINGER and KEMP- THORNE (1956) to the case where the inbreeding coefficient is arbitrary but constant for all lines. EISEN, BOHREN and MCKEAN (1963) have given the genetic interpretation of general and specific reciprocal effects when the lines are homozygous.
The results of diallel experiments with poultry (HILL and NORDSKOG 1958; GOTO and NORDSKOG 1959; MERRITT and GOWE 1960; REDMAN and SHOFFNER 1961; YAO 1961; and WEARDEN et al. 1965) suggest that general combining ability variance is the single most important source of genetic variation for most traits, but that specific combining ability and reciprocal effect variances may be important for some traits.
The major objective of the present study was to assess the types of genetic variability present for 13 traits among the crosses of a random set of four White Leghorn (light type) and four heavy type inbred lines.
MATERIALS AND METHODS
The data used for this investigation were collected at the North Central Regional Poultry Breeding Laboratory, Lafayette, Indiana over a period of three years. The inbred lines employed and their respective inbreeding coefficients are given in Table 1. The average inbreeding coefi-
Journal Paper No. 3841 of the Plrrdue University Agricultural Experiment Station. ? This research was supported by U.S. Department of Agriculture Contract No. 12-14-100-5763 ( 4 4 ) and conducted in
cooperation with the Poultry Research Branch, Animal Husbandry Research Division, A.R.S. , U.S.D.A. as part of Rrgional Poultry Breeding Project NC-47.
Present address: Animal Science Department, North Carolina State University, Raleigh, North Carolina 27607. 1 Department of Statistics. ’ Present address: Animal Husbandry Research Division, A.R.S., U.S.D.A., Beltsville, Maryland.
Genetics 55: 5-20 January 1967.
Dow
nloaded from https://academ
ic.oup.com/genetics/article/55/1/5/5988744 by guest on 21 January 2022

6 E. J. EISEN et al. TABLE 1
The inbred lines with their respective inbreeding coeficients and line designations
Inbred line IBreed) Inbreedina coefficient
Light types Iowa 9 (White Leghorn) Minnesota 520 (White Leghorn) R.P.L. (East Lansing) 6 (White Leghorn) R.P.L. (East Lansing) 15 (White Leghorn)
USDA (Beltsville) 44 (Rhode Island Red) Minnesota 500 (New Hampshire) Minnesota 530 (White Plymouth Rock) Missouri R3 (Rhode Island Red)
Heavy types
.91
.63
.79
.67
.60
.64
.41
.50
cient for the eight lines was .644, but the coefficient differs from line to line, resulting in some- what unequal error variances.
A diallel cross consisting of 28 single crosses plus the reciprocals was obtained by mating the eight inbred lines in all combinations. The eight by eight diallel was repeated over three years. The eight breeding pens required to produce the light x heavy and heavy x light single cross progeny each involved three males from a representative inbred line and approximately eight hens from each of either the four heavy or four light type inbred lines. However, in the eight pens involving the formation of the light x light or the heavy x heavy crosses there were only three. strains of females represented with eight hens each in a given breeding pen. An attempt was made to produce 25 pullets from each single cross every year.
Traits measured on an individual pullet basis were age at first egg (weeks), eight and 55-week body weight (lb), 55-week egg weight (g), U.S.D.A. interior egg quality score (coded 1 to 9), specific gravity score (coded 0 to 9), egg shape index (width/length), and survivors’ percent egg production to January 1, from January 1 to 72 weeks and the sum of both periods. The percent egg production records of each hen were subjected to the arcsine transformation for statistical analysis. Cross-mean records were obtained for percent adult mortality, percent blood spots and percent meat spots. As these traits are binomially distributed, the arcsine transforms were analyzed with 821/ri used as a measure of error variance on a cross-mean basis, where ri = the harmonic mean. A complete description of how measurements were made on each trait is given by EISEN (1965).
Eggs were hatched in Jamesway incubators and chicks were brooded intermingled in pens of 600 each. Hot water space heaters with supplemental infra-red lamps were used for brooding. At eight weeks of age the birds were weighed and placed on range. Pullets were brought to the laying house at 21 weeks of age, where egg production records were begun at 22 weeks. Since pullets of the same cross were randomly assigned to one pen and no pen replicates were available in each year, cross x year and pen effects are confounded for all traits except eight-week body weight.
STATISTICAL ANALYSIS
All traits measured on an individual pullet basis were corrected for hatch effects by the method described by FRIARS (1961), assuming no cross x hatch inter- action. The presence of cross x hatch interactions provides a possible source of error in applying hatch-correction factors. A preliminary analysis showed that highly significant (P < .01) hatch x cross effects were present for age at first egg and egg shape index in one year and eight-week body weight in two years.
Dow
nloaded from https://academ
ic.oup.com/genetics/article/55/1/5/5988744 by guest on 21 January 2022

GENETIC COMBINING ABILITY 7
It was concluded that hatch x cross interactions are probably not an important source of bias in these data, except perhaps for eight-week body weight.
The data include information on 56 crosses which may be classified into three types: 12 light, 12 heavy and 32 light x heavy and heavy x light crosses. Since differences among types of crosses may be confounded with specific combining ability variance in the genetic analysis, both the phenotypic and genetic analyses are carried out within each type of cross. The effects of crosses and years are assumed to be random. All analyses of variance are by the method of unweighted means.
Data for each trait were subjected to a phenotypic analysis based on the following model:
where Xqh, = I* + cq + y h 4- (cy),?, $- P q h + e q h b
X, , , P = grand mean,
= an observation on the tth progeny of the 4th cross in the hth year,
= qth cross effect; 4 = 1, . . . , c, = hth year effect; h = 1,. . . , y ,
= pen effect within year and cross and completely confounded with = random error; t = 1, . . . , nqh.
c, ' h (CY)qlk = interaction effect of the 4th cross with the hth year,
P,, eqht
Each term in the model except for p is assumed to be normally and independently distributed with mean zero and variances uZC, vZy, uZcE7, and u2,, respectively. The phenotypic analysis of variance and the expected mean squares are shown in Table 2.
Genetic analyses were carried out by averaging each cross mean over years and partitioning the sum of squares due to crosses into genetic sources of varia- tion. The mean square for the cross x year interaction divided by the number of years (three) was used as the error variance in the genetic analysis ( GRIFFING 1956a). This general procedure was followed for each of the three type-of-cross analyses.
The diallel analysis of variance model for the light and heavy type crosses presents a problem because the diagonal elements (inbred line means) are not
TABLE 2
The form of the phenotypic analysis of uariance for each type of cross
Source df Expected mean s q u a r 4
Crosses (C) Years (Y) C X Y Error
Dow
nloaded from https://academ
ic.oup.com/genetics/article/55/1/5/5988744 by guest on 21 January 2022

8 E. J. EISEN et al.
included. GRIFFING (1956a) gives an orthogonal partition of the cross sum of squares into general and specific combining ability effects and total reciprocal effects (general plus specific). The sum of squares for general combining ability presented by GRIFFTNG (1956a) contains a portion of the maternal and/or sex- linked effects. On the other hand, the method of HENDERSON (1948) yields a sum of squares for general combining ability corrected for maternal effects, but not for sex-linked effects in female progeny of homogametic male species (EISEN et al. 1966). HENDERSON’S model also provides a partitioning of the total recipro- cal effect sum of squares into general and specific reciprocal effects. However, the sums of squares in HENDERSON’S model are not mutually orthogonal.
COCKERHAM (1963) has presented a model which combines some of the ad- vantages of the two models previously described. The sums of squares are mu- tually orthogonal, which permits a clear statistical interpretation of the results. Also the reciprocal effect sums of squares are partitioned into general and spe- cific reciprocal differences, which permits a more refined description of genetic differences due to maternal and sex-linked effects. Although the sum of squares for general combining ability is identical to the one given by GRIFFING (1956a), the general reciprocal effect is included in the expectation of the general combin- ing ability mean square. Thus, general combining ability and general reciprocal effect mean squares may be estimated independently. For these reasons a modi- fication of the genetic analysis suggested by COCKERHAM (1963) was used to analyze the diallel among both the light and heavy type crosses.
The mathematical model for the genetic analysis of either the light or the heavy type crosses is given by x.. = 2 9 I” + gi + gi + mj + ~ 3 i + rzj + etj,
where
Xij = mean performance of a cross between sire line i and dam line j ( i , j = 1 , . . . , p ) , p = grand mean, gi ( g i ) = general combining ability effect of the ith (jth) line, mi = general reciprocal effect of the jth line, sii = specific combining ability effect of the ( i j ) th cross, rii = specific reciprocal effect of the (ij)th versus the (ji)th cross, e . . = random error. 23
TABLE 3
Analysis of variance and expected mean squares for the diallel cross experiment involving either light or heauy type crosses with reciprocals but no parental means
Source df Expected mean squarest
General combining ability P-1 U* + 202, + [ ( P - 2 ) / 2 1 + 2(P-2)u2g Specific combining ability P (P-3) / 2 U2 + 2u2 ,
General reciprocal P-1 U2 + 202, + (p/2)u*, Specific reciprocal ( P - 1 ) (P-2)/2 + 2 0 2 ,
Error [ P ( P - - l ) - - l ] (Y-1) u2
i U2 = (u2; + u2cy + u y y
Dow
nloaded from https://academ
ic.oup.com/genetics/article/55/1/5/5988744 by guest on 21 January 2022

GENETIC COMBINING ABILITY 9
Each effect in the model except p is assumed to be normally and independently distributed with mean zero and variances u'~, (U'; + u2c1, t u ' p ) , respectively. The diallel analysis of variance and expected mean squares are presented in Table 3. Note that the coefficients for 2,. and 2% in the expected mean squares are different from those given by COCKERHAM (1963). This is simply a matter of definition of effects and has been uscd to conform with the expected mean squares for total reciprocal effects presented originally by GRIF- FING (1956a) and the biological interpretation of these effects (EISEN et al. 1966). In addition, the specific reciprocal effect variance has been deleted from the ex- pected mean squares for general and specific combining ability, since it is assumed that r , 3 + r lc = 0 for all i and j .
The expected mean squares (Table 3) indicate that there is no direct statistic for testing general combining ability effects. An approximate F statistic (SAT- TERTHWAITE 1946) was used to test the null hypothesis that general combining ability effects are zero.
The genetic analysis for the light x heavy and their reciprocal crosses is based on a straightforward three-way factorial experiment since the diagonal elements
u2,. and u2 =
are present. The analysis of variance model is given by X l l h = p + glL) + gre 1 + dLJH) + b k + mli) + m f H ) + r(rd,H) + e,,k ,
11 ik c i k
where
X i jk = mean performance of a cross of the ith light line mated with the jth heavy line in the kth parental arrangement (i = 1: . . . , p ; j = 1, . . . , p'; k = 1,2),
.U =grandmean, dLJ g f H ) s ( L . , H ) = specific Combining ability (interaction) effect of a cross between the ith light line
b,
ml:) = general reciprocal effect of the ith light line, m ! H ) = general reciprocal effect of the jth heavy line,
I k r!L,HJ = specific reciprocal effect of a cross between the ith light line and jth heavy line in
1 I k
e i j k = random error.
= general combining ability effect of the ith light line, = general combining ability effect of the jth heavy line,
11 and jth heavy line,
indicates H 8 >:L 9 ), = effect of the kth parental arrangement ( k = 1 indicates L 8 x H 9 and k = 2
the kth parental arrangement,
Since this is a mixed model, the random variables (all but ,U and the bk) have the following assumed characteristics:
(1) The sets of random variables [g.',")], [ g y ) ] , by,^)], [m::)], [m::)], [mi:'], [":'I, I - c 1 1 [ T ( ~ , ~ ) ] , 112 [ e , j k ] are, within sets, mutually independent and normally distributed with zero means, and variances u 2 9 ( L ) , u2s(H) , u 2 , ( L , H ) ,
u Z m ( L ) , u',n(L), U',("), ~ ' ~ ( r , ) , @ ' r ( L , H ) , @'r (L ,H) , and U' = % (U'; + uzCy + U',), respectively.
(2) Fairs of random variables from different sets are also independent, with the following exceptions:
Dow
nloaded from https://academ
ic.oup.com/genetics/article/55/1/5/5988744 by guest on 21 January 2022

10 E. J. EISEN et al.
i) mi:) + m:.) ii) m;:) + m!H)
iii) m!4jH' + m ! L , H j = 0 , > i j = 1, . . . , 4
= 0, i = 1, . . . , 4 = 0, j = 1, . . . , 4
3 2
. b k = 0. The effects defined in the model are analogous
2 1 1 2 3 2
It also is assumed that to those given for the within light arid within heavy type of cross genetic analysis. The analysis of variance and expected mean squares are presented in Table 4. The approximation given by SATTERTHWAITE (1946) was used to test for the statistical significance of the parental arrangement effect.
RESULTS AND DISCUSSION
Phenotypic analyses: Means, error degrees of freedom and harmonic means for each trait and type of cross are given in Table 5. Variance components obtained from the phenotypic analyses of variance are presented in Table 6. The residual variance ( G Z e ) accounts for the largest proportion of total variability for all traits within each type of cross. The residual variance for the first ten traits contains genetic variance due to segregation as well as random environmental variance, since the inbred lines are not completely homozygous.
The theoretical error variance for percent adult mortality, percent blood spots and percent meat spots is not derived from the data, but is the expected variance based on the distribution of its arcsine transformation. Therefore it is not subject to the same interpretation given for the other ten traits.
The cross x year interaction components of variance are large and significant for most traits within each type of cross. Since no pen replicates were available within years and crosses, no pen effects are included in the error term of the phenotypic analyses. However, pen effects are contained in all other mean squares and could account for the high frequency of significant interactions between
TABLE 4
Analysis of variance and expected mean squares for the experiment involving light x heavy rype crosses and reciprocals
Source df Expected mean squares.
General combining
General combining
Specific combining
Parental arrangement
ability (Heavy) p'-I (7' + 2U',(L,") + 2 P W 2 9 f H )
ability (Light) P - 1 + 2u2,q(L,H) + 2p'02g(L)
ability (P'-l) ( P P I ) f &'s(L,H) 1 0' + a'r(L,Hj + P 0 2 , ( H , + P'u2m(L) + P P ' C ( b )
General reciprocal
General reciprocal
Specific reciprocal ( ~ ' - 1 ) ( ~ - 1 ) 0' + 0'r(L,II)
Error (PP'-- l ) (Y-1) (1'
(Heavy) p'-I + 02r (L ,H) $- Po2mfH)
(Light) P-1 + 0 2 r ( L , H ) + p'u2m(L)
* 0' = (0:- + u y / y
Dow
nloaded from https://academ
ic.oup.com/genetics/article/55/1/5/5988744 by guest on 21 January 2022

GENETIC COMBINING ABILITY
TABLE 5
Means, error degrees of freedom a d harmonic means for each trait and iype of cross
11
- - Trait x e SE df n
A. Light crosses: Age at first egg 27.42 t .46 8-week body wt 1.43 t .02 55-week body wt 4.37 t .08
U.S.D.A. egg quality score 3.71 t .35 Specific gravity score 2.55 t .18
.7% t ,010
% egg prod. (whole) 50.43 k 1.17 % egg prod. (second part) 48.58 t 1.49 % adult mortality 39.32 t 3.01 % blood spots 16.71 F 2.54 % meat spots 39.41 t 3.56
Age at first egg 27.04 t .74 8-week body wt 1.58 F .02
55-week egg wt 58.39 t 1.27 U S.D.A. egg quality score 4.19 t .35 Specific gravity score 2.35 t .15 Egg shape index .731 F .011 % egg prod. (first part)-) 62.95 t 1.4.6 % egg prod. (whole) 54.65 t .98 % egg prod. (second part) 52.53 F .99 % adult mortality 30.74 * 4.88 % blood spots 8.93 +- 1.34 % meat spots 54.70 t 3.41)
Age at first egg 26.M t .76 8-week body wt 1.55 t .02 55-week body wt 4.90 F .13 55-week egg wt 59.14 * .78 U.S.D.A. egg quality score 4.04 t .36 Specific gravity score 2.60 t .08 Egg shape index ,744 t ,013 % egg prod. (first part)-) 60.60 * .95 % egg prod. (whole) 53.82 t 1.00 % egg prod. (second part) 51.99 t 1.09 % adult mortality 36.04 F 4.18
11.10 t 1.49 % meat spots 43 06 k 2.15
55-week egg wt 57.78 t .m
Egg shape index % egg prod. (first part)+ 54.97 3= 3 4
B. Heavy crosses:
55-week body wt 5.37 t .I2
C . Light x heauy and heavy x light crosses:
% blood spots
889 841 702 45 1 499 515 516 537 543 541 CO CO
W
1149 1097 994 792 803 819 820 833 859 855 CO X
oc
2806 2821 2265 1662 1677 1693 1694 2007 1868 1865
CO
CO
W
24.19 22.81 17.08 8.20 9.93 9.93 9.93 9.10
12.67 12.67 26.84 15.10 15.10
29.82 29.43 25.48 18.42 17.67 17.67 17.67 8.71
19.78 19.76 31.27 35.04 35.04
27.50 28.26 21 .I 1 13.83 14.80 14.80 14a.80 10.64 16.14 16.13 29.31 30.43 30.43
+ 411 percentage data are given as arcsine values.
crosses and years. An additional contribution to the large C x Y interaction may be the sampling each year of sires and dams from lines which are not homo- zygous.
Dow
nloaded from https://academ
ic.oup.com/genetics/article/55/1/5/5988744 by guest on 21 January 2022

12 E. J. EISEN et al.
TABLE 6
Variance components for the phenotypic annlyses
Variance components:
p Traits C2C sal. ci'cu
A.
B.
C.
Light crosses: Age at first egg 8-week body wt 55-week body wt 55-week egg wt U.S.D.A. egg quality score Specific gravity score Egg shape index % egg prod. (first part) % egg prod. (whole) % egg prod. (second part) % adult mortality % blood spots % meat spots Heavy crosses: Age at first egg 8-week body wt 55-week body wt 55-week egg wt U.S.D.A. egg quality score Specific gravity score Egg shape index % egg prod. (first part) % egg prod. (whole) % egg prod. (second part) % adult mortality % blood spots % meat spots Light x Heavy and Heavy Age at first egg 8-week body wt 55-week body wt 55-week egg wt U.S.D.A. egg quality score Specific gravity score Egg shape index % egg prod. (first part) % egg prod. (whole) % egg prod. (second part) % adult mortality % blood spots % meat spots
.IO .0027* .031* 1.94 .03 .07*
.00002 .22
12.31** 14.05 * * 75.35** -.20
-7.78
.51** .0036** .007 5.44** .oo .09*
.oooo7** 6.71 5.32' 6.05* 6.09
17.94* -8.10
x Light crosses: .72**
.0015** .021* * 4.28** .13** .08*
.00013** 7.62'
14.04** 14.46** 49.64** 11.22f * 35.33**
.47 .WO7 .006 .57 .29* * .06*
.00001 .35 -.a
2 2 -2.98 4 . 5 7 29.33'
1.46* * .OOO8* .031* 3.24' * .36** .04*
.00002* * 3.01
.64
.44 63.37**
-4 .43 28.31**
1.64* * .0017** .045** 1.32** .38**
-.04 .moo
1.30 1.32* 1.78**
46.27** 4.58**
10.20* *
1.27** .0027** .036* 3.77** .05* .06
.OOOO8* 7.44' 6.45** 4.86'
69.94** 180.26** 50.91**
.34** .0022* * .078** 1.91** .05* .08*
. m o 4.79 6.71** 7.59**
58.17** 41.39* 8.40
.38** .0036** .039** 1.38** .w** .26* *
.00006** 10.12** 7.09* * 7.90**
18.%** 5.85
13.79**
10.16 .0250 .358
15.66 .85
1.68 .00075 116.57 76.27 80.45
821 .GQ$ 821 .OO$ 821 .OO$
9.24 ,0282 ,4437
16.02 1.18 1.52
.00069 137.79 73.38 78.24
821.00$ 821 .OO$ 821.00$
6.05 .0268 .400
17.01 1.10 1.78
,00126 133.00 74.40 83.06
821 .OO$ 821 .OO$ 821.00i
t Approximate tests of significance based on F test involving the appropriate mean squares.
* P < .05. Theoretical variance of arcsine transformation.
* * P < .Ol.
The variance component due to years (&) within the light type crosses is significant at P < .01 for U.S.D.A. score and at P < .05 for age at first egg,
Dow
nloaded from https://academ
ic.oup.com/genetics/article/55/1/5/5988744 by guest on 21 January 2022

GENETIC C O M B I N I N G ABILITY 13
specific gravity score and percent meat spots. The variance components for years are significant for nine of the traits within the heavy type crosses and for ten of the traits within the light x heavy types. The variance components due to years for age at first egg accounted for 12.64% and 18.65% of the total variance in the heavy and light x heavy types of crosses, respectively. Egg weight at 55 weeks of age is the only other trait where eZy accounted for more than 10% of the total variance. The results suggest that year effects are an important source of vari- ability for some traits and emphasizes the need for testing all crosses in each year.
The variance component among crosses, 6.2c, reflects the presence of genetic variability. In the light type crosses, accounts for 7% or more of the total variance in eight and 55-week body weights, 55-week egg weight, percerzt egg production (second part and whole year records) and percent adult mortality. The cross variance component accounts for 3.74% of the variance in specific gravity score. The remaining traits show little variance aniong crosses.
For the heavy type crosses, genetic variability appears to be present for eight of the 13 traits studied. The traits showing no evidence of variability among crosses are 55-week body weight, U.S.D.A. score, percent egg production (first part), percent adult mortality and percent blood spots.
In contrast the genetic variability among the light x heavy and heavy X light type crosses is larger than for Crosses within the light and heavy types. The cross variance component is significant for all traits. The increased frequency of sta- tistical significance for G~~~ may be due, in part, to the greater number of degrees of freedom available in this analysis relative to the previous two analyses. In addition, the increase in 6."(. might be expected because of the greater genetic diversity among the parental inbreds used to form this set of crosses.
The phenotypic analysis has demonstrated the presence of genetic variability among crosses for a number of the traits studied. However, of greater relevance is an analysis of the magnitude of the types of genetic variability present among the crosses.
Genetic analyses: The presence of pen effects in the cross sum of squares has been mentioned previously. A specific pair of reciprocal crosses in two separate pens within a year may be considered as two replicate pens within a year. Thus, 62T and I , ) include replicate pen effects as well as genetic effects. The genetic portion of the specific reciprocal effect variance consists 01 a complex of inter- actions between autosomal and maternal or sex-linked effects.
The ratio of the mean square for specific reciprocal effects to the error mean square for the genetic analysis ( e 2 ) is distributed approximately as F under the null hypothesis that G~,. [or L + ~ ~ ( ~ , ~ , ] = 0. Since pen effects are present in both mean squares, a rejection of the null hypothesis infers the presence of specific reciprocal genetic effects. In only one case was the null hypothesis rejected (percent egg production in the first part of the laying year for the heavy type crosses). However, the whole and second part year records did not show a sig- nificant F ratio. Therefore, it is concluded that interactions involving autosomal and maternal or sex-linked genetic effects are negligible for the traits studied. Thus the error sum of squares for the genetic analyses was pooled with the specific
Dow
nloaded from https://academ
ic.oup.com/genetics/article/55/1/5/5988744 by guest on 21 January 2022

14 E. J. EISEN et al.
Dow
nloaded from https://academ
ic.oup.com/genetics/article/55/1/5/5988744 by guest on 21 January 2022

GENETIC COMBINING ABILITY 15
E
5 € E a
j >
1 1
vi z 2 a 9 2 0)
m c .s g:
b ; 46
:P z s
h: O G -2s 22 2 s 8 Bg & Z V
.* 3
0' 2 0
.- * m m + y I
fie
* E
c a . c c . ." 3
.B,& = m:
z 2
a , . a,;'" a WV
r i o * U
'F: U '5 S U
c c
- y /
:$?
22 p, -,--CF.
1 1 1 * m m
a 2 ;.
o i l r i b ; 1 - 3
I X l x - c)
m a
m b D ,--. 4-
m a
i-"
Y
i: v
$ a D 8
l i j / U
Dow
nloaded from https://academ
ic.oup.com/genetics/article/55/1/5/5988744 by guest on 21 January 2022

16 E. J. EISEN et al.
reciprocal effect sum of squares for all traits in order to provide a greater number of degrees of freedom to estimate more efficiently the remaining components of genetic variance. This pooling procedure should not cause an appreciable decrease in the power of the statistical tests, since the null hypothesis is not rejected at P < .25 for 32 of the 39 traits.
The estimates of the components of genetic variance and their percentages are presented in Table 7. The error variances are expressed on a mean basis which increases the precision of the estimates of genotypic variance (GRIFFING 1956a). It should make no difference whether the error variance is expressed on an individual or a sub-class mean basis so far as tests of significance are con- cerned, since the F ratios would be exactly the same in either case. The number of degrees of freedom available for each of the genetic variances are relatively small. For this reason, there are some discrepancies in tests of significance be- tween the phenotypic and genetic analyses. The procedure followed to evaluate the importance of a particular component of variance was to consider both its relative magnitude and the test of significance of the corresponding mean square.
The concept of general combining ability uariance was introduced by SPRAGUE and TATUM (1 942) with reference to the average differences among lines in cross combination. The estimates of general combining ability variance [ GZg, 6zg(Lj, G Z g ( H ) ] in the present analysis include additive autosomal genetic variance plus a fraction of epistatic variance, but do not contain general reciprocal effects (sex- linked and/or maternal effects). Thus, G~~ is defined as the general combining ability variance among light (or heavy) type lines in light (or heavy) type crosses, whereas G Z g ( L ) and 6zg(H) are the general combining ability variances of light and heavy type lines, respectively, in light x heavy and heavy x light crosses.
Estimates of general combining ability variance (Table 7) in the light type crosses are large for eight and 55-week body weights, U.S.D.A. egg quality score, second part and whole year survivors’ percent egg production, percent adult mortality and percent blood spots. However, only the last mentioned character reached statistical significance (P < .05) for GZg. General combining ability vari- ances in the heavy crosses are high for eight-week body weight, 55-week egg weight, U.S.D.A. egg quality score, specific gravity score, egg shape index, second part and whole year survivors’ percent egg production, percent adult mortality and percent meat spots. Of these nine traits, only eight-week body weight and egg shape index are significant (P < .OS). Estimates of & 2 g ( L j are significant for all traits except specific gravity score, percent egg production (first part) and percent blood spots, while significant estimates of 2g(Hj are obtained for all traits except eight-week body weight and percent blood spots. Additive genetic variance clearly accounted for the largest proportion of the genetic variation for most of the traits studied.
In general, it is difficult to see any correspondence between the magnitude of the estimates of general combining ability variance of light (heavy) type lines in light (heavy) crosses compared with light x heavy and heavy x light crosses. For example, 6.2g(L) accounts for 20% of the total variance in age at first egg,
Dow
nloaded from https://academ
ic.oup.com/genetics/article/55/1/5/5988744 by guest on 21 January 2022

GENETIC COMBINING ABILITY 17
whereas 62g in light crosses does not account for any measurable variability. In contrast, the theoretical expectation of kZg in light crosses is equal to 62g(L) in light x heavy and heavy x light crosses. Part of this discrepancy may be due to sam- pling effects since only four lines of each type have been sampled. The rank corre- lation between the average of a line in the intra-type and inter-type crosses was calculated for each trait in the light and heavy groups. Unfortunately an adequate test statistic for a sample size of four is not available. However, the results indi- cated a positive trend. The rank correlations between inter- and intra-type per- formance were positive for 9 and 12 traits in the light and heavy lines, respec- tively. The rank correlations were .8 or above for eight traits in the light types (age at first egg, eight and 55-week body weight, 55-week egg weight, egg shape index and the three measures of egg production) and seven traits in the heavy types (age at first egg, 55-week egg weight, egg shape index, the three measures of egg production and adult mortality).
Estimates of general combining ability variance in poultry comparable to those in the present study are not available. GOTO and NORDSKOG (1959), using the analysis presented by HENDERSON (1948). obtained estimates of general com- bining ability variance separately among white-egg (light) type and brown-egg (heavy) type fowl. However, EISEN et al. (1966) have shown that some sex- linked effects are included in these estimates, when female progeny of homo- gametic male species such as poultry are considered. MERRITT and GOWE (1960) and YAO (1961) used Model I11 of GRIFFING (1956a) to estimate general com- bining ability variance, but these estimates are biased upward by both maternal and sex-linked variances. YAO (1961) and WEARDEN et al. (1965) estimated general combining ability variance by the method outlined by HAYMAN ( 1954). Since the inbred lines are included in the analysis of YAO (1961) and WEARDEN et al. (1965), general combining ability and other genetic effects are confounded with inbreeding effects. REDMAN and SHOFFNER (1961) assumed that the lines considered in their study were fixed so that estimates of genetic variances were not obtained. HILL and NORDSKOG (1958) and GOTO and NORDSKOG (1959) reported estimates of general combining ability variance among light type male lines and heavy type female lines. However, since reciprocal crosses were not obtained, general reciprocal effects of light [62m(L,] and heavy types [ 6 2 m ( H ) ]
were confounded with general combining ability variances. Specific combining ability eflects refers to the average inferiority or superiority
of a cross relative to the average performance of the lines involved in that cross ( SPRAGUE and TATUM 1942). The estimates of specific combining ability variance [62d, 62g(L,H,] contain the dominance variance of genes plus a fraction of the epistatic variance among means of crosses. The value 62sfL,H) estimates non- additive genetic variance between light and heavy types, while 62s estimates nonadditive genetic variance within the light o r heavy type crosses.
Specific combining ability variance estimates are highest among light crosses for age at first egg, specific gravity score and percent adult mortality, and among heavy crosses for age at first egg, 55-week egg weight, specific gravity score, percent meat spots and survivors' percent egg production (second part and whole
Dow
nloaded from https://academ
ic.oup.com/genetics/article/55/1/5/5988744 by guest on 21 January 2022

18 E. J. EISEN et al.
year records). Nonadditive genetic variance accounted for a greater portion of the total variance than did additive genetic variation for age at first egg, specific gravity score and percent meat spots among light crosses and for age at first egg and percent meat spots among heavy type crosses. Estimates of & 2 8 ( L , H ) are high for 55-week egg weight, percent blood spots and U.S.D.A. visual score. There is no apparent association between intra-type and inter-type nonadditive genetic variance in these populations. However, all of these observations must be inter- preted with caution since only two traits showed significant (P < .05) specific combining ability variance (meat spots in heavy crosses and egg weight in heavy X light crosses).
GOTO and NORDSKOG (1959) reported zero estimates of G~~ among light type crosses for age at 50% egg production, percent laying house mortality, egg weight and 300 day hen-housed percent egg production. The latter two traits show agree- ment with the present study but the former two do not. GOTO and NORDSKOG (1959) also reported large estimates of GZ9 among heavy type crosses for 300 day hen-housed percent production, egg weight and percent laying house mortality and a zero estimate for age at 50% production. Only the first two traits show agreement with the present data.
HILL and NORDSKOG (1958) and GOTO and NORDSKOG (1959) presented esti- mates of specific combining ability variance for nine traits among light x heavy crosses without reciprocals. These estimates included specific reciprocal effects [ @ T f & , " ) ] because reciprocal crosses were omitted. Since the evidence from the present data suggests that G ~ ~ ( ~ , ~ ) = 0, it would appear reasonable to compare results. The data presented by HILL and NORDSKOG (1958) indicate that specific combining ability variance among the light x heavy single crosses they studied is not important for adult body weight, eight-week body weight, age at first egg, percent laying house mortality and March egg weight. HILL and NORDSKOG (1959) found no significant interaction between light male and heavy female crosses for age at 50% production, 269 day hen-housed production and egg weight, while percent laying house mortality was significant at P < .05 for this source of variation.
General reciprocal effects was defined statistically by HENDERSON (1948) as the average difference between a line used as a sire versus the same line used as a dam. Although HENDERSON (1948) interpreted general reciprocal effect vari- ance biologically as being a function of maternal variance, EISEN et al. (1966) have shown that in male homogametic species, the general reciprocal effect variance among female progeny [kZm, hZmIL), 52m(H,] contains the additive sex- linked and maternal variances.
The estimates of aZI, are significant for 55-week body and egg weight and sur- vivors' percent egg production in the light type crosses and for age at first egg and 55-week egg weight in the heavy type crosses. Estimates of G Z m ( L ) are signifi- cant for 55-week body weight and survivors' percent egg production, while GZm(H) is important for age at first egg, 55-week egg weight, egg shape index and percent meat spots. It is of interest that some of the traits exhibiting important general reciprocal effects in intra-type crosses also do so in inter-type crosses. GOTO and
Dow
nloaded from https://academ
ic.oup.com/genetics/article/55/1/5/5988744 by guest on 21 January 2022

GENETIC COMBINING ABILITY 19
NORDSKOG (1959) provided evidence for the existence of general reciprocal effects in the case of age at 50% production, 300 day hen-housed percent egg production in light and heavy type single crosses and egg weight in heavy type crosses, which is in general agreement with the present results. However, the interpretation of these effects by GOTO and NORDSKOG (1 959) as being due strictly to maternal variance must be amended to include additive sex-linked variance.
Parental arrangement effects in the light x heavy plus reciprocal cross analysis are significant for age at first egg, specific gravity score and percent adult mor- tality. On the average, a shorter time was required to attain sexual maturity among means of the crosses studied, when the light line was used as the male parent and the heavy line as the female parent in 15 of the 16 pairs of reciprocal crosses. When the male parent was a Leghorn, percent mortality was greater in 13 of the 16 comparisons. These results on overall reciprocal differences of light x heavy and heavy x light crosses are in agreement with the findings of WARREN and MOORE (1956), NORDSKOG and PHILLIPS (1960) and HUTT (1961). HUTT (1961) found evidence that the higher viability of females from sires of heavy breeds may be attributable to the significantly higher level of broodiness in that group. NORDSKOG and PHILLIPS (1960) attributed the mortality differences to the Leghorn sex chromosome and not to maternal effects. However, COCK and MORTON (1963) and EISEN et al. (1966) have shown that sex-linked and maternal effects are completely confounded in female progeny of homogametic male species. The association between sexual maturity, adult mortality and broodiness probably has a genetic basis and warrants further investigation.
The authors are indebted to DRS. DEWEY HARRIS and GORDON DICKERSON for their helpful suggestions and criticisms of the manuscript.
SUMMARY
An eight by eight diallel cross experiment among four light and four heavy type inbred lines of poultry was conducted over a three year period. Estimates of the magnitudes of genetic variability for 13 traits were made within light, heavy and light by heavy type crosses. The data were analyzed such that general combining ability variance provided an estimate of additive autosomal genetic variance, unbiased by additive maternal or sex-linked variances. General com- bining ability variance was the most important type of genetic variability for the majority of traits studied. Specific combining ability variance was low in magni- tude for most traits, indicating that dominance and epistatic variance was of little importance. General reciprocal effect variance accounted for a large amount of variation in a number of traits. The general reciprocal effect variance contains additive sex-linked and maternal effects. Specific reciprocal effects did not con- tribute significantly to the genetic variance of any of the traits considered.
Dow
nloaded from https://academ
ic.oup.com/genetics/article/55/1/5/5988744 by guest on 21 January 2022

20 E. J. EISEN et al.
LITERATURE CITED
COCK, A. G., and J. R. MORTON, 1963
COCKERHAM, C. C., 1963
Maternal and sex-linked effects on size and conformation in the domestic fowl. Heredity 18: 337-350.
Estimation of genetic variances. Statistical Genetics and Plant Breeding. Edited by W. D. HANSQN and H. F. ROBINSON. Natl. Acad. Sci., Natl. Res. Council Publ., Washington, D.C.
A study of genetic combining ability among inbred lines of poultry in single crosses, double crosses and top crosses. Unpublished Ph.D. Thesis. Purdue University Library, Lafayette, Indiana.
EISEN, E. J., B. B. BOHREN, and H. E. MCKEAN, 1966 Sex-linked and maternal effects in the diallel cross. Australian J. Biol. Sci. (In press).
FRIARS, G. W., 1961 The effect of selection on genetic variances of some traits of the fowl. Unpublished Ph.D. Thesis. Purdue University Library, Lafayette, Indiana.
GOTO, E., and A. W. NORDSKOG, 1959 Heterosis in poultry. 4. Estimation of combining ability variance from diallel crosszs of inbred lines i n the fowl. Poultry Sci. 38: 1381-1388.
GRIFFING, B., 1956a Concept of general and specific combining ability in relation to diallel crosses. Australian J. Biol. Sci. 9: 463-4.93. - 1956b A generalized treatment of the use of diallel crosses in quantitative inheritance. Heredity 10: 31-50. - 1958 Appli- cation of sampling variables in the identification of methods which yield unbiased estimates of genotypic variance components. Australian J. Biol. Sci. 11: 219-245.
EISEN, E. J., 1965
HAYMAN, B. I., 1954 HENDERSON, C. R., 1948
The analysis of variance of diallel crosses. Biometrics 10: 235-244. Estimation of general, specific and maternal combining abilities in
crosses among inbred lines of swine. Unpublished Ph.D. Thesis. Iowa State University Library, Ames, Iowa.
Heteromsis in poultry. 3. Predicting combining ability of performance in the crossbred fowl. Poultry Sci. 37: 1159-1169.
Differential mortality in reciprocal crosses between Leghorns and heavy breeds. (Abstr.) Poultry Sci. 40: 1418.
HILL, J. F., and A. W. NORDSKOG, 1958
HUTT, F. B., 1961
KEMPTHORNE, O., 1956 MATZINGER, D. F., and 0. KEMPTHORNE, 1956
ing and interactions with environment. Genetics 41 : 822-833. MERRITT, E. S., and R. S. GOWE, 1960
type fowl. Can. J. Genet. Cytol. 2: 286-294. NORDSKOG: A. W., and R. E. PHILLIPS, 1960
Leghorns, heavy breeds and Fayoumi. Poultry Sci. 39: 257-263. REDMAN, C. S., and R. N. SHOFFNER, 1961 Estimates of egg quality parameters utilizing a
polyallel crossing system. Poultry Sci. 40: 1662-1675. SATTERTHWAITE, F. E., 1946 An approximate distribution of estimates of variance components.
Biometrics Bull. 2: 110-114. SPRAGUE, G. F., and L. A. TATUM, 1942 General vs. specific combining ability in single crosses
of corn. J. Am. Soc. Agron. 34: 923-932. WARREN, D. C., and C. H. MOORE, 1956 Adult mortality in reciprocal crosses of Leghorns and
heavy breeds. (Abstr.) Poultry Sci. 35: 1178. WEARDEN, S., D. TINDELL, and J. V. CRAIG, 1965 Use of a full diallel cross to estimate general
and specific combining ability in chickens. Poultry Sci. 44: 104.3-1053. YAO, T. S., 1961 Genetic variations in the progenies of the diallel crosses of inbred lines of
chickens. Poultry Sci. 40: 104.8-1059.
The theory of the diallel cross. Genetics 41: 451459. The modified diallel table with partial inbreed-
Combining ability among breeds and strains of meat
Heterosis in poultry. 5. Reciprocal crosses involving
Dow
nloaded from https://academ
ic.oup.com/genetics/article/55/1/5/5988744 by guest on 21 January 2022