Embed Size (px)
Citation preview

Behavior Genetics, Vol. 17, No. 4, 1987
Genetic and Environmental Factors in Primary Dysmenorrhea and Its Relationship to Anxiety, Depression, and Neuroticism J~ L. Silberg, 1'2 N. G. Martin, 1'3 and A. C. Heath 1'4
Received 10 June 1986--Final 29 Apr. 1987
Over 1200 pairs o f female monozygotic and dizygotic twins with regular menses reported on the amount of flow, severity o f pain, and degree of limitation experienced during menstruation. Fifty-two percent o f the women reported moderate or severe menstrual pain and these reports were fairly repeatable (0.62-0.80) over a 3-month interval. Heritabilities were 0.22 for flow, 0.38 for pain, and 0.36 for limitation. Covariations between menstrual symptoms and the symptoms and personality vari- ables o f state anxiety and depression and trait neuroticism were shown to be almost entirely genetic in origin. There was also gene action spe- cifically affecting menstrual pain and also menstrual flow, but genetic variation in limitation was entirely due to genes also affecting flow, pain, and personality variables--neuroticism in particular.
KEY WORDS: primary dysmenorrhea; genetics; anxiety; depression; neuroticism; twins.
I N T R O D U C T I O N
M e n s t r u a l pa in that occurs in the absence of d e m o n s t r a b l e organic pe lv ic pa tho logy is t e rmed p r ima ry d y s m e n o r r h e a . S ince mos t w o m e n experi -
The collection of these data was supported by grants from the Australian National Health and Medical Research Council to NGM, Drs. J. D. Mathews and J. B. Gibson. Analysis of the data was supported in part by NIH Grants AA06781, MH40828, GM30250, AG04954, and GM32732.
1 Department of Human Genetics, Box 33, MCV Station, Medical College of Virginia, Vir- ginia Commonwealth University, Richmond, Virginia 23298.
z Department of Psychology, Virginia Commonwealth University, Richmond, Virginia 23298.
3 Present address: Queensland Institute of Medical Research, Bramston Road, Herston, Queensland 4006, Australia.
4 To whom correspondence should be addressed.
363 0001-8244/87/0700-0363505.00/0 �9 1987 Plenum Publishing Corporation

364 Silberg, Martin, and Heath
ence some degree of discomfort or cramping during menstruation, the diagnosis of dysmenorrhea is reserved for those women whose pain is severe enough to limit normal activity or to require medical treatment (Jay and Taylor, 1981). The prevalence of this disorder has been estimated to range from 50 to 60% (Coppen and Kessel, 1963; Jeffcoate, 1975), making painful menstruation a common experience for a substantial num- ber of women. In terms of economic impact, dysmenorrhea has been estimated to account for 140 million lost working hours annually in the United States alone and is considered the greatest cause of lost working days among young women (Kistner, 1972).
The symptoms of dysmenorrhea usually begin approximately 6-12 months following menarche (Kulig, 1972). Dalton (1976) differentiated two subtypes of dysmenorrhea, each having its own symptomatology. Conges- tive dysmenorrhea, synonymous with premenstrual syndrome (PMS), generally occurs prior to the onset of menstruation. The pain associated with it involves the lower abdomen, back, and breasts and is accompanied by generalized joint pain and headaches. It is further described as heavy, dragging and continuous. Spasmodic dysmenorrhea is described as con- tractile pain that may occur a few hours before or at the onset of men- struation and may persist for a few hours or up to 3 days. The pain is described as "sharp suprapubic pain with radiation to the lower back and anterior thighs, and may be accompanied by gastrointestinal and vascular symptoms including nausea, vomiting, diarrhea, headache, irritability, fatigue, and syncope" (Abraham, 1978). Evidence to support Dalton's differentiation of dysmenorrhea into distinct subtypes, however, is at present mixed. Using the Menstrual Symptom Questionnaire developed by Chesney and Tasto (1979) and the Moos Menstrual Distress Ques- tionnaire (Moos, 1968, 1985), Taylor (1979) and Silberg (1984), respec- tively, have found a positive and substantial correlation between items reflecting spasmodic symptoms and those reflecting congestive symptoms.
Research regarding the pathophysiology of dysmenorrhea suggests that the pain accompanying this disorder is caused by hyperactivity of the uterine muscle, subsequent reduction in blood flow, and concomitant uterine ischemia (Akerlund et al., 1976; Akerlund, 1979). Several factors have been proposed which may be involved in uterine hypercontractility: they include (1) ovarian steroids, (2) cervical obstruction, (3) pituitary hormones, and most notably (4) prostaglandins. It has been demonstrated that prostaglandin production in the uterine lining is up to seven times greater in women with clinically diagnosed dysmenorrhea as compared with controls (Yliklorkala and Daywood, 1978), and successful treatment

Primary Dysmenorrhea 365
of this disorder has been found with drugs that inhibit prostaglandin syn- thesis (Bochm and Sarrat, 1975; Csapo et al., 1977) and reduce uterine hypercontractility [e.g., naproxen, ibuprofen (Csapo et al., 1977; Pulkinen and Csapo, 1978)]. We have found associations among oral contraceptive usage, parity, and menstrual pain [pain being increased in nuUiparous women and those not using contraceptives (Austin et al., 1985)] and these risk factors, and their interactions with genotype, will be the subject of future publications.
Psychological factors have also been implicated in the etiology of dysmenorrhea. Past research typically associated the disorder with "re- jection of the feminine role" (Menninger, 1939). However, attempts to demonstrate a relationship between menstrual distress and femininity re- main inconclusive: some investigators have found support for this hy- pothesis (Berry and McQuirre, 1972; Wittkower and Wilson, 1940; Men- ninger, 1939), while others have not (Shrader and Ohly, 1970; Bloom et al., 1978; Chernovety et al., 1979). Similarly some have found evidence that dysmenorrheic sufferers are more neurotic than nonsufferers (Sains- bury, 1960; Levitt and Lubin, 1967), but others have not (Schunckh, 1951 ; Coppen and Kessel, 1963; Hirt et al., 1967). An association between af- fective disorder and premens t rua l dysphoria has, however, been a con- sistent finding (e.g., Kashwagi et al., 1976; Halbreich and Endicott, 1985).
Despite the suspected role of heredity in dysmenorrhea, relatively little research has addressed this important aspect of the disorder. Kan- tero and Widholm (1972) in Finland found a correlation of 0.19 for dys- menorrhea in a sample of 1080 pairs of mothers and their daughters who had been menstruating for at least 5 years. Rose and Monroe (1985) also report significant correlations for menstrual attitudes and symptoms in female relatives. However, shared genes and shared family environment can each cause parent-offspring similarity so this cannot be regarded as conclusive evidence for hereditary predisposition. If familial aggregation for dysmenorrhea is determined solely by genetic differences acting ad- ditively over a number of loci, then we would predict from the results of the Finnish study that the monozygotic and dizygotic correlations should be 0.38 and 0.19, respectively.
The present study was undertaken in order to explore paths by which genetic and environmental factors may influence dysmenorrhea and re- lated menstrual symptoms. Its purpose was twofold: (1) to determine the influence of genetic and environmental factors in the report of menstrual symptoms and (2) to find the extent to which such factors are mediated through symptoms and personality variables such as state anxiety and depression and the Neuroticism trait.
366 Silberg, Martin, and Heath
METHODS
Subjects
Between November 1980 and March 1982, questionnaires were mailed to 5967 adult (>18 years) twin pairs throughout Australia. The twins were all volunteers who had enrolled in the Australian NH&MRC Twin Register. After one or two reminders to nonrespondents, completed questionnaires were returned by both members of 3810 pairs (including 1984 female-female pairs), a 64% pairwise response rate.
Diagnosis of zygosity of same-sex pairs was based on their responses to questions about physical similarity and confusion in recognition and has been described elsewhere (Jardine et al., 1984). Among the female- female twins were 1233 pairs diagnosed as monozygotic (MZ) and 751 pairs as dizygotic (DZ). This excess of MZ pairs is a common feature of volunteer twin samples and has been presumed to be due to sampling bias, MZtwins being more cooperative (Lykken et al., 1978). But it could also be due to truncate selection on a latent scale that we may call "Co- operation," which itseff has a genetic component (Martin and Wilson, 1982).
Prior to mailing the questionnaire to the entire adult sample, a pilot questionnaire had been mailed to 100 pairs in order to assess the likely response rate and any problems in construction of the questionnaire. When the main study was conducted some months later, 96 individuals (including 64 females) from the pilot sample returned a second question- naire and these duplicate responses have been used to assess the short- term repeatability of our measures.
Items and Scales
The questionnaire sought information on many biomedical variables including smoking (Hannah et al., 1985), drinking (Jardine and Martin, 1984), sleeping habits (Heath et al., 1987), personality (Martin and Jar- dine, 1986), and attitudes (Martin et al., 1986). Females were also asked to complete a page on their reproductive history, including items on men- struation, contraception, pregnancy, and childbearing. Analysis of side effects of oral contraceptive usage is reported elsewhere (Martin et al., 1987) and in this paper we turn our attention to causes of individual dif- ferences in self-reported menstrual symptoms and their psychological correlates.
We were interested in obtaining a sample of twin pairs both of whom were currently menstruating and not pregnant at the time of completing the questionnaire. In order to do so, we selected those twins who both
Primary Dysmenorrhea 367
answered " N o " to "Are you pregnant now?," answered "Yes" to "Are your menstrual periods regular?" and, as a further check, answered " N o " to " I f not regular, have your periods completely stopped?"
The responses to the following items of subjects meeting these criteria were the focus of the present analysis:
"Are your periods: (1) heavy, (2) moderate, (3) light?" "Are your periods: (1) very painful, (2) moderately painful, (3) no
trouble?" "Are your periods: (1) very limiting, (2) moderately limiting, (3) not
limiting?" For convenience, we name these three items Flow, Pain, and Limitation, respectively, and it is primarily the second item, Pain, which we refer to when we talk of dysmenorrhea. The third item, Limitation, may be as much a measure of Premenstrual or Congestive symptomatology as of Spasmodic symptoms.
Elsewhere in the questionnaire these twins answered items of the Anxiety and Depression scales of the Delusions-Symptoms-States In- ventory (DSSI-sAD). The DSSI-sAD (Bedford et al., 1976) consists of seven state anxiety and seven state depression items. Each item is scored 0, 1, 2, or 3 according to the degree of distress claimed, i.e., "none," "a little," "a lot," or "unbearably." The possible range of scores is thus 0-21 for both the anxiety (A) and the depression (D) scales. The responses of our twin sample to these items have been analyzed extensively (Jardine et al., 1984; Kendler et al., 1986, 1987; Eaves et al., 1987).
Twins also completed the Eysenck Personality Questionnaire (EPQ; Eysenck and Eysenck, 1975), which yields scales for four personality dimensions, among which the Neuroticism (N) scale is of particular in- terest here. The N scale consists of 23 yes/no items which are scored 0 or 1, so the total N scores can range from 0 to 23 in the direction of increasing neuroticism.
Data Summary
Two-way contingency tables, cross-classifying the response of one twin (arbitrarily designated the "first twin") by the response of the cotwin o r " second twin," were computed for each of the trichotomous menstrual variables, separately for MZ and for DZ twin pairs. In addition, for mul- tivariate analysis, two-way tables cross-classifying different variables both within and between twin pairs (e.g., pain in first twin with limitation of first twin; limitation of first twin with flow of second twin) were computed.
368 Silberg, Martin, and Heath
Since reporting of the menstrual symptoms is discontinuous, the tra- ditional methods of genetic analysis for continuous twin data (e.g., Eaves et al., 1978) could not be applied. Instead, we estimated from each two- way contingency table a polychoric correlation and its standard error by the method of maximum likelihood (Tallis, 1962; Olsson, 1979). Esti- mation of a polychoric correlation [sometimes described as "threshold analysis" (cf. Pearson, 1900; Falconer, 1981)] implies the assumptions that each observed variable, although discontinuous, provides a measure of a corresponding latent variable whose distribution is continuous and normal and that the joint distribution of all the latent variables is multi- variate normal. Thus when we estimate the polychoric correlation be- tween twin pairs for menstrual Pain, we are assuming that this variable provides only an imperfect measure of true menstrual pain which tricho- tomizes the " true" continuous distribution. The polychoric correlation estimates the correlation between the continuous latent variables (e.g., the true menstrual pain of twin pairs) rather than the imperfect discon- tinuous measures.
Univariate Model Fitting
Expected values for correlations between twin pairs were expressed as a function of parameters representing the additive effects of alleles at multiple loci (VA) and the effects of shared family environment on twin resemblance (EC) (Eaves et al., 1978). Our purpose in fitting models was to identify the most parsimonious model able to explain the data and then to determine how much of the variance in the menstrual variables (strictly, the underlying latent variables) is attributable to genetic factors, to family background, and to "nonfamilial" environmental factors (ES) which make one twin differ from her cotwin. Since nonshared environmental factors do not contribute to the correlation between family members, the parameter ES is calculated as ES = 1 - V A - E C . For each variable, maximum-likelihood estimates of parameters were obtained by fitting models directly to the contingency tables for female MZ and DZ twin pairs (Eaves et al., 1978). The goodness of fit of different models was compared by likelihood-ratio chi-square test (Eaves et al., 1978: Joreskog, 1978).
Multivariate Model Fitting
Univariate model fitting allows us to determine how much genetic or environmental differences contribute to variation in each of the menstrual variables taken separately. Multivariate model fitting allows us to deter-

Primary Dysmenorrhea 369
mine whether factors that affect one menstrual variable are the same as those that affect another menstrual variable or, indeed, a correlated per- sonality trait. For example, our multivariate analysis could reveal whether any genetic influences on menstrual Flow, Pain, or Limitation are due to the same genes responsible for anxious (A) or depressed (D) symptoms as measured by the DSSI/sAD or Neuroticism (N) as measured by the EPQ. This question is particularly important because we have shown elsewhere, for this same sample, that genetic differences contribute sig- nificantly to A, D, and N and to the considerable covariation between them (Jardine et al., 1984; Kendler et al., 1986, 1987; Eaves et al., 1987). If we did discover significant genetic variation in self-reported menstrual flow, pain, and limitation, we would like to establish whether this could be explained by the same genes which affect A, D, and N or whether there is evidence for further independent dimensions of biological varia- tion predisposing to particular subsets of menstrual symptoms or even to all of them.
As a first step we performed, separately for twin 1 and twin 2, factor analyses of the phenotypic product-moment correlations between the menstrual ratings and the A, D, and N scores. Conventional factor anal- ysis seeks to explain the pattern of correlations between a set of observed variables in terms of the linear additive effects on those variables of a smaller number of latent variables or "factors." If more than one latent factor must be hypothesized to explain the correlations between menstrual symptoms, and at least one of these factors shows no association with A, D, and N, then we may be certain that genetic or environmental effects on menstrual symptoms are not entirely mediated by effects on symptoms of anxiety and depression or the personality trait Neuroticism.
Factor analysis was designed to test hypotheses about the phenotypic relations between variables. It does not allow us to test hypotheses about the structure of genetic and environmental effects on menstrual symp- toms. Advocates of factor analysis often assume that the same pattern of correlations between variables is created by biological factors and by environmental factors. There is clearly no a priori reason why this should be the case. We therefore also performed multivariate genetic analyses, which can be understood as a generalization of factor analysis, in which we estimate separate genetic and environmental factors. In this way we were able to test simultaneously a causal model, representing the genetic and environmental determinants of our variables, and a model describing the structure of these determinants (Martin and Eaves, 1977).
We used as the basis for model fitting the 2v x 2v matrices of cor- relations (i.e., all possible correlations of the v variables measured on first twins and on second twins) for each zygosity group. We carried out ge-

370 Silberg, Martin, and Heath
netic covariance structure analysis on three trichotomous menstrual vari- ables and three continuous measures of anxiety (A), depression (D), and neuroticism (N), six measures in all. To construct the 12 x 12 matrices of cross-correlations for MZ and DZ twins, three steps were necessary: (i) cross-correlations between the three trichotomous items were com- puted as polychoric correlations from the appropriate contingency tables (Olsson, 1979); (ii) product-moment cross-correlations between the three continuous measures were computed; and (iii) between the trichotomous and continuous measures, cross-correlations were calculated using an ap- proximation to the polyserial correlation coefficient (Olsson et al., 1982, p. 344).
Since there is no guarantee that such matrices will be positive defi- nite, we fitted models by a least-squares procedure in which we weighted MZ and DZ matrices by their degrees of freedom (685 and 421, respec- tively) but no attempt was made to allow for the differing standard errors of the correlations within matrices. (Standard errors were not available for the approximate polyserial correlation coefficients.) Heath (unpub- lished) has found that with sample sizes as large as in the present analyses, estimates of factor loadings from such analyses are remarkably robust to variations in the method used for weighting, unweighted solutions giving estimates close to those of the most appropriately weighted solution. However, the disadvantage of unweighted analysis is that it does not provide an absolute measure of goodness of fit. Nevertheless, if one is prepared to regard the residual sum of squares (SS) of the most elaborate model, divided by its degrees of freedom (df), as an estimate of error variance, then one can use an F test to assess the worsening of fit when a simpler model is fitted, provided the simpler model is genuinely nested within the elaborate model. Thus, if model B with b df is a simpler model nested within model A with a df, then
Fb-a,a = [(SS(B) - SS(A))/(b - a)]/SS(A)/a].
This criterion can be used as a guide to parsimony.
RESULTS
Frequencies of Menstrual Ratings; Age Characteristics
Of the 1984 female-female twin pairs in the sample, 1296 pairs met the criteria for inclusion in the present study, viz., both twins were men- struating regularly and neither was pregnant at the time of completing the questionnaire. These women ranged in age from 18 to 53 years, with a mean of 29 years and a standard deviation of 8 years; age distributions were very similar in MZ and DZ twins. Frequencies of ratings for the

Primary Dysmenorrhea
Table I. Frequencies (%) of Ratings for Menstrual Symptoms
1, 2, 3, N much a some less
Flow 2518 14.6 65.3 17.1 Pain 2493 7.6 43.6 44.8 Limitation 2413 4.0 34.3 54.8
See text for exact wording of items.
371
three menstrual variables are shown in Table I. Since not all subjects provided ratings for all variables, the N ' s in this and in subsequent tables are slightly smaller than the subsample total.
Repeatability
There were 42 women who answered the questionnaire twice at an average interval of 3 months (range, 1-10 months) and who also met the criteria for inclusion in the sample. Estimated polychoric correlations between the reports by these women of menstrual symptoms on the first and second occasions ( - S E ) were 0.80 _+ 0.11 for Flow, 0.74 - 0.15 for Limitation, and 0.62 ___ 0.15 for Pain. Thresholds were also estimated simultaneously and have been constrained to be equal on the first and second occasions.
These polychoric correlations estimate the test-retest reliability or repeatability (Falconer, 1981) of symptom reporting. Since the path from true to observed phenotype is parameterized as r 1/2, the amount of reliable variance is r and not its square. Although the standard errors are large, repeatability is impressively high.
Univariate Genetic Analysis of Menstrual Symptoms
The results of univariate model fitting are shown in Table II. For each variable, the first line shows the maximum-likelihood estimates and standard errors of MZ and DZ polychoric correlations. The goodness-of- fit chi-square and its associated probability are shown andalso minus the log-likelihood ( - L L ) . It can be seen that the threshold model gives a passable fit for Flow but a poor fit for Pain and Limitation. Relaxation of the constraints that thresholds be the same in MZ and DZ twins caused a negligible increase in the log-likelihood, demonstrating that the distri- bution of symptoms was very similar in both twin types. Inequality of
3 7 2 S i l b e r g , M a r t i n , a n d H e a t h
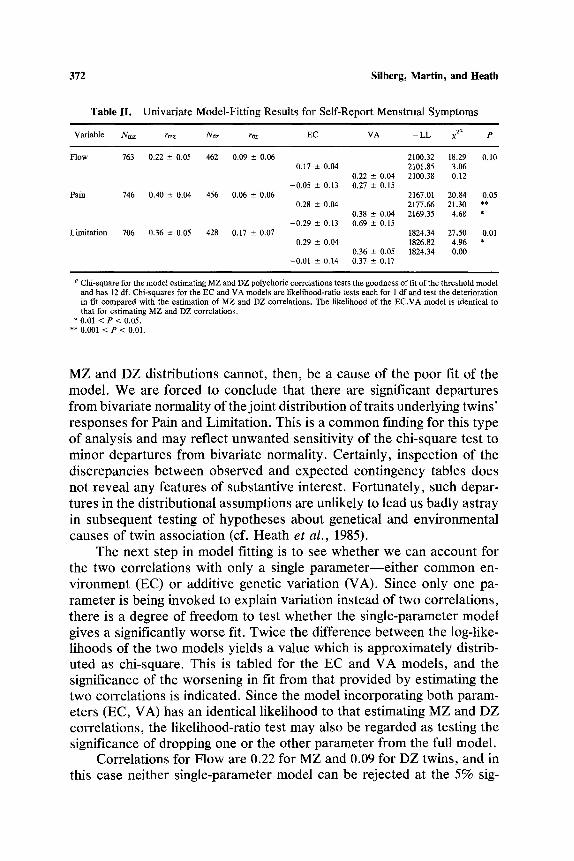
T a b l e I I . U n i v a r i a t e M o d e l - F i t t i n g R e s u l t s f o r S e l f - R e p o r t M e n s t r u a l S y m p t o m s
Variable Nmz rmz Naz raz EC VA - L L • za P
Flow 763 0.22 --- 0.05 462 0.09 + 0.06 2100.32 18.29 0.10 0.17 -+ 0,04 2101.85 3.06
0.22 -+ 0.04 2100.38 0.12 - 0 . 0 5 + 0.13 0.27 -- 0.15
0.28 -+ 0.04
- 0 . 2 9 -+ 0.13
0.29 -+ 0.04
- 0 . 0 1 +- 0.14
Pain 746 0.40 +- 0.04 456 0.06 -~ 0.06
Limitation 706 0.36 • 0.05 428 0.17 • 0.07
0.38 -+ 0.04 0.69 -+ 0.15
0.36 -+ 0.05 0.37 • 0.17
2167.01 20.84 0.05 2177.66 21.30 ** 2169.35 4.68 *
1824.34 27.50 0.01 1826.82 4.96 * 1824.34 0.00
a Chi-square for the model estimating MZ and DZ polychoric correlations tests the goodness of fit of the threshold model and has 12 df. Chi-squares for the EC and VA models are likelihood-ratio tests each for 1 dfand test the deterioration in fit compared with the estimation of MZ and DZ correlations. The likelihood of the EC,VA model is identical to that for estimating MZ and DZ correlations.
* 0.01 < P < 0.05. ** 0.001 < P < 0.01.
MZ and DZ distributions cannot, then, be a cause of the poor fit of the model. We are forced to conclude that there are significant departures from bivariate normality of the joint distribution of traits underlying twins' responses for Pain and Limitation. This is a common finding for this type of analysis and may reflect unwanted sensitivity of the chi-square test to minor departures from bivariate normality. Certainly, inspection of the discrepancies between observed and expected contingency tables does not reveal any features of substantive interest. Fortunately, such depar- tures in the distributional assumptions are unlikely to lead us badly astray in subsequent testing of hypotheses about genetical and environmental causes of twin association (cf. Heath et al. , 1985).
The next step in model fitting is to see whether we can account for the two correlations with only a single parameter--either common en- vironment (EC) or additive genetic variation (VA). Since only one pa- rameter is being invoked to explain variation instead of two correlations, there is a degree of freedom to test whether the single-parameter model gives a significantly worse fit. Twice the difference between the log-like- lihoods of the two models yields a value which is approximately distrib- uted as chi-square. This is tabled for the EC and VA models, and the significance of the worsening in fit from that provided by estimating the two correlations is indicated. Since the model incorporating both param- eters (EC, VA) has an identical likelihood to that estimating MZ and DZ correlations, the likelihood-ratio test may also be regarded as testing the significance of dropping one or the other parameter from the full model.
Correlations for Flow are 0.22 for MZ and 0.09 for DZ twins, and in this case neither single-parameter model can be rejected at the 5% sig-
Primary Dysmenorrhea 373
nificance level, implying that either would do as an explanation of varia- tion. However, the EC model could be rejected at the 10% level, and it seems likely that genetic factors have contributed to the report of men- strual flow. Taking the results of the VA model, genetic factors contribute 22% of the total variance, the remaining 78% being due to nonfamilial environmental factors including errors in reporting and recording.
In the case of menstrual Pain, dropping either EC or VA from the full model results in a highly significant worsening of fit, suggesting that one parameter alone is insufficient to explain variation. However, in the EC, VA model, we note that the estimate of EC is negative because the DZ correlation is less than half that of MZ twins. This is an indication either of nonadditive genetic factors (dominance or epistasis) influencing variation (Heath et al., 1984) or of sibling interaction effects such that menstrual pain experienced by one twin tends to inhibit (environmentally) the reporting of menstrual pain by the cotwin (Eaves, 1976; Carey, 1986). Such an environmental interaction is unlikely, especially since less than 25% of the twin pairs in our sample are living together, and since it would in any case lead to heterogeneity of threshold values between MZ and DZ pairs (arising through differences in variance), so genetical nonad- ditivity is probably the explanation. Unfortunately the relative importance of additive and nonadditive genetic variance is notoriously difficult to resolve in twin data. The proportion of total variance due to genetic factors is 40%, but how much of this is due to additive versus nonadditive factors we are unable to say with any precision (Martin et al., 1978).
For menstrual Limitation the correlation of MZ twins is only slightly greater than twice that for DZ twins (i.e., 0.36 vs. 0.17), suggesting that sibling similarity in reporting of this symptom is due solely to additive genetic effects. Dropping VA from the full model does significantly worsen the fit (X~ 2 = 4.96), whereas dropping EC has no effect on the likelihood. The heritability of Limitation is 0.36.
Multivariate Analysis
Our chief interest in the multivariate domain is the extent to which reports of the menstrual symptoms are related and whether variation in such reporting can be accounted for by variation in independently mea- sured symptoms of anxiety (A), depression (D), and the personality trait Neuroticism (N). Table III shows the product-moment intercorrelations of the three trichotomous menstrual variables and the three continuous measures, A, D, and N. In the upper triangle are those for the "first" twin and in the lower triangle are those for the "second" twin. (The correspondence between "first" and first-born twin is far from perfect.)

374 Silberg, Martin, and Heath
Tab le H I . P e a r s o n Cor re la t ions B e t w e e n M e n s t r u a l S y m p t o m s an d Pe r so n a l i t y M e a s u r e s ~
1 2 3 4 5 6
1. F l o w i 31 25 - 12 - 11 - 10 2. Pa in 6 - - 46 - 2 2 - 1 9 - 2 0 3. L i m i t a t i o n 4 40 i - 18 - 18 - 24 4. A n x i e t y ( D S S I / s A D ) - 4 - 19 - 18 i 64 58 5. D e p r e s s i o n ( D S S I / s A D ) - 4 - 15 - 17 68 - - 56 6. N e u r o t i c i s m (EPQ) - 8 - 21 - 23 59 57 i
a Cor r e l a t i ons ( x 100) for the first tw in a re in the u p p e r t r iangle , an d t h o se fo r the s e c o n d tw in in the l o w e r t r iangle .
Note that since the three personality variables are scored in the "oppo- site" direction to the three menstrual variables, the correlation between a personality variable and a menstrual variable is expected to be negative (and they all are) and this is reflected in the signs of the loadings in the subsequent factor analyses (Tables IV and V).
The correlation matrices for twin 1 and twin 2 were subjected to principal-factor analysis and the resulting orthogonal factors were rotated to simple structure by the varimax criterion (Harman, 1976). Phenotypic factor loadings are shown in Table IV and are remarkably congruent for twin 1 and twin 2. Factor I is clearly an "affect" factor, loading heavily on the DSSI A and D scales and the EPQ N scale, whereas factor II is a menstrual symptom factor, loading most heavily on Pain, Limitation, and Flow.
Although we have identified a consistent pattern of phenotypic fac- tors, it does not follow that genetic and environmental factors will con- tribute to covariation in the same pattern. Using the least-squares ap-
Table IV. L o a d i n g s ( x 100) o f M e n s t r u a l S y m p t o m s a n d Pe r sona l i t y M e a s u r e s on V a r i m a x - R o t a t e d P h e n o t y p i c Fac -
tors for T w i n 1 a nd T w i n 2
T w i n 1 T w i n 2
I II I II
1. F l o w - 6 42 - 1 47 2. Pa in - 15 73 - 13 66 3. L i m i t a t i o n - 14 61 - 16 56 4. A n x i e t y ( D S S I / s A D ) 81 - 14 81 - 13 5. D e p r e s s i o n ( D S S I / s A D ) 77 - 12 80 - 8 6. N e u r o t i c i s m (EPQ) 70 - 18 73 - 17
Primary Dysmenorrhea
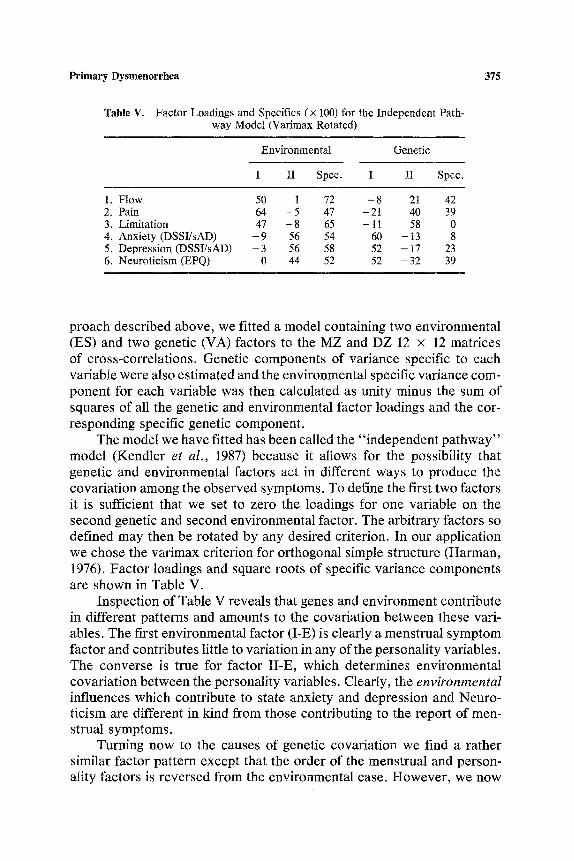
Table V. Factor Loadings and Specifics ( • 100) for the Independent Path- way Model (Varimax Rotated)
375
Environmental Genetic
I II Spec. I II Spec.
1. Flow 50 1 72 - 8 21 42 2. Pain 64 - 5 47 - 21 40 39 3. Limitation 47 - 8 65 - 11 58 0 4. Anxiety (DSSI/sAD) - 9 56 54 60 - 13 8 5. Depression (DSSI/sAD) - 3 56 58 52 - 17 23 6. Neuroticism (EPQ) 0 44 52 52 - 32 39
proach described above, we fitted a model containing two environmental (ES) and two genetic (VA) factors to the MZ and DZ 12 x 12 matrices of cross-correlations. Genetic components of variance specific to each variable were also estimated and the environmental specific variance com- ponent for each variable was then calculated as unity minus the sum of squares of all the genetic and environmental factor loadings and the cor- responding specific genetic component.
The model we have fitted has been called the "independent pathway" model (Kendler et al., 1987) because it allows for the possibility that genetic and environmental factors act in different ways to produce the covariation among the observed symptoms. To define the first two factors it is sufficient that we set to zero the loadings for one variable on the second genetic and second environmental factor. The arbitrary factors so defined may then be rotated by any desired criterion. In our application we chose the varimax criterion for orthogonal simple structure (Harman, 1976). Factor loadings and square roots of specific variance components are shown in Table V.
Inspection of Table V reveals that genes and environment contribute in different patterns and amounts to the covariation between these vari- ables. The first environmental factor (I-E) is clearly a menstrual symptom factor and contributes little to variation in any of the personality variables. The converse is true for factor II-E, which determines environmental covariation between the personality variables. Clearly, the environmental influences which contribute to state anxiety and depression and Neuro- ticism are different in kind from those contributing to the report of men- strual symptoms.
Turning now to the causes of genetic covariation we find a rather similar factor pattern except that the order of the menstrual and person- ality factors is reversed from the environmental case. However, we now

376 Silberg, Martin, and Heath
see that the first genetic factor (I-G) accounts not only for genetic co- variation between A, D, and N but also for some of the covariation of these three with Pain and, to a much lesser extent, menstrual Limitation and Flow. Factor II-G accounts for more of the genetic covariation among the menstrual symptoms but also for more of the covariation between these and the personality and symptom variables, particularly Neuroticism.
Inspection of the results from the independent pathway model sug- gests that genetical and environmental factors make qualitatively different contributions to covariation between menstrual and personality variables. In other words, there are environmental influences and aspects of the genotype which make their own independent contributions to covariation between measured variables, the relative contributions from each source differing from variable to variable. We can test this hypothesis explicitly by fitting the alternative, "common pathway" model, which posits that it is latent phenotypes which mediate genetic and environmental effects on the covariation between measurements. In our example, this is equiv- alent to specifying that there are two latent phenotypic variables (e.g., "neuroticism" and "dysmenorrhea") responsible for covariation and that each of these has its own particular heritability. This model makes the strong and explicit prediction that genetical factor loadings will be a con- stant multiple of the corresponding environmental loadings for a given factor. The independent and common pathway models are discussed in more detail by Martin and Eaves (1977) and Kendler et al. (1987).
The residual sum of squares (RSS) for the independent pathway model is 118.97. The number of unique statistics in each matrix is 12 x 11/2 and there are two matrices, so there is a total of 132 statistics. We estimate 11 factor loadings for both genetic and environmental sources of covariation and we also estimate 6 specific genetic variances. Thus 28 parameters are estimated in all, leaving 104 degrees of freedom associated with the RSS or a residual mean square of 1.14. The common pathway model estimates only one set of factor loadings but introduces two new parameters (one for each factor) to estimate the heritability of each factor, resulting in 9 fewer parameters in all. However, the RSS increases to 149.86 so we can reject at a highly significant level (F = 3.00, df = 9,104, P < 0.003) the hypothesis that the common pathway model provides a fit to the data no worse than that of the independent pathway model.
DISCUSSION
There are several possible limitations of our study that need to be kept in mind. Objections to use of the classical twin study for investigation
Primary Dysmenorrhea 377
of the causes of individual differences in behavior are often voiced on a number of grounds. These arguments have been considered in detail by Kendler (1983) and have been shown, for the most part, to be invalid. The data gathered from our sample of twins is self-reported and used three brief retrospective items to assess dysmenorrhea, rather than more detailed questionnaires or daily rating scales (e.g., Moos, 1968, 1985; Chesney and Tasto, 1975; Halbreich and Endicott, 1985; Halbreich et al., I982). Such retrospective self-report data may suffer from certain weak- nesses including response sets and memory deficits and distortions. No explicit distinction was made between congestive and spasmodic symp- toms, so that menstrual Limitation, in particular, may be as much a mea- sure of premenstrual as of spasmodic symptomatology. We did not ask questions about the use of medication specifically intended for the alle- viation of menstrual symptoms, in particular the recently developed drugs such as naproxen sodium, ibuprofen, and indomethacin, which have been found to be 70-80% effective in the relief of menstrual pain (Pulkinen and Csapo, 1978; Rosenwaks and Seegan-Jones, 1980). However, the use of such drugs in Australia at the time this study was conducted (1981) would have been negligible. Finally, it is unfortunate that we did not elicit from twins the day of their menstrual cycle on which they filled in the ques- tionnaire, since this has been shown to affect volunteering behavior (Doty and Silverthorne, 1975) and conceivably might affect perception and re- porting of menstrual and psychological symptoms. Those subjects that experience greater menstrual distress may rate symptoms more severely during the premenstrual and perimenstrual phase in comparison with rat- ings obtained intermenstrually.
Several features of our own data, taken in combination with findings of other researchers, give us confidence that our conclusions are not se- riously biased by these complications. Forty-four percent of the individ- uals in our sample reported moderate pain during their periods and 8% indicated that their periods were very painful. These frequencies are in good agreement with previous estimates of 50-60% for the prevalence of dysmenorrhea in western societies, based upon more elaborate methods of assessment (Coppen and Kessel, 1963; Jeffcoate, 1975). Reporting of menstrual symptoms using our three brief items was found to be sur- prisingly consistent in a subsample of 42 women who completed the ques- tionnaire twice at an average interval of 3 months; test-retest reliabilities were 0.80 for flow, 0.62 for pain, and 0.74 for limitation.
Coppen and Kessel (1963) and Moos (1968) failed to find any variation in self-reported menstrual distress as a function of phase of cycle. This does not appear to be an important effect in our data either. McClintock (1971) has reported that menstrual cycles of cohabiting females tend to

378 Silberg, Martin, and Heath
come into synchrony and this may be due to a pheromonal effect. To the extent that twins in our sample live together (23% of MZ and 22% of DZ pairs in our sample report that they live together), that "day of the month" affects reporting of symptoms, and that cotwins fill out their question- naires on about the same day, we should expect to detect an effect of common environment (EC) on menstrual symptoms. The fact that we do not suggests that cohabitation, collusion of cotwins filling in the ques- tionnaire, and cyclical variation in reporting of symptoms make at most minor contributions to individual differences in self-report of menstrual symptoms.
To assess the influence of menstrual phase on reporting, it is also helpful to compare the unreliabilities of the measures (i.e., one minus the reliabilities) with the specific environmental variance components from the multivariate analysis (i.e., the squares of the environmental-specific loadings in Table V). If errors in reporting and recording of menstrual symptoms are the only source of unreliability and are uncorrelated be- tween symptoms, then one might expect unreliability to be of the same magnitude as the specific environmental variance components. On the other hand, if identifiable factors such as day of the month cause cor- related fluctuations in responses to all three items, then these fluctuations will also be reflected in s of the measures but will be detected as ES factor variance in the multivariate analysis. In the latter case, we should expect unreliability to be greater than environmental-specific var- iance. Within the rather large sampling errors of the estimates of unre- liability, our results suggest that unreliability is about the same or smaller than environmental-specific variance and this would support the notion that it is symptom-specific errors, rather than correlated fluctuations in perception, which are responsible for unreliability of reporting. Any ef- fects of menstrual cycle on the reporting of symptoms of anxiety and depression and Neuroticism in our data must also be very weak, since we found almost no environmental covariation between reports of men- strual symptoms, on the one hand, and of symptoms of anxiety and depression, on the other.
Our results suggest an important influence of genetic differences on liability to primary dysmenorrhea. MZ correlations were greater than DZ correlations for all three menstrual symptoms and genetic variance was shown to be significant for Pain and Limitation. The heritability of liability for these symptoms (uncorrected for unreliability) was estimated as 0.22 for menstrual flow, 0.38 for menstrual pain, and 0.36 for perceived lim- itation. Taken in conjunction with the reliability data, these values indi- cate that genetic differences account for as much as 58% of the reliable variance in menstrual pain, 49% of the reliable variance in perceived

Primary Dysmenorrhea 379
limitation, and 35% of the reliable variance in menstrual flow. No sig- nificant evidence could be found that shared familial environment also contributes to the correlation between sisters in the reporting of menstrual symptoms. However, there was evidence from the low DZ correlation that nonadditivity (probably genetic dominance or epistasis) plays a role in determining individual differences in menstrual pain.
If familial aggregation for dysmenorrhea were caused solely by ad- ditive gene action, we would predict, from the MZ correlation of 0.4, DZ twin and mother-daughter correlations of 0.2. The correlation of 0.19 for dysmenorrhea in 1080 pairs of mothers and daughters in Finland reported by Kantero and Widholm (1971) is in excellent agreement with the additive genetic hypothesis. However, the correlation of 0.06 _+ 0.06 in our sample of 456 DZ pairs is significantly less than that predicted. Genetic nonad- ditivity suggested by the low DZ correlation would predict an even lower mother-daughter correlation. Sibling interaction ["contrast" or "com- petition" effects (Eaves, 1976; Carey, 1986)], which is very difficult to resolve from genetic dominance in twin data (Jardine, 1986), might explain this apparent discrepancy. However, such an explanation seems unlikely since only 25% of our female twin pairs were still living together at the time of the study. Alternatively, these differences may simply reflect the differences in population, time, and instruments used in the two studies. Resolution of the paradox must await simultaneous collection of twin and mother-daughter data with a single set of criteria.
Moderate correlations were found among the menstrual symptoms and between these and scores for state anxiety and depression and trait Neuroticism. Phenotypic factor analysis revealed two factors, the first loading predominantly on the three "affect" variables (A, D, and N) and the second predominantly on. the three menstrual variables. Whether the correlations between the affect and the menstrual variables and the mod- erate cross-loadings in the two factors are caused by genetic or environ- mental influences, or both, can only remain a matter of speculation when the investigator is confined to phenotypic factor analysis.
The advantage of twin data is that one can answer precisely such questions. Our analyses show with remarkable clarity that the correlations we find between self-report menstrual symptoms and self-report person- ality variables are almost entirely genetic in origin. Environmental influ- ences on reporting of, say, menstrual Pain also affect reporting of Flow and Limitation, and similarly among the three personality or symptom variables. However, environmental factors influencing menstrual symp- toms have no effect on state anxiety or depression or on trait neuroticism, and vice versa.
380 Silberg, Martin, and Heath
Our results suggest that genes whose primary effect is on anxiety, depression, and Neuroticism also have some influence on the reporting of menstrual Pain. Conversely, genes whose primary influence is on re- porting of menstrual symptoms (particularly perceived Limitation) also have some effect on the personality variables (particularly Neuroticism). (The use of "primary" here, of course, is only relative to the set of vari- ables being measured.)
We still find substantial specific genetic variance for Flow and Pain. This is not surprising since we would expect distinct physiological mech- anisms, with only limited interactions between them, to influence these two phenomena. However, the lack of detectable specific genetic variance for Limitation indicates that all the genetic variance for this symptom can be accounted for by genes influencing all three menstrual symptoms or by genes influencing the "affective" personality variables. With the ben- efit of hindsight it seems obvious that limitation of activity by menstrua- tion is entirely a function of physiological constraints and personality. Path analysis might reveal in more detail the most likely causal connec- tions between these variables.
Previous research has implicated psychological and (allegedly) en- vironmental factors in the etiology of dysmenorrheic pain, including "re- jection of the feminine role" (Menninger, 1939), neuroticism (Levitt and Lubin, 1967), and life stress (Wilcoxon et al., 1976; Siegel et al., 1970; Silberg and Farrell, 1984), but these studies have rarely been able to account for more than 10-20% of the variance in menstrual pain. Our results suggest that covariation between dysmenorrhea and personality is entirely genetic in origin and that there are further genetic factors spe- cifically affecting menstrual pain. Together these genetic factors account for almost 60% of the reliable variance in self-report of menstrual pain. In our study we have no measures which relate specifically to rejection of the feminine role or to life stress. However, we can say that if these do covary with dysmenorrhea, then either their environmental effects are uncorrelated between sisters or their influence is genetically mediated.
ACKNOWLEDGMENTS
We are grateful to Dr. David Handelsman for his advice in framing the questions, to Marilyn Olsen and Dr. Rosemary Jardine for their vital roles in collection of the data, to Drs. Greg Carey, Lindon Eaves, and Marilyn Erickson for their helpful comments and advice, and to an anony- mous reviewer for helpful suggestions about the manuscript.

Primary Dysmenorrhea 381
REFERENCES
Abraham, G. E. (1978). Primary dysmenorrhea. CIin. Obstet. Gynecol. 21:139-145. Akerlund, M. (1979). Pathophysiology of dysmenorrhea. Acta Obstet. Gynecol. Scand.
87:27-32. Akerlund, M., Anderson, I., and Ingemarsson, E. (1976). Effects of terbutaline on my_
ometrial activity, uterine blood flow, and lower abdominal pain in women with primary dysmenorrhea. Br. J. Obstet. Gynaecol. 83:673-679.
Austin, M. J. F., Martin, N. G., and Heath, A. C. (1985). Detection of genotype • envi- ronment interaction in dysmenorrhea. Am. J. Hum. Genet. (Suppl.) 37:A3.
Bedford, A., Foulds, G. A., and Sheffield, B. F. (1976). A new personal disturbance scale (DSSI/sAD). Br. J. Soc. Clin. Psychol. 15:387-394.
Berry, C., and McQuirre, F. (1972). Menstrual distress and acceptance of sexual role. Am. J. Obstet. Gynecol. 114:83-86.
Bloom, L. J., Shelton, J. L., and Michaels, A. C. (1978). Dysmenorrhea and personality. J. Personal. Assess. 42:272-276.
Bochm, F. E., and Sarrat, H. (1975). Indomethacin for the treatment of dysmenorrhea. J. Reprod. Med. 15:84-87.
Carey, G. (1986). Sibling imitation and contrast effects. Behav. Genet. 16:319-342. Chernovety, M. E., Jones, W. H., and Hansson, R. O. (1979). Predictability, attentional
focus, sex role orientation and menstrual related stress. Psychosom. Med. 41:383-391. Chesney, M. A., and Tasto, D. L. (1975). The development of the menstrual symptom
questionnaire. Behav. Res. Ther. 13:237-244. Coppen, A., and Kessel, N. (1963). Menstruation and personality. Br. J. Psychiat. 109:711-
721. Csapo, A. I., Pulkinen, M. O., and Henzl, M. R. (1977). The effect of naproxen sodium on
the uterine pressure and menstrual pain of dysmenorrheic patients. Prostaglandins 13:193-195.
Dalton, K. (1976). The Premenstrual Syndrome and Progesterone Therapy, William Hei- nemann, London.
Doty, R. L., and Silverthorne, C. (1975). Influence of menstrual cycle on volunteering behaviour. Nature 254:139-140.
Eaves, L. J. (1976). A model for sibling effects in man. Heredity 36:205-214. Eaves, L. J., Last, K. A., Young, P. A., and Martin, N. G. (1978). Model-fitting approaches
to the analysis of human behaviour. Heredity 41:249-320. Eaves, L. J., Martin, N. G., Kendler, K. S., and Heath, A. C. (1987). Testing models for
multiple symptoms: An application to the genetic analysis of liability to depression. Behav. Genet. 17:331-341.
Eysenck, H. J., and Eysenck, S. B. G. (1975). Eysenck Personality Questionnaire (Junior and Adult), Hodder and Stoughton Educational, London.
Falconer, D. S. (1981). Introduction to Quantitative Genetics, 2nd. ed., Longman, London. Halbreich, U., and Endicott, J. (1985). The relationship of dysphoric premenstrual changes
to depressive disorders. Acta Psychiat. Scand. 71:331-338. Halbreich, U., Endicott, J., and Nee, J. (1982). The diversity of premenstrual changes as
reflected in the Premenstrual Assessment Form. Acta Psychiat. Scand. 65:46-65. Hannah, M. C., Hopper, J. L., and Mathews, J. D. (1985). Twin concordance for a binary
trait. II. Nested analysis of ever-smoking and ex-smoking traits and unnested analysis of a "committed smoking" trait. Am. J. Hum. Genet. 37:153-165.
Harman, H. H. (1976). Modern Factor Analysis, University of Chicago Press, Chicago. Heath, A. C., Martin, N. G., Eaves, L. J., and Loesch, D. (t984). Evidence for polygenic
epistasis in man? Genetics 106:719-727. Heath, A. C., Berg, K., Eaves, L. J., Solaas, M. H., Sundet, J., Nance, W. E., Corey, L.
A., and Magnus, P. (1985). No decline in assortative mating for educational level. Behav. Genet. 15:349-369.
Heath, A. C., Martin, N. G., Gibson, J. B., Kendler, K. S., and Eaves, L. J. (1987). Effects of life-style, personality, symptoms of anxiety and depression, and genetic predispo- sition on subjective sleep disturbance and sleep pattern. Unpublished manuscript.

382 Silberg, Martin, and Heath
Hirt, M., Kurtz, R., and Ross, W. E. (1967). The relationship between dysmenorrhea and selected personality variables. Psychosomatics 11:219-225.
Jardine, R. (1986). Unpublished Ph.D. thesis, University of Canberra, Canberra, Australia. Jardine, R., and Martin, N. G. (1984). Causes of variation in drinking habits in a large twin
sample. Acta Genet. Med. Gemellol. 33:435-450. Jardine, R., Martin, N. G., and Henderson, A. S. (1984). Genetic covariation between
Neuroticism and the symptoms of anxiety and depression. Genet. Epidemiol. 1:89-107. Jay, S. M., and Taylor, W. (1981). Primary dysmenorrhea: Current concepts. Am. Family
Phys. 24:29-34. Jeffcoate, T. N. A. (1975). Principles ofGynaecology, Butterworth, London. Joreskog, K. G. (1978). Structural analysis of covariance and correlation matrices. Psy-
chometrika 43:443-477. Kantero, R.-L., and Widholm, O. (1971). Correlations of menstrual traits between adolescent
girls and their mothers. Aeta Obstet. Gynaecol. Scand. (Suppl.) 14:30-36. Kashwagi, T., McClure, J. M., and Wetzel, R. D. (1976). Premenstrual affective syndrome
and psychiatric disorder. Dis. Nerv. Syst. 37:116-119. Kendler, K. S. (1983). overview: A current perspective on twin studies of schizophrenia.
Am. J. Psychiat. 140:1413-1425. Kendler, K. S., Heath, A. C., Martin, N. G., and Eaves, L. J. (1986). Symptoms of anxiety
and depression in a volunteer twin population: The etiologic role of genetic and envi- ronmental factors. Arch. Gen. Psychiat. 43:213-221.
Kendler, K. S., Heath, A. C., Martin, N. G., and Eaves, L. J. (1987). Symptoms of anxiety and depression: Same genes, different environments? Arch. Gen. Psychiat. 44:451-457.
Kistner, R. W. (1972). Gynecology: Principles and Practice, 2nd ed., Year Book Medical, Chicago.
Kulig, J. W. (1972). Primary dysmenorrhea pathogenesis and therapy. Conn. Med. 46:123- 125.
Levitt, E. E., and Lubin, B. (1967). Some personality factors associated with menstrual compliance and menstrual attitude. J. Psychosom. Res. 11:267-270.
Lykken, D. T., Tellegen, A., and DeRubeis, R. (1978). Volunteer bias in twin research: The rule of two thirds. Soc. Biol. 25:1-9.
Martin, N. G., and Eaves, L. J. (1977). The genetical analysis of covariance structure. Heredity 38:79-95.
Martin, N. G., and Jardine, R. (1986). Eysenck's contribution to behavior genetics. In Modgil, S., and Modgil, C. (eds.), Hans Eysenck: Consensus and Controversy, Falmer Press, Lewes, Sussex.
Martin, N. G., and Wilson, S. R. (1982). Bias in the estimation of heritability from truncated samples of twins. Behav. Genet. 12:467-472.
Martin, N. G., Eaves, L. J., Kearsey, M. J., and Davies, P. (1978). The power of the classical twin study. Heredity 40:97-116.
iVrartin, N. G., Eaves, L. J., Heath, A. C., Jardine, R., Feingold, L., and Eysenck, H. J. (1986). The transmission of social attitudes. Proc. Natl. Acad. Sci. 83:4364-4368.
Martin, N. G., Kendler, K. S., Heath, A. C., Handelsman, D., and Eaves, L. J. (1987). A twin study of the psychiatric side-effects of oral contraceptives (submitted for publication).
McClintock, M. K. (1971). Menstrual synchrony and suppression. Nature 229:244-245. Menninger, K. A. (1939). Somatic correlations with the unconscious repudiation of femi-
ninity in women. J. Nerv. Ment. Dis. 89:514-529. Moos, R. H. (1985). Perimenstrual Symptoms: A Manual and Overview of Research with
the Menstrual Distress Questionnaire, Department of Psychiatry, Stanford University, Palo Alto, Calif.
Moos, R. H. (1968). The development of the menstrual distress questionnaire. Psychosom. Med. 30:853-857.
Olsson, U. (1979). Maximum likelihood estimation of the polychoric correlation coefficient. Psychometrika 44:443-460.
Primary Dysmenorrhea 383
Olsson, U., Drasgow, F., and Dorans, N. J. (1982). The polyserial correlation coefficient. Psychometrika 47:337-347.
Pulkinen, M. O., and Csapo, A. I. (1978). The effect of ibuprofen on the uterine pressure and menstrual pain of dysmenorrheic women. Prostaglandins 15:1055-1057.
Pearson, K. (1900). Mathematical contributions to the theory of evolution. VII. On the correlation of characters not quantitatively measurable. Phil. Trans. Roy. Soc. Ser. A 195:1-47.
Rose, R. J., and Monroe, M. J. (1985). Aggregation of menstrual attitudes and symptoms among female relatives. Behav. Genet. 15:608.
Rosenwaks, Z., and Seegan-Jones, G. (1980). Menstrual pain: Its origins and pathogenesis. J. Reprod. Med. 4:207-212.
Sainsbury, P. (1960). Advances in Psychosomatic Medicine, Vol. 1, Karger, Basel. Schunck, M. (1951). Pain and pain relief in essential dysmenorrhea. Am. J. Obstet. Gynecol.
62:559-567. Shrader, R. E., and Ohly, J. I. (1970). Premenstrual tension, femininity, and drive. Med.
Asp. Hum. Sexual. 4:421-453. Siegel, J. M., Johnson, J. H., and Sarason, I. G. (1970). Life changes and menstrual dis-
comfort. J. Hum. Stress 5:41-46. Silberg, J. L. (1984). The Relationship Between Life-Stress and Dysmenorrhea: A Study of
Relevant Mediating Variables, Unpublished master's thesis, Virginia Commonwealth University, Richmond.
Silberg, J. L., and Farrell, A. D. (1984). The role of coping strategies and cognitive appraisal of life events in primary dysrnenorrhea. Paper presented at the annual convention of the Association for the Advancement of Behavior Therapy, Philadelphia.
Tallis, G. M. (1962). The maximum likelihood estimation of correlation from contingency tables. Biometrics 18:342-353.
Taylor, J. W. (1979). The timing of menstrual related symptoms assessed by a daily symptom rating scale. Acta Psychiat. Scand. 60:87-105.
Wilcoxon, L. A., Schrader, S. L., and Sherif, C. W. (1976). Daily self-report on activities, life events, and moods, and somatic changes during the menstrual cycle. Psychosom. Med. 38:399-417.
Wittkower, E., and Wilson, A. T. (1940). Dysmenorrhea and sterility: Personality studies. Br. Med. J. 2:586-589.
Yliklorkala, O., and Daywood, M. Y. (1978). New concepts in dysmenorrhea. Am. J. Obstet. Gynecol. 130:833-847.
Edited by H. Hill Goldsmith