Embed Size (px)
Citation preview

10.1101/gr.176933.114Access the most recent version at doi: published online September 23, 2014Genome Res.
Sonia Shah, Allan F McRae, Riccardo E Marioni, et al. over the human life courseGenetic and environmental exposures constrain epigenetic drift
Material
Supplemental
http://genome.cshlp.org/content/suppl/2014/09/17/gr.176933.114.DC1.html
P<P
Published online September 23, 2014 in advance of the print journal.
Manuscript
Accepted
manuscript is likely to differ from the final, published version. Peer-reviewed and accepted for publication but not copyedited or typeset; accepted
License
Commons Creative
.http://creativecommons.org/licenses/by-nc/4.0/described at
a Creative Commons License (Attribution-NonCommercial 4.0 International), as ). After six months, it is available underhttp://genome.cshlp.org/site/misc/terms.xhtml
first six months after the full-issue publication date (see This article is distributed exclusively by Cold Spring Harbor Laboratory Press for the
ServiceEmail Alerting
click here.top right corner of the article or
Receive free email alerts when new articles cite this article - sign up in the box at the
http://genome.cshlp.org/subscriptionsgo to: Genome Research To subscribe to
Published by Cold Spring Harbor Laboratory Press
Cold Spring Harbor Laboratory Press on September 26, 2014 - Published by genome.cshlp.orgDownloaded from Cold Spring Harbor Laboratory Press on September 26, 2014 - Published by genome.cshlp.orgDownloaded from
1
Title: Genetic and environmental exposures constrain epigenetic drift over the human life course Running title: Genetics & environment constrain epigenetic drift Sonia Shaha,1, Allan F McRaea,1, Riccardo E Marionia,b,c,1, Sarah E Harrisb,c, Jude Gibsond, Anjali K Henderse, Paul Redmondf, Simon R Coxc,f, Alison Pattief, Janie Corleyf, Lee Murphyd, Nicholas G Martine, Grant W Montgomerye, John M Starrc,g, Naomi R Wraya,2 Ian J Dearyc,f,2, Peter M Visschera,c,h,2 1 These authors contributed equally 2
These authors contributed equally aQueensland Brain Institute, The University of Queensland, Brisbane, 4072, QLD, Australia b Medical Genetics Section, Centre for Genomic and Experimental Medicine, Institute of Genetics and Molecular Medicine, University of Edinburgh, Edinburgh, EH4 2XU, UK c Centre for Cognitive Ageing and Cognitive Epidemiology, University of Edinburgh, 7 George Square, Edinburgh, EH8 9JZ, UK d Wellcome Trust Clinical Research Facility, University of Edinburgh, Western General Hospital, Crewe Road, Edinburgh, EH4 2XU, UK e QIMR Berghofer Medical Research Institute, Brisbane, 4029, QLD, Australia f Department of Psychology, University of Edinburgh, Edinburgh, EH8 9JZ, UK g Alzheimer Scotland Dementia Research Centre, University of Edinburgh, Edinburgh, EH8 9JZ, UK h University of Queensland Diamantina Institute, Translational Research Institute, The University of Queensland, Brisbane, 4072, QLD, Australia Corresponding author: Peter M Visscher, Queensland Brain Institute, Building 79, The University of Queensland, Brisbane, 4072, QLD, Australia. Tel: +61 7 334 66348, email: [email protected].
Keywords: DNA methylation, epigenetics, epigenetic drift
Cold Spring Harbor Laboratory Press on September 26, 2014 - Published by genome.cshlp.orgDownloaded from
2
Abstract
Epigenetic mechanisms such as DNA methylation (DNAm) are essential for regulation of gene expression. DNAm is dynamic, influenced by both environmental and genetic factors. Epigenetic drift is the divergence of the epigenome as a function of age due to stochastic changes in methylation. Here we show that epigenetic drift may be constrained at many CpGs across the human genome by DNA sequence variation and by lifetime environmental exposures. We estimate repeatability of DNAm at 234,811 autosomal CpGs in whole blood using longitudinal data (2-3 repeated measurements) on 478 older people from two Scottish birth cohorts – the Lothian Birth Cohorts of 1921 and 1936. Median age was 79yrs and 70yrs, and the follow-up period was ~10yrs and ~6yrs, respectively. We compare this to methylation heritability estimated in the Brisbane Systems Genomics Study, a cross-sectional study of 117 families (offspring median age 13yrs; parent median age 46yrs). CpG repeatability in older people was highly correlated (0.68) with heritability estimated in younger people. Highly heritable sites had strong underlying cis-genetic effects. 37 and 1687 autosomal CpGs were associated with smoking and sex, respectively. Both sets were strongly enriched for high repeatability. Sex-associated CpGs were also strongly enriched for high heritability. Our results show that a large number of CpGs across the genome, as a result of environmental and/or genetic constraints, have stable DNAm variation over the human life-time. Moreover, at a number of CpGs, most variation in the population is due to genetic factors, despite some sites being highly modifiable by the environment.
Cold Spring Harbor Laboratory Press on September 26, 2014 - Published by genome.cshlp.orgDownloaded from
3
Introduction Epigenetics refers to the chemical modifications of DNA that regulate gene expression without altering the underlying DNA sequence. DNA methylation (DNAm), the covalent addition of a methyl group to a cytosine nucleotide primarily in the context of a CpG dinucleotide, is among the best-studied epigenetic mechanisms, and plays a crucial role in mammalian development (Tate et al. 1996; Li et al. 1992), X-chromosome inactivation (Panning and Jaenisch 1998), imprinting (Li et al. 1993), cell-lineage specification (Challen et al. 2012; Bröske et al. 2009; Trowbridge et al. 2009), and maintaining genome stability (Lengauer et al. 1997; Bellacosa et al. 1999). In mammalian development, shortly after fertilisation, DNAm marks are largely erased. Genome-wide and tissue-specific de novo methylation takes place following blastocyst formation. Primordial germ cells also undergo de-methylation, followed by de novo methylation during gametogenesis and establishment of sex-dependent imprints. By contrast with sequence variants, DNAm is dynamic, and is influenced by many factors including lifestyle, environment and genetics (Mathers et al. 2010; Jirtle and Skinner 2007; Alegría-Torres et al. 2011). Two forms of inheritance of epigenetic marks have been demonstrated: genetic inheritance and epigenetic inheritance. The latter is independent of DNA sequence and may occur through incomplete erasure of epigenetic marks during epigenetic reprogramming at the gamete and zygote stages. Genetic inheritance of epigenetic state is where an individual’s DNA sequence affects epigenetic state. A large number of common single nucleotide polymorphisms (SNPs) have been shown to affect methylation at CpG sites that are typically in close proximity to the SNP i.e. located in cis (Kerkel et al. 2008; Gibbs et al. 2010; Bell et al. 2011; Grundberg et al. 2012), with some SNPs explaining up to 90% of the variation in methylation at the associated CpG site (Gibbs et al. 2010). These genetic variants are referred to as DNA methylation quantitative trait loci (mQTL), and methylation at the associated CpG sites is highly heritable (McRae et al. 2014). Recent estimates of mean genome-wide DNAm heritability (proportion of variance explained by additive genetic factors) are 12-18% in blood (Bell et al. 2012; Grundberg et al. 2013; McRae et al. 2014) but locus-specific levels have shown to be variable. Mean heritability across tissues vary, with estimates of 5% in placenta and 7% in human umbilical vein endothelial cells (HUVECs) (Gordon et al. 2012). Age-related changes in DNAm are well documented, and a large number of age-associated methylation sites have been identified across the genome (Hannum et al. 2013; Horvath 2013; Bocklandt et al. 2011). The epigenome diverges with age, even within monozygotic twins, with older twins having less similar epigenetic profiles than younger twins (Fraga et al. 2005). The differences in the epigenome of genetically identical individuals has been attributed to differences in external factors, such as changes in lifestyle and environment, but also to internal stochastic factors such as small defects in transmitting epigenetic information through successive cell divisions or maintaining it in differentiated cells, a process termed ‘epigenetic drift’
Cold Spring Harbor Laboratory Press on September 26, 2014 - Published by genome.cshlp.orgDownloaded from
4
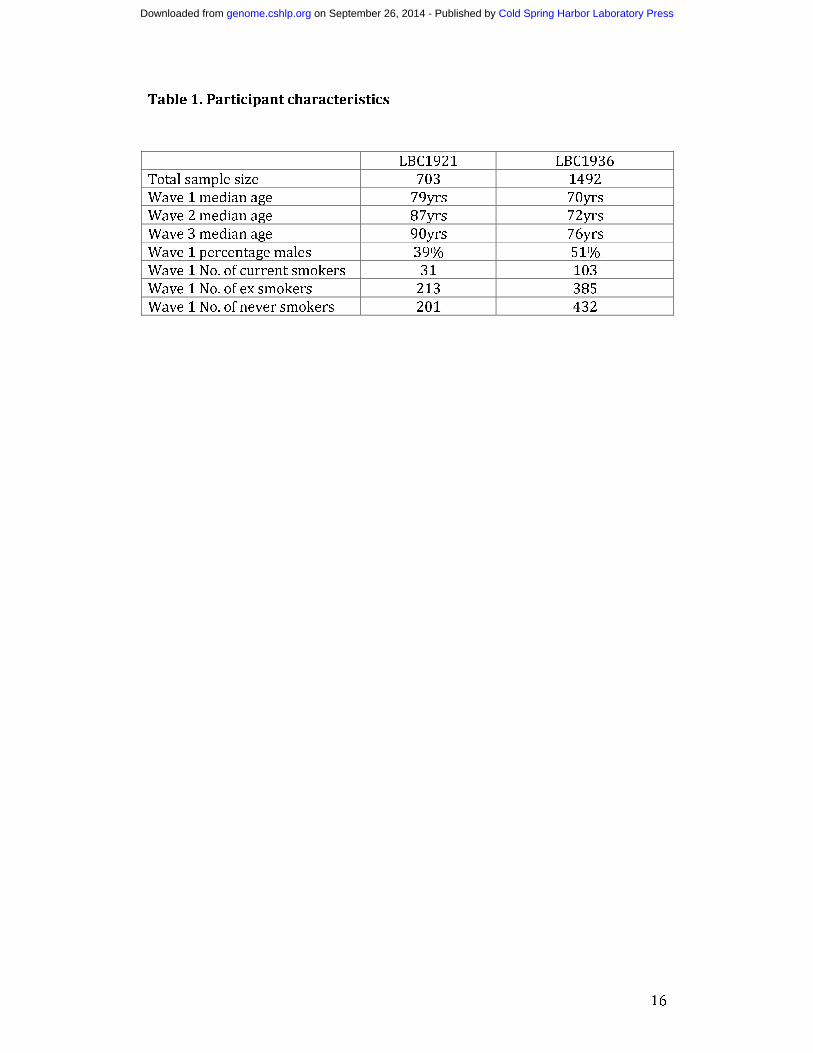
(Fraga et al. 2005). Epigenetic differences in genetically identical twins may be key to understanding disease discordance in monozygotic twins. Understanding what factors contribute to DNAm variation is important not only for understanding the role of DNAm in complex disease traits, but also for informing future epigenetic studies that take a cross-sectional approach. There have been relatively few longitudinal studies on DNAm, and these have focused either on a handful of selected loci (Wong et al. 2010; Talens et al. 2010) or only on loci whose DNAm changes with age (Madrigano et al. 2012; Florath et al. 2013), and others have used only global measures of methylation (Bjornsson et al. 2008). Therefore, it is still not fully known how stable DNAm levels across the genome are over time and to what extent these are influenced by heritable versus environmental factors. When longitudinal data are available, one measure of stability over time is the repeatability (Rm) of methylation levels. Rm is the correlation between repeated measures of the same individual (Falconer and Mackay 1996) and is calculated as the ratio of the between-individual variance over the total variance. Variance between individuals can be partitioned into variance due to genetic factors and variance due to permanent differences in environment between individuals. The genetic variance can be further partitioned into additive and non-additive (dominant and epistatic effects) genetic variance, and the proportion of phenotypic variance due to additive genetic factors is the (narrow sense) heritability (h2). Since heritability is one of the determining factors of repeatability, h2 estimates should not exceed Rm estimates in the same sample, and Rm therefore sets an upper bound for h2 (see Methods). By comparing the Rm and h2 we can assess the extent to which variation between individuals is due to additive genetic factors. To assess the stability of DNAm across the genome over time, we estimated methylation Rm at 234,811 autosomal CpG probes in whole blood using longitudinal data on 478 older, initially healthy, Scottish individuals from two birth cohorts – the Lothian Birth Cohort of 1921 (LBC1921) and 1936 (LBC1936) (Deary et al. 2012, 2004, 2007). Participants had 2 or 3 repeated measures of DNAm over a period of ~10 years in LBC1921 and ~6 years in LBC1936. Median ages at baseline (wave 1) were 79 and 70 years, in LBC1921 and LBC1936, respectively. To assess the extent to which additive genetic factors contribute to DNAm variation, we compared the Rm for each CpG site to their h2 estimated in the Brisbane Systems Genomics Study (BSGS). The BSGS is a cross-sectional study of 117 families comprising adolescent monozygotic (MZ) and dizygotic (DZ) twins, their siblings and their parents, with an age range of 9-75yrs (offspring median age 13 years; parent median age 46 years) (Powell et al. 2012). Results Data
Cold Spring Harbor Laboratory Press on September 26, 2014 - Published by genome.cshlp.orgDownloaded from

5
In LBC, DNAm was measured in 2460 whole blood samples (from 1520 individuals) at 485,512 CpG sites across the genome using the Infinium HumanMethylation450. array. After quality control (QC) analysis and probe filtering (see Methods and Materials), 2195 samples (from 1366 individuals) and 249,741 methylation probes remained. Only 478 out of the 1366 individuals in the QCd data had repeated measures of DNAm (186 individuals with 2 measures and 292 individuals with 3 measures) and these were used for estimating repeatability. At the three waves of sample collection, LBC1921 participants had median age 79 (n=446), 87 (n=175) and 90 (n=82) years, while LBC1936 participants had median age 70 (n=920), 72 (n=299) and 76 (n=273) years (Table 1). In BSGS, DNAm was measured in 614 blood lymphocyte samples using the Infinium HumanMethylation450 array. All 614 samples passed QC with DNAm data available on 261,450 autosomal CpG sites. Beta-value heteroscedasticity Methylation levels are summarised as beta values ranging between 0 and 1, where a value close to zero indicates that all copies of the CpG site in the sample were completely unmethylated (no methylated molecules were measured) and a value close to one indicates that every copy of the site was methylated. Six percent of CpG sites (14,930 out of 249,741) were either unmethylated (beta ≤ 0.1) across all samples or completely methylated (beta-values ≥0.9) across all samples. The beta-value has significant heteroscedasticity and the standard deviation of the beta value in these very low and very high beta ranges is greatly compressed (Du et al. 2010) (Figure S1). Any variation in methylation signal at these high and low ranges is likely to be measurement noise. Since Rm is a function of both within-individual and between-individual variance, individual consistency will only be evident in the repeatability if there is between-individual variation in the sample (Figure S2). Therefore, despite these CpGs having extremely stable methylation in the entire sample, their estimates of repeatability were very low (Figure S3A). This was also the case for heritability estimates (Figure S3B). Based on assessments of the relationship between mean beta values, beta variance and Rm, we excluded these 14,930 probes. Rm estimates for 234,811 probes were therefore considered in further analysis. Genome-wide repeatability The distribution of Rm for the 234,811 autosomal CpG sites is shown in Figure 1. We found 13% (31,273 probes) had Rm ≥ 0.5. To show that the CpG sites with higher Rm were not observed simply by chance, we used permutation to derive the null distribution. The empirical distribution of Rm values was not consistent with the null hypothesis of chance associations (Figure S4). For comparison, we also looked at the distribution of Rm for the 234,811 CpG sites in 7 pairs of technical replicates available in the BSGS data (no replicate data was available in the LBCs). The Rm distribution was shifted to the right, with the majority of probes having high Rm values (60% with Rm ≥ 0.5) (Figure S5). However, around 25,000 probes had repeatability of zero even in technical replicates. These may represent poor-performing probes. A much larger number of replicate samples would be needed to accurately estimate the true
Cold Spring Harbor Laboratory Press on September 26, 2014 - Published by genome.cshlp.orgDownloaded from

6
proportion of repeatable probes and identify those that warrant removal from further analyses. With a larger number of replicates, the standard error in the Rm estimation will decrease, and it is likely the Rm distribution would shift further to the right, with most probes either having repeatability close to one or close to zero, providing greater power to distinguish the poor-performing probes. Correlation between repeatability and heritability
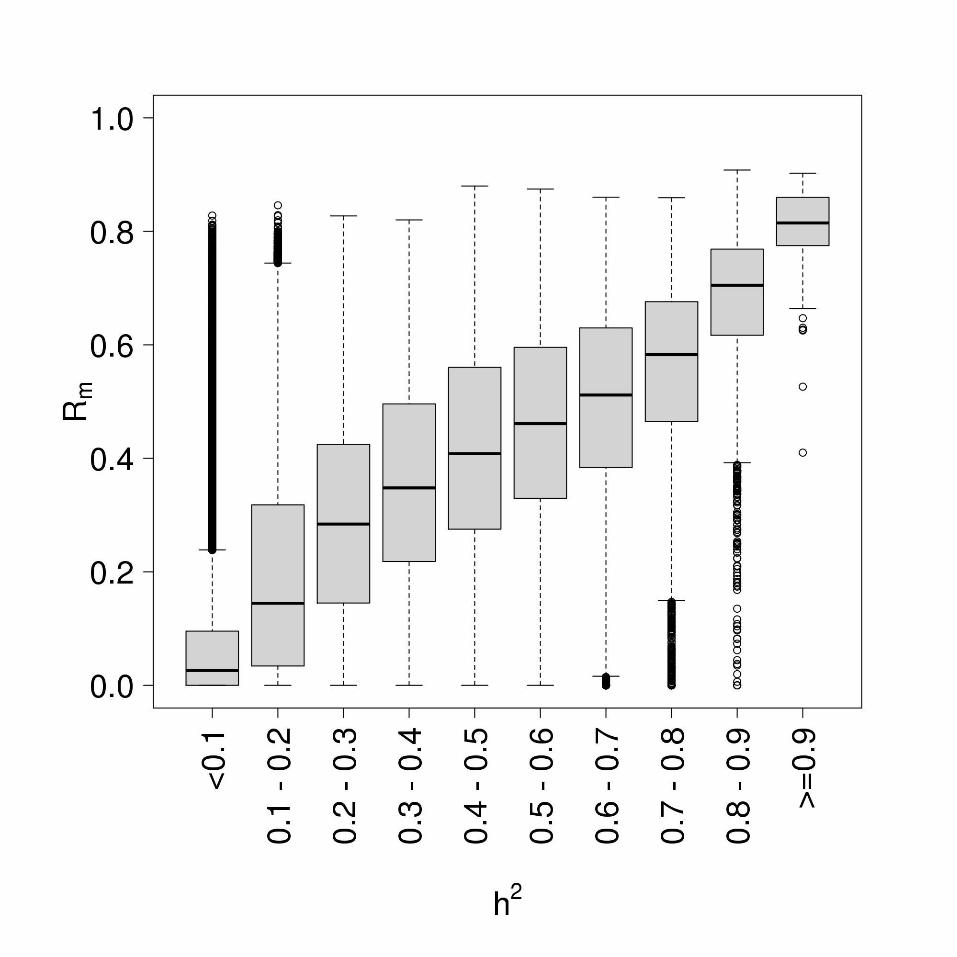
We then correlated probe Rm to probe h2, which had been estimated in the younger BSGS family cohort (McRae et al. 2014). All 234,811 probes were present in the QCd BSGS dataset. We observed a high correlation of 0.68 (p-value <1.0x10⁻¹⁶) between Rm and h2 (Figure 2). Given the relationship of both Rm and h2 with mean beta values (figure S3) in the two separate datasets, one might expect the correlation between probe Rm and h2 to be confounded by the mean beta values of the CpG probes. However, we found a strong positive correlation between Rm and h2 in different bins of mean beta values (figure S7), suggesting that the observed correlation between Rm and h2 is not confounded by mean beta values. Both genetic and/or environmental factors may be responsible for high DNAm repeatability. Probes with high h2 generally had high Rm, consistent with a genetic constraint. To demonstrate this we used the sum of ranks to select 10 CpG sites with the highest Rm and h2 and looked for associations with SNPs in the BSGS data. For all 10 CpG sites we identified significant associations between methylation levels and SNPs (association p-value < 8.3x10-09; representing significance at the 5% level after Bonferroni correction for 6,005,138 SNP association tests performed on the BSGS genotype data). For 9 out of 10 CpG sites, the associated SNP was located less than 150kb from the CpG site, and for 7 of these, the SNP was located within 1kb. The effect sizes of these single cis-acting SNPs were very large, explaining between 50-85% of the variation in methylation at the CpG site (Table S1). For one of these associations, the SNP was located on a different chromosome to the CpG site but still explained 30% of the variation in methylation at this site. Using the sum of ranks we also selected 10 probes that had highest Rm and lowest h2 (ranking probes by decreasing Rm and increasing h2), and none had significant associations with any SNPs, suggesting that the high repeatability may be due to environmental effects. Repeatability and heritability of smoking-associated methylation sites We hypothesised that CpG sites with high Rm but low h2 may be under strong influence of environmental factors. To test this we assessed the distribution of Rm and h2 of CpG sites whose methylation levels were associated with an environmental factor – smoking. Using LBC1936 as a discovery sample (731 never smokers vs 139 current smokers) we identified 305 significantly associated autosomal CpG sites (at p-value <2.13x10-07 representing significance at the 5% level after Bonferroni correction for 234,811 tests). Using LBC1921 as a replication sample (333 never-smokers vs 39 current smokers), 37 sites in/near 27 genes were validated (p-value<0.00016; Bonferroni correction for 305 tests). Of the identified genes, 16 had previously been
Cold Spring Harbor Laboratory Press on September 26, 2014 - Published by genome.cshlp.orgDownloaded from
7
identified to contain CpGs that were differentially methylated in response to smoking status (Joubert et al. 2012; Shenker et al. 2013; Zeilinger et al. 2013) (Table S2). Looking at the distribution of Rm and h2, we observed a strong enrichment for probes with high Rm (Figure 3). Though some of these CpG sites also had high h2, the enrichment for high heritability probes was not as substantial (Figure 3). The discordance in the distribution of Rm and h2 for smoking-associated CpG sites was more obvious when looking at the larger subset of the 305 CpG sites that were identified in the LBC1936 discovery sample. For this set of 305 probes, a much larger proportion had high Rm compared to those with high h2 (Figure S8). The correlation between Rm and h2 for the 37 smoking-associated probes was 0.68 (p-value=3.0x10-
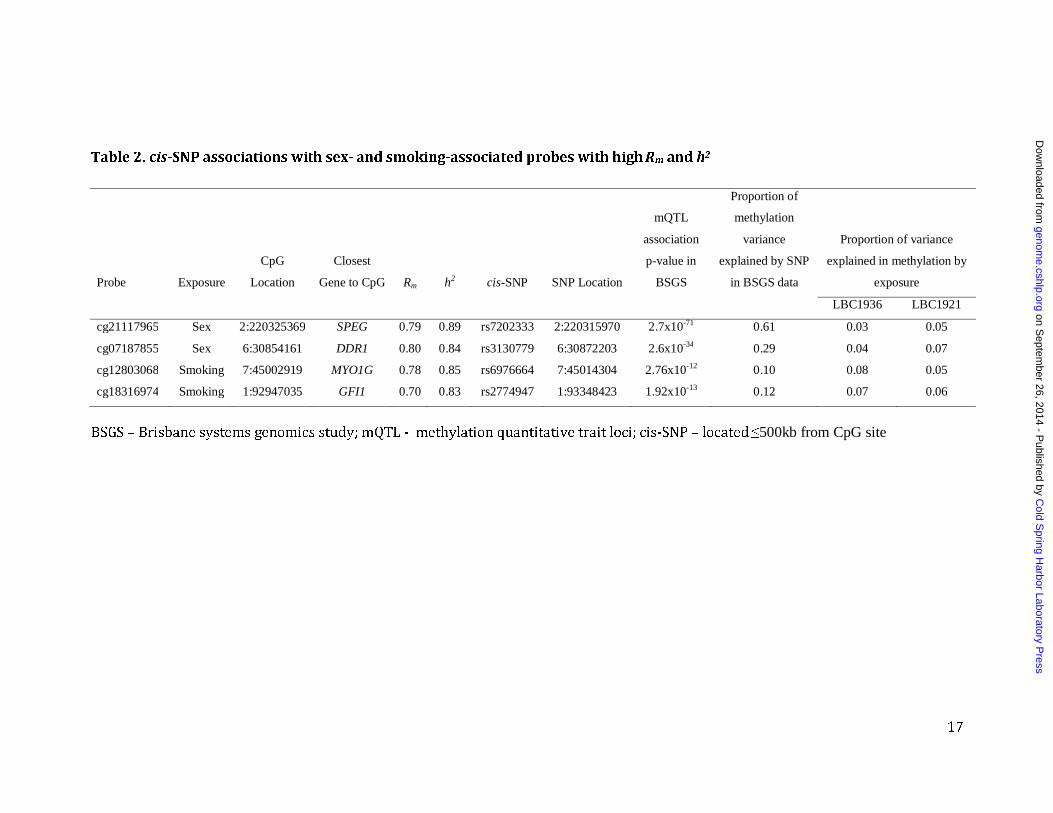
06), suggesting that even for sites where methylation is influenced by environment, additive genetic factors have a strong influence. We found significant SNP associations for 12 out of the 37 smoking probes (32%), 10 of which were with cis-acting SNPs (located within 500kb of CpG site), one was with a SNP on the same chromosome but more than 500kb away, and one with a SNP on a different chromosome. A lookup of two independent smoking-associated probes with the highest Rm and h2 identified strong underlying cis-SNP effects, each explaining around 10% of the methylation variation at these CpG sites, similar to that explained by smoking status itself (Table 2). The most significant association with smoking status in our data was with a previously reported CpG probe (cg05575921) in the AHRR gene. This probe had high Rm of 0.74 but relatively low h2 of 0.24, with no significant SNP associations found in the BSGS data. Repeatability and heritability of sex-associated methylation sites We also identified and assessed the distribution of Rm and h2 of CpG sites that were differentially methylated between males and females. Sex can be considered as a genetic factor, but also as an unmodifiable life-long “exposure”, and differences between males and females would be confounded by any gender-related differences in environment or lifestyle. Using LBC1936 as a discovery sample (732 females and 760 males) and modelling individual as a random effect, 3810 autosomal CpGs were significantly associated with sex (p-value <2.13 x10-07; Bonferroni correction for 234,811 tests). Of these, 1687 were replicated (p-value <1.30x10-05; Bonferroni correction for 3810 tests) in the LBC1921 data (409 females and 294 males). These were located in or near 1157 genes (Table S3). Sex-associated CpG probes were significantly enriched for probes with high Rm and h2 (Figure 3 and S8). It is important to note that Rm and h2 were calculated after adjusting for sex, therefore the high Rm and h2 are not being driven simply by mean differences between the two groups. The correlation between Rm and h2 for these CpG sites was 0.76 (p-value<1.0x10⁻¹⁶). This suggests that methylation at these sites is strongly influenced by genetic factors. Of the 1687 probes, 561 (33%) had significant underlying SNP associations, of which 519 (93%) were located within 500kb from CpG site. A lookup of two sex-associated probes with high Rm and h2 identified strong underlying cis-SNP effects explaining 29% and 61% of the variation in methylation (Table 2), which was much higher than the proportion of variance explained by sex (3-7%). One of
Cold Spring Harbor Laboratory Press on September 26, 2014 - Published by genome.cshlp.orgDownloaded from
8
these CpG sites (cg07187855) is located within a regulatory region upstream of the discoidin domain receptor tyrosine kinase 1 (DDR1) gene, which based on mice studies, plays an essential role in mammary gland development (Vogel et al. 2001).
Discussion Though observations of changes in global (or average) methylation over time have been previously reported (Fraga et al. 2005; Bjornsson et al. 2008), using population-based, longitudinal methylation analyses, we have identified a large number of autosomal CpG sites across the genome whose methylation levels are stable over time. It has been suggested by studies on global methylation that epigenetic drift with age is a genome-wide phenomenon that may occur due to the accumulation of small defects in the transmission of epigenetic marks through successive cell divisions (Fraga et al. 2005). We identify genetic and environmental factors that appear to be responsible for DNAm stability over time at a number of CpG sites. Such factors may therefore be constraining drift at these CpG sites. The strong correlation between repeatability estimated in older individuals to heritability estimated in younger individuals suggests, firstly, that additive genetic factors are the main contributors to methylation variation at a large proportion of the measured CpG sites, and secondly, that CpG sites under strong genetic influence appear to be stable almost over the human life course. Heritability estimates for any given CpG site can change, and can be age-, tissue- and population-specific. Methylation at the same CpG site measured over an individual’s lifetime can have different genetic and environmental effects influencing it, so that the variances become a function of age. However, despite the differences between the LBC and BSGS participant characteristics, especially the age of the participants, we find that CpG sites under strong genetic influence have stable methylation even later on in life. Heritability can be thought of as the repeatability within related individuals. For example, if stability is solely due to genetic factors then the repeatability within a person over time is the same as the correlation between monozygotic twins (and this correlation is the heritability). Since h2 is partly derived from the correlation between parents and offspring, high h2 in BSGS data indicates that methylation levels are stable within the age-range of the BSGS samples (9-75 years). If the same probes have high Rm in LBC, this indicates that methylation is also stable between 70-90 yrs. Therefore, for probes with both high h2 and Rm, methylation repeatability is high throughout the age-ranges in BSGS and LBC (9-90 yrs). The stability of DNA methylation over time is an important factor to consider when drawing conclusions about causality in epidemiological studies, especially in prospective cohorts, where only a single biological sample has been collected but phenotypic information on participants is collected at subsequent phases. For CpG sites where environment/lifestyle plays the major role, the length or continuity of
Cold Spring Harbor Laboratory Press on September 26, 2014 - Published by genome.cshlp.orgDownloaded from

9
exposure may be key. For example, for cg05575921, the most strongly associated probe with smoking status, we observed that the mean methylation level at baseline in ex-smokers (unadjusted beta mean=0.83; SD=0.087) was significantly lower than those who had never smoked (unadjusted beta mean=0.88; SD=0.05) (p<1x10-16), but also significantly higher than current smokers (unadjusted beta mean=0.61; SD=0.11) (p<1x10-16). Information on when ex-smokers gave up smoking would allow us to determine the longevity of the effects of smoking on methylation, which would be important in determining the long-term exposure risk in diseases where smoking is a known risk factor. CpG sites influenced by smoking were relatively stable over time. However, though some CpGs had high heritability, overall the genetic contribution was not as strong as that observed for the sex-associated CpG sites. This was evident in the higher correlation between Rm and h2 for the sex-associated CpGs compared to that for the smoking-associated CpGs. CpG sites with differential methylation between males and females will be of interest in the context of diseases that are more prevalent in one sex compared to the other. It remains to be seen whether the stability and heritability of DNAm translates to gene expression levels. A comparison between methylation QTLs and expression QTLs would be needed to determine if common genetic variation affects gene expression via changes in DNAm. There are a number of factors to consider when interpreting the results from these analyses: Firstly, repeatability is a well-established measure for assessing reproducibility (Sokal and Rohlf 1995), but it is only evident if there is between-individual variation in the population. It is therefore not a suitable method for estimating reproducibility in extremely stable measures where there is little between-individual variation, and is likely to underestimate the true number of repeatable CpGs. Our analyses on replicate samples did identify a number of probes with repeatability of zero. These may be probes that are truly stable over time, or probes that due to technical reasons do not perform well. Under the null distribution of the test statistic for repeatability, the expected proportion of probes with zero repeatability is 50%. Using this, we can estimate a lower limit of the true proportion of probes that have a non-zero repeatability as 2*(0.5 – P), where P is the proportion of observed probes with Rm=0. In the LBC data, P=0.16, thus we conclude that at least 68% of probes have non-zero repeatability over the time course studied. Similarly, from our analysis of seven replicates (P=0.1), the upper-bound of the proportion of probes that have zero repeatability through either showing no variation in DNA methylation levels or through technical issues is 20%. This indicates that although our estimated proportion of repeatable results in LBC is downwardly biased by the presence of probes with technical issues or having no variation in DNA methylation, it is not markedly biased. Secondly, CpGs with mean beta-values between 0.4 - 0.6 showed the highest Rm and h2 values (Figure S3). This may partly reflect the heteroscedasticity of the beta-value and the reliance of Rm estimation on the presence of between-individual variation. However, CpGs with strong underlying SNP effects, especially if these are common
Cold Spring Harbor Laboratory Press on September 26, 2014 - Published by genome.cshlp.orgDownloaded from

10
SNPs, have high between-individual variation with mean methylation around 0.5 (individuals in the 3 genotype groups tend to have beta-values around 0, 0.5 and 1). Therefore, high Rm and h2 for probes with mean beta-values in the medium methylation range (0.4 - 0.6) is likely to reflect underlying mQTLs. Thirdly, though the Infinium HumanMethylation450 array comprehensively evaluates promoter regions and CpG islands as well as other potentially relevant intergenic regions, such as regulatory regions (Slieker et al. 2013), it only interrogates a small subset of the ~28 million CpG sites in the human genome. Therefore, our results may not be representative of all CpG sites across the entire human genome. Finally, whole blood, from which the DNA samples were extracted, consist of a heterogenous cell population and it has been shown that these functionally distinct populations have unique DNA methylation profiles (Reinius et al. 2012), which could confound analyses. However, we found a very high correlation (0.98) between Rm estimated from data adjusted and unadjusted for cell count. In summary, we show that genetic and environmental factors may constrain epigenetic drift. We also show that methylation at CpG sites measured in blood has a number of the same characteristics as other “complex traits”. Firstly, variation in methylation at any given CpG site can be influenced by both genetic and environmental factors, secondly, heritable variation can be mapped by associations with SNPs, and thirdly robust and replicable associations with environmental factors can be found. Therefore, methylation levels at a single CpG site can be treated as a complex trait. Materials and methods Subjects The Lothian Birth Cohort 1921 (LBC1921): This cohort is the basis of a longitudinal study of ageing (Deary et al. 2012, 2004). All participants were born in 1921 and most completed a cognitive ability test (Moray House Test No. 12) at about age 11 years in the Scottish Mental Survey 1932 (SMS1932) (Scottish Council for Research in Education 1933). The LBC1921 study attempted to follow up individuals who might have completed the SMS1932 and resided at about age 79 years in the Lothian region (Edinburgh and its surrounding areas) of Scotland; 550 people (n=234, 43% men) were successfully traced and participated in the study from age 79 years. To date, there have been four additional follow-up waves at average ages of 83, 87, 90, and 92 years. The cohort has been deeply phenotyped during the later-life waves, including blood biomarkers, white blood cell counts, cognitive testing, and psycho-social, lifestyle, and health measures. DNA methylation was measured in subjects at an average age of 79 years (n=515), 87 years (n=181) and 90 years (n=87), and data from these waves were used for analyses. Lothian Birth Cohort 1936 (LBC1936): All participants were born in 1936 (Deary et
Cold Spring Harbor Laboratory Press on September 26, 2014 - Published by genome.cshlp.orgDownloaded from

11
al. 2007, 2012). Most had taken part in the Scottish Mental Survey 1947 at mean age 11 years as part of national testing of almost all children born in 1936 who attended Scottish schools on June 4th 1947 (Scottish Council for Research in Education 1949). The cognitive test administered was the same Moray House Test No. 12 used in the SMS1932. A total of 1,091 participants (n=548, 50% men) who were mostly living in the Lothian area of Scotland were recontacted in later life. Extensive phenotyping, including white blood cell counts, has also been carried out in this study, with data collection waves at three time points. DNA methylation was measured at mean age 70 years (n= 1,005), 73 years (n=336), and 76 years (n=332), and data from these waves were used for analyses. Brisbane Systems Genetics Study (BSGS): Participants were originally recruited into an ongoing study of the genetic and environmental factors influencing cognition and pigmented nevi. DNA methylation was measured on 614 individuals from 117 families of European descent. Families consist of adolescent monozygotic (MZ; n=67 pairs) and dizygotic (DZ; n=111 pairs) twins, their siblings (n=119), and their parents (n=139). Children have a mean age of 14 years (range 9-23) and parents 47 years (range 33-75) (Powell et al. 2012). Ethics Following informed consent, venesected whole blood was collected for DNA extraction in both LBC1921 and LBC1936. Ethics permission for the LBC1921 was obtained from the Lothian Research Ethics Committee (Wave 1: LREC/1998/4/183). Ethics permission for the LBC1936 was obtained from the Multi-Centre Research Ethics Committee for Scotland (Wave 1: MREC/01/0/56), the Lothian Research Ethics Committee (Wave 1: LREC/2003/2/29). Written informed consent was obtained from all subjects. The BSGS study was approved by the Queensland Institute for Medical Research Human Research Ethics Committee. All participants gave informed written consent. DNA methylation LBC1921 and LBC1936: DNA was extracted from whole blood samples in LBC1921 at MRC Technology, Western General Hospital, Edinburgh (LBC1921) and the Wellcome Trust Clinical Research Facility (WTCRF), Western General Hospital, Edinburgh (LBC1936), using standard methods. Methylation typing of 485,512 probes was performed at the WTCRF. Bisulphite converted DNA samples were hybridised to the Infinium HumanMethylation450 array using the Infinium HD Methylation protocol and Tecan robotics (Illumina, San Diego, CA, USA). Raw intensity data were background-corrected and normalised using internal controls, and methylation beta-values generated using the R minfi package (Aryee et al. 2014). Quality control (QC) analysis was performed to remove probes with a low (<95%) detection rate at p<0·01. Manual inspection of the array control probe signals was used to identify and remove low quality samples (e.g. samples with inadequate hybridisation, bisulfite conversion, nucleotide extension or staining signal). The
Cold Spring Harbor Laboratory Press on September 26, 2014 - Published by genome.cshlp.orgDownloaded from

12
Illumina-recommended threshold was used to eliminate samples with a low call rate (samples with <450,000 probes detected at p<0·01). Samples whose predicted sex, based on XY probes, did not match reported sex were excluded. Probes on the X and Y chromosomes were also removed. After these QC steps, 450,726 autosomal probes remained. Beta-values were corrected for effects of sample plate, beadchip, position on beadchip, hybridisation date, white blood cell counts (basophils, eosinophils, monocytes, lymphocytes, neutrophils) and sex using a generalised linear model with a logistic link function. Residuals from this model were used in further analyses. BSGS: DNA was extracted from peripheral blood lymphocytes by the salt precipitation method (Miller et al. 1988) from samples that were time matched to sample collection of PAXgene tubes for gene expression studies in the Brisbane Systems Genetics Study. Bisulphite converted DNA samples were hybridised to the 12 sample Infinium HumanMethylation450 array using the Infinium HD Methylation protocol and Tecan robotics (Illumina, San Diego, CA, USA). The proportion of probes with detection p-value less than 0·01 was examined to confirm strong binding of the sample to the array. The probability of a probe within a sample either being called as missing or with a detection p-value less than 0.001 were estimated from the average rate across all probes and samples. A threshold for probes showing significant deviation from random missingness (or excess poor binding) was determined by testing against a binomial distribution for the number of samples at the 0.05 significance level with a Bonferroni correction for the number of probes. Any probe with more than 11 individuals with missing data or more than five individuals with detection p-values > 0.001 were removed. Probes on the X and Y chromosomes were also removed. After QC, 614 samples and 458,836 autosomal probes remained. Raw intensity values were background corrected and normalised to internal controls using the Genome Studio software and beta values generated. Percentage of monocytes, B cells, NK cells, CD4+ T cells, CD8+ T cells and granulocytes were predicted using a published prediction algorithm (Houseman et al. 2012). Beta values were corrected for array, sex, age, age2, sex x age, sex x age2 and predicted white blood cell counts using a generalised linear model with a logistic link function, and residuals used in subsequent analyses. BSGS methylation data are available from the NCBI Gene Expression Omnibus (GEO; http://www.ncbi.nlm.nih.gov/geo/) under accession number GSE56105. Genotyping and methylation quantitative trait loci (mQTL) analysis All BSGS individuals were genotyped on the Illumina Human610-Quad BeadChip. Full details of genotyping procedures is given elsewhere (Medland et al. 2009). Standard QC filters were applied, leaving 528,509 SNPs. The remaining genotyped SNPs were phased using HAPI-UR (Williams et al. 2012) and imputed using 1000 Genomes Phase I Version 3 (The 1000 Genomes Project Consortium 2010) with IMPUTE2 (Howie et al. 2011, 2012). Raw imputed SNPs were filtered to remove any SNPs with low imputation quality as defined by an R2 < 0.8. Subsequent quality
Cold Spring Harbor Laboratory Press on September 26, 2014 - Published by genome.cshlp.orgDownloaded from

13
control removed SNPs with MAF < 0.05, those with HWE p < 1 x 10⁻⁶, and a missing rate > 10%. After filtering, 6,005,138 SNPs remained for further analysis. Association of methylation data (residuals after adjusting for covariates) with imputed genotype probabilities was performed using Merlin (Abecasis et al. 2002). Repeatability The repeatability measure (Rm) for each methylation probe was calculated as the ratio of the between-individual variance over the total variance (Vtotal). These quantities can be extracted from a random effects linear regression with individual as random effect:
�� � ��
�
�� � � ��
�
where ��
� and ��� are the between-subject and residual (within-subject) variances,
respectively, and Vtotal = ��� +��
�. The lmer() function in the lme4 R CRAN package (Bates et al. 2014) was used to perform the random effects linear regression. Since the variance between individuals can be partitioned into variance due to genetic factors (VG) and variance due to permanent differences in environment between individuals (VEp), we can define Rm as
�� ��� � ���
���
The genetic variance can be further partitioned into additive and non-additive (dominant and epistatic effects) genetic variance, so that Rm can be defined as
�� �����������
���
� ����� ��������
���
� � ��
���
The proportion of phenotypic variance due to additive genetic factors (����������
/
���) is the (narrow sense) heritability (h2). Based on this equation we can see that h2
estimates should not exceed Rm estimates in the same sample, and Rm therefore sets an upper bound for h2. By comparing the Rm and h2 we can assess the extent to which variation between individuals is due to additive genetic factors. Probes that contained SNPs or had been identified previously as potentially cross-hybridising (Price et al. 2013) showed some inflation in Rm and h2 (Figure S9). Therefore, to avoid potential biases due to effects of SNPs on array binding, we removed all probes that encompass SNPs annotated in 1000 Genomes data (The 1000 Genomes Project Consortium 2010) and high-quality SNPs in dbSNP (Price et al. 2013). Probes where all samples had beta ≤0.1 or all samples had beta ≥0.9 were
excluded from analysis, as the lack of between-individual variance means Rm or h2 cannot be accurately estimated for these probes. The null distribution for Rm was derived using data permutation.
Cold Spring Harbor Laboratory Press on September 26, 2014 - Published by genome.cshlp.orgDownloaded from

14
Heritability The heritability for each probe was estimated in BSGS by partitioning its variance into additive genetic (����������
) and environmental (VEp) component by fitting a linear
mixed model of the form: y = μ + Za + e
where y is the vector of the covariate-adjusted methylation level, μ is the mean value, a is the additive genetic effects and e is the unique environmental effects (residuals). The model was fitted using QTDT (Abecasis et al. 2000), which uses maximum likelihood to estimate the variance components. Probes that contained SNPs or had been identified previously as potentially cross-hybridising (Price et al. 2013) were excluded from analysis. Association analysis
To identify probes associated with smoking status and sex, data from all waves was analysed using a linear mixed model, where individual was modelled as a random effect. LBC1936 samples were used for discovery and LBC1921 as replication sample. Association with smoking (never smokers versus current smokers) was performed on residuals corrected for sample plate, beadchip, position on beadchip, hybridisation date, sex, cell count and wave. For sex-association analysis, residuals uncorrected for sex were used, and smoking status (current/ex/never) was added as a covariate in the model. Smoking information was available at all waves for 693 out of the 1366 (51%) individuals, and for the vast majority of these individuals smoking status did not change across the different waves. Therefore, baseline smoking status was used for all samples in the association analysis. In a mixed model analysis, the proportion of variance explained by fixed effects (marginal R2 value) for each probe can be extracted using the r.squaredGLMM() command in the MuMIn R package (Barton 2014). For the sex-association analysis, since both sex and smoking were fitted as fixed effects, to get the proportion of variance explained by sex alone, the marginal R2 had to be extracted from a linear mixed model that included only sex but not smoking. Probes significant at the 5% level after Bonferroni correction in the LBC1936 discovery sample (p<2.13x10-07 for 234,811 tests) were validated in the LBC1921 replication sample. Data access LBC data have been submitted to the European Genome-phenome Archive (EGA; https://www.ebi.ac.uk/ega/home) under accession number EGAS00001000910. Acknowledgements We thank the cohort participants and team members who contributed to these studies. Phenotype collection in the Lothian Birth Cohort 1921 was supported by the
UK’s Biotechnology and Biological Sciences Research Council (BBSRC), The Royal Society and The Chief Scientist Office of the Scottish Government. Phenotype
Cold Spring Harbor Laboratory Press on September 26, 2014 - Published by genome.cshlp.orgDownloaded from

15
collection in the Lothian Birth Cohort 1936 was supported by Age UK (The Disconnected Mind project). Methylation typing was supported by Centre for Cognitive Ageing and Cognitive Epidemiology (Pilot Fund award), Age UK, The Wellcome Trust Institutional Strategic Support Fund, The University of Edinburgh, and The University of Queensland. REM, IJD, SEH, SRC, JMS and PMV are members of the University of Edinburgh Centre for Cognitive Ageing and Cognitive Epidemiology (CCACE). CCACE is supported by funding from the BBSRC, the Economic and Social Research Council (ESRC), the Medical Research Council (MRC), and the University of Edinburgh as part of the cross-council Lifelong Health and Wellbeing initiative (MR/K026992/1). Research reported in this publication was supported by National Health and Medical Research Council (NHMRC) project grants 613608, APP496667, APP1010374 and APP1046880. NHMRC Fellowships to GWM, PMV, and NRW (613602) and Australia Research Council (ARC) Future Fellowship to NRW (FT0991360). The content is solely the responsibility of the authors and does not necessarily represent the official views of the NHMRC or ARC. Disclosure declaration All authors declare no conflict of interest. Figure legends Figure 1. Distribution of Rm. Rm distribution for 234,811 autosomal CpG sites in the Lothian Birth Cohorts. Figure 2. Correlation between Rm and h2. The distribution of Rm estimated in the LBC cohorts by bins of h2 estimated in the BSGS cohort. Correlation between the two measures was 0.68. Figure 3. Distribution of Rm and h2 for smoking- and sex-associated CpG sites. (A) 37 smoking-associated autosomal probes (B) 1687 sex-associated autosomal probes.
Cold Spring Harbor Laboratory Press on September 26, 2014 - Published by genome.cshlp.orgDownloaded from
16
Table 1. Participant characteristics
LBC1921 LBC1936
Total sample size 703 1492
Wave 1 median age 79yrs 70yrs
Wave 2 median age 87yrs 72yrs
Wave 3 median age 90yrs 76yrs
Wave 1 percentage males 39% 51%
Wave 1 No. of current smokers 31 103
Wave 1 No. of ex smokers 213 385
Wave 1 No. of never smokers 201 432
Cold Spring Harbor Laboratory Press on September 26, 2014 - Published by genome.cshlp.orgDownloaded from
17
Table 2. cis-SNP associations with sex- and smoking-associated probes with high Rm and h2
Probe Exposure
CpG
Location
Closest
Gene to CpG Rm h2 cis-SNP SNP Location
mQTL
association
p-value in
BSGS
Proportion of
methylation
variance
explained by SNP
in BSGS data
Proportion of variance
explained in methylation by
exposure
LBC1936 LBC1921
cg21117965 Sex 2:220325369 SPEG 0.79 0.89 rs7202333 2:220315970 2.7x10-71 0.61 0.03 0.05
cg07187855 Sex 6:30854161 DDR1 0.80 0.84 rs3130779 6:30872203 2.6x10⁻³⁴ 0.29 0.04 0.07
cg12803068 Smoking 7:45002919 MYO1G 0.78 0.85 rs6976664 7:45014304 2.76x10⁻¹² 0.10 0.08 0.05
cg18316974 Smoking 1:92947035 GFI1 0.70 0.83 rs2774947 1:93348423 1.92x10⁻¹³ 0.12 0.07 0.06
BSGS – Brisbane systems genomics study; mQTL - methylation quantitative trait loci; cis-SNP – located ≤500kb from CpG site
C
old Spring H
arbor Laboratory Press
on Septem
ber 26, 2014 - Published by
genome.cshlp.org
Dow
nloaded from

18
References The 1000 Genomes Project Consortium. 2010. A map of human genome variation from population-scale sequencing. Nature 467: 1061–73. Abecasis GR, Cardon LR, Cookson WO. 2000. A general test of association for quantitative traits in nuclear families. Am J Hum Genet 66: 279–292. Abecasis GR, Cherny SS, Cookson WO, Cardon LR. 2002. Merlin-rapid analysis of dense genetic maps using sparse gene flow trees. Nat Genet 30: 97–101. Alegría-Torres JA, Baccarelli A, Bollati V. 2011. Epigenetics and lifestyle. Epigenomics 3: 267–277. Aryee MJ, Jaffe AE, Corrada-Bravo H, Ladd-Acosta C, Feinberg AP, Hansen KD, Irizarry RA. 2014. Minfi: a flexible and comprehensive Bioconductor package for the analysis of Infinium DNA methylation microarrays. Bioinformatics 30: 1363-1369. Bates D, Maechler M, Bolker B, Walker S. 2014. lme4: Linear mixed-effects models using Eigen and S4. http://cran.r-project.org/web/packages/lme4/index.html. Barton K. 2014. MiMIn: Multi-model inference. http://cran.r-project.org/web/packages/MuMIn/index.html Bell JT, Tsai P-C, Yang T-P, Pidsley R, Nisbet J, Glass D, Mangino M, Zhai G, Zhang F, Valdes A, et al. 2012. Epigenome-wide scans identify differentially methylated regions for age and age-related phenotypes in a healthy ageing population. PLoS
Genet 8: e1002629. Bellacosa A, Cicchillitti L, Schepis F, Riccio A, Yeung AT, Matsumoto Y, Golemis EA, Genuardi M, Neri G. 1999. MED1, a novel human methyl-CpG-binding endonuclease, interacts with DNA mismatch repair protein MLH1. PNAS 96: 3969–3974. Bjornsson HT, Sigurdsson MI, Fallin MD, Irizarry RA, Aspelund T, Cui H, Yu W, Rongione MA, Ekström TJ, Harris TB, et al. 2008. Intra-individual change over time in DNA methylation with familial clustering. JAMA 299: 2877–2883. Bocklandt S, Lin W, Sehl ME, Sánchez FJ, Sinsheimer JS, Horvath S, Vilain E. 2011. Epigenetic predictor of age. PLoS One 6: e14821. Bröske A-M, Vockentanz L, Kharazi S, Huska MR, Mancini E, Scheller M, Kuhl C, Enns A, Prinz M, Jaenisch R, et al. 2009. DNA methylation protects hematopoietic stem cell multipotency from myeloerythroid restriction. Nat Genet 41: 1207–1215.
Cold Spring Harbor Laboratory Press on September 26, 2014 - Published by genome.cshlp.orgDownloaded from

19
Challen GA, Sun D, Jeong M, Luo M, Jelinek J, Berg JS, Bock C, Vasanthakumar A, Gu H, Xi Y, et al. 2012. Dnmt3a is essential for hematopoietic stem cell differentiation. Nat Genet 44: 23–31. Deary IJ, Gow AJ, Pattie A, Starr JM. 2012. Cohort profile: the Lothian Birth Cohorts of 1921 and 1936. Int J Epidemiol 41: 1576–1584. Deary IJ, Gow AJ, Taylor MD, Corley J, Brett C, Wilson V, Campbell H, Whalley LJ, Visscher PM, Porteous DJ, et al. 2007. The Lothian Birth Cohort 1936 - a study to examine influences on cognitive ageing from age 11 to age 70 and beyond. BMC
Geriatr 7: 28. Deary IJ, Whiteman MC, Starr JM, Whalley LJ, Fox HC. 2004. The impact of childhood intelligence on later life: following up the Scottish mental surveys of 1932 and 1947. J Pers Soc Psychol 86: 130–147. Du P1, Zhang X, Huang CC, Jafari N, Kibbe WA, Hou L, Lin SM. 2010. Comparison of Beta-value and M-value methods for quantifying methylation levels by microarray analysis. BMC Bioinformatics 11:587. Falconer DS & Mackay TFC 1996. Variance. In Introduction to quantitative
genetics, 4th edition. pp 122-144. Benjamin Cummings, San Francisco, California. Florath I, Butterbach K, Müller H, Bewerunge-Hudler M, Brenner H. 2013. Cross-sectional and longitudinal changes in DNA methylation with age - an epigenome-wide analysis revealing over 60 novel age-associated CpG sites. Hum Mol Genet 23: 1186-1201. Fraga MF, Ballestar E, Paz MF, Ropero S, Setien F, Ballestar ML, Heine-Suñer D, Cigudosa JC, Urioste M, Benitez J, et al. 2005. Epigenetic differences arise during the lifetime of monozygotic twins. PNAS 102: 10604–10609. Gibbs JR, van der Brug MP, Hernandez DG, Traynor BJ, Nalls MA, Lai SL, Arepalli S, Dillman A, Rafferty IP, Troncoso J, et al. 2010. Abundant quantitative trait loci exist for DNA methylation and gene expression in human brain. PLoS Genet 6: e1000952. Gordon L, Joo JE, Powell JE, Ollikainen M, Novakovic B, Li X, Andronikos R, Cruickshank MN, Conneely KN, Smith AK, et al. 2012. Neonatal DNA methylation profile in human twins is specified by a complex interplay between intrauterine environmental and genetic factors, subject to tissue-specific influence. Genome
Res 22:1395-1340. Grundberg E, Meduri E, Sandling JK, Hedman AK, Keildson S, Buil A, Busche S, Yuan W, Nisbet J, Sekowska M, et al. 2013. Global analysis of DNA methylation variation in adipose tissue from twins reveals links to disease-associated variants in distal regulatory elements. Am J Hum Genet 93: 876–90.
Cold Spring Harbor Laboratory Press on September 26, 2014 - Published by genome.cshlp.orgDownloaded from
20
Hannum G, Guinney J, Zhao L, Zhang L, Hughes G, Sadda S, Klotzle B, Bibikova M, Fan J-B, Gao Y, et al. 2013. Genome-wide methylation profiles reveal quantitative views of human aging rates. Mol Cell 49: 359–367. Heijmans BT, Kremer D, Tobi EW, Boomsma DI, Slagboom PE. 2007. Heritable rather than age-related environmental and stochastic factors dominate variation in DNA methylation of the human IGF2/H19 locus. Hum Mol Genet 16: 547–354. Horvath S. 2013. DNA methylation age of human tissues and cell types. Genome
Biol 14: R115. Houseman EA, Accomando WP, Koestler DC, Christensen BC, Marsit CJ, Nelson HH, Wiencke JK, Kelsey KT. 2012. DNA methylation arrays as surrogate measures of cell mixture distribution. BMC Bioinformatics 13: 86. Howie B, Fuchsberger C, Stephens M, Marchini J, Abecasis GR. 2012. Fast and accurate genotype imputation in genome-wide association studies through pre-phasing. Nat Genet 44: 955–959. Howie B, Marchini J, Stephens M. 2011. Genotype imputation with thousands of genomes. G3 1: 457–70. Jirtle RL, Skinner MK. 2007. Environmental epigenomics and disease susceptibility. Nat Rev Genet 8: 253–262. Joubert BR, Håberg SE, Nilsen RM, Wang X, Vollset SE, Murphy SK, Huang Z, Hoyo C, Midttun Ø, Cupul-Uicab LA, et al. 2012. 450K epigenome-wide scan identifies differential DNA methylation in newborns related to maternal smoking during pregnancy. Environ Health Perspect 120: 1425–1431. Kerkel K, Spadola A, Yuan E, Kosek J, Jiang L, Hod E, Li K, Murty V V, Schupf N, Vilain E, et al. 2008. Genomic surveys by methylation-sensitive SNP analysis identify sequence-dependent allele-specific DNA methylation. Nat Genet 40: 904–908. Lengauer C, Kinzler KW, Vogelstein B. 1997. DNA methylation and genetic instability in colorectal cancer cells. PNAS 94: 2545–2550. Li E, Beard C, Jaenisch R. 1993. Role for DNA methylation in genomic imprinting. Nature 366: 362–365. Li E, Bestor TH, Jaenisch R. 1992. Targeted mutation of the DNA methyltransferase gene results in embryonic lethality. Cell 69: 915–926. Madrigano J, Baccarelli A, Mittleman MA, Sparrow D, Vokonas PS, Tarantini L, Schwartz J. 2012. Aging and epigenetics: longitudinal changes in gene-specific DNA methylation. Epigenetics 7: 63–70.
Cold Spring Harbor Laboratory Press on September 26, 2014 - Published by genome.cshlp.orgDownloaded from
21
Mathers JC, Strathdee G, Relton CL. 2010. Induction of epigenetic alterations by dietary and other environmental factors. Adv Genet 71: 3–39. McRae AF, Powell JE, Henders AK, Bowdler L, Hemani G, Shah S, Painter JN, Martin NG, Visscher PM, Montgomery GW. 2014. Contribution of genetics variation to transgenerational inheritance of DNA methylation. Genome Biology 15: R73. Medland SE, Nyholt DR, Painter JN, McEvoy BP, McRae AF, Zhu G, Gordon SD, Ferreira MAR, Wright MJ, Henders AK, et al. 2009. Common variants in the trichohyalin gene are associated with straight hair in Europeans. Am J Hum Genet
85: 750–5. Miller SA, Dykes DD, Polesky HF. 1988. A simple salting out procedure for extracting DNA from human nucleated cells. Nucleic Acids Res 16: 1215. Panning B, Jaenisch R. 1998. RNA and the epigenetic regulation of X chromosome inactivation. Cell 93: 305–308. Powell JE, Henders AK, McRae AF, Caracella A, Smith S, Wright MJ, Whitfield JB, Dermitzakis ET, Martin NG, Visscher PM, et al. 2012. The Brisbane Systems Genetics Study - genetical genomics meets complex trait genetics. PLoS One 7: e35430. Price ME, Cotton AM, Lam LL, Farré P, Emberly E, Brown CJ, Robinson WP, Kobor MS. 2013. Additional annotation enhances potential for biologically-relevant analysis of the Illumina Infinium HumanMethylation450 BeadChip array. Epigenetics Chromatin 6: 4. Reinius LE, Acevedo N, Joerink M, Pershagen G, Dahlén S-E, Greco D, Söderhäll C, Scheynius A, Kere J. 2012. Differential DNA methylation in purified human blood cells: implications for cell lineage and studies on disease susceptibility. PLoS One 7: e41361. Scottish Council for Research in Education. 1933. The Intelligence of Scottish Children: a National Survey of an Age-Group. University of London Press, London. Scottish Council for Research in Education 1949. The Trend of Scottish Intelligence. University of London Press, London. Shenker NS, Polidoro S, van Veldhoven K, Sacerdote C, Ricceri F, Birrell MA, Belvisi MG, Brown R, Vineis P, Flanagan JM. 2013. Epigenome-wide association study in the European Prospective Investigation into Cancer and Nutrition (EPIC-Turin) identifies novel genetic loci associated with smoking. Hum Mol Genet 22: 843–851. Slieker RC, Bos SD, Goeman JJ, Bovée JV, Talens RP, van der Breggen R, Suchiman HED, Lameijer E-W, Putter H, van den Akker EB, et al. 2013. Identification and
Cold Spring Harbor Laboratory Press on September 26, 2014 - Published by genome.cshlp.orgDownloaded from
22
systematic annotation of tissue-specific differentially methylated regions using the Illumina 450k array. Epigenetics Chromatin 6: 26. Talens RP, Boomsma DI, Tobi EW, Kremer D, Jukema JW, Willemsen G, Putter H, Slagboom PE, Heijmans BT. 2010. Variation, patterns, and temporal stability of DNA methylation: considerations for epigenetic epidemiology. FASEB J 24: 3135–3144. Tate P, Skarnes W, Bird A. 1996. The methyl-CpG binding protein MeCP2 is essential for embryonic development in the mouse. Nat Genet 12: 205–8. Trowbridge JJ, Snow JW, Kim J, Orkin SH. 2009. DNA methyltransferase 1 is essential for and uniquely regulates hematopoietic stem and progenitor cells. Cell Stem Cell 5: 442–449. Vogel WF, Aszodi A, Alves F, Pawson T. 2001. Discoidin domain receptor 1 tyrosine kinase has an essential role in mammary gland development. Molecular
Cell Biology 21:2906-2917. Williams AL, Patterson N, Glessner J, Hakonarson H, Reich D. 2012. Phasing of many thousands of genotyped samples. Am J Hum Genet 91: 238–251. Wong CCY, Caspi A, Williams B, Craig IW, Houts R, Ambler A, Moffitt TE, Mill J. 2010. A longitudinal study of epigenetic variation in twins. Epigenetics 5: 516–526. Zeilinger S, Kühnel B, Klopp N, Baurecht H, Kleinschmidt A, Gieger C, Weidinger S, Lattka E, Adamski J, Peters A, et al. 2013. Tobacco smoking leads to extensive genome-wide changes in DNA methylation. PLoS One 8: e63812.
Cold Spring Harbor Laboratory Press on September 26, 2014 - Published by genome.cshlp.orgDownloaded from

Cold Spring Harbor Laboratory Press on September 26, 2014 - Published by genome.cshlp.orgDownloaded from
Cold Spring Harbor Laboratory Press on September 26, 2014 - Published by genome.cshlp.orgDownloaded from

Cold Spring Harbor Laboratory Press on September 26, 2014 - Published by genome.cshlp.orgDownloaded from