Embed Size (px)
Citation preview

SEDE AMMINISTRATIVA: UNIVERSITÀ DEGLI STUDI DI PADOVA
DIPARTIMENTO DI SCIENZE ANIMALI
SCUOLA DI DOTTORATO DI RICERCA IN SCIENZE ANIMALI
INDIRIZZO: GENETICA, BIODIVERSITÀ, BIOSTATISTICA E BIOTECNOLOGIE
CICLO XXII
Genetic analysis of milk protein composition
and of its relationship with renneting
properties of individual cow milk
Direttore della Scuola: Ch. mo Prof. Martino Cassandro
Supervisore: Ch. mo Prof. Paolo Carnier
Dottorando: Valentina Bonfatti
1 FEBBRAIO 2010


CONTENTS
Riassunto I
Summary III
.
General introduction 5
Aims 13
Chapter 1. Validation of a new reversed-phase high-performance liquid
chromatography method for separation and quantification of bovine
milk protein genetic variants 15
Chapter 2. Effects of CSN2-CSN3 haplotype and BLG genotype on milk
production traits, contents of protein fractions and detailed protein
composition of individual milk of Simmental cows 31
Chapter 3. Effects of CSN2-CSN3 haplotype, BLG genotype and detailed
protein composition on coagulation properties of individual milk of
Simmental cows 53
Chapter 4. The effect of the relative κ-CN B content in bulk milk on Montasio,
Asiago, and Caciotta cheese yield using milks of similar protein
composition 71
Chapter 5. Estimation of genetic parameters for detailed milk protein
composition and coagulation properties in Simmental breed 95
General discussion and conclusions 121
.
Acknowledgments 125
.


I
SUMMARY
Milk coagulation properties (MCP) are a fundamental aspect in cheese production, but un unfavorable trend over year on MCP have been observed in several countries. The cheese yield has decreased, accentuating the necessity to provide dairies with milk well suited for dairy products manufacture. During the past decades the focus of milk production has been kg’s of milk protein, but total milk protein content is a poor indicator of MCP, and the lack of an appropriate high-throughput analysis for routine determination of milk coagulation is currently limiting the opportunity to improve MCP by direct selection. Milk protein composition has long been a subject of interest for worldwide dairy researchers. As a consequence, information on milk protein genotype could be utilized to improve milk protein composition and MCP trough marker assisted selection without having to phenotype large progeny groups. Considering such options, it would be desirable to gain further knowledge about effects of milk protein genetic variants on milk protein composition and on MCP. Aims of the study were to investigate the effects of CSN2-CSN3 haplotypes (β-κ-casein) and BLG (β-Lactoglobulin, β-LG ) genotypes on milk production traits, contents of protein fractions and detailed protein composition; to investigate the effects of CSN2-CSN3 haplotypes, BLG genotypes, contents of milk protein fractions and protein composition on MCP; to investigate the effect exerted by the relative ratio of κ-CN A to κ-CN B content on MCP and industrial cheese yield of three Italian cheese varieties. The final aim was to estimate genetic parameters of major milk protein fractions and estimate genetic and phenotypic correlation between milk protein fractions and MCP. A new reversed-HPLC method for the separation and quantification of the most common genetic variants of bovine milk proteins was developed and validated testing linearity, repeatability, reproducibility and accuracy. Contents of major protein fractions were measured by this new method in individual milk samples of 2,167 Simmental cows. Protein composition was measured as weight percentage of each casein (CN) fraction to total casein (TCN) and as weight percentage of β-LG to total whey protein (WH ). Genotypes at CSN2, CSN3 and BLG loci were also assessed by HPLC and CSN2-CSN3 haplotype probabilities were estimated for each cow. Rennet coagulation time (RCT) and curd firmness (a30) were measured using a computerized renneting meter. Effects of haplotypes and BLG genotypes on yields were weak or trivial. Haplotypes carrying CSN2 B and CSN3 B exhibited greater TCN and casein number (CI ), in comparison with all other haplotypes. Genotype BB at BLG was associated with increased protein, TCN and CI, when compared to genotype AA. Haplotypes including CSN3 B were associated with greater κ-CN content and percentage. Allele CSN2 B was associated with an increase of β-CN content, which occurred at the expense of content of αS1-CN. Haplotypes including allele CSN2 A1 exhibited decreased β-, αS2- and γ-CN concentrations and increased αS1- and κ-CN contents, whereas CSN2 I exerted positive effects on β-CN concentration, without altering other protein fractions content. Effects exerted by haplotypes on CN composition were similar to those exhibited on CN fractions contents. Allele BLG A increased β-LG concentration and altered the β-LG to α-Lactalbumin (α-LA ) ratio. When protein fractions contents or protein composition were not included in the statistical model, haplotypes carrying CSN3 B allele exhibited shorter RCT and greater a30, in comparison with those carrying CSN3 A, and haplotypes carrying CSN2 B allele were responsible for a noticeable decrease of RCT and for an increase of a30, when compared to haplotype A2A. When effects of protein fractions contents or of protein composition were added to the model, no difference across haplotypes due to CSN3 and CSN2 alleles was observed for MCP, with the exception of the effect of CSN2 B on RCT, which remained markedly favorable. Also, the favorable effect exerted by CSN2 B on a30 was mediated by the increase of β-CN B in milk. Conversely, β-CN B is likely to exert a molecular effect on RCT, which does not depend upon variation of β-CN content associated to allele B. To test if the lack of effect of κ-CN genetic variant would have been observed also on cheese yield, milks with different κ-CN A to κ-CN B content ratios were separately manufactured to produce Montasio, Asiago and Caciotta cheese. Milk was characterized by having similar composition in terms of protein, TCN, CI, CN

II
composition, β-CN composition and pH. Milk with the higher proportion of κ-CN B (HIGHB ) exhibited similar coagulation properties but a higher cheese yield in all the investigated cheese in comparison with milk with a lower proportion of κ-CN B (LOWB ). However, the increment of yield observed for HIGHB milk in Montasio cheese was ascribed to a greater fat content of HIGHB milk in comparison with LOWB milk. The probability of HIGHB milk giving a cheese yield 5 % greater than that of LOWB milk ranged from 51 to 67 % for Montasio cheese, but was lower than 21 % for Asiago and Caciotta cheeses. Thus, the ratio of κ-CN A to κ-CN B content did not relevantly affect industrial cheese yield when milks of similar CN composition were processed, and an indirect effect due to the higher κ-CN content of κ-CN B milk on cheese yield is to be suggested. Values of heritability for αS1-CN%, κ-CN% and β-CN% were similar and ranging from 0.61 to 0.70, whereas heritability of αS2-CN%, γ-CN% and β-LG% were 0.28, 0.29 and 0.33, respectively. When CSN2-CSN3 haplotype and BLG genotype were accounted for by the model, heritability estimates of all the protein fractions became similar suggesting that proteins synthesis is regulated by specific genes which control the overall production of milk protein. Genetic correlations among the contents of the five CN fractions and between CN fractions and WH fractions were generally low. Generally, all the CN fractions were also moderately positively correlated with WH. When data where adjusted for CSN2-CSN3 haplotype and BLG genotype, genetic correlations among the contents of protein fractions markedly increased confirming that all the fractions undergone a common regulation. The content and the relative proportion of κ-CN were not genetically correlated with RCT, αS1- and αS2-CN were unfavourately correlated with RCT, but increasing the content of β-CN in milk would result in a shorter RCT. Stronger curds were associated with higher κ-CN and β-CN, and with lower αS1-, αS2-, and γ-CN contents and proportions. Results confirm the lack of favorable associations between TCN and MCP indicating that other traits, i.e. milk protein fractions, should be used for the genetic improvement of cheese-making properties.

III
RIASSUNTO
Le proprietà di coagulazione del latte (MCP) sono un aspetto fondamentale nella produzione di formaggio, tuttavia, negli ultimi anni, è stato registrato un andamento sfavorevole della coagulazione del latte in diversi Paesi. La resa in formaggio è diminuita, accentuando la necessità di fornire i caseifici con latte più adatto per la trasformazione in formaggio. Nel corso degli ultimi decenni il miglioramento genetico si è focalizzato sui kg di proteina del latte, ma il contenuto totale di proteina non sembra essere un buon indicatore delle MCP, e la mancanza di un metodo di analisi che consenta la determinazione delle MCP su larga scala attualmente limita la possibilità di migliorare le MCP attraverso una selezione diretta. La composizione proteica del latte è stato a lungo oggetto di interesse per i ricercatori di tutto il mondo. Di conseguenza, le informazioni sul genotipo delle proteine del latte potrebbero essere utilizzate per migliorare la composizione della proteina oppure nella selezione assistita da marcatori per migliorare le MCP, senza dover fenotipizzare grandi gruppi di progenie. Alla luce di tali possibilità, sarebbe auspicabile poter acquisire ulteriori conoscenze sugli effetti delle varianti genetiche delle proteine sulla composizione proteica del latte e sulle MCP. Obiettivi di questa tesi sono stati: studiare gli effetti dell’aplotipo CSN2-CSN3 (β-κ-caseina) e del genotipo al locus BLG (β-lattoglobulina, β-LG ) su caratteri produttivi, contenuto di frazioni proteiche e composizione proteica; studiare gli effetti dell’aplotipo CSN2-CSN3 e del genotipo al locus BLG, del contenuto di frazioni proteiche e della composizione proteica sulle MCP, studiare l'effetto esercitato dal rapporto relativo tra κ-CN A e B sulle MCP e sulla resa industriale in tre varietà di formaggi italiani. Inoltre, ultimo obiettivo del lavoro è stato la stima dei parametri genetici delle principali frazioni proteiche del latte e delle correlazioni genetiche e fenotipiche tra le frazioni proteiche e le MCP. Un nuovo metodo di analisi HPLC a fase inversa per la separazione e la quantificazione delle più comuni varianti genetiche delle proteine del latte bovino è stato sviluppato e validato attraverso test di linearità, ripetibilità, riproducibilità e accuratezza. Il contenuto delle principali frazioni proteiche è stato misurato con questo nuovo metodo in campioni di latte individuale di 2,167 bovine di razza Simmental. La composizione proteica è stata espressa come percentuale in peso di ogni frazione caseinica rispetto al contenuto totale di caseina (TCN) e come percentuale del peso della β-LG sul totale di proteine del siero (WH ). Il genotipo ai loci CSN2, CSN3 e BLG è stato determinato tramite HPLC e le probabilità aplotipiche per gli aplotipi CSN2-CSN3 sono state stimate per ogni animale. Tempo di coagulazione (RCT) e consistenza del coagulo (a30) sono stati misurati utilizzando un lattodinamografo. Gli effetti dell’aplotipo delle caseine e del genotipo al locus BLG sui caratteri produttivi sono stati limitati o trascurabili. Gli aplotipi contenenti gli alleli CSN2 B e CSN3 B hanno mostrato valori più elevati di TCN e un indice caseinico (CI ) superiore, rispetto a tutti gli altri aplotipi. Il genotipo BB al locus BLG è stato associato ad un aumento del contenuto proteico e ad un CI superiore rispetto al genotipo AA. Gli aplotipi contenenti l’allele CSN3 B sono stati associati a contenuti e percentuali di κ-CN maggiori. L’allele CSN2 B è risultato associato con un aumento del contenuto di β-CN, che si è verificato a scapito del contenuto di αS1-CN. Gli aplotipi che includevano la variante CSN2 A1 hanno mostrato una diminuzione del contenuto di β-, αS2- e γ-CN e un aumento del contenuto di αS1- e κ-CN, mentre la variante CSN2 I ha esercitato effetti positivi sulla concentrazione di β-CN, senza alterare il contenuto delle altre frazioni proteiche. L’allele A al locus BLG è stato associato ad una maggiore concentrazione di β-LG e ad un più elevato rapporto tra β-LG e α-lattoalbumina (α-LA). Quando il contenuto delle frazioni proteiche o la composizione della proteina non erano inclusi nel modello statistico, gli aplotipi contenenti l’allele CSN3 B erano associati ad RCT più brevi ed a30 maggiori, rispetto a quelli che includevano l’allele CSN3 A, e gli aplotipi contenenti la variante CSN2 B erano responsabili di una notevole diminuzione dei valori di RCT e per valori di a30 maggiori, rispetto agli aplotipi contenente la variante A2. Quando gli effetti del contenuto delle frazioni proteiche o della composizione proteica sono stati inclusi nel modello statistico, nessuna differenza tra aplotipi riconducibile agli alleli ai loci CSN3 e CSN2 è stata osservata per le MCP, con l'eccezione dell’effetto della CSN2 B su RCT, che è rimasto molto favorevole. L'effetto favorevole esercitato dall’allele CSN2 B su a30 è risultato mediato dall’aumento di β-CN

IV
B nel latte. Al contrario, la β-CN B esercita probabilmente un effetto diretto su RCT, che non dipende dalla variazione del contenuto di β-CN associato all’allele B. Per verificare se la mancanza di effetto diretto delle varianti genetiche di κ-CN sarebbe stato osservato anche sulla resa in formaggio, latte con differenti rapporti tra κ-CN A e B sono stati lavorati separatamente per la produzione di Montasio, Asiago e Caciotta. Il latte lavorato aveva composizione simile in termini di proteina, TCN, CI, composizione caseinica, composizione della β-CN e pH simile. Il latte con la percentuale maggiore di κ-CN B (HIGHB ) ha presentato valori di MCP simili, ma una resa superiore in tutti i tipi di formaggio esaminati, rispetto al latte con una percentuale inferiore di κ-CN B (LOWB ). Tuttavia, l'incremento di resa osservato per il formaggio Montasio è stato attribuito a un maggior contenuto di grasso del latte HIGHB in confronto con il latte LOWB. La probabilità del latte HIGHB di dare un formaggio con una resa del 5% superiore a quella del latte LOWB variava dal 51 al 67% per il Montasio, ma è stata inferiore al 21% per Asiago e Caciotta. Il rapporto tra le varianti A e B di κ-CN non ha quindi influito in modo rilevante sulla resa casearia industriale, quando la composizione del latte era bilanciata per la composizione caseinica, ed è possibile supporre pertanto che vi sia un effetto indiretto delle varianti di κ-CN sulla resa casearia, a causa del più elevato contenuto di κ-CN associato alla variante B. I valori di ereditabilità per αS1-CN%, κ-CN% e β-CN% erano simili e variabili da 0.61 al 0.70, mentre l’ereditabilità di αS2-CN%, γ-CN% e β-LG% erano 0.28, 0.29 e 0.33, rispettivamente. Quando l’effetto dell’aplotipo CSN2-CSN3 e del genotipo al locus BLG sono stati inclusi nel modello, le stime di ereditabilità di tutte le frazioni proteiche sono divenute simili suggerendo che la sintesi di proteine del latte sia sottoposta a un controllo genetico da parte di geni specifici che controllano il livello generale di proteina del latte. Le correlazioni genetiche tra il contenuto delle 5 frazioni caseiniche e tra le frazioni caseiniche e le frazioni sieriche erano generalmente basse. In generale, tutte le frazioni caseiniche erano anche moderatamente positivamente correlata con WH, suggerendo che vi sia una regolazione generale del livello di proteina del latte che coinvolge contemporaneamente TCN e WH. Quando l’effetto dell’aplotipo CSN2-CSN3 e del genotipo al locus BLG sono stati inclusi nel modello, le correlazioni genetiche tra i contenuti delle frazioni proteiche sono aumentate significativamente, supportando l’ipotesi che tutte le frazioni siano oggetto di una regolazione generale. Il contenuto di κ-CN del latte non è risultato essere geneticamente correlato con RCT, αS1- e αS2-CN hanno mostrato una correlazione sfavorevole con RCT, mentre un aumento della β-CN nel latte sarebbe a favore di RCT più brevi. Coaguli più consistenti sono stati associati ad un maggior contenuto di κ-CN e β-CN e ad un minor contenuto di αS1-, αS2-, e γ-CN. I risultati ottenuti confermano la mancanza di un’associazione favorevole tra TCN e MCP, sottolineando l’esigenza di utilizzare altri caratteri, come il contenuto delle frazioni proteiche, per il miglioramento genetico delle proprietà casearie del latte.

5
GENERAL INTRODUCTION
Trends in Milk and Cheese Production
According to the Food and Agricultural Policy Research Institute (FAPRI, 2008), world cheese
production is expected to grow 22.3 % over ten years, with the US and the EU accounting for over
64 %. The expected trends in milk and cheese production in Europe from 2010 to 2017 will be
stationary for milk but +10.8 % for cheese production. Within the same period, the consumption of
milk is expected to decrease (-0.3 %) whereas the consumption of cheese is expected to have a
marked increase (+12 %).
Besides France, Italy is the country with the largest number of locally-made cheeses, nowadays
approximately counting 400 products. Dairy sector accounts for 13 % of the food industry incomes
and exerts a key role for the Italian food industry on an international level, involving more than
2,000 dairy implants and transformation facilities. Italy accounts 9 % of the European milk
production (11 million tons, 94 % cow milk), but 15 % of the cheese production (Pieri e Del Bravo,
2005). More than 70 % of the overall milk production (ISTAT, 2006) is used in the manufacture of
cheese and 55 % of total milk is processed for the 31 PDO (Protected Designation of Origin)
cheeses (Cassandro, 2003).
Improvement of Milk Coagulation Properties
Milk coagulation properties (MCP) are a fundamental aspect in cheese production, especially in
those countries where dairy industry is based on traditional products (Cassandro et al., 2008).
A general worsening of MCP has been observed in several countries. Unfavorable trends over years
on MCP, at the phenotypic level, have been evidenced by some authors (Mariani et al., 1992;
Cassandro and Marusi, 1999; Sandri et al., 2001) on milk yielded in dairy herds located in
traditional areas for cheese production in Italy. A comparison of the Swedish dairy milk produced
within the period from 1970 to 1996 (Lindmark-Månsson et al., 2003) showed that although there
was no difference in total protein concentration, the proportion of casein in total protein was
significantly decreased over that period. Although there are no published data on variation of MCP
over the past decades in Finland, according to observations made in Finnish dairies, the average
coagulation ability of milk has been deteriorating during the past 20 to 30 years, and the ratio of
cows producing non-coagulating (NC) milk has increased (Ikonen et al., 1999). Stagnating cheese
yields despite increased total protein concentration of milk has been reported in France also
(Coulon et al., 2001). Consequently, the cheese yield has decreased, accentuating the necessity to
provide dairies with milk well suited for dairy products manufacture.
6
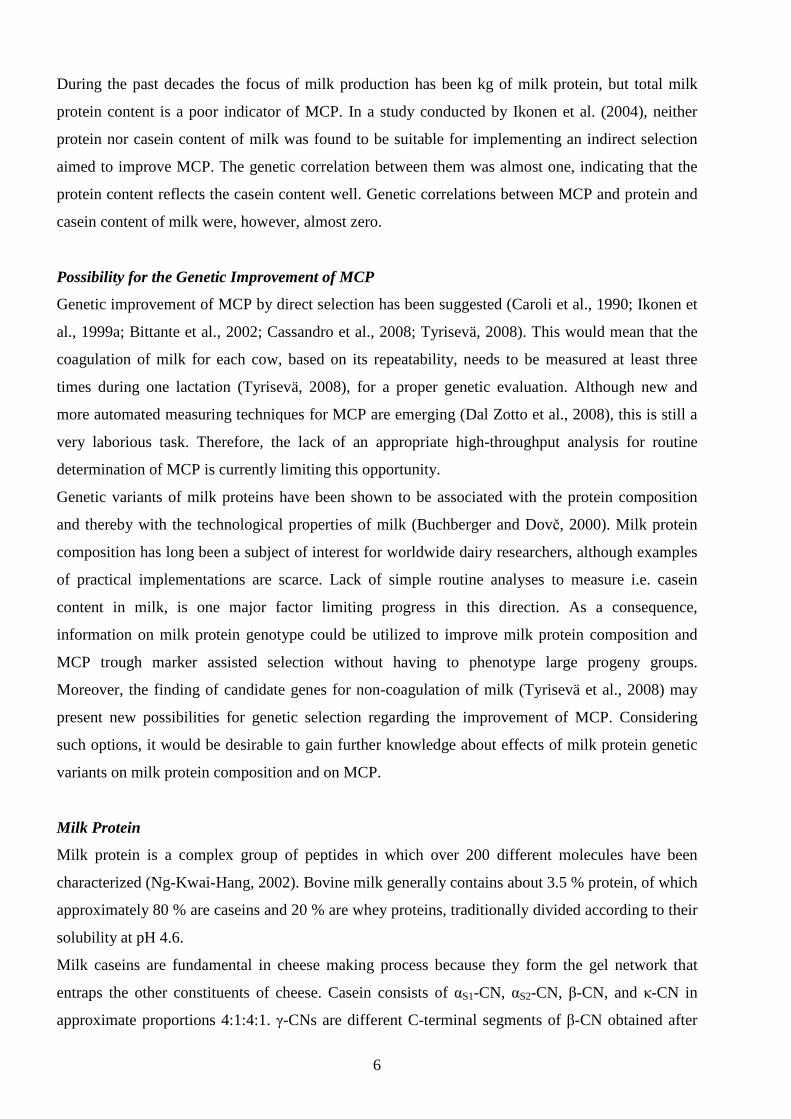
During the past decades the focus of milk production has been kg of milk protein, but total milk
protein content is a poor indicator of MCP. In a study conducted by Ikonen et al. (2004), neither
protein nor casein content of milk was found to be suitable for implementing an indirect selection
aimed to improve MCP. The genetic correlation between them was almost one, indicating that the
protein content reflects the casein content well. Genetic correlations between MCP and protein and
casein content of milk were, however, almost zero.
Possibility for the Genetic Improvement of MCP
Genetic improvement of MCP by direct selection has been suggested (Caroli et al., 1990; Ikonen et
al., 1999a; Bittante et al., 2002; Cassandro et al., 2008; Tyrisevä, 2008). This would mean that the
coagulation of milk for each cow, based on its repeatability, needs to be measured at least three
times during one lactation (Tyrisevä, 2008), for a proper genetic evaluation. Although new and
more automated measuring techniques for MCP are emerging (Dal Zotto et al., 2008), this is still a
very laborious task. Therefore, the lack of an appropriate high-throughput analysis for routine
determination of MCP is currently limiting this opportunity.
Genetic variants of milk proteins have been shown to be associated with the protein composition
and thereby with the technological properties of milk (Buchberger and Dovč, 2000). Milk protein
composition has long been a subject of interest for worldwide dairy researchers, although examples
of practical implementations are scarce. Lack of simple routine analyses to measure i.e. casein
content in milk, is one major factor limiting progress in this direction. As a consequence,
information on milk protein genotype could be utilized to improve milk protein composition and
MCP trough marker assisted selection without having to phenotype large progeny groups.
Moreover, the finding of candidate genes for non-coagulation of milk (Tyrisevä et al., 2008) may
present new possibilities for genetic selection regarding the improvement of MCP. Considering
such options, it would be desirable to gain further knowledge about effects of milk protein genetic
variants on milk protein composition and on MCP.
Milk Protein
Milk protein is a complex group of peptides in which over 200 different molecules have been
characterized (Ng-Kwai-Hang, 2002). Bovine milk generally contains about 3.5 % protein, of which
approximately 80 % are caseins and 20 % are whey proteins, traditionally divided according to their
solubility at pH 4.6.
Milk caseins are fundamental in cheese making process because they form the gel network that
entraps the other constituents of cheese. Casein consists of αS1-CN, αS2-CN, β-CN, and κ-CN in
approximate proportions 4:1:4:1. γ-CNs are different C-terminal segments of β-CN obtained after

7
proteolytic cleavage by the enzyme plasmin. Moreover, post-translational modifications such as
phosphorylation, glycosylation, disulphide bonding, proteolysis, and the existence of genetic
variants, cause further diversity within the casein group (Ng-Kwai-Hang, 2002).
Polar and apolar regions on the casein peptide chains are not uniformly distributed, giving them an
amphiphilic structure. This, in addition to their proline and phosphate content, constitutes the basis
for the ability of caseins to form micelles. The concentrations of calcium generally found in milk
would cause precipitation of αS1-CN, αS2-CN, and β-CN, which are calcium-sensitive proteins, by
calcium binding to their phosphoserine residues. The κ-CN, however, is soluble in calcium and
stabilizes the other caseins in a colloidal state (Farrell et al., 2006). The κ-CN is found in several
glycosylated forms where the C-terminal part (the caseinomacropeptide) contains varying numbers
of O-glucosidic linked residues (Farrell et al., 2004).
In milk about 95 % of the caseins are aggregated in colloidal structures (Farrell et al., 2006) and
several theories of the casein micelle structure have been proposed. Although there is no
unanimously accepted model, there are some general properties that are commonly recognized.
These include the notion of partly hydrophobic caseins being stabilized by κ-CN predominantly
located near the micelle surface. The hydrophilic and negatively charged C-terminal end of κ-CN
protrudes from the micelle, which is open and porous, to form a hairy layer that, by steric and
electrostatic repulsion, prevents any further submicelle aggregation and also micelle flocculation
(Walstra, 1999). Micelle stability is suggested to be maintained by excess of hydrophobic attraction
over electrostatic repulsion (Farrell et al., 2006). Containing only one phosphoserine residue,
micelle growth is limited by κ-CN acting as a dead-end capping unit, which becomes part of the
micelle surface structure (Horne, 1998). The stabilizing function of κ-CN and its role in micelle
growth makes it a key protein in determining micelle size (Dalgleish et al., 1989; Donnelly et al.,
1984; Risso et al., 2007) and also some functional properties.
The three main whey proteins are β-LG, α-LA and blood serum albumin (BSA), representing
approximately 50, 20 and 10 % of total whey proteins, respectively. The remaining part comprises
immunoglobulins (Ig) and trace amounts of several other proteins, including enzymes and growth
factors.
Most whey proteins are globular with organized secondary and tertiary structure, which, in contrast
to the caseins, make them sensitive to heat denaturation at temperatures above 60 °C. A reactive
thiol group is exposed at heat denaturation of β-LG, which forms disulphide-thiol interchanges with
other β-LG molecules as well as with κ-CN (Creamer et al., 2004). α-LA is important in the
biosynthesis of lactose being a sub-component in the lactose synthetase complex (Ng-Kwai-Hang,
2002). Whereas α-LA and β-LG are synthesized in the mammary gland, BSA and Ig are
components of blood serum.

8
Genetic Polymorphism of Milk Proteins
Polymorphisms have been observed for all milk proteins (Farrell et al., 2004). However, αS2-CN
and α-LA have been shown to be essentially monomorphic in all Western dairy breeds and variation
at the αS1-CN locus is rather limited (Farrell et al., 2004).
Single nucleotide substitutions in coding sequences of a gene may give rise to amino acid shifts
affecting the physico-chemical properties of the protein polymorphism. But amino acidic
substitutions can occur also in promoter regions, leading to variations of protein expression.
Milk protein polymorphisms play an important role in the technological quality of milk
(Buchberger and Dovč, 2000) as a result of both the qualitative and quantitative protein variations.
The former depend on molecular composition of the polypeptide, resulting in different chemical and
physical behavior of a variant when compared to another and are the consequence of the specific
amino acid variation. The latter are relate to the different capacities of expression of alleles that
control the synthesis of that specific protein (Ikonen et al., 1997; Mayer et al., 1997).
Qualitative variations. The most common qualitative variations affect the net charge of the protein.
For example, variant B of αS1-CN carries one more negative charge than variant C via the
substitution of Gly for Glu, the presence of Asp in β-LG A increase the negative charged of this
variant in comparison with that of β-LG B, whereas the B variant of β-CN has one and two more
net positive charges than A1 and A2 variants, respectively. It has been suggested that the repulsive
forces between casein micelles containing variants such as αS1-CN C, β-CN B and κ-CN B, in
which amino acid substitution results in lower net negative charge, are decreased compared to
micelles containing more negatively charged protein variants (McLean, 1986). This would thus
facilitate aggregation.
In addition, κ-CN and β-CN B variants have been associated with lower electronegativity and
alkaline pH, with positive effects on the stability of micelles and on their reactivity to rennet, which
results in shorter clotting times and more compact curds (Mariani and Summer, 1999).
However, there are also mutations affecting not only the net charge of the protein. For example, the
rare αS1-CN variant A is characterized, when compared to variants B and C, by the lack of an
hydrophobic region (resulting by a deletion of 13 amino acids residues), which makes it less
sensitive to proteolytic degradation of chymosin and pepsin, originating a soft, friable and
unsuitable clot for the production of cheese (Cocker et al., 1997).
Milk containing different genetic variants has also been shown to yield gels with an altered
structure, due to different bonding and cross-linking patterns (Nuyts-Petit et al., 1997; Walsh et al.,
1998).
Quantitative variations. Apart from effects of polymorphism in the coding part of the gene on the
resulting protein structure, polymorphism in the non-coding regions of milk protein genes is

9
believed to affect protein transcription (Lum et al., 1997; Robitaille et al., 2000, 2002). It has been
suggested (Martin et al., 2002) that, if polymorphisms in the promoter region of a gene are linked to
polymorphisms located in the coding region, a specific protein might be characterized by an allele-
specific expression.
In general, the B allele of κ-CN has been associated with a higher κ-CN concentration in milk
compared to A (Lodes et al., 1997; Ikonen et al., 1997; Bobe et al., 1999; Graml and Pirchner,
2003), and also with higher total protein and casein number, which results in different MCP
depending on κ-CN genotype. The influence of CSN3 genotypes on the amount of total κ-CN in
milk has important consequences on the size of the micelles also. The more uniform micelle
systems are characterized by increased quantities of small micelles, which form a protein network
more dense and compact. In contrast, the CSN3 E allele has been associated with a lower κ-CN
content compared to B, possibly also to A (Oloffs et al., 1992; Ikonen et al., 1997).
In several studies, κ-CN B allele has been associated with the most favorable MCP (Schaar, 1984;
van den Berg et al., 1992; Ikonen et al., 1997), whereas κ-CN A has been associated with longer
coagulation times and softer curds. Poorest MCP has been ascribed to the κ-CN E allele (Oloffs et
al., 1992; Ikonen et al., 1999a). These effects of the different variants with MCP of milk are also
found regarding cheese yield (Schaar et al., 1985; van den Berg et al., 1992; Walsh et al., 1995;
Walsh et al., 1998).
Cows carrying the β-CN B allele have been reported to produce milk with increased total protein
and β-CN concentrations (McLean et al., 1984; Ng-Kwai-Hang et al., 1986) and it has been shown
that the amount of protein and casein decrease in the order A1A1 > A1A2 > A2A2 (Ng-Kwai-Hang et
al., 1986; Jakob & Puhan, 1994). The B allele of β-CN has been linked to an improved coagulation
compared to the A variants. Higher protein recovery in cheese has been reported for β-CN A1A1
compared to A1A2 (Marziali & Ng-Kwai-Hang, 1986), and for β-CN A2B compared to β-casein
A2A2 (Mayer et al., 1997). Finally, the B variant of β-LG has been shown to be expressed at a
markedly lower level in milk compared to the A variant, with a concomitant increase in casein
number (Lodes et al., 1997; Lundén et al., 1997).
REFERENCES
Bittante, G., M. Marusi, F. Cesarini, M. Povinelli, and M. Cassandro. 2002. Genetic analysis on milk rennet-coagulation ability in Italian Holstein cows. Proceedings of the 7th World Congress on Genetics Applied to Livestock Production, Montpellier, France, August, 2002. Session 9, pp. 0–4.
Bobe, G., D. C. Beitz, A. E. Freeman, and G. L. Lindberg. 1999. Effect of milk protein genotypes on milk protein composition and its genetic parameter estimates. J. Dairy Sci. 82:2797–2804.
Buchberger, J., and P. Dovč. 2000. Lactoprotein genetic variants in cattle and cheese making ability. Food Technol. Biotechnol. 38(Suppl. 2):91–98.
Caroli, A., P. Bolla, G. Pagnacco, M. Rampilli, L. Degano. 1990. Repeatability of milk clotting aptitude evaluated by

10
lactodynamographic analysis. J. Dairy Res. 57(1):141–142. Cassandro, M. 2003. Status of milk production and market in Italy. Agriculturae Conspectus Scientificus. Vol. 68(2),
pp. 65–69, ISSN:1331–7768. Cassandro, M., A. Comin, M. Ojala, R. Dal Zotto, M. De Marchi, L. Gallo, P. Carnier, and G. Bittante. 2008. Genetic
parameters of milk coagulation properties and their relationships with milk yield and quality traits in Italian Holstein cows. J. Dairy Sci. 91:371–376.
Cassandro, M., and M. Marusi. 2001. La caseificabilità del latte di razza Frisona Italiana. Bianco Nero 9:43–47. Coulon, J. B., D. Dupont, S. Pochet, P. Pradel, and H. Duployer. 2001. Effect of genetic potential and level of feeding
on milk protein composition. J. Dairy Res. 68(4):569–577. Dal Zotto, R., M. De Marchi, A. Cecchinato, M. Penasa, M. Cassandro, P. Carnier, L. Gallo and G. Bittante. 2008.
Reproducibility and repeatability of measures of milk coagulation properties and predictive ability of Mid-Infrared Reflectance Spectroscopy. J. Dairy Sci. 91:4103–4112.
Dalgleish, D. G., D. S. Horne, and A. J. R. Law. 1989. Size-related differences in bovine casein micelles. Biochim. Biophys. Acta 991(Suppl. 3):383–387.
Donnelly, W. J., G. P. McNeill, , W. Buchheim, and T. C. A. McGann. 1984. A comprehensive study of the relationship between size and protein-composition in natural bovine casein micelles. Biochim. Biophys. Acta 789(Suppl. 2):136–143.
Farrell, H. M., E. L. Malin, E. M. Brown, and P. X. Qi. 2006. Casein micelle structure: What can be learned from milk synthesis and structural biology? Current Opinion in Colloid & Interface Science 11(2-3):135–147.
Farrell, H. M., R. Jimenez-Flores, G. T. Bleck, E. M. Brown, J. E. Butler, L. K. Creamer, C. L. Hicks, C. M. Hollar, K. F. Ng-Kwai-Hang, and H. E. Swaisgood. 2004. Nomenclature of the Proteins of Cows' Milk--Sixth Revision. J. Dairy Sci. 87(6):1641–1674.
Graml, R., and F. Pirchner. 2003. Effects of milk protein loci on content of their proteins. Arch. Tierz. Dummerstorf 46:331–340.
Horne, D. S. 1998. Casein interactions: casting light on the black boxes, the structure in dairy products. Int. Dairy J. 8(Suppl. 3): 171–177.
Ikonen, T., K. Ahlfors, R. Kempe, M. Ojala, and O. Ruottinen. 1999a. Genetic parameters for the milk coagulation properties and prevalence of noncoagulating milk in Finnish dairy cows. J. Dairy Sci. 82:205–214.
Ikonen, T., M. Ojala, and E. L. Syväoja. 1997. Effects of composite casein and β-lactoglobulin genotypes on renneting properties and composition of bovine milk by assuming an animal model. Agricultural and Food Science in Finland 6, 283–294.
Ikonen, T., M. Ojala, and O. Ruottinen. 1999b. Associations between milk protein polymorphism and first lactation milk production traits in Finnish Ayrshire cows. J. Dairy Sci. 82:1026–1033.
Ikonen, T., S. Morri, A. M. Tyrisevä, O. Ruottinen, and M. Ojala. 2004. Genetic and phenotypic correlations between milk coagulation properties, milk production traits, somatic cell count, casein content, and pH of milk. J. Dairy Sci. 87(2):458–467.
ISTAT - istituto nazionale di statistica. 2006. Rilevazione annuale sul latte e sui prodotti lattiero-caseari nell’anno 2004. http://www.istat.it/salastampa/comunicati/20060112_00/testointegrale.pdf.
Jakob, E., and Z. Puhan. 1994. Genetic polymorphism of milk proteins. Mljekarstvo 44(3):197–217. Lindmark-Månsson, H., R. Fondén, H. E. Pettersson. 2003. Composition of Swedish dairy milk. Int. Dairy J.
13(6):409–425. Lodes, A., J. Buchberger, I. Krause, J. Aumann, and H. Klostermeyer. 1997. The influence of genetic variants of milk
proteins on the compositional and technological properties of milk. 3. Content of protein, casein, whey protein, and casein number. Milchwissenschaft 52(1):3–8.
Lum, L. S., P. Dovc, and J. F. Medrano. 1997. Polymorphisms of bovine beta-lactoglobulin promoter and differences in the binding affinity of activator protein-2 transcription factor. J. Dairy Sci. 80:1389–1397.
Lunden, A., M. Nilsson, and L. Janson. 1997. Marked effect of betalactoglobulin polymorphism on the ratio of casein to total protein in milk. J. Dairy Sci. 80:2996–3005.
Mariani, P., P. Monatti, and S. Sandri. 1992. Contenuto di urea, pH, acidità titolabile e caratteristiche di coagulazione del latte di singoli allevamenti. Ind. Latte 28(3-4):3–17.
Martin, P., M. Szymanowska, L. Zwierzchowski, and C. Leroux. 2002. The impact of genetic polymorphisms on the protein composition of ruminant milks. Reprod. Nutr. Dev. 42:433–459.
Mayer, H. K., M. Ortner, E. Tschager, and W. Ginzinger. 1997. Composite milk protein phenotypes in relation to composition and cheesemaking properties of milk. Int. Dairy J. 7:305–310.
McLean, D. M. 1986. Influence of milk protein genetic variants on milk composition, yield and cheese making
11
properties. Anim. Genet. 18(suppl 1):100–102. McLean, D.M., E. R. B. Graham, R. W. Ponzoni, and H. A. McKenzie. 1984. Effects of milk protein genetic variants on
milk yield and composition. J. Dairy Res. 51(4):531–546. Ng-Kwai-Hang, K. F. 2002. Heterogeneity, fractionation and isolation. In: Roginski, H., et al. (Eds.) Encyclopaedia of
Dairy Sciences. London: Academic Press.3). p. 1881–1894. Ng-Kwai-Hang, K. F., J. F. Hayes, J. E. Moxley, and H. G. Monardes. 1986. Relationships between milk protein
polymorphisms and major milk constituents in Holstein-Friesian cows. J. Dairy Sci. 69(1):22–26. Nuyts-Petit, V., A. Delacroix-Buchet, and L. Vassal. 1997. Influence de trois hapolotypes de caséines αS1, β et κ
fréquents en race bovine Normande sur la composition du lait et l'aptitude à la fabrication fromagère. Lait 77(5):625–639.
Oloffs, K., H. Schulte-Coerne, K. Pabst, H. O. Gravert. 1992. The relevance of protein variants to genetic differences in cheese making properties in milk. Züchtungskunde 64(1):20–26.
Pieri, R., and F. Del Bravo. 2005. Il mercato del latte - Rapporto 2005. Osservatorio sul mercato dei prodotti lattiero-caseari, ISMEA.
Risso, P. H., V. M. Relling, M. S. Armesto, M. S. Pires, and C. A. Gatti. 2007. Effect of size, proteic composition, and heat treatment on the colloidal stability of proteolyzed bovine casein micelles. Colloid and Polymer Science 285(7):809–817.
Robitaille, G., M. Britten, J. Morisset, and D. Petitclerc. 2002. Quantitative analysis of beta-lactoglobulin A and B genetic variants in milk of cows beta-lactoglobulin AB throughout lactation. J. Dairy Res. 69:651–654.
Robitaille, G. and D. Petitclerc. 2000. Expression polymorphism of κ-casein gene in Holstein cows. J. Dairy Res. 67:107–111.
Sandri, S., F. Tosi, P. Mariani, P. Vecchia, M. Malacarne, A. Summer. 2001. Observations on the trend of the main dairy-characteristics of Parmigiano-Reggiano cheese milk during the years 1990-2001. Annali della Facolta di Medicina Veterinaria, Universita degli Studi di Parma, vol. XXI, 235–247.
Schaar, J. 1984. Effects of κ-casein genetic variants and lactation number on the renneting properties of individual milks. J. Dairy Res. 51:397–406.
Schaar, J., B. Hansson, and H. E. Pettersson. 1985. Effects of genetic variants of κ-casein and β-lactoglobulin on cheesemaking. J. Dairy Res. 52:429–437.
Tyrisevä, A. M. 2008a. Options for selecting dairy cattle for milk coagulation ability. PhD Diss. University of Helsinki. Helsinki.
Tyrisevä A. M., K. Elo, A. Kuusipuro, V. Vilva, I. Jänönen, H. Karjalainen, T. Ikonen, and M. Ojala 2008b. Chromosomal regions underlying noncoagulation of milk in Finnish Ayrshire cows. Genetics 180(2), 1211–1220.
van den Berg, G., J. T. M. Escher, P. J. de Koning, and H. Bovenhuis. 1992. Genetic polymorphism of κ-casein and β-lactoglobulin in relation to milk composition and processing properties. Neth. Milk Dairy J. 46:145–168.
Walsh, C. D., T. Guinee, D. Harrington, R. Mehra, J. Murphy, J. F. Connolly, and R. J. Fitzgerald. 1995. Cheddar cheesemaking and rennet coagulation characteristics of bovine milks containing κ-casein AA or BB genetic variants. Milchwissenshaft 50:492–496.
Walsh, C. D., T. P. Guinee, W. D. Reville, D. Harrington, J. J. Murphy, B. T. O’Kennedy, and R. J. FitzGerald. 1998. Influence of κ-casein genetic variant on rennet gel microstructure, cheddar cheesemaking properties and casein micelle size. Int. Dairy J. 8:707–714.
Walstra, P. 1999. Casein sub-micelles: do they exist? Int. Dairy J. 9(3-9):189–192. Wedholm, A., L. B. Larsen, H. Lindmark-Månsson, A. H. Karlsson, and A. Andrén. 2006. Effect of protein
composition on the cheesemaking properties of milk from individual dairy cows. J. Dairy Sci. 89:3296–3305.


13
AIMS
The general aim of this thesis was to gain further knowledge about the association of milk protein
polymorphisms with detailed milk protein composition, and about the effect exerted by genetic
variants at milk protein loci and protein composition on milk coagulation and cheese yield. The
main aim was to clarify if effects exerted by milk protein polymorphisms on renneting ability of
milk and cheese yield are due to specific biochemical properties of protein genetic variants or to
variations of the relative ratios between protein fractions associated with the presence of specific
polymorphisms.
Specific aims were to:
• Develop a method for the quantification of the major milk protein fractions and for the
determination of their most common genetic variants (Chapter 1);
• Study the effect of casein haplotypes and β-LG genotype on detailed protein composition of
individual milk of Simmental cows (Chapter 2);
• Study the effects of casein haplotypes and β-LG genotype together with the detailed protein
composition of milk on milk coagulation properties of individual milk of Simmental cows
(Chapter 3);
• Assess the effect of different ratios between κ-CN A and B protein genetic variants in bulk
milk on the cheese yield obtained in industrial scale cheese-making experiments (Chapter 4);
• Estimate genetic parameters for milk protein fractions contents, protein composition and milk
coagulation properties (Chapter 5).


15
Chapter 1.
Validation of a new reversed-phase high-performance liquid
chromatography method for separation and quantification of
bovine milk protein genetic variants
V. Bonfatti, L. Grigoletto, A. Cecchinato, L. Gallo, and P. Carnier
Department of Animal Science, University of Padova, Viale dell’Università 16, 35020 Legnaro,
Padova, Italy
Published in Journal of Chromatography A, 1195 (2008) 101–106


17
Validation of a new reversed-phase high-performance liquid chromatography method for
separation and quantification of bovine milk protein genetic variants
V. Bonfatti, L. Grigoletto, A. Cecchinato, L. Gallo, and P. Carnier
Department of Animal Science, University of Padova, Viale dell’Università 16, 35020 Legnaro,
Padova, Italy
ABSTRACT
A new RP-HPLC method for the separation and quantification of the most common genetic variants
of bovine milk proteins is described. A reversed-phase analytical column C8 (Zorbax 300SB-C8
RP, 3.5 µm, 300 Å, 150×4.6 I.D.) was used. All the most common casein and whey protein genetic
variants, including β-CNI, were detected and separated simultaneously in less than 40 min, with the
exception of αS1-CN B and C variants. Purified protein genetic variants were employed in
calibration and showed different absorbances at 214 nm. The procedure was developed using 40
raw individual milk samples of cows belonging to four different breeds and certified skim milk
powder BCR-063R. Method validation consisted in testing linearity, repeatability, reproducibility
and accuracy. A linear relationship (R2>0.99) between the concentration of proteins and peaks area
was observed over the concentration range, with low detection limits. Repeatability and
reproducibility were satisfactory for both retention times and peak areas. The RSD of peak areas
ranged from 0.92 to 4.32% within analytical day and from 0.85 to 9.52% across analytical days.
The recoveries, calculated using mixtures of samples previously quantified, ranged from 98.1 to
103.7%.
INTRODUCTION
Bovine milk protein has been widely studied because of its relationships with composition,
nutritional and technological properties of milk. Lactoproteins include caseins (CNs) and whey
proteins which differ in their solubility behavior at pH 4.6. Caseins account for nearly 80% of total
milk protein and include αS1-, αS2-, β- and κ-CN fractions, in the relative proportion of 4:1:4:1.
Whey proteins include α-lactalbumin (α-La) and β-lactoglobulin (β-Lg), in the approximate
proportion of 1:3, together with bovine serum albumin (BSA) and immunoglobulins (Igs) as minor

18
constituents (Farrell et al., 2004). For CN, β-Lg and α-La, more than 60 genetic variants have been
identified, albeit in western bovine breeds few polymorphisms occur exclusively or are strongly
predominant (Farrell et al., 2004). As genetic variants of CNs and whey proteins influence many
properties of milk that are crucial in the cheese-making process, the development of analytical
methods for the separation and quantification of variants of milk proteins within single protein
fractions is of interest. As an example, the κ-CNBB genotype seems to be associated with an
increased protein and CN content, reduced rennet coagulation time, enhanced cheese curd firmness
and overall cheese yield (Marziali and Ng-Kwai-Hang, 1986a,b; Buchberger and Dovč, 2000).
Also, milk protein polymorphisms have been reported to be associated to variation in protein
composition of milk (Bobe et al., 1999) which is an important factor for the profitability of the dairy
industry (Pabst, 1994). Because genes that encode milk CNs and whey proteins are autosomal genes
exhibiting Mendelian inheritance, selection of cows for desired proteins variants is feasible and
milk protein polymorphisms might be used in gene-assisted selection programs for altering
composition and technological properties of milk. Despite DNA-based genotyping of animals is
available for large scale applications, it can not provide any information on milk protein
composition. Moreover, the quantification of relative ratios for milk protein fractions, or even
variants, is of interest for milk quality payment systems.
A variety of methods are employed to analyze milk protein fractions: electrophoretic techniques
(Ng-Kwai-Hang and Kroeker, 1984; Kim and Jimenez-Florez., 1994) and isoelectric focusing (IEF)
(Kim and Jimenez-Florez., 1994), high-performance liquid chromatography (HPLC) by ion-
exchange (Hollar et al., 1991), hydrophobic interactions (Bramanti et al., 2002) and reversed-phase
methods (Visser et al., 1991; Bobe et al., 1998; Bordin et al., 2001; Veloso et al., 2002), and, more
recently, capillary electrophoresis and capillary zone electrophoresis (Recio et al., 1997; Fairise and
Cayot, 1998; Miralles et al., 2001; Ferreira and Caçote, 2003), mass spectrometry (Miralles et al.,
2003) or combinations of them (Mollé and Léonil, 2005). In particular, high performance liquid
chromatography allows rapid and automated analysis, characterized by good separations, high
resolutions and accuracy and reproducible results.
Previous investigations on the application of HPLC methods to the analysis of milk protein have
been focused on the quantification of protein fractions using bulk-tank milk and employing protein
commercial standards. Those methods lack the capacity to quantify single milk protein genetic
variants within fraction, with the only exception of β-Lg. As protein composition might be involved
in future breeding programs for dairy cattle populations aiming to enhance technological properties
of milk, the development of methods for the quantification of single protein fractions or variants in
individual milk samples is of interest and UV absorbance of each genetic variant should be
assessed.

19
In this study, an RP-HPLC method for simultaneous qualitative and quantitative analysis of most
common genetic variants of bovine caseins and whey proteins was optimized and validated. Our
method was developed improving the results obtained by Bordin et al. (2001) allowing a 20 min
lower analytical time, and with the use of purified genetic variants in the calibration phase to assess
the response of each protein genetic variant. The validation of the method has been performed by
testing the linearity, the precision (repeatability and reproducibility) and the accuracy.
MATERIALS AND METHODS
Reagents, Standards and Samples
Guanidine hydrochloride (GdnHCl) (lot G-4505, purity>99%) and Bis-Tris Buffer (lot B-9754,
>98%) were supplied by Sigma (Sigma Aldrich, St. Louis, MO, USA). DL-dithiothreitol (lot 43817,
>98%) was from Fluka (Buchs, Switzerland). Purified major proteins from bovine milk were also
purchased from Sigma and their purity checked by electrophoresis or by polyacrilamide gel
electrophoresis: κ-CN (lot C-0406, >80%), α-CN (lot C-6780, >70%), β-CN (lot C-6905, >90%),
α-La (lot L-5385 type I, ~85%), β-LgB (lot L-8005, >90%) and β-LgA (lot L-7880, >90%). Ultra
pure water (Milli-Q Plus System, >18.3 MΩ cm) was obtained in the laboratory.
Bovine individual milk and blood samples for 10 Holstein Friesian, 10 Brown Swiss, 10 Jersey and
10 Italian Simmental cows were collected directly in dairy herds. Preservative (Bronopol, 2-bromo-
2-nitropropan-1,3-diol) was immediately added to raw milk samples at 0.6:100 (v/v) to prevent
microbial growth and aliquots containing 0.8 ml of milk were frozen at -20°C. Milk samples were
prepared following the method proposed by Bobe et al. (1998). No preliminary separation or
precipitation procedures of the casein fraction were required.
HPLC Equipment
The HPLC equipment consisted of an Agilent 1100 Series chromatograph (Agilent Technologies,
Santa Clara, CA, USA) equipped with a binary pump (Agilent 1100 Series, G1312A). A variable-
wavelength ultraviolet detector (Agilent 1200 Series, G1314B) was also used. The equipment was
controlled by the Agilent ChemStation for LC Systems software which set solvent gradient, data
acquisition and data processing. Separations were performed on a reversed-phase analytical column
C8 (Zorbax 300SB-C8 RP, Agilent Technologies) with a silica-based packing (3.5 µm, 300 Å,
150×4.6 I.D.). A Security Guard Cartridge System (product No. AJ0-4330, Phenomenex) was used
as pre-column (widepore C4 4×3.0 mm). The sample vial was kept at constant low temperature
(4°C) by a liquid refrigerator (Agilent 1200 series, G1330B) and injected via an auto-sampler
(Agilent 1200 series, G1329 A). An injection loop of 100 µl was used.

20
Chromatographic Conditions
Gradient elution was carried out with a mixture of two solvents. Solvent A consisted of 0.1%
trifluoroacetic acid (TFA) in water and solvent B was 0.1% TFA in acetonitrile.
Separations were performed with the following program: linear gradient from 33% to 35% B in 5
min (0.4% B min-1), from 35% to 37% B in 4 min (0.5% B min-1), from 37% to 40% B in 9 min
(0.33% B min-1), from 40% to 41% B in 4 min (0.25% B min-1), followed by an isocratic elution at
41% B during 5.5 min, then linear gradient from 41% to 43% B in 0.5 min (4% B min-1), from 43%
to 45% B in 8 min (0.25% B min-1) and return linearly to the starting condition in 1 min. Before
inject the following sample, the column was re-equilibrated under the starting conditions for 8 min.
Therefore, the total analysis time per sample was 45 min.
The flow rate was 0.5 ml/min, the column temperature was kept at 45°C and the detection was
made at a wavelength of 214 nm. The injection volume consisted of 5 µl.
Purified Proteins
Pure protein genetic variants were extracted for calibration experiments because other caseins and
whey proteins are present as impurities in commercial standards and commercial standards for each
genetic variant are not available.
Each protein genetic variant was purified by RP-HPLC, starting from individual milk samples of
DNA-genotyped animals, and then lyophilized and weighted. For this purpose, the same elution
conditions were used in semi-preparative experiments by collecting the major peaks (κ-CN variants
A and B, αS2-CN, αS1-CN, β-CN variants A1, A2, B, and I). α-La, β-LgA and β-LgB were used
without further purification. A semi-preparative Zorbax 300SB-C8 (5 µm, 300 Å, 9.4×250 mm,
Agilent Technologies) column was used. The flow rate was 2 ml/min. After lyophilisation, purified
proteins were stored at -20°C.
Because of the limited amount of protein obtainable from a semi-preparative method, purified
genetic variants were only used to check their response coefficients and to quantifying the content
of each protein genetic variant into a milk sample. This milk sample was stored at -196°C and used
as standard for further analysis. The quantitative precision was improved by running this milk
sample at the beginning of each analytical day to adjust for column-to-column and day-to-day
variation.
DNA Genotyping
To ensure a higher variability of genotypes, individual milk and blood samples collected from
Holstein Friesian, Brown Swiss, Jersey and Italian Simmental cows were used to check the
correspondence between genotyping results provided by DNA-based techniques and RP-HPLC.

21
DNA was extracted from leukocytes by standard protocols and genotyped by direct sequencing.
Primers and sequences are reported by Chessa et al. (2007).
Validation
Ten individual milk samples from Italian Simmental cows were used in the validation tests as this
breed exhibits more balanced allelic frequencies when compared with Holstein Friesian, Brown
Swiss and Jersey. Moreover, Italian Simmental shows a rather high occurrence of β-CNI allele
(Jann et al., 2002, 2004).
Before calibration, linearity was tested by running the same sample at 5, 10, 20, 40 and 80 µl in
triplicate. The precision of the method was then evaluated by estimating the repeatability and
reproducibility. Areas under all peaks on the chromatogram were used to validate the method.
For the validation procedure, 10 samples were analyzed daily, repeating the analysis of the same
sequence over 4 days (sample injection volume = 5 µl). The reproducibility was calculated as the
RSD of peaks area and elution times across days. The repeatability was studied by running 10
consecutive replications of the same sample and calculating the RSD for peaks area and elution
times (sample injection volume = 5 µl). All the aliquots employed in validation were stored at -196
°C to prevent enzymatic lysis.
The accuracy was determined by quantifying each genetic variant in two samples and by repeating
the quantification on different mixtures of them (at 75, 50 and 25%). Each mixture was analyzed in
duplicate. The percentage recovery rate was calculated using the experimental response values and
values provided by the calibration curves for the same quantity of analyte. Student’s t-test was
performed to assess whether the recovery rate differed statistically from 100% at P < 0.05.
The external standard method was used to calibrate the chromatographic system for protein
quantifications. For this purpose, standard solutions consisting of purified protein genetic variants
were used. Each solution was analyzed in duplicate.
Calibration curves were computed for each protein genetic variant by estimating parameters of the
linear regression of the peak area on the amount injected, at increasing injection volume (5, 10, 20,
40 and 80 µl).
Certified Reference Material BCR-063R Skim Milk Powder
BCR-063R skim milk powder was supplied by the Institute of Reference Materials and
Measurements (IRMM, Geel, Belgium). The certified total Nitrogen content was 62.3±0.8 mg/g. Its
‘true protein’ content was calculated using the average conversion factor of 6.38 (Fox and
McSweeney, 2003). The estimated protein concentration was therefore 39.75±1.02 g/100g. Three
aliquots of BCR-063R were weighted, suspended and analyzed in duplicate.

22
RESULTS AND DISCUSSION
Separation
In this study, HPLC conditions were optimized for mobile phase composition, gradient, operating
temperature and flow-rate. Retention times of the major eluted peaks coincided with retention times
of standard protein fractions. It was therefore ascertained that proteins eluted in the following order:
κ-CN, αS2-CN, αS1-CN, β-CN, α-La and β-Lg. It is worth to note that commercial standards were
available for the mixture α-CN only, but not for αS2-CN and αS1-CN fractions and that the
chromatographic profiles showed the contamination of the standards due to the presence of traces of
other milk proteins.
The identification of peaks of genetic variants of milk proteins was confirmed by comparison with
commercial standards that consisted of purified genetic variants (β-Lg variants A and B) or by
comparison with chromatograms of individual milk samples of DNA-genotyped animals (Fig. 1).
For αS2-CN, assignment was made on the basis of αS2/αS1-CN ratio, αS2-CN being 10-12% of total
protein (Walstra and Jenness. 1984).
κ-CN eluted as several distinct peaks which consisted of glycosylated and unglycosylated forms of
κ-CNA and κ-CNB (Farrell et al., 2001). Chromatograms from animals carrying different κ-CN
genetic variants are reported in Fig. 2. The profile of the different forms of κ-CN was well resolved
and it was very similar to those obtained by Visser et al. (1991). The main genetic variants A and B
(glycol-free form A and B), together with their glycosylated forms were detectable. Glycosylated
forms belonging to variant A and variant B were identified as the peaks that were not visible in κ-
CNBB and κ-CNAA animals, respectively.
Under the conditions used, κ-CNA and the infrequent variant κ-CNE coeluted, but κ-CNA/E and
κ-CNB were perfectly resolved. κ-CNE is an uncommon variant which has been detected in Italian
Brown Swiss and Holstein Friesian cattle populations and exhibits a high frequency (~30%) in the
Finnish Ayrshire (Formaggioni et al., 1999).
As previously reported by Bordin et al. (2001), αS2-CN multiple peaks and shoulders were probably
caused by the partial separation of differently phosphorylated forms of αS2-CN (Farrell et al., 2004).
Resolution between κ-CNB and αS2-CN was higher than 2.4, ensuring a complete separation.
Separation of variants B and C of αS1-CN was not feasible with the current method or by any other
published RP-HPLC method (Visser et al., 1991; Bobe et al., 1998; Bordin et al., 2001). For
homozygous animals, these two variants gave rise to a double peak, which is likely to occur for a
difference in the degree of post-translational phosphorylation (Farrell et al., 2004). No individuals
carrying αS1-CNA or αS1-CND were found in the group of sampled animals and assessment of
elution times for these two variants was not feasible.

23
Figure 1. Chromatograms relative to individual milk samples (samples 1-7) obtained using the optimized elution condition: Zorbax 300SB-C8 RP (Agilent Technologies); linear gradient from 33% to 35% B in 5 min (0.4% B min-1), from 35% to 37% B in 4 min (0.5% B min-1), from 37% to 40% B in 9 min (0.33% B min-1), from 40% to 41% B in 4 min (0.25% B min-1), followed by an isocratic elution at 41% B during 5.5 min, then linear gradient from 41% to 43% B in 0.5 min (4% B min-1), from 43% to 45% B in 8 min (0.25% B min-1) and return linearly to the starting condition in 1 min, where solvent A consisted of 0.1% trifluoroacetic acid (TFA) in ultra pure water and solvent B was 0.1% TFA in acetonitrile; flow rate 0.5 ml/min at 45°C; UV detection at 214 nm.

24
For A1, A2 and B variants of β-CN, all peaks were well resolved. The most difficult separation, the
one between A1 and A2 variants, was achieved by an isocratic elution at 41% of solvent B. The
resolution between these two peaks exceeded 1.15, which is considered satisfactory in
chromatographic separations. As reported by Bobe et al. (1998), the C variant, which is a rare
variant, partially coeluted with A1 variant, albeit differences in peak shape allowed detection of
heterozygous individuals CA1. Peak for variant C was well resolved and recognizable in
heterozygous individuals in absence of A1 variant. Variant I of β-CN was detectable albeit it
partially coeluted with A2 variant. Hence, our method ensured the discrimination between
homozygous I and heterozygous IA2 individuals. To our knowledge, this is achieved for the first
time at protein level. Up to date, the detection of genetic polymorphisms of milk proteins has been
mainly achieved through various electrophoretic techniques, but these methods are restricted to
separation of proteins differing in net charge caused by amino acid substitution. Differences
between β-CN A2 and I variants are caused by a neutral amino acid exchange and will not be
detectable by electrophoretic techniques at protein level (Jann et al., 2002). Likely, the peak eluting
at approximately 29.5 min is attributable to β-CNF (Visser et al., 1995).
Figure 2. Chromatograms relative to individual milk samples of DNA-genotyped cows: (a) κ-CNAA, (b) κ-CNAB and (c) κ-CNBB; peak 1: glycosylated form κ-CN variant A and B; peak 2: glycosylated form κ-CN variant A; peak 3: unglycosylated form κ-CN variant A; peak 4: glycosylated form κ-CN variant B; peak 5: unglycosylated form κ-CN variant B; peak 6: αS2-CN.

25
Under the conditions used and as reported for other RP-HPLC methods that analyzed whole milk
(Bobe et al., 1998), γ-CNs (proteolytic products of β-CNs) partially coeluted with β-CN. The same
absorption coefficient for γ-CNs and the respective β-CN variants were assumed. Detection of γ-
CNs was made after comparison with chromatograms of commercial standards incubated with
plasmin at time 0 and after 20, 60 and 120 min (Bastian and Brown, 1996). Plasmin action affected
resolution between β-CNA1 and β-CNA2 as it gave rise to a proteolytic peak just between them.
Moreover, plasmin activity caused a decrease of resolution between κ-CN and αS2-CN by increasing
the background noise (data not shown).
α-LA eluted after β-CNs group and it is monomorphic in variant B in all western breeds
(Formaggioni et al., 1999). For β-Lg, variant B eluted before variant A. As reported by Bordin et al.
(2001), β-LgA exhibited a minor peak followed by a main one and the relative proportion between
the size of the peaks can be considered as an indicator of the extent of proteolysis occurred. A third
β-Lg genetic variant, likely β-LgD (Formaggioni et al., 1999), eluted immediately before B variant
in samples belonging to Simmental cows.
On the basis of comparisons with separate injections of standards, it was observed that BSA eluted
just before β-LgB whereas Igs coeluted with αS2-CN. However, both BSA and Igs were not
detectable when analyzing individual milk samples.
There was full agreement between HPLC-inferred genotypes and genotyping results provided by
DNA-based techniques, with the only exceptions of chromatographic discriminations between κ-
CN A and E and between αS1-CN B and C. In some cases, there were uncertainties in the
assignment of genotypes by DNA-based analysis when β-CNI was present.
Detection wavelength at 214 nm was preferred over 220 and 280 nm because it improved the
baseline (less noise), the peak efficiency and the resolution of the protein peaks. Temperature
exerted a significant effect on the resolution between milk proteins. In particular, increasing the
column temperature from 45 to 50 °C improved the resolution between all β-CN variants, mostly
the one between β-CNA1 and β-CNA2, whereas κ-CNB and αS2-CN coeluted. Whey proteins were
badly resolved and tended to coelute with β-CNs when temperature was higher than 45 °C. These
results suggest the use of a temperature gradient to improve the overall separation. In agreement
with results by Bordin et al. (2001), temperature had no effect on the resolution of κ-CN variants.
Differently to other investigations using long-chain columns (Visser et al., 1991; Groen et al.,
1994), no carryover effect caused by column adsorption was observed in this study with the
exception of the carryover ascribed to proteins retained in the pre-column. To prevent the
worsening of separation caused by enzymatic lysis of proteins, milk samples should be stored at -
20°C immediately after collection and analyzed within few days. In addiction to preservative,
enzymatic inhibitors might be used to limit plasmin activity.

26
Quantification
All former RP-HPLC quantifications of milk proteins have been based on the use of bulk-tank milk.
In addition, calibration curves have been derived from parameters of regressions computed for
whole protein fractions by using commercial standards which contain a number of genetic variants
per fraction. When quantification by RP-HPLC is performed for individual milk samples, response
factors for single variants have to be considered because, for homozygous animals, a whole protein
fraction consists of a single variant.
Linearity
From 5 to 80 µl of injection volume, the relation between peak area and injected amount of protein
variant was linear (R2 > 0.99; data not shown). Parameters of calibration curves are reported in
Table 1. As a consequence of small errors in the integration phase, intercepts of regression
equations were statistically different from zero at P < 0.05 for most protein variants with the
exception of whey proteins, αS2-CN and κ-CNA. For all peaks, there was a very tight relationship
between the amount of protein and the detector response as indicated by R2 values that exceeded
0.99.
Table 1. Parameters of regression equations for calibration curves, response factors, and limit of detection (LOD) for single protein genetic variants or protein fractions1.
Protein Intercept ± SE Slope ± SE R2 Response ± SD (µg /area) ·103
LOD (µg)
Injected amount
(µg)
Theoretical
plates (N·103)
κ-CNA 1.29 ± 18.23 1169.6 ± 5.01 0.9999 0.86 ± 0.01 0.5 3.5 – 56.4 7.83 κ-CNB -77.3 ± 16.74 923.8 ± 4.67 0.9999 1.16 ± 0.06 0.6 3.5 – 55.6 10.22 αS2-CN -35.8 ± 37.15 788.3 ± 7.91 0.9999 1.37 ± 0.15 0.7 2.3 – 37.2 2.16 αS1-CN -138.3 ± 52.88 766.3 ± 7.73 0.9998 1.44 ± 0.17 0.7 6.6 – 106.0 15.57 β-CNB -150.1 ± 25.86 693.6 ± 3.99 0.9999 1.62 ± 0.19 0.9 6.3 – 100.4 22.24 β-CNA1 -209.3 ± 32.35 1013.2 ± 4.88 0.9999 1.13 ± 0.18 0.6 6.4 – 102.8 23.02 β-CNA2 -186.2 ± 52.04 1140.1 ± 7.88 0.9999 0.97 ± 0.11 0.5 6.4 – 102.4 21.23 β-CNI -263.4 ± 46.67 924.6 ± 7.17 0.9998 1.25 ± 0.15 0.7 6.3 – 100.4 34.12 α-La -122.7 ± 73.56 1004.2 ± 9.67 0.9974 1.14 ± 0.10 0.6 1.1 – 17.6 20.62 β-LgB -11.2 ± 9.63 755.9 ± 3.01 0.9999 1.34 ± 0.02 0.7 3.1 – 49.6 120.69 β-LgA 7.3 ± 37.77 1066.4 ± 9.31 0.9999 0.93 ± 0.01 0.5 3.6 – 56.8 153.28
1 Separated solutions of purified protein genetic variants injected at volume of 5, 10, 20, 40 and 80 µl in duplicate. LOD = 10×(3×SD) where SD is the standard deviation of the background noise. For computation of the number of theoretical plates, peak width at the baseline was obtained by tangential lines drawn at half-height; for αS2-CN, peak width was calculated including all major and minor peaks.
At a wavelength of 214 nm, response factors were of different magnitude for different protein
variants. Conversely, absorbance coefficients were homogeneous at 280 nm (data not shown). At
280 nm the absorbance of proteins is almost exclusively due to the aromatic amino acids content,

27
which is the same for all variants within a protein fraction, whereas at 214 nm absorbance
coefficients also depend upon the secondary structure of the protein (Rosenheck and Doty, 1961).
Because variation of response across variants is large, specific coefficients have to be used when
working with individual milk samples.
For milk samples used in the validation procedure, CN content was nearly 87% of total protein.
Within caseins, αS1-CN was less than 50% and β-CN roughly one third of total CN, while κ-CN and
αS2-CN accounted for about 10% of total CN. These results are in agreement with average content
values for bovine milk reported in the literature (Walstra and Jenness. 1984; Fox and McSweeney,
2003). Because non-protein nitrogen, proteose-peptones and minor constituents of whey protein
were not detectable, the CN content of samples used in our study was greater than the average CN
content of fresh milk reported in other investigations.
Table 2. Relative standard deviation of retention times and peak areas for milk proteins fractions or genetic variants obtained in the analysis of repeatability and reproducibility.
Protein Repeatability1 Reproducibility2 Retention time Area Retention time Area Samples
(n) R.S.D. (%) R.S.D. (%) R.S.D. (%) R.S.D. (%) κ-CNA 0.51 1.53 2.01 1.17 7 κ-CNB 0.32 0.92 1.41 1.21 6 αS2-CN 0.15 4.32 0.71 9.52 10 αS1-CN 0.14 1.68 0.63 0.85 10 β-CNB - - 0.87 2.78 2 β-CNA1 0.28 2.14 0.90 2.59 5 β-CNA2 0.29 1.73 0.91 2.12 9 β-CNI - - 0.87 2.45 1 α-La 0.23 1.82 0.70 6.54 10 β-LgB 0.12 1.30 0.31 5.34 7 β-LgA 0.12 1.08 0.28 4.22 9
1 Ten aliquots of the same individual raw milk sample were injected consecutively. 2 A sequence of 10 individual raw milk samples was injected over 4 days.
Repeatability and Reproducibility
Values of RSD for retention times and peak areas obtained in the analysis of repeatability and
reproducibility are presented in Table 2. All RSD values were similar to those reported in literature
for within- and between-days variation (Bobe et al., 1998; Bordin et al., 2001). Results indicate that
the precision (repeatability and reproducibility) of the method was acceptable. The RSD values for
retention times were below 0.51% within analytical day (repeatability) and below 2.01% across
analytical days (reproducibility). Values of RSD for peak areas were below 4.32% within day and
below 6.54% across days with the exception of RSD for αS2-CN. Likely, αS2-CN response was

28
markedly affected by pre-column conditions, as roughly a half of the injected amount was retained
at this level. Pre-column conditions might have also affected the reproducibility of quantification of
whey proteins. Thus, a frequent guard-cartridge turnover is advisable. In addition, a blank injection
might be used after each sample run. In our study, a blank injection, consisting of 1 part of buffer
and 3 parts of solvent (4.5 M of GdnHCl in TFA:ACN:H20,1:100:900) improved the precision of
the method (data not shown). The “cleaning run” was an isocratic elution at 45% solvent B over 5
min with a flow rate of 0.8 ml/ml. The re-equilibrium was introduced after each cleaning and not at
the end of the analytical run. Thus, including the cleaning run, the total analysis time per sample
was 46 min.
Accuracy
Recovery studies were carried out to determine the accuracy of the method (Table 3). Recoveries
ranged from 98.9% for αS2-CN content to 103.4% for β-LgB content and were close to 100% for all
other proteins. Results of Student’s t-test indicated that recovery rates were not significantly
different from 100% at P < 0.05.
Table 3. Results of the analysis of accuracy1.
Protein Recovery rate
(%) R.S.D.
(%) t-test
(t(0.05,2) = ± 4.30) κ-CNA 100.27 4.31 0.15 κ-CNB 103.13 4.37 1.70 αS2-CN 98.10 3.88 -1.22 αS1-CN 100.93 1.85 1.23 β-CNA1 103.66 4.33 2.00 β-CNA2 100.69 1.78 0.93 α-La 102.54 3.08 1.97 β-LgB 103.36 3.89 2.05 β-LgA 101.16 1.56 1.80
1Mixtures of two raw milk samples were obtained following relative proportions of 75, 50 and 25%. Mixtures and whole samples were analysed in duplicate and recovery rates were calculated using expected areas provided by calibration curves and observed areas.
Certified Reference Material BCR-063R Skim Milk Powder
Due to spray drying treatment, milk powders showed chromatograms of poorer quality in
comparison with those obtained from fresh milk. The RP-HPLC method estimated total protein
content of BCR-063R to be 38.07±0.67 g/100g. The estimated content was in good agreement with
the one reported by the manufacturer which was 39.75±1.02 g/100g. As expected, the total protein
content was slightly underestimated because the amount of non-proteic-nitrogen was not
measurable by RP-HPLC. Total casein of BCR-063R was 93.33±0.13% of the estimated total

29
protein, with αS1-CN and β-CN accounting for roughly 38, and 43% of total protein, respectively,
and κ-CN and αS2-CN accounting for 9.5% of total protein. In agreement with results reported by
Bordin et al. (2001) for powder milk samples, whey proteins content of BCR-063R measured by
our method was lower, as a consequence of heat sensitivity of these proteins, than the average
content of whey proteins of raw milk.
CONCLUSIONS
In this study, a new RP-HPLC method for separation and quantification of milk protein genetic
variants was developed. The method allows the separation of all milk protein fractions and genetic
variants in one run with very high resolutions. It allows a decrease of 20 min of the total run time if
compared to the method proposed by Bordin et al. (2001). In addition, it ensures a precise
quantification of most common genetic variants based on specific response factors and it might be a
useful tool for studies aiming at measurement of milk protein composition.
In conclusion, this procedure is suitable for routine analysis of raw individual and bulk-tank milk
samples as no complex sample preparation prior to injection is required and the total analysis time
per sample is considerably short if considering the great amount of information that the method can
provide.
ACKNOWLEDGMENTS
Financial support by Regione del Veneto (Azione Biotech III Delibera CIPE n. 35 27/05/2005) is
gratefully acknowledged.
REFERENCES
Bastian, E. D., and R. J. Brown. 1996. Plasmin in milk and dairy products: an update. Int. Dairy J. 6:435–457. Bobe, G., D. C. Beitz, A. E. Freeman, and G. L. Lindberg. 1998. Separation and quantification of bovine milk proteins
by reversed-phase high-performance liquid chromatography. J. Agric. Food Chem. 46:458–463. Bobe, G., D. C. Beitz, A. E. Freeman, and G. L. Lindberg. 1999. Effect of milk protein genotypes on milk protein
composition and its genetic parameter estimates. J. Dairy Sci. 82:2797–2804. Bordin, G., F. Cordeiro Raposo, B. de la Calle, and A. R. Rodriguez. 2001. Identification and quantification of major
bovine milk proteins by liquid chromatography. J. Chromatogr. A 928:63–76. Bramanti, E., C. Sortino, an G. Raspi. 2002. New chromatographic method for separation and determination of
denatured αS1-, αS2-, β- and κ-caseins by hydrophobic interaction chromatography J. Chromatogr. A 958: 157–166.
Buchberger, J., and P. Dovč. 2000. Lactoprotein genetic variants in cattle and cheese making ability. Food Technol. Biotechnol. 38(Suppl. 2):91–98.
Chessa, S., F. Chiatti, G. Ceriotti, A. Caroli, C. Consolandi, G. Pagnacco, and B. Castiglioni. 2007. Development of a SNP genotyping microarray platform for the identification of bovine milk protein genetic polymorphisms. J.

30
Dairy Sci. 90:451-464. Fairise, J. F., and P. Cayot. 1998. New ultrarapid method for the separation of milk proteins by capillary
electrophoresis. J. Agric. Food Chem. 46:2628–2633. Farrell, H. M., R. Jimenez-Flores, G. T. Bleck, E. M. Brown, J. E. Butler, L. K. Creamer, C. L. Hicks, C. M. Hollar, K.
F. Ng-Kwai-Hang, and H. E. Swaisgood. 2004. Nomenclature of the Proteins of Cows' Milk--Sixth Revision. J. Dairy Sci. 87(6):1641–1674.
Ferreira, I. M. P. L. V. O., and C. Caçote. 2003. Detection and quantification of bovine, ovine and caprine milk percentages in protected denomination of origin cheeses by reversed-phase high-performance liquid chromatography of beta-lactoglobulins. J. Chromatogr. A 1015:111–118.
Formaggioni, P., A. Summer, M. Malacarne, and P. Mariani. 1999. Milk protein polymorphism: Detection and diffusion of the genetic variants in Bos genus. Ann. Fac. Med. Vet. Un. Parma. XIX:127–165.
Fox, P. F., and P. L. H. McSweeney (Editors), Advanced Dairy Chemistry, Vol. 1: Proteins, Kluwer/Plenum, New York, 2003.
Groen, A. F., R. van der Vegt, M. A. van Boekel, O. L. A. de Rouw, and H. Vos. 1994. Case study on individual animal variation in milk protein composition as estimated by highpressure liquid chromatography. Neth. Milk Dairy J. 48:201–212.
Hollar, C. M., A. J. R. Law, D. G. Dalgleish, and R. J. Brown. 1991. Separation of major casein fractions using cation-exchange fast protein liquid chromatography. J. Dairy Sci. 74:2403–2409.
Jann, O., G. Ceriottti, A. Caroli, and G. Erhardt. 2002. A new variant in exon VII of bovine β-casein gene (CSN2) and its distribution among European cattle breeds. J. Anim. Breed. Genet. 119:65–68.
Jann O. C, E. M. Ibeagha-Awemu, C. Özbeyaz, P. Zaragoza, J. L. Williams, P. Ajmone-Marsan, J. A. Lenstra, K. Moazami-Goudarzi, and G. Erhardt. 2004. Genet. Sel. Evol. 36 243–257.
Kim, H.-H. Y., and R. Jimenez-Florez. 1994. Comparison of milk proteins using preparative isoelectric focusing followed by polyacrylamide gel electrophoresis. J. Dairy Sci. 77:2177–2190.
Marziali, A. S., and K. F. Ng-Kwai-Hang. 1986a. Relationships between milk protein polymorphisms and cheese yielding capacity. J. Dairy Sci. 69:1193–1201.
Marziali, A. S., and K. F. Ng-Kwai-Hang. 1986b. Effects of milk composition and genetic polymorphism on coagulation properties of milk. J. Dairy Sci. 69:1793–1798.
Miralles, B., J. Leaver, M. Ramos, and L. Amigo. 2003. Mass mapping analysis as a tool for the identification of genetic variants of bovine β-casein. J. Chromatogr. A 1007: 47–53.
Miralles, B., V. Rothbauer, M. A. Manso, L. Amigo, I. Krause, and M. Ramos. 2001. Improved method for the simultaneous determination of whey proteins, caseins and para-κ-casein in milk and dairy products by capillary electrophoresis. J. Chromatogr. A 915: 225–230.
Mollé, D., and J. Léonil. 2005. Quantitative determination of bovine κ-casein macropeptide in dairy products by Liquid chromatography/Electrospray coupled to mass spectrometry (LC-ESI/MS) and Liquid chromatography/Electrospray coupled to tamdem mass spectrometry (LC-ESI/MS/MS). Int. Dairy J. 15:419–428.
Ng-Kwai-Hang, K. F., and E. M. Kroeker. 1984. Rapid separation and quantification of major caseins and whey proteins of bovine milk by polyacrylamide gel electrophoresis. J. Dairy Sci. 67:3052–3056.
Pabst, K. 1994. Die Bedeutung von Milchproteinvarianten für die Herstellung von Käse. Kiel. Milchwirtsch. Forschungsber. 46:263–274.
Recio, I., L. Amigo, and R. López-Fandiño. 1997. Assessment of the quality of dairy products by capillary electrophoresis of milk proteins. J. Chromatogr. B 697:231–242.
Rosenheck, K., and P. Doty. 1961. The far ultraviolet absorption spectra of polypeptide and protein solutions and their dbpendence on conforiwation. Proc. Natl. Acad. Sci. USA 47:1775–1785.
Veloso, A. C. A., N. Teixeira, and I. M. P. L. V. O. Ferriera. 2002. Separation and quantification of the major casein fractions by reversed-phase high-performance liquid chromatography and urea–polyacrylamide gel electrophoresis. Detection of milk adulterations. J. Chromatogr. A 967:209–218.
Visser, S. C. J. Slangen, F. M. Lagerwerf, W. D. Van Dongen, and J. Haverkamp. 1995. Identification of a new genetic variant of bovine β-casein using reversed-phase high-performance liquid chromatography and mass spectrometric analysis. J. Chromatogr. A 711: 141–150.
Visser, S., C. J. Slangen, and H. S. Rollema. 1991. Phenotyping of bovine milk proteins by reversed-phase high-performance liquid chromatography. J. Chromatogr. 1991, 548, 361–370.
Walstra, P., and R. Jenness. 1984. Protein composition of milk. In Dairy Chemistry and Physics; Walstra, P., and R. Jenness Eds. Wiley: New York.

31
Chapter 2.
Effects of CSN2-CSN3 haplotype and BLG genotype on milk
production traits, contents of protein fractions and detailed
protein composition of individual milk of Simmental cows
V. Bonfatti,* G. Di Martino,* A. Cecchinato,* D. Vicario,† and P. Carnier*
* Department of Animal Science, University of Padova, Viale dell’Università 16, 35020, Legnaro,
Padova, Italy † Italian Simmental Cattle Breeders Association, Via Nievo 19, 33100, Udine, Italy
Submitted to Journal of Dairy Science


33
Effects of CSN2-CSN3 haplotypes and BLG genotypes on milk production traits, contents of
protein fractions and detailed protein composition of individual milk of Simmental cows
V. Bonfatti,* G. Di Martino,* A. Cecchinato,* D. Vi cario,† and P. Carnier* * Department of Animal Science, University of Padova, Viale dell’Università 16, 35020, Legnaro,
Padova, Italy † Italian Simmental Cattle Breeders Association, Via Nievo 19, 33100, Udine, Italy
ABSTRACT
The aim of this study was to investigate the effects of CSN2-CSN3 (β-κ-casein) haplotypes and BLG
(β-Lactoglobulin) genotypes on milk production traits, contents of protein fractions and detailed
protein composition of individual milk of Simmental cows. Contents of major protein fractions
were measured by reversed-phase HPLC in individual milk samples of 2,167 cows. Protein
composition was measured as weight percentage of each casein fraction to total casein and as
weight percentage of β-Lactoglobulin (β-LG ) to total whey protein. Genotypes at CSN2, CSN3 and
BLG loci were also assessed by HPLC and CSN2-CSN3 haplotype probabilities were estimated for
each cow. Traits were analyzed with a linear model including the fixed effects of herd-test day,
parity, days in milk and somatic cell score class, linear regressions on haplotype probabilities, BLG
genotype and the random effect of the sire of the cow. Effects of haplotypes and BLG genotypes on
yields were weak or trivial. Haplotypes carrying CSN2 B and CSN3 B exhibited greater casein (CN)
content and casein number, in comparison with all other haplotypes, but no differences in whey
protein content. Genotype BB at BLG was associated to increased protein and CN contents and
casein number when compared to genotype AA. Haplotypes including CSN3 B were associated
with greater κ-CN content and κ-CN to total CN ratio compared with those carrying the A variant.
The increase of κ-CN to total CN ratio was coupled with decreased αS1- and γ-CN to total CN
ratios. Allele CSN2 B was associated with an increase of β-CN content, which occurred at the
expense of content of αS1-CN. Haplotypes including allele CSN2 A1 exhibited decreased β-, αS2-
and γ-CN concentrations and increased αS1- and κ-CN contents, whereas CSN2 I exerted positive
effects on β-CN concentration, without altering other protein fractions content. Effects exerted by
haplotypes on CN composition were similar to those exhibited on CN fractions contents. Allele
BLG A increased β-LG concentration and altered the β-LG to α-Lactalbumin ratio. The higher

34
relative concentration of β-LG associated with the A variant was compensated by a lower
concentration of all other milk proteins, in particular of β-CN and αS1-CN. Estimated additive
genetic variance for investigated traits ranged from 14 to 39 % of total variance. Increasing the
frequency of specific genotypes or haplotypes might be an effective way for altering milk protein
composition.
INTRODUCTION
Most research concerning milk protein polymorphisms focused on the associations of CSN3 (κ-CN)
and BLG (β-LG) polymorphisms with milk production traits, coagulation time, curd firmness and
cheese yield. Results for the association between milk protein genetic variants and production traits
are inconsistent across studies (Braunschweig et al., 2000; Ikonen et al., 2001; Boettcher et al.,
2004a), but the B allele of CSN3 has been consistently reported to be associated with improved milk
clotting properties (Schaar, 1984) and increased cheese yields (Schaar et al., 1985; Caroli et al.,
2000).
Milk coagulation properties have been reported to be influenced also by protein composition
(Wedholm et al., 2006; Jõudo et al., 2008). A few studies investigated the role of milk protein
polymorphisms on protein composition and focused mostly on CSN3 and BLG loci. Significant
effects of A and B alleles at BLG and CSN3 on the concentration of β-LG, κ-CN, and total casein in
milk have been reported (Lunden et al., 1997; Mayer et al., 1997; Robitaille et al., 2002) and
genetically linked polymorphisms in the non-coding regions of these genes are assumed to affect
transcription of proteins (Martin et al., 2002). Variation in casein composition has been reported
also for CSN2 (β-CN) variants (Heck et al., 2009), but knowledge on the effects exerted by CSN2 B
allele is scarce because of its limited frequency in all previously investigated cattle populations.
The effects of polymorphisms at milk protein loci on all major protein fractions concentrations or
relative ratios have been investigated using limited numbers of animals (Bobe et al., 1999; Hallén et
al., 2008), because of the difficulty of quantifying all major milk proteins simultaneously, and
genotypes rather than haplotypes effects have been considered in all those studies. Genes encoding
αS1-CN, αS2-CN, β-CN and κ-CN are located on chromosome 6, within a region of about 250 kb
(Ferretti et al., 1990; Threadgill and Womack, 1990), making the estimation of the effects of single
CN genes difficult (Lien et al., 1995). For this, evaluation of the effects of casein haplotypes should
be preferred to the estimation of genotypes effects (Ikonen et al., 2001; Boettcher et al., 2004a).
Recently, for the first time, the effects exerted by casein haplotypes on milk protein composition
have been investigated using a large sample of Dutch Holstein Friesian cows (Heck et al., 2009).
With few exceptions (Bobe et al., 1999; Heck et al., 2009), estimation of milk protein

35
polymorphisms effects on detailed protein composition has been performed using ordinary least
squares procedures and effects due to polygenes have been ignored. As a consequence, estimated
effects of milk protein loci might be biased (Kennedy et al., 1992).
Despite a wide spreading of the breed, only few studies have been carried out on the variation of
milk protein composition in Simmental cattle (Pérez-Rodríguez et al, 1998; Amigo et al., 2001;
Graml and Pirchner, 2003). The Simmental breed exhibits more balanced allele frequencies within
each locus if compared with other breeds where frequency of some alleles (e.g., CSN3 B or CSN2
B) is very high or very low. This facilitates the estimation of haplotype and genotype effects.
Moreover, this breed exhibits a moderate presence of allele CSN2 I whose effects have never been
reported previously.
The aim of this study was to estimate the effects exerted by casein haplotypes and BLG genotypes
on milk production traits, protein fractions concentrations and detailed milk protein composition in
individual milk samples of Italian Simmental cows.
MATERIALS AND METHODS
Animals and Milk Sampling
Individual milk samples of 2,167 Simmental cows, distributed across 47 commercial herds in the
north of Italy, were collected from November 2007 to December 2008. Milk sampling occurred
once per animal, during the morning or evening milking, concurrently with the monthly milk
recording of the herd. Herd and test-day effects were confounded because all cows of a herd were
sampled in the same test day.
Milk was added with preservative (Bronopol, 0.6:100 vol/vol) immediately after collection, to
prevent microbial growth, and stored at –40°C until reversed-phase (RP-) HPLC analysis, to
prevent enzymatic proteolysis. Procedures used in the national milk recording program for the
assessment of fat and protein contents are based on mid-infrared spectroscopy and a Fourier-
transformed interferogram (MilkoScan FT 6000, Foss Elecrtic, Hillerød, Denmark). Milk yield
records and pedigree information were supplied by the Italian Simmental cattle breeders association
(ANAPRI, Udine, Italy).
Milk Protein Composition and Genotyping
Contents of αS1-CN, αS2-CN, β-CN, γ-CN, κ-CN, β-LG, and α-LA of individual milk samples were
measured using the RP-HPLC method proposed by Bonfatti et al. (2008). Genotypes of cows for
CSN2, CSN3, and BLG, were also derived by RP-HPLC. Briefly, the method ensures the separation
of all major casein and whey protein fractions in one run, with very high resolutions, and provides

36
the quantification of A1, A2, B and I variants of β-CN, A and B variants of κ-CN, and A, B and D
variants of β-LG. When analyzing individual milk samples of homozygous animals, a whole protein
fraction consists of a single genetic variant, and quantification performed by RP-HPLC can be
affected by the response factor of the specific protein form. Since purified protein genetic variants
were used to develop specific calibration equations, the method used in this study was suitable for
the quantification of protein fractions contents in individual milk samples. A detailed description of
the RP-HPLC technique used in this study can be found in Bonfatti et al. (2008).
Table 1. Descriptive statistics for milk production traits, protein fractions contents and protein composition (n = 2,167)
Trait Mean SD Minimum Maximum Milk yield, kg/d 26.18 7.44 7.00 50.40 Fat yield, kg/d 1.02 0.32 0.22 2.62 Protein yield, kg/d 0.92 0.23 0.27 1.70 Fat, % 3.92 0.72 1.36 6.98 Protein, % 3.56 0.37 2.50 5.12 SCS1 2.67 1.95 -2.05 10.34 Protein measured by reversed-phase HPLC2 Protein, g/L 38.78 4.54 19.58 59.16 Casein, g/L 33.88 3.40 16.92 51.76 Whey protein, g/L 4.91 0.71 2.58 7.63 Casein number, % 87.35 1.11 84.20 91.26 Protein fractions content3, g/L αS1-CN 11.38 1.41 5.82 17.38 αS2-CN 4.23 0.74 1.74 7.24 β-CN 12.99 2.02 5.99 22.83 γ-CN 1.62 0.45 0.23 4.51 κ-CN 3.66 0.85 1.29 6.84 α-LA 1.25 0.23 0.53 2.10 β-LG 3.66 0.61 1.76 6.13 Protein composition4, % αS1-CN% 35.61 2.65 28.00 45.46 αS2-CN% 12.11 1.60 5.39 18.36 β-CN% 37.14 2.90 27.31 46.02 γ-CN% 4.68 1.33 0.77 12.56 κ-CN% 10.46 1.95 4.70 17.57 β-LG% 74.49 3.79 61.25 87.38
1SCS = log2(SCC × 103) + 3 ; 2Casein = αS1-CN + αS2-CN + β-CN + γ-CN + κ-CN; whey protein = β-LG + α-LA ; protein = casein + whey protein; casein number = (casein/protein) × 100; 3Contents of all protein fractions were measured by reversed-phase HPLC on skimmed milk; 4αS1-CN%, αS2-CN%, β-CN%, γ-CN% and κ-CN% are measured as weight percentages of total casein content; β-LG%
is measured as weight percentage of total whey protein content.

37
Because of the very low frequency of BLG D, records of cows carrying this allele were not
considered in the statistical analysis. The RP-HPLC method did not allow the discrimination
between CSN1S1 (αS1-CN) alleles. Because the frequency of the C allele at CSN1S1 has been
reported to range from 0.08 to 0.11 for Simmental cattle (Pérez-Rodríguez et al, 1998; Jann et al.,
2004), suitability of genotyping based on alternative techniques was carefully evaluated in terms of
benefits and disadvantages. This involved the assessment of genotypes at CSN1S1 in a random
sample of 200 cows by direct DNA sequencing. Portion of exon 17 of CSN1S1 (allele B and C
discriminating fragment) was amplified by standard PCR using primers Csn1S1_ex17f 5'-
TGGATGCCTATCCATCTGGT-3' and Csn1S1_ex17r 5'-CACTGCTCCACATGTTCCTG-3'.
Amplicons (333bp) were directly sequenced using Csn1S1_ex17f primer on a CEQ8000 sequencer
(BeckmanCoulter, Fullerton, CA, USA). Because of the very low frequency (less than 6%) of the
CSN1S1 C allele, genotyping through direct DNA sequencing was not extended to all milk samples,
and CSN1S1 locus was not considered when computing haplotypes probabilities. With such a
limited frequency, haplotypes carrying the C allele at CSN1S1 would have been included in the
group of “rare” haplotypes or would have obtained a trivial haplotype probability, thus limiting the
reliability of the estimated haplotype effects and jeopardizing expected advantages arising from the
gain of additional gene information. Furthermore, a very limited bias is to be expected when
neglecting CSN1S1 contribution to haplotype definition.
Frequency of CSN3 E allele, which cannot be differentiated from CSN3 A by RP-HPLC, is known
to be quite low for the Simmental breed and ranges from 4%, for Czech Simmental (Matějíček et
al., 2008), to 0% for Italian Simmental (Jann et al., 2004), albeit the allele has been detected in other
cattle breeds (Ikonen et al., 1999a; Heck et al., 2009). Due to its low frequency, the incidence of
CSN3 E was not assessed by direct DNA sequencing. Thus, the estimated effects for CSN3 A might
be slightly biased being the combined effects of CSN3 A and E variants.
Despite the partial co-elution of β-CN I with A2 variant, the double peak of heterozygous A2I
samples exhibited a typical shape that was easily recognizable. Also, heterozygous A1I and BI
milks exhibited a characteristic shape of the peaks valley so that genotyping errors were unlikely.
Shifts of the chromatogram were rare and usually homogeneous in the whole β-CN elution interval.
More likely, genotyping errors occurred for A2A2 and II samples.
Fraction γ-CN consisted of a number of minor peaks eluting close to β-CN, or partially co-eluting
with it. Although constituted by multiple peaks characterized by low resolutions, total γ-CN
exhibited good repeatability and reproducibility with values similar to those obtained by Bonfatti et
al. (2008) for the other protein fractions, and can be used as an indicator of the extent of proteolysis
occurred in the milk sample.

38
Traits Definition
For proteins quantified by RP-HPLC, total casein (TCN, g/L) was computed as the sum of αS1-CN,
αS2-CN, β-CN, γ-CN and κ-CN contents of milk. Total whey protein (WH , g/L) was calculated as
the sum of α-LA and β-LG contents. Total protein (PRT, g/L) was expressed as the sum of casein
and whey protein contents. Casein number (CI , %) was calculated as the percentage ratio of TCN to
PRT. Protein composition (i.e., relative contents of protein fractions) was computed as weight
percentage ratio of αS1-CN (αS1-CN% , %), αS2-CN (αS2-CN% , %), β-CN (β-CN% , %), γ-CN
(γ-CN% , %), and κ-CN (κ-CN% , %) to TCN and as the percentage ratio of β-LG to WH (β-LG%,
%). When protein fractions are expressed as percentage ratios of PRT, for a certain haplotype
associated with increased CI, the percentage ratios of all casein fractions are expected to increase
whereas those of whey fractions is expected to decrease. Expressing protein composition as
percentage ratios of the TCN or total WH ensures that estimations of effects will not be affected by
simultaneous variations in CI.
Computation of Haplotypes Probabilities
Sires families of limited size occur rather commonly in the Italian Simmental population. For 60%
of the sires, the family size was between 2 and 5 daughters, for 17.2% was between 6 and 20, and
for 10.4% between 21 and 50 daughters. Only 3% of the sires had more than 50 daughters. Because
sire genotypes were unknown, but also to avoid problems related to the attribution of haplotypes in
families of very small size that would have markedly reduced the size of the dataset, we estimated
haplotypes probabilities. Cows (2,016 animals) originated by sires having at least 2 genotyped
daughters were used to estimate CSN2-CSN3 haplotypes probabilities. Two animals had genotypes
that were incompatible with observed haplotypes in their families and were discarded. The
probability of haplotypes inherited by each daughter was estimated using the method proposed by
Boettcher et al. (2004b).
Computation of haplotypes probabilities was carried out by assuming no recombination events
across CN genes. The expected number of copies of each possible haplotype carried by an animal
was indirectly derived from the estimated probabilities. To test the null hypothesis that genotypes at
one locus were independent upon genotypes at another locus (i.e., to test the hypothesis of linkage
equilibrium between loci), GENEPOP Version 4.0 was used. The program creates contingency
tables for all pairs of loci in each sample and then performs a probability test for each table using a
Monte Carlo Markov chain method. Hardy Weinberg equilibrium was also verified for each locus
by the Monte Carlo Markov chain method. Values of r2 for the haplotype CSN3-BLG were
computed following the method proposed by Hill and Robertson (1968) and Zhao et al. (2005), and
used by Heck et al. (2009).

39
Statistical Analysis
Somatic cell score (SCS) was computed as log2(SCC × 103) + 3. The effects of casein haplotypes
and BLG genotypes on phenotypic variation of traits of concern were estimated using a linear mixed
model with the MIXED procedure of SAS (Version 9.1, SAS Institute Inc., Cary, NC). The mixed
model was:
ijklmnonm
h
lkjiijklmno esire BLGPR SCS DIM P HTDy1s
ijklmno:ss +++∑++++==
β
where yijklmno is a measure for a trait; HTDi is the fixed effect of herd-test day i (i = 1, …, 47); Pj is
the fixed effect of parity j of the cow (j = 1: first parity, j = 2: second parity, j = 3: third parity, j =
4: fourth and later parities); DIMk is the fixed effect of DIM class k (12 classes of 30-d intervals,
with the exception of the last class, which included samples collected at DIM 330 or greater); SCSl
is the fixed effect of SCS class l (6 classes of 1-point intervals, with the exception of the last class
which included records with SCS ≥ 5); h is the total number of haplotypes evaluated (h = 8);
ijklmno:sPR is the probability that the cow carried haplotype s, expressed as the expected number of
copies of haplotype s carried by the animal; βs is the regression coefficient on the probability of
haplotype s; BLGm is the fixed effect of BLG genotype m (m = 1: AA, m = 2: AB, m = 3: BB); siren
is the random effect of the sire of the cow (n = 1, …, 211) assumed to follow a normal distribution
with siren ( )2 , ~ sN σ0 , where 2sσ is the sire variance; and eijklmno is a random residual assumed to
follow a normal distribution with eijklmno ( )2 , ~ eN σ0 , where 2eσ is the residual variance.
A probability (ranging from 0 to 1) was assigned to each possible haplotype carried by an animal.
For example, if the only possible haplotype couple was composed by two copies of the same
haplotype, that haplotype gained a final value of 2 because the animal was expected to carry 2
copies of that haplotype, each one with a probability of 1.
Hence, the difference between the estimated regression coefficients for two haplotypes of interest
provides a quantification of the expected change in the phenotype of a given trait when a copy of
the second haplotype replaces a copy of the first haplotype. Likewise, in the hypothetical situation
in which 2 animals differ for only one haplotype, the difference between the estimated coefficients
would correspond to the expected difference in the phenotype of the 2 animals for a given trait
(Boettcher et al., 2004a). Only additive effects of haplotypes were estimated and dominance effects
were not considered. Sire effects were included in the model to account for variation due to
polygenes underlying the investigated traits. All analyses and hypothesis testing were carried out
using the MIXED procedure of SAS.

40
RESULTS AND DISCUSSION
Descriptive Statistics
Descriptive statistics for the investigated traits are reported in Table 1. The difference between
average protein content assessed in the milk recording program and average protein content
measured by RP-HPLC was large. This must be ascribed to the skimming of milk prior to
chromatographic analysis and to the specific gravity of milk: protein content assessed by HPLC was
measured in weight per volume whereas protein content quantified in the milk recording program
was measured in weight per weight. After adjusting for skimming and specific gravity of milk,
averages of the two traits were comparable. However, since protein content provided by mid-
infrared spectroscopy consisted in a prediction of the content of crude protein (including the NPN
fraction), higher values for this trait are to be expected in comparison with protein content measured
by RP-HPLC (which do not include NPN and minor protein fractions). Nevertheless, protein
content measured by HPLC was constantly greater than that recorded in the milk recording
program. This is attributable to more favorable preservation conditions guaranteed for sample
aliquots analyzed by HPLC than for samples collected in the milk recording program. Differences
between measures of milk protein content provided by RP-HPLC and those obtained in the milk
recording program increased in summer, when preservation of samples is more critical (data not
shown).
Locus Genotype frequency Allele frequency Genotype Frequency Allele Frequency CSN2 A2A2 0.362 A2 0.596 A1A2 0.224 A1 0.188
A2B 0.177 B 0.158 A1B 0.065 I 0.058 A2I 0.064 A1A1 0.036 BB 0.025 BI 0.022 A1I 0.019 II 0.006
CSN3 AA 0.438 A 0.652 AB 0.432 B 0.348 BB 0.130 BLG AB 0.466 A 0.543 AA 0.306 B 0.449 BB 0.213 D 0.008 AD 0.008 BD 0.007
Table 2. Genotype and allele frequencies for CSN2 (β-CN), CSN3 (κ-CN), and BLG (β-LG) loci (n = 2,167)

41
Table 3. Frequency of CSN2-CSN3 haplotypes (n = 2,016)
As a consequence of lack of NPN and minor serum proteins, high values of CI, ranging from 84 to
91%, were observed. This was in agreement with results reported by Heck et al. (2009), who used
capillary electrophoresis for the analysis of individual milk samples of Dutch Holstein Friesian
cows.
Alleles and Haplotype Frequencies
Frequencies of genotypes and alleles, obtained by gene counting, for CSN2, CSN3 and BLG are
presented in Table 2. To our knowledge, it is the first time that these frequencies are computed
investigating a large sample of Simmental cows. Four alleles (A1, A2, B and I) for CSN2, 2 alleles
(A and B) for CSN3 and 3 alleles (A, B and D) for BLG were present in the sampled population.
Conversely to other breeds in which some alleles at CN loci have very high or very low
frequencies, rather balanced allelic frequencies were detected at all investigated loci and mostly at
CSN2 where B allele showed a moderate frequency (0.16). With the only exception of CSN2 I,
allelic frequencies were in good agreement with those reported by Jann et al. (2004) for a sample of
Simmental cows of limited size. Almost 30 % of animals carried at least one copy of CSN2 B allele
and the frequency of CSN3 BB animals (n = 282) was rather high. Within the studied loci, only
CSN2 genotype frequencies were in Hardy-Weinberg equilibrium (P > 0.05).
Similarly to results for other breeds (Ikonen et al., 2001;
Boettcher et al., 2004a), linkage disequilibrium between
CSN2 and CSN3 loci has been detected (P < 0.001).
Following haplotype reconstruction, 8 CNS2-CSN3
haplotypes, including all combinations between CNS2 and
CSN3 alleles, were identified. Haplotypes were assigned with
a probability of 1 to 1,493 cows (i.e., 74% of cows).
Haplotype frequencies (Table 3) were calculated as the
weighted mean of the haplotype probabilities obtained, thus
all the animals have been included in the computing. The
most recurrent CNS2-CSN3 haplotype was A2A which had a frequency of 39%. Haplotypes
carrying allele CSN2 B had a moderate frequency whereas the rarest haplotype, exhibiting a
frequency of 1.6%, was IA. Linkage disequilibrium was detected (P < 0.001) also between CSN3
and BLG, which are located in different chromosomes, and might be due to random drift. To
quantify linkage disequilibrium, the correlation coefficient (r2) of the CSN3 and BLG variants, as
described by Hill and Robertson (1968), was computed. The overall r2 for the haplotype CSN3-BLG
was below 0.006 and showed that the haplotypes AB and BA had a higher frequency than the
frequency expected by random mating. However, since CSN3 A and BLG B had the opposite effect,
Haplotype Frequency A2A 0.387 A2B 0.207 A1A 0.128 A1B 0.059 BA 0.119 BB 0.040 IA 0.016 IB 0.043

42
the bias due to the exclusion of BLG from the haplotype is expected to be low. Moreover, both
casein haplotype and BLG locus were simultaneously included in all the statistical analysis.
Effect of Casein Haplotypes and BLG Genotypes on Milk Production Traits
With the only exception of the effect of CSN3 on protein content, results concerning the effect of
casein polymorphisms on milk production traits are not consistent across studies and breeds
(Braunschweig et al., 2000; Ikonen et al., 2001; Boettcher et al., 2004a). Estimates of the effects
exerted by casein haplotypes and BLG genotypes on milk production traits are reported in Table 4
and 5, respectively. All estimates are expressed in standard deviation units of the trait to make
across-traits comparisons of the magnitude of effects feasible. Milk yield, fat and protein contents
and fat and protein yields were affected neither by casein haplotypes nor by BLG genotypes, with
few exceptions. In comparison with haplotype A2A, a slight increase (P < 0.05) of fat and protein
content and protein yield was observed in presence of haplotype A1A, and a slight increase
(P < 0.05) of protein content was associated with haplotypes A2B and IB. These results are not in
agreement with those obtained by Boettcher et al. (2004a) for Italian Holstein Friesian and Brown
Swiss cows. Bovenhuis et al. (1992) suggested that associations between casein alleles and milk
production traits are attributable to effects of linked loci rather than to direct effects of the protein
loci themselves. Under this assumption, associations between milk protein genes and linked QTLs
might be different across breeds and sire families and might explain inconsistencies across studies.
Similarly to CN loci, results for the effect of BLG genotypes on milk production traits are not
consistent across studies. Some authors (Lunden et al., 1997; Ojala et al., 1997; Heck et al., 2009)
reported no association between BLG genotype and milk production traits whereas Ikonen et al.
(1999a) reported that genotype AA exerted favorable effects on milk and protein yield and genotype
BB increased milk fat content. In our study, genotype BB did not significantly affect (P > 0.05)
milk production and protein yield.
In a study concerning the effect of genetic merit on protein composition, Bobe et al. (2007)
concluded that there were small differences in milk protein composition of cows of different genetic
merit for milk yield and that, as a consequence, prolonged selection for increased yield is not
expected to affect composition of milk protein if selection is only for a few generations.
Estimated genetic correlations between protein yield and concentrations of the major milk proteins
have been reported to be low or very low, indicating that selection for protein yield is expected to
exert negligible effects on protein composition (Shopen et al., 2009). However, selection to enhance
protein percentage is expected to result in a slight increase in κ-CN% while decreasing αS1-CN%
and α-LA%, and selection for increased milk yield is expected to exert the opposite effect (Shopen
et al., 2009).

43
Table 4. Estimated effects (± SE) of CSN2-CSN3 haplotypes compared to haplotype A2A on yield (kg/d) and content (%) of milk protein and fat (magnitude of effects is expressed in SD units of traits)1
Haplotype Milk yield Protein yield Fat yield Protein content Fat content A2A 0 0 0 0 0 A1A -0.022 ± 0.041 -0.003 ± 0.045 0.046 ± 0.047 0.093 ± 0.042* 0.110 ± 0.051* BA 0.070 ± 0.043 0.069 ± 0.047 0.097 ± 0.049† 0.007 ± 0.044 0.035 ± 0.054 IA -0.143 ± 0.134 -0.124 ± 0.148 0.044 ± 0.155 0.098 ± 0.134 0.185 ± 0.167 A1B -0.090 ± 0.059 -0.082 ± 0.065 -0.016 ± 0.068 0.064 ± 0.060 0.074 ± 0.074 A2B -0.043 ± 0.035 -0.016 ± 0.039 0.003 ± 0.041 0.090 ± 0.037* 0.069 ± 0.045 BB -0.060 ± 0.077 -0.051 ± 0.084 -0.026 ± 0.088 0.051 ± 0.078 0.094 ± 0.095 IB 0.029 ± 0.068 0.103 ± 0.075 0.001 ± 0.078 0.208 ± 0.069** -0.043 ± 0.085
1All measures have been collected in the national milk recording program and measures of protein yield and milk protein content are derived from mid infrared predictions; †P < 0.10, *P < 0.05, ** P < 0.01, *** P < 0.001.
Table 5. Estimated effects (± SE) of BLG genotypes compared to genotype AA on yield (kg/d) and content (%) of milk protein and fat (magnitude of effects is expressed in SD units of traits)1
Genotype2 Milk yield Protein yield Fat yield Protein content Fat content AA 0 0 0 0 0 AB 0.007 ± 0.037 0.011 ± 0.041 0.009 ± 0.043 -0.002 ± 0.038 0.043 ± 0.046 BB 0.091 ± 0.047† 0.090 ± 0.052† 0.069 ± 0.054 -0.005 ± 0.049 0.008 ± 0.060 Additive deviation 0.046 ± 0.023† 0.045 ± 0.026† 0.034 ± 0.027 -0.003 ± 0.024 0.004 ± 0.030 Dominance deviation -0.039 ± 0.032 -0.034 ± 0.036 -0.025 ± 0.037 0.001 ± 0.032 0.038 ± 0.040
1All measures have been collected in the national milk recording program and measures of protein yield and milk protein content are derived from mid infrared predictions; 2Additive deviation was computed as )ˆˆ(5.0 AABLGBBBLG ββ −× where BBBLGβ and AABLGβ are model solutions for
BLG BB and AA genotypes, respectively; dominance deviation was computed as
)ˆˆ(5.0ˆAABLGBBBLGABBLG βββ +×− where ABBLGβ is the model solution for BLG AB genotype.
†P < 0.10, *P < 0.05, ** P < 0.01, *** P < 0.001.
Effects of Casein Haplotypes on Protein, Casein, Whey Protein and Casein Number
Estimates of CN haplotypes effects on PRT, TCN, WH and CI are reported in Table 6. Conversely
to milk production traits, CN haplotypes exerted significant effects on PRT and TCN content
measured by RP-HPLC. Estimated haplotypes effects on PRT are closely related to those obtained
for TCN because these two variables were tightly associated (r = 0.99, P < 0.001). Differences in
TCN were ascribed to both CSN2 and CSN3 alleles. Haplotypes carrying CSN3 B exhibited a
greater TCN and CI and no difference in WH in comparison with haplotypes carrying CSN3 A, but
the effect of CSN3 B on TCN was not consistent across haplotypes. As an example, haplotypes A1B
and A1A exhibited no significant difference in TCN content. In particular, marked differences in
TCN and CI due to CSN3 variants were observed in association with CSN2 A2 and B. Also
haplotypes carrying allele CSN2 B showed a greater TCN but similar WH in comparison with

44
haplotypes including alternative CSN2 alleles. Conversely, Bobe et al. (1999) reported no
significant effect of milk protein genotypes on total protein content measured by RP-HPLC.
Table 6. Estimated effects (± SE) of CSN2-CSN3 haplotypes compared to haplotype A2A on contents (g/L) of protein, casein, whey protein and casein number (%) measured by reversed-phase HPLC (magnitude of effects is expressed in SD units of traits)1
Haplotype Protein Casein Whey protein Casein number A2A 0 0 0 0 A1A -0.063 ± 0.044 -0.056 ± 0.044 -0.086 ± 0.043* 0.056 ± 0.044 BA 0.354 ± 0.047*** 0.401 ± 0.047*** 0.009 ± 0.046 0.467 ± 0.047*** IA 0.183 ± 0.140 0.223 ± 0.140 -0.081 ± 0.137 0.432 ± 0.138* A1B 0.009 ± 0.063 0.034 ± 0.064 -0.130 ± 0.063* 0.238 ± 0.063*** A2B 0.219 ± 0.039*** 0.252 ± 0.039*** -0.014 ± 0.038 0.316 ± 0.038*** BB 0.645 ± 0.081*** 0.747 ± 0.082*** -0.078 ± 0.080 0.964 ± 0.081*** IB 0.485 ± 0.072*** 0.528 ± 0.073*** 0.133 ± 0.071† 0.430 ± 0.072***
1Protein = αS1-CN + αS2-CN + β-CN + γ-CN + κ-CN + β-LG + α-LA; casein = αS1-CN + αS2-CN + β-CN + γ-CN + κ-CN; whey protein = β-LG + α-LA; casein number = (casein/protein) × 100; †P < 0.10, *P < 0.05, ** P < 0.01, *** P < 0.001.
Effects of Casein Haplotypes on Contents of Protein Fractions
Estimates of the effects of CN haplotypes on contents of milk protein fractions are reported in Table
7. Casein haplotypes exerted a marked effect on contents of all CN fractions. In agreement with
Hallén et al. (2008), alleles at CSN2 and CSN3 affected the expression of the protein fraction which
the locus encodes for and had limited effects on whey protein fractions. Only a few studies
investigated milk protein composition, mainly in relation to effects of CN genotypes (Ng-Kwai-
Hang et al., 1987; Bobe et al., 1999; Hallén et al., 2008) whereas effects exerted by CN haplotypes
on milk protein composition have been investigated only by Heck et al. (2009). In that study, only
the glyco-free κ-CN content was assessed because the glycosylated form was not detectable.
Because Coolbear et al. (1996) showed that the κ-CN B variant is highly glycosylated when
compared with the A variant, the effect of CSN3 B on total content of κ-CN might have been
underestimated in the study by Heck et al. (2009).
In our study, the increased CN content (P < 0.001) due to the presence in the haplotype of CSN3 B
in comparison with CSN3 A was exclusively determined by a significant increase in κ-CN content,
with no effects on contents of other protein fractions. Despite several authors (Van Eenennaam and
Medrano, 1991; Robitaille and Petitclerc, 2000; Vachon et al., 2004) reported an allele-specific
protein expression for CSN3 locus, others (Ehrmann et al., 1997; Hallén et al., 2008) found no
significant differences between expressions of allele A and B at CSN3. As possible explanation of
these inconsistencies, Robitaille and Petitclerc (2000) suggested that a differential expression might
result from polymorphisms in the non-coding region of the gene.
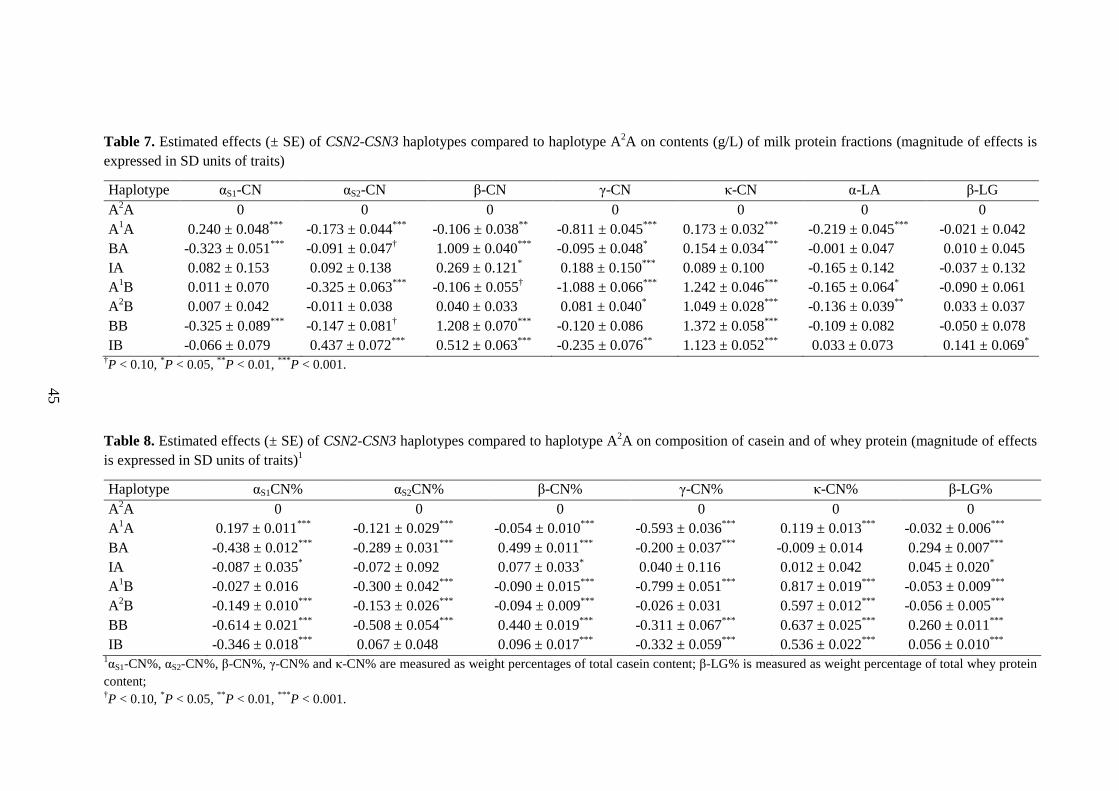
45 45
45 45
Table 7. Estimated effects (± SE) of CSN2-CSN3 haplotypes compared to haplotype A2A on contents (g/L) of milk protein fractions (magnitude of effects is expressed in SD units of traits)
Haplotype αS1-CN αS2-CN β-CN γ-CN κ-CN α-LA β-LG A2A 0 0 0 0 0 0 0 A1A 0.240 ± 0.048*** -0.173 ± 0.044*** -0.106 ± 0.038** -0.811 ± 0.045*** 0.173 ± 0.032*** -0.219 ± 0.045*** -0.021 ± 0.042 BA -0.323 ± 0.051*** -0.091 ± 0.047† 1.009 ± 0.040*** -0.095 ± 0.048* 0.154 ± 0.034*** -0.001 ± 0.047 0.010 ± 0.045 IA 0.082 ± 0.153 0.092 ± 0.138 0.269 ± 0.121* 0.188 ± 0.150*** 0.089 ± 0.100 -0.165 ± 0.142 -0.037 ± 0.132 A1B 0.011 ± 0.070 -0.325 ± 0.063*** -0.106 ± 0.055† -1.088 ± 0.066*** 1.242 ± 0.046*** -0.165 ± 0.064* -0.090 ± 0.061 A2B 0.007 ± 0.042 -0.011 ± 0.038 0.040 ± 0.033 0.081 ± 0.040* 1.049 ± 0.028*** -0.136 ± 0.039** 0.033 ± 0.037 BB -0.325 ± 0.089*** -0.147 ± 0.081† 1.208 ± 0.070*** -0.120 ± 0.086 1.372 ± 0.058*** -0.109 ± 0.082 -0.050 ± 0.078 IB -0.066 ± 0.079 0.437 ± 0.072*** 0.512 ± 0.063*** -0.235 ± 0.076** 1.123 ± 0.052*** 0.033 ± 0.073 0.141 ± 0.069*
†P < 0.10, *P < 0.05, ** P < 0.01, *** P < 0.001.
Table 8. Estimated effects (± SE) of CSN2-CSN3 haplotypes compared to haplotype A2A on composition of casein and of whey protein (magnitude of effects is expressed in SD units of traits)1
Haplotype αS1CN% αS2CN% β-CN% γ-CN% κ-CN% β-LG% A2A 0 0 0 0 0 0 A1A 0.197 ± 0.011*** -0.121 ± 0.029*** -0.054 ± 0.010*** -0.593 ± 0.036*** 0.119 ± 0.013*** -0.032 ± 0.006*** BA -0.438 ± 0.012*** -0.289 ± 0.031*** 0.499 ± 0.011*** -0.200 ± 0.037*** -0.009 ± 0.014 0.294 ± 0.007*** IA -0.087 ± 0.035* -0.072 ± 0.092 0.077 ± 0.033* 0.040 ± 0.116 0.012 ± 0.042 0.045 ± 0.020* A1B -0.027 ± 0.016 -0.300 ± 0.042*** -0.090 ± 0.015*** -0.799 ± 0.051*** 0.817 ± 0.019*** -0.053 ± 0.009*** A2B -0.149 ± 0.010*** -0.153 ± 0.026*** -0.094 ± 0.009*** -0.026 ± 0.031 0.597 ± 0.012*** -0.056 ± 0.005*** BB -0.614 ± 0.021*** -0.508 ± 0.054*** 0.440 ± 0.019*** -0.311 ± 0.067*** 0.637 ± 0.025*** 0.260 ± 0.011*** IB -0.346 ± 0.018*** 0.067 ± 0.048 0.096 ± 0.017*** -0.332 ± 0.059*** 0.536 ± 0.022*** 0.056 ± 0.010***
1αS1-CN%, αS2-CN%, β-CN%, γ-CN% and κ-CN% are measured as weight percentages of total casein content; β-LG% is measured as weight percentage of total whey protein
content; †P < 0.10, *P < 0.05, ** P < 0.01, *** P < 0.001.

46
An allele-specific differential expression was reported also for CSN2. In agreement with previous
investigations (Ng-Kwai-Hang et al., 1987; Hallén et al., 2008), our study clearly indicates that
allele CSN2 B is associated with an increased β-CN content and effects of alternative CSN2 alleles
are significant but of smaller magnitude than the one exerted by allele B. The increased expression
of β-CN observed for haplotypes carrying CSN2 B was associated to a decrease of αS1-CN and, to a
lesser extent, of αS2-CN. Effects of CSN2 B were favorable also for content of κ-CN whereas those
on WH content were trivial.
In comparison with haplotypes including allele CSN2 A2, haplotypes containing allele A1 showed
lower β- and αS2-CN contents and greater αS1- and κ-CN contents, but a major effect exerted by A1
allele was a noticeable reduction of γ-CN content. Effects of CSN2 I have never been studied before
and knowledge about its role for protein composition has never been reported. From results
obtained in this study, CSN2 I seems to exert positive effects on the expression of β-CN, when
compared with the most frequent alleles, without altering contents of other protein fractions.
Casein haplotypes exerted limited effects on whey proteins contents. Bobe et al. (1999) reported
that CSN3 B did not affect α-LA concentration whereas Ng-Kwai-Hang et al. (1987) and Heck et al.
(2009) observed a slightly decrease of α-LA associated with this allele. A moderate positive effect
of haplotype IB on β-LG was observed, which partially agree with results obtained by Bobe et al.
(1999), who reported a slightly increase of the ratio of β-LG to total protein in relation to CSN3 B.
Effect of Casein Haplotypes on Protein Composition
Effects of CN haplotypes on protein composition are reported in Table 8. Several studies (Lunden
et al., 1997; Mayer et al., 1997; Robitaille et al., 2002) reported a significant effect of CSN3 alleles
on the ratio of κ-CN to total casein and a significant association of allele B with increased κ-CN%.
As expected, all haplotypes carrying CSN3 B increased κ-CN% (P < 0.001) in comparison with
those carrying CSN3 A. This result is consistent across studies (Van Eenennam and Medrano, 1991;
Bobe et al., 1999; Heck et al., 2009). Similarly to results obtained for contents of milk protein
fractions, the marked increase of κ-CN% associated with CSN3 B occurred at the expense of all
other casein fractions, with the exception of β-CN%. A marked decrease of αS1-CN relative content
in CN, associated with CSN3 B variant, has been reported also in other studies (Bobe et al., 1999;
Hallén et al., 2008; Heck et al., 2009). The inverse relationship between κ-CN% and αS1-CN%
supports the hypothesis that specific proteins compete for expression in the mammary gland
(McClenaghan et al., 1995).
With respect to CSN2 alleles, they exhibited different effects on protein composition both in
magnitude and in sign. As an example, haplotypes including CSN2 B were associated with
increased β-CN% in comparison with alternative haplotypes. As observed for protein fractions

47
contents, the increased β-CN% associated with haplotypes carrying CSN2 B occurred mostly at the
expense of αS1-CN% and, to a lesser extent, of αS2-CN%, without altering relative content of κ-CN.
Fractions β-CN and αS1-CN seem to undergo a competitive synthesis and their relative contents in
CN were inversely related (r = -0.51; P < 0.001). Consequently, haplotypes which influenced
positively β-CN% exerted opposite effects on αS1-CN%. Likely, milk proteins, in particular αS1- and
β-CN, are co-regulated. According to Bobe et al. (1999), a limited pool of transcriptional factors or
amino acids or both might explain how a gene sequence can influence the synthesis of other
abundant milk proteins, primarily αS1-CN. In opposition to results obtained for proteins contents,
haplotypes including CSN2 B were also associated with a variation of whey protein composition,
namely an increased relative content of β-LG.
In agreement with Heck et al. (2009), haplotypes carrying allele CSN2 A1 were associated with
greater αS1-CN% and κ-CN% and with lower αS2-CN% and β-CN% in comparison with haplotypes
carrying CSN2 A2. In addition, a marked decrease of γ-CN% was observed for haplotypes carrying
CSN2 A1 allele.
Also the effects exerted by CSN2 I on both contents and composition of milk proteins were very
similar, with a slightly positive effect on the relative content of β-CN, compared with alleles A1 and
A2. Even in this case, the increase in β-CN% was associated with a decrease of αS1-CN%.
Conversely with the findings obtained for whey fractions contents, whey composition was
significantly affected by casein haplotypes, but the strongest effect was attributable to CSN2 B, as
reported above.
Effect of BLG Genotypes on Contents of Protein Fractions and on Protein Composition
Effects of BLG genotypes on contents of protein fractions and on protein composition are reported
in Table 9. Genotypes at BLG significantly influenced contents of protein fractions and protein
composition. In comparison with genotype AA, genotype BB was associated with increased PRT
and TCN and with decreased WH in milk (all P < 0.001). As a consequence, allele BLG B was also
responsible for an increase of CI (P < 0.001). These results are in agreement with those reported by
Braunschweig et al. (2000). Hallén et al. (2008) reported a negative association between BLG B and
PRT whereas Bobe et al. (1999) found no effect of BLG genotypes on PRT. Inconsistencies of
results across studies might be partly attributed to different breeds and to the limited size of
investigated samples used in some studies.
In comparison with BLG A, allele B at BLG influenced contents of all protein fractions
(all P < 0.05) and increased β-LG% (P < 0.001), by regulating the relative amount of β-LG in WH,
but exerted trivial effects on CN composition. The large effect of BLG genotypes on β-LG content
of milk has been previously attributed to differences in the expression of the whey protein caused

48
by polymorphisms in the promoter region of the gene which is physically linked to BLG (Wagner et
al., 1994; Lum et al., 1997; Folch et al., 1999). Differences in the stability of mRNA derived from
A and B alleles have been also suggested (Heck et al., 2009) as a possible explanation for variation
of β-LG content across BLG genotypes. Heck et al. (2009) reported that BLG genotypes explained
90% of total genetic variation of relative concentration of β-LG in milk protein.
Table 9. Estimated effects (± SE) of BLG genotypes compared to genotype AA on protein, casein, and whey protein contents (g/L), casein number (%), protein fractions contents (g/L) and protein composition (%) measured by reversed-phase HPLC (magnitude of effect is expressed in SD units of traits)1
Trait Genotype Additive deviation
Dominance deviation AB BB
Protein2 0.085 ± 0.039* 0.191 ± 0.052*** 0.095 ± 0.026*** -0.010 ± 0.034 Casein3 0.131 ± 0.039*** 0.314 ± 0.052*** 0.157 ± 0.026*** -0.026 ± 0.034 Whey protein4 -0.188 ± 0.039*** -0.540 ± 0.051*** -0.270 ± 0.026*** 0.082 ± 0.033* Casein number5 0.442 ± 0.039*** 1.183 ± 0.052*** 0.591 ± 0.026*** -0.149 ± 0.034*** Prot. fract. contents αS1-CN 0.158 ± 0.043*** 0.361 ± 0.057*** 0.180 ± 0.028*** -0.023 ± 0.037 αS2-CN 0.076 ± 0.039† 0.140 ±0.052** 0.070 ±0.026** 0.006 ±0.034 β-CN 0.072 ± 0.034* 0.227 ± 0.044*** 0.114 ± 0.022*** -0.041 ± 0.029 γ-CN 0.092 ± 0.042* 0.075 ± 0.052 0.038 ± 0.026 0.054 ± 0.036 κ-CN 0.072 ± 0.028* 0.187 ± 0.037*** 0.094 ± 0.019*** -0.022 ± 0.024 α-LA -0.018 ± 0.040 0.345 ± 0.052*** 0.172 ± 0.026*** -0.191 ± 0.034*** β-LG -0.216 ± 0.037*** -0.764 ± 0.050*** -0.382 ± 0.025*** 0.166 ± 0.032*** Protein composition6 αS1-CN% 0.037 ± 0.026* 0.072 ± 0.035* 0.036 ± 0.017* 0.002 ± 0.023 αS2-CN% -0.018 ± 0.041* -0.095 ± 0.055† -0.047 ± 0.028† 0.029 ± 0.036 β-CN% -0.054 ± 0.027* -0.015 ± 0.035 -0.008 ± 0.018 -0.047 ± 0.023* γ-CN% 0.035 ± 0.043 -0.053 ± 0.055 -0.027 ± 0.027 0.061 ± 0.037† κ-CN% 0.022 ± 0.023 0.046 ± 0.031 0.023 ± 0.015 -0.001 ± 0.020 β-LG% -0.171 ± 0.037*** -1.040 ± 0.049*** -0.520 ± 0.024*** 0.349 ± 0.032***
1Additive deviation was computed as )ˆˆ(5.0 AABLGBBBLG ββ −× where BBBLGβ and AABLGβ are model solutions for
BLG BB and AA genotypes, respectively; dominance deviation was computed as
)ˆˆ(5.0ˆAABLGBBBLGABBLG βββ +×− where ABBLGβ is the model solution for BLG AB genotype;
2Protein = αS1-CN + αS2-CN + β-CN + γ-CN + κ-CN + β-LG + α-LA; 3Casein = αS1-CN + αS2-CN + β-CN + γ-CN + κ-CN; 4Whey protein = β-LG + α-LA ; 5Casein number = (casein/protein) × 100; 6αS1-CN%, αS2-CN%, β-CN%, γ-CN% and κ-CN% are measured as weight percentages of total casein content; β-LG%
is measured as weight percentage of total whey protein content.; †P < 0.10, *P < 0.05, ** P < 0.01, *** P < 0.001.
Consistently, Bobe et al. (1999) concluded that BLG genotypes regulate almost solely the
proportion of β-LG in total milk protein. Significant dominance effects were estimated in our study

49
in relation to both content and composition of whey protein whereas these effects were trivial for
CN fractions contents and CN composition.Less investigated is the effect of BLG genotypes on
relative concentrations of individual CN fractions and use of different breeds might partly explain
inconsistencies of results. In our study, genotypes at BLG affected TCN and CI, with no effect on
CN composition with the exception of a very small increase of αS1-CN% (P < 0.05) and decrease of
αS2-CN% (P < 0.1) associated with genotype BB. Previous investigations (Ng-Kwai-Hang et al.,
1987; Heck et al., 2009) reported that the increased relative concentration of β-LG associated with
A variant was counterbalanced by a decreased relative content of all other fractions in milk protein,
especially β-CN and αS1-CN. Likewise, Bobe et al. (1999) concluded that the A allele at BLG
increased the proportion of β-LG at the expense of αS1-CN and β-CN relative concentrations. For all
those studies, these results were partly expected because concentrations of casein fractions were
expressed as weight percentages of total milk protein, albeit variation of casein composition due to
BLG alleles remains noticeable. Mechanisms causing the effect of BLG locus on relative contents of
the other milk proteins are currently unknown.
Based on these results, breeding practices aimed to increase the frequency of BLG B in the
Simmental cattle population are expected to affect the composition of whey protein and to increase
CN content with trivial effects on casein composition. As discussed by Heck et al. (2009), a lack of
change of casein composition ensures that selection for BLG B allele does not affect cheese quality
and, therefore, is beneficial for increasing cheese yield with no negative effects on cheese
properties.
Contribution of Additive Genetic Variance to Total Variance of Protein Fractions Contents
Estimates of additive genetic variances (data not presented in tables) indicate that the polygenic
background of the cow affects variation of protein fractions contents, even when effects of casein
haplotypes and BLG genotypes are accounted for by the statistical model. Estimated additive
genetic variance was 38 and 39 % of total variance, for αS2-CN and β-LG contents, respectively.
The effect of the sire of the cow on variation of γ-CN content was trivial and ratios of additive
genetic variance to total variance observed for β-CN and α-LA contents were low, ranging from 14
to 16 %. For all other protein fractions contents, additive genetic variance to total variance ranged
from 21 % to 32 %. Results for protein composition were similar to those obtained for protein
contents. Although genetic variation of protein fractions contents and protein composition is greatly
attributable to casein haplotypes and BLG genotypes, the effect of the polygenic background of the
animal is noteworthy. Besides milk protein genes, other loci are responsible of variation of protein
fractions contents and protein composition. Estimation of genetic parameters for milk protein
fractions contents and composition will be the objective of future investigations.

50
CONCLUSIONS
Our results indicate that CSN2-CSN3 haplotypes and BLG genotypes play an important role for
variation of milk protein fractions contents and milk protein composition. This suggests that
increasing the frequency of specific genotypes or haplotypes might be an effective way for altering
milk protein composition. The marked effects of casein haplotypes and BLG genotypes on protein
composition, together with the lack of effects on milk production traits, ensure that altering milk
protein composition does not interfere with yield traits. In addition to milk protein loci, polygenes
affect phenotypic variation of concentrations of milk protein fractions and their relative contents in
total milk protein. Genetic variation of protein composition might be exploited in breeding
programs aiming to enhance milk renneting properties and cheese yield or to obtain milk with
increased contents of specific protein fractions. Currently, knowledge concerning the effects of milk
protein composition, casein haplotypes and BLG genotypes on the technological properties of milk,
as well as availability of estimated genetic parameters for protein composition, is scarce and
requires specific investigations.
ACKNOWLEDGMENTS
The authors like to thank ANAPRI (Udine, Italy) for having provided pedigree information,
AAFVG (Codroipo, Italy) and the milk recording agencies of Treviso, Vicenza, and Padova for the
organization of herd sampling. Alessandra Stella is gratefully acknowledged for having provided
the software for computation of haplotype probabilities. Financial support by Regione del Veneto
(Azione Biotech III Bis, Delibera CIPE n. 03, 03/22/2006) and the University of Padova
(CPDA067387) is also gratefully acknowledged.
REFERENCES
Amigo, L., P. J. Martin-Alvarez, E. Garcia-Muro, and I. Zarazaga. 2001. Effect of milk protein haplotypes on the composition and technological properties of Fleckvieh bovine milk. Milchwissenshaft 56:488–491.
Bobe, G., D. C. Beitz, A. E. Freeman, and G. L. Lindberg. 1999. Effect of milk protein genotypes on milk protein composition and its genetic parameter estimates. J. Dairy Sci. 82:2797–2804.
Bobe, G., G. L. Lindberg, A. E. Freeman, and D. C. Beitz. 2007. Short communication: composition of milk protein and milk fatty acids is stable for cows differing in genetic merit for milk production. J. Dairy Sci. 90:3955–3960.
Boettcher, P. J., A. Caroli, A. Stella, S. Chessa, E. Budelli, F. Canavesi, S. Ghiroldi, and G. Pagnacco. 2004a. Effects of casein haplotypes on milk production traits in Italian Holstein and Brown Swiss cattle. J. Dairy Sci. 87:4311–4317.
Boettcher, P. J., G. Pagnacco, and A. Stella. 2004b . A Monte Carlo approach for estimation of haplotype probabilities in half-sib families. J. Dairy Sci. 87:4303–4310.
Bonfatti, V., L. Grigoletto, A. Cecchinato, L. Gallo, and P. Carnier. 2008. Validation of a new reversed-phase high-performance liquid chromatography method for separation and identification of bovine milk protein genetic

51
variants. J. Chromatogr. A 1195:101–106. Bovenhuis, H., J. A. M. van Arendonk, and S. Korver. 1992. Associations between milk protein polymorphisms and
milk production traits. J. Dairy Sci. 75:2549–2559. Braunschweig, M., C. Hagger, G. Stranzinger, and Z. Puhan. 2000. Associations between casein haplotypes and milk
production traits of Swiss Brown cattle. J. Dairy Sci. 83:1387–1395. Coolbear, K. P., D. F. Elgar, and J. S. Ayers. 1996. Profiling of genetic variants of bovine kappa-casein macropeptide
by electrophoretic and chromatographic techniques. Int. Dairy J. 6:1055–1068. Ehrmann, S., H. Bartenschlager, and H. Gendermann. 1997. Quantification of gene effects on single milk proteins in
selected groups of dairy cows. J. Anim. Breed. Genet. 114:49–53. Ferretti, L., P. Leone, and V. Sgaramella. 1990. Long range restriction analysis of the bovine casein genes. Nucleic
Acids Res. 18:6829–6833. Folch, J. M., P. Dovc, and J. F. Medrano. 1999. Differential expression of bovine beta-lactoglobulin A and B promoter
variants in transiently transfected HC11 cells. J. Dairy Res. 66:537–544. Graml, R., and F. Pirchner. 2003. Effects of milk protein loci on content of their proteins. Arch. Tierz. Dummerstorf
46:331–340. Hallén, E., Wedholm A., A. Andrén, and A. Lundén. 2008. Effect of β-casein, κ-casein and β-lactoglobulin genotypes
on concentration of milk protein variants. J. Anim. Breed. Genet. 17:791–799. Hill, W. G., and A. Robertson. 1968. Linkage disequilibrium in finite populations. Theor. Appl. Genet. 38:226–231. Heck, J. M. L., A. Schennink, H. J. F. van Valenberg, H. Bovenhuis, M. H. P. W. Visker, J. A. M. van Arendonk, and
A. C. M. van Hooijdonk. 2009. Effects of milk protein variants on the protein composition of bovine milk. J. Dairy Sci. 92:1192–1202.
Ikonen, T., K. Ahlfors, R. Kempe, M. Ojala, and O. Ruottinen. 1999a. Genetic parameters for the milk coagulation properties and prevalence of noncoagulating milk in Finnish dairy cows. J. Dairy Sci. 82:205–214.
Ikonen, T., M. Ojala, and O. Ruottinen. 1999b. Associations between milk protein polymorphism and first lactation milk production traits in Finnish Ayrshire cows. J. Dairy Sci. 82:1026–1033.
Ikonen, T., H. Bovenhuis, M. Ojala, O. Ruottinen, and M. Georges. 2001. Associations between casein haplotypes and first lactation milk production traits in Finnish Ayrshire cows. J. Dairy Sci. 84:507–514.
Jann O. C, E. M. Ibeagha-Awemu, C. Özbeyaz, P. Zaragoza, J. L. Williams, P. Ajmone-Marsan, J. A. Lenstra, K. Moazami-Goudarzi, and G. Erhardt. 2004. Genet. Sel. Evol. 36 243-257.
Jõudo, I., M. Henno, T. Kaart, T. Püssa, and O. Kärt. 2008. The effect of milk protein contents on the rennet coagulation properties of milk from individual dairy cows. Int. Dairy Sci. 964–967.
Kennedy, B. W., M. Quinton, and J. A. van Arendonk. 1992. Estimation of effects of single genes on quantitative traits. J. Anim. Sci. 70:2000–2012.
Lien, S., L. Gomez-Raya, T. Steine, E. Fimland, and S. Rogne. 1995. Associations between casein haplotypes and milk yield traits. J. Dairy Sci.78:2047–2056.
Lum, L. S., P. Dovc, and J. F. Medrano. 1997. Polymorphisms of bovine beta-lactoglobulin promoter and differences in the binding affinity of activator protein-2 transcription factor. J. Dairy Sci. 80:1389–1397.
Lunden, A., M. Nilsson, and L. Janson. 1997. Marked effect of betalactoglobulin polymorphism on the ratio of casein to total protein in milk. J. Dairy Sci. 80:2996–3005.
Martin, P., M. Szymanowska, L. Zwierzchowski, and C. Leroux. 2002. The impact of genetic polymorphisms on the protein composition of ruminant milks. Reprod. Nutr. Dev. 42:433–459.
Matějíček, A., J. Matějíčková, M. Štípková, O. Hanuš, V. Genčurová, J. Kyseľová, E. Němcová, T. Kott, J. Šefrová, M. Krejčová, S. Melčová, I. Hölzelová, J. Bouška, J. Frelich. 2008. Joint effects of CSN3 and LGB genes on milk quality and coagulation properties in Czech Fleckvieh. Czech J. Anim. Sci., 53:246–252.
Mayer, H. K., M. Ortner, E. Tschager, and W. Ginzinger. 1997. Composite milk protein phenotypes in relation to composition and cheesemaking properties of milk. Int. Dairy J. 7:305–310.
McClenaghan M., A. Springbett, R. M. Wallace, C. J. Wilde, and A. J. Clark. 1995. Secretory proteins compete for production in the mammary-gland of transgenic mice. Biochem. J., 310:637–641.
Ng-Kwai-Hang, K. F., J. F. Hayes, J. E. Moxley, and H. G. Monardes. 1987. Variation in milk protein concentrations associated with genetic polymorphism and environmental factors. J. Dairy Sci. 70:563–570.
Ojala, M., T. R. Famula, and J. F. Medrano. 1997. Effects of milk protein genotypes on the variation for milk production traits of Holstein and Jersey cows in California. J. Dairy Sci. 80:1776–1785.
Perez-Rodriguez, M. L., P. J. Martin-Alvarez, M. Ramos, E. García-Muro, I. Zarazaga and L. Amigo. 1998 Genetic polymorphism of bovine milk proteins in Holstein-Friesian and Fleckvieh breeds exploited in Spain. Milchwissenschaft 53:543–546.

52
Robitaille, G. and D. Petitclerc. 2000. Expression polymorphism of κ-casein gene in Holstein cows. J. Dairy Res. 67:107–111.
Robitaille, G., M. Britten, J. Morisset, and D. Petitclerc. 2002. Quantitative analysis of beta-lactoglobulin A and B genetic variants in milk of cows beta-lactoglobulin AB throughout lactation. J. Dairy Res. 69:651–654.
Schaar, J. 1984. Effects of κ-casein genetic variants and lactation number on the renneting properties of individual milks. J. Dairy Res. 51:397–406.
Schaar, J., B. Hansson, and H. E. Pettersson. 1985. Effects of genetic variants of κ-casein and β-lactoglobulin on cheesemaking. J. Dairy Res. 52:429–437.
Schopen, G. C. B., J. M. L. Heck, H. Bovenhuis, M. H. P. W. Visker, H. J. F. van Valenberg, and J. A. M. van Arendonk. 2009. Genetic parameters for major milk proteins in Dutch Holstein-Friesians. J. Dairy Sci. 92:1182–1191.
Threadgill, D. W., and J. E. Womack. 1990. Genomic analysis of the major bovine milk protein gene. Nucleic Acids Res. 18:6935–6942.
Vachon, D., M. Britten, J. Morisset, D. Petitclerc, and G. Robitaille. 2004. Differential allele-specific accumulation of bovine kappa-casein mRNA throughout lactation. J. Dairy Res. 71:405–408.
Van Eenennaam, A. L., and J. F. Medrano. 1991. Differences in allelic protein expression in the milk of heterozygous kappa-casein cows. J. Dairy Sci. 74:1491–1496.
Wagner, V. A., T. A. Schild, and H. Geldermann. 1994. DNA variants within the 5´-flanking region of milk-protein-encoding genes. II. The beta-lactoglobin-encoding gene. Theor. Appl. Genet. 89:121–126.
Wedholm, A., L. B. Larsen, H. Lindmark-Månsson, A. H. Karlsson, and A. Andrén. 2006. Effect of protein composition on the cheesemaking properties of milk from individual dairy cows. J. Dairy Sci. 89:3296–3305.
Zhao, H., D. Nettleton, M. Soller, and J. C. M. Dekkers. 2005. Evaluation of linkage disequilibrium measures between multiallelic markers as predictors of linkage disequilibrium between markers and QTL. Genet. Res. 86:77–87.

53
Chapter 3.
Effects of CSN2-CSN3 haplotype, BLG genotype and detailed
protein composition on coagulation properties of individual
milk of Simmental cows
V. Bonfatti,* G. Di Martino,* A. Cecchinato,* L. Degano,† and P. Carnier*
*Department of Animal Science, University of Padova, viale dell’Università 16, 35020, Legnaro,
Padova, Italy †Italian Simmental Cattle Breeders Association, via Nievo 19, 33100, Udine, Italy
Submitted to Journal of Dairy Science


55
Effects of CSN2-CSN3 haplotypes, BLG genotypes and detailed protein composition on
coagulation properties of individual milk of Simmental cows
V. Bonfatti, * G. Di Martino, * A. Cecchinato,* L. Degano,† and P. Carnier* *Department of Animal Science, University of Padova, viale dell’Università 16, 35020, Legnaro,
Padova, Italy †Italian Simmental Cattle Breeders Association, via Nievo 19, 33100, Udine, Italy
ABSTRACT
The aim of this study was to investigate the effects of CSN2-CSN3 (β-κ-casein) haplotypes, BLG
(β-Lactoglobulin) genotypes, contents of milk protein fractions and protein composition on
coagulation properties of milk (MCP). Rennet coagulation time (RCT) and curd firmness (a30)
were measured using a computerized renneting meter and contents of major milk protein fractions
were quantified by reversed-phase HPLC in individual milk of 2,167 Simmental cows. Cow
genotype at CSN2, CSN3, and BLG loci was assessed by HPLC. Haplotype probabilities were
estimated for each cow. Phenotypes for MCP were regressed on these probabilities using linear
models that included the effects of herd-test day, parity, days in milk, pH, somatic cell score,
renneting meter sensor, sire of the cow, and, contents of major protein fractions or, alternatively,
protein composition. When protein fractions contents or protein composition were not included in
the statistical model, haplotypes carrying CSN3 B allele exhibited shorter RCT and greater a30, in
comparison with those carrying CSN3 A, and haplotypes carrying CSN2 B allele were responsible
for a noticeable decrease of RCT and for an increase of a30, when compared to haplotype A2A.
When effects of protein fractions contents or of protein composition were added to the model, no
difference across haplotypes due to CSN3 and CSN2 alleles was observed for MCP, with the
exception of the effect of CSN2 B on RCT, which remained markedly favorable. Hence, the effect
exerted by κ-casein (κ-CN) B on MCP is related to a variation of protein composition caused by the
allele-specific expression of this protein fraction, rather than to a direct role of the protein variant on
the coagulation process. Also, the favorable effect exerted by CSN2 B on a30 was mediated by the

56
increase of β-casein (β-CN) B in milk. Conversely, β-CN B is likely to exert a molecular effect on
RCT, which does not depend upon variation of β-CN content associated to allele B. An increased
RCT was observed for milk yielded by BLG BB cows, even when models accounted for protein
composition. Rennet clotting time was favorably affected by κ-CN content and percentage on total
casein, whereas a30 increased when contents and percentages of both β-CN and κ-CN increased.
Changes in milk protein composition exert correlated effects on MCP and changes in frequency of
specific allelic variants at CN and whey protein loci might be beneficial or detrimental for MCP.
INTRODUCTION
Coagulation ability of milk is influenced by several factors including genetic polymorphisms of
milk proteins (Schaar et al., 1985; Mayer et al., 1997; Ikonen et al., 1999b). Rennet clotting time
(RCT) and curd firmness (a30) have been reported to be affected also by milk protein composition
(Wedholm et al., 2006; Jõudu et al., 2008). Previous studies investigated the effects of milk protein
polymorphisms either on coagulation properties (Buchberger and Dovč, 2000) or on protein
composition (Hallén et al., 2008; Heck et al., 2009; Bonfatti et al., 2009). Because simultaneous
assessment of all major milk proteins contents is difficult and time-consuming when the amount of
samples is large, the effect of protein composition on milk coagulation properties (MCP) has been
scarcely investigated and existing studies have been carried out on bulk milk samples (Walsh et al.,
1998) or on limited numbers of animals (Marziali and Ng-Kwai-Hang, 1986; Wedholm et al.,
2006).
Significant associations between CSN3 (κ-CN) B allele and improved milk coagulation properties
(Van den Berg et al., 1992; Lodes et al., 1996b; Walsh et al., 1998) have been reported. These
studies did not clarify whether detected associations between MCP and genotypes at milk protein
loci were attributable to different structural properties of protein variants or to variation of protein
fractions contents or protein composition related to genetic polymorphisms of milk proteins or both.
As an over-expression of CSN3 B in comparison with CSN3 A has been reported (Hallèn et al.,
2008; Heck et al., 2009; Bonfatti et al., 2009), effects of CSN3 on MCP might result from
differences in casein content of milk or in κ-CN to total CN ratio (i.e., casein composition) across
genotypes. Other factors, like differences in micelle structure (van Eenennam and Medrano, 1991;
Lodes et al., 1996a) or differences in the structure or molecular properties of the curd, may also
contribute to the observed variation of MCP associated to different κ-CN variants. No study
investigated effects of CSN3 genotypes on MCP while accounting for milk protein fractions
contents or protein composition or both using a large sample of animals. Moreover, estimation of
these effects is troublesome for some cattle breeds due to the low frequency of specific genotypes or

57
haplotypes. In comparison with other cattle populations, where frequency of some alleles (e.g.,
CSN3 B or CSN2 B) is very high or very low, the Simmental breed exhibit more balanced allele
frequencies at CSN2, CSN3, and BLG loci and is characterized by a moderate frequency of CSN2 B
(Bonfatti et al., 2009). The aim of this study was to estimate the effects of CN haplotypes, BLG
genotypes, protein fractions contents and protein composition on MCP of individual milk of Italian
Simmental cows.
MATERIALS AND METHODS
Animals and Data
Details on milk samples collection and preservation, measures of protein fractions contents and
protein composition, assessment of genotypes at CSN2, CSN3, and BLG and computation of
CSN2-CSN3 haplotype probabilities can be found in Bonfatti et al. (2009). Briefly, individual milk
samples were collected from 2,167 Simmental cows from 47 commercial herds in Italy. Samples (1
per animal) were collected during the morning or the evening milking of a test day. Herd and test-
day effects were confounded because all cows of a herd were sampled in the same test day. Milk
yield records and pedigree information for sampled cows were supplied by the Italian Simmental
Cattle Breeders Association (ANAPRI, Udine, Italy).
Contents of αS1-CN, αS2-CN, β-CN, γ-CN, κ-CN, β-LG, and α-LA and genotypes of cows at CSN2,
CSN3, and BLG were assessed by reversed-phase HPLC using the method proposed by Bonfatti et
al. (2008). More indications about the method used are reported also by Bonfatti et al. (2009).
Because it was not possible to discriminate CSN1S1 (αS1-CN) alleles by reversed-phase HPLC,
allele frequencies at CSN1S1 were preliminarily investigated by direct DNA-sequencing (Bonfatti
et al., 2009) using 200 randomly-chosen samples. Because of the frequency of CSN1S1 C allele was
lower than 6 %, sequencing was not extended to all samples and CSN1S1 was not considered in the
definition of CN haplotypes.
With such a limited frequency, haplotypes carrying the C allele at CSN1S1 would have been
included in the group of “rare” haplotypes or would have obtained a trivial haplotype probability,
thus limiting the reliability of the estimated haplotype effects and jeopardizing expected advantages
arising from the gain of additional gene information. Furthermore, a very limited bias is to be
expected when neglecting CSN1S1 contribution to haplotype definition.
Due to its low frequency in Simmental cattle (Jann et al., 2004; Matějíček et al., 2008), the
incidence of CSN3 E, which cannot be differentiated from CSN3 A by RP-HPLC, was not assessed.
Thus, the estimated effects for CSN3 A might be slightly biased being the combined effects of
CSN3 A and E variants.

58
Protein Composition
For proteins quantified by RP-HPLC, total casein (TCN, g/L) was computed as the sum of αS1-CN,
αS2-CN, β-CN, γ-CN and κ-CN contents of milk. Total whey protein (WH , g/L) was calculated as
the sum of α-LA and β-LG contents. Total protein (PRT, g/L) was expressed as the sum of casein
and whey protein contents. Casein number (CI , %) was calculated as the percentage ratio of TCN to
PRT. Protein composition (i.e., relative contents of protein fractions) was computed as weight
percentage ratio of αS1-CN (αS1-CN% , %), αS2-CN (αS2-CN% , %), β-CN (β-CN% , %), γ-CN
(γ-CN% , %), and κ-CN (κ-CN% , %) to TCN and as the percentage ratio of β-LG to WH (β-LG%,
%).
Analysis of Milk Coagulation Properties
Measures of MCP of individual milk samples were obtained by using the Computerized Renneting
Meter (CRM-48, Polo Trade, Monselice, Italy) within 3 h after sample collection. The principle of
the Computerized Renneting Meter is based on the control of the oscillation, which is driven by an
electromagnetic field, created by a swinging pendulum immerged into the milk container. A survey
system measures differences in the electromagnetic field due to milk coagulation: the greater the
extent of coagulation, the smaller the pendulum swing. The analysis produces a diagram as reported
by Dal Zotto et al. (2008).
Milk samples (10 mL) were preheated at 35 °C, and 200 µL of rennet (Hansen standard 160, 80 %
chymosin, 1:14,900, Pacovis Amrein AG, Bern, Switzerland) diluted to 1.6 % (vol/vol) in distilled
water was added to milk. Measurement of MCP ended within 31 min after rennet addition to
samples. This analysis provided measurements of RCT (the time interval, in minutes, from the
addition of the clotting enzyme to the beginning of the coagulation process) and a30 (the width, in
millimeters, of the diagram at 31 min after the addition of rennet which is a measure of curd
firmness). Non-coagulating milk was defined as milk that did not begin to coagulate within 31 min
after the addition of the clotting enzyme. These samples were not considered in the statistical
analysis because of missing information on coagulation time. Measures of pH (pH-Burette 24,
Crison) were obtained before measurement of MCP.
Statistical Analysis
The effects of casein haplotypes and BLG genotypes on phenotypic variation of MCP were
estimated using 4 linear mixed models with the MIXED procedure of SAS (Version 9.1, SAS
Institute Inc., Cary, NC). The first model (model M1) was:
ijklmnopqpo
h
ijklmnopqmlkjiijklmnopq esire BLGPRpHS SCS DIM P HTDy1a
:aan +++∑++++++==
β

59
where yijklmnopq is an observation on RCT or a30; HTDi is the fixed effect of herd-test day i (i = 1, …,
47); Pj is the fixed effect of parity j of the cow (j = 1: first parity, j = 2: second parity, j = 3: third
parity, j = 4: fourth and later parities); DIMk is the fixed effect of DIM class k (12 classes of 30-d
intervals, with the exception of the last class, which included samples collected at DIM 330 or
greater); SCSl is the fixed effect of SCS class l (6 classes of 1-point intervals, with the exception of
the last class which included records with SCS ≥ 5); Sm is the fixed effect of the renneting meter
sensor m (m = 1, …, 10); pHn is the fixed effect of pH class n (12 classes of 0.02-point intervals,
except for the first class, which included records with pH ≤ 6.62, and the last class, which included
records with pH ≥ 6.82); h is the total number of haplotypes evaluated (h = 8); PRa:ijklmnopq is the
probability that the cow carried haplotype a (a = 1, …, 8), expressed as the expected number of
copies of haplotype a carried by the animal; βa is the regression coefficient on the probability of
haplotype a; BLGo is the fixed effect of BLG genotype o (o = 1: AA, o = 2: AB, o = 3: BB); sirep is
the random effect of the sire of the cow (p = 1, …, 210) assumed to follow a normal distribution
with sirep ( )2 , ~ sN σ0 , where 2sσ is the sire variance; and eijklmnopq is a random residual assumed to
follow a normal distribution with eijklmnopq ( )2 , ~ eN σ0 , where 2eσ is the residual variance.
A probability (ranging from 0 to 1) was assigned to each possible haplotype carried by an animal.
For example, if the only possible haplotype couple was composed by two copies of the same
haplotype, that haplotype gained a final value of 2 because the animal was expected to carry 2
copies of that haplotype, each one with a probability of 1.
Hence, the difference between the estimated regression coefficients for two haplotypes of interest
provides a quantification of the expected change in the phenotype of a given trait when a copy of
the first haplotype is replaced by a copy of the second haplotype. Likewise, in the hypothetical
situation in which 2 animals differ for only one haplotype, the difference between the estimated
coefficients would correspond to the expected difference in the phenotype of the 2 animals for a
given trait (Boettcher et al., 2004a). Only additive effects of haplotypes were estimated and
dominance effects were not considered.
To evaluate the effects of casein haplotypes and BLG genotypes while accounting for contents of
protein fractions or for protein composition, alternative models were considered. For the second
model (model M2), the linear effects due to contents (g/L) of αS1-, αS2-, β-, κ-CN, and β-LG were
added to the effects included in M1. In the third model (model M3) the linear effects due to total
protein content of milk, were added to those of M2. Because effects of protein fractions contents are
evaluated at the same level of total protein content, model M3 is a model that in fact accounts for
protein composition. The last model (model M4) accounted for composition of CN and whey
protein and included regressions on αS1-, αS2-, β-, κ-CN, expressed as weight percentages of total
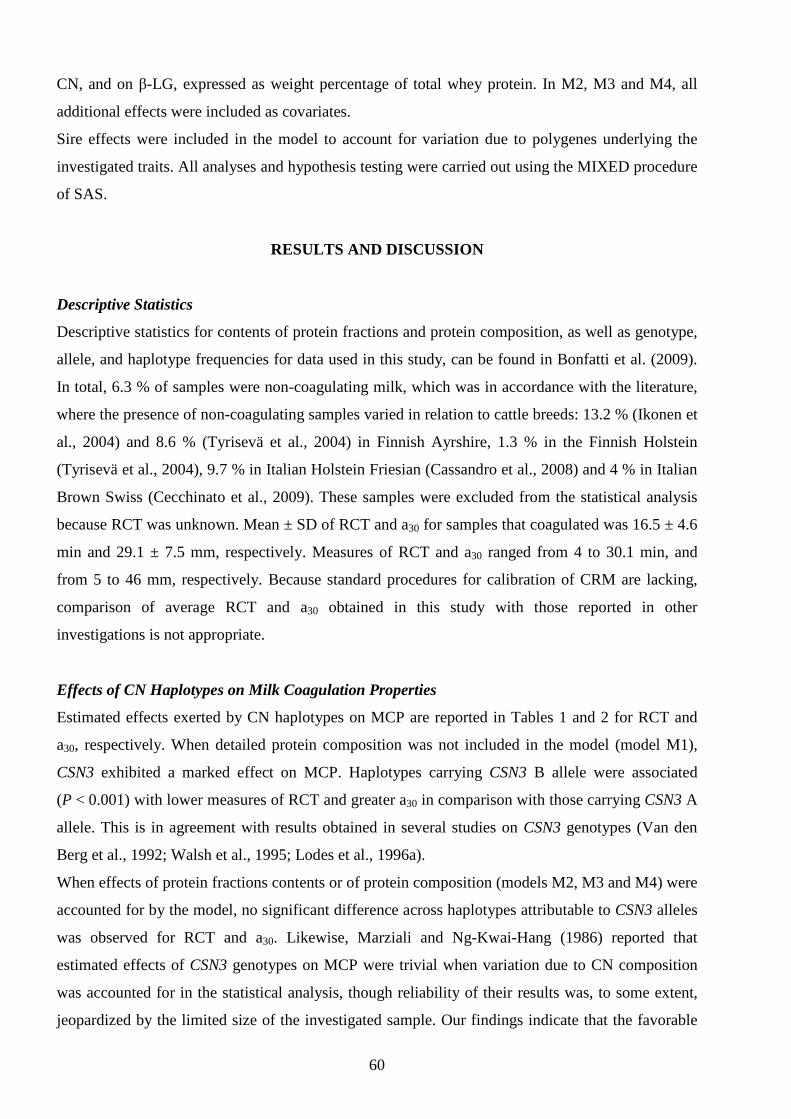
60
CN, and on β-LG, expressed as weight percentage of total whey protein. In M2, M3 and M4, all
additional effects were included as covariates.
Sire effects were included in the model to account for variation due to polygenes underlying the
investigated traits. All analyses and hypothesis testing were carried out using the MIXED procedure
of SAS.
RESULTS AND DISCUSSION
Descriptive Statistics
Descriptive statistics for contents of protein fractions and protein composition, as well as genotype,
allele, and haplotype frequencies for data used in this study, can be found in Bonfatti et al. (2009).
In total, 6.3 % of samples were non-coagulating milk, which was in accordance with the literature,
where the presence of non-coagulating samples varied in relation to cattle breeds: 13.2 % (Ikonen et
al., 2004) and 8.6 % (Tyrisevä et al., 2004) in Finnish Ayrshire, 1.3 % in the Finnish Holstein
(Tyrisevä et al., 2004), 9.7 % in Italian Holstein Friesian (Cassandro et al., 2008) and 4 % in Italian
Brown Swiss (Cecchinato et al., 2009). These samples were excluded from the statistical analysis
because RCT was unknown. Mean ± SD of RCT and a30 for samples that coagulated was 16.5 ± 4.6
min and 29.1 ± 7.5 mm, respectively. Measures of RCT and a30 ranged from 4 to 30.1 min, and
from 5 to 46 mm, respectively. Because standard procedures for calibration of CRM are lacking,
comparison of average RCT and a30 obtained in this study with those reported in other
investigations is not appropriate.
Effects of CN Haplotypes on Milk Coagulation Properties
Estimated effects exerted by CN haplotypes on MCP are reported in Tables 1 and 2 for RCT and
a30, respectively. When detailed protein composition was not included in the model (model M1),
CSN3 exhibited a marked effect on MCP. Haplotypes carrying CSN3 B allele were associated
(P < 0.001) with lower measures of RCT and greater a30 in comparison with those carrying CSN3 A
allele. This is in agreement with results obtained in several studies on CSN3 genotypes (Van den
Berg et al., 1992; Walsh et al., 1995; Lodes et al., 1996a).
When effects of protein fractions contents or of protein composition (models M2, M3 and M4) were
accounted for by the model, no significant difference across haplotypes attributable to CSN3 alleles
was observed for RCT and a30. Likewise, Marziali and Ng-Kwai-Hang (1986) reported that
estimated effects of CSN3 genotypes on MCP were trivial when variation due to CN composition
was accounted for in the statistical analysis, though reliability of their results was, to some extent,
jeopardized by the limited size of the investigated sample. Our findings indicate that the favorable
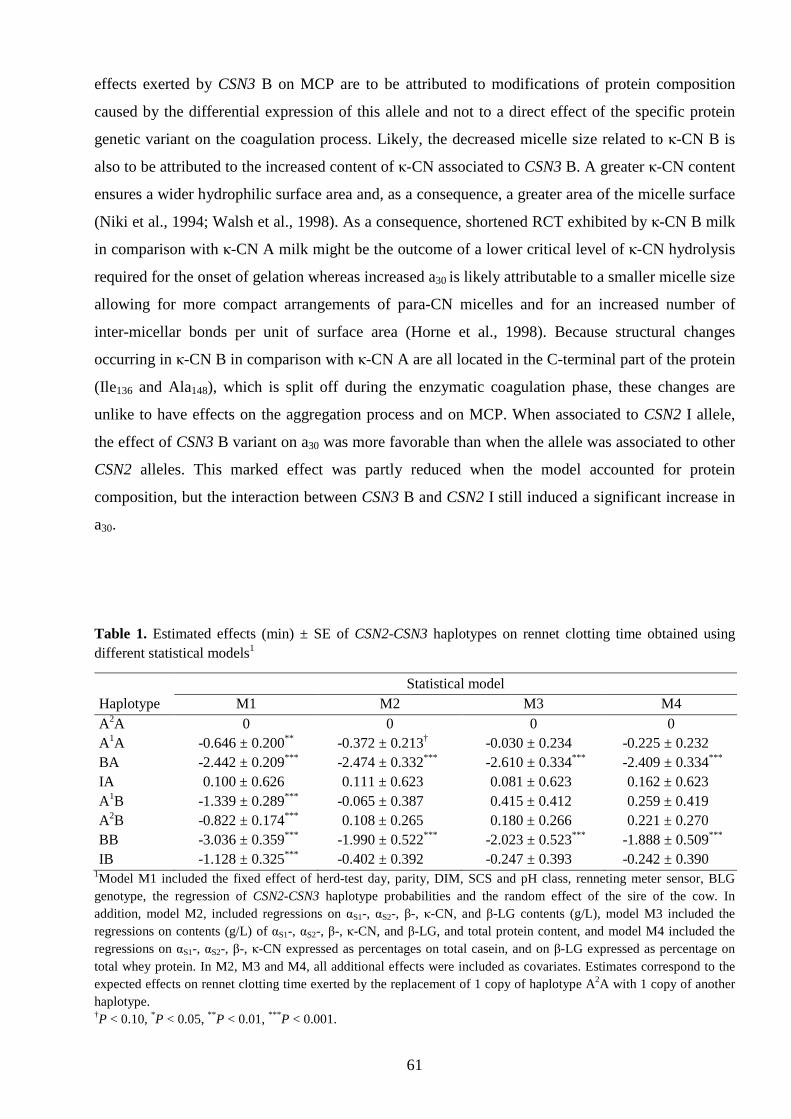
61
effects exerted by CSN3 B on MCP are to be attributed to modifications of protein composition
caused by the differential expression of this allele and not to a direct effect of the specific protein
genetic variant on the coagulation process. Likely, the decreased micelle size related to κ-CN B is
also to be attributed to the increased content of κ-CN associated to CSN3 B. A greater κ-CN content
ensures a wider hydrophilic surface area and, as a consequence, a greater area of the micelle surface
(Niki et al., 1994; Walsh et al., 1998). As a consequence, shortened RCT exhibited by κ-CN B milk
in comparison with κ-CN A milk might be the outcome of a lower critical level of κ-CN hydrolysis
required for the onset of gelation whereas increased a30 is likely attributable to a smaller micelle size
allowing for more compact arrangements of para-CN micelles and for an increased number of
inter-micellar bonds per unit of surface area (Horne et al., 1998). Because structural changes
occurring in κ-CN B in comparison with κ-CN A are all located in the C-terminal part of the protein
(Ile136 and Ala148), which is split off during the enzymatic coagulation phase, these changes are
unlike to have effects on the aggregation process and on MCP. When associated to CSN2 I allele,
the effect of CSN3 B variant on a30 was more favorable than when the allele was associated to other
CSN2 alleles. This marked effect was partly reduced when the model accounted for protein
composition, but the interaction between CSN3 B and CSN2 I still induced a significant increase in
a30.
Table 1. Estimated effects (min) ± SE of CSN2-CSN3 haplotypes on rennet clotting time obtained using different statistical models1
Statistical model Haplotype M1 M2 M3 M4 A2A 0 0 0 0 A1A -0.646 ± 0.200** -0.372 ± 0.213† -0.030 ± 0.234 -0.225 ± 0.232 BA -2.442 ± 0.209*** -2.474 ± 0.332*** -2.610 ± 0.334*** -2.409 ± 0.334*** IA 0.100 ± 0.626 0.111 ± 0.623 0.081 ± 0.623 0.162 ± 0.623 A1B -1.339 ± 0.289*** -0.065 ± 0.387 0.415 ± 0.412 0.259 ± 0.419 A2B -0.822 ± 0.174*** 0.108 ± 0.265 0.180 ± 0.266 0.221 ± 0.270 BB -3.036 ± 0.359*** -1.990 ± 0.522*** -2.023 ± 0.523*** -1.888 ± 0.509*** IB -1.128 ± 0.325*** -0.402 ± 0.392 -0.247 ± 0.393 -0.242 ± 0.390
1Model M1 included the fixed effect of herd-test day, parity, DIM, SCS and pH class, renneting meter sensor, BLG genotype, the regression of CSN2-CSN3 haplotype probabilities and the random effect of the sire of the cow. In addition, model M2, included regressions on αS1-, αS2-, β-, κ-CN, and β-LG contents (g/L), model M3 included the regressions on contents (g/L) of αS1-, αS2-, β-, κ-CN, and β-LG, and total protein content, and model M4 included the regressions on αS1-, αS2-, β-, κ-CN expressed as percentages on total casein, and on β-LG expressed as percentage on total whey protein. In M2, M3 and M4, all additional effects were included as covariates. Estimates correspond to the expected effects on rennet clotting time exerted by the replacement of 1 copy of haplotype A2A with 1 copy of another haplotype. †P < 0.10, *P < 0.05, ** P < 0.01, *** P < 0.001.

62
With model M1, CSN2 alleles exhibited significant effects on MCP. Haplotypes carrying the B
variant were responsible for a noticeable decrease of RCT (ranging from -2.44 to -3.04 min, in
comparison with haplotype A2A) and for an increase of a30 (ranging from 1.85 to 4.54 mm, in
comparison with haplotype A2A). The effect of CSN2 B on RCT remained markedly favorable
when accounting for contents of protein fractions or protein composition, and an interaction
between CSN2 B and CSN3 A, which decreased RCT, was observed. The reduced magnitude of the
effect of haplotype BB observed with models M2, M3, and M4, in comparison with that obtained
with model M1, is to be ascribed to the adjustment for the effect exerted by CSN3 B variant on
κ-CN content. Different allelic-specific expressions have been reported for β-CN also. Allele CSN2
B has been associated with an increase of β-CN content in milk (Bonfatti et al., 2009) and is likely
to exert a specific molecular effect on RCT, which does not depend upon variation of β-CN content
associated with this allele. The increased net charge of this protein variant, exhibiting one or two
additional net positive charges compared to A1 or A2 variants, respectively, for the presence of two
positively charged amino acids residues (Arg122 and His67), is a possible explanation for direct
effects of β-CN B on MCP. Repulsive forces between casein micelles containing variants like β-CN
B, in which amino acid substitution results in lower negative charge, seem to be weaker in
comparison to micelles containing more negatively charged protein variants (McLean, 1986). As a
consequence, a greater proportion of β-CN B into casein micelles facilitate aggregation.
Table 2. Estimated effects (mm) ± SE of CSN2-CSN3 haplotypes on curd firmness obtained using different statistical models1
Statistical model Haplotype M1 M2 M3 M4 A2A 0 0 0 0 A1A 0.747 ± 0.352* 0.606 ± 0.363† 0.013 ± 0.399 -0.438 ± 0.405 BA 1.848 ± 0.368*** -0.131 ± 0.570 -0.082 ± 0.572 0.858 ± 0.585 IA -1.320 ± 1.116 -1.891 ± 1.074† -1.797 ± 1.071† -1.448 ± 1.098 A1B 2.196 ± 0.511*** 0.272 ± 0.661 -0.595 ± 0.703 -1.355 ± 0.732† A2B 1.832 ± 0.307*** 0.101 ± 0.453 -0.044 ± 0.453 0.049 ± 0.471 BB 4.540 ± 0.638*** 0.184 ± 0.898 0.223 ± 0.895 1.471 ± 0.894 IB 3.163 ± 0.575*** 0.632 ± 0.670 0.397 ± 0.671 0.969 ± 0.681
1Model M1 included the fixed effect of herd-test day, parity, DIM, SCS and pH class, renneting meter sensor, BLG genotype, the regression of CSN2-CSN3 haplotype probabilities and the random effect of the sire of the cow. In addition, model M2, included regressions on αS1-, αS2-, β-, κ-CN, and β-LG contents (g/L), model M3 included the regressions on contents (g/L) of αS1-, αS2-, β-, κ-CN, and β-LG, and total protein content, and model M4 included the regressions on αS1-, αS2-, β-, κ-CN expressed as percentages on total casein, and on β-LG expressed as percentage on total whey protein. In M2, M3 and M4, all additional effects were included as covariates. Estimates correspond to the expected effects on curd firmness exerted by the replacement of 1 copy of haplotype A2A with 1 copy of another haplotype. †P < 0.10, *P < 0.05, ** P < 0.01, *** P < 0.001.

63
The favorable effect of CSN2 B on a30 observed with model M1 was not confirmed by models
accounting for protein fractions contents or protein composition (models M2, M3 and M4),
indicating that effect of CSN2 B was mediated by the increase of β-CN content of milk.
The A1 variant, compared to the most common A2, exerted a positive effect on both RCT and a30, in
particular when associated with κ-CN A. When effects due to associated variation in CN
composition were accounted for by the model, this favorable interaction effect was somewhat
reduced because estimation was performed at the same level of κ-CN% (Heck et al., 2009; Bonfatti
et al., 2009). Results obtained in this study for the effect of CSN2 on MCP partially agree with those
reported by Marziali and Ng-Kwai-Hang (1986), who concluded that, after adjustments for
concentration of major milk protein fractions, MCP were not different across β-CN phenotypes.
That study compared A1 and A2 alleles only because no animal carried CSN2 B.
Effects exerted by CSN2 I on MCP have never been investigated in previous studies and they might
be of interest because of a moderate frequency of this allele in some dairy cattle breeds such as
Italian Holstein Friesian and Jersey (Jann et al., 2002). Although frequency of haplotypes
containing this allele was low, estimated effects indicate that CSN2 I has no influence on RCT,
when compared to A2, and affects a30 unfavorably (P < 0.001) when associated with κ-CN A.
Likewise, variant I might exert, when associated to κ-CN A in the haplotype, a negative effect on
variation of a30, but relevant biochemical mechanisms are currently unknown.
Effect of BLG Genotypes on Milk Coagulation Properties
Effects of BLG genotypes on RCT and a30, as well as estimates of additive and dominance
deviations, are reported in Table 3 and 4, respectively. As expected, magnitude of these effects was
relatively small when compared to that of effects of CN genes because whey proteins are not
directly involved in the milk coagulation process. In agreement with Ikonen et al. (1999a), an
increased RCT was observed for milk yielded by BLG BB cows, even when models accounted for
detailed protein composition. Explanation for the unfavorable effect of β-LG B variant on RCT is
currently unknown. In the literature, results for the effect of BLG genotypes on RCT are
controversial: some authors detected an effect of BLG genotypes on RCT (Ikonen et al., 1999a; Ng-
Kwai-Hang et al., 2002; Kübarsepp et al., 2005), whereas other studies reported no effect (Pagnacco
and Caroli, 1987; Ikonen et al., 1997). It has been suggested (Lunden et al., 1997; Bobe et al., 1999)
that the favorable effect of BLG B variant on RCT estimated in a number of studies might be
ascribed to increased total casein content and casein number associated with BLG B. Nevertheless,
inconsistent results have been obtained on the association between casein content or casein number
and RCT (Ikonen et al., 2004), and this might explain controversial reports on effects of BLG
genotypes and RCT.

64
Table 3. Estimated effects (min) ± SE of BLG genotypes compared to genotype AA on rennet clotting time obtained using different statistical models1
Genotype2 Statistical model M1 M2 M3 M4 AA 0 0 0 0 AB 0.667 ± 0.176*** 0.785 ± 0.183*** 0.773 ± 0.183*** 0.638 ± 0.176*** BB 1.033 ± 0.231*** 1.411 ± 0.284*** 1.348 ± 0.284*** 0.827 ± 0.259** Additive deviation 0.517 ± 0.116*** 0.706 ± 0.142*** 0.674 ± 0.142*** 0.414 ± 0.129** Dominance deviation -0.151 ± 0.152 -0.079 ± 0.154 -0.099 ± 0.154 -0.224 ± 0.156
1Model M1 included the fixed effect of herd-test day, parity, DIM, SCS and pH class, renneting meter sensor, BLG genotype, the regression of CSN2-CSN3 haplotype probabilities and the random effect of the sire of the cow. In addition, model M2, included regressions on αS1-, αS2-, β-, κ-CN, and β-LG contents (g/L), model M3 included the regressions on contents (g/L) of αS1-, αS2-, β-, κ-CN, and β-LG, and total protein content, and model M4 included the regressions on αS1-, αS2-, β-, κ-CN expressed as percentages on total casein, and on β-LG expressed as percentage on total whey protein. In M2, M3 and M4, all additional effects were included as covariates. Estimates correspond to the expected effects on rennet clotting time exerted by the replacement of 1 copy of haplotype A2A with 1 copy of another haplotype; 2Additive deviation was computed as )ˆˆ(5.0 AABLGBBBLG ββ −× where BBBLGβ and AABLGβ are model solutions for
BLG BB and AA genotypes, respectively; dominance deviation was computed as
)ˆˆ(5.0ˆAABLGBBBLGABBLG βββ +×− where ABBLGβ is the model solution for BLG AB genotype.
†P < 0.10, *P < 0.05, ** P < 0.01, *** P < 0.001.
Table 4. Estimated effects (mm) ± SE of BLG genotypes compared to genotype AA on curd firmness obtained using different statistical models1
Genotype2 Statistical model M1 M2 M3 M4 AA 0 0 0 0 AB -0.106 ± 0.312 -0.585 ± 0.314† -0.551 ± 0.313† 0.014 ± 0.308 BB 0.767 ± 0.407† -0.660 ± 0.484 -0.519 ± 0.484 1.167 ± 0.450** Additive deviation 0.384 ± 0.203† -0.330 ± 0.242 -0.260 ± 0.242 0.584 ± 0.225** Dominance deviation 0.490 ± 0.271† 0.255 ± 0.265 0.292 ± 0.264 0.569 ± 0.274*
1Model M1 included the fixed effect of herd-test day, parity, DIM, SCS and pH class, renneting meter sensor, BLG genotype, the regression of CSN2-CSN3 haplotype probabilities and the random effect of the sire of the cow. In addition, model M2, included regressions on αS1-, αS2-, β-, κ-CN, and β-LG contents (g/L), model M3 included the regressions on contents (g/L) of αS1-, αS2-, β-, κ-CN, and β-LG, and total protein content, and model M4 included the regressions on αS1-, αS2-, β-, κ-CN expressed as percentages on total casein, and on β-LG expressed as percentage on total whey protein. In M2, M3 and M4, all additional effects were included as covariates. Estimates correspond to the expected effects on curd firmness exerted by the replacement of 1 copy of haplotype A2A with 1 copy of another haplotype; 2Additive deviation was computed as )ˆˆ(5.0 AABLGBBBLG ββ −× where BBBLGβ and AABLGβ are model solutions for
BLG BB and AA genotypes, respectively; dominance deviation was computed as
)ˆˆ(5.0ˆAABLGBBBLGABBLG βββ +×− where ABBLGβ is the model solution for BLG AB genotype.
†P < 0.10, *P < 0.05, ** P < 0.01, *** P < 0.001.
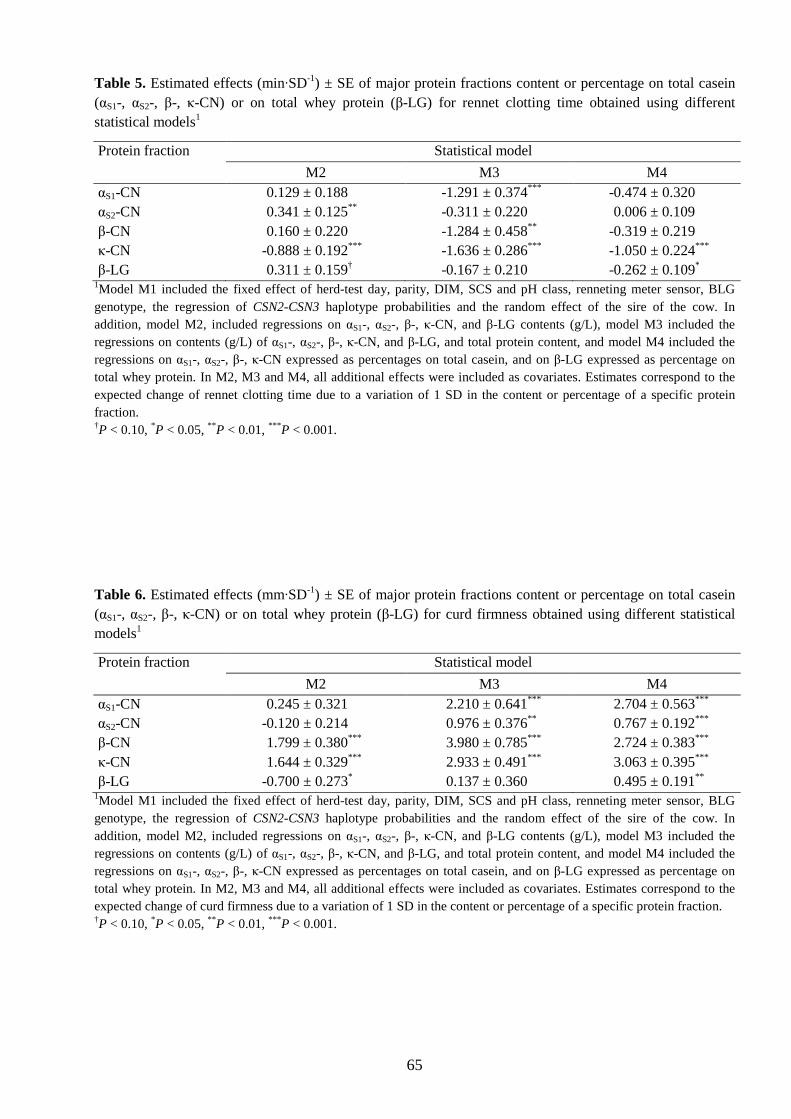
65
Table 5. Estimated effects (min·SD-1) ± SE of major protein fractions content or percentage on total casein (αS1-, αS2-, β-, κ-CN) or on total whey protein (β-LG) for rennet clotting time obtained using different statistical models1
Protein fraction Statistical model M2 M3 M4 αS1-CN 0.129 ± 0.188 -1.291 ± 0.374*** -0.474 ± 0.320 αS2-CN 0.341 ± 0.125** -0.311 ± 0.220 0.006 ± 0.109 β-CN 0.160 ± 0.220 -1.284 ± 0.458** -0.319 ± 0.219 κ-CN -0.888 ± 0.192*** -1.636 ± 0.286*** -1.050 ± 0.224*** β-LG 0.311 ± 0.159† -0.167 ± 0.210 -0.262 ± 0.109*
1Model M1 included the fixed effect of herd-test day, parity, DIM, SCS and pH class, renneting meter sensor, BLG genotype, the regression of CSN2-CSN3 haplotype probabilities and the random effect of the sire of the cow. In addition, model M2, included regressions on αS1-, αS2-, β-, κ-CN, and β-LG contents (g/L), model M3 included the regressions on contents (g/L) of αS1-, αS2-, β-, κ-CN, and β-LG, and total protein content, and model M4 included the regressions on αS1-, αS2-, β-, κ-CN expressed as percentages on total casein, and on β-LG expressed as percentage on total whey protein. In M2, M3 and M4, all additional effects were included as covariates. Estimates correspond to the expected change of rennet clotting time due to a variation of 1 SD in the content or percentage of a specific protein fraction. †P < 0.10, *P < 0.05, ** P < 0.01, *** P < 0.001.
Table 6. Estimated effects (mm·SD-1) ± SE of major protein fractions content or percentage on total casein (αS1-, αS2-, β-, κ-CN) or on total whey protein (β-LG) for curd firmness obtained using different statistical models1
Protein fraction Statistical model M2 M3 M4 αS1-CN 0.245 ± 0.321 2.210 ± 0.641*** 2.704 ± 0.563*** αS2-CN -0.120 ± 0.214 0.976 ± 0.376** 0.767 ± 0.192*** β-CN 1.799 ± 0.380*** 3.980 ± 0.785*** 2.724 ± 0.383*** κ-CN 1.644 ± 0.329*** 2.933 ± 0.491*** 3.063 ± 0.395*** β-LG -0.700 ± 0.273* 0.137 ± 0.360 0.495 ± 0.191**
1Model M1 included the fixed effect of herd-test day, parity, DIM, SCS and pH class, renneting meter sensor, BLG genotype, the regression of CSN2-CSN3 haplotype probabilities and the random effect of the sire of the cow. In addition, model M2, included regressions on αS1-, αS2-, β-, κ-CN, and β-LG contents (g/L), model M3 included the regressions on contents (g/L) of αS1-, αS2-, β-, κ-CN, and β-LG, and total protein content, and model M4 included the regressions on αS1-, αS2-, β-, κ-CN expressed as percentages on total casein, and on β-LG expressed as percentage on total whey protein. In M2, M3 and M4, all additional effects were included as covariates. Estimates correspond to the expected change of curd firmness due to a variation of 1 SD in the content or percentage of a specific protein fraction. †P < 0.10, *P < 0.05, ** P < 0.01, *** P < 0.001.

66
A slightly positive effect on a30 was estimated for allele B at BLG when the statistical model (model
M1) did not account for protein fractions contents or when effects due to variation of CN and whey
protein composition where accounted for (model M4). In agreement with previous studies reporting
positive effects of BLG B on CN content (Lunden et al., 1997) and cheese yield (Schaar et al., 1985;
Van den Berg et al., 1992; Wedholm et al., 2006), this result might be ascribed to the increased CN
content associated with this genetic variant. Results from models estimating non significant effects
(P > 0.10) of BLG genotypes on a30 while adjusting for variation of protein fractions concentrations
(model M2) and total protein content (model M3) support this hypothesis.
These results partially agree with Marziali and Ng-Kwai-Hang (1986) who reported shorter mean
RCT for phenotypes AA than for phenotypes AB and BB and enhanced a30 at cutting for
phenotypes AA in comparison with phenotypes AB and BB. In that study, the statistical model
accounted for CN content, indicating that effects exerted by β-LG genotypes on MCP are not
interpretable as indirect effects due to altered milk protein content.
Contribution of Additive Genetic Variance to Total Variance of Milk Coagulation Properties
Although estimation of genetic parameters for MCP is not a specific aim of the investigation,
estimates of additive genetic variance obtained in our study indicate that MCP are moderately
influenced by polygenic effects. Depending on the statistical model (M1-4), estimates of additive
genetic variance for RCT and a30 ranged from 16.8 to 18.4% and from 9.9 to 11.5%, respectively, of
total variance. Estimation of genetic parameters for MCP, protein fraction contents and protein
composition will be the objective of future investigations.
Effects of Major Protein Fractions Contents and Protein Composition on MCP
Estimated regression coefficients for the effects of protein fractions contents (model M2 and M3) or
protein composition (model M4) on RCT and a30 are reported in Table 5 and 6, respectively. These
estimates quantify the expected change of RCT or a30 occurring when the concentration of a
specific protein fraction or its relative content (in CN for CN fractions or in whey protein for β-LG)
increases of 1 SD. In literature, studies on the role of major protein fractions contents and milk
protein composition for variation of MCP are scarce. In our study, RCT was favorably affected
(P < 0.001) by increased κ-CN content and κ-CN proportion on total CN whereas a30 increased
when amounts of both κ-CN and β-CN in milk and in CN increased.
Previous studies (Yun et al., 1982; Storry et al., 1983) reported that RCT was related to proportions
of αS- and β-CN in CN and that curd tension increased significantly with β-CN fortification,
suggesting an essential role of β-CN for curd hardening. Recently, Van Hekken and Holsinger
(2000) and St-Gelais and Haché (2005) observed that changes in αS-CN to β-CN contents ratio

67
reflect alteration in the gelation properties of milk. Wedholm et al. (2006) reported that the
concentration of κ-CN in milk and ratios of this fraction to αS1- and β-CN were significantly lower
in poorly-coagulating or non-coagulating milk than in milk exhibiting optimal coagulation ability,
but, consistently with Jõudo et al. (2008), they observed no effect of β-CN content on MCP.
Similarly to previous reports (McLean, 1986; van den Berg et al., 1992; Jõudu et al., 2008), our
results indicate that κ-CN concentration plays a role as a source of variation of a30. A possible
explanation is that milk with increased κ-CN content exhibits shortened RCT (van den Berg et al.,
1992), which leaves more time for curd firming and, as a consequence, and enhances a30 at cutting.
In addition, κ-CN content has been also associated with increased casein retention in curd during
chymosin-induced coagulation. The effect of κ-CN concentration on casein losses into whey may
partly be explained by the association between increased κ-CN content and small casein micelle
size (Dalgleish et al., 1989; Donnelly et al., 1984). Milk containing small-sized micelles originates
gels with an improved structure, which may increase the ability to entrap milk constituents possibly
reducing casein losses into whey (Niki et al., 1994; Walsh et al., 1998).
CONCLUSIONS
This study indicates that previously observed differences across CN genotypes in coagulating
properties of milk may have been mostly due to differences in contents of major protein fractions
and in detailed protein composition, that are known to be associated with milk protein genotypes.
Factors expected to affect milk composition are expected to affect processing properties of milk
also. Although further research is needed to investigate the effect exerted by milk protein
composition and casein haplotypes on cheese yield, results obtained in this study suggest that
changes in milk protein composition might exert correlated effects on milk coagulation properties
and that changes in frequency of specific allelic variants at CN and whey protein loci might be
beneficial or detrimental for coagulation properties of milk. Genetic parameters for contents of milk
protein fractions and protein composition, as well as their relationships with breeding goal traits of
dairy cattle populations, need to be investigated in further studies.
ACKNOWLEDGMENTS
The authors like to thank ANAPRI (Udine, Italy) for having provided pedigree information and for
the organization of herd sampling. Financial support by Regione del Veneto (Azione Biotech III
Bis, Delibera CIPE n. 03, 22/03/2006) and the University of Padova (CPDA067387) is also
gratefully acknowledged.

68
REFERENCES
Aleandri, R., J. S. Schneider, and L. G. Buttazzoni. 1989. Evaluation of milk for cheese production based on milk characteristics and formagraph measures. J. Dairy Sci. 72:1967–1989.
Bobe, G., D. C. Beitz, A. E. Freeman, and G. L. Lindberg. 1999. Effect of milk protein genotypes on milk protein composition and its genetic parameter estimates. J. Dairy Sci. 82:2797–2804.
Boettcher, P. J., A. Caroli, A. Stella, S. Chessa, E. Budelli, F. Canavesi, S. Ghiroldi, and G. Pagnacco. 2004a. Effects of casein haplotypes on milk production traits in Italian Holstein and Brown Swiss cattle. J. Dairy Sci. 87:4311–4317.
Boettcher, P. J., G. Pagnacco, and A. Stella. 2004b . A Monte Carlo approach for estimation of haplotype probabilities in half-sib families. J. Dairy Sci. 87:4303–4310.
Bonfatti, V., G. Di Martino, A. Cecchinato, D. Vicario, and P. Carnier. 2009. Effects of CSN2-CSN3 haplotypes and BLG genotypes on milk production traits, protein fractions contents and protein composition of individual milk of Simmental cows. J. Dairy Sci. Submitted
Bonfatti, V., L. Grigoletto, A. Cecchinato, L. Gallo, and P. Carnier. 2008. Validation of a new reversed-phase high-performance liquid chromatography method for separation and identification of bovine milk protein genetic variants. J. Chromatogr. A 1195:101–106.
Buchberger, J., and P. Dovč. 2000. Lactoprotein genetic variants in cattle and cheese making ability. Food Technol. Biotechnol. 38(Suppl. 2):91–98.
Cassandro, M., A. Comin, M. Ojala, R. Dal Zotto, M. De Marchi, L. Gallo, P. Carnier, and G. Bittante. 2008. Genetic parameters of milk coagulation properties and their relationships with milk yield and quality traits in Italian Holstein cows. J. Dairy Sci. 91:371–376.
Cecchinato, A., M. De Marchi, L. Gallo, G. Bittante, and P. Carnier. 2009. Mid-infrared spectroscopy predictions as indicator traits in breeding programs for enhanced coagulation properties of milk. J. Dairy Sci. 92 :5304–5313.
Dalgleish, D. G., D. S. Horne, and A. J. R. Law. 1989. Size-related differences in bovine casein micelles. Biochim. Biophys. Acta 991(Suppl. 3):383–387.
Dal Zotto, R., M. De Marchi, A. Cecchinato, M. Penasa, M. Cassandro, P. Carnier, L. Gallo and G. Bittante. 2008. Reproducibility and repeatability of measures of milk coagulation properties and predictive ability of Mid-Infrared Reflectance Spectroscopy. J. Dairy Sci. 91:4103–4112.
Donnelly, W. J., G. P. McNeill, , W. Buchheim, and T. C. A. McGann. 1984. A comprehensive study of the relationship between size and protein-composition in natural bovine casein micelles. Biochim. Biophys. Acta 789(Suppl. 2):136–143.
Hallén, E., Wedholm A., A. Andrén, and A. Lundén. 2008. Effect of β-casein, κ-casein and β-lactoglobulin genotypes on concentration of milk protein variants. J. Anim. Breed. Genet. 17:791–799.
Heck, J. M. L., A. Schennink, H. J. F. van Valenberg, H. Bovenhuis, M. H. P. W. Visker, J. A. M. van Arendonk, and A. C. M. van Hooijdonk. 2009. Effects of milk protein variants on the protein composition of bovine milk. J. Dairy Sci. 92:1192–1202.
Horne, D.S. 1998. Casein interactions: casting light on the black boxes, the structure in dairy products. Int. Dairy J. 8(Suppl. 3): 171–177.
Ikonen, T., K. Ahlfors, R. Kempe, M. Ojala, and O. Ruottinen. 1999a. Genetic parameters for the milk coagulation properties and prevalence of non-coagulating milk in Finnish dairy cows. J. Dairy Sci. 82:205–214.
Ikonen, T., S. Morri, A. M. Tyrisevä, O. Ruottinen, and M. Ojala. 2004. Genetic and phenotypic correlations between milk coagulation properties, milk production traits, somatic cell count, casein content, and pH of milk. J. Dairy Sci. 87:458–467.
Ikonen, T., M. Ojala, and O. Ruottinen. 1999b. Associations between milk protein polymorphism and first lactation milk production traits in Finnish Ayrshire cows. J. Dairy Sci. 82:1026–1033.
Ikonen, T., M. Ojala, and E. L. Syväoja. 1997. Effects of composite casein and β-lactoglobulin genotypes on renneting properties and composition of bovine milk by assuming an animal model. Agric. Food Sci. Finl. 6:283–294.
Jann, O., G. Ceriottti, A. Caroli, and G. Erhardt. 2002. A new variant in exon VII of bovine β-casein gene (CSN2) and its distribution among European cattle breeds. J. Anim. Breed. Genet. 119:65–68.
Jann O. C, E. M. Ibeagha-Awemu, C. Özbeyaz, P. Zaragoza, J. L. Williams, P. Ajmone-Marsan, J. A. Lenstra, K. Moazami-Goudarzi, and G. Erhardt. 2004. Genet. Sel. Evol. 36 243-257.
Jõudo, I., M. Henno, T. Kaart, T. Püssa, and O. Kärt. 2008. The effect of milk protein contents on the rennet coagulation properties of milk from individual dairy cows. Int. Dairy Sci. 964–967.

69
Kübarsepp, I., M. Henno, H. Viinalass, and D. Sabre. 2005. Effect of κ−casein and β−lactoglobulin genotypes on the milk renneting coagulation properties. Agronomy Research 3(Suppl. 1):55–64.
Lodes, A., J. Buchberger, J. Aumann, and H. Klostermeyer. 1996a. The influence of genetic variants of milk proteins on the compositional and technological properties of milk: 1. Casein micelle size and the content of non-glycosylated kappa-casein. Milchwissenshaft 51:368–373.
Lodes, A., J. Buchberger, J. Aumann, and H. Klostermeyer. 1996b. The influence of genetic variants of milk proteins on the compositional and technological properties of milk: 2. Rennet coagulation time and firmness of the rennet curd. Milchwissenshaft 51:543–547.
Lunden, A., M. Nilsson, and L. Janson. 1997. Marked effect of betalactoglobulin polymorphism on the ratio of casein to total protein in milk. J. Dairy Sci. 80:2996–3005.
Marziali, A. S., and K. F. Ng-Kwai-Hang. 1986. Effects of milk composition and genetic polymorphism on coagulation properties of milk. J. Dairy Sci. 69:1793–1798.
Mayer, H. K., M. Ortner, E. Tschager, and W. Ginzinger. 1997. Composite milk protein phenotypes in relation to composition and cheesemaking properties of milk. Int. Dairy J. 7:305–310.
McLean, D. M., E. R. Bruce Graham, and R. W. Ponzoni. 1984. Effects of milk protein genetic variants on milk yield and composition. J. Dairy Res. 51:531–546.
Matějíček, A., J. Matějíčková, M. Štípková, O. Hanuš, V. Genčurová, J. Kyseľová, E. Němcová, T. Kott, J. Šefrová, M. Krejčová, S. Melčová, I. Hölzelová, J. Bouška, J. Frelich. 2008. Joint effects of CSN3 and LGB genes on milk quality and coagulation properties in Czech Fleckvieh. Czech J. Anim. Sci., 53: 246–252
Ng-Kwai-Hang, K. F., C. Dodds, M. J. Boland, and M. J. Auldist. 2002. The influence of genetic variants of β-lactoglobulin on gelation speed and firmness of rennet curd. Milchwissenshaft 57(Suppl. 5):267–269.
Niki, R., K. Royama, Y. Sano, and K. Nishinari. 1994. Rheological study on the rennet-induced gelation of casein micelles with different size. Polymer Gels and Networks 2(Suppl. 2):105–118.
Pagnacco, G., and A. Caroli. 1987. Effect of casein and β-lactoglobulin genotypes on renneting properties of milks. J. Dairy Res. 54(Suppl. 4):479–485.
Robitaille, G., M. Britten, J. Morisset, and D. Petitclerc. 2002. Quantitative analysis of beta-lactoglobulin A and B genetic variants in milk of cows beta-lactoglobulin AB throughout lactation. J. Dairy Res. 69:651–654.
Schaar, J., B. Hansson, and H. E. Pettersson. 1985. Effects of genetic variants of κ-casein and β-lactoglobulin on cheesemaking. J. Dairy Res. 52:429–437.
St-Gelais, D., and S. Haché. 2005. Effect of β-casein concentration in cheese milk on rennet coagulation properties, cheese composition and cheese ripening. Food Res. Int. 38:523-531.
Storry, E. J., A. S. Grandison, D. Millard, A. J. Owen, and G. D. Ford. 1983. Chemical composition and coagulating properties of renneted milks from different breeds and species of ruminant. J. Dairy Res. 50:215–229.
Tyrisevä, A.-M., T. Vahlsten, O. Ruottinen, and M. Ojala. 2004. Noncoagulation of milk in Finnish Ayrshire and Holstein-Friesian cows and effect of herds on milk coagulation ability. J. Dairy Sci. 87:3958–3966.
van den Berg, G., J. T. M. Escher, P. J. de Koning, and H. Bovenhuis. 1992. Genetic polymorphism of κ-casein and β-lactoglobulin in relation to milk composition and processing properties. Neth. Milk Dairy J. 46:145–168.
Van Eenennaam, A. L., and J. F. Medrano. 1991. Differences in allelic protein expression in the milk of heterozygous kappa-casein cows. J. Dairy Sci. 74:1491–1496.
Van Hekken, D. L., and V. H. Holsinger. 2000. Use of cold microfiltration to produce unique β-casein enriched milk gels. Lait 80:69–76.
Yun, S. E., K. Ohmiya, and S. Shimizu. 1982. Role of β-casein in milk curdling. Agric. Biol. Chem. 46(Suppl. 2):443–449.
Walsh, C. D., T. P. Guinee, W. D. Reville, D. Harrington, J. J. Murphy, B. T. O’Kennedy, and R. J. FitzGerald. 1998. Influence of kappa-casein genetic variant on rennet gel microstructure, cheddar cheesemaking properties and casein micelle size. Int. Dairy J. 8:707–714.
Wedholm, A., L. B. Larsen, H. Lindmark-Månsson, A. H. Karlsson, and A. Andrén. 2006. Effect of protein composition on the cheesemaking properties of milk from individual dairy cows. J. Dairy Sci. 89:3296–3305.

71
Chapter 4.
The effect of the relative κ-CN B content in bulk milk on
Montasio, Asiago, and Caciotta cheese yield using milks of
similar protein composition
V. Bonfatti, A. Cecchinato, L. Gallo, M. De Marchi, and P. Carnier
Department of Animal Science, University of Padova, viale dell’Università 16, 35020, Legnaro,
Padova, Italy
Submitted to Journal of Dairy Science

73
The effect of the relative κ-CN B content in bulk milk on Montasio, Asiago, and Caciotta
cheese yield using milks of similar protein composition
V. Bonfatti, A. Cecchinato, L. Gallo, M. De Marchi, and P. Carnier
Department of Animal Science, University of Padova, V.le dell’Università 16, 35020, Legnaro,
Padova, Italy
ABSTRACT
The aim of this study was to investigate the effect exerted by the relative ratio of κ-CN A to κ-CN B
content on milk coagulation properties and industrial cheese yield of three Italian cheese varieties
(Montasio, Asiago, and Caciotta). Twenty-four cheese-making experiments were carried out in two
industrial and in one artisanal scale dairy plants. Detailed protein composition of bulk milk of 380
herds conferring to these dairies was analyzed by reversed-phase HPLC (RP-HPLC). In order to
obtain experimental milks with different κ-CN A to κ-CN B content ratios, herds were selected on
the basis of their milk protein composition and κ-CN genetic composition. Milk of selected groups
of herds was separately collected and processed. For each cheese-making trial in each factory,
amounts of milk, ranging from 2,000 to 6,000 kg, with different κ-CN A to κ-CN B content ratios
were separately manufactured. Each vat contained milk collected from at least 4 dairy herds.
Cheese-yields at different ripening times were recorded. A difference of about 20 % for the κ-CN A
to κ-CN B content ratio was obtained experimentally in each dairy plant. Milk was characterized by
having similar composition in terms of protein, casein, casein number, casein composition, β-CN
composition and pH. Milk with the higher proportion of κ-CN B (HIGHB ) exhibited similar
coagulation properties but a higher cheese yield in all the investigated cheese in comparison with
milk with a lower proportion of κ-CN B (LOWB ). However, the increment of yield observed for
HIGHB milk in Montasio cheese was ascribed to a greater fat content of HIGHB milk in
comparison with LOWB milk. The probability of HIGHB milk giving a cheese yield 5 % greater
than that of LOWB milk ranged from 51 to 67 % for Montasio cheese, but was lower than 21 % for
Asiago and Caciotta cheeses. The ratio of κ-CN A to κ-CN B content did not relevantly affect
industrial cheese yield when milks of similar casein composition were processed. Thus, an indirect
effect due to the higher κ-CN content of κ-CN B milk on cheese yield is to be suggested.

74
INTRODUCTION
Cheese yield (CY) plays a fundamental role in the profitability of dairy industry and it is influenced
by many factors, such as casein (CN) content and milk protein polymorphisms. The effect of the
CSN3 (κ-CN) B genetic variant has generated considerable interest because, when compared to the
A variant, it has been associated with improved milk coagulation properties (MCP) (Van den Berg
et al., 1992; Lodes et al., 1996b; Walsh et al., 1998a,b) and increased CY in a range of cheese
varieties such as Cheddar, Mozzarella, Parmigiano-Reggiano, Svecia, Gouda (Buchberger and
Dovč, 2000). Also, studies investigating Cheddar cheese-making have shown that milk produced by
homozygous CSN3 BB animals exhibited higher fat recoveries into cheese, which was likely
associated with the finer gel structure of κ-CN BB milk (Walsh et al., 1998b). Because the two
amino acid substitutions differentiating κ-CN A and B variants are not close to the site of action of
rennet during the initial phase of coagulation, a direct effect of this substitution on the enzymatic
process can be excluded (Glosclaude, 1988).
Several causes have been considered to explain the enhanced properties of κ-CN BB milk. They
involved the different net charge of the two protein variants, the content of citric acid in milk, a
difference in the degree of glycosylation, and a greater homogeneity of the size of the micelles in κ-
CN BB milks (Grosclaude, 1988). Finally, these properties have been partly attributed to greater
overall CN content associated with κ-CN B (Jakob and Puhan, 1992; Walsh et al., 1995) in
comparison with κ-CN A milk.
To date, most studies have been pilot-scale cheese-making studies or have been using bulk milk of
genotyped cows (Buchberger and Dovč, 2000) in which total CN content (TCN) or contents of
other protein fractions were unknown or unlike across compared milks. Genotypes at CSN3 have
been associated with differences in κ-CN content of milk (Heck et al., 2009; Bonfatti et al., 2009b),
which are responsible for a greater number of small micelle in κ-CN BB milk, resulting in more
compact curds (Horne et al., 1998). In addition, a marked effect of CN composition and CSN2 (β-
CN) genotypes on MCP has been recently reported (Bonfatti et al., 2009a). All these factors may
contribute to observed variation in CY and MCP occurring when milks exhibiting different κ-CN
variants content are processed. Literature studies have not clarified whether detected associations
between CY and specific genotypes at CSN3 were attributable to effects exerted by different
structural properties of κ-CN protein variants or were largely due to modifications of CN
composition of milk.
The aim of this study was to investigate the effect exerted by the ratio of κ-CN A to κ-CN B bulk
milk content on industrial CY of Montasio (MO ), Asiago (AS), and Caciotta (CA) cheeses when
CN content and composition and contents of β-CN variants were alike in bulk milk.

75
MATERIALS AND METHODS
Data Collection
A total of 24 cheese-making trials were carried out in three commercial dairies located in the north
of Italy: one artisanal plant, manufacturing MO, and two industrial plants, one manufacturing AS
and one manufacturing CA. The cheese-making trials were carried out from January to June 2009.
An exploratory sampling of bulk milk of all herds (13 herds for MO, 125 for AS and 242 for CA)
supplying the three dairies involved in the study was initially performed to assess across-herds
variation of detailed protein composition. After the initial assessment, sampling of herds selected to
supply milk used in experimental cheese making trials was replicated few days before each cheese
making experiment. This was performed to ensure that characteristics of experimental milk were
consistent with the desired ones. Two samples were collected in each herd, stored in portable
chilling devices immediately after collection, frozen at -20°C, and then transferred to the milk
laboratory of the Department of Animal Science (Padova, Italy) to measure protein composition and
MCP and to the Milk quality Laboratory of Veneto Agricoltura (Thiene, Italy) to measure fat
content by infrared analysis with a Milko-Scan FT120 (Foss Electric, Hillerød, Denmark).
Analysis of Protein Composition
Contents of αS1-, αS2-, βγ-, κ-CN, β-LG and α-LA were measured in herd bulk milk samples, vat-
milk and in cheese-whey samples, by reversed-phase HPLC (RP-HPLC), following the method
proposed by Bonfatti et al. (2008). The method allows the separation and quantification of major
CN and whey protein fractions and of their most common genetic variants. Contents of κ-CN A and
B, of β-LG A and B, and of β-CN A1, A2 and B were quantified. The content of each genetic variant
was quantified through the use of specific calibration equations as estimated by Bonfatti et al.
(2008). γ-CN elutes in the interval of elution of the F variant of β-CN. For this reason, the peak
eluting in this interval (γ-CN/β-CNF) was considered to be composed by γ-CN and β-CN and the
total content of γβ-CN was given. Total CN (TCN) content was defined as the sum of αS1-CN, αS2-
CN, γβ-CN, and κ-CN content. Total whey protein content (WH ) was calculated as the sum of α-
LA and β-LG contents. Total protein content (PRT) was expressed as the sum of TCN and WH.
Casein number (CI ) was calculated as the ratio of TCN to PRT. Casein composition (i.e., relative
contents of CN fractions) was expressed as the percentage ratio of αS1-CN (αS1-CN% ), αS2-CN
(αS2-CN% ), γβ-CN (γβ-CN% ), and κ-CN (κ-CN%) contents to TCN. The glycosylated portion of
κ-CN (glico-κ-CN) was also quantified and expressed as a percentage ratio of the total κ-CN
content in milk. The ratio of κ-CN A to κ-CN content (κ-CNA% ) was expressed as the percentage
ratio of glyco-free κ-CN A content to the total content of glyco-free κ-CN.

76
Milk Coagulation Properties
Measures of MCP of bulk-milk and vat-milk samples were obtained by using the Computerized
Renneting Meter (CRM-48, Polo Trade, Monselice, Italy), within few hours after samples
collection. Samples (10 mL) were preheated at 35 °C and added with 200 µL of rennet (Hansen
standard 160, 80 % chymosin, 1:14900, Pacovis Amrein AG, Bern, Switzerland) 1.6 % vol/vol in
distilled water. Measures of rennet clotting time (RCT, min), curd firming time (K20, min) and curd
firmness (a30, mm) were obtained. Traits definition and details on used methods can be found in Dal
Zotto et al. (2008). Non coagulating milks (i.e., milk that did not coagulated within 31 min since
rennet addition) obtained no value for RCT and K20. Measures of pH were carried out (pH-Burette
24, Crison) prior to rennet coagulation analysis.
Manufacture of Montasio Cheese
Montasio cheese is a Protected Designation of Origin (PDO) product (Reg. CEE n. 1107/96), a
geographical definition that includes the entire territory of Friuli-Venezia Giulia region and the
whole province of Belluno and Treviso and a fraction of Padova and Venice provinces. It is a semi-
hard pressed cheese, cylindrical, 6–10 cm height and with an average weight ranging from 5 to 9
kg, with a diameter of 30–40 cm. The crust is smooth and elastic. The paste is slightly straw-
coloured and has small uniform holes.
Weekly and over a period of 4 weeks, two experimental milks (HIGHB and LOWB), differing for
the relative ratio of κ-CN A to κ-CN B content (HIGHB: κ-CNA% = 40 %; LOWB: κ-CNA% = 60
%) were processed consecutively on the same day and using the same vat. Each experimental milk
derived by the blending of bulk milk of a minimum of 4 herds. The volume of processed milk
ranged from 2,000 to 3,000 L, but was similar for the two experimental milks within day of
processing. Immediately after pasteurization (71.5 °C for 20 s), milk was loaded into the vat (4,000
L-capacity) and heated at 37 °C. When milk reached 37 °C, a starter (strain ST Mesophilic and
Thermophilic; Lyofast ST 073, 0.5 U for every 100 L of milk) and a natural milk starter (2.5–3.3 L
for every 100 L vat milk) were added. The latter derived from naturally acidified milk collected on
the preceding day of the day of cheese making and its addition aimed to enrich the milk with lactic
acid bacteria. After 35 min since the starter addition, rennet was added to milk (natural calf rennet
powder, 3.6 g for every 100 L milk, 1:125,000, 95 % chymosin, 5 % pepsin). During the rest period
after the addition of rennet, the exact volume of milk in the vat was measured through the use of a
dip-stick. The coagulation process began within 16–18 min since the addition of rennet. The curd
was broken up into small granules. The first cut of the curd was made 6 min after curd formation
and a second cut was made after removing 15 % of the whey contained in the vat and after a 10-min
healing period. After the second cutting, the curd was cooked for 22 min at 47 °C. During cooking,

77
the curd was agitated continuously and, finally, curd was drained off the vat to form the moulds.
Moulds were pressed for 35–40 minutes and then, after a gradual cooling (1 d) and drying, the
wheels of cheese were placed into brine (20 % salt) for 24 h. Temperature of the ripening rooms
was kept at a 9–11 °C, and relative humidity around 80 %. Moulds were turned on the planks of the
ripening rooms every 2 weeks. At d 30 of ripening, moulds were scraped with a steel plate and at d
50 they were oiled with linseed oil.
Manufacture of Asiago Cheese
Asiago cheese is a PDO product (Reg. CEE n. 1107/96). The officially-recognized production
region for Asiago cheese includes the entire provinces of Vicenza and Trento, and two areas in the
provinces of Treviso and Padova, all located in the north-east of Italy. It is a cylindrical soft cheese,
with a thin and elastic crust. The mould is 11–15 cm height and its weight ranges from 8 to 12 kg.
The paste has small and scattered holes.
Two experimental milks (HIGHB and LOWB), differing for the relative ratio of κ-CN A to κ-CN B
content (HIGHB: κ-CNA% = 60 %; LOWB: κ-CNA% = 75 %), were processed within a single vat
(11,000 L volume) on three consecutive days, over two weeks, in order to obtain two replicates for
each experimental milk. The volume of processed milk in each trial was 5,500 L. Each experimental
milk derived by the blending of bulk milk of a minimum of five herds. After pasteurization (72 °C
for 18 s), milk was loaded in the vat and starter culture (like AP 100 thermophilic lactic cultures,
CHR Hansen, 200 U per 110 q of milk diluted in 2 L of water) was added when the temperature of
milk reached 37 °C. The addition of liquid calf rennet (1:10,000, 80 % chymosin, 20 % pepsin)
occurred 35 min after the starter addition. During the rest period after the addition of rennet, the
exact volume of milk in the vat was measured through the use of a dip-stick. Curd formation
occurred after 17–18 min and the curd was cut after 30 min since rennet addition to milk. The
healing time after cutting was 12 min. After healing, whey was partially drained off the vat and the
curd was cooked for 20 min at 42 °C. Finally, curd was drained off the vat to form the moulds.
Moulds were pressed for 2 h and, after a drying period of 72 h, were transferred into brine. Moulds
were kept into brine for 48 h and then transferred in the ripening rooms. During the 20-d period of
ripening, moulds were kept at 10 °C and 80 % relative humidity.
Manufacture of Caciotta Cheese
Caciotta cheese is a soft short-maturing cheese, with small-sized and spherical-cylindrical moulds.
This cheese is produced in northern Italy with standardized technologies and on a semi-industrial
scale. Ripening lasts few weeks. Paste is slightly pigmented, compact, uniform or slightly eyes-
scattered.

78
Two experimental milks (HIGHB and LOWB), differing for the relative ratio of κ-CN A to κ-CN B
content (HIGHB: κ-CNA% = 45 %; LOWB: κ-CNA% = 65 %), were processed simultaneously.
Each experimental milk was processed into three industrial vats of equal volume (1,900 L). The
experimental cheese making experiment was repeated on three consecutive days over a week, for
two weeks. Each experimental milk derived by the blending of bulk milk of at least 8 herds.
Immediately after pasteurization (72 °C for 16 s), milk was loaded in the vats (the volume of milk
was measured automatically at loading) and heated at 41 °C. At this temperature, a starter (strain
TB1 Mesophilic yeasts and lactobacilli) was added. Salt (12.5 kg/vat) was introduced immediately
before the addition of rennet (1:12,000 chymosin 75 %, pepsin 25 %, 50 mL per 100 L of milk),
which was added after 35 min since the starter addition to milk.
Curd was formed within 14–15 min and cutting of the curd occurred after 25 min since rennet
addition. After cutting, the curd was drained off the vat and moulds were formed. After 1 h of
pressing, moulds were kept into brine (17 °BE, 9 °C) for 2 d, then moulds were ripened for 5 d at 3
°C and kept, during the following 5 d, at 5 °C, with ventilation to allow crust formation.
Analysis of Vat-milk and Cheese-whey
Analysis of milk composition was carried out twice for milk sampled from the vat before the adding
of the starter and for the cheese-whey collected after curd extraction from the vat.
The following traits were measured: pH with a pH-meter, titratable acidity with 0.25 M NaOH
using the Soxhlet-Henkel method (Anon, 1963) and fat by infrared analysis with a Milko-Scan
FT120 (Foss Electric, Hillerød, Denmark). Analysis of protein composition was carried out by RP-
HPLC (Bonfatti et al., 2008). Milk coagulation properties were also measured in duplicate (CRM-
48, Polo Trade, Monselice, Italy) on vat-milk.
Cheese Yield Recording and Analysis of Cheese
For all cheeses, the first measure of CY (CY1) was recorded after the brine period at d 2 or 3 for
MO and CA or AS, respectively. Cheese yield at the end of the ripening period (CY2) was also
measured. At the end of the ripening period, which lasted 60, 20, or 10 d for MO, AS, or CA,
respectively, three moulds per experimental milk in each day of processing were randomly sampled.
Cheese samples were analyzed for moisture by vacuum oven at 100 °C (method 926.08; AOAC,
2003), fat by the Mojonnier method (method 933.05; AOAC, 2003), ash using a muffle furnace at
550 °C (method 935.42; AOAC, 2000), and total protein by macro-Kjeldahl (method 2001.14;
AOAC, 2002). As κ-CN variants have been reported (Walsh et al., 1998a) to exert trivial effects on
primary and secondary proteolysis during ripening or on the grading scores awarded for
acceptability, cheese quality was not evaluated.

79
Statistical Analysis
Variation of composition of vat-milk and cheese-whey, MCP of vat-milk, CY at different ageing
periods, and moisture, protein and fat content of manufactured cheese attributable to the effects of
experimental milk (i.e., the effects of the ratio of κ-CN A to κ-CN B content) was investigated
through Bayesian analyses. A difficulty when comparing CY of different experimental groups is
due to the small sample size achievable in this type of studies. Moreover, relevance of effects is
often difficult to evaluate. A Bayesian statistical approach performing numerical integration through
Monte-Carlo Markov Chain (MCMC) procedures allows the use of marginal posterior probability
densities for treatment means comparisons. Thus, the probability for a treatment mean of being
greater or lower than the one of another treatment group, or the probability of a relevant difference
across treatments can be obtained. These procedures ensure high flexibility for the interpretation of
results.
As differences in the ratio of κ-CN A to total κ-CN content across processed milks were different
for MO, AS, and CA cheese making trials, separated statistical analyses were performed for each
type of manufactured cheese. Models included the effect of the experimental milk (2 levels: HIGHB
and LOWB) and the effect of the day of cheese making (4 levels for MO, 2 levels for AS, and 6
levels for CA). Prior distributions for both effects were assumed to be uniform. A unique Gibbs
chain of 100,000 iterations was run for each analysis, with a burn-in of 10,000 iterations. Samples
were saved every 10 iterations. Convergence was tested for each chain using the Z criterion of
Geweke (Geweke, 1992). Monte Carlo standard errors were also calculated (Sorensen and Gianola,
2002). The posterior median was used as a point estimate of parameters of concern. Features of the
marginal posterior distribution for the difference between means of experimental milks were
obtained. Lower and upper bounds of the 95 % posterior probability interval (HPD) for the mean of
experimental milks and for the difference between means of experimental milks were obtained from
the estimated marginal densities. The probability of similarity between experimental milks was also
calculated for each trait and was expressed as the probability of the percentage difference between
means being in the range from -8 to +8 %, for milk composition and MCP, and from -5 to +5 % for
cheese composition.
The ranges of similarity for milk and cheese composition were established considering the
variability due to sampling and analytical procedures. The probability of HIGHB having a higher
cheese-yield than LOWB was also calculated, as well as the probability of the increase in cheese-
yield of HIGHB being higher than 5 % in comparison with LOWB. Without considering milk
composition, a 5 % increase has been the minimum value of the difference between BB and AA
milk reported in literature (Buchberger and Dovč, 2000), with few exceptions (Schaar et al., 1985;
Rahali and Menard, 1991).

80
RESULTS AND DISCUSSION
Protein Composition and Milk Coagulation Properties of Bulk Milk Samples
Descriptive statistics for protein composition and coagulation properties of bulk milk from all 380
dairy herds supplying the three dairies involved in the study are reported in Table 1. The high value
of average protein content of milk is to be ascribed to the skimming of milk prior to
chromatographic analysis.
Exploratory sampling included all herds with no distinction of breed and herd size, thus resulting in
a large variability of protein fractions and protein genetic variants contents in bulk milk.
Composition of bulk milk yielded by a limited number of animals is essentially determined by
characteristics of these animals and also less common genetic variants at the population level may
be prevalent in bulk milk of small herds.
Genetic composition of κ-CN showed a large variability. Relative content of κ-CN A in total κ-CN
(κ-CNA%) ranged from 4.1 to 89.0 %. Overall, content of κ-CN A was slightly greater than that of
κ-CN B. Also the β-CN fraction exhibited a great variability of genetic composition (i.e., relative
ratios between genetic variants) with a large prevalence of variant A2 (50.2 % on total β-CN). This
was expected as a consequence of the high frequency of this allele in many Italian dairy cattle
breeds (Comin et al., 2008; Bonfatti et al., 2009b). However, bulk milk of sampled herds exhibited
also a rather high content of β-CN A1. Variant B of β-CN was also detected in milk of several herds,
with an average relative content of 16.28 % on total β-CN. The rather high content of this variant,
not common for the Holstein Friesian breed, may be attributable to the presence of Brown Swiss or
Simmental cows in the sampled herds.
Whey protein composition showed a slight predominance (52.54 %) of β-LG B over β-LG A. This
result was expected, due to the slightly higher frequency of variant B, in respect to A variant, in
Holstein Friesian and Simmental, and its high frequency in Brown Swiss cows (Formaggioni et al.,
1999).
Of the investigated bulk milk samples, 7.4 % coagulated within 15 min since rennet addition and
exhibited a rather short RCT, 43.9 % coagulated in the interval from 15 to 20 min, which is
considered an optimal RCT range, and 33.9 % coagulated after 20, but before 25 min. The
proportion of milk not suitable for processing (RCT > 25 min) was 14.7 %.
Within this category of milk, a great proportion of non-coagulating milk (6.8 % of all samples) was
observed. The high incidence of non-coagulating milk and averages values for RCT and a30 (20 min
and 24 mm, respectively) confirm the poor coagulation ability of milk in Italy, which has been
reported in previous studies (Mariani et al., 1992; Sandri et al., 2001).

81
Table 1. Descriptive statistics for protein composition and coagulation properties of bulk-milk samples (n = 380)
Item1 Mean SD Minimum Maximum
Protein, g/L 40.57 2.85 29.97 52.77 Casein, g/L 35.38 2.51 25.72 46.33 Whey protein, g/L 5.19 0.46 4.02 6.75 Casein number,% 87.21 0.67 85.45 91.01
Protein fractions content, g/L
αS1-CN 13.52 1.01 10.50 18.18 αS2-CN 4.35 0.47 2.80 5.99 βγ-CN 14.08 1.05 9.94 18.25 κ-CN 3.43 0.40 2.33 5.36 α-LA 1.17 0.14 0.78 1.53 β-LG 4.02 0.41 3.02 5.85
Casein genetic variants content, g/L
β-CNB 0.82 0.22 0.41 2.66 β-CNA1 3.86 1.27 0.85 8.65 β-CNA2 7.08 1.62 0.98 14.73 γ-CN/β-CNF 0.82 0.22 0.41 2.66 κ-CNA 1.03 0.27 0.10 1.79 κ-CNB 0.82 0.41 0.17 3.15 β-LGA 1.92 0.58 0.13 5.30 β-LGB 2.10 0.49 0.42 4.11
Casein composition, %
αS1-CN% 38.21 1.24 33.08 42.95 αS2-CN% 12.30 0.91 9.55 16.58 β-CN% 39.80 1.20 35.15 43.96 κ-CN% 9.69 0.81 7.77 15.58
κ-CN composition, %
κ-CNA% 56.98 16.02 4.11 89.00 Glyco-κ-CN 45.94 3.69 34.95 60.30
β-CN composition, %
β-CN A1% 27.62 9.45 5.95 71.52 β-CN A2% 50.21 10.58 8.14 83.00 β-CN B% 16.28 8.29 2.77 54.95 γ-CN/β-CNF% 5.89 1.70 2.31 20.62
Milk coagulation properties
RCT, min 20.00 3.56 7.08 29.57 K20, min 2.97 2.10 0.00 8.95 a30, mm 24.07 7.31 3.00 41.00
1 Protein = αS1-CN + αS2-CN + βγ-CN + κ-CN + β-LG + α-LA; casein = αS1-CN + αS2-CN + βγ-CN + κ-CN; casein number = casein/protein×100; κ-CNA% = κ-CNA/(κ-CNA + κ-CNB) × 100; whey protein = β-LG + α-LA; Milk coagulation properties referred only to coagulating samples (n = 354); RCT = rennet clotting time; K20 = curd firming time; a30 = curd firmness.

82
Composition of Experimental Milks
Inferences were made from features of marginal posterior distributions of the differences between
experimental milks. MCMC chains converged in all cases and Monte Carlo standard errors were
very small (lower than 0.004, data not reported in table).
In general, the range of variation of κ-CNA% across experimental milks was smaller in comparison
with that observed in the exploratory sampling. This was due to the need of keeping other
characteristics similar across experimental milks when bulk milks were blended. Exclusive
blending of milk from most extreme herds for milk κ-CNA% was not feasible because those herds
exhibited also the most extreme total κ-CN contents and casein number and it would have led to
experimental milks with large differences in terms of protein composition. Nevertheless, the range
of the κ-CN A to κ-CN B content ratio for experimental milks was approximately equal to 1 κ-
CNA% SD in the sampled bulk milks and, for nearly half of sampled herds, κ-CNA% was within the
interval of experimental milks κ-CNA%.
For fat content and protein composition, features of the marginal posterior density for the
experimental milk means and for the difference between means are reported in Table 2, 3, and 4, for
MO, AS and CA trials, respectively. The main advantage of using Bayesian techniques when
compared with classical statistics is the use of estimated posterior probability densities, which
permits greater accuracy about the evaluations of the uncertainty in the estimated parameters and
allows the construction of several types of probability intervals to test hypotheses. For example, in
Table 2, 3, and 4, almost all differences between means of HIGHB and LOWB milk for protein
composition had a HPD interval that included zero. From a classical point of view, this will lead to
the conclusion that there are no significant differences between milks. However, this interval is only
an indication of the accuracy of the measurement of the difference across milks. To answer the
question of whether milks are different or not in relation to a characteristic of concern, the
probability of difference (or similarity) needs to be investigated.
Montasio cheese milks
For MO cheese, in HIGHB milk the relative content of κ-CN A was approximately 40 %, whereas it
was 60 % in LOWB milk. Because of large variability of fat content over time, equal contents of fat
across experimental milks were not obtained and HIGHB milk exhibited a greater fat content (+13
%) in comparison with LOWB milk. Moreover, HIGHB milk was also characterized by a slightly
higher content of αS1-CN and κ-CN, which increased also overall CN and PRT content. The
proportions of CN fractions on TCN were comparable across experimental milks, but a lower β-CN
B to total β-CN content ratio, counterbalanced by a higher proportion of β-CN A2, was observed in
HIGHB milk. Allele B of CSN2 is reported to have positive effects on MCP (Buchberger and Dovč,
2000; Wedholm et al., 2006; Bonfatti et al., 2009a), and a different incidence of this variant in milk

83
is expected to affect coagulation ability and possibly CY. Although there was a relevant difference
in the proportion of β-CNB% on total β-CN, the content of β-CN B was similar for the two
experimental milks. As content of κ-CN B variant is associated to that of β-LG B, β-LG genetic
composition was unbalanced between the two experimental milk, with HIGHB milk exhibiting a
higher content of β-LG B over the A variant. Literature results for the effect of β-LG variants on
MCP and CY are conflicting. No significant differences between CY or MCP for milks of different
phenotypes for β-LG have been reported (Marziali and Ng-Kwai-Hang, 1986a), but in most studies
(Lodes et al., 1996b; Schaar et al., 1985; van den Berg et al., 1992) β-LG B, for its increased CN to
PRT content ratio in comparison with β-LG A, has been associated with increased CY. In our study,
HIGHB and LOWB milks had very similar CI and HIGHB milk (which was expected to give an
increased CY) had the lowest content of β-LG B.
Asiago cheese milks
Two experimental milks were processed to investigate the effect of κ-CN composition on CY of AS
cheese. No relevant differences of contents and composition were observed between HIGHB and
LOWB milks. Experimental milks were characterized by having similar contents of fat and TCN,
CN composition (αS1-, αS2-, β-, and κ-CN to TCN content ratios), and WH composition (β-LG and
α-LA to WH content ratios). Contents of all genetic variants for major CN fractions were also
similar, with the only expected exception of κ-CN A and κ-CN B contents. Like for MO trials, an
increased proportion of β-LG B was observed for HIGHB milk. For the manufacturing of AS
cheese, the difference for the relative content of κ-CN A across experimental milks was rather
limited (κ-CNA% was 61 and 75 % of total κ-CN for HIGHB and LOWB milks, respectively). This
was mainly due to the large amount of milk required for processing (a minimum of 5,500 L) which
reduced variation of κ-CNA% and did not permit to obtain experimental milks with larger
differences in genetic composition of κ-CN.
Caciotta cheese milks.
For the composition of vat-milk of CA manufacture, a difference between the two experimental
milks of approximately 20 % in the relative proportion of κ-CN A in κ-CN content was obtained.
HIGHB milk exhibited a slightly greater amount of PRT content, due to increased CN and WH
contents of HIGHB milk when compared to LOWB milk, but these differences did not appear to be
relevant. Within CN fractions, HIGHB milk had a greater content of κ-CN (+8 % in comparison
with LOWB milk). However, the relative proportion of κ-CN to TCN was very similar in both
milks. HIGHB milk exhibited also a greater content of β-CN B and A2, and a smaller amount of β-
CN A1 in comparison with LOWB milk. The relative proportions of CN fractions were well
balanced, but with a higher content of β-CN and an increased percentage ratio of β-CN to TCN
content for HIGHB milk.

84
Table 2. Median and 95 % high posterior density interval (HPD95%) for the difference between means of experimental milk (low and high κ-CN A to B content ratio) in relation to milk and protein composition for Montasio cheese production1
Experimental milk Difference between milks (%) Item HIGHB LOWB Median HPD95% P Fat, % 4.38 3.90 13.05 -5.48 – 35.71 26 Protein, g/L 40.94 38.83 5.69 -3.38 – 14.81 79 Casein, g/L 35.82 33.80 6.23 -2.58 – 14.17 75 Whey protein, g/L 5.12 5.04 1.85 -14.21 – 20.10 75 Casein number, % 87.25 87.49 0.28 -1.03 – 1.66 100 Protein fractions content, g/L αS1-CN 13.35 12.37 8.55 -1.31 – 19.84 42 αS2-CN 4.63 4.63 -0.13 -9.05 – 9.52 92 βγ-CN 14.09 13.33 5.80 -0.69 – 12.63 83 κ-CN 3.76 3.47 9.25 -3.09 – 22.71 37 α-LA 1.23 1.27 -3.28 -25.94 – 22.85 64 β-LG 3.89 3.78 3.25 -10.34 – 17.05 77 Casein genetic variants content, g/L β-CNB 2.54 2.60 -1.79 -21.58 – 18.95 68 β-CNA1 3.39 3.34 1.68 -8.72 – 12.99 85 β-CNA2 7.44 6.64 13.65 -1.47 – 28.79 12 γ-CN/β-CNF 0.72 0.76 -5.09 -29.89 – 25.12 45 κ-CNA 0.80 1.12 -31.40 -56.35 – -7.88 0 κ-CNB 1.24 0.72 78.34 15.00 – 165.50 0 β-LGA 1.50 2.40 -41.37 -73.06 – -10.60 0 β-LGB 2.39 1.38 76.89 -4.106 – 175.30 0 Casein composition, % αS1-CN% 37.26 36.56 1.98 -1.46 – 5.32 100 αS2-CN% 12.92 13.72 -5.50 -12.03 – 1.30 85 βγ-CN% 39.32 39.46 -0.36 -3.19 – 2.34 100 κ-CN% 10.49 10.25 2.37 -1.76 – 6.81 100 κ-CN composition, % κ-CNA% 39.23 60.51 -36.30 -52.93 – -16.68 0 Glyco κ-CN 45.45 47.09 -3.40 -8.13 – 0.70 98 βγ-CN composition, % β-CNA1% 24.12 25.02 -3.62 -14.22 – 7.65 79 β-CNA2% 52.74 49.76 6.61 -3.34 – 16.80 67 β-CNB% 18.05 19.53 -6.07 -27.24 – 14.73 55 γ-CN/β-CNF% 5.08 5.71 -10.50 -34.29 – 13.52 33
1 Protein = αS1-CN + αS2-CN + βγ-CN + κ-CN + β-LG + α-LA; casein = αS1-CN + αS2-CN + βγ-CN + κ-CN; whey protein = β-LG + α-LA;
κ-CNA% = κ-CNA/(κ-CNA + κ-CNB) × 100; HIGHB = milk containing a low κ-CN A to κ-CN B content ratio; LOWB = milk containing a high κ-CN A to κ-CN B content ratio; difference between milk was computed as (HIGHB - LOWB)/LOWB × 100; P = probability of (HIGHB - LOWB)/LOWB × 100 being within ±8%.

85
Table 3. Median and 95 % high posterior density interval (HPD95%) for the difference between means of experimental milk (low and high κ-CN A to B content ratio) in relation to milk and protein composition for Asiago cheese production1
Experimental milk Difference between milks (%) Item HIGHB LOWB Median HPD95% P Fat, % 3.94 3.87 1.93 -2.07 – 6.57 99 Protein, g/L 39.29 40.08 4.39 -6.77 – 9.63 94 Casein, g/L 34.10 34.64 -1.57 -7.17 – 4.09 98 Whey protein, g/L 5.17 5.43 -4.77 -14.28 – 4.49 81 Casein number, % 86.83 86.45 0.44 -0.29 – 1.16 100 Protein fractions content, g/L αS1-CN 12.95 13.22 3.94 -7.61 – 3.75 98 αS2-CN 4.11 4.26 -3.43 -8.57 – 1.84 96 βγ-CN 13.66 13.91 -1.72 -8.56 – 4.97 96 κ-CN 3.38 3.26 3.68 -5.46 – 13.36 83 α-LA 1.28 1.41 -8.59 -20.17 – 3.47 43 β-LG 3.89 4.03 -3.36 -13.50 – 7.38 83 Casein genetic variants content, g/L β-CNB 1.49 1.54 -3.27 -15.60 – 10.38 74 β-CNA1 4.07 3.93 3.59 -4.92 – 12.47 85 β-CNA2 7.21 7.66 -5.93 -16.65 – 4.71 69 γ-CN/β-CNF 0.89 0.77 16.25 -19.74 – 56.71 23 κ-CNA 1.07 1.24 -13.32 -26.58 – 1.08 16 κ-CNB 0.68 0.40 68.77 -14.01 – 191.20 2 β-LGA 1.76 2.13 -17.44 -30.13 – -3.48 5 β-LGB 2.13 1.90 12.18 -4.81 – 29.13 25 Casein composition, % αS1-CN% 37.98 38.18 -0.52 -1.22 – 0.29 100 αS2-CN% 12.05 12.29 -1.94 -7.50 – 2.88 98 βγ-CN% 40.07 40.14 -0.17 -1.61 – 1.22 100 κ-CN% 9.90 9.40 5.36 -3.04 – 13.71 77 κ-CN composition, % κ-CNA% 61.36 75.38 -18.63 -33.37 – -1.42 7 Glyco κ-CN 48.27 49.74 -2.85 -7.19 – 2.03 98 βγ-CN composition, % β-CNA1% 29.74 28.19 5.49 -2.78 – 13.38 78 β-CNA2% 52.70 55.06 -4.29 -11.18 – 3.30 87 β-CNB% 10.95 11.14 -1.71 -14.37 – 11.69 79 γ-CN/β-CNF% 6.61 5.60 18.09 -19.30 – 59.17 21
1 Protein = αS1-CN + αS2-CN + βγ-CN + κ-CN + β-LG + α-LA; casein = αS1-CN + αS2-CN + βγ-CN + κ-CN; whey protein = β-LG + α-LA;
κ-CNA% = κ-CNA/(κ-CNA + κ-CNB) × 100; HIGHB = milk containing a low κ-CN A to κ-CN B content ratio; LOWB = milk containing a high κ-CN A to κ-CN B content ratio; difference between milk was computed as (HIGHB - LOWB)/LOWB × 100; P = probability of (HIGHB - LOWB)/LOWB × 100 being within ±8%.
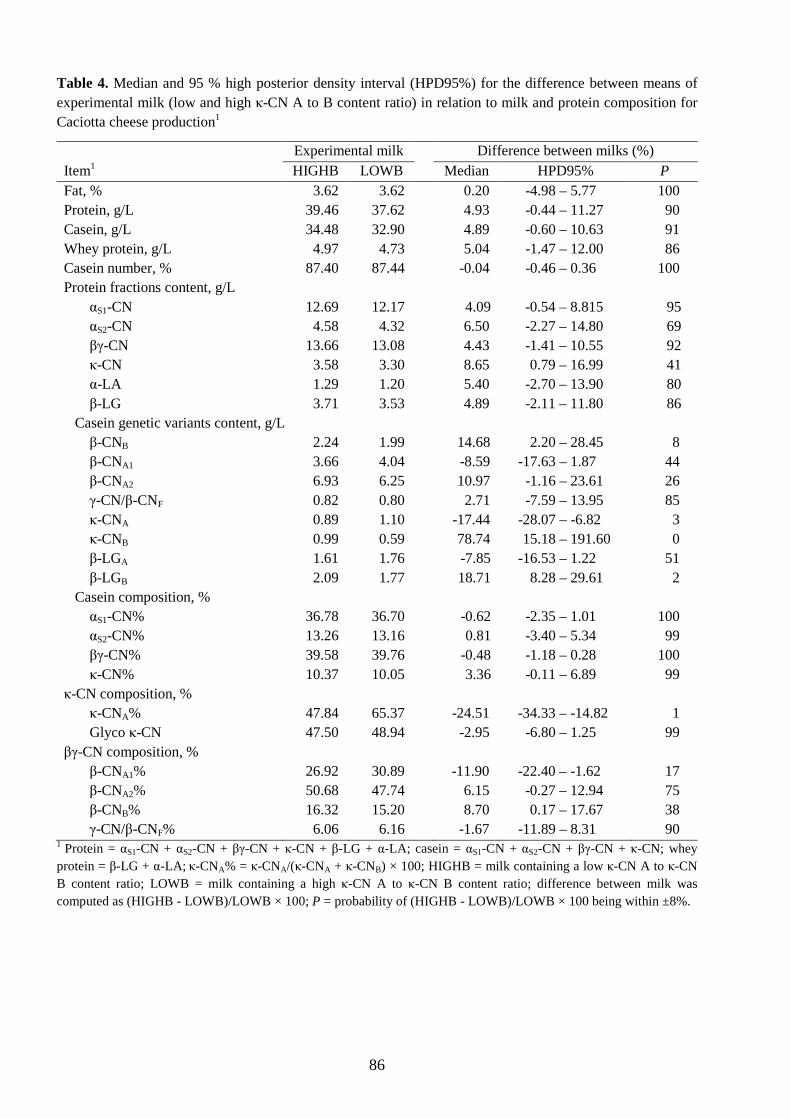
86
Table 4. Median and 95 % high posterior density interval (HPD95%) for the difference between means of experimental milk (low and high κ-CN A to B content ratio) in relation to milk and protein composition for Caciotta cheese production1
Experimental milk Difference between milks (%) Item1 HIGHB LOWB Median HPD95% P Fat, % 3.62 3.62 0.20 -4.98 – 5.77 100 Protein, g/L 39.46 37.62 4.93 -0.44 – 11.27 90 Casein, g/L 34.48 32.90 4.89 -0.60 – 10.63 91 Whey protein, g/L 4.97 4.73 5.04 -1.47 – 12.00 86 Casein number, % 87.40 87.44 -0.04 -0.46 – 0.36 100 Protein fractions content, g/L αS1-CN 12.69 12.17 4.09 -0.54 – 8.815 95 αS2-CN 4.58 4.32 6.50 -2.27 – 14.80 69 βγ-CN 13.66 13.08 4.43 -1.41 – 10.55 92 κ-CN 3.58 3.30 8.65 0.79 – 16.99 41 α-LA 1.29 1.20 5.40 -2.70 – 13.90 80 β-LG 3.71 3.53 4.89 -2.11 – 11.80 86 Casein genetic variants content, g/L β-CNB 2.24 1.99 14.68 2.20 – 28.45 8 β-CNA1 3.66 4.04 -8.59 -17.63 – 1.87 44 β-CNA2 6.93 6.25 10.97 -1.16 – 23.61 26 γ-CN/β-CNF 0.82 0.80 2.71 -7.59 – 13.95 85 κ-CNA 0.89 1.10 -17.44 -28.07 – -6.82 3 κ-CNB 0.99 0.59 78.74 15.18 – 191.60 0 β-LGA 1.61 1.76 -7.85 -16.53 – 1.22 51 β-LGB 2.09 1.77 18.71 8.28 – 29.61 2 Casein composition, % αS1-CN% 36.78 36.70 -0.62 -2.35 – 1.01 100 αS2-CN% 13.26 13.16 0.81 -3.40 – 5.34 99 βγ-CN% 39.58 39.76 -0.48 -1.18 – 0.28 100 κ-CN% 10.37 10.05 3.36 -0.11 – 6.89 99 κ-CN composition, % κ-CNA% 47.84 65.37 -24.51 -34.33 – -14.82 1 Glyco κ-CN 47.50 48.94 -2.95 -6.80 – 1.25 99 βγ-CN composition, % β-CNA1% 26.92 30.89 -11.90 -22.40 – -1.62 17 β-CNA2% 50.68 47.74 6.15 -0.27 – 12.94 75 β-CNB% 16.32 15.20 8.70 0.17 – 17.67 38 γ-CN/β-CNF% 6.06 6.16 -1.67 -11.89 – 8.31 90
1 Protein = αS1-CN + αS2-CN + βγ-CN + κ-CN + β-LG + α-LA; casein = αS1-CN + αS2-CN + βγ-CN + κ-CN; whey protein = β-LG + α-LA;
κ-CNA% = κ-CNA/(κ-CNA + κ-CNB) × 100; HIGHB = milk containing a low κ-CN A to κ-CN B content ratio; LOWB = milk containing a high κ-CN A to κ-CN B content ratio; difference between milk was computed as (HIGHB - LOWB)/LOWB × 100; P = probability of (HIGHB - LOWB)/LOWB × 100 being within ±8%.

87
Whey Composition
No significant difference for pH and for contents of protein fractions was observed in cheese-whey
from LOWB and HIGHB milks (data not reported in tables). Also dry matter, ash, protein and fat
contents did not vary between milks and exhibited a probability of similarity of at least 67 %.
Conversely, other authors reported higher levels of fat in the κ-CN AA cheese whey for Cheddar
(Graham et al., 1986; Walsh et al., 1995, 1998b), Gouda (van der Berg et al., 1992) and Mozzarella
(Walsh et al., 1998a). This finding was attributed to finer gel networks and to the resulting smaller
porosity of gels derived from of k-CN BB milks causing an improved fat retention. This effect was
likely reduced when milks with similar κ-CN contents were processed.
Milk Coagulation Properties
Posterior medians and HPD for the effect of experimental milk on MCP are reported in Table 5.
The probability of similarity between MCP of HIGHB and LOWB milks is also reported. A slightly
higher titratable acidity was observed in LOWB milks in comparison with HIGHB, even if pH was
similar in both types of milk.
In general, differences between HIGHB and LOWB milks observed for MCP were not relevant.
Although slight variations of MCP can be observed, they were not in favour of HIGHB milk. As
MCP are strictly related to pH of milk, a lacking difference in pH across experimental milks is
expected to have limited the difference in RCT between HIGHB and LOWB milk.
In a previous study (Walsh et al., 1998b) conducted using milks with similar contents of CN, κ-CN
BB milk had shorter RCT, and higher a30 when compared with κ-CN AA milk. It has been
suggested (Horne et al., 1996) that the shorter RCT of κ-CN BB milk probably results from a lower
critical level of κ-CN hydrolysis required for the onset of gelation. However, this property might be
ascribed to the increased κ-CN content of BB milk. Because, for a given CN content, the curd
firming rate has been reported to be inversely proportional to the cube of the micelle diameter
(Horne et al., 1996) and the micelle size is smaller when κ-CN content is greater, the higher curd
firming rate for κ-CN BB milk might be attributable to the smaller micelle size of this milk, which
allows for more numerous intermicellar bonds and for a more compact arrangement of the curd
(Horne et al., 1996). In agreement with our results, when the statistical analysis of MCP data have
been performed accounting for protein fractions contents or protein composition, no significant
effect of CSN3 alleles was observed for RCT and a30 (Marziali and Ng-Kwai-Hang, 1986b; Bonfatti
et al., 2009a). Our results seem to confirm that the favorable effects exerted by CSN3 B on MCP are
to be entirely attributable to modifications of protein composition caused by the differential
expression of this allele and not to a direct effect of the specific protein genetic variant on the
coagulation process.

88
Table 5. Median and 95 % high posterior density interval (HPD95%) for the difference between means of experimental milk (low and high κ-CN A to B content ratio) in relation to acidity and milk coagulation properties for Montasio, Asiago and Caciotta cheese production1
Item Experimental milk Difference between milks (%) HIGHB LOWB Median HPD95% P
Montasio pH 6.74 6.73 0.18 -1.31 – 1.68 100 SH° 3.22 3.37 -4.69 -19.64 – 11.36 34 RCT, min 21.80 21.24 2.73 -12.09 – 18.86 41 K20, min 2.33 2.43 -3.67 -30.96 – 30.88 26 a30, min 37.13 36.93 0.50 -14.66 – 15.60 49 Asiago pH 6.91 6.91 -0.08 -1.59 – 1.49 100 SH° 2.79 3.27 -14.08 -42.70 – 17.78 24 RCT, min 24.42 24.60 -0.71 -21.54 – 22.40 57 K20, min 3.47 2.99 16.26 -54.1 – 128.00 17 a30, min 27.92 30.19 -7.36 -48.52 – 44.27 27 Caciotta pH 6.76 6.78 -0.19 -1.82 – 1.29 100 SH° 3.24 3.30 -1.71 -15.70 – 13.47 74 RCT, min 21.93 22.07 -0.59 -31.59 – 33.75 43 K20, min 2.65 2.44 8.47 -54.74 – 96.30 25 a30, min 36.42 35.50 2.79 -26.53 – 32.28 46
1RCT = rennet clotting time; K20 = curd firming time; a30 = curd firmness; HIGHB = milk containing a low κ-CN A to κ-CN B content ratio; LOWB = milk containing a high κ-CN A to κ-CN B content ratio; difference between milk was computed as (HIGHB - LOWB)/LOWB × 100; P = probability of (HIGHB - LOWB)/LOWB × 100 being within ±8%.
Cheese Yield
Posterior medians and HPD for the effect of experimental milk on CY are reported in Table 6. The
probability that HIGHB milk gave a greater CY in comparison with LOWB milk is also reported,
together with the probability that the increase in CY for HIGHB milk was greater than 5 % of CY
for LOWB milk.
All HPD intervals estimated for CY1 and CY2 and for all trials included zero. However, mean CY1
and CY2 for HIGHB milk were higher than corresponding means for LOWB milk in MO, AS and
CA, with a probability of at least 70 %. Literature values reported that BB milk is responsible for a
5 % minimum increase of CY in comparison with AA milk. Hence, the probability of obtaining a 5
% greater CY when manufacturing HIGHB milk in comparison with LOWB milk was calculated.
Considering a 5 % increase in CY as a relevant difference across experimental milks, the
probability of a relevant difference markedly decreased. Only in MO cheese trials, HIGHB milk
exhibited CY means greater than 5 % of those provided by LOWB milk with a rather high
probability (67 and 51 % for CY1 and CY2, respectively). However, the increased CY observed for
HIGHB milk in MO trials was ascribed to its greater fat content in comparison with LOWB milk.

89
Regression analyses reported by Marziali and Ng-Kwai-Hang (1986a) indicated that for a 1 %-
increase in milk fat content a 1.07 %-increase in CY is to be expected. For a similar increase in milk
CN content a 1.59 %-increase in CY is likely to occur. For MO cheese, HIGHB milk had a fat
content that was 13 % higher than that of LOWB milk and the probability of the difference being
higher than 8 % was nearly 75 %. When data were adjusted for fat content, the increase of CY of
HIGHB milk, compared to LOWB milk, was smaller than 1 %, and the probability of obtaining a
relevant difference of CY across experimental milks was trivial (data not reported in table).
Although a slightly higher CY was observed for HIGHB milks in comparison with LOWB milks,
no relevant effects on CY due to the different relative ratio between κ-CN A and B genetic variants
were found on industrial scale cheese-making, within the range of milk κ-CNA% considered. When
milk composition was comparable across experimental milks, as for AS and CA cheese-making
trials, the probability that HIGHB milk gave a 5 % higher CY than that obtained with LOWB milk
was lower than 21 %. Likely, the slightly higher CY associated with HIGHB milk is to be attributed
to its slightly higher TCN or κ-CN content.
Table 6. Median and 95 % high posterior density interval (HPD95%) for the difference between means of experimental milk (low and high κ-CN A to B content ratio) in relation to cheese yield after brine (CY1) and final cheese yield (CY2) for Montasio, Asiago and Caciotta cheese
Item1 Experimental milk Difference between milks (%) HIGHB LOWB Median HPD95% P > 0 P > 5
Montasio CY1 12.12 11.44 5.89 -0.16 – 11.89 98 67 CY2 10.70 10.15 5.47 -1.13 – 11.73 85 51 Asiago CY1 11.59 11.44 1.28 -0.76 – 3.23 92 0 CY2 10.85 10.81 0.42 -1.36 – 2.39 70 0 Caciotta CY1 12.84 12.54 2.34 -3.06 – 8.10 83 14 CY2 11.71 11.39 2.89 -3.20 – 9.71 87 21
1 CY1was measured at 2 d for Montasio and Caciotta and 3 d for Asiago cheese; CY2 was measured for Montasio, Asiago and Caciotta at 60, 20 and 10 d, respectively; HIGHB = milk containing a low κ-CN A to κ-CN B content ratio; LOWB = milk containing a high κ-CN A to κ-CN B content ratio; difference between milk was computed as (HIGHB - LOWB)/LOWB × 100; P > 0: probability of (HIGHB - LOWB)/LOWB × 100 being greater than 0; P > 5 : probability of (HIGHB - LOWB)/LOWB × 100 being greater than 5%.
In most investigations involving Parmigiano-Reggiano, Cheddar or other cheese varieties, higher
yields of cheese, ranging from 5 to 10 %, were found in favour of κ-CN BB compared with κ-CN
AA milk (Buchberger and Dovč, 2000). For example, the moisture-adjusted Cheddar CY from κ-
CN BB milk was 8.2 % higher than that from κ-CN AA milk, whereas, for Mozzarella cheese, the

90
moisture-adjusted CY was 12 % higher in κ-CN BB milk (Walsh et al., 1998a,b).
In contrast to the majority of results, Schaar (1986) obtained no significant effect of CSN3
polymorphism on CY of Swedish cheese Svecia and he explained the inconsistency of results in
comparison with those obtained for Parmigiano-Reggiano by Morini et al. (1982) by the fact that
the cooking temperature when manufacturing Parmigiano-Reggiano is higher (55 °C instead of 41
°C for Svecia), thus supporting the syneresis and promoting the retention of fat in cheese. However,
temperature for Cheddar cheese-making was 31 °C in the experiment of Walsh et al. (1998b), thus
this inconsistency seems not to be ascribed to temperature.
Table 7. Median and 95 % high posterior density interval (HPD95%) for the difference between means of experimental milk (low and high κ-CN A to B content ratio) in relation to cheese composition of Montasio and Caciotta cheese at the end of the ripening period1
Item Experimental milk Difference between milks (%) HIGHB LOWB Median HPD95% P
Montasio DM 63.46 63.72 -0.41 -2.57 – 1.85 100 Protein, %DM 37.51 38.33 -2.11 -4.95 – 0.51 93 Fat, %DM 50.05 49.70 0.70 -3.43 – 4.99 93 Ash, %DM 6.25 6.28 -0.53 -5.55 – 4.97 86 Caciotta DM 56.70 56.50 0.37 -3.78 – 4.70 94 Protein, %DM 37.25 37.13 0.34 -2.00 – 2.67 100 Fat, %DM 49.80 51.48 -3.26 -6.71 – 0.29 79 Ash, %DM 6.06 6.37 -4.83 -13.74 – 5.20 44
1 The ripening period was 60 d for Montasio and 10 d for Caciotta; DM = dry matter; HIGHB = milk containing a low κ-CN A to κ-CN B content ratio; LOWB = milk containing a high κ-CN A to κ-CN B content ratio; difference between milk was computed as (HIGHB - LOWB)/LOWB × 100; P : probability of (HIGHB - LOWB)/LOWB × 100 being within ±5%.
However, up to date, most studies investigated the effect of κ-CN genetic variants on CY
processing milk of cows grouped on the basis of their CSN3 genotypes, without analyzing the CN
composition of milk (Van den Berg et al. 1992, Ng-Kwai-Hang and Grousclaude, 1994, Lodes et
al., 1996a). The only exception is the work of Marziali and Ng-Kwai-Hang (1986a). In that study, a
significant effect of CSN3 genotype on CY of 283 individual milk samples was observed, even
when accounting for protein composition, but a different CY was detected between AB and BB
genotypes and not between AA and BB genotypes. In addition, the content of the two variants in
milk was not quantified in that study. Several studies (Hallén et al., 2008; Heck et al., 2009)
reported that milk produced by heterozygous animals contains intermediate amounts of both
variants when compared to homozygous animals and the effect observed in the study by Marziali
and Ng-Kwai-Hang (1986a) seems to be not attributable to the difference in the relative ratio of
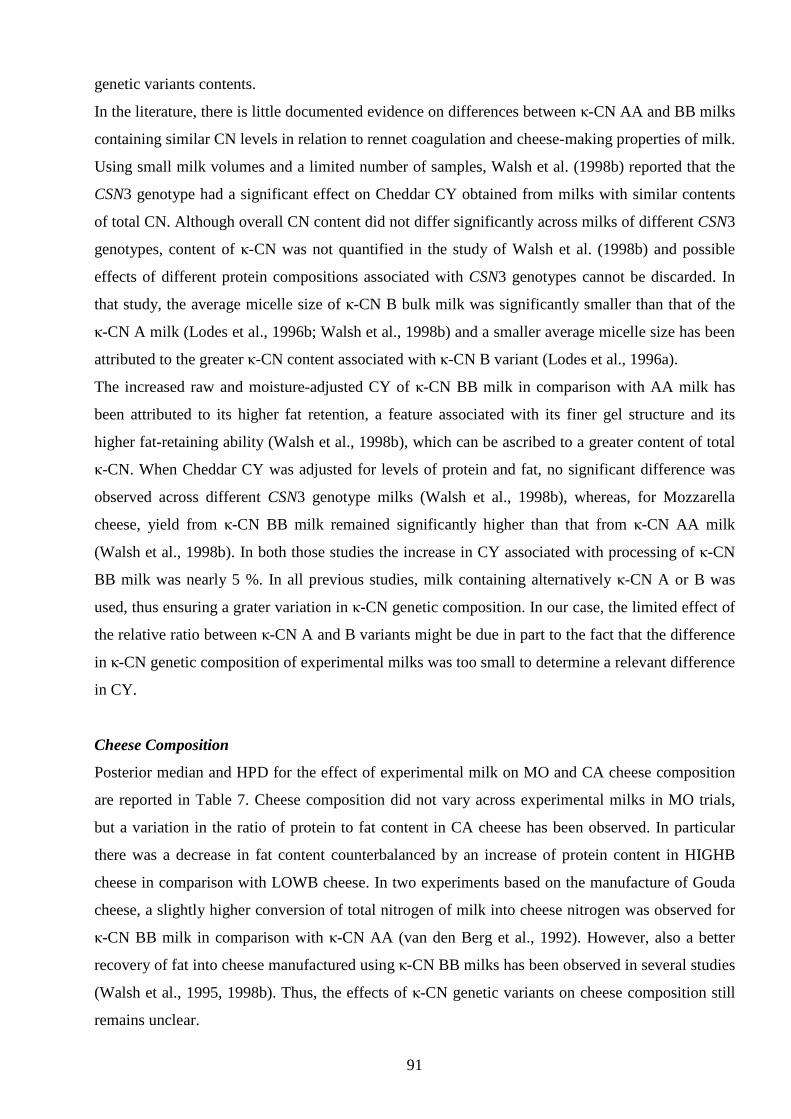
91
genetic variants contents.
In the literature, there is little documented evidence on differences between κ-CN AA and BB milks
containing similar CN levels in relation to rennet coagulation and cheese-making properties of milk.
Using small milk volumes and a limited number of samples, Walsh et al. (1998b) reported that the
CSN3 genotype had a significant effect on Cheddar CY obtained from milks with similar contents
of total CN. Although overall CN content did not differ significantly across milks of different CSN3
genotypes, content of κ-CN was not quantified in the study of Walsh et al. (1998b) and possible
effects of different protein compositions associated with CSN3 genotypes cannot be discarded. In
that study, the average micelle size of κ-CN B bulk milk was significantly smaller than that of the
κ-CN A milk (Lodes et al., 1996b; Walsh et al., 1998b) and a smaller average micelle size has been
attributed to the greater κ-CN content associated with κ-CN B variant (Lodes et al., 1996a).
The increased raw and moisture-adjusted CY of κ-CN BB milk in comparison with AA milk has
been attributed to its higher fat retention, a feature associated with its finer gel structure and its
higher fat-retaining ability (Walsh et al., 1998b), which can be ascribed to a greater content of total
κ-CN. When Cheddar CY was adjusted for levels of protein and fat, no significant difference was
observed across different CSN3 genotype milks (Walsh et al., 1998b), whereas, for Mozzarella
cheese, yield from κ-CN BB milk remained significantly higher than that from κ-CN AA milk
(Walsh et al., 1998b). In both those studies the increase in CY associated with processing of κ-CN
BB milk was nearly 5 %. In all previous studies, milk containing alternatively κ-CN A or B was
used, thus ensuring a grater variation in κ-CN genetic composition. In our case, the limited effect of
the relative ratio between κ-CN A and B variants might be due in part to the fact that the difference
in κ-CN genetic composition of experimental milks was too small to determine a relevant difference
in CY.
Cheese Composition
Posterior median and HPD for the effect of experimental milk on MO and CA cheese composition
are reported in Table 7. Cheese composition did not vary across experimental milks in MO trials,
but a variation in the ratio of protein to fat content in CA cheese has been observed. In particular
there was a decrease in fat content counterbalanced by an increase of protein content in HIGHB
cheese in comparison with LOWB cheese. In two experiments based on the manufacture of Gouda
cheese, a slightly higher conversion of total nitrogen of milk into cheese nitrogen was observed for
κ-CN BB milk in comparison with κ-CN AA (van den Berg et al., 1992). However, also a better
recovery of fat into cheese manufactured using κ-CN BB milks has been observed in several studies
(Walsh et al., 1995, 1998b). Thus, the effects of κ-CN genetic variants on cheese composition still
remains unclear.

92
CONCLUSIONS
This study showed that effects of genetic variants A and B at CSN3 on cheese yield are limited
when milks with similar protein composition and contents are processed. Hence, it is likely that the
positive universally-recognized effect of κ-CN B is almost exclusively due to the mediated effect of
the increased κ-CN content associated with κ-CN B milk, rather than to a direct effect of this
variant on the efficiency of the coagulation process. Further evidence might be provided by
experimental trials processing milk with similar κ-CN A to κ-CN B content ratio, but exhibiting
different levels of κ-CN to total casein content ratio. Finally, similarly to what experimented in this
study, cheese-making trials might be conducted to investigate the effect exerted by a variation in the
content of total β-CN and of its genetic variants in milk on cheese yield. Also this protein fraction
exhibits allele-specific expressions, in particular with the B variant, and its effect on cheese yields
needs to be investigated more accurately. A major critical issue for industrial cheese-making trials
is the volume of milk required, which markedly limit the number of experimental samples.
Methodologies that make feasible the assessment of cheese yield using reduced volumes of milk
should be developed and implemented.
ACKNOWLEDGMENTS
The authors like to thank the Provincial Breeders Association of Treviso for the organization of
bulk-milk sampling, the Milk quality Laboratory of Veneto Agricoltura (Thiene, Italy) for
providing milk fat measures, and Latteria Sociale di Tarzo e Revine Lago (Tarzo, Italy), Latterie
Trevigiane (Vedelago, Italy) and Latteria di Soligo (Soligo, Italy) for performing the cheese-making
trials. Financial support by Regione del Veneto (Azione Biotech III Bis, Delibera CIPE n. 03,
22/03/2006) is also gratefully acknowledged.
REFERENCES
AOAC. 2000. Official Methods of Analysis. 17th ed. AOAC, Arlington, VA. AOAC. 2002. Official Methods of Analysis. 17th ed. AOAC, Arlington, VA. AOAC. 2003. Official Methods of Analysis. 17th ed. AOAC, Gaithersburg, MD. Bonfatti, V., L. Grigoletto, A. Cecchinato, L. Gallo, and P. Carnier. 2008. Validation of a new reversed-phase high-
performance liquid chromatography method for separation and identification of bovine milk protein genetic variants. J. Chromatogr. A 1195:101–106.
Bonfatti, V., G. Di Martino, A. Cecchinato, L. Degano, and P. Carnier. 2009a. Effects of CSN2-CSN3 haplotypes, BLG genotypes and detailed protein composition on coagulation properties of individual milk of Simmental cows. J. Dairy Sci. Submitted
Bonfatti, V., G. Di Martino, A. Cecchinato, D. Vicario, and P. Carnier. 2009b. Effects of CSN2-CSN3 haplotypes and BLG genotypes on milk production traits, protein fractions contents and protein composition of individual milk

93
of Simmental cows. J. Dairy Sci. Submitted Buchberger, J., and P. Dovč. 2000. Lactoprotein genetic variants in cattle and cheese making ability. Food Technol.
Biotechnol. 38(Suppl. 2):91–98. Comin, A., M. Cassandro, S. Chessa, M. Ojala, R. Dal Zotto, M. De Marchi, P. Carnier, L. Gallo, G. Pagnacco, and G.
Bittante. 2008. Effects of composite β- and κ-casein genotypes on milk coagulation, quality, and yield traits in Italian Holstein cows. J. Dairy Sci. 91(10):4022-4027.
Dalgleish, D. G. 1998. Casein micelle and colloids: surface structure and stailities. J. Dairy Sci. 81:3013–3018. Dalgleish, D. G., D. S. Horne, and A. J. R. Law. 1989. Size-related differences in bovine casein micelles. Biochim.
Biophys. Acta 991(Suppl. 3):383–387. Dal Zotto, R., M. De Marchi, A. Cecchinato, M. Penasa, M. Cassandro, P. Carnier, L. Gallo and G. Bittante. 2008.
Reproducibility and repeatability of measures of milk coagulation properties and predictive ability of Mid-Infrared Reflectance Spectroscopy. J. Dairy Sci. 91:4103–4112.
Donnelly, W. J., G. P. McNeill, , W. Buchheim, and T. C. A. McGann. 1984. A comprehensive study of the relationship between size and protein-composition in natural bovine casein micelles. Biochim. Biophys. Acta 789(Suppl. 2):136–143.
Formaggioni, P., A. Summer, M. Malacarne, and P. Mariani. 1999. Milk protein polymorphism: Detection and diffusion of the genetic variants in Bos genus. Ann. Fac. Med. Vet. Un. Parma. XIX:127–165.
Geweke, J. 1992. Evaluating the accuracy of sampling-based approaches to the calculation of posterior moments (with discussion). In Bernardo, J. M., J. O. Berger, A. P. Dawid, and A. F. Smith (Eds.). Bayesian statistics (Vol. 4, pp. 169–193). Oxford, UK: Oxford University Press.
Grosclaude, F. 1988. Le polymorphisme génétique des principales lactoprotéines bovines. INRA Prod. Anim. 1(1):5–17.
Hallén, E., Wedholm A., A. Andrén, and A. Lundén. 2008. Effect of β-casein, κ-casein and β-lactoglobulin genotypes on concentration of milk protein variants. J. Anim. Breed. Genet. 17:791–799.
Heck, J. M. L., A. Schennink, H. J. F. van Valenberg, H. Bovenhuis, M. H. P. W. Visker, J. A. M. van Arendonk, and A. C. M. van Hooijdonk. 2009. Effects of milk protein variants on the protein composition of bovine milk. J. Dairy Sci. 92:1192–1202.
Horne, D.S. 1998. Casein interactions: casting light on the black boxes, the structure in dairy products. Int. Dairy J. 8(Suppl. 3): 171–177.
Jakob, E., and Z. Puhan. 1992. Technological properties of milk as influenced by genetic polymorphism of milk proteins: a review. Int. Dairy J. 2:157–178.
Lodes, A., J. Buchberger, J. Aumann, and H. Klostermeyer. 1996a. The influence of genetic variants of milk proteins on the compositional and technological properties of milk: 1. Casein micelle size and the content of non-glycosylated kappa-casein. Milchwissenshaft 51:368–373.
Lodes, A., J. Buchberger, J. Aumann, and H. Klostermeyer. 1996b. The influence of genetic variants of milk proteins on the compositional and technological properties of milk: 2. Rennet coagulation time and firmness of the rennet curd. Milchwissenshaft 51:543–547.
Marziali, A. S., and K. F. Ng-Kwai-Hang. 1986. Relationships between milk protein polymorphisms and cheese yielding capacity. J. Dairy Sci. 69:1193–1201.
Marziali, A. S., and K. F. Ng-Kwai-Hang. 1986. Effects of milk composition and genetic polymorphism on coagulation properties of milk. J. Dairy Sci. 69:1793–1798.
Morini, D., G. B. Castagnetti, C. Chiavari, L. Grazia, G. Losi, R. Davoli and P. Bosi. 1982. Prova di caseificazione con latte caratterizzato dalle varinati A e B della β-lattoglobulina nella produzione del formaggio Parmigiano-Reggiano. Scienze e tecnica lattiero-casearia 30:243–262.
Rahali, V., and J. L. Ménard. 1991. Influence des variants génétiques de la β-lactoglobuline et de la κ-caséine sur la composition du lait et son aptitude fromagère. Lait 71:275–297.
Schaar, J., B. Hansson, and H. E. Pettersson. 1985. Effects of genetic variants of κ-casein and β-lactoglobulin on cheesemaking. J. Dairy Res. 52:429–437.
Sorensen, D., and Gianola, D. 2002. Likelihood, Bayesian, and MCMC methods in quantitative genetics. New York: Springer.
van den Berg, G., J. T. M. Escher, P. J. de Koning, and H. Bovenhuis. 1992. Genetic polymorphism of κ-casein and β-lactoglobulin in relation to milk composition and processing properties. Neth. Milk Dairy J. 46:145–168.
Walsh, C. D., T. Guinee, D. Harrington, R. Mehra, J. Murphy, J. F. Connolly, and R. J. Fitzgerald. 1995. Cheddar cheesemaking and rennet coagulation characteristics of bovine milks containing κ-casein AA or BB genetic variants. Milchwissenshaft 50:492–496.

94
Walsh, C. D., T. P. Guinee, D. Harrington, R. Mehra, J. Murphy, and R.J. Fitzgerald. 1998. Cheesemaking, compositional and functional characteristics of low-moisture part-skim Mozzarella cheese from bovine milks containing κ-casein AA or BB genetic variants. J. Dairy Res. 65:307–315.
Walsh, C. D., T. P. Guinee, W. D. Reville, D. Harrington, J. J. Murphy, B. T. O’Kennedy, and R. J. FitzGerald. 1998. Influence of κ-casein genetic variant on rennet gel microstructure, cheddar cheesemaking properties and casein micelle size. Int. Dairy J. 8:707–714.
Walstra, P. and T. Van Vliet. 1986. The physical chemistry of curd making. Neth. Milk Dairy J., 40:241–259. Wedholm, A., L. B. Larsen, H. Lindmark-Månsson, A. H. Karlsson, and A. Andrén. 2006. Effect of protein
composition on the cheesemaking properties of milk from individual dairy cows. J. Dairy Sci. 89:3296–3305.

95
Chapter 5.
Estimation of genetic parameters for detailed milk protein
composition and coagulation properties in Simmental breed
V. Bonfatti,* A. Cecchinato,* L. Gallo,* A. Blasco,† and P. Carnier*
*Department of Animal Science, University of Padova, Viale dell’Università 16, 35020 Legnaro
(PD), Italy †Departamento de Ciencia Animal, Universidad Politécnica de Valencia, P.O. Box 22012, 46071
Valencia, Spain
To be submitted to Journal of Dairy Science


97
Estimation of genetic parameters for detailed milk protein composition and coagulation
properties in Simmental breed
V. Bonfatti,* A. Cecchinato,* L. Gallo,* A. Blasco,† and P. Carnier*
*Department of Animal Science, University of Padova, Viale dell’Università 16, 35020 Legnaro
(PD), Italy †Departamento de Ciencia Animal, Universidad Politécnica de Valencia, P.O. Box 22012, 46071
Valencia, Spain
ABSTRACT
The aim of this study was to estimate genetic parameters of major milk protein fractions and
estimate genetic and phenotypic correlations between milk protein fractions and coagulation
properties. Contents of αS1-, αS2-, β-, γ-, and κ-casein (CN), β-Lactoglobulin (β-LG), and α-
Lactalbumin (α-LA) were measured by reversed-phase HPLC in individual milk samples of 2,167
Simmental cows. Values of estimated heritability ranged from 0.11 to 0.52, for the content of α-LA
and κ-CN, respectively. The highest values were those of κ-CN and β-CN which synthesis is mainly
controlled by CSN3 and CSN2 loci. Values of heritability for αS1-CN%, κ-CN% and β-CN% were
similar and ranged from 0.61 to 0.70, whereas heritability of αS2-CN%, γ-CN% and β-LG% were
0.28, 0.29 and 0.33, respectively. When CSN2-CSN3 haplotype and BLG genotype are accounted
for by the model, heritability estimates of all the protein fractions became similar suggesting that
proteins synthesis is regulated by genes which control the overall production of milk protein.
Genetic correlations among the contents of the five CN fractions and between CN fractions and
whey protein (WH ) fractions were generally low. Increasing the level of total CN (TCN) would
increase the proportion of β-CN and κ-CN while decreasing the others. Generally, all the CN
fractions were also moderately positively correlated with WH. When data where adjusted for CSN2-
CSN3 haplotype and BLG genotype, genetic correlations among the contents of protein fractions
markedly increased confirming that all the fractions undergone a common regulation. The content
and the relative proportion of κ-CN were not genetically correlated with rennet coagulation time
(RCT), αS1- and αS2-CN were unfavourately correlated with RCT, but increasing the content of β-
CN in milk would result in a shorter RCT. Stronger curds were associated with higher κ-CN and β-
CN, and with lower αS1-, αS2-, and γ-CN contents and proportions. Results confirm the lack of
favorable associations between TCN and MCP indicating that other traits, i.e. milk protein
fractions, should be used for the genetic improvement of cheese-making properties.

98
INTRODUCTION
Milk protein polymorphisms and protein composition are known to be responsible for the variation
of milk coagulation properties (MCP) (Wedholm et al., 2006; Jõudo et al., 2008; Bonfatti et al.,
2009a,b) and the relative concentrations of the major protein fractions is the primary cause of the
effect exerted by protein polymorphisms on the variation of MCP (Bonfatti et al., 2009a). For this
reason, milk protein composition might play an important role in the profitability of the dairy
industry.
Genetic variation of MCP measures has been reported by many authors (Ikonen et al., 1999;
Cassandro et al. 2008; Cecchinato et al., 2009) and improvement of MCP based on selective
breeding has been proposed (Ikonen et al., 2004). In addition, marker-assisted selection through the
use of milk protein genes has been also suggested (Wedholm et al., 2006; Hallén et al., 2008; Heck
et al., 2009). To evaluate the possibility of altering milk protein composition through selective
breeding, but also to evaluate the possible effects of implementing a marker-assisted selection based
on milk protein polymorphisms, genetic parameters of milk protein fractions contents and genetic
correlations between protein fractions contents and MCP measures need to be investigated.
Only a few studies have estimated the magnitude of the genetic variation of milk proteins (Kroeker
et al., 1985; Ikonen et al., 1997; Bobe et al., 1999; Graml and Pirchner, 2003) because of the
analytical difficulties of quantifying the major bovine milk proteins simultaneously on a large
sample size. Only one study (Schopen et al., 2009) reported the estimated genetic correlations
among protein fractions in Dutch Holstein Friesian. Genetic correlations between protein fractions
and MCP measures have never been reported before.
The aims of this study were to investigate genetic variation of milk protein fractions contents,
detailed protein composition and MCP, and to infer genetic correlations among protein fractions, in
a population of Simmental cows. The genetic correlations between milk protein fractions contents
and MCP was estimated as well.
MATERIALS AND METHODS
Animals and Milk Sampling
Individual milk samples of 2,167 Simmental cows, distributed across 47 commercial herds in the
north of Italy, were collected from November 2007 to December 2008. Individual milk samples
(one per animal) were collected during the morning or evening milking of a test day. Milk was
added with preservative (Bronopol, 0.6:100 vol/vol) immediately after collection, to prevent
microbial growth, and stored at –40°C until reversed-phase (RP-) HPLC analysis, to prevent

99
enzymatic proteolysis. Pedigree information was supplied by the Italian Simmental Cattle Breeders
Association (ANAPRI, Udine, Italy) and included all known ancestors of sampled cows.
Milk Protein Composition and Genotyping
Contents of αS1-CN, αS2-CN, β-CN, γ-CN, κ-CN, β-LG, and α-LA were measured using the RP-
HPLC method proposed by Bonfatti et al. (2008). Genotypes of cows for CSN2, CSN3, and BLG
loci, were also derived by RP-HPLC. The method provides the quantification of A1, A2, B and I
variants of β-CN, A and B variants of κ-CN, and A, B and D variants of β-LG. A detailed
description of the RP-HPLC technique used in this study can be found in Bonfatti et al. (2008) and
more indications are reported by Bonfatti et al. (2009b).
Milk coagulation properties
Rennet coagulation time (RCT) and curd firmness (a30) of individual milk samples were obtained
by using the Computerized Renneting Meter (CRM-48, Polo Trade, Monselice, Italy) within 3 h
after sample collection. The description of the instrument and the details of the method used have
been reported by Dal Zotto et al. (2008) and Bonfatti et al. (2009a). Samples that did not coagulate
within 31 min were classified as non-coagulating milk. Measures of pH (pH-Burette 24, Crison)
were obtained before measurement of MCP.
Traits Definition
For proteins quantified by RP-HPLC, total casein (TCN, g/L) was computed as the sum of αS1-CN,
αS2-CN, β-CN, γ-CN and κ-CN contents of milk. Total whey protein (WH , g/L) was calculated as
the sum of α-LA and β-LG contents. Total protein (PRT, g/L) was expressed as the sum of TCN
and WH contents. Protein composition (i.e., relative contents of protein fractions) was computed as
weight percentage ratio of αS1-CN (αS1-CN% , %), αS2-CN (αS2-CN% , %), β-CN (β-CN% , %), γ-
CN (γ-CN% , %), and κ-CN (κ-CN% , %) to TCN and as the percentage ratio of β-LG to WH (β-
LG%, %).
Computation of Haplotypes Probabilities
The probability for each CSN2-CSN3 possible haplotype inherited by each daughter was estimated
using the method proposed by Boettcher et al. (2004). Computation of haplotype probabilities was
carried out by assuming no recombination events between CN genes. The expected number of
copies of each haplotype carried by each animal can be indirectly derived by the estimated
probabilities. More details on the haplotype probabilities estimation can be found also in Bonfatti et
al. (2009b).

100
Statistical analysis
The model of analysis for all traits included the infinitesimal genetic effect of each animal (ai), as
well as some non genetic sources of variation: the effects of herd-test day (47 levels); parity of the
cow (4 levels); DIM (12 classes of 30-d intervals, with the exception of the last class, which
included samples collected at DIM 330 or greater). An alternative model included also the genetic
effect of CSN2-CSN3 haplotype as regressions on haplotype probabilities, and BLG genotype (AA,
AB, BB). Note that we assumed an additive model following in part the standard model of Falconer
and Mackay (1996).
Estimation of (Co)variance Components and Genetic Parameters. Estimation of (co)variance
components for the contents of protein fractions, protein composition, and MCP was performed
through bivariate Bayesian analyses. The general model, in matrix notation, can be written as:
+
⋅
+
⋅
+
⋅
=
2
1
2
1
2
1
2
1
2
1
2
1
2
1
2
1
e
e
a
a
Z0
0Z
q
q
U0
0U
β
β
X0
0X
y
y
where 1y and 2y are vectors of phenotypic records for trait 1 and 2, respectively; β 1 and β 2 are
vectors of non genetic effects and of the genetic effects of CSN2-CSN3 haplotype and BLG
genotype; 1X and 2X , are known incidence matrices relating effects in 1β and 2β to 1y and 2y ,
respectively; q 1 and q 2 are vectors of herd effects considered to be normally distributed as
[ ] ( )IQ0qq 21 , ~ ⊗′ N where Q is the (co)variance matrix between herd effects for trait 1 and 2;
1U , and 2U , are known incidence matrices relating herd effects in 1q and 2q to 1y and 2y ,
respectively; a 1 and a 2 are vectors of additive genetic effects of animals assumed to follow a
multivariate normal distribution with [ ] ( )AG0aa 021 , ~ ⊗′ N , where 0G is the (co)variance
matrix between animal effects, and A is the numerator of Wright's relationship matrix; 1Z , and 2Z
are known incidence matrices relating additive genetic effects in 1a and 2a to 1y and 2y ,
respectively; e1 and e2 are vectors of residual effects assumed to follow a multivariate normal
distribution with [ ] ( )IR0ee 021 , ~ ⊗′ N , where 0R is the (co)variance between residual effects
for trait 1 and 2. Prior distributions for effects in β 1 and β 2 were assumed to be uniform whereas
those for herds, and additive genetic effects were inverted Wishart distributions. Marginal posterior
distributions of parameters of concern (i.e., covariance components, heritabilities and correlations)
were estimated by performing numerical integration through the Gibbs sampler, as implemented in
the program TM by Legarra et al. (2007, available on request from the author at
[email protected]). A unique Gibbs chain of 5,000,000 iterations was run for each
bivariate analysis. Samples were saved every 250 iterations. The effective length of the burn-in

101
period was calculated following the methods of Raftery and Lewis (1992), respectively. The
posterior median was used as a point estimate of parameters of concern. Lower and upper bounds of
the highest posterior density interval with 95 % probability (HPD) for the heritability, and
correlations were obtained from the estimated marginal densities.
Estimated heritability was defined as:
2e
2h
2a
2a2
σσσ
σh
++=
where 2aσ is the additive genetic variance,
2hσ is the herd variance and
2eσ is the residual variance.
Genetic correlations were estimated as:
a2a1
a2a1,a
σσ
σr
⋅=
where a2a1,σ is the additive genetic covariance between trait 1 and 2, and a1σ and a2σ are the
additive genetic standard deviation of trait 1 and 2, respectively. Phenotypic correlations were
computed as:
p2p1
p2p1,p
σσ
σr
⋅=
where p2p1,σ is the phenotypic covariance between trait 1 and 2, and p1σ and p2σ are the
phenotypic standard deviation of trait 1 and 2, respectively.
RESULTS AND DISCUSSION
Descriptive statistics for contents of protein fractions and protein composition, as well as genotype,
allele, and haplotype frequencies for data used in this study can be found in Bonfatti et al. (2009b).
Descriptive statistics for MCP can be found in Bonfatti et al. (2009a).
Heritability of Contents of Protein Fractions
Point estimates (median of the marginal posterior density of the parameter) of heritability for
contents of protein fractions, protein composition and MCP are reported in Table 1. The median of
the marginal posterior distribution was used as a point estimate of all the parameters of concern
because in its loss function errors are considered according to their value and not to their square or
other transformations, and because it is invariant to transformations. However, median, mean and
mode were coincident, as posterior distributions for all the traits investigated were almost
symmetrical.

102
Table 1. Features of the marginal posterior densities for the heritability of milk protein fractions and protein composition1.
Complete genome2 Polygenic background3 Trait4 h2 HPD95% σa h2 HPD95% σa Casein, g/L 0.23 0.14 – 0.33 1.77 0.18 0.10 – 0.29 1.49 Whey protein, g/L 0.29 0.22 – 0.37 0.35 0.20 0.12 – 0.29 0.28 Protein fractions content, g/L αS1-CN 0.23 0.16 – 0.30 0.65 0.17 0.08 – 0.26 0.53 αS2-CN 0.22 0.16 – 0.29 0.33 0.19 0.12 – 0.28 0.30 β-CN 0.46 0.37 – 0.55 1.25 0.18 0.09 – 0.27 0.61 γ-CN 0.25 0.19 – 0.33 0.22 0.04 0.01 – 0.09 0.07 κ-CN 0.52 0.42 – 0.63 0.59 0.26 0.15 – 0.38 0.51 α-LA 0.11 0.05 – 0.17 0.08 0.09 0.04 – 0.15 0.07 β-LG 0.38 0.30 – 0.46 0.32 0.24 0.16 – 0.40 0.24 Protein composition, % αS1-CN% 0.66 0.58 – 0.73 2.01 0.28 0.17 – 0.38 0.81 αS2-CN% 0.28 0.22 – 0.35 0.87 0.24 0.15 – 0.33 0.78 β-CN% 0.70 0.58 – 0.81 2.30 0.18 0.10 – 0.28 0.64 γ-CN% 0.18 0.12 – 0.25 0.57 0.05 0.02 – 0.11 0.28 κ-CN% 0.61 0.53 – 0.71 1.54 0.23 0.14 – 0.33 0.53 β-LG% 0.33 0.24 – 0.43 2.19 0.19 0.11 – 0.27 1.49 Milk coagulation properties RCT, min 0.29 0.19 – 0.39 2.43 0.23 0.13 – 0.33 2.06 a30, mm 0.12 0.03 – 0.21 3.04 0.10 0.03 – 0.18 2.16 pH 0.18 0.10 – 0.26 0.03 0.17 0.09 – 0.25 0.02
1 h2 = median of the marginal posterior density of the heritability; HPD95% = 95 % high posterior density interval; σa = median of the marginal posterior density of the additive genetic standard deviation; 2 Model did not included information on CSN2-CSN3 haplotype and BLG genotype; 3 Model included regressions on CSN2-CSN3 haplotype probabilities and BLG genotype; 4 Contents of all protein fractions were measured by reversed-phase HPLC on skimmed milk; casein = αS1-CN + αS2-CN + β-CN + γ-CN + κ-CN; whey protein = β-LG + α-LA ; protein = casein + whey protein; casein number = (casein/protein) × 100; αS1-CN%, αS2-CN%, β-CN%, γ-CN% and κ-CN% are measured as weight percentages of total casein content; β-LG% is measured as weight percentage of total whey protein content; RCT = rennet coagulation time; a30 = curd firmness.
Heritability estimates for the protein fraction contents ranged from 0.11 to 0.52, for the content of
α-LA and κ-CN, respectively. The highest values of heritability were those of κ-CN and β-CN
which synthesis is mainly controlled by CSN3 and CSN2 loci. The content of β-LG, which is known
to be affected for a large extent by BLG locus, exhibited a value of heritability of 0.38.
In most studies (Bobe et al., 1999; Schopen et al., 2009) heritability estimates have been reported
only for the relative proportion of protein fractions on total protein. Graml and Pirchner (2003)
reported heritability estimates for the contents of protein fractions in Fleckvieh and Braunvieh cattle
for roughly 2,000 cows per breed, combining heritability estimates derived from a sire model and a
daughter to dam regression for both breeds.
The heritability estimates were similar to those obtained by Graml and Pirchner (2003), with the

103
exception of κ-CN and β-CN fractions which values were significantly lower than the ones reported
in this study. These differences could be due to the combination of different methods of variance
component estimation and different breeds used.
The content of α-LA get the lower value of heritability. This can be in part explained by the lower
accuracy of its quantification by RP-HPLC in respect to that of the other protein fractions, which
likely increased the error variance. Despite some difficulties of quantification due to the multiple
peaks and their limited resolution, heritability estimated for total γ-CN content was similar to that
obtained for TCN, WH, αS1-CN, and αS2-CN. With the only exception of α-LA, all the heritability
estimates were higher than 0.10 with a probability greater than 94 % (data not reported in table).
The high values of heritabilities indicate that it might be possible to increase the contents of specific
protein fractions in milk through breeding strategies. The only limitation could be due to the
difficult to collect phenotypic records for these traits. Interestingly, κ-CN and β-CN resulted more
heritable than TCN, indicating that selection for increasing these two protein fractions would be
more effective than selection for increasing the overall level of CN of milk.
Heritability of Protein Composition
Point estimates (posterior medians) and HPD of the heritability for the proportions of protein
fractions are reported in Table 1. Values of the posterior median of the heritability for αS1-CN%, κ-
CN% and β-CN% were similar and ranging from 0.61 to 0.70. This confirms the results obtained in
previous works (Bobe et al., 1999; Bonfatti et al., 2009b) on the effect exerted by CN haplotypes on
protein composition. In those studies, a tight relation between the relative proportion of these three
protein fractions on TCN depending on the CN haplotype was observed.
Heritability of αS2-CN% was only moderate (0.28). Conversely, Schopen et al. (2009) found a
heritability estimate of αS2-CN% markedly higher in comparison with our result and similar to the
values obtained for αS1-CN% and κ-CN%.
As suggested by Schopen et al. (2009), heritability estimates might differ across studies depending
on the accuracy of the analytical methods used to quantify the contents of milk protein fractions.
For example, Kroeker et al. (1985), using PAGE combined with densitometry on a dataset of over
11,000 test-day records, obtained heritability values for protein composition not significantly
different from zero. When compared to other methods, RP-HPLC, like capillary zone
electrophoresis, is a tool characterized by high repeatability and reproducibility (Bonfatti et al.,
2008), resulting in a marked decrease of the random error variance. In the study by Schopen et al.
(2009), protein fractions contents have been quantified by the method proposed by Heck et al.
(2008) and only the glyco-free portion of the total κ-CN content could be quantified, because the
glycosylated form, roughly a half of the total κ-CN content, co-eluted with β-CN. This might in part

104
explain the marked difference between values of heritability of β-CN obtained in that study and our
estimates. β-CN exhibited a markedly higher heritability (0.70), in comparison with the value (0.25)
obtained by Schopen et al. (2009). Estimates of heritability of κ-CN are more similar, but a lower
value has been found by Schopen et al. (2009). However, also differences of sample size, breeds or
allele frequencies can contribute to the inconsistencies in heritability estimates observed across
studies.
As WH is composed by β-LG and α-LA, they sum up to 100%. Consequently, they obtained the
same value of heritability and results for α-LA have been omitted. β-LG% exhibited only a
moderate heritability (0.33) in comparison with that obtained for αS1-CN%, κ-CN% and β-CN%,
and had a value markedly lower than that obtained by Schopen et al. (2009), but in line with the
estimates reported by Bobe et al. (1999). Differences in the extent of the allele-differential
expression of heterozygous animals across population have been reported (Ng-Kwai-Hang et al.,
1998) and inconsistencies in the heritability estimates for β-LG% across studies might be partially
explained by the possible different extent of the effect of the BLG locus in determining the
expression of the β-LG genetic variants across populations. Heck et al. (2008) and Bobe et al.
(1999) reported that the relative contents of β-LG in milk depend almost exclusively on BLG
genotypes, in Dutch and US Holstein Friesian, respectively, but, in a previous study conducted on
Simmental cows (Bonfatti et al., 2009b), a smaller effect of the allele-specific expression of β-LG
have been observed, in comparison with that reported in those studies.
Proportion of the Genetic Variation explained by CSN2-CSN3 Haplotype and BLG Genotype
The relevance of CSN2-CSN3 haplotype and BLG genotype in explaining the variation of milk
protein fractions was also investigated (Table 1). Results showed that milk protein genes account
for a large part of the genetic variation of milk protein composition. Accounting for milk protein
loci reduced considerably the polygenic additive genetic variance of αS1-CN, β-CN, κ-CN and β-LG
contents and relative proportions.
In agreement with Bobe et al. (1999), who found that CSN3 and BLG genotypes explained a
significant part of the genetic control of αS1-CN, the genetic variance of αS1-CN% was strongly
reduced when model accounted for CSN2-CSN3 haplotype and BLG genotype. Like for κ-CN%,
milk protein loci explained roughly the 60 % of the heritability of αS1-CN%. Conversely, Schopen
et al. (2009) reported that genotypes at CSN3 and BLG loci had no effect on the polygenic additive
genetic variance for αS1-CN. Casein haplotype explained more than 70 % of the genetic variation of
β-CN%. In both those studies, the genetic control of β-LG fraction was nearly complete by BLG
genotypes. Conversely, our results indicate that, despite a strong effect exerted by BLG genotype
on the expression of β-LG%, the residual genetic variance remains noteworthy, indicating that other

105
genes, besides those considered, are responsible of the genetic variation of this protein fraction.
Good candidates seem to be the polymorphisms at BLG promoter region (Martin et al., 2002).
Interestingly, when CSN2-CSN3 haplotype and BLG genotype are accounted for in the model,
heritability estimates of all the protein fractions, but also heritabilities obtained for the contents of
protein fractions and their relative proportions on TCN or WH, became similar. This suggests that
milk proteins synthesis undergone a genetic control by specific genes (CNs and BLG loci) but also
by genes which control the overall production of milk protein and are responsible for one-third to
almost the totality of the genetic variation, depending on the protein fraction.
While the mutations described above can dramatically affect the levels of expression of the genes in
which they are located, effects on TCN or WH were less pronounced. One hypothesis is that when
expression of one CN gene is downregulated, the others can be upregulated to compensate
(Lerouxet al. 2003).
Inconsistencies across studies on the proportion of the genetic variation of milk proteins contents
explained by milk protein loci might be due to different extent of the linkage disequilibrium
between milk protein loci and polymorphisms located in their promoter region. Bovenhuis et al.
(1992) suggested that the conflicting results of the effects of mutations in CN genes might be due to
linkage between mutations in different CNs, as well as the different statistical models used in the
analyses. They proposed a multigene model as an alternative to single-gene models. As mutations
with effects on quantitative traits can occur in exons, introns promoters, and other regulatory
sequences (Hoogendoorn et al. 2003), it is possible that the functional mutation(s) will not be within
the set of mutations (such as single-nucleotide polymorphisms, SNPs) genotyped in the data set.
Heritability of Milk Coagulation Properties
Heritability estimates for RCT, a30 and pH are reported in Table 1. Estimated heritability for RCT
and pH was similar to previous reports (Ikonen et al., 1999, 2004; Tyrisevä et al., 2004; Cassandro
et al., 2008). Heritability estimate for a30 measures obtained in this study were similar to those
obtained by Tyrisevä et al. (2004) from a sample of Finnish Ayrshire and Holstein-Friesian cows,
and Cassandro et al. (2008) in Holstein-Friesian, but lower than estimates reported by other authors.
Ikonen et al. (1999) reported estimates of heritability for a30 of 0.40, whereas Ikonen et al. (2004)
and Cecchinato et al. (2009) obtained estimates of heritability for a30 ranging from 0.22 to 0.39 and
from 0.22 to 0.27, respectively. Differences in breeds and statistical models might explain some of
these inconsistencies.
The relevance of CSN2-CSN3 haplotype and BLG genotype in explaining the variation of MCP and
pH was also investigated showing that milk protein genes did not affect the genetic variation of pH,
but accounted for 15 % and 30 % of the additive genetic variance of RCT and a30, respectively.

106 106
106 106
Table 2. Median and 95 % highest posterior density interval (in parenthesis) of the marginal posterior density of additive genetic (above diagonal) and phenotypic (below diagonal) correlations between contents (g/L) of milk protein fractions1
Protein fraction TCN WH αS1-CN αS2-CN β-CN γ-CN κ-CN α-LA β-LG
TCN
0.42 0.41 0.43 0.80 0.51 0.45 0.29 0.38 (0.19, 0.61) (0.13, 0.63) (0.18, 0.64) (0.71, 0.88) (0.22, 0.75) (0.24, 0.64) (-0.05, 0.60) (0.16, 0.57)
WH 0.67 0.26 0.43 0.26 0.46 0.05 0.33 0.98 (0.63, 0.71) (-0.01, 0.48) (0.23, 0.61) (0.05, 0.44) (0.22, 0.69) (-0.17, 0.26) (0.04, 0.55) (0.96, 0.99)
αS1-CN 0.80 0.61 0.22 -0.07 -0.14 0.12 0.09 0.26 (0.77, 0.82) (0.56, 0.66) (-0.06, 0.49) (-0.37, 0.20) (-0.42, 0.17) (-0.14, 0.36) (-0.28, 0.42) (0.15, 0.54)
αS2-CN 0.60 0.56 0.43 0.14 0.50 0.11 0.38 0.35 (0.55, 0.66) (0.49, 0.63) (0.35, 0.50) (-0.09, 0.36) (0.24, 0.73) (-0.13, 0.34) (0.09, 0.64) (0.15, 0.54)
β-CN 0.86 0.52 0.53 0.37 0.39 0.08 0.14 0.25 (0.84, 0.87) (0.47, 0.58) (0.49, 0.58) (0.31, 0.44) (0.16, 0.61) (-0.13, 0.28) (-0.16, 0.42) (0.06, 0.42)
γ-CN 0.12 -0.02 -0.06 0.08 -0.01 0.08 0.50 0.36 (0.05, 0.18) (-0.10, 0.05) (-0.12, 0.00) (0.00, 0.16) (-0.07, 0.05) (-0.15, 0.33) (0.21, 0.77) (0.12, 0.59)
κ-CN 0.55 0.27 0.30 0.27 0.30 0.04 0.11 0.06 (0.50, 0.60) (0.21, 0.34) (0.24, 0.36) (0.20, 0.33) (0.24, 0.36) (-0.02, 0.10) (-0.20, 0.41) (-0.14, 0.26)
α-LA 0.37 0.62 0.27 0.38 0.31 -0.08 0.18 0.10 (0.29, 0.45) (0.56, 0.69) (0.17, 0.35) (0.33, 0.54) (0.23, 0.38) (-0.16, 0.00) (0.11, 0.26) (-0.18, 0.37)
β-LG 0.65 0.94 0.62 0.49 0.50 0.01 0.25 0.31 (0.61, 0.69) (0.93, 0.95) (0.58, 0.67) (0.42, 0.56) (0.45, 0.55) (-0.06, 0.08) (0.19, 0.32) (0.22, 0.40)
1 TCN = total casein, computed as the sum of αS1-CN, αS2-CN, β-CN, γ-CN and κ-CN; WH = total whey protein, computed as the sum of β-LG and α-LA.

107 107
107 107
Table 3. Median and 95 % highest posterior density interval (in parenthesis) of the marginal posterior density of additive genetic (above diagonal) and phenotypic (below diagonal) correlations between total casein (TCN) and whey protein (WH) content, and proportions (%) of milk protein fractions1
Protein fraction TCN WH αS1-CN% αS2-CN% β-CN% γ-CN% κ-CN% β-LG%
TCN -0.48 -0.23 0.39 0.17 0.15 0.15 (-0.68, -0.28) (-0.49, 0.04) (0.18, 0.59) (-0.18, 0.51) (-0.10, 0.38) (-0.11, 0.40)
WH -0.10 0.14 0.04 0.36 -0.10 0.70 (-0.28, 0.09) (-0.08, 0.37) (-0.15, 0.22) (0.06, 0.65) (-0.29, 0.11) (0.53, 0.85)
αS1-CN% -0.17 0.00 0.04 -0.68 -0.46 -0.19 0.08 (-0.24, -0.11) (-0.07, 0.07) (-0.14, 0.23) (-0.78, -0.58) (-0.66, -0.25) (-0.34, -0.03) (-0.08, 0.26)
αS2-CN% -0.03 0.18 -0.21 -0.43 0.37 -0.13 0.05 (-0.11, 0.07) (0.09, 0.28) (-0.28, -0.14) (-0.58, -0.27) (0.09, 0.63) (-0.32, 0.07) (-0.27, 0.17)
β-CN% 0.23 0.06 -0.46 -0.35 0.08 -0.44 -0.00 (0.18, 0.29) (0.00, 0.12) (-0.51, -0.40) (-0.40, -0.29) (-0.16, 0.31) (-0.57, -0.30) (-0.18, 0.17)
γ-CN% -0.26 -0.27 -0.22 0.03 -0.27 -0.13 -0.03 (-0.33, -0.20) (-0.34, -0.21) (-0.28, -0.16) (-0.06, 0.11) (-0.32, -0.22) (-0.38, 0.14) (-0.30, 0.25)
κ-CN% 0.09 -0.05 -0.31 -0.10 -0.36 -0.05 -0.01 (0.02, 0.16) (-0.13, 0.02) (-0.36, -0.25) (-0.18, -0.03) (-0.41, -0.31) (-0.11, 0.02) (-0.21, 0.18)
β-LG% 0.12 0.13 0.16 -0.15 -0.03 0.03 -0.05 (0.03, 0.21) (0.02, 0.23) (0.08, 0.23) (-0.25, -0.04) (-0.09, 0.03) (-0.04, 0.12) (-0.13, 0.03)
1 αS1-CN%, αS2-CN%, β-CN%, γ-CN% and κ-CN% are expressed as the percentage ratio of each casein fraction on TCN; β-LG% is expressed as the percentage ratio of β-LG on WH.

108 108
108 108
Table 4. Median and 95 % highest posterior density interval (in parenthesis) of the marginal posterior density of additive genetic (above diagonal) and phenotypic (below diagonal) correlations between contents (g/L) of milk protein fractions, obtained whit a model including the regressions on CSN2-CSN3 haplotype probabilities and the effect of BLG genotype1
Protein fraction TCN WH αS1-CN αS2-CN β-CN γ-CN κ-CN α-LA β-LG
TCN 0.68 0.91 0.47 0.95 0.23 0.75 0.19 0.70 (0.48, 0.83) (0.84, 0.96) (0.20, 0.70) (0.90, 0.98) (-0.50, 0.80) (0.59, 0.89) (-0.25, 0.56) (0.52, 0.84)
WH 0.75 0.67 0.47 0.53 0.27 0.55 0.54 0.97 (0.71, 0.78) (0.46, 0.84) (0.23, 0.69) (0.27, 0.73) (-0.34, 0.80) (0.31, 0.75) (0.27, 0.76) (0.95, 0.99)
αS1-CN 0.92 0.69 0.26 0.82 0.08 0.61 0.25 0.67 (0.91, 0.93) (0.64, 0.73) (-0.07, 0.56) (0.69, 0.92) (-0.63, 0.74) (0.37, 0.82) (-0.17, 0.61) (0.47, 0.83)
αS2-CN 0.62 0.59 0.45 0.30 0.35 0.31 0.32 0.44 (0.57, 0.68) (0.52, 0.66) (0.37, 0.52) (-0.02, 0.58) (-0.24, 0.81) (0.03, 0.57) (-0.03, 0.62) (0.20, 0.65)
β-CN 0.93 0.67 0.84 0.46 0.21 0.66 0.03 0.58 (0.92, 0.94) (0.63, 0.72) (0.82, 0.86) (0.39, 0.53) (-0.47, 0.80) (0.44, 0.84) (-0.42, 0.43) (0.35, 0.76)
γ-CN 0.06 -0.09 -0.02 0.00 -0.12 0.15 0.24 0.22 (-0.01, 0.13) (-0.17, -0.01) (-0.08, 0.05) (-0.09, 0.09) (-0.19, -0.05) (-0.50, 0.75) (-0.53, 0.90) (-0.51, 0.86)
κ-CN 0.66 0.52 0.51 0.40 0.51 0.08 0.12 0.58 (0.59, 0.71) (0.45, 0.59) (0.43, 0.58) (0.30, 0.48) (0.44, 0.58) (0.00, 0.15) (-0.28, 0.46) (0.36, 0.76)
α-LA 0.38 0.67 0.29 0.43 0.36 -0.16 0.34 0.32 (0.30, 0.47) (0.61, 0.73) (0.19, 0.38) (0.32, 0.53) (0.27, 0.44) (-0.25, -0.07) (0.24, 0.43) (-0.00, 0.61)
β-LG 0.76 0.94 0.73 0.54 0.67 -0.04 0.49 0.38 (0.73, 0.79) (0.93, 0.95) (0.69, 0.76) (0.47, 0.61) (0.63, 0.72) (-0.12, 0.03) (0.42, 0.56) (0.28, 0.47)
1 TCN = total casein, computed as the sum of αS1-CN, αS2-CN, β-CN, γ-CN and κ-CN; WH = total whey protein, computed as the sum of β-LG and α-LA.

109 109
109 109
Table 5. Median and 95 % highest posterior density interval (in parenthesis) of the marginal posterior density of additive genetic (above diagonal) and phenotypic (below diagonal) correlations between total casein (TCN) and whey protein (WH) content, and proportions (%) of milk protein fractions, obtained whit a model including the regressions on CSN2-CSN3 haplotype probabilities and the effect of BLG genotype1
Protein fraction TCN WH αS1-CN% αS2-CN% β-CN% γ-CN% κ-CN% β-LG%
TCN 0.02 -0.14 0.18 -0.73 0.20 0.58 (-0.31, 0.36) (-0.44, 0.18) (-0.19, 0.56) (-0.99, -0.29) (-0.14, 0.53) (0.25, 0.86)
WH 0.08 0.05 -0.22 -0.32 0.19 0.56 (-0.21, 0.38) (-0.24, 0.33) (-0.56, 0.11) (-0.78, 0.15) (-0.10, 0.48) (0.31, 0.81)
αS1-CN% 0.10 0.05 -0.65 -0.09 -0.45 -0.24 0.07 (0.01, 0.18) (-0.05, 0.14) (-0.82, -0.47) (-0.42, 0.25) (-0.81, -0.02) (-0.49, 0.03) (-0.23, 0.36)
αS2-CN% 0.02 0.18 -0.57 -0.56 0.38 -0.11 -0.15 (-0.07, 0.11) (0.08, 0.28) (-0.63, -0.50) (-0.76, -0.30) (-0.09, 0.77) (-0.38, 0.17) (-0.42, 0.14)
β-CN% 0.17 0.06 0.03 -0.41 -0.23 -0.33 0.07 (0.10, 0.24) (-0.02, 0.13) (-0.04, 0.11) (-0.47, -0.33) (-0.70, 0.32) (-0.61, 0.01) (-0.27, 0.43)
γ-CN% -0.35 -0.38 -0.24 -0.04 -0.52 -0.15 -0.46 (-0.41, -0.29) (-0.45, -0.31) (-0.32, -0.16) (-0.14, 0.04) (-0.57, -0.47) (-0.65, 0.38) (-0.97, 0.04)
κ-CN% -0.06 0.00 -0.39 -0.03 -0.36 0.07 0.28 (-0.16, 0.04) (-0.11, 0.11) (-0.48, -0.30) (-0.15, 0.09) (-0.43, -0.29) (-0.01, 0.17) (-0.02, 0.56)
β-LG% 0.18 0.03 0.25 -0.17 -0.02 0.05 -0.12 (0.08, 0.27) (-0.08, 0.15) (0.16, 0.35) (-0.28, -0.05) (-0.11, 0.06) (-0.04, 0.14) (-0.26, -0.01)
1 αS1-CN%, αS2-CN%, β-CN%, γ-CN% and κ-CN% are expressed as the percentage ratio of each casein fraction on TCN; β-LG% is expressed as the percentage ratio of β-LG on WH.

110
Phenotypic and Genetic Correlations Among the Contents of Milk Protein Fractions
As PRT and TCN were tightly genetically and phenotypically correlated (ra and rp were greater than
0.98), only results for the correlation of TCN with protein fractions and MCP measures will be
discussed. Phenotypic and genetic correlations among the contents of milk protein fractions are
reported in Table 2. All the protein fractions were phenotypically positively correlated. Their
correlation with TCN and WH approximately reflected the proportion in which they take part to the
TCN and WH contents. Hence, for example, β-CN, which is quantitatively the most important CN
fraction, exhibited the higher phenotypic correlation with TCN. However, in general, phenotypic
correlations among CN fractions were fairly low and all positive, with the exception of those
involving γ-CN which were slightly negative or close to zero. As γ-CNs are proteolytic products of
the β-CN, a high content of γ-CN in milk would be expected to be counterbalanced by a lower
content of β-CN and, more in general, of TCN. This can explain the lack of positive phenotypic
correlation between γ-CN and all the other protein fractions. On the contrary, γ-CN exhibited
positive genetic correlations with all protein fractions, with the only exception of αS1-CN.
With few exceptions, genetic correlations among the contents of the five CN fractions were from
very low to moderate, ranging from −0.14 to 0.50. The medians of their posterior distributions were
all positive or can be considered not different from zero. The strongest genetic correlation (0.50)
was between αS2-CN and γ-CN. Low to moderate genetic correlation was observed also between the
contents of CN fractions and the contents of WH proteins, ranging from 0.06 to 0.50. These
findings show that the contents of the protein fractions are genetically rather independent, in
particular the content of κ-CN in respect to all the other fractions.
It is well known that CN loci are located very closely, within a 250-kb region of chromosome 6
(Threadgill and Womack, 1990; Bevilacqua et al., 2006), and homology between the promoter
region of αS1-CN, αS2-CN, and β-CN genes (Groenen and van der Poel, 1994) can explain possible
co-regulation mechanisms. However, as suggested by Schopen et al. (2009), the generally low
genetic correlations among the contents of milk protein fractions might be due to a different
translation efficiency of the CNs messengers in each of the CN genes, i.e. in a differential post-
transcriptional regulation, as showed by Bevilacqua et al. (2006).
Casein fractions were correlated to TCN, but with different extents. The higher genetic correlation
(0.80) was between TCN and β-CN, whereas all other CN fractions were only moderately positively
correlated with TCN. Generally, all the CN fractions, in particular αS2-CN and γ-CN, were also
moderately positively correlated with total WH, suggesting that a general regulation of the protein
level in milk involves simultaneously TCN and WH. The tight genetic correlation (0.98) between
WH and β-LG was in part expected because, in this study, WH was composed only by β-LG and α-
LA and the latter represent only a minimal proportion of the total WH.

111
Only a moderate positive correlation (0.42) was observed between TCN and WH, indicating that
these two heterogeneous portions of milk protein are quite independent. However, these results
support the suggestion that the regulation of TCN and WH genes partially involves the same co-
factors, hormones, and transcription factors (Groenen and van der Poel, 1994).
Conversely, Schopen et al. (2009) found a strong negative genetic correlation between TCN and β-
LG or WH. Those authors reported that genetic correlations between TCN and WH fractions were
stronger than the genetic correlations between and CN fractions. Likely, this can be explained by
the strong effect of BLG locus on CN number found by those authors (when data have been
adjusted for BLG genotypes, the genetic correlation between TCN and WH markedly increased).
Other authors (van den Berg et al., 1992; Wedholm et al., 2006) reported a negative relationship
between β-LG and TCN concentration. However, this could have been due in part also to the fact
that proteins have been expressed as percentage ratios of total protein content, hence an increase of
all CN fractions is somewhat expected to decrease β-LG and thus WH.
When data were adjusted for CSN2-CSN3 haplotype and BLG genotype (Table 4), genetic
correlations among the contents of protein fraction markedly increased. This confirms that CN and
BLG loci contribute in creating genetic variability but suggests also that the synthesis of all the
fractions undergone a common regulation. However, genetic correlations ranged from moderate to
high, indicating that other genes or other factors, such as a different stability of the mRNA, might
be involved in the variation of the synthesis of specific protein fractions.
Interestingly, when accounting for CSN2-CSN3 haplotype and BLG genotype, the genetic
correlations among αS1-CN, β-CN and κ-CN changed from very low, or slightly negative, to high
and positive values. In particular, the genetic correlation between αS1-CN and β-CN changed from -
0.07 to 0.82.
In previous studies (Bobe et al., 1999; Hallén et al., 2008; Bonfatti et al., 2009b) a competitive
synthesis between these two protein fractions have been suggested. However, their generally
negative correlations, together with the markedly high genetic correlation found when adjusting for
CN haplotype, might be explained also by a possible close linkage of a favorable allele for the
synthesis of β-CN with an allele in the promoter region of CSN1S1 which is unfavorable for the
synthesis of αS1-CN (Kuss et al., 2005).
Chanat et al. (1999) have studied the transport of CNs from the endoplasmic reticulum (ER) to the
Golgi apparatus in mammary epithelial cells. Their data suggest that for animals with a high CN
content, αS1-CN must interact with the other CNs for efficient transport to the Golgi. In cells that
completely lack αS1-CN the accumulation of β-CN (or maybe κ–β-mixtures) is observed in the ER.
In the long term this causes ER stress, activates the ER-associated degradation system and impedes
secretion. Preformed CN complexes of the size of the putative CN submicelles must form through

112
protein-protein interactions (Farrell et al., 2002) and emerge from the ER for efficient transit via
secretory vesicles to the Golgi apparatus. κ-CN must either be SH capped or self associate with
other CNs for the transit through the ER lumen. αS1-CN can reduce aggregated species and allow
the associated particles to escape the ER. This propriety of αS1-CN can explain its strong correlation
with β-CN and κ-CN when not accounting for CN haplotype.
Phenotypic and Genetic Correlations for Protein Composition
Posterior median and HPD intervals for the phenotypic and genetic correlations among the relative
proportion of milk protein fractions are reported in Table 3. Phenotypic correlations were generally
higher than genetic correlations but similar, indicating that environmental correlations are
analogous to the genetic ones. However, in all the cases in which γ-CN was involved, genetic
correlations were higher than the phenotypic ones, confirming results obtained for the contents of
the protein fractions.
As WH is composed only by β-LG% and α-LA% and they sum up to 100%, all correlations
between them and all the other fractions had the same value, but opposite direction. For this reason
only the correlations of β-LG% will be discussed.
The genetic correlations for the relative contents of milk protein fractions ranged from -0.66,
between αS1-CN% and β-CN%, to 0.04, between αS1-CN% and αS2-CN%. Results of the genetic
correlation between proportion of CN fractions are in contrast with those found by Schopen et al.
(2009), who reported that the strongest genetic correlations were between αS1-CN and αS2-CN
(−0.49), and between αS1-CN and κ-CN (−0.56).
Selecting for TCN content of milk might alter CN composition, increasing the relative proportions
of β-CN, and κ-CN in a minor extent, while decreasing αS1-CN% and αS2-CN%, whereas only a
slightly increase of β-LG% on total WH would be expected. Casein composition seems to be
completely independent from WH composition, as genetic correlations of TCN proteins with β-
LG% were trivial.
When CSN2-CSN3 haplotype and BLG genotype were accounted for by the model, genetic
correlations between the relative proportions of protein fractions became more similar among each
other and also similar to the correlations observed among the contents on protein fractions. This
confirms the hypothesis of the existence of a general regulation of the protein level, in which milk
protein genes act as regulator of the proportions of specific protein fractions.
A whole genome scan has been recently carried out by Schopen et al. (2009b) to detect quantitative
trait loci (QTL ) for milk protein composition of Holstein Friesian cows. The chromosomal regions
most significantly related to milk protein composition were found on Bos taurus autosomes (BTA )
6, 11 and 14. The QTL on BTA6 affected αS1-, αS2-, β- and κ-CN. The QTL on BTA11 affected β-

113
LG, and the QTL on BTA14 affected protein percentage. These results was expected because CN
genes and β-LG gene have been mapped on BTA6 and on BTA11, respectively (Hayes et al., 1993)
and locus DGAT1, which is known to be associated with milk protein and fat contents (Grisart et
al., 2001), has been mapped on BTA14. However, the QTL found in that study could only partially
be explained by polymorphisms in milk protein genes, and several other significant QTL affecting
milk protein composition were found.
Table 6. Median and 95 % high posterior density interval (HPD 95%) of the marginal posterior density of additive genetic (ra) and phenotypic (rp) correlations between rennet coagulation time and protein fractions contents (g/L), proportions (%) of milk protein fractions on total casein or whey protein contents, curd firmness and pH of milk
ra rp Trait1 Median HPD 95% Median HPD 95% Casein, g/L 0.20 -0.10 – 0.49 -0.08 -0.15 – 0.02 Whey protein, g/L -0.02 -0.28 – 0.23 0.01 -0.06 – 0.08 Protein fractions content, g/L αS1-CN 0.46 0.18 – 0.73 0.01 -0.05 – 0.07 αS2-CN 0.37 0.09 – 0.65 0.03 -0.05 – 0.10 β-CN -0.11 -0.34 – 0.14 -0.15 -0.22 – -0.09 γ-CN 0.19 -0.09 – 0.45 0.10 0.04 – 0.16 κ-CN 0.08 -0.17 – 0.33 -0.09 -0.16 – -0.03 α-LA 0.24 -0.11 – 0.56 0.01 -0.07 – 0.10 β-LG -0.06 -0.28 – 0.19 0.01 -0.06 – 0.08 Protein composition, % αS1-CN% 0.21 0.01 – 0.42 0.13 0.06 – 0.18 αS2-CN% 0.25 -0.01 – 0.53 0.09 0.02 – 0.17 β-CN% -0.26 -0.47 – -0.06 -0.17 -0.23 – -0.12 γ-CN% 0.14 -0.17 – 0.43 0.13 0.06 – 0.19 κ-CN% 0.02 -0.21 – 0.26 -0.06 -0.13 – -0.00 β-LG% -0.19 -0.44 – 0.05 -0.01 -0.08 – 0.08 a30 -0.78 -0.95 – -0.59 -0.70 -0.73 – -0.66 pH 0.61 0.43 – 0.79 0.47 0.40 – 0.54
1 Contents of all protein fractions were measured by reversed-phase HPLC on skimmed milk; Casein = αS1-CN + αS2-CN + β-CN + γ-CN + κ-CN; whey protein = β-LG + α-LA ; protein = casein + whey protein; casein number = (casein/protein) × 100; a30 = curd firmness. αS1-CN%, αS2-CN%, β-CN%, γ-CN% and κ-CN% are measured as weight percentages of total casein content; β-LG% is measured as weight percentage of total whey protein content.
Genetic and Phenotypic Correlations between Milk Proteins and MCP
Median and HPD interval of the marginal posterior density of additive genetic and phenotypic
correlations between RCT and protein fractions contents and relative proportions are reported in
Table 6. Phenotypic correlations were generally very low and lower than genetic correlations.
Results confirm the lack of a positive association between RCT and TCN of milk that was reported
by Ikonen et al. (1999). Although the slightly negative phenotypic correlation, the genetic

114
correlation between RCT and TCN was unfavorable (0.20), indicating that increasing the TCN
content of milk would result in a longer RCT. This result underlines that other traits should be used
as indirect breeding goals for the genetic improvement of MCP. Some protein fractions were more
strongly correlated to RCT than TCN. In particular, αS1- and αS2-CN were genetically positively
correlated with RCT, resulting in a worsening of MCP at increasing levels of these two fractions.
The possible reasons of these unfavourable associations are unknown, but a study conducted by
Mariani et al. (2001) on the effect of αS1-CN G confirm that milk with a decreased content of αS1-
CN is characterized by better coagulation properties in comparison with milk having a grater αS1-
CN content.
Table 7. Median and 95 % high posterior density interval (HPD 95%) of the marginal posterior density of additive genetic (ra) and phenotypic (rp) correlations between curd firmness and protein fractions contents (g/L), proportions (%) of milk protein fractions on total casein or whey protein contents, and pH of milk
ra rp Trait1 Median HPD 95% Median HPD 95% Casein, g/L 0.27 -0.12 – 0.67 0.19 0.11 – 0.26 Whey protein, g/L 0.12 -0.23 – 0.50 0.01 -0.06 – 0.10 Protein fractions content, g/L αS1-CN -0.13 -0.61 – 0.32 0.12 0.05 – 0.19 αS2-CN -0.13 -0.58 – 0.32 -0.01 -0.09 – 0.07 β-CN 0.33 0.01 – 0.63 0.19 0.12 – 0.26 γ-CN -0.10 -0.23 – 0.45 0.02 -0.05 – 0.10 κ-CN 0.43 0.13 – 0.72 0.25 0.19 – 0.31 α-LA 0.06 -0.42 – 0.57 -0.03 -0.12 – 0.06 β-LG 0.10 -0.23 – 0.45 0.02 -0.05 – 0.10 Protein composition, % αS1-CN% -0.31 -0.60 – -0.01 -0.09 -0.15 – -0.03 αS2-CN% -0.32 -0.73 – 0.10 -0.16 -0.23 – -0.08 β-CN% 0.17 -0.12 – 0.48 0.10 0.04 – 0.15 γ-CN% -0.22 -0.63 – 0.25 -0.12 -0.20 – -0.05 κ-CN% 0.36 0.06 – 0.66 0.19 0.13 – 0.26 β-LG% 0.03 -0.30 – 0.42 0.04 -0.05 – 0.12 pH -0.61 -0.87 – -0.33 -0.27 -0.36 – -0.18
1 Contents of all protein fractions were measured by reversed-phase HPLC on skimmed milk; Casein = αS1-CN + αS2-CN + β-CN + γ-CN + κ-CN; whey protein = β-LG + α-LA ; protein = casein + whey protein; casein number = (casein/protein) × 100; αS1-CN%, αS2-CN%, β-CN%, γ-CN% and κ-CN% are measured as weight percentages of total casein content; β-LG% is measured as weight percentage of total whey protein content.
An increased RCT was also associated with the increase of γ-CN content and relative propotion in
milk. Kelly and McSweeney (2002) reported that somatic cells, the principal physiological function
of which is to defend the udder from infections, contain lysosomes that release active proteolytic
enzymes (i.e., elastase, collagenase, and cathepsins). Plasmin plays the main role among the
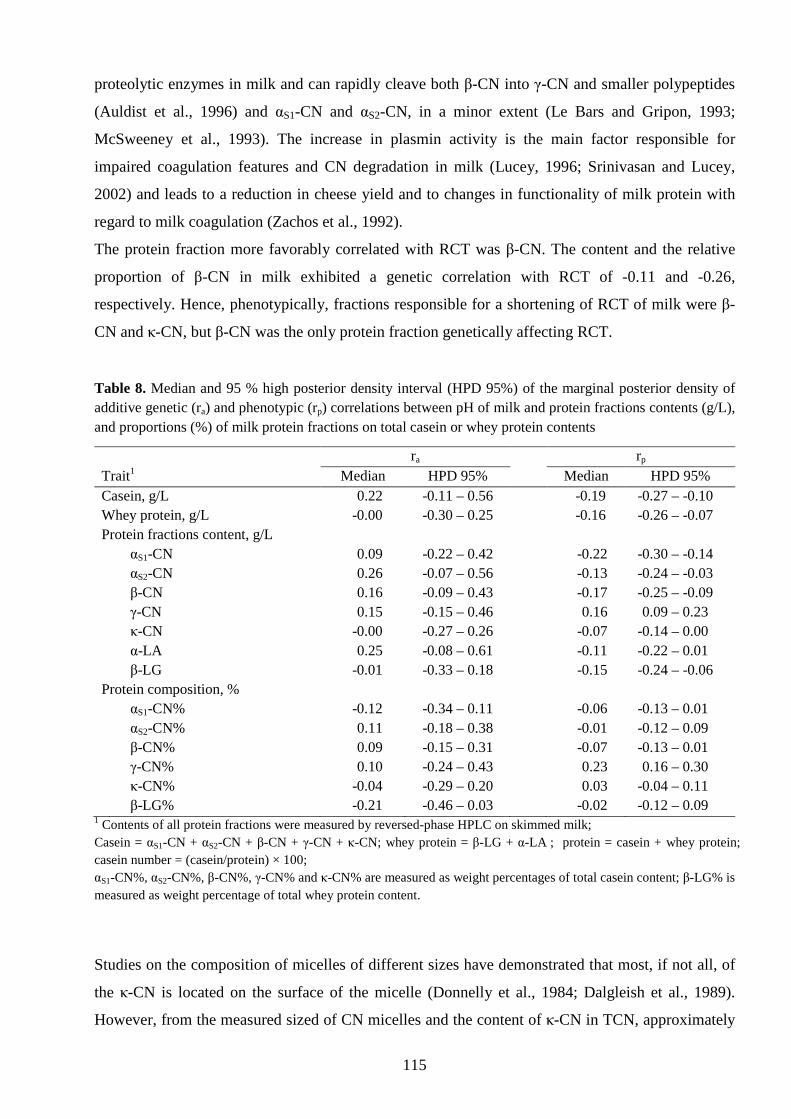
115
proteolytic enzymes in milk and can rapidly cleave both β-CN into γ-CN and smaller polypeptides
(Auldist et al., 1996) and αS1-CN and αS2-CN, in a minor extent (Le Bars and Gripon, 1993;
McSweeney et al., 1993). The increase in plasmin activity is the main factor responsible for
impaired coagulation features and CN degradation in milk (Lucey, 1996; Srinivasan and Lucey,
2002) and leads to a reduction in cheese yield and to changes in functionality of milk protein with
regard to milk coagulation (Zachos et al., 1992).
The protein fraction more favorably correlated with RCT was β-CN. The content and the relative
proportion of β-CN in milk exhibited a genetic correlation with RCT of -0.11 and -0.26,
respectively. Hence, phenotypically, fractions responsible for a shortening of RCT of milk were β-
CN and κ-CN, but β-CN was the only protein fraction genetically affecting RCT.
Table 8. Median and 95 % high posterior density interval (HPD 95%) of the marginal posterior density of additive genetic (ra) and phenotypic (rp) correlations between pH of milk and protein fractions contents (g/L), and proportions (%) of milk protein fractions on total casein or whey protein contents
ra rp Trait1 Median HPD 95% Median HPD 95% Casein, g/L 0.22 -0.11 – 0.56 -0.19 -0.27 – -0.10 Whey protein, g/L -0.00 -0.30 – 0.25 -0.16 -0.26 – -0.07 Protein fractions content, g/L αS1-CN 0.09 -0.22 – 0.42 -0.22 -0.30 – -0.14 αS2-CN 0.26 -0.07 – 0.56 -0.13 -0.24 – -0.03 β-CN 0.16 -0.09 – 0.43 -0.17 -0.25 – -0.09 γ-CN 0.15 -0.15 – 0.46 0.16 0.09 – 0.23 κ-CN -0.00 -0.27 – 0.26 -0.07 -0.14 – 0.00 α-LA 0.25 -0.08 – 0.61 -0.11 -0.22 – 0.01 β-LG -0.01 -0.33 – 0.18 -0.15 -0.24 – -0.06 Protein composition, % αS1-CN% -0.12 -0.34 – 0.11 -0.06 -0.13 – 0.01 αS2-CN% 0.11 -0.18 – 0.38 -0.01 -0.12 – 0.09 β-CN% 0.09 -0.15 – 0.31 -0.07 -0.13 – 0.01 γ-CN% 0.10 -0.24 – 0.43 0.23 0.16 – 0.30 κ-CN% -0.04 -0.29 – 0.20 0.03 -0.04 – 0.11 β-LG% -0.21 -0.46 – 0.03 -0.02 -0.12 – 0.09
1 Contents of all protein fractions were measured by reversed-phase HPLC on skimmed milk; Casein = αS1-CN + αS2-CN + β-CN + γ-CN + κ-CN; whey protein = β-LG + α-LA ; protein = casein + whey protein; casein number = (casein/protein) × 100; αS1-CN%, αS2-CN%, β-CN%, γ-CN% and κ-CN% are measured as weight percentages of total casein content; β-LG% is measured as weight percentage of total whey protein content.
Studies on the composition of micelles of different sizes have demonstrated that most, if not all, of
the κ-CN is located on the surface of the micelle (Donnelly et al., 1984; Dalgleish et al., 1989).
However, from the measured sized of CN micelles and the content of κ-CN in TCN, approximately

116
only one-third of the micellar surface can be covered by κ-CN (Dalgleish, 1998). Compositional
studies of micelles suggest that both αS-CN and β-CN may share the surface with κ-CN, but β-CN
and αS-CN have been less studied than κ-CN and their properties are not well known. However,
measurements of the rate of hydrolysis of different proteins in micelles treated with tripsin suggest
that β-CN is the protein nearest to the surface (Dalgleish, 1998). Moreover, it is known that β-CN
dissociate from the CN micelles with cooling. When the cooled micelles are warmed and the β-CN
re-associates with them, it seems unlikely that the β-CN will be able to penetrate deeply into the
micelle. Thus, during re-association, the dissociated β-CN may alter the structure of the surface of
the CN micelle (Dalgleish, 1998). This could partly explain the marked importance of β-CN on
determining RCT.
Although there was a weak negative phenotypic correlation between κ-CN and RCT, resulting in
milk with shorter RCT at increasing contents of κ-CN, the genetic correlations between both the
content and the relative proportion of κ-CN and RCT were not different from zero. The lack of a
favorable genetic correlation between κ-CN and RCT can be explained by the negative correlation
between κ-CN% and β-CN% and by the similar correlation of κ-CN with both β-CN and αS1-CN.
Results for genetic correlations between protein fractions and a30 (Table 7) were similar to those
obtained for RCT. Genetically, weaker curds were associated with higher contents and proportions
of αS1-, αS2-, and γ-CN and with lower contents and proportions of β-CN. But, in this case, also κ-
CN was positively strongly correlated with a30. The tight relation of κ-CN with a30 might be
attributable to the finer gel network of milk with greater κ-CN content, which allow the formation
of a great number of intermicellar bonds (Horne et al., 1998).
During a series of studies on casein–calcium–phosphate interactions Holt and coworkers (Holt et
al., 1998a,b) discovered that the phosphopeptide fraction of β-CN could bind to and stabilize
calcium–phosphate aggregates resulting in the formation of nanoclusters of a discrete size and
composition; without the peptides the calcium–phosphate structures would grow randomly and
precipitate. The formation of nanoclusters would drive micelle formation by randomly binding
phosphoproteins causing an inverted micelle, then more proteins could coat this new hydrophobic
surface and in turn, bind more calcium phosphate until a size limited colloid is formed. Hence, β-
CN seems to have a central role in the micelle formation and, possible, it might be also the
responsible of the organization of the protein reticulum during curd formation. The unfavorable
genetic correlation between αS1-CN and MCP might be in part explained by the fact that the
proportion of αS1-CN in milk is negatively correlated with the relative content of β-CN.
Correlations between MCP traits and protein fractions are not expected to be greatly affected by
related changing of pH of milk as, generally, correlations between protein fractions and pH were
from low to very low (Table 8). Phenotypically, an increase of each CN fraction results in a

117
decrease of the pH of milk, with the only exception of γ-CN which are usually related to the
presence of SCC and hence to milk with high pH values. Conversely, genetic correlations are
generally positive, but all very low. Hence, in general, it is possible to affirm that genetic
correlations between MCP and milk protein fractions are only slightly determined by related effects
on pH of milk. Only the unfavourable correlation of αS2-CN and α-LA with MCP might be scribed
to their positive correlation (0.26 and 0.25, respectively) with pH of milk.
CONCLUSIONS
The heritability for protein fractions ranged from moderate to high and most of the genetic
correlations among the major milk proteins were low. For some protein fractions, protein
polymorphisms explained a considerable part of the genetic variance. However, there is still genetic
variation in the rest of the genome to permit to alter protein composition by selective breeding.
Selection for the total casein content of milk would not be useful for the genetic improvement of
milk coagulation properties. Selection for increasing the β-CN and κ-CN contents or decreasing the
content of αS1-CN of milk seems to be a more attractive alternative for improving renneting ability,
also because of their high heritability. The lack of rapid and automatic analytical methods which
allow the quantification of milk protein fractions on a large scale limit the possibility of considering
protein fractions as possible indirect traits for the improvement of milk coagulation properties
through selective breeding. Altought the development of easy immunoassay is currently under
investigation, marker-assisted selection for the alleles associated with the higher expression of those
proteins could be a more easier strategy. However, genetic parameters between protein fractions
and currently breeding goal traits must be investigated. Moreover, the effect of protein fractions in
determining the non-coagulation of milk should be studied.
REFERENCES
Auldist, M. J., S. Coats, B. J. Sutherlands, J. J. Mayes, G. H. McDowell, and L. Rogers Graeme. 1996. Effects of somatic cell count and stage of lactation on raw milk composition and the yield and quality of Cheddar cheese. J. Dairy Res. 63:269–280.
Bevilacqua, C., J. C. Helbling, G. Miranda, and P. Martin. 2006. Translational efficiency of casein transcripts in the mammary tissue of lactating ruminants. Reprod. Nutr. Dev. 42:567–578.
Bobe, G., D. C. Beitz, A. E. Freeman, and G. L. Lindberg. 1999. Effect of milk protein genotypes on milk protein composition and its genetic parameter estimates. J. Dairy Sci. 82:2797–2804.
Boettcher, P. J., G. Pagnacco, and A. Stella. 2004. A Monte Carlo approach for estimation of haplotype probabilities in half-sib families. J. Dairy Sci. 87:4303–4310.
Bonfatti, V., L. Grigoletto, A. Cecchinato, L. Gallo, and P. Carnier. 2008. Validation of a new reversed-phase high-performance liquid chromatography method for separation and identification of bovine milk protein genetic variants. J. Chromatogr. A 1195:101–106.
118
Bonfatti, V., G. Di Martino, A. Cecchinato, L. Degano, and P. Carnier. 2009a. Effects of CSN2-CSN3 haplotypes, BLG genotypes and detailed protein composition on coagulation properties of individual milk of Simmental cows. J. Dairy Sci. (Submitted)
Bonfatti, V., G. Di Martino, A. Cecchinato, D. Vicario, and P. Carnier. 2009b. Effects of CSN2-CSN3 haplotypes and BLG genotypes on milk production traits, protein fractions contents and protein composition of individual milk of Simmental cows. J. Dairy Sci. (Submitted)
Bovenhuis, H., J. A. M. van Arendonk, and S. Korver. 1992. Associations between milk protein polymorphisms and milk production traits. J. Dairy Sci. 75:2549–2559.
Cassandro, M., A. Comin, M. Ojala, R. Dal Zotto, M. De Marchi, L. Gallo, P. Carnier, and G. Bittante. 2008. Genetic parameters of milk coagulation properties and their relationships with milk yield and quality traits in Italian Holstein cows. J. Dairy Sci. 91:371–376.
Cecchinato, A., M. De Marchi, L. Gallo, G. Bittante, and P. Carnier. 2009. Mid-infrared spectroscopy predictions as indicator traits in breeding programs for enhanced coagulation properties of milk. J. Dairy Sci. 92 :5304–5313.
Chanat, E., P. Martin, and M. Ollivier-Bosquet. 1999. αS1-casein is required for the efficient transport of β- and κ-casein from the endoplasmic reticulum to the Golgi apparatus of mammary epithelial cells. J. Cell. Sci. 112:3399–412.
Dal Zotto, R., M. De Marchi, A. Cecchinato, M. Penasa, M. Cassandro, P. Carnier, L. Gallo and G. Bittante. 2008. Reproducibility and repeatability of measures of milk coagulation properties and predictive ability of Mid-Infrared Reflectance Spectroscopy. J. Dairy Sci. 91:4103–4112.
Falconer, D. S., and T. F. C. Mackay. 1996. Introduction to quantitative genetics. 4th ed. Longman Scientific and Technical, New York, NY.
Farrell, Jr. H. M. , P. H. Cooke, E. D. Wickham, E. G. Piotrowski, and P. D. Hoagland. 2002. Environmental influences on bovine κ-casein: reduction and conversion to fibrillar (amyloid) structures. J. Protein Chem. 24:259–73.
Graml, R., and F. Pirchner. 2003. Effects of milk protein loci on content of their proteins. Arch. Tierz. Dummerstorf 46:331–340.
Grisart, B., W. Coppieters, F. Farnir, L. Karim, C. Ford, P. Berzi, N. Cambisano, M. Mni, S. Reid, P. Simon, R. Spelman, M. Georges, and R. Snell. 2001. Positional candidate cloning of a QTL in dairy cattle: identification of a missense mutation in the bovine DGAT1 gene with major effect on milk yield and composition. Genome Res. 12:222–231.
Groenen, M. A. M., and J. J. van der Poel. 1994. Regulation of expression of milk protein genes: A review. Livest. Prod. Sci. 38:61–78.
Hallén, E., Wedholm A., A. Andrén, and A. Lundén. 2008. Effect of β-casein, κ-casein and β-lactoglobulin genotypes on concentration of milk protein variants. J. Anim. Breed. Genet. 17:791–799.
Hayes, J. F., K. F. Ng-Kwai-Hang, and J. E. Moxley. 1984. Heritability of milk casein and genetic and phenotypic correlations with production traits. J. Dairy Sci. 67:841–846.
Hayes, H., and E. Petit. 1993. Mapping of the β-lactoglobulin gene and of an immunoglobulin M heavy chain-like sequence in homologous cattle, sheep, and goat chromosomes. Mamm. Genome 4:207–210.
Heck, J. M. L., C. Olieman, A. Schennink, H. J. F. van Valenberg, M. H. P. W. Visker, R. C. R. Meuldijk, and A. C. M. van Hooijdonk. 2008. Estimation of variation in concentration, phosphorylation and genetic polymorphism of milk proteins using capillary zone electrophoresis. Int. Dairy J. 18:548–555.
Heck, J. M. L., A. Schennink, H. J. F. van Valenberg, H. Bovenhuis, M. H. P. W. Visker, J. A. M. van Arendonk, and A. C. M. van Hooijdonk. 2009. Effects of milk protein variants on the protein composition of bovine milk. J. Dairy Sci. 92:1192–1202.
Holt, C., P.A. Timmins, N. Errington, J. Leaver. 1998. A core–shell model of calcium phosphate nanoclusters stabilized by β-casein phosphopeptides, derived from sedimentation equilibrium and small-angle X-ray and neutron scattering measurements. Eur. J. Biochem. 252:73–8.
Holt, C. 1998. Casein micelle substructure and calcium phosphate interactions studied by Sephacryl column chromatography. J Dairy Sci. 81:2994–3003.
Horne, D.S. 1998. Casein interactions: casting light on the black boxes, the structure in dairy products. Int. Dairy J. 8(Suppl. 3): 171–177.
Ikonen, T., K. Ahlfors, R. Kempe, M. Ojala, and O. Ruottinen. 1999. Genetic parameters for the milk coagulation properties and prevalence of noncoagulating milk in Finnish dairy cows. J. Dairy Sci. 82:205–214.
Ikonen, T., S. Morri, A.-M. Tyrisevä, O. Ruottinen, and M. Ojala. 2004. Genetic and phenotypic correlations between milk coagulation properties, milk production traits, somatic cell count, casein content, and pH of milk. J. Dairy Sci. 87:458–467.
Ikonen, T., M. Ojala, and E.-L. Syväoja. 1997. Effects of composite casein and β-lactoglobulin genotypes on renneting

119
properties and composition of bovine milk by assuming an animal model. Agric. Food Sci. Finl. 6:283–294. Jõudo, I., M. Henno, T. Kaart, T. Püssa, and O. Kärt. 2008. The effect of milk protein contents on the rennet
coagulation properties of milk from individual dairy cows. Int. Dairy Sci. 964–967. Kelly, A. L., and P. L. H. McSweeney. 2002. Indigenous proteinases in milk. Adv. Dairy Chem. 1:494–519. Kroeker, E. M., K. F. Ng-Kwai-Hang, J. F. Hayes, and J. E. Moxley. 1985. Heritabilities of relative percentages of
major bovine casein and serum proteins in test-day milk samples. J. Dairy Sci. 68:1346–1348. Kuss, A. W., J. Gogol, H. Bartenschlager, and H. Geldermann. 2005. Polymorphic AP-1 binding site in bovine CSN1S1
shows quantitative differences in protein binding associated with milk protein expression. J. Dairy Sci. 88:2246–2252.
Le Bars, D., and J. C. Gripon. 1993. Hydrolysis of αs1-casein by bovine plasmin. Lait 73:337–344. Leroux, C., P. Martin, M. F. Mahe, H. Leveziel, and J. C. Mercier. 1990. Restriction-fragment-length-polymorphism
identification of goat αS1-casein alleles: a potential tool in selection of individuals carrying alleles associated with a high-level protein synthesis. Anim. Genet. 21:341–351.
Lucey, J. 1996. Cheesemaking from grass based seasonal milk and problems associated with late-lactation milk. J. Soc. Dairy Technol. 49:59–64.
McSweeney P. L. H., N. F. Olson, P. F. Fox, A. Healy, and P. Højrup. 1993. Proteolytic specificity of plasmin on bovine αs1-casein. Food Biotechnol. 7:143–158.
Mariani, P., A. Summer, P. Di Gregorio, A. Rando, E. Fossa, and M. Pecorari. 2001. Effects of the CSN1AG allele on the clotting time of cow milk and on the rheological properties of rennet-curd. J. Dairy Res. 68:1:63–70.
Martin, P., M. Szymanowska, L. Zwierzchowski, and C. Leroux. 2002. The impact of genetic polymorphisms on the protein composition of ruminant milks. Reprod. Nutr. Dev. 42:433–459.
McClenaghan M., A. Springbett, R. M. Wallace, C. J. Wilde, and A. J. Clark. 1995. Secretory proteins compete for production in the mammary-gland of transgenic mice. Biochem. J., 310:637–641.
Ng-Kwai-Hang, K. F., and S. Kim. 1996. Different amounts of β-Lactoglobulin A and B in milk from heterozygous AB cows. Int. Dairy J. 6:689–695. Raftery, A. E., and S. M. Lewis. 1992. How many iterations in the Gibbs Sampler?. In: Bernardo, J. M., Berger, J. O.,
Dawid, A. P., Smith, A. F. M. (Eds), Bayesian Statistics IV. Oxford Univ. Press, New York, USA, pp. 763–774. Schopen, G. C. B., J. M. L. Heck, H. Bovenhuis, M. H. P. W. Visker, H. J. F. van Valenberg, and J. A. M. van
Arendonk. 2009a. Genetic parameters for major milk proteins in Dutch Holstein-Friesians. J. Dairy Sci. 92:1182–1191.
Schopen, G. C. B., P. D. Koks, J. A. M. van Arendonk, H. Bovenhuis, and M. H. P. W. Visker. 2009b. Whole genome scan to detect quantitative trait loci for bovine milk protein composition. Anim. Genet. 40(4):524–537.
Srinivasan, M., and J. A. Lucey. 2002. Effects of added plasmin on the formation and rheological properties of rennet-induced skim milk gels. J. Dairy Sci. 5:1070–1078.
Threadgill, D. W., and J. E. Womack. 1990. Genomic analysis of the major milk protein genes. Nucleic Acids Res. 18:6935–6942.
Tyrisevä, A. M., T. Vahlsten, O. Ruottinen, and M. Ojala. 2004. Noncoagulation of milk in Finnish Ayrshire and Holstein-Friesian cows and effect of herds on milk coagulation ability. J. Dairy Sci. 87:3958–3966.
van den Berg, G., J. T. M. Escher, P. J. de Koning, and H. Bovenhuis. 1992. Genetic polymorphism of κ-casein and β-lactoglobulin in relation to milk composition and processing properties. Neth. Milk Dairy J. 46:145–168.
Wedholm, A., L. B. Larsen, H. Lindmark-Månsson, A. H. Karlsson, and A. Andrén. 2006. Effect of protein composition on the cheesemaking properties of milk from individual dairy cows. J. Dairy Sci. 89:3296–3305.
Zachos, T., I. Politis, R. C. Gorewit, and D. M. Barbano. 1992. Effect of mastitis on plasminogen activator activity of milk somatic cells. J. Dairy Res. 59:461–467.


121
GENERAL DISCUSSION AND CONCLUSIONS
Milk protein is probably the most studied food protein. However, most of the biological aspects
involving milk protein fractions and coagulation ability of milk are currently unknown or are still
unclear.
When studying traits such as protein fractions contents or protein composition, the investigation is
complicated by a number of critical issues, which require additional care in developing research
protocols and in interpreting results. The first critical issue is the lack of analytical methods able to
quantify milk protein fractions content and, more in general, easily detect protein genetic variants.
This is an important limit, mostly for genetic studies, in which large sample sizes are commonly
needed to obtain reliable estimates of genetic parameters. No current method allows the detection of
all protein genetic variants. Hence, neglected alleles can bias estimated parameters with a
magnitude that is dependent upon the frequency of the allele and the extent of its effect. Moreover,
the close physical linkage of casein genes on bovine chromosome 6 can produced biased estimates
if models do not account for all their effects simultaneously. Information on haplotypes is difficult
to obtain and estimates of the effects of rare haplotypes are likely to be unreliable.
Several factors, such as linkage with polymorphisms in the non-coding regions of casein genes
(Martin et al., 2002), act on the expression of milk protein fractions. This might be responsible of
inconsistent results on the effect of casein polymorphisms on protein expression or milk production
traits across populations and families.
Despite the study of the physico-chemical properties of a casein variant after purification is
relatively simple, the study of its effect on biological properties of milk is particularly difficult
because caseins aggregate to each other forming a complex system, the micelle. The lack of
knowledge about the real conformation of the casein micelle and the biological role of protein
fractions, and of their genetic variants, on the coagulation process is another critical aspect of
studies dealing with milk coagulation properties.
In order to provide dairies with milk well suited for the manufacture of dairy products and able to
meet requirements for dairy processing, selection for specific genetic variants (gene selection) of
milk proteins has been proposed. Results obtained in this study confirmed the marked effect of
protein polymorphisms on the expression of their relative protein fraction. The ready availability of
milk protein genotypes of animals, the tight relationship between genotypes (or haplotypes) and
milk protein fraction, and the marked genetic correlation between protein composition and
renneting ability make the gene-based selection a possible effective strategy for the genetic
improvement of milk coagulation properties.

122
Our results indicate that the effect exerted by milk protein polymorphisms on coagulation properties
is mainly attributable to the allele-specific expression of the proteins, which modifies milk protein
composition. This allele-specific protein expression seems to be related to the presence of linkage
disequilibrium between alleles at the milk protein loci and polymorphisms in the non-coding region
of these genes (Gustafsson et al., 2003; Kuss et al., 2005; Keating et al., 2007). Hence, the effect
exerted by protein polymorphisms is actually to be ascribed to other linked loci. In this case,
selection should be based on the polymorphisms in the non-coding region, the direct responsible of
the observed effect. Previous work demonstrated that the differential allele-specific accumulation of
CSN3 mRNA is not directly linked to the protein variants of κ-CN (Robitaille and Petitclerc, 2000),
as in the case of other milk proteins like β-LG (Wilkins et al., 1995). Cows homozygous for a
protein variant may actually be heterozygous in terms of CSN3 expression into mRNA because of a
differential allele-specific accumulation of CSN3 mRNA. As a consequence, if the breeding goal
aims to increase the content of κ-CN in milk, a selection program based on CSN3 expression into
mRNA (κ-CN%) would appear to be more appropriate than a program relying on CSN3 protein
variants (Vachon et al., 2004).
If on one side gene selection can be easily implemented, on the other side it can be affected by
variation in the linkage phase between polymorphisms in the coding region and those in the non-
coding region of genes. In addition, it will not exploit existing variation in genetic merit of animals
of identical genotype. As a consequence, animals with an unfavorable genotype at one locus but
with favorable genetic merit for content of a certain protein fraction, due to the variability of the
protein expression, might be excluded from selection.
This study also highlighted the importance of considering β-casein, instead of κ-casein, as the
principal gene to be used in selection programs aiming at the improvement of milk coagulation
properties in Simmental cattle. The greater importance of β-casein in comparison with κ-casein
reported in this study seems to be inconsistent with literature results. A possible explanation might
be the fact that estimates were obtained for a population in which allele frequencies at casein loci
were more balanced (not very high nor very low) and the presence of CSN2 B was rather high when
compared to that observed in previous studies. Studies on the effect exerted by CSN2 on protein
composition and coagulation properties of milk were often limited at two alleles, A1 and A2, whose
effects are similar, if compared to the effect of B allele. Alternatively, many studies were conducted
on cattle populations in which the B allele was included in the “rare” genotypes or haplotypes
leading to low reliability of estimated effects or to not significant estimates as a consequence of
large standard errors.
Despite the marked effect of protein genes on variation of investigated traits, there is polygenic
variation in milk protein composition that might be exploited through breeding. However, to

123
implement breeding programs using protein composition as indicator traits for the enhancement of
milk coagulation properties, protein composition should be measured on a large scale. Currently, in
spite of a good repeatability of these traits (Graml and Princhner, 2003), which might limit the
number of measurements of protein composition to be recorded per animal, analytical assessment is
not feasible at the population level. However, the direct measurement of milk coagulation properties
at the population level still remains a critical issue. At the experimental level, RP-HPLC is a
reliable and useful analytical method to perform this type of analysis, albeit some alleles cannot be
identified. It represents, together with capillary electrophoresis, one of the most precise methods to
quantify proteins, ensuring high repeatability and reproducibility of measures. More rapid, high-
throughput, automated methods need to be developed for an easier quantification of protein
fractions on a large scale and, within available options, Mid Infrared Spectroscopy (MIRS)
represents the most attractive one.
Other questions, such as those related to the biological role of milk proteins during the coagulation
process and the effect exerted by protein composition or polymorphisms on the non-coagulation of
milk, remain to be solved.
REFERENCES
Graml, R., and F. Pirchner. 2003. Effects of milk protein loci on content of their proteins. Arch. Tierz. Dummerstorf 46:331–340.
Gustafsson, V., and A. Lundén. 2003. Strong linkage disequilibrium between polymorphisms in the 5’-flanking region and the coding part of the bovine β-lactoglobulin gene. J. Anim. Breed. Genet. 120:68–72.
Keating, A. F., P. Davoren, T. J. Smith, R. P. Ross, and M. T. Cairns. 2007. Bovine κ-casein gene promoter haplotypes with potential implications for milk protein expression. J. Dairy Sci. 90:4092–4099
Kuss, A. W., J. Gogol, H. Bartenschlager, and H. Geldermann. 2005. Polymorphic AP-1 binding site in bovine CSN1S1 shows quantitative differences in protein binding associated with milk protein expression. J. Dairy Sci. 88:2246–2252.
Martin, P., M. Szymanowska, L. Zwierzchowski, and C. Leroux. 2002. The impact of genetic polymorphisms on the protein composition of ruminant milks. Reprod. Nutr. Dev. 42:433–459.
Robitaille, G. and D. Petitclerc. 2000. Expression polymorphism of κ-casein gene in Holstein cows. J. Dairy Res. 67:107–111.
Vachon, D., M. Britten, J. Morisset, D. Petitclerc, and G. Robitaille. 2004. Differential allele-specific accumulation of bovine kappa-casein mRNA throughout lactation. J. Dairy Res. 71(4):405-408.
Wilkins, R. J., H. W. Dawer, T. T. Wheeler, and C. A. Ford. 1995. Differential expression of β-lactoglobulin alleles A and B in daity cattle. In Intercellular Signalling in the mammary gland, pp. 189–190 (Eds C. J. Wilde, M. Peaker, and C. H. Knight). New York: Plenum Press.

124
125
ACKNOWLEDGMENTS
Desidero ringraziare il mio supervisore, prof. Paolo Carnier, per avermi sempre guidata con fermezza e competenza, ma soprattutto per aver lasciato a me la più ampia libertà (e responsabilità) di scelta. Ringrazio inoltre il prof. Agustín Blasco per le lezioni di statistica Bayesiana e l’ospitatlità durante il mio soggiorno a Valencia. Un doveroso ringraziamento va poi a quanti hanno direttamente collaborato alla realizzazione di questo studio: Luca Grigoletto, dal quale ho appreso le basi della cromatografia, Alessandro Eulogi, che ha condotto i campionamenti, e Marica Deretti, che ha partecipato alle prove di caseificazione. Inoltre, desidero ringraziare in modo particolare Guido Di Martino per essere stato un insostituibile aiutante nelle attività di laboratorio, per l’impegno, la serietà e l’efficienza con cui ha portato avanti il suo lavoro, ma soprattutto per la travolgente simpatia con la quale mi ha accompagnata ogni giorno! Un ringraziamento e un abbraccio a tutti gli amici del “laboratorio DNA” che hanno condiviso con me questi anni di dottorato: Fabio, Cinzia, Giuseppe, Martina, Matteo, Alberto, Enrico, e Mirko, e a tutti gli amici del Dipartimento di Scienze Animali, in particolare Alessio e Mauro, per il loro costante contributo e aiuto, la pazienza con cui hanno sempre risposto ad ogni mia domanda, ma soprattutto per avermi fatto compagnia durante i week-end di lavoro, per i pasticcini, lo spumante, le risate, le cene, i caffè, le colazioni al bar di Agripolis e le serate al Wallaby! Ringrazio in particolare chi in questi anni mi ha silenziosamente accompagnata a casa quasi ogni sera, per essermi sempre stato vicino quando siamo stati lontani. Un grazie di cuore ai miei genitori e ai miei nonni per ogni momento in cui avrebbero voluto che io fossi a casa e hanno sopportato il fatto che non ci fossi e a tutti i miei coinquilini, la mia seconda (e piuttosto numerosa) famiglia, per le indimenticabili serate in appartamento, i pop-corn, le tisane, la pizza del Crazy e gli spritz al Centrale, per essermi sempre stati vicini nei momenti difficili e per aver condiviso ogni cosa, nella nostra casa, come farebbe una vera famiglia.
Tambièn quiero agradecear mis compañeros de piso y todos los amigos y compañeros de trabajo de Valencia por sus ospitalidad, y por los conciertos, las noches en el barrio del Carmen... y la sangrìa! Ma colui che voglio ringraziare più di ogni altro è chi, qualche anno fa, mi ha scritto: “In
questo mondo quello che hai, di solito, è meno di quello che ti spetta, pertanto di nulla devi
ringraziarmi, perché nulla ti ho donato”, che mi ha convinta a fare un dottorato in genetica, anche se era l’ultima cosa che avrei voluto fare nella vita, e per il quale nutro grande stima, ammirazione e affetto. A te, un grazie di cuore per ogni momento che mi hai dedicato in tutti questi anni, per aver avuto fiducia in me, in ogni istante, più di quanta ne avrei avuto io stessa, per avermi chiamata per nome molto raramente, per esserti preoccupato per me… e occupato di me. Ma soprattutto perché da te ho ricevuto pesanti rimproveri, ma anche enormi soddisfazioni. Infine, un ricordo e un ringraziamento speciale a Ricky, al quale dedico questa tesi, che mille volte mi ha chiesto come stavo, anche se i suoi problemi erano ben maggiori dei miei, che aveva sempre un sorriso per me, e che ogni giorno mi manca.