Embed Size (px)
Citation preview

D-4432 1
GENERIC STRUCTURES:S-SHAPED GROWTH I
Produced for theMIT System Dynamics in Education Project
Under the Supervision ofDr. Jay W. Forrester
Sloan School of ManagementMassachusetts Institute of Technology
BY
Marc GlickTerri Duhon
August 24, 1994Vensim Examples added October 2001
Copyright © 2001 by MITPermission granted for non-commercial educational purposes

D-4432-2 3
TABLE OF CONTENTS
ABSTRACT ............................................................................................................... 4
INTRODUCTION ...................................................................................................... 4
S-SHAPED GROWTH ............................................................................................... 5
S-SHAPED GROWTH STRUCTURE 1..................................................................... 7
EXERCISE 1: S-SHAPED GROWTH STRUCTURE 1............................................. 9
S-SHAPED GROWTH STRUCTURE 2..................................................................... 11
EXERCISE 2: S-SHAPED GROWTH STRUCTURE 2............................................. 14
STRUCTURE SIMILARITIES................................................................................... 17
CONCLUSION........................................................................................................... 19
APPENDIX A - Documentation.................................................................................. 20S-SHAPED GROWTH STRUCTURE 1 (From Figure 5a)......................................................20S-SHAPED GROWTH STRUCTURE 2 (From Figure 7b)......................................................21
APPENDIX B - Solutions to Exercises........................................................................ 24EXERCISE 1..........................................................................................................................24EXERCISE 2..........................................................................................................................25
APPENDIX C - Technical Documentation.................................................................. 29S-Shaped Growth Structure 1..................................................................................................29S-Shaped Growth Structure 2..................................................................................................29
VENSIM EXAMPLES… … … … … … … … … … … … … … … … … … … … … … … … … .31
D-4432 4
ABSTRACT
Generic Structures: S-Shaped Growth I is an introduction to the concept of generic structures, along with specific examples of such a structure. This paper assumes knowledge of STELLA1 software, and simple system dynamics structures such as positive and negative feedback loops, exponential growth, and S-shaped growth.
Generic Structures: S-Shaped Growth I will examine two different structures that generate S-shaped growth. We will look at the multiple behaviors that each structure generates, and the simulations of each structure that produce the same behaviors. Then causal loop diagrams will be utilized to explain similarities between the structures.
INTRODUCTION
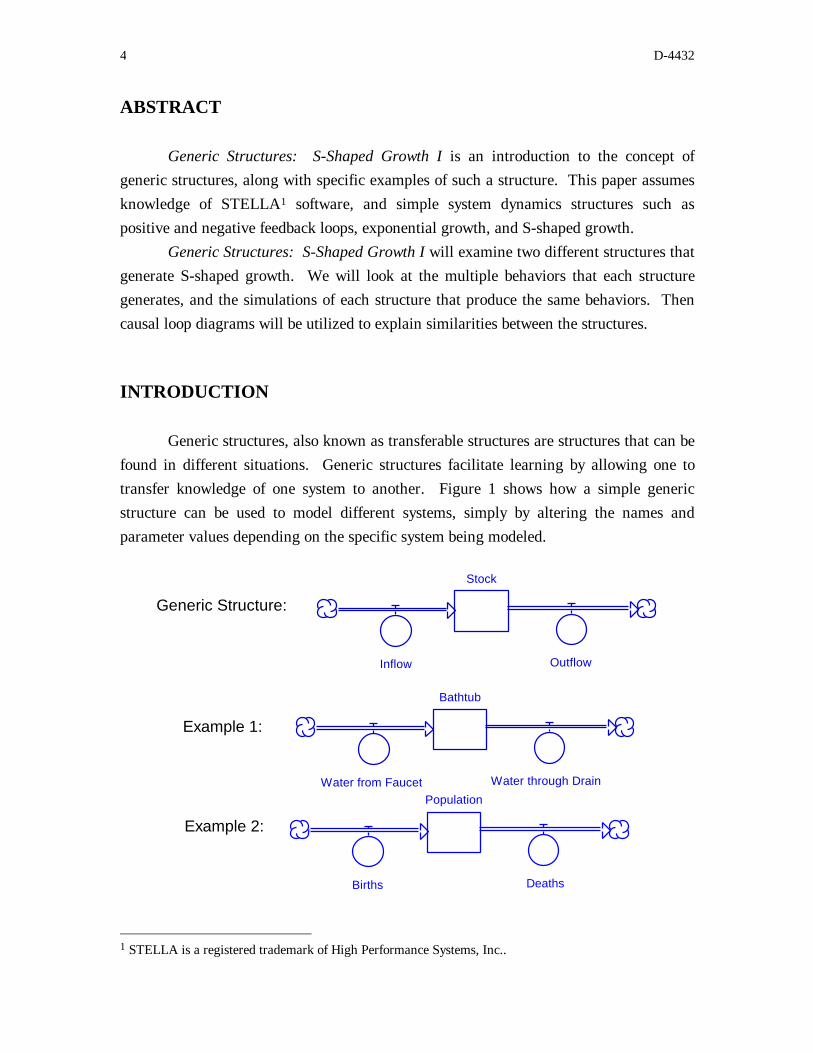
Generic structures, also known as transferable structures are structures that can be found in different situations. Generic structures facilitate learning by allowing one to transfer knowledge of one system to another. Figure 1 shows how a simple generic structure can be used to model different systems, simply by altering the names and parameter values depending on the specific system being modeled.
Stock
Generic Structure:
Inflow Outflow
Bathtub
Example 1:
Water from Faucet Water through Drain Population
Example 2:
Births Deaths
1 STELLA is a registered trademark of High Performance Systems, Inc..
D-4432-2 5
Figure 1 - Model of a generic structure followed by two specific models based on that structure.
Once a person understands a generic structure, that person’s knowledge of other similar systems is expanded.
“A generic structure that many people are familiar with is S-shaped growth.” The previous sentence is a popular misconception. S-shaped growth is commonly classified as a generic structure. However, it is not a generic structure, but rather a behavior. A structure generates a behavior, but a behavior is not a structure. They are not synonymous. Several different structures can exhibit the same behavior. Also, several different behaviors can be generated by the same structure. This can be achieved by changing either the initial values of the stock, or the parameter values. Despite the lack of direct relation between behavior and structure, the different behaviors a structure can generate are related. Additionally, different structures that exhibit similar behaviors must also be related. This is the focus of Generic Structures: S-Shaped Growth I.
S-SHAPED GROWTH
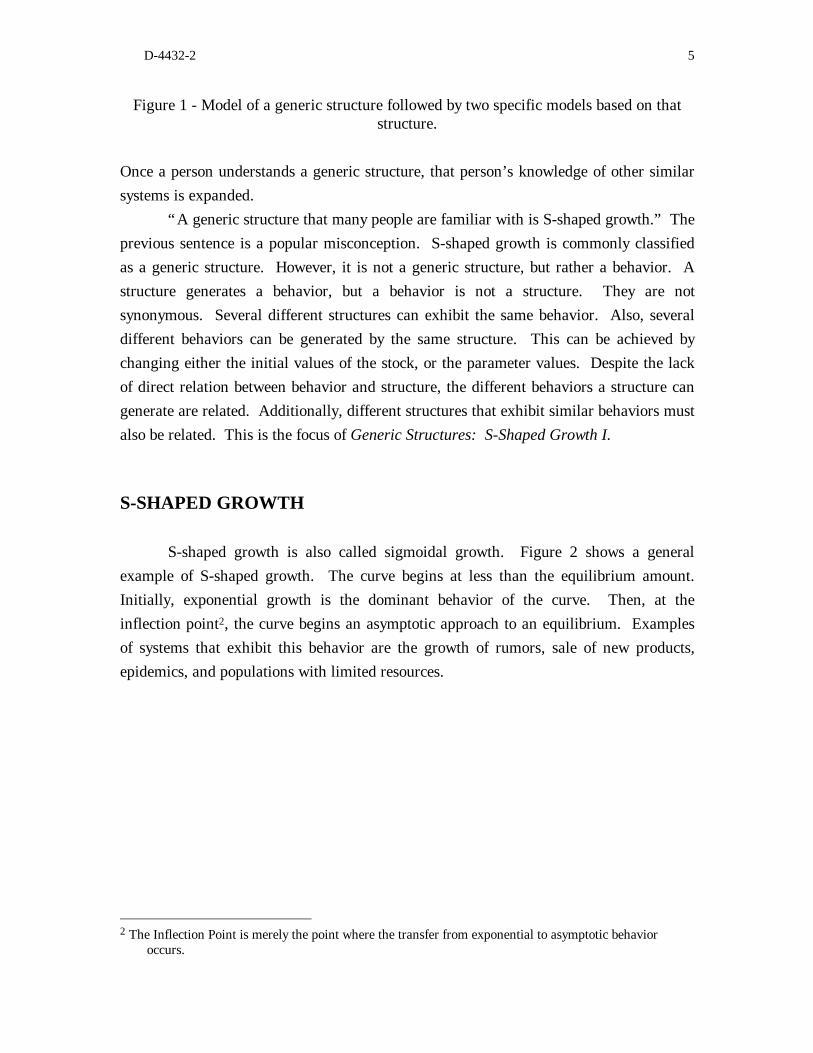
S-shaped growth is also called sigmoidal growth. Figure 2 shows a general example of S-shaped growth. The curve begins at less than the equilibrium amount. Initially, exponential growth is the dominant behavior of the curve. Then, at the inflection point2, the curve begins an asymptotic approach to an equilibrium. Examples of systems that exhibit this behavior are the growth of rumors, sale of new products, epidemics, and populations with limited resources.
2 The Inflection Point is merely the point where the transfer from exponential to asymptotic behavior occurs.
D-4432 6
Stock
Equilibrium Level Asymptotic Growth
Inflection Point
Exponential Growth
TimeFigure 2 - STELLA generated graph of generic S-shaped growth.
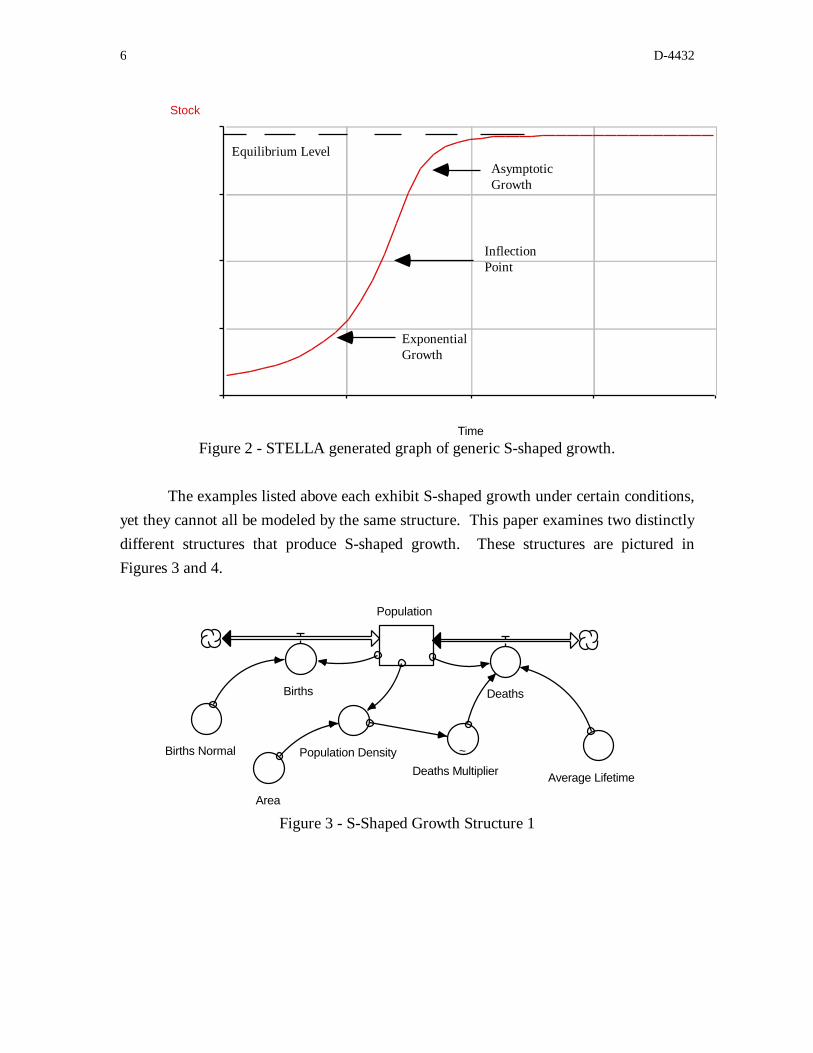
The examples listed above each exhibit S-shaped growth under certain conditions, yet they cannot all be modeled by the same structure. This paper examines two distinctly different structures that produce S-shaped growth. These structures are pictured in Figures 3 and 4.
Population
Births Deaths
Population DensityBirths Normal ~
Deaths Multiplier Average Lifetime
Area
Figure 3 - S-Shaped Growth Structure 1
D-4432-2 7
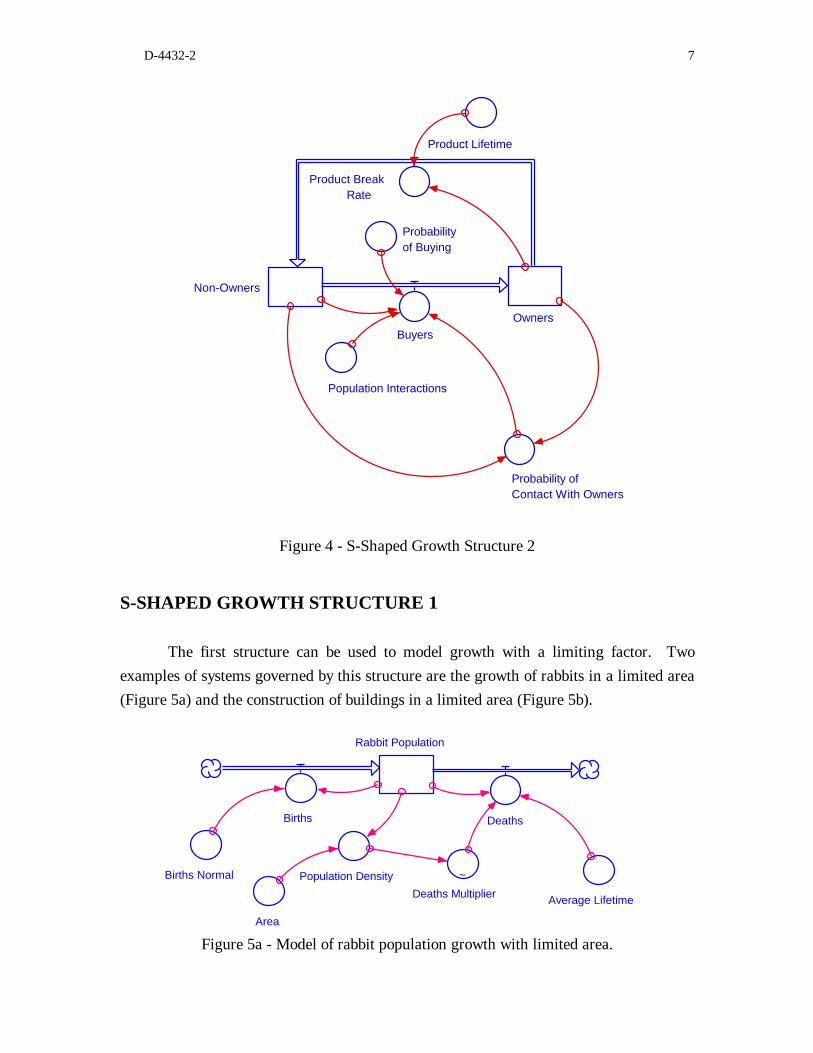
Non-Owners
Owners Buyers
Probability of Contact With Owners
Probability of Buying
Product Break
Product Lifetime
Population Interactions
Rate
Figure 4 - S-Shaped Growth Structure 2
S-SHAPED GROWTH STRUCTURE 1
The first structure can be used to model growth with a limiting factor. Two examples of systems governed by this structure are the growth of rabbits in a limited area (Figure 5a) and the construction of buildings in a limited area (Figure 5b).
Rabbit Population
Births Deaths
Population DensityBirths Normal ~
Deaths Multiplier Average Lifetime
Area
Figure 5a - Model of rabbit population growth with limited area.
D-4432 8
Buildings
Construction Demolition
Building Density
Construction Normal ~
Demolition Multiplier Average Building Lifetime
Building Area
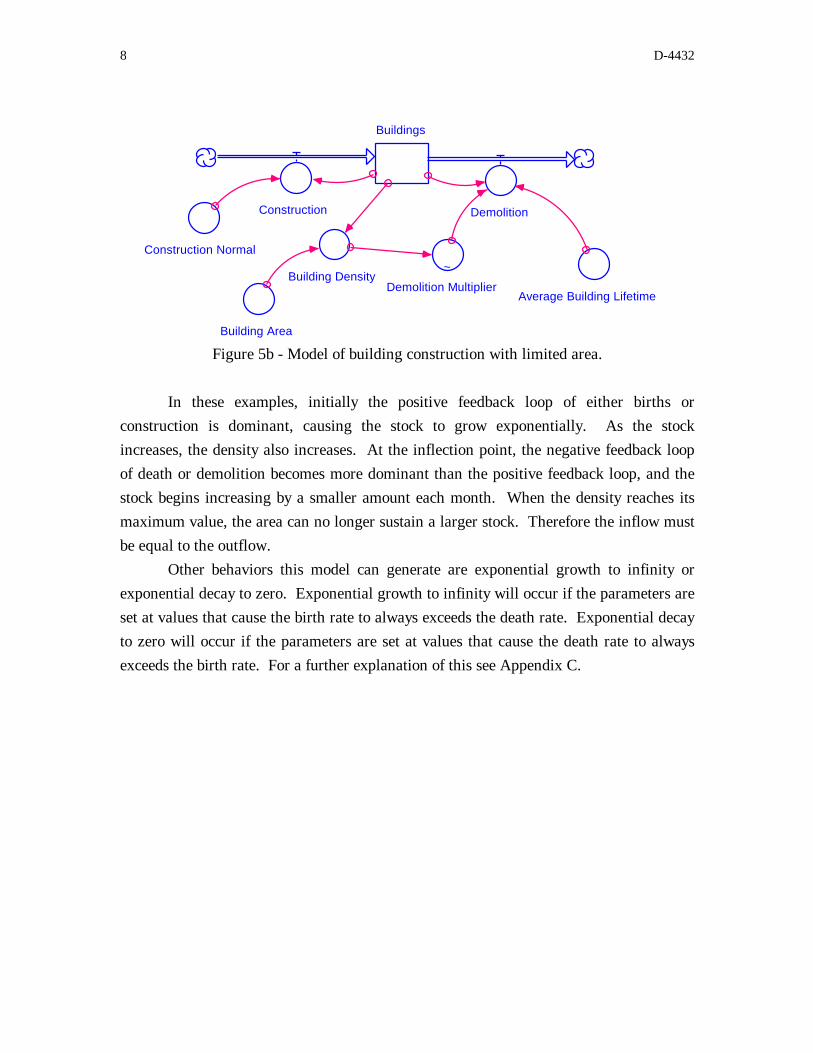
Figure 5b - Model of building construction with limited area.
In these examples, initially the positive feedback loop of either births or construction is dominant, causing the stock to grow exponentially. As the stock increases, the density also increases. At the inflection point, the negative feedback loop of death or demolition becomes more dominant than the positive feedback loop, and the stock begins increasing by a smaller amount each month. When the density reaches its maximum value, the area can no longer sustain a larger stock. Therefore the inflow must be equal to the outflow.
Other behaviors this model can generate are exponential growth to infinity or exponential decay to zero. Exponential growth to infinity will occur if the parameters are set at values that cause the birth rate to always exceeds the death rate. Exponential decay to zero will occur if the parameters are set at values that cause the death rate to always exceeds the birth rate. For a further explanation of this see Appendix C.
D-4432-2 9
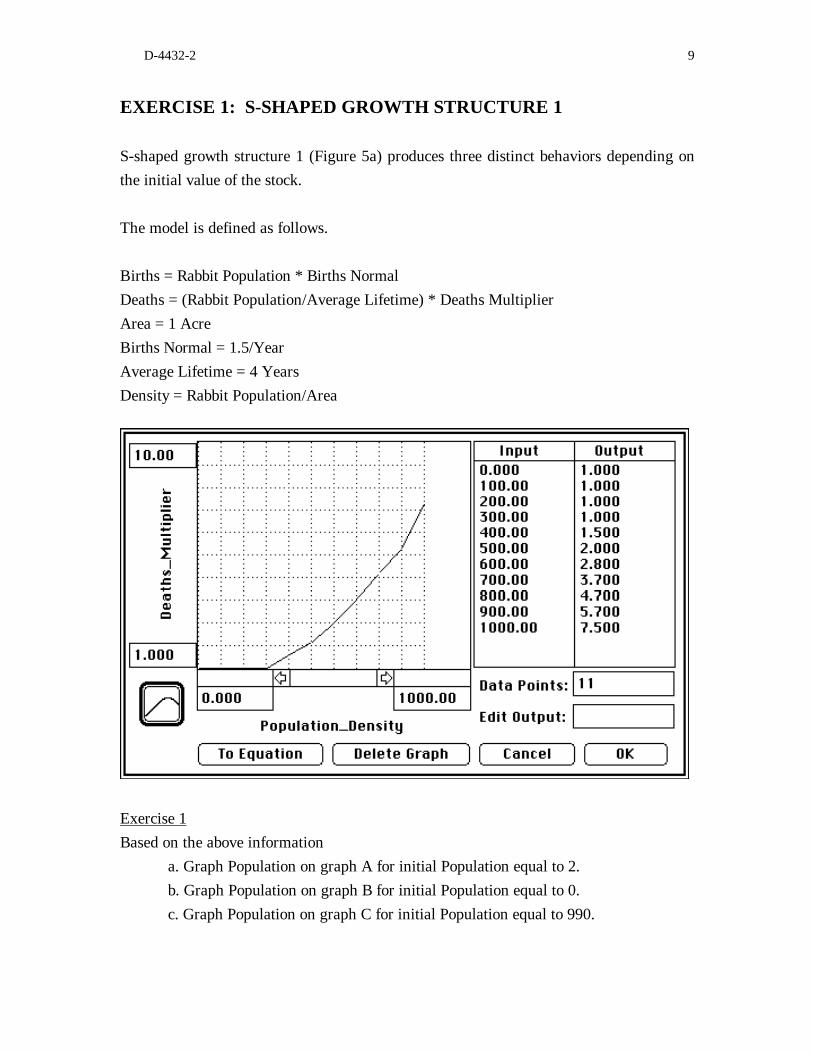
EXERCISE 1: S-SHAPED GROWTH STRUCTURE 1
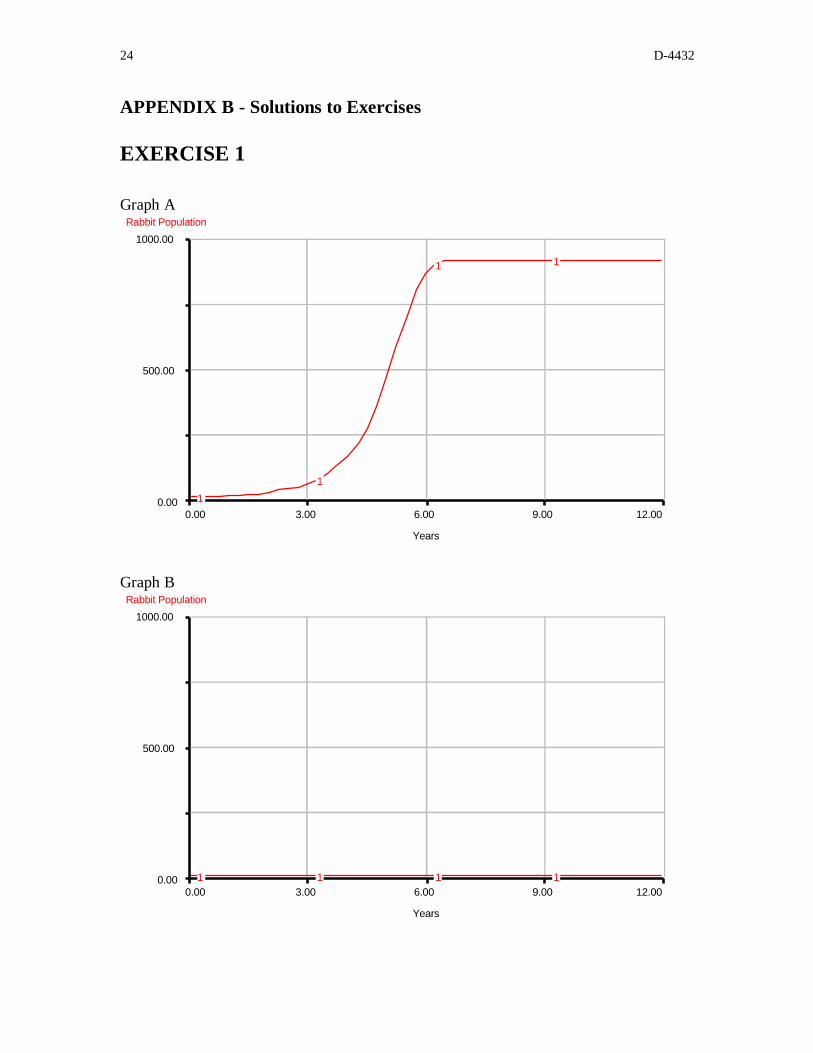
S-shaped growth structure 1 (Figure 5a) produces three distinct behaviors depending on the initial value of the stock.
The model is defined as follows.
Births = Rabbit Population * Births Normal Deaths = (Rabbit Population/Average Lifetime) * Deaths Multiplier Area = 1 Acre Births Normal = 1.5/Year Average Lifetime = 4 Years Density = Rabbit Population/Area
Exercise 1 Based on the above information
a. Graph Population on graph A for initial Population equal to 2. b. Graph Population on graph B for initial Population equal to 0. c. Graph Population on graph C for initial Population equal to 990.
10
Graph A
1000.00
Rabbit Population
D-4432
500.00
0.00 0.00
Graph B
1000.00
Rabbit Population
3.00 6.00
Years
9.00 12.00
500.00
0.00 0.00
3.00 6.00
Years
9.00 12.00
D-4432-2 11
Graph C Rabbit Population
1000.00
500.00
0.00 0.00 3.00 6.00 9.00 12.00
Years
S-SHAPED GROWTH STRUCTURE 2
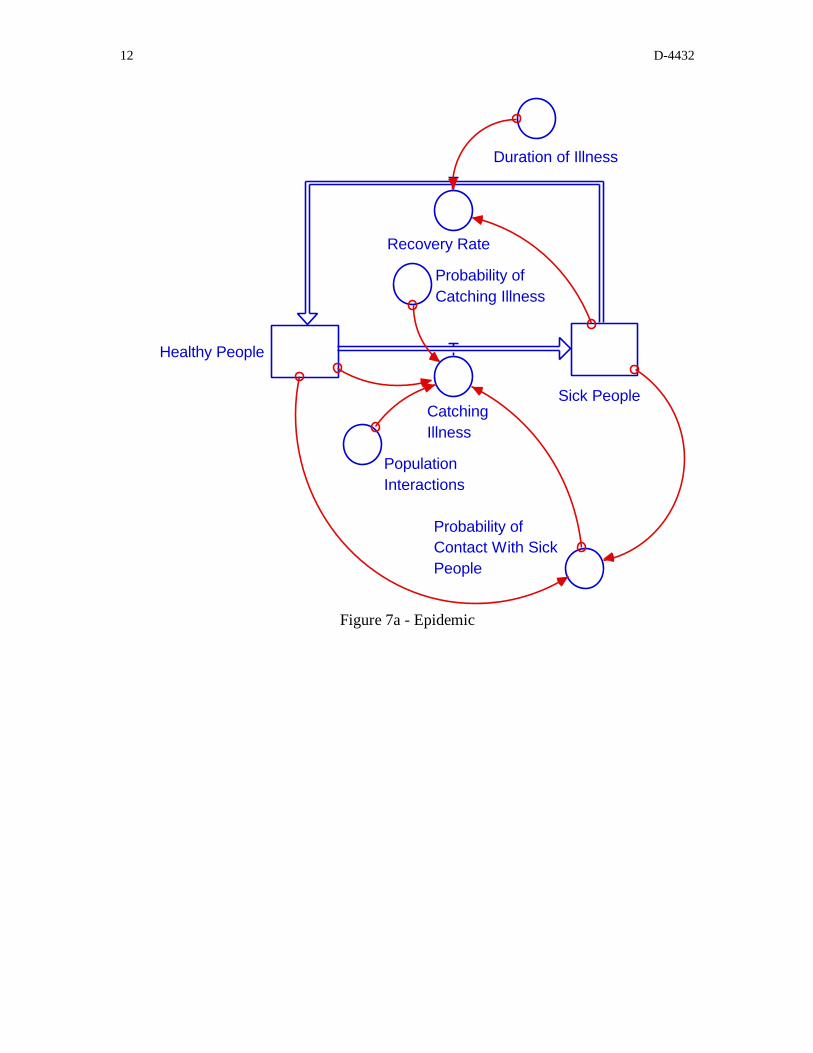
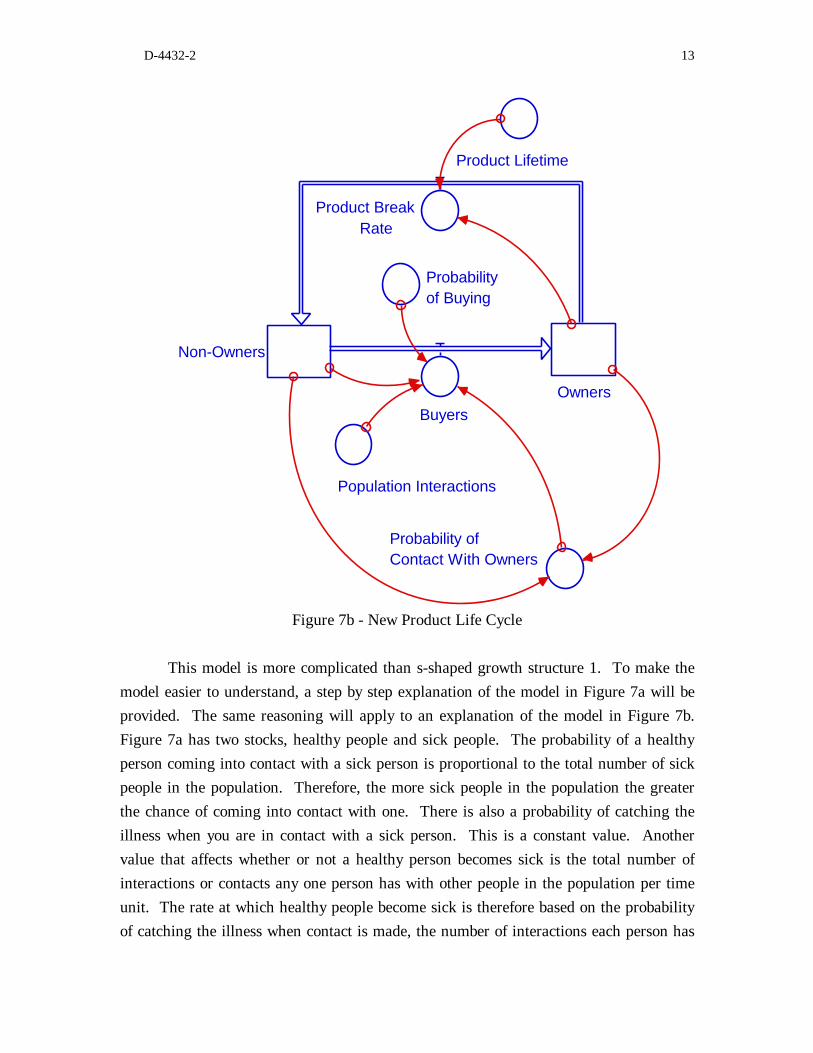
The second S-shaped growth structure and its variations are derived from systems involving rumors, new products, and epidemics. Two examples of systems governed by this structure are epidemics (Figure 7a) and a new product life cycle (Figure 7b).
12 D-4432
Healthy People
Probability of Contact With Sick People
Population Interactions
Catching Illness
Sick People
Probability of Catching Illness
Recovery Rate
Duration of Illness
Figure 7a - Epidemic
D-4432-2 13
Non-Owners
Owners Buyers
Probability of Contact With Owners
Probability of Buying
Product Break
Product Lifetime
Population Interactions
Rate
Figure 7b - New Product Life Cycle
This model is more complicated than s-shaped growth structure 1. To make the model easier to understand, a step by step explanation of the model in Figure 7a will be provided. The same reasoning will apply to an explanation of the model in Figure 7b. Figure 7a has two stocks, healthy people and sick people. The probability of a healthy person coming into contact with a sick person is proportional to the total number of sick people in the population. Therefore, the more sick people in the population the greater the chance of coming into contact with one. There is also a probability of catching the illness when you are in contact with a sick person. This is a constant value. Another value that affects whether or not a healthy person becomes sick is the total number of interactions or contacts any one person has with other people in the population per time unit. The rate at which healthy people become sick is therefore based on the probability of catching the illness when contact is made, the number of interactions each person has

14 D-4432
with others in the population, and the probability that an interaction is with a sick person. Another factor that affects the number of sick people and healthy people is the rate at which sick people recover from their illness and re-enter the stock of healthy people, assuming no permanent immunity.
Altering the parameter values in this structure will only affect the behavior of the model by changing the time scale over which the various behaviors occur. For a further explanation of this see Appendix C.
EXERCISE 2: S-SHAPED GROWTH STRUCTURE 2
The structures in Figure 7 can produces three distinct behaviors which depend on the initial values of the stocks. We will examine these three behaviors using the epidemic model shown in Figure 7a.
The model is defined as follows:
Recovering Patients = Sick People/Duration of Illness
Catching Illness = Healthy People * Probability of Contact With Sick People * Population Interactions * Probability of Catching Illness
Population Interactions = 10/Months Duration of Illness = .5 Months Probability of Catching Illness = .5 Probability of Contact With Sick People = Sick People/(Sick People + Healthy People)
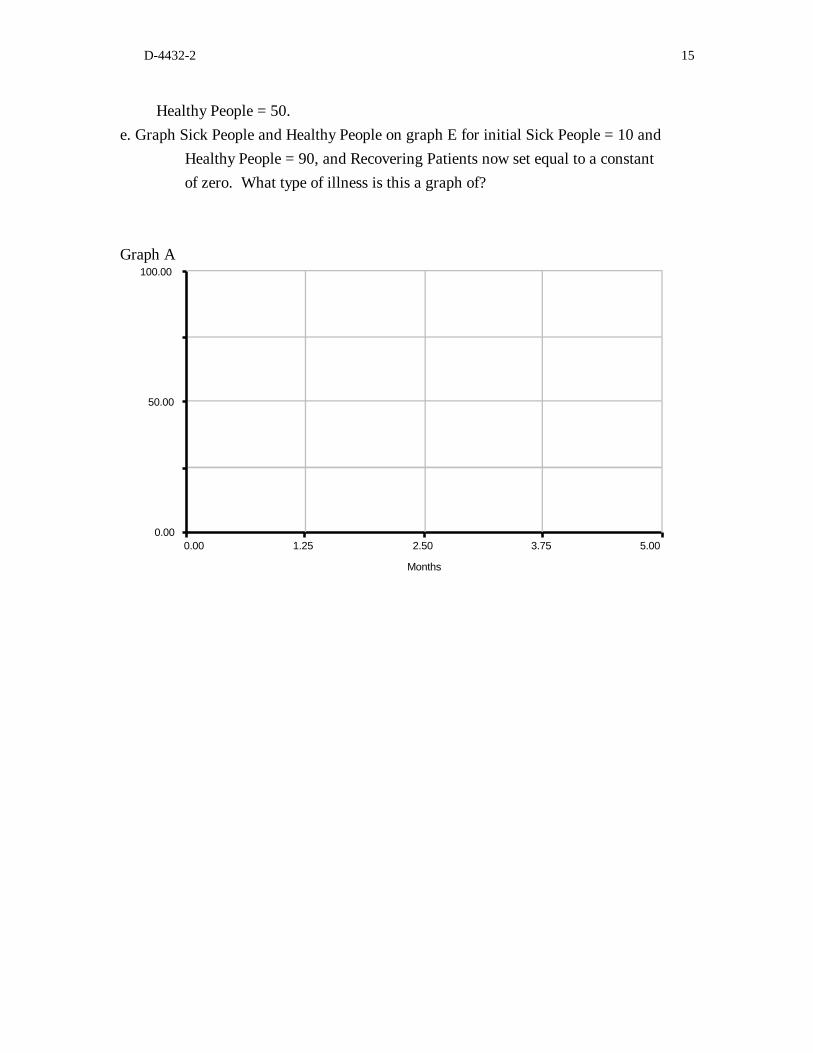
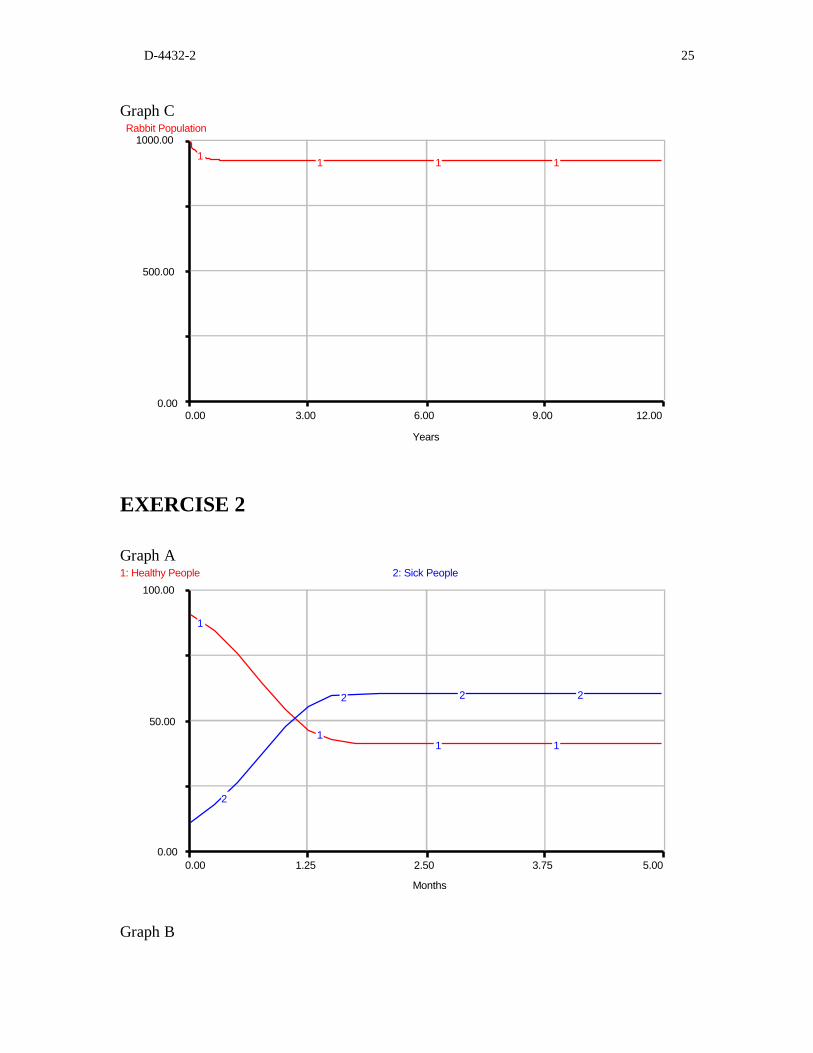
Exercise 2 Based on the above information a. Graph Sick People and Healthy People on graph A for initial Sick People = 10 and
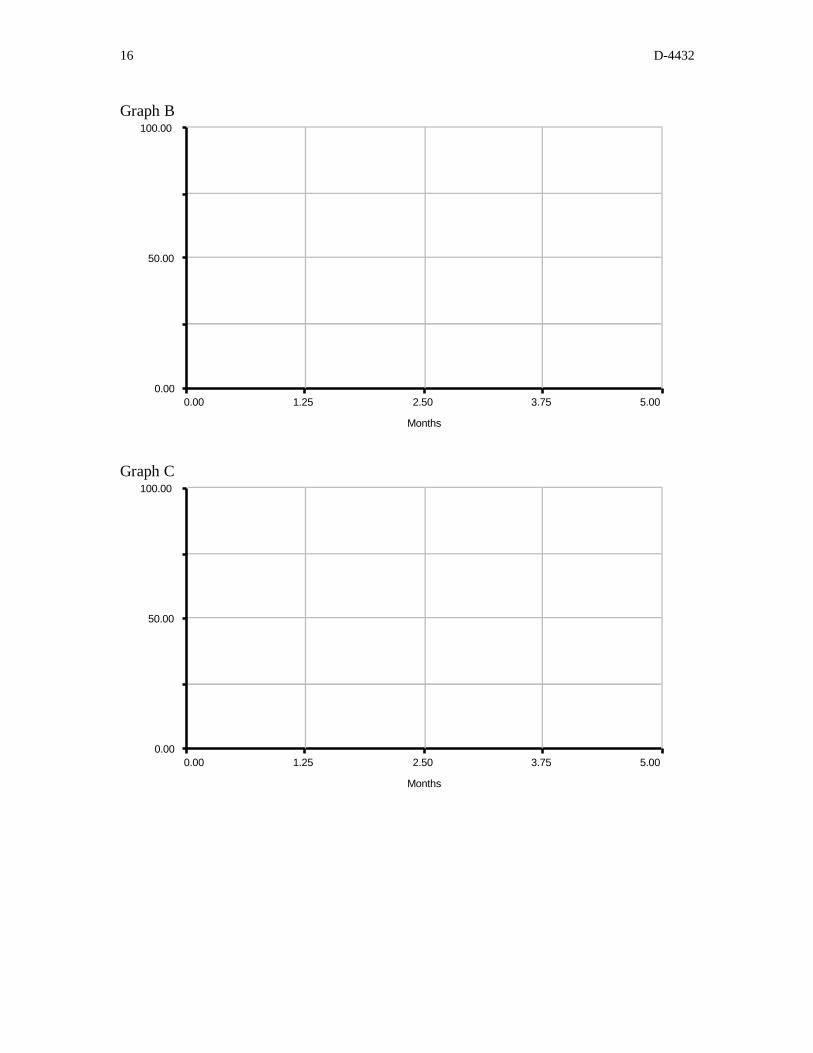
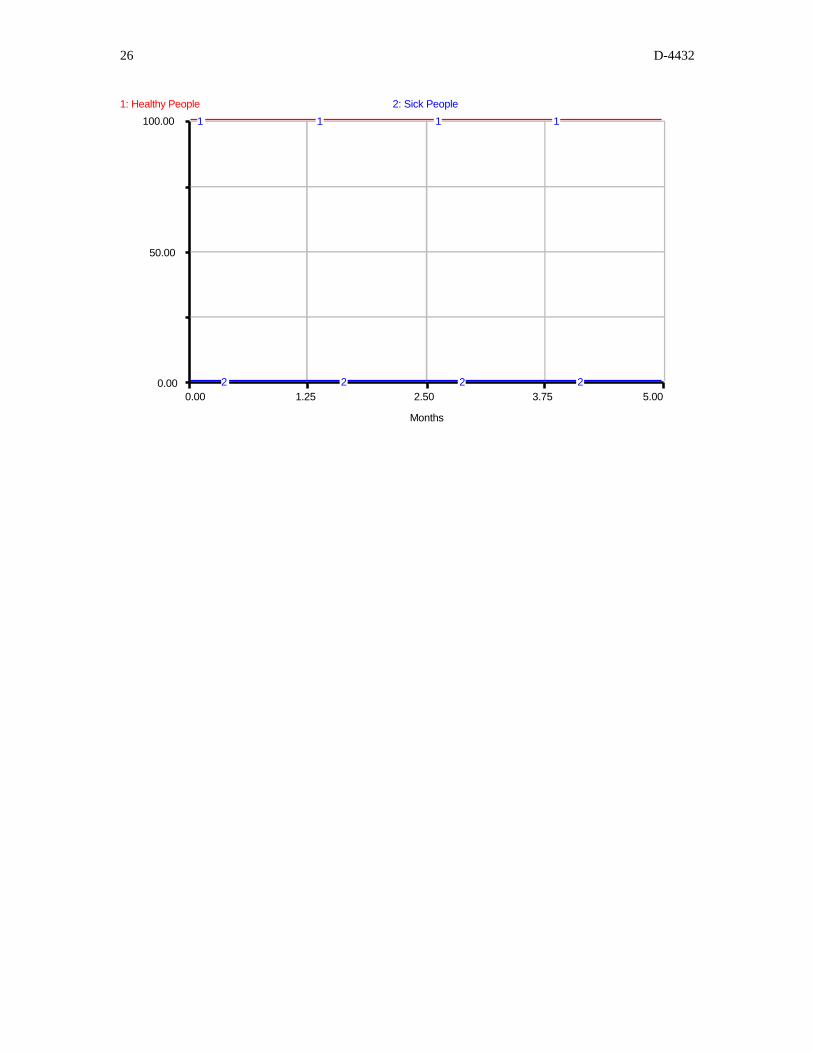
Healthy People =90. b. Graph Sick People and Healthy People on graph B for initial Sick People = 0 and
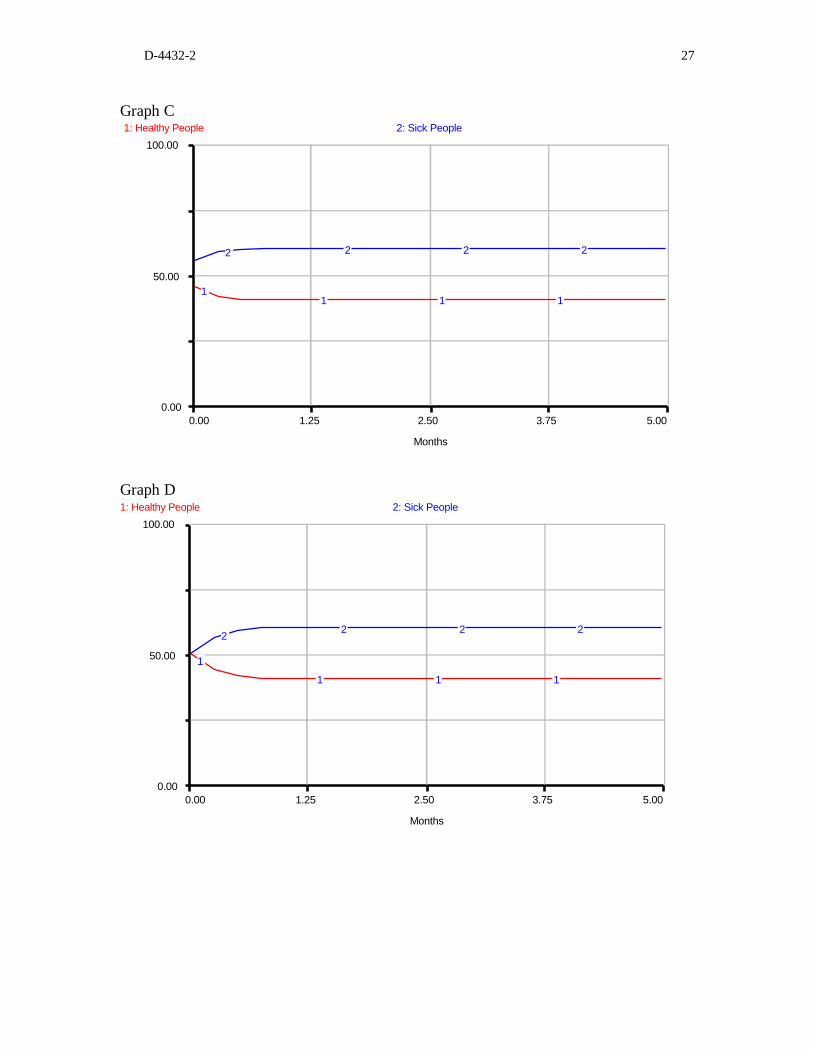
Healthy People =100. c. Graph Sick People and Healthy People on graph C for initial Sick People = 55 and
Healthy People =45. d. Graph Sick People and Healthy People on graph D for initial Sick People = 50 and
D-4432-2 15
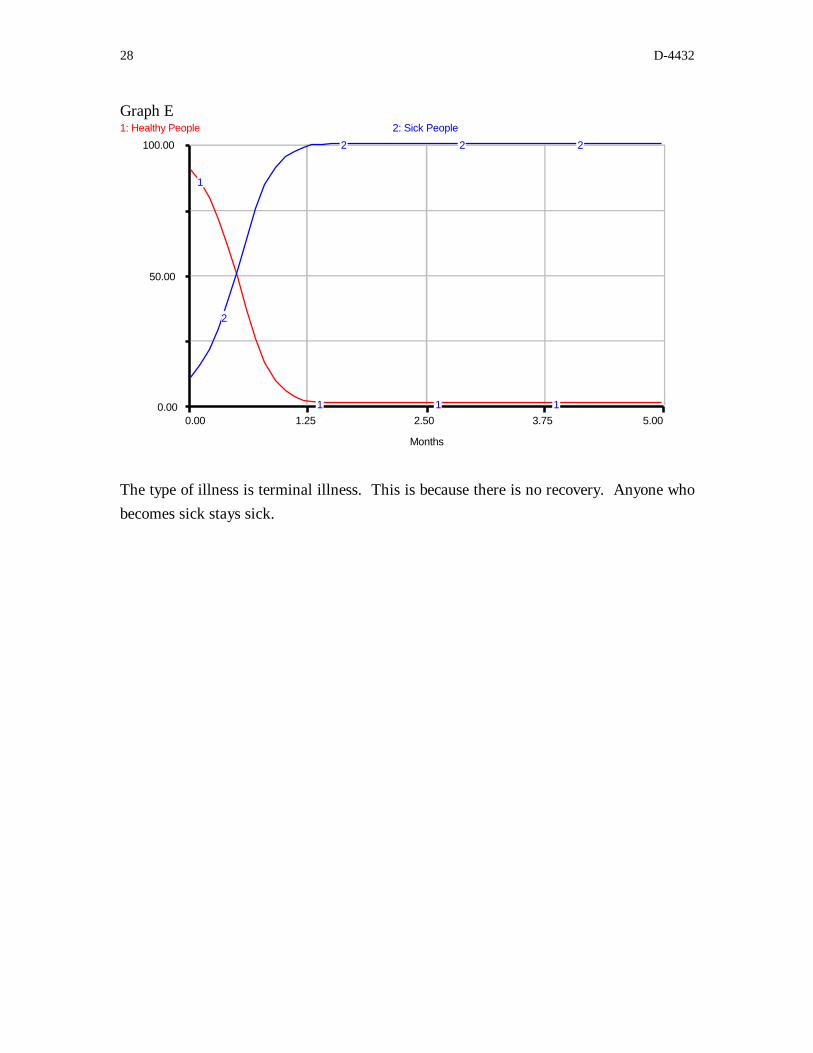
Healthy People = 50. e. Graph Sick People and Healthy People on graph E for initial Sick People = 10 and
Healthy People = 90, and Recovering Patients now set equal to a constant of zero. What type of illness is this a graph of?
Graph A 100.00
50.00
0.00 0.00 1.25 2.50 3.75 5.00
Months
16 D-4432
Graph B 100.00
50.00
0.00
Graph C 100.00
0.00 1.25 2.50
Months
3.75 5.00
50.00
0.00 0.00 1.25 2.50
Months
3.75 5.00
D-4432-2 17
Graph D 100.00
50.00
0.00 0.00 1.25 2.50 3.75 5.00
Months
Graph E 100.00
50.00
0.00 0.00 1.25 2.50 3.75 5.00
Months
STRUCTURE SIMILARITIES
Although these two structures seem very different, they are capable of producing the same behavior. We will now examine the underlying similarities of the structures.
18 D-4432
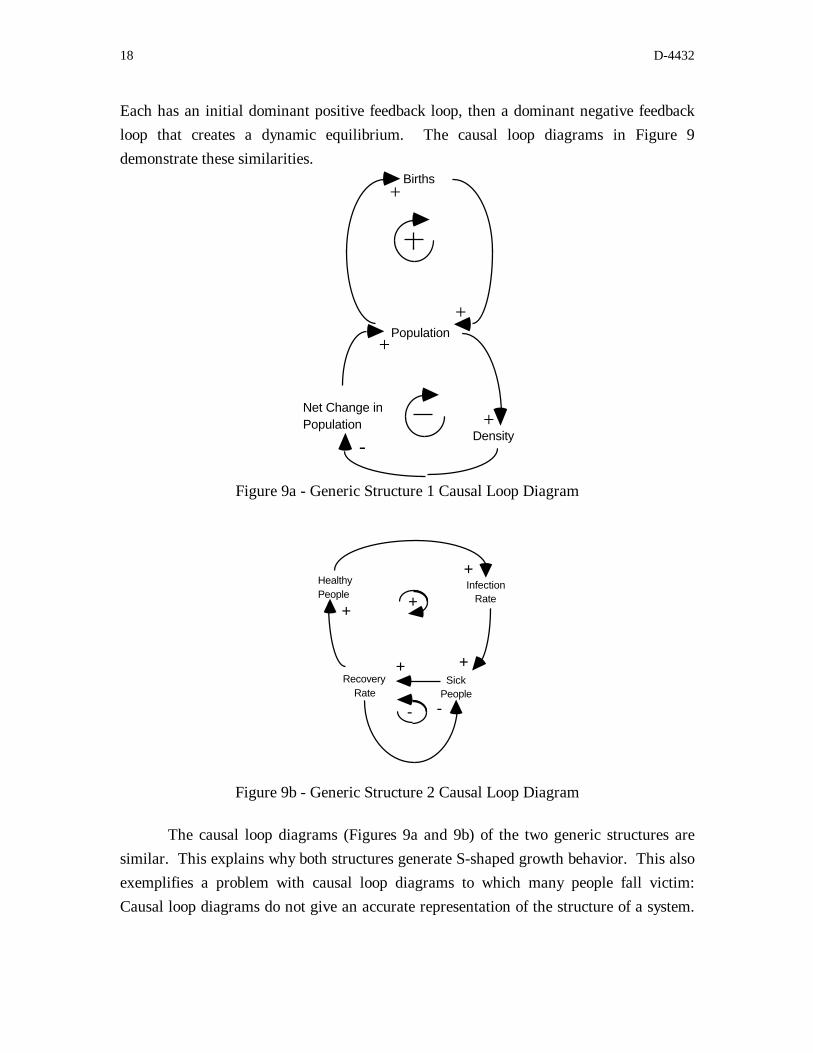
Each has an initial dominant positive feedback loop, then a dominant negative feedback loop that creates a dynamic equilibrium. The causal loop diagrams in Figure 9 demonstrate these similarities.
Births +
+ Population
+
Net Change in Population +
Density-
Figure 9a - Generic Structure 1 Causal Loop Diagram
+ Healthy Infection People + Rate
+
+ + Recovery Sick
Rate People --
Figure 9b - Generic Structure 2 Causal Loop Diagram
The causal loop diagrams (Figures 9a and 9b) of the two generic structures are similar. This explains why both structures generate S-shaped growth behavior. This also exemplifies a problem with causal loop diagrams to which many people fall victim: Causal loop diagrams do not give an accurate representation of the structure of a system.

D-4432-2 19
Causal loop diagrams are useful when describing the necessary behavior of a system, but fail when it comes to defining structure.
CONCLUSION
Generic Structures: S-Shaped Growth I provides a specific case study of generic structures as it applies to S-shaped growth behavior. It both gives examples of, and explains two generic structures for S-shaped growth. Two different structures can have similar causal loop diagrams. Since causal diagrams can be used to predict behavior, this explains why it is possible for two different structures to exhibit similar behaviors. In addition, the multiple behavior modes of each structure were examined, showing that while structure and behavior are related, they are not exclusive of each other. One structure can produce many behaviors, depending on initial conditions, and one behavior can be produced by different structures.

20 D-4432
APPENDIX A - Documentation
S-SHAPED GROWTH STRUCTURE 1 (From Figure 5a)
Rabbit_Population(t) = Rabbit_Population(t - dt) + (Births - Deaths) * dtINIT Rabbit_Population = 1
DOCUMENT: Units = Rabbits
The number of rabbits in the rabbit population.
INFLOWS:Births = Rabbit_Population * Births_NormalDOCUMENT: Units = Rabbits/YearThe number of rabbits being born each year.
OUTFLOWS:Deaths = (Rabbit_Population/Average_Lifetime) * Deaths_MultiplierDOCUMENT: Units = Rabbits/YearThe number of rabbits that die each year.
Area = 1
DOCUMENT: Units = Acres
The amount of land the rabbit population is living on.
Births_Normal = 1.5
DOCUMENT: Units = Fraction/YearThe number of rabbits born into the population per rabbit in the population each year.
Average Lifetime = 4
DOCUMENT: Units = Years
The number of rabbits that die per rabbit in the population per year.

D-4432-2 21
Population_Density = Rabbit_Population/Area
DOCUMENT: Units = Rabbits/Acres
The number of rabbits per unit of area.
Deaths_Multiplier = GRAPH(Population_Density)(0.00, 1.00), (100, 1.00), (200, 1.00), (300, 1.00), (400, 1.50), (500, 2.00), (600, 2.70),(700, 3.70), (800, 4.70), (900, 5.70), (1000, 7.50)DOCUMENT: Units = Unitless
Births Multiplier is a multiplication factor which is dependent upon the population
density. It converts density to a factor which affect the number of Births(i.e. it makes
Births affected by density).
S-SHAPED GROWTH STRUCTURE 2 (From Figure 7b)
Healthy_People(t) = Healthy_People(t - dt) + (Recovering_Patients - Catching_Illness) *
dtINIT Healthy_People = 100
DOCUMENT: Units = People
The number of healthy people in the population, where the population is the number ofhealthy people and the number of sick people.
INFLOWS:Recovering_Rate = Sick_People/Duration_of_Illness
DOCUMENT: Units = People/Month
The number of sick people recovering and becoming healthy people each month.
OUTFLOWS:Catching_Illness = Healthy_People * Probability_of_Contact_With_Sick_People *
Population_Interactions * Probability_of_Catching_Illness DOCUMENT: Units = People/Month The number of healthy people catching the illness and becoming sick people each month.

22 D-4432
Sick_People(t) = Sick_People(t - dt) + (Catching_Illness - Recovering_Patients) * dtINIT Sick_People = 1
DOCUMENT: Units = People
The number of sick people in the population.
INFLOWS:Catching_Illness = Healthy_People * Probability_of_Contact_With_Sick_People *
Population_Interactions * Probability_of_Catching_Illness DOCUMENT: Units = People/Month The number of healthy people catching the illness and becoming sick people each month.
OUTFLOWS:Recovering_Rate = Sick_People/Duration_of_Illness
DOCUMENT: Units = People/Month
The number of sick people recovering and becoming healthy people each month.
Probability_of_Contact_With_Sick_People = Sick_People/(Sick_People +
Healthy_People)DOCUMENT: Units = Unitless
The probability that when a person in the population is in contact with another person in
the population, that the other person is a sick person.
Duration_of_Illness = .5
DOCUMENT: Units = Months
The time it takes for a sick person to recover and become healthy.
Probability_of_Catching_Illness = .5
DOCUMENT: Units = Unitless
The odds of catching the illness.

D-4432-2 23
Population_Interactions = 10 DOCUMENT: Units = Fraction/Month The number of people a person will come into contact with each month.
24 D-4432
APPENDIX B - Solutions to Exercises
EXERCISE 1
Graph A Rabbit Population
1000.00
500.00
0.00
1 1
1
1
0.00 3.00 6.00
Years
9.00 12.00
Graph B Rabbit Population
1000.00
500.00
0.00 1 1 1 1 0.00 3.00 6.00 9.00 12.00
Years
D-4432-2 25
Graph C Rabbit Population
1000.00
500.00
0.00
1 1 1 1
0.00 3.00 6.00 9.00 12.00
Years
EXERCISE 2
Graph A 1: Healthy People 2: Sick People
100.00
50.00
0.00
1
2 2 2
1 1 1
2
0.00 1.25 2.50 3.75 5.00
Months
Graph B
26 D-4432
1: Healthy People 2: Sick People
100.00 1 1 1 1
50.00
0.00 2 2 2 2 0.00 1.25 2.50 3.75 5.00
Months
D-4432-2 27
Graph C 1: Healthy People 2: Sick People
100.00
50.00
0.00
2 2 2 2
1 1 1 1
0.00 1.25 2.50
Months
3.75 5.00
Graph D 1: Healthy People 2: Sick People
100.00
50.00
0.00
2 2 2 2
1
1 1 1
0.00 1.25 2.50 3.75 5.00
Months
28 D-4432
Graph E 1: Healthy People 2: Sick People
2 2 2100.00
50.00
0.00
1
2
1 1 1 0.00 1.25 2.50 3.75 5.00
Months
The type of illness is terminal illness. This is because there is no recovery. Anyone who becomes sick stays sick.
D-4432-2 29
APPENDIX C - Technical Documentation
S-Shaped Growth Structure 1
Exponential growth to infinity occurs when the parameters are set at values that cause the Birth Rate to always exceed the Death Rate.
Birth Rate = Rabbit Population ? Birth Fraction
Death Rate = Rabbit Population ? Deaths MultiplierAverage Lifetime
For the Birth Rate to always be greater than the Death Rate the following must always hold true:
Deaths MultiplierBirth Fraction >
Average Lifetime
Exponential decay to zero occurs when the parameters are set at values that cause the Death Rate to always exceed the Birth Rate. For this to be the case the following must always hold true:
Deaths MultiplierBirth Fraction <
Average Lifetime
S-Shaped Growth Structure 2
Changing parameter values for this structure will only affect the time scale over which the various behaviors occur. This can be easily understood if one examines the equation for Catching Illness.
Catching Illness = Healthy People ? Probability of Contact with Sick People ? Population Interactions? Probability of Catching Illness
One must now must substitute into the above equation, the equation for Probability of Contact with Sick People.
30 D-4432
Probability of Contact with Sick People = Sick People
Healthy People + Sick People
Catching Illness = Healthy People ? Sick People ?Healthy People + Sick People
Population Interactions? Probability of Catching Illness
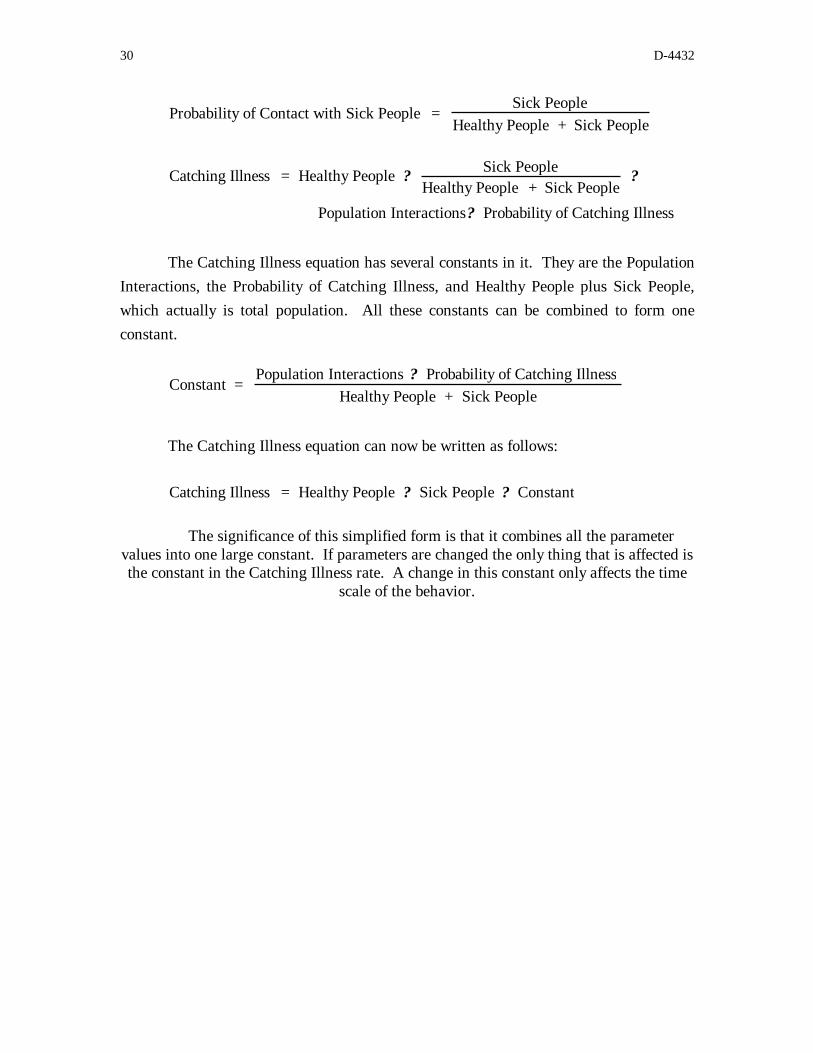
The Catching Illness equation has several constants in it. They are the Population Interactions, the Probability of Catching Illness, and Healthy People plus Sick People, which actually is total population. All these constants can be combined to form one constant.
Population Interactions ? Probability of Catching IllnessConstant =
Healthy People + Sick People
The Catching Illness equation can now be written as follows:
Catching Illness = Healthy People ? Sick People ? Constant
The significance of this simplified form is that it combines all the parameter values into one large constant. If parameters are changed the only thing that is affected is the constant in the Catching Illness rate. A change in this constant only affects the time
scale of the behavior.
D-4432-2 31
Vensim Examples: Generic Structures: S-Shaped Growth I
By Lei Lei October 2001
S-Shaped Growth Structure 1
INITIAL RABBIT POPULATION
Rabbit Population
births deaths
BIRTHS NORMAL AVERAGE LIFETIME
population density
deaths multiplier LOOKUP OF
DEATHS MULTIPLIER
NORMAL AREA POPULATION
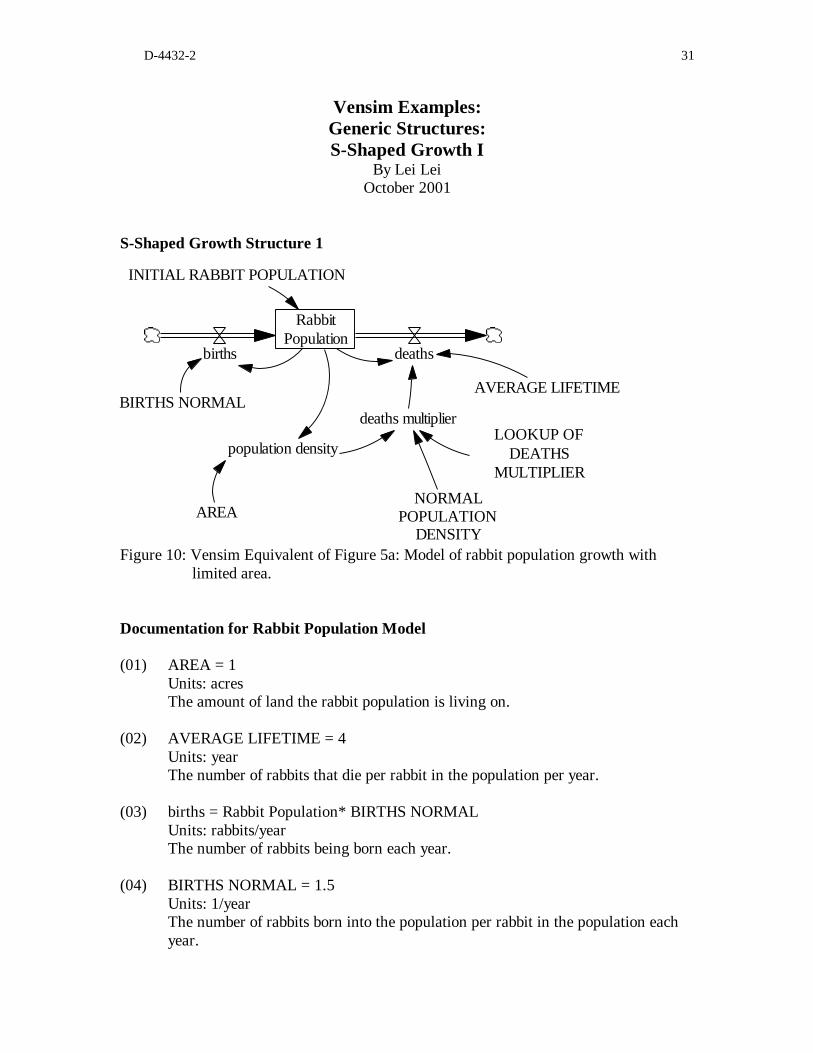
DENSITY Figure 10: Vensim Equivalent of Figure 5a: Model of rabbit population growth with
limited area.
Documentation for Rabbit Population Model
(01) AREA = 1 Units: acres The amount of land the rabbit population is living on.
(02) AVERAGE LIFETIME = 4 Units: year The number of rabbits that die per rabbit in the population per year.
(03) births = Rabbit Population* BIRTHS NORMAL Units: rabbits/year The number of rabbits being born each year.
(04) BIRTHS NORMAL = 1.5 Units: 1/year The number of rabbits born into the population per rabbit in the population each year.
32 D-4432
(05) deaths = (Rabbit Population/AVERAGE LIFETIME)* deaths multiplier Units: rabbits/year The number of rabbits that die each year.
(06) deaths multiplier = LOOKUP OF DEATHS MULTIPLIER(population density/NORMAL POPULATION DENSITY) Units: dmnl Deaths Multiplier is a multiplication factor that is dependent upon the population density. It converts density to a factor that affects the number of births (i.e. it makes births affected by density).
(07) FINAL TIME = 100 Units: year The final time for the simulation.
(08) INITIAL RABBIT POPULATION = 1 Units: rabbits
(09) INITIAL TIME = 0 Units: year The initial time for the simulation.
(10) LOOKUP OF DEATHS MULTIPLIER [(0,1)(20,25)],(0.01,1),(1,1),(2,1),(3,1),(4,1.5),(5,2),(6,2.7),(7,3.7),(8,4.7),(9,5.7), (10,7.5),(11,9),(12,10.5),(13,12),(14,14),(15,17),(16,19),(17,21),(18,23),(19,24), (20,25)Units: dmnl
(11) NORMAL POPULATION DENSITY = 100 Units: rabbits/acres The normal population density is the initial rabbit population, 1 rabbit, divided by the area, 1 acre. So it is 1.
(12) population density = Rabbit Population/AREA Units: rabbits/acres
(13) Rabbit Population = INTEG (births-deaths, INITIAL RABBIT POPULATION) Units: rabbits The number of rabbits in the rabbit population.
(14) SAVEPER = TIME STEP Units: year The frequency with which output is stored.
(15) TIME STEP = 0.0625 Units: year The time step for the simulation.
D-4432-2 33
S-Shaped Growth Structure 2
DURATION OF ILLNESS
recovery rate PROBABILITYOF CATCHING
ILLNESS
Sick People
INITIAL SICK PEOPLE
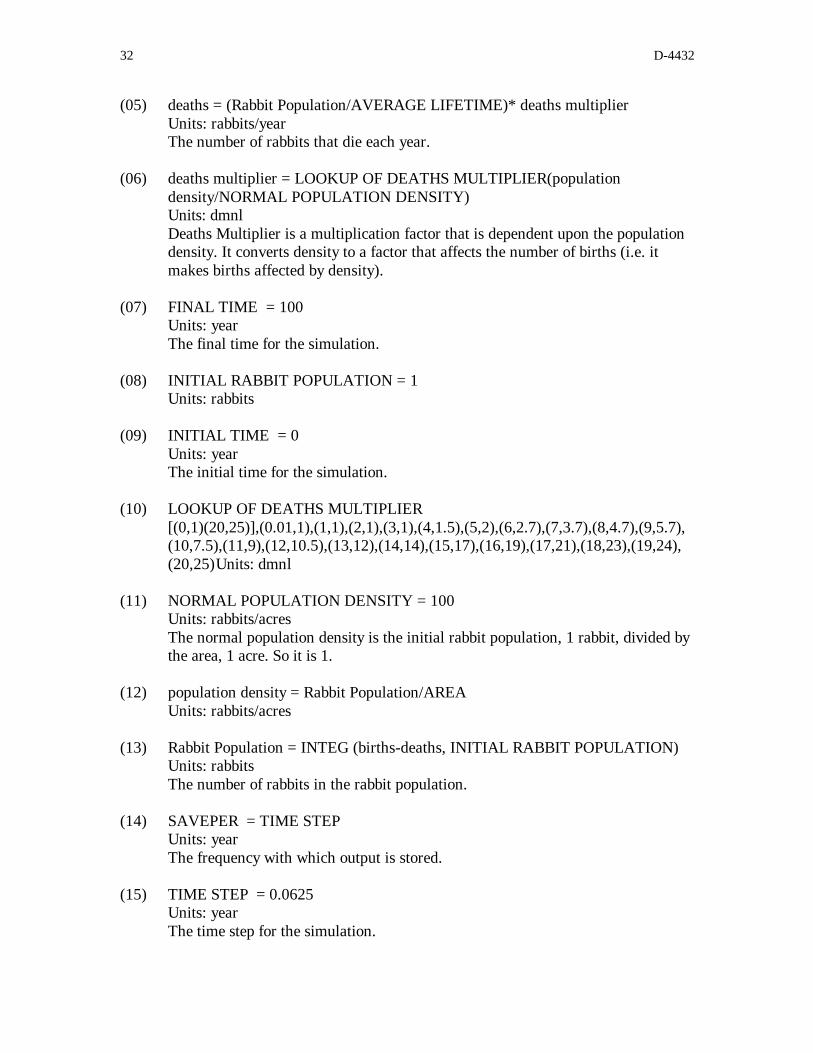
Figure 11: Vensim Equivalent of Figure 7a: Epidemic
Healthy People catching illness
POPULATION INTERACTIONS
probability ofcontact with sick
people INITIAL
HEALTHY PEOPLE
Documentation for Epidemic Model
(01) catching illness = Healthy People* probability of contact with sick people* POPULATION INTERACTIONS * PROBABILITY OF CATCHING ILLNESS Units: people/Month The number of Healthy People catching the illness and becoming Sick People each month.
(02) DURATION OF ILLNESS = .5 Units: Month The time it takes for a Sick Person to recover and become healthy.
(03) FINAL TIME = 5 Units: Month The final time for the simulation.
(04) Healthy People = INTEG (+recovery rate-catching illness, INITIAL HEALTHY PEOPLE) Units: people

34 D-4432
The number of Healthy People in the population, where the population is the number of healthy people and the number of Sick People.
(05) INITIAL HEALTHY PEOPLE = 100 Units: people
(06) INITIAL SICK PEOPLE = 1 Units: people
(07) INITIAL TIME = 0 Units: Month The initial time for the simulation.
(08) POPULATION INTERACTIONS = 10 Units: 1/Month The number of people a person will come into contact with each month.
(09) PROBABILITY OF CATCHING ILLNESS = 0.5 Units: dmnl The odds of catching the illness.
(10) probability of contact with sick people = Sick People/(Sick People+ Healthy People) Units: dmnl The probability that when a person in the population is in contact with another person in the population, that the other person is a sick person.
(11) recovery rate = Sick People/DURATION OF ILLNESS Units: people/Month The number of Sick People recovering and becoming Healthy People each month.
(12) SAVEPER = TIME STEP Units: Month The frequency with which output is stored.
(13) Sick People = INTEG (catching illness-recovery rate, INITIAL SICK PEOPLE) Units: people
(14) TIME STEP = 0.125 Units: Month The time step for the simulation.
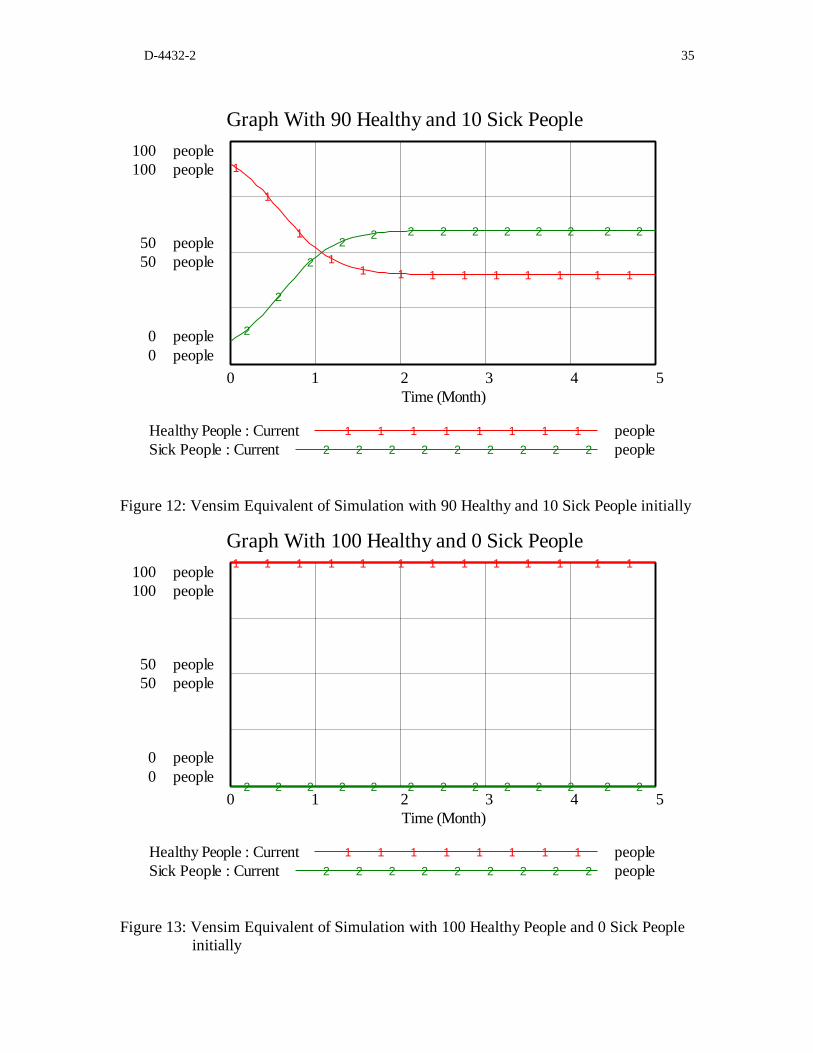
D-4432-2 35
Graph With 90 Healthy and 10 Sick People
100 people 100 people
50 people 50 people
0 people 0 people
1
1
1 2
2 2 2 2 2 2 2 2 2
2
2 1 1 1 1 1 1 1 1 1 1
2
0 1 2 3 4 5 Time (Month)
Healthy People : Current 1 1 1 1 1 1 1 1 people Sick People : Current 2 2 2 2 2 2 2 2 2 people
Figure 12: Vensim Equivalent of Simulation with 90 Healthy and 10 Sick People initially
Graph With 100 Healthy and 0 Sick People 1 1 1 1 1 1 1 1 1 1100 people 1 1 1
100 people
50 people 50 people
0 people 0 people
2 2 2 2 2 2 2 2 2 2 2 2 2 0 1 2 3 4 5
Time (Month)
Healthy People : Current 1 1 1 1 1 1 1 1 people Sick People : Current 2 2 2 2 2 2 2 2 2 people
Figure 13: Vensim Equivalent of Simulation with 100 Healthy People and 0 Sick People initially
36 D-4432
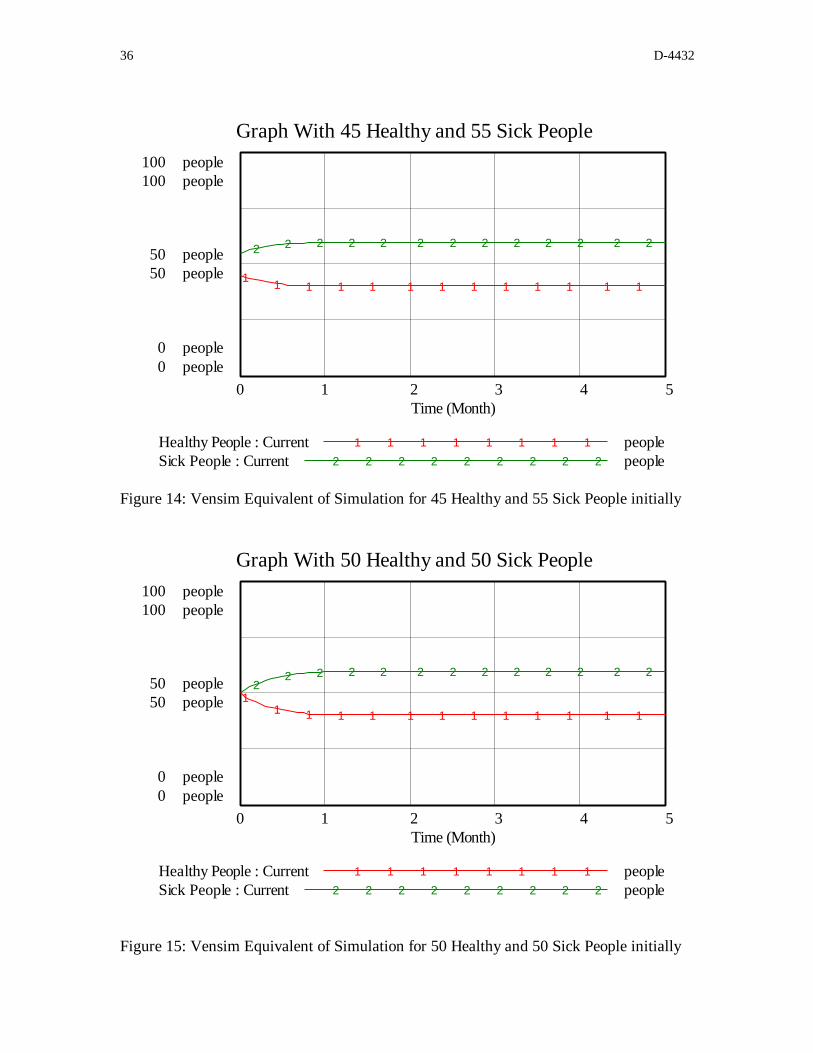
Graph With 45 Healthy and 55 Sick People
100 people 100 people
50 people 50 people
0 people 0 people
2 2 2 2 2 2 2 2 2 2 2 2 2
1 1 1 1 1 1 1 1 1 1 1 1 1
0 1 2Time (Month)
3 4 5
Healthy People : Current Sick People : Current 2
1 1 1 2 2 2
1 2
1 1 2 2
1 1 2 2
people people
Figure 14: Vensim Equivalent of Simulation for 45 Healthy and 55 Sick People initially
Graph With 50 Healthy and 50 Sick People 100 people 100 people
50 people 50 people
0 people 0 people
2 2 2 2 2 2 2 2 2 2 2 2 2
1 1 1 1 1 1 1 1 1 1 1 1 1
0 1 2 3Time (Month)
4 5
Healthy People : Current Sick People : Current 2
1 2
1 2
1 2
1 2
1 2
1 2
1 2
1 2
people people
Figure 15: Vensim Equivalent of Simulation for 50 Healthy and 50 Sick People initially
D-4432-2 37
2 2 2 2
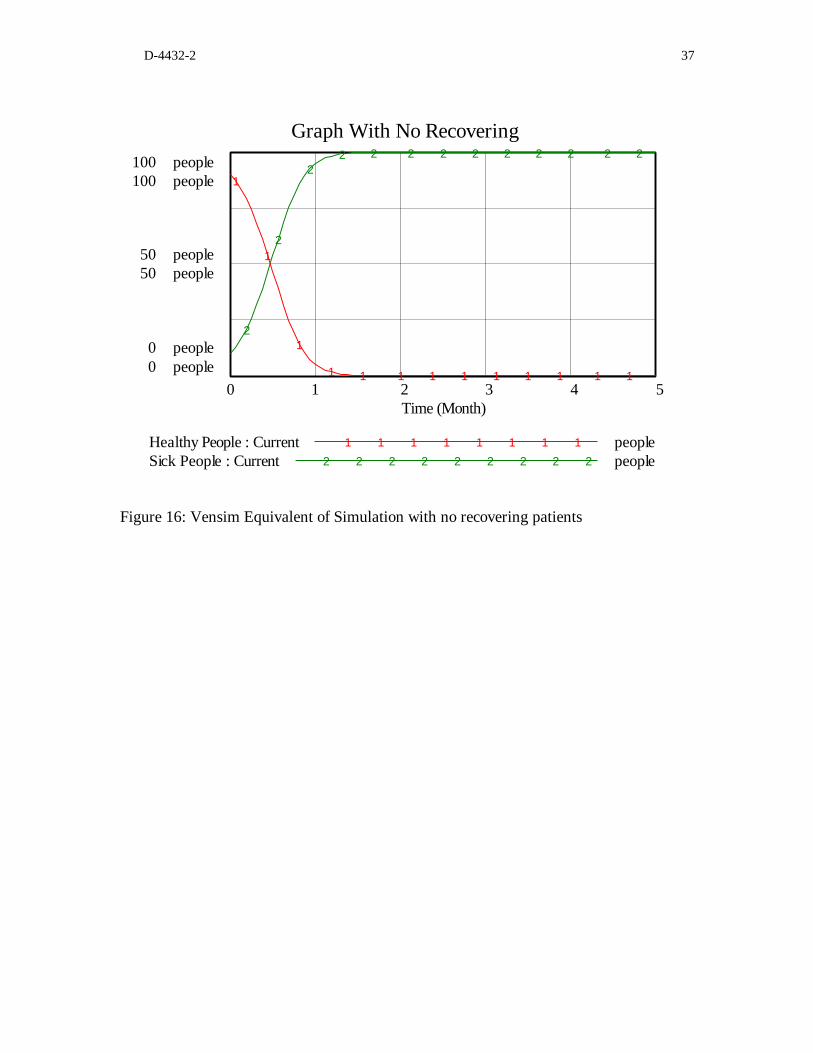
Graph With No Recovering 2 2 2 2 2100 people
100 people
50 people 50 people
0 people 0 people
2 1
2
2 1
2 1
1 1 1 1 1 1 1 1 1 1 0 1 2 3 4 5
Time (Month)
Healthy People : Current 1 1 1 1 1 1 1 1 people Sick People : Current 2 2 2 2 2 2 2 2 2 people
Figure 16: Vensim Equivalent of Simulation with no recovering patients


![AN OPTIMAL DESIGN OF CPW-FED UWB APERTURE ANTENNAS … · wave resonant structures) in the antenna’s tuning stub, such as a U-shaped [27], V-shaped [3], C-shaped slots [27,28],](https://img.dokumen.tips/doc/110x75/5e6f2490d68cd01abb03376b/an-optimal-design-of-cpw-fed-uwb-aperture-antennas-wave-resonant-structures-in.jpg)


