Embed Size (px)
Citation preview
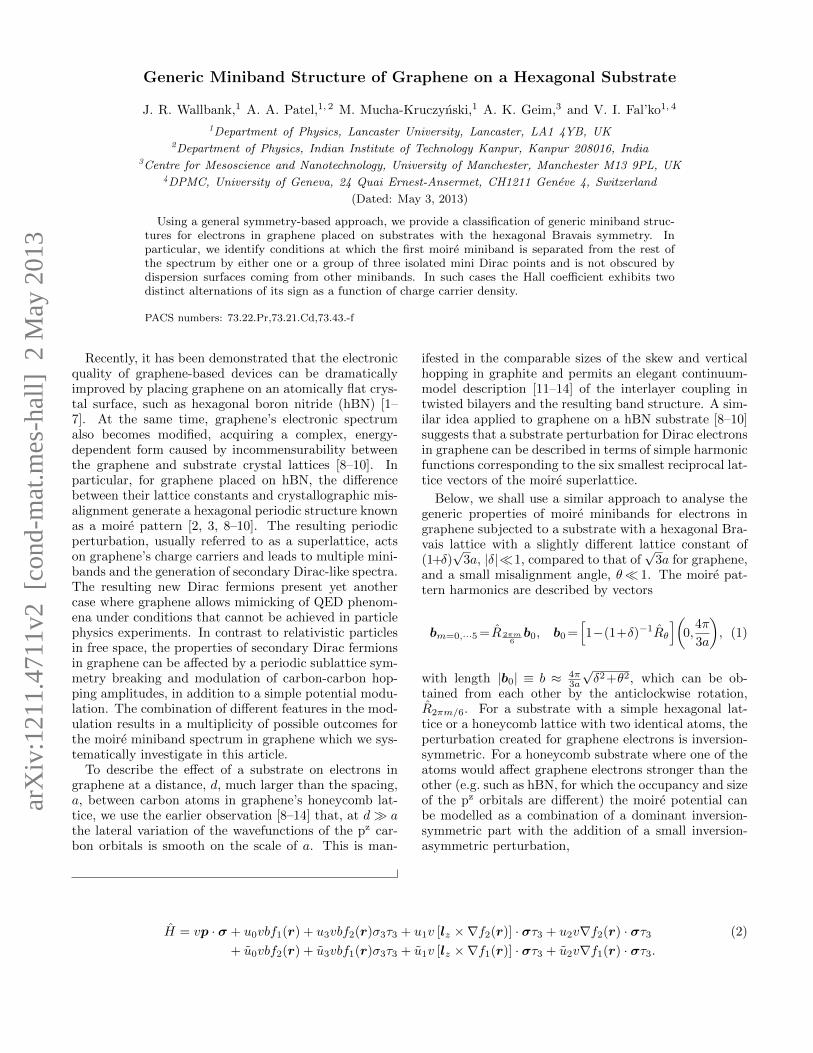
Generic Miniband Structure of Graphene on a Hexagonal Substrate
J. R. Wallbank,1 A. A. Patel,1, 2 M. Mucha-Kruczynski,1 A. K. Geim,3 and V. I. Fal’ko1, 4
1Department of Physics, Lancaster University, Lancaster, LA1 4YB, UK2Department of Physics, Indian Institute of Technology Kanpur, Kanpur 208016, India
3Centre for Mesoscience and Nanotechnology, University of Manchester, Manchester M13 9PL, UK4DPMC, University of Geneva, 24 Quai Ernest-Ansermet, CH1211 Geneve 4, Switzerland
(Dated: May 3, 2013)
Using a general symmetry-based approach, we provide a classification of generic miniband struc-tures for electrons in graphene placed on substrates with the hexagonal Bravais symmetry. Inparticular, we identify conditions at which the first moire miniband is separated from the rest ofthe spectrum by either one or a group of three isolated mini Dirac points and is not obscured bydispersion surfaces coming from other minibands. In such cases the Hall coefficient exhibits twodistinct alternations of its sign as a function of charge carrier density.
PACS numbers: 73.22.Pr,73.21.Cd,73.43.-f
Recently, it has been demonstrated that the electronicquality of graphene-based devices can be dramaticallyimproved by placing graphene on an atomically flat crys-tal surface, such as hexagonal boron nitride (hBN) [1–7]. At the same time, graphene’s electronic spectrumalso becomes modified, acquiring a complex, energy-dependent form caused by incommensurability betweenthe graphene and substrate crystal lattices [8–10]. Inparticular, for graphene placed on hBN, the differencebetween their lattice constants and crystallographic mis-alignment generate a hexagonal periodic structure knownas a moire pattern [2, 3, 8–10]. The resulting periodicperturbation, usually referred to as a superlattice, actson graphene’s charge carriers and leads to multiple mini-bands and the generation of secondary Dirac-like spectra.The resulting new Dirac fermions present yet anothercase where graphene allows mimicking of QED phenom-ena under conditions that cannot be achieved in particlephysics experiments. In contrast to relativistic particlesin free space, the properties of secondary Dirac fermionsin graphene can be affected by a periodic sublattice sym-metry breaking and modulation of carbon-carbon hop-ping amplitudes, in addition to a simple potential modu-lation. The combination of different features in the mod-ulation results in a multiplicity of possible outcomes forthe moire miniband spectrum in graphene which we sys-tematically investigate in this article.
To describe the effect of a substrate on electrons ingraphene at a distance, d, much larger than the spacing,a, between carbon atoms in graphene’s honeycomb lat-tice, we use the earlier observation [8–14] that, at d� athe lateral variation of the wavefunctions of the pz car-bon orbitals is smooth on the scale of a. This is man-
ifested in the comparable sizes of the skew and verticalhopping in graphite and permits an elegant continuum-model description [11–14] of the interlayer coupling intwisted bilayers and the resulting band structure. A sim-ilar idea applied to graphene on a hBN substrate [8–10]suggests that a substrate perturbation for Dirac electronsin graphene can be described in terms of simple harmonicfunctions corresponding to the six smallest reciprocal lat-tice vectors of the moire superlattice.
Below, we shall use a similar approach to analyse thegeneric properties of moire minibands for electrons ingraphene subjected to a substrate with a hexagonal Bra-vais lattice with a slightly different lattice constant of(1+δ)
√3a, |δ|�1, compared to that of
√3a for graphene,
and a small misalignment angle, θ� 1. The moire pat-tern harmonics are described by vectors
bm=0,···5 =R 2πm6b0, b0 =
[1−(1+δ)−1Rθ
](0,
4π
3a
), (1)
with length |b0| ≡ b ≈ 4π3a
√δ2+θ2, which can be ob-
tained from each other by the anticlockwise rotation,R2πm/6. For a substrate with a simple hexagonal lat-tice or a honeycomb lattice with two identical atoms, theperturbation created for graphene electrons is inversion-symmetric. For a honeycomb substrate where one of theatoms would affect graphene electrons stronger than theother (e.g. such as hBN, for which the occupancy and sizeof the pz orbitals are different) the moire potential canbe modelled as a combination of a dominant inversion-symmetric part with the addition of a small inversion-asymmetric perturbation,
H = vp · σ + u0vbf1(r) + u3vbf2(r)σ3τ3 + u1v [lz ×∇f2(r)] · στ3 + u2v∇f2(r) · στ3 (2)
+ u0vbf2(r) + u3vbf1(r)σ3τ3 + u1v [lz ×∇f1(r)] · στ3 + u2v∇f1(r) · στ3.
arX
iv:1
211.
4711
v2 [
cond
-mat
.mes
-hal
l] 2
May
201
3
2
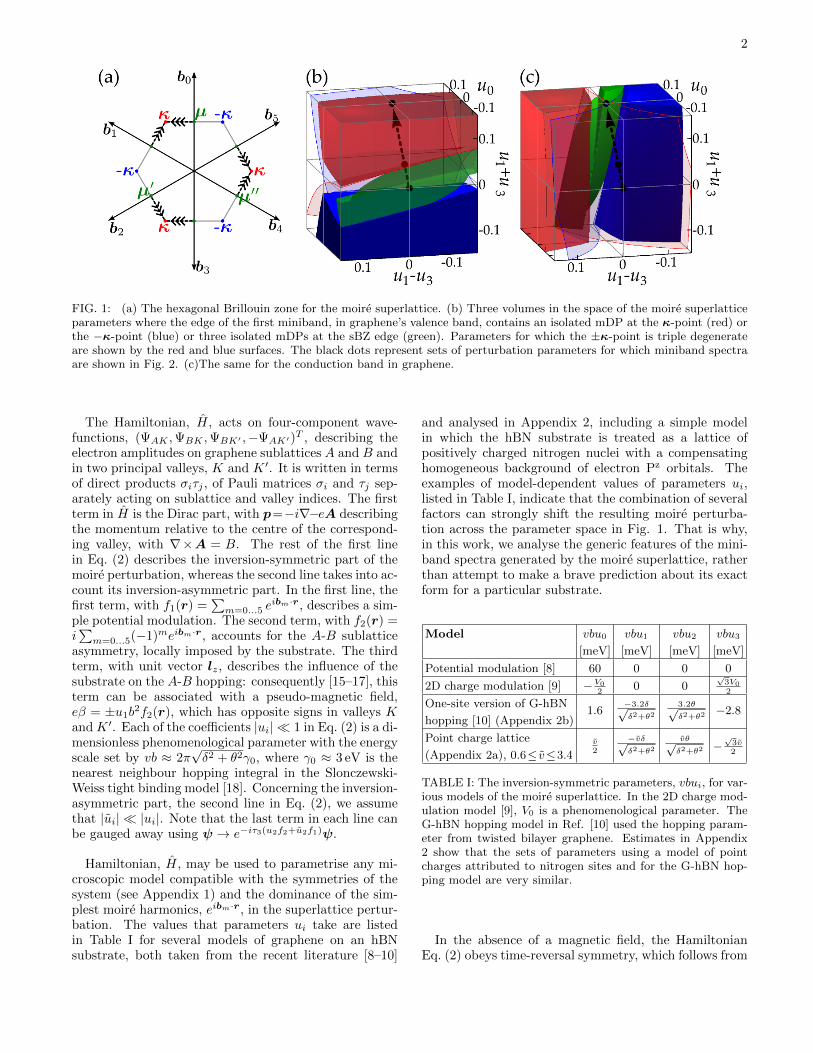
FIG. 1: (a) The hexagonal Brillouin zone for the moire superlattice. (b) Three volumes in the space of the moire superlatticeparameters where the edge of the first miniband, in graphene’s valence band, contains an isolated mDP at the κ-point (red) orthe −κ-point (blue) or three isolated mDPs at the sBZ edge (green). Parameters for which the ±κ-point is triple degenerateare shown by the red and blue surfaces. The black dots represent sets of perturbation parameters for which miniband spectraare shown in Fig. 2. (c)The same for the conduction band in graphene.
The Hamiltonian, H, acts on four-component wave-functions, (ΨAK ,ΨBK ,ΨBK′ ,−ΨAK′)T , describing theelectron amplitudes on graphene sublattices A and B andin two principal valleys, K and K ′. It is written in termsof direct products σiτj , of Pauli matrices σi and τj sep-arately acting on sublattice and valley indices. The firstterm in H is the Dirac part, with p=−i∇−eA describingthe momentum relative to the centre of the correspond-ing valley, with ∇×A = B. The rest of the first linein Eq. (2) describes the inversion-symmetric part of themoire perturbation, whereas the second line takes into ac-count its inversion-asymmetric part. In the first line, thefirst term, with f1(r) =
∑m=0...5 e
ibm·r, describes a sim-ple potential modulation. The second term, with f2(r) =i∑m=0...5(−1)meibm·r, accounts for the A-B sublattice
asymmetry, locally imposed by the substrate. The thirdterm, with unit vector lz, describes the influence of thesubstrate on the A-B hopping: consequently [15–17], thisterm can be associated with a pseudo-magnetic field,eβ = ±u1b2f2(r), which has opposite signs in valleys Kand K ′. Each of the coefficients |ui| � 1 in Eq. (2) is a di-mensionless phenomenological parameter with the energyscale set by vb ≈ 2π
√δ2 + θ2γ0, where γ0 ≈ 3 eV is the
nearest neighbour hopping integral in the Slonczewski-Weiss tight binding model [18]. Concerning the inversion-asymmetric part, the second line in Eq. (2), we assumethat |ui| � |ui|. Note that the last term in each line canbe gauged away using ψ → e−iτ3(u2f2+u2f1)ψ.
Hamiltonian, H, may be used to parametrise any mi-croscopic model compatible with the symmetries of thesystem (see Appendix 1) and the dominance of the sim-plest moire harmonics, eibm·r, in the superlattice pertur-bation. The values that parameters ui take are listedin Table I for several models of graphene on an hBNsubstrate, both taken from the recent literature [8–10]
and analysed in Appendix 2, including a simple modelin which the hBN substrate is treated as a lattice ofpositively charged nitrogen nuclei with a compensatinghomogeneous background of electron Pz orbitals. Theexamples of model-dependent values of parameters ui,listed in Table I, indicate that the combination of severalfactors can strongly shift the resulting moire perturba-tion across the parameter space in Fig. 1. That is why,in this work, we analyse the generic features of the mini-band spectra generated by the moire superlattice, ratherthan attempt to make a brave prediction about its exactform for a particular substrate.
Model vbu0 vbu1 vbu2 vbu3
[meV] [meV] [meV] [meV]
Potential modulation [8] 60 0 0 0
2D charge modulation [9] −V02
0 0√3V02
One-site version of G-hBN1.6
−3.2δ√δ2+θ2
3.2θ√δ2+θ2
−2.8hopping [10] (Appendix 2b)
Point charge lattice v2
−vδ√δ2+θ2
vθ√δ2+θ2 −
√3v2(Appendix 2a), 0.6≤ v≤3.4
TABLE I: The inversion-symmetric parameters, vbui, for var-ious models of the moire superlattice. In the 2D charge mod-ulation model [9], V0 is a phenomenological parameter. TheG-hBN hopping model in Ref. [10] used the hopping param-eter from twisted bilayer graphene. Estimates in Appendix2 show that the sets of parameters using a model of pointcharges attributed to nitrogen sites and for the G-hBN hop-ping model are very similar.
In the absence of a magnetic field, the HamiltonianEq. (2) obeys time-reversal symmetry, which follows from

3
both σi and τi changing sign upon the transformationt→ −t [19]. As a result, εK+p = εK′−p and we limit thediscussion of minibands to the K valley. Subject to thislimitation the bandstructure for the inversion-symmetricsuperlattice perturbation obeys the c3v symmetry. More-over, using the commutation properties of σi one can es-tablish that
εu0,u1,u3
K+p =−ε−u0,−u1,u3
K−p =−ε−u0,u1,−u3
K+p =εu0,−u1,−u3
K−p . (3)
To calculate the miniband spectrum for H in Eq. (2)we perform zone folding (in the graphene K valley) bring-ing states with momenta related by the reciprocal latticevectors n1b1 + n2b2 of the moire pattern to the samepoint of the superlattice Brillouin zone (sBZ) in Fig. 1(a).
Then, we calculate the matrix elements of H betweenthose states and diagonalise the corresponding Heisen-berg matrix numerically exploring the parametric space(u0, u1, u3) of the dominant inversion-symmetric part ofthe moire perturbation shown in Fig 1 (b,c). The sizeof the matrix is chosen to guarantee the convergence ofthe calculated energies for the three lowest minibandsin both the conduction band (s = +1) and the valenceband (s = −1). Below, we discuss the generic features ofthe moire miniband spectra for the characteristic pointsin the parametric space (u0, u1, u3), marked using blackdots in Fig. 1(b,c), using both the numerically calculateddispersion surfaces in Fig. 2 and analytical perturbationtheory analysis.
For the zero-energy Dirac point in graphene, there areonly the original p = 0 states in each valley that appearat ε = 0 upon zone folding. For all three characteris-tic spectra shown in Fig. 2, for the inversion-symmetricmoire perturbation, the gapless Dirac spectrum persistsat low energies near the conduction-valence band edgewith almost unchanged Dirac velocity,
[1 +O(u2)
]v.
The inversion-asymmetric terms ui are able [10] to opena minigap at the Dirac point.
For the point µ = b0/2 on the edge of the first sBZ,zone folding brings together two degenerate plane wavestates, |µ + q〉 and |µ + b3 + q〉. The splitting of thesedegenerate states by the moire potential in Eq. (2) canbe studied using degenerate perturbation theory. Thecorresponding 2× 2 matrix, expanded in small deviationq of the electron momentum from each of the three sBZµ-points [20] has the form
Hµ+q = vb
(Eµ + s
qyb H12
H∗12 Eµ − s qyb
), (4)
Eµ ≈s
2+sq2xb2,
H12 ≈ (su1 − u3)− i(su1 − u3) + 2qxb
(u0 + iu0).
For the inversion-symmetric perturbation, the dispersionrelation resulting from Eq. (4) contains an anisotropicmini Dirac point (mDP) [8, 21, 22] with Dirac velocitycomponent ≈ 2u0v in the direction of the sBZ edge and
≈ v in the perpendicular direction. This feature is clearlyseen at the µ-point of the first moire miniband in thevalence band, in the top row of Fig. 2. Note that theelectron spectrum is not symmetric between the valenceand conduction bands and that the mDPs at the µ-pointin the conduction band are obscured by an overlappingspectral branch.
Moving in parameter space, e.g., along the line shownin Fig. 1(b), the positions of the three anisotropic mDPsshift along the sBZ edge towards the sBZ corners: ei-ther κ = (b4 + b5)/3, or −κ, as shown by arrowedlines in Fig. 1(a). In general, a spectrum with three iso-lated mDPs at the sBZ edge is typical for the green vol-ume in the parameter space in Fig. 1(b) for the valenceband, or Fig. 1(c) for the conduction band. In contrast,for (u0, u1, u3) in the clear part of the parameter space,mDPs on the edge of the first sBZ are overshadowed byan overlapping spectral branch, as is the case on the con-duction band side for all three cases shown in Fig. 2.
For the points in Fig. 1(b,c) on the red and blue sur-faces, the three mDPs reach the κ-point, forming a tripledegenerate band crossing, as in the valence band spec-trum shown in the middle row of Fig. 2, which can betraced using the perturbation theory analysis of the bandcrossing at κ discussed below.
The third line in Fig. 2 shows the third type of spec-trum of moire minibands, characteristic for the red andblue volumes of the parameter space in Fig. 1. Thecharacteristic feature of such spectra consists in a sin-gle isolated mDP, at the ±κ-point, in the valence band(Fig. 1(b)) or the conduction band (Fig. 1(c)).
For the κ and −κ-points, zone folding brings togetherthree degenerate plane wave states, |ζ(κ+q)〉, |ζ(κ+b1+q)〉, and |ζ(κ + b2 + q)〉 (where ζ = ±), whose splittingis determined by
Hζ(κ+q) =vb
s√3
+ sqxb wζ w∗ζ
w∗ζs√3−s qx−
√3qy
2b −wζwζ −w∗ζ s√
3−s qx+
√3qy
2b
,wζ≈
1
2
[(u0−2sζu1+
√3ζu3
)+iζ
(u0+2sζu1−
√3ζu3
)]. (5)
For wζ 6= 0, the inversion-symmetric terms in Hζ(κ+q)
partially lift the ζκ-point degeneracy into a singlet withenergy ( s√
3− 2wζ)vb and a doublet with energies ( s√
3+
wζ)vb, so that a distinctive mDP [22] characterised byDirac velocity vκ = [1 +O(u)] v2 [9] is always present at±κ somewhere in the spectrum [23]. This behaviour re-flects the generic properties of the symmetry group ofwave vector κ which has the two-dimensional irreduciblerepresentation E (corresponding to the mDP) and one-dimensional irreducible representations A1 and A2. Notethat each isolated mDP is surrounded by Van Hove sin-gularities in the density of states corresponding to sad-dle points in the lowest energy minibands. The weakerinversion-asymmetric terms, |ui| � |ui|, in the secondline of Eq. (2), open a minigap in both types of mDP

4
FIG. 2: Numerically calculated moire miniband (left), the corresponding density of states (centre), and Landau level spectrum(right) for electrons in the vicinity of graphene’s K point. Here we use the rhombic sBZ, so that the c3v symmetry of the moiresuperlattice spectrum is not obviously seen in the images.
discussed above.
Appearance of mDPs at the edge of the first minibandresults in a peculiar spectrum of electronic Landau levels,as shown on the r.h.s of Fig. 2. Each data point in thesespectra represents one of the Hofstadter minibands [24](with an indistinguishably small width) calculated for ra-tional values of magnetic flux, p
qΦ0 per moire supercell
following a method in Ref. [13]. Using these spectra onecan trace a clearly separated “zero-energy” Landau levelrelated to the isolated κ-point mDP in the valence bandin the bottom row of Fig. 2, in addition to the true zero-
energy Landau level at the conduction-valence band edge.The three isolated mDPs on the sBZ edge in the valenceband (top row of Fig. 2) also result in a “zero-energy”Landau level, though not as clearly separated and splitby the magnetic breakdown occurring at Φ ≈ 0.1Φ0.
To summarise, the inversion-symmetric moire pertur-bation will result in either the first sBZ separated fromthe rest of the spectrum by one or three mDPs, or, forweak perturbations, will result in overlapping first andhigher minibands. The experimental consequences of thiscan be expected in the optical spectroscopy of graphene

5
FIG. 3: The relation between the two densities at which theHall coefficient in graphene reverses sign upon its doping withholes. The results are shown for several realisations of moiresuperlattice in the parameter range corresponding to eitherthree isolated mDPs on the sBZ edge (squares) or one isolatedmDP at the sBZ corner (other symbols). The thresholds forisolation are indicated on the x-axis.
on a hexagonal substrate: the presence of mDPs and VanHove singularities in the density of states should lead toa modulation of the FIR and IR absorption spectra ofmonolayer graphene, which otherwise, has the flat ab-sorption coefficient of 2.3%.
Another experimental consequence of the moire mini-bands would consist in a non-monotonic variation of theHall coefficient upon doping the graphene flake with elec-trons or holes. For example, for those miniband spectrain Fig. 2, where there are isolated mDPs in the valenceband, the Hall coefficient would pass through a zero valueand change sign at two characteristic densities, n1 and n2.At the density n1, which corresponds to the valence bandfilled with holes up to the Van Hove singularity, the Hallcoefficient will change sign from positive to negative. Atthe higher density, n2, which corresponds to a completelyfilled first miniband, it would repeat the behaviour at theneutrality point changing sign from negative to positive.Such behaviour is expected to take place for the entire re-gions of the parametric space painted red, blue or green inFig. 1. The relation between these two carrier densitiesfor various types and strengths of moire perturbationsis shown in Fig. 3. For the clear part of the parametricspace for which we find substantial overlap between manymoire minibands such alternations in the sign of the Hallcoefficient would be obscured by the competing contribu-tions from the “electron-like” and “hole-like” branches inthe spectrum.
The authors thank F. Guinea, A. MacDonald,E. J. Mele and P. San-Jose for useful discussions duringthe 2012 KITP programme The Physics of Graphene,where this study was started. We acknowledge financialsupport from DTC NOWNANO, ERC Advanced GrantGraphene and Beyond, EU STREP ConceptGraphene,Royal Society Wolfson Research Merit Award and
EPSRC Science and Innovation Award.
Appendix 1: Moire superlattice symmetry
The point group symmetry of graphene on an incom-mensurate substrate is given by the intersection of thepoint group of graphene, c6v, with that of its substrate.For a perfectly aligned (θ = 0) inversion-symmetric sub-strate, with either a single (dominant) atom per unitcell or two identical atoms arranged in a honeycomblattice, the point group symmetries of the substrateand graphene coincide. The corresponding Hamiltonian,Eq. (2), with moire harmonics orientated as per Fig. 1(a), must necessarily commute with the operators corre-sponding to the elements of c6v: c6 , sx and sy whichdescribe 2π/6 rotations and reflections that either ex-change or preserve the graphene sublattices. The opera-tors for c6 and sy involve the valley exchanging matricesτ1,2 resulting in that the symmetry of the Hamiltonianrestricted to the K valley, as well as the K valley band-structure, is reduced to c3v = {id, c3, sx}, where c3 = c26has no intervalley structure. Each of the ui terms are oddunder c6, while the u2 and u2 terms are odd under sy, sothat these terms are forbidden for the perfectly alignedinversion-symmetric system described above. The pointgroup of substrates with the honeycomb lattice and twonon-equivalent atoms per unit cell, such as hBN, onlypossesses the c3 and sy symmetries which allow inversion-asymmetric parameters ui=0,1,3 to take a finite value.
For a finite misalignment angle, the reflection symme-tries of graphene and the substrate do not coincide, andthe moire harmonics become misaligned, by an angle φ,from those in Fig. 1 (a). However, the moire harmonicsmay be brought back into alignment using the transfor-
mation H(r)→ eiσ3φ2 H(Rφr)e−iσ3
φ2 , and the u2 and u2
terms, which are no longer forbidden, may be gaugedaway. This procedure restores the reflection symmetriesto the Hamiltonian, despite their absence in the geometryof the moire pattern for finite misalignment angle.
The symmetries described above can be used to gain adeeper understanding of the mDPs discussed in the maintext. The K valley plane wave states from the threeequivalent sBZ corners, ζκn=0,1,2 = ζR2πn/3κ, which
form the basis for Hζκ, Eq. (5), transform into each otheron application of symmetry operators of c3v. In the samebasis, the symmetry operators acting on Hζκ take theform of matrices
Γζκ(c3) =
0 0 −1
−1 0 0
0 1 0
, Γζκ(sx) = sζ
1 0 0
0 0 1
0 1 0
. (6)
For the inversion-symmetric superlattice perturbation,the singlet eigenstate of Hζκ is given by vs =1√3
(1,−1,−1). The action of matrices from Eq. (6) on

6
this state show that it transforms according to the one-dimensional irreducible representations of c3v: either A1
for sζ = 1 or A2 for sζ = −1, indicating evenness or odd-ness under sx respectively. Similarly, the doublet states
of Hζκ, v+ = 1√3
(√2, 1√
2, 1√
2
)and v− = 1√
2(0, 1,−1)
transform as the two-dimensional irreducible representa-tion, E, and their degeneracy is therefore protected bythe c3v symmetry.
The three anisotropic mDPs can be understood usingthe compatibility relations in the group appropriate forthe sBZ edge, ch = {id, sx}. This group only supportsone-dimensional irreducible representations A1 and A2
with the doublet states reducing as E = A1 + A2. For agiven band, s = ±1, the split bands at κ and −κ belongto different irreducible representations of ch and thereforecannot be joined along the sBZ edge. Instead, if both ofthese bands are closer to zero energy than the doubletstates, they must each be joined to one of the doubletbands at the opposite sBZ corner. Thus, along the sBZedge, a crossing of the split bands is required resulting inthe mDPs illustrated in the valence band for the top rowof Fig. 2.
Appendix 2: Microscopic Models
A. Point charge lattice model
The point charge model analysed in this Appendixmimics the effect of the quadrupole electric moment ofthe atoms in the top layer of the substrate. In applicationto the graphene-hBN system, we neglect the potentials ofthe quadrupole moments of the boron atom, which haveonly σ-orbitals occupied by electrons, and replace nitro-gen sites by a point core charge +2|e| compensated by thespread out cloud of the π-electrons, which we replace bya homogeneous background charge density, giving −2|e|per hexagonal unit cell of the substrate. This model givesan example of an inversion-symmetric moire superlattice.The matrix elements of the resulting perturbation, takenbetween sublattice Bloch states i and j (i, j = A or B),acting on the low energy Dirac spinors of the grapheneK valley, are given by the long wavelength componentsof
Hij =−2e2
4πε0
∑RN
∫dz
L2Φ∗Ki(r, z)ΦKj(r, z)√(r −RN )2 + (z − d)2
=−2e2
4πε0a
∑g,g′,gN
I|K+g|,|K+g′|,|gN |ei(g′−g+gN )·rei(g·δi−g
′·δj). (7)
In Eq. (7) RN are positions of nitrogen sites and L2 isthe total area of the graphene sheet; ΦK,i(r, z) are Blochwavefunctions of graphene π-electrons exactly at the Kpoint. Then the Fourier transform has been used to writeδHij in terms of a sum over substrate reciprocal latticevectors, gN , and graphene reciprocal lattice vectors, gand g′. Nearest neighbour vectors, δi=A/B , are δA =(0, a) and δB = (0,−a), so that K ·δi = 0. The homoge-neous background charge has not been included in Eq. (7)since its only role is to exclude gN = 0 from the sum. Thelong wavelength terms in the first exponential of the sec-ond line of Eq. (7) determine bm = −(g′ − g+ gN ). Thedimensionless integral,
IQ,Q′,gN =32a3027a3
∫dqzdq
′z
ψ∗(Q, qz)ei(qz−q′z)·dψ(Q′, q′z)
g2N + (qz − q′z)2,
is written in terms of the Fourier transform of thehydrogen-like graphene Pz(r, z) orbitals with an effectiveBohr radius a0,
ψ(Q, qz) =π
a3/20
1
2π
∫drdze−i(Q·r+qzz)Pz(r, z)
=−64ia0qz
(1 + 4a20(Q2 + q2z))3.
The integral, IQ,Q′,gN , rapidly decays as a function ofthe magnitude all its arguments so that we limit the sum
in Eq. (7) to only several terms such that |K + g| =|K + g′| = |K|, with I = IK,K,g0 where g0 = 4π
3a(1+δ) .
For the graphene layer, a = 1.42 A and for thegraphene-hBN heterostructure δ = 0.018. The carbonPz orbitals may have a different effective Bohr radiuscompared to hydrogen. The range of values quoted
for v = 2e2
4πε0aI in Table I corresponds to the interval
0.27 A ≤ a0 ≤ 0.53 A, indicated by the black double-arrow in Fig. 4. Interlayer separation 3.22 A ≤ d ≤ 3.5 Ais taken from Ref. [25].
Both the dominance of the simplest moire harmonicsand the finite values for the off-diagonal terms u1 and u2stem from the three dimensional treatment of the sub-strate potential. The potential is strongest near the sub-strate and therefore a greater proportion of the integralIQ,Q′,gN comes from the region near the substrate, wherethe graphene Pz orbitals are broad and therefore haveboth rapidly decaying Fourier components and signifi-cant overlap with their neighbours. This contrasts withthe model employed in Ref. [9] which is based on a two-dimensional substrate potential resulting in u1 = u2 = 0.

7
FIG. 4: Solid lines show the dimensionless integral I, asa function of the effective Bohr radius of the graphene Pz
orbitals, for various choices of interlayer separation d. Todemonstrate convergence of the sum in Eq. (7), dashed linesshow I2K,K,g0 for the same values of d.
B. G-hBN hopping model
In Ref. [10], Kindermann et al. modelled a hBN sub-strate as a lattice of Pz orbitals onto which the grapheneelectrons can hop. This treatment, extended from amodel of twisted bilayer graphene [26], assumed equalvalues for the hopping integral to the boron and nitrogensites, with the difference between the two sublattices aris-
ing from their different on-site energies. Here we consideran inversion-symmetric version of the hopping model ofRef. [10], assuming that coupling between graphene andthe hBN layer is dominated by the hopping to only oneof the two sublattices (e.g. boron). Using k ·p theory,this coupling can be written as [10]
δH = Hint1
ε− V −mH†int,
Hint =γ
3
∑n=0,1,2
e−i
(R 2πn
3κ
)·r(ei
2πn3
e−i2πn3
). (8)
Neglecting a non-oscillatory term, which corresponds toa trivial constant energy shift, Eq. (8) as applied tographene electrons in valley K, leads to the moire Hamil-tonian, Eq. (2), with
{ui=0,...3} =γ2/(vb)
9(m+ V )
{1
2,−δ√δ2+θ2
,θ√
δ2+θ2,−√
3
2
}.
The parameters of the superlattice perturbation givenin Table I of the main text, correspond to γ = 0.3 eV,V = 0.8 eV and m = 2.3 eV, in accordance with Ref. [10].For the perfectly aligned system, we always find u2 =0, which is a consequence of the reflection symmetriespresent in the perfectly aligned substrate-graphene sys-tem (see Appendix 1).
[1] C. R. Dean, A. F. Young, I. Meric, C. Lee, L. Wang,S. Sorgenfrei, K. Watanabe, T. Taniguchi, P. Kim,K. L. Shepard, and J. Hone, Nature Nanotech. 5, 722(2010).
[2] J. Xue, J. Sanchez-Yamagishi, D. Bulmash, P. Jacquod,A. Deshpande, K. Watanabe, T. Taniguchi, P. Jarillo-Herrero, and B. J. LeRoy, Nature Mater. 10, 282 (2011).
[3] R. Decker, Y. Wang, V. W. Brar, W. Regan, H.-Z. Tsai,Q. Wu, W. Gannett, A. Zettl, and M. F. Crommie, NanoLett. 11, 2291 (2011).
[4] A. S. Mayorov, R. V. Gorbachev, S. V. Morozov,L. Britnell, R. Jalil, L. A. Ponomarenko, P. Blake,K. S. Novoselov, K. Watanabe, T. Taniguchi, andA. K. Geim, Nano Lett. 11, 2396 (2011).
[5] E. Kim, T. Yu, E. S. Song, B. Yu, Appl. Phys. Lett. 98,262103 (2011).
[6] H. Wang, T. Taychatanapat, A. Hsu, K. Watanabe,T. Taniguchi, P. Jarillo-Herrero, and T. Palacios, IEEEElectron Device Lett. 32, 1209 (2011).
[7] M. S. Bresnehan, M. J. Hollander, M. Wetherington,M. LaBella, K. A. Thurnbull, R. Cavalero, D. W. Snyder,and J. A. Robinson, ACS Nano 6, 5234 (2012).
[8] M. Yankowitz, J. Xue, D. Cormode, J. D. Sanchez-Yamagishi, K. Watanabe, T. Taniguchi, P. Jarillo-Herrero, P. Jacquod, and B. J. LeRoy, Nature Phys. 8,382 (2012).
[9] C. Ortix, L. Yang, and J. van den Brink, Phys. Rev. B86, 081405 (2012).
[10] M. Kindermann, B. Uchoa, D. L. Miller, Phys. Rev. B86, 115415 (2012).
[11] J. M. B. Lopes dos Santos, N. M. R. Peres, andA. H. Castro Neto, Phys. Rev. Lett. 99, 256802 (2007).
[12] R. Bistritzer and A. H. MacDonald, Phys. Rev. B 81245412 (2010).
[13] R. Bistritzer and A. H. MacDonald, Phys. Rev. B 84035440 (2011).
[14] J. M. B. Lopes dos Santos, N. M. R. Peres, and A. H. Cas-tro Neto, Phys. Rev. B 86, 155449 (2012).
[15] S. V. Iordanskii and A. Koshelev, JETP Lett. 41, 574(1985).
[16] M. S. Foster and A. W. W. Ludwig, Phys. Rev. B 73,155104 (2006).
[17] A. F. Morpurgo and F. Guinea, Phys. Rev. Lett. 97,196804 (2006).
[18] J. C. Slonczewski and P. R. Weiss, Phys. Rev. 109, 272(1958).
[19] I. L. Aleiner and K. B. Efetov, Phys. Rev. Lett. 97,236801 (2006).
[20] The Hamiltonian in the vicinity of other two inequivalent
points on the sBZ edge, µ′ = R2π/3µ, µ′′ = R4π/3µ, canbe obtained using Hµ+q = Hµ′+R2π/3q
= Hµ′′+R4π/3q.
[21] C.-H. Park, L. Yang, Y.-W. Son, M. L. Cohen, andS. G. Louie, Phys. Rev. Lett. 101, 126804 (2008).
[22] F. Guinea and T. Low, Phil. Trans. R. Soc. A 368, 5391(2010).
[23] Note that the spectra derived from Hζ(κ+q) obey the

8
three-fold rotational symmetry.[24] D. R. Hofstadter, Phys. Rev. B 14, 2239 (1976).[25] G. Giovannetti, P. A. Khomyakov, G. Brocks, P. J. Kelly,
and J. van den Brink, Phys. Rev. B 76, 073103 (2007).
[26] M. Kindermann and P. N. First, Phys. Rev. B 83, 045425(2011).