Embed Size (px)
DESCRIPTION
A new report shows federal parties have committed "pocket change" to Canadians under 45 compared to what they're willing to invest in seniors.
Citation preview
By the NumBers: A generational guide to voting in the 2015 federal election
Dr. Paul Kershaw UBC School of Population & Public Health, HELP
Founder, Generation Squeeze

Acknowledgement The author would like to acknowledge the insight of Bob Parker who con-tributed to the analysis of education spending in the party platforms, as well as the expertise of Kathryn Harrison who provided the climate change policy analysis. Andrea Long provided invaluable analytical and editing support for the entire manuscript. Ada Leung and Jeremy Alexander did wonderful work, as always, designing the info graphics and formatting the report. The study could not have been produced in such a timely way without their contribu-tions and flexibility.
Normally, all Generation Squeeze analyses of budget documents are reviewed by a Certified Public Accountant (CPA). Given that some parties did not re-lease their fully costed platforms until nine days left in the campaign, this re-view was not possible if our findings were to be shared before voting day. Dr. Kershaw is responsible for any resulting errors or omissions.
Please direct all correspondence about the article to Dr. Paul Kershaw at: [email protected]
© Copyright Generation Squeeze 2015.
www.gensqueeze.ca
Suit up, Spread out, Squeeze back.
Generation Squeeze is a national campaign to build A Canada that Works for
All Generations.
The campaign is co-hosted by the Association for Generational Equity (AGE)
and the Human Early Learning Partnership in the University of BC School of
Population and Public Health, Vancouver, BC.
BY THE NUMBERS: A generational guide to voting in the 2015 federal election 3
By the NumBers: a generational guide to voting in the 2015 federal election.
Political parties do not report by age the implications of their campaign promises – not even in the fully costed
platforms that the big three parties published last week.
This lack of age-specific information can make it difficult for young and old alike to understand what the
dizzying array of daily promises made on the campaign trail mean for each generation. It can make it hard to
assess which parties are looking out for the aging parents and grandparents we love, or addressing the needs
of the kids and grandchildren for whom we want to leave proud legacies.
The latest Generation Squeeze study fixes this problem. It is the first ever comprehensive comparison of fully
costed platforms that includes a careful analysis of the age implications of party promises. This study focuses
on revenue collection along with the big ticket social policy issues that govern the daily lives of Canadians, and
that represent the large majority of federal spending: 1
1. Retirement income
2. Medical care
3. Employment & Labour
4. Families with children
5. Education
6. Housing
7. Infrastructure and economic investment
8. Climate change
The results show a significant gap in new spending on seniors compared to younger Canadians. For
every new dollar the Conservatives, NDP, Liberals and Greens will invest in a retiree, investments for each
citizen under age 45 total only:
• 18 cents from the Conservatives
• 27 cents from the NDP
• 28 cents from Liberals
• 34 cents from the Greens2
These results underscore that all four national parties campaign on platforms that will at the very least preserve
the amount spent per senior at the same level it is today after adjusting for inflation and the addition of another
million seniors by 2019/20. From a generational standpoint, this is the top priority in all four platforms.
1 For the sake of brevity, and due to time constraints at the end of the election campaign, the study does not analyze party promises about small programs related to social development or poverty reduction. It omits larger categories of spending related to veterans, the military, policing, debt repayment, etc. The study also does not focus on the nearly $13 billion annual increase to Canada and Quebec Public Pension spending that is projected. C/QPP funds are not paid from general revenue, which reflects that this spending has been largely prepaid by the aging population through earlier contributions.2 It should be noted that there are weaknesses in the Green party calculation of its budget that make the party’s account of its spending promises less reliable than the other parties.

BY THE NUMBERS: A generational guide to voting in the 2015 federal election 4
While the four parties prioritize investments in retirees, study results also show that there is substantial
variation in the urgency with which the parties commit to adapt policy for Canadians in their 20s, 30s, and 40s,
along with the children they rear. Generation Squeeze research shows that urgent adaptation is now required
because this demographic is squeezed by lower incomes, higher costs, new time pressures and a deteriorating
environment compared to a generation ago (Kershaw 2015b).
It is important to make clear that Generation Squeeze does not tell Canadians for which party to cast their vote
– but we do want more people to show up at the ballot box well informed. The evidence-based, impartial,
trustworthy information in this study will help to inform people’s evaluation of each party’s positions. The
study illuminates issues on which the Conservative (2015), NDP (2015), Liberal (2015) and Green (2015) parties
agree, and also identifies where and why they disagree. Importantly, all observations are based on the numbers
reported in party platforms and DO NOT reflect partisan preferences. If parties don’t like the comparisons,
they can and should change their policy and financial commitments in future platforms.
This study is organized into two parts. The first part summarizes findings based on spending on retirement,
health, employment, infrastructure, families, education and housing proposed by the four parties in the fiscal
year 2019/20. This year is generally used as a reference to ensure each party gets the benefit of the entire
mandate to phase in their annual spending commitments for new initiatives that may take time to implement.
The exception is for infrastructure and economic investment spending. A central 2015 election theme is
the degree to which each party believes urgency is required to stimulate growth and job creation
through public investment. Focusing only on infrastructure and economic investments in year four of
the mandate would disadvantage parties committed to phasing in spending more quickly. Accordingly, we
calculate and compare infrastructure spending for the year in which each party proposes the most spending
between 2015/16 and 2019/20.
Part one has five short sections. The first shows that the parties converge in their efforts to protect per person
spending on Canadians age 65+ as the population of seniors grows over the next four years. The second
documents how the parties diverge more in terms of their investments for younger generations. Section three
analyzes how revenue collection drives the resulting age distribution of spending in each of the four party
platforms. Section four alerts readers to any resulting deficits in the party platforms, and comments on the
prudence underpinning the revenue assumptions that guide each party. The final section of part one considers
what impact inflation, population growth and the aging of the population means for per capita spending.
Part two includes supporting material that examines in more detail the budget promises made in each party
platform for the eight policy areas identified above. We generally report on the platforms in the order that
reflects the number of seats that each party held in the House of Commons before the writ was dropped: i.e.
Conservatives first, followed by the NDP, Liberals and then the Greens.
Our analysis of the four party platforms considers how any new promises diverge from the funding levels and
commitments contained in the 2015 Government of Canada budget. We measure change relative to fiscal year
2014/15 – the last full budget year before the election3. To do so, this study follows the same methodology
3 The federal 2015 budget doesn’t include sufficient detail for some education and housing spending for the years 2014/15 through to 2019/20. To compensate, we rely on figures from the 2015 estimates from Employment and Social Development Canada (Government of Canada 2015b). These include a narrower range of budget estimates: 2015-2017. As a result, this study underestimates slightly the increase in funding for these areas. However, the impact on the analysis is modest, and does not affect the overall trends.
BY THE NUMBERS: A generational guide to voting in the 2015 federal election 5
reported by Kershaw and Anderson (2015) in their examination of the age distribution of federal spending in
the most recent federal budget4.
Kershaw and Anderson (2015) show that the Government of Canada spends $280.5 billion on social issues
in 2015. Spending on retirement income security ($142 billion) is by far the largest category of federal
expenditure, followed by medical care ($43 billion). The two largest components of federal social spending
disproportionately benefit Canadians age 65+. By comparison, the categories of federal social spending
on which younger generations disproportionately rely account for small fractions of the federal budget –
employment & labour ($25 billion), families ($24 billion), education ($10 billion).
The result is a large age gap in federal social spending. Each year, the Government of Canada spends $20,868
on average for each the 5.8 million Canadians age 65+, compared to $7,185 for each of the 10.1 million
Canadians age 45 to 64, and $4,349 for each of the 20.1 million people under age 45 (Kershaw and Anderson
2015). By analyzing the social policy funding commitments of all four national parties, we estimate in this
study the degree to which the four parties plan to retain or alter this age distribution of federal spending by
the end of the next government mandate – in year 2019/20.
PArt I - the BIG PICture: Comparing parties spending and revenue promises
The Four Parties Converge in their Spending on Retirees
There are important similarities between the four parties. Most notably, they all commit to boost annual
spending on the population of Canadians age 65+ by more per person than any other age group. Spending
on seniors will increase by:
• $18.2 billion under a Conservative government
• $20.2 billion under an NDP government;
• $20.3 billion under a Liberal government; and
• $19.9 billion under a Green government5.
In all four party platforms, approximately $13 billion of the new spending on Canadians age 65+ will go to
support incomes in retirement (see Table 1). The remainder consists largely of medical care spending. We use
the most recent per capita health care spending estimates from the Canadian Institute for Health Information
(2014) to project that 49 per cent of medical care spending in 2019 will go to the population age 65+.
In 2019, there will be approximately 6,747,110 Canadians age 65+, representing 18 per cent of the population6.
To calculate the amount each party would invest per senior, we divide the total amount of proposed new
spending by the total number of people age 65+.
4 We draw on per capita age allocations for each line item of the federal budget that Kershaw and Anderson calculate in the light of Statistics Canada (2013) longitudinal administrative data, and prorate these to reflect the ongoing growth and aging of the population, as well as inflation. The one exception is infrastructure spending, which Kershaw and Anderson did not examine. This paper assumes infrastructure spending benefits all citizens equally, and apportions the total infrastructure budget in each platform on a per capita basis. 5 These numbers are not adjusted for inflation because the party platform and Government of Canada budget forecasts do not make this adjustment. The 2015 budget does provide Consumer Price Index estimates of inflation for each of the next four years. We rely on these estimates in other parts of the study when examining what the party platforms mean for per capita spending patterns as the population grows and ages.6 Statistics Canada (2014) estimated the population at 35.5 million as of 2014 with almost 20 million people under the age of 45; 10 million people 45 to 64; and 5.6 million people age 65+. We estimate the population will grow 1.1 per cent larger each year, which is the population increase in 2014 and the average annual population age increase over the last 30 years. We prorate the age distributions accordingly in keeping with the rate of change reported for each age cohort in the previous year.
BY THE NUMBERS: A generational guide to voting in the 2015 federal election 6
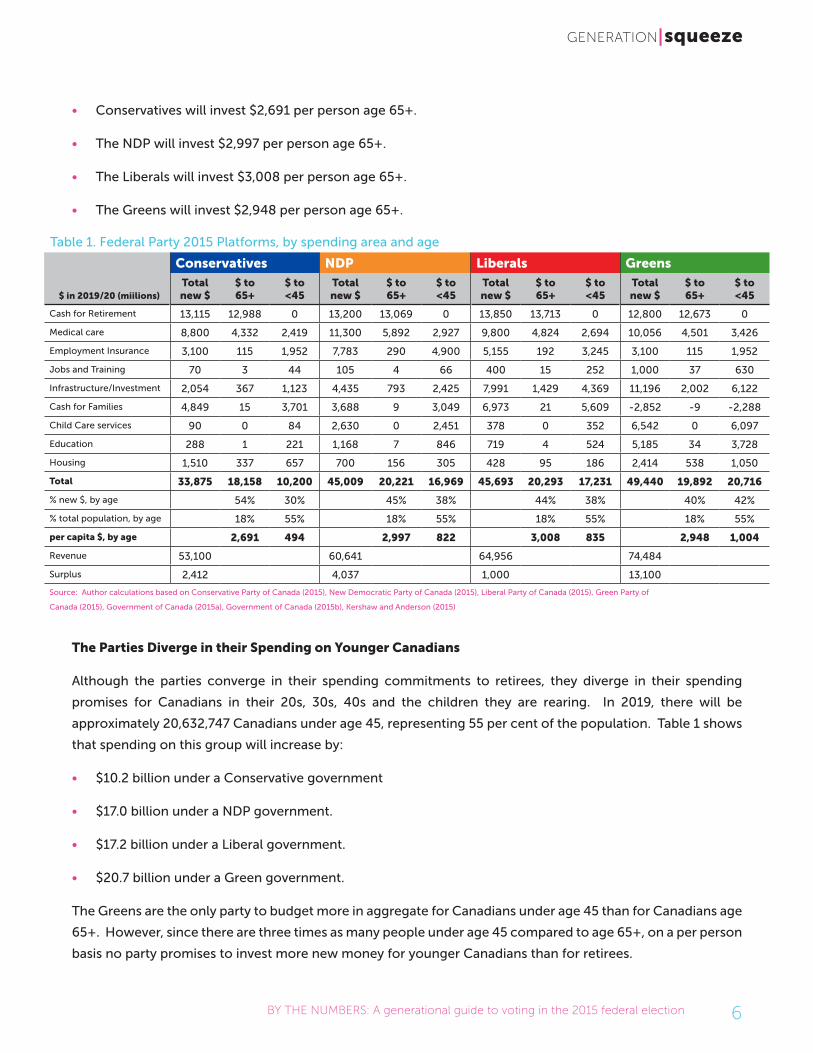
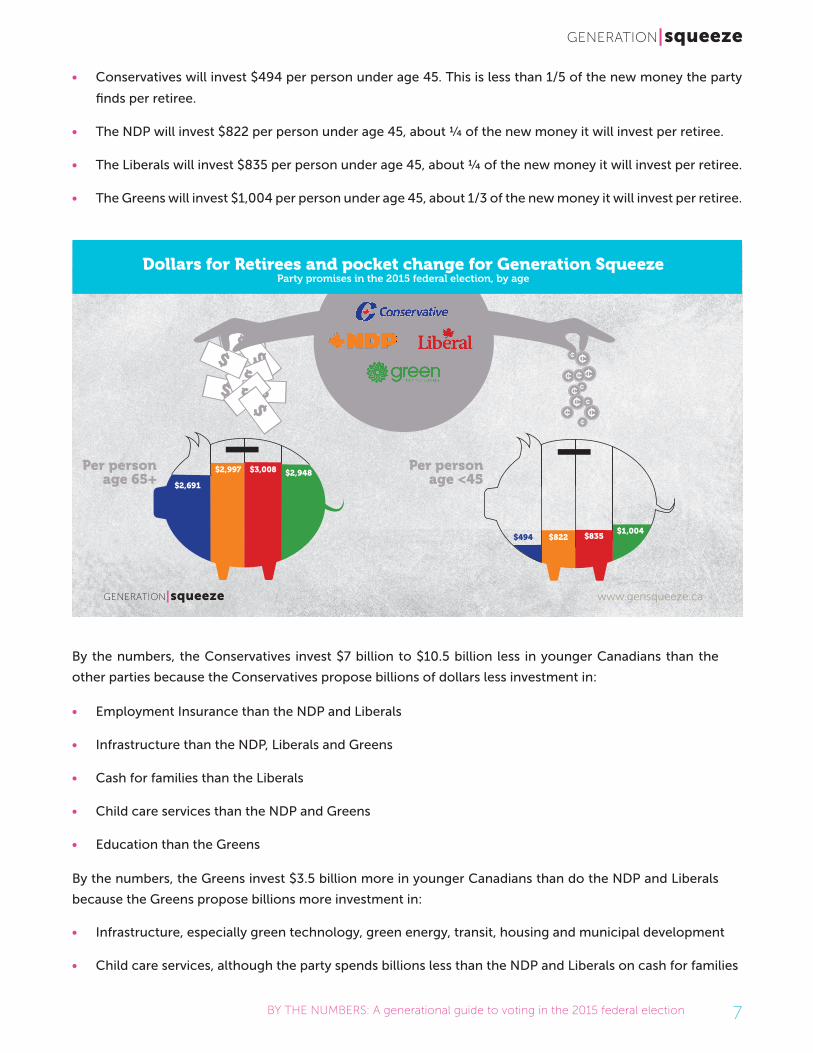
• Conservatives will invest $2,691 per person age 65+.
• The NDP will invest $2,997 per person age 65+.
• The Liberals will invest $3,008 per person age 65+.
• The Greens will invest $2,948 per person age 65+.
The Parties Diverge in their Spending on Younger Canadians
Although the parties converge in their spending commitments to retirees, they diverge in their spending
promises for Canadians in their 20s, 30s, 40s and the children they are rearing. In 2019, there will be
approximately 20,632,747 Canadians under age 45, representing 55 per cent of the population. Table 1 shows
that spending on this group will increase by:
• $10.2 billion under a Conservative government
• $17.0 billion under a NDP government.
• $17.2 billion under a Liberal government.
• $20.7 billion under a Green government.
The Greens are the only party to budget more in aggregate for Canadians under age 45 than for Canadians age
65+. However, since there are three times as many people under age 45 compared to age 65+, on a per person
basis no party promises to invest more new money for younger Canadians than for retirees.
Table 1. Federal Party 2015 Platforms, by spending area and age
Conservatives NDP Liberals Greens
$ in 2019/20 (miilions)Total new $
$ to 65+
$ to <45
Total new $
$ to 65+
$ to <45
Total new $
$ to 65+
$ to <45
Total new $
$ to 65+
$ to <45
Cash for Retirement 13,115 12,988 0 13,200 13,069 0 13,850 13,713 0 12,800 12,673 0
Medical care 8,800 4,332 2,419 11,300 5,892 2,927 9,800 4,824 2,694 10,056 4,501 3,426
Employment Insurance 3,100 115 1,952 7,783 290 4,900 5,155 192 3,245 3,100 115 1,952
Jobs and Training 70 3 44 105 4 66 400 15 252 1,000 37 630
Infrastructure/Investment 2,054 367 1,123 4,435 793 2,425 7,991 1,429 4,369 11,196 2,002 6,122
Cash for Families 4,849 15 3,701 3,688 9 3,049 6,973 21 5,609 -2,852 -9 -2,288
Child Care services 90 0 84 2,630 0 2,451 378 0 352 6,542 0 6,097
Education 288 1 221 1,168 7 846 719 4 524 5,185 34 3,728
Housing 1,510 337 657 700 156 305 428 95 186 2,414 538 1,050
Total 33,875 18,158 10,200 45,009 20,221 16,969 45,693 20,293 17,231 49,440 19,892 20,716
% new $, by age 54% 30% 45% 38% 44% 38% 40% 42%
% total population, by age 18% 55% 18% 55% 18% 55% 18% 55%
per capita $, by age 2,691 494 2,997 822 3,008 835 2,948 1,004
Revenue 53,100 60,641 64,956 74,484
Surplus 2,412 4,037 1,000 13,100
Source: Author calculations based on Conservative Party of Canada (2015), New Democratic Party of Canada (2015), Liberal Party of Canada (2015), Green Party of
Canada (2015), Government of Canada (2015a), Government of Canada (2015b), Kershaw and Anderson (2015)
BY THE NUMBERS: A generational guide to voting in the 2015 federal election 7
• Conservatives will invest $494 per person under age 45. This is less than 1/5 of the new money the party
finds per retiree.
• The NDP will invest $822 per person under age 45, about ¼ of the new money it will invest per retiree.
• The Liberals will invest $835 per person under age 45, about ¼ of the new money it will invest per retiree.
• The Greens will invest $1,004 per person under age 45, about 1/3 of the new money it will invest per retiree.
By the numbers, the Conservatives invest $7 billion to $10.5 billion less in younger Canadians than the
other parties because the Conservatives propose billions of dollars less investment in:
• Employment Insurance than the NDP and Liberals
• Infrastructure than the NDP, Liberals and Greens
• Cash for families than the Liberals
• Child care services than the NDP and Greens
• Education than the Greens
By the numbers, the Greens invest $3.5 billion more in younger Canadians than do the NDP and Liberals
because the Greens propose billions more investment in:
• Infrastructure, especially green technology, green energy, transit, housing and municipal development
• Child care services, although the party spends billions less than the NDP and Liberals on cash for families
www.gensqueeze.ca
Per personage 65+
Per personage <45$2,691
$2,997 $3,008 $2,948
$494 $822 $835$1,004
Dollars for Retirees and pocket change for Generation SqueezeParty promises in the 2015 federal election, by age
BY THE NUMBERS: A generational guide to voting in the 2015 federal election 8
• Postsecondary education
Party commitments to raising revenue shape spending on younger generations
By their own platform numbers (Conservative Party of Canada 2015, p. 156-159;Government of Canada 2015a,
Table 5.2.5), the Conservatives plan to collect less revenue than the NDP, Liberals or Greens in 2019/20.
• $7.5 billion (14 per cent) less revenue than the NDP;
• $11.9 billion (22 per cent) less revenue than the Liberals; and
• $21.4 billion (40 per cent) less revenue than the Greens (although the Green platform is based on outdated,
more optimistic financial projections than the Government of Canada’s last budget, so likely overstates the
revenue that will be collected by at least $5 billion).
Given that the Conservatives plan to collect less revenue, they also propose less total new spending on
retirement, health, employment, infrastructure, families, education and housing. New spending on these
areas is between 25 per cent and 31 per cent lower than the other parties (see Table 1).
However, Conservatives do not spread this lower level of new spending evenly across age groups. An even
allocation would have the Conservatives spend between 25 and 31 per cent less both on retirees and younger
Canadians. In actual fact, the Conservatives will spend:
• 9 to 11 per cent less on retirees than the other parties; and
• 40 to 51 per cent less on Canadians under age 45 than the other parties.
This means that the Conservatives prioritize lower taxes and/or less investment primarily at the expense of
spending on younger Canadians.
Conservatives choose to operate with lower federal revenue levels than the other parties because their
platform prioritizes collecting billions of dollars less from:
• Corporate taxes than would the NDP and Greens
• Canadians who earn $200,000+/year than the Liberals
• Fossil fuel companies than the NDP, Liberals and Greens by retaining larger subsidies for these industries
The Greens will collect billions more in revenue than the NDP and Liberals from:
• Legalizing and taxing marijuana
• Pricing pollution
• Wealthy inheritances valued above $1 million
Surpluses/Deficits and Prudence
Governments may decide to spend more money in a fiscal year than they collect in revenue. Economic

BY THE NUMBERS: A generational guide to voting in the 2015 federal election 9
research often supports such decisions when the private sector economy is stalling.
The 2015 election is being fought in part over the question of how urgent is the need to stimulate growth
and job creation through program and infrastructure spending. The Greens would invest in green energy,
municipal infrastructure, housing and transit in the first year of a new government faster than any other party.
The Liberals follow the Greens. NDP and Conservatives propose to invest less in total for infrastructure (See
Table 1).
To facilitate a more rapid pace of investment, the Liberals (2015, p. 77) plan to run modest deficits in the first
three years of the next mandate. The Liberals are the only party reporting deficits in those years. Proposed
Liberal deficits will be smaller than the average deficits tabled by the Conservative government over the last
decade.
The Greens report they will not run deficits (2015). This reflects in part that they plan to raise billions in
additional revenue from the sources identified above. However, it also reflects that the Green platform is
based on the most optimistic economic projections of any party. It relies on revenue and spending projections
that are higher than what the Government of Canada published in its 2015 April budget.
This means that Green budget numbers are the least reliable. In their defense, they also project by far the
largest surpluses in each of the next four years – as much as $13 billion in 2019/20. Consequently, proposed
budget numbers can be inaccurate by a lot and still leave room for a Green government to balance its books.
However, readers should interpret the precise dollar values associated with Green budget promises with more
caution than the promises made by other parties.
The Liberal (2015, p. 77) and NDP (2015, p. 61-62) platforms are based on the most cautious assumptions about
economic growth. Their numbers build on analyses provided by the politically neutral Parliamentary Budget
Officer in July 2015 after Statistics Canada data revealed that Canada was in a minor recession for the first half
of the year. The Liberals and NDP use these estimates to minimize the chance that promised budget outcomes
do not materialize because the economy performs more poorly than expected.
The Conservative platform is based on assumptions made in the Government of Canada (2015a, Table 5.2.5)
budget that it presented in April of this year. It’s assumptions for revenue growth fall in between what the
Liberals and NDP use on one hand, and the Greens use on the other.
Inflation and Population Aging
The parties do not control for inflation in their platform promises so spending increases in 2019/20 are actually
somewhat smaller in real terms after adjusting for inflation. The Government of Canada (2015a, Table 2.2)
estimates inflation will be 0.9 per cent in 2015; 2.2 per cent in 2016; 2 per cent thereafter.
Coming into the federal election, the Conservative government spent $20,868 on average for each of the 5.8
million Canadians age 65+, compared to $7,185 for each of the 10.1 million Canadians age 45 to 64, and $4,349
for each of the 20.1 million people under age 45 (Kershaw and Anderson, 2015).
By 2019, the Canadian population is expected to grow by another 1.8 million people, and to become older on
average. There will be almost an extra million people age 65+. By contrast, there will be an extra 350,000

BY THE NUMBERS: A generational guide to voting in the 2015 federal election 10
people age 45 to 64, and an extra half million people under the age of 45.
What these statistics illustrate is that the segment of the Canadian population on which the federal government
spends the most money is also the segment that will grow the most between 2015 and 2019. This is important,
and why all four national parties promise platforms that will at the very least preserve the amount spent per
senior at the same level they are today after adjusting for inflation. It will cost minimally an extra $17.2 billion
in annual spending by 2019/20 to preserve the per person amount we currently allocate to each retiree as the
number of seniors increases by 1 million over the next four years7.
This $17.2 billion annual increase has not been prepaid by the growing group of seniors in the same way they
prepaid for much of the Canada and Quebec public pensions they will receive. As a result, it is important that
all parties and the federal government routinely break down how its revenue and spending decisions distribute
tax collection and investment by age group so that we can assess whether our country lives up to the goal
of working fairly for all generations while adjusting to the fiscal realities of an aging population. This goal
will require preserving the federal government’s fiscal capacity to invest in policy that eases the time, money,
service and environmental squeeze facing Canadians in their 20s, 30s, 40s and the children they represent
while Ottawa also adapts to the needs of an aging population.
To support this goal, Generation Squeeze called on all political parties to commit in their platforms to report
the age distribution of spending in future Government of Canada budget cycles.
In response, the NDP (2015, p. 60) committed to producing “an Intergenerational Report every four years,
which will detail demographic and economic changes to identify challenges Canada will face over the next 40
years and how this may influence decision-making today.”
The Liberal party (2015, p. 37) “will make Statistics Canada fully independent. We will work with Statistics
Canada and other stakeholders to provide a broader range of information, including detailed labour market
information, child development data, and statistics about our population.” While this platform commitment
does not speak directly to the Gen Squeeze call for reporting the age implications of government decisions, it
does hold open the possibility that Statistics Canada could assume responsibility for such reporting.
In reviewing documents for this study, we could not find material in Conservative or Green party platforms that
speaks to the need to report the age distribution of governments spending and revenue collection.
Generation Squeeze looks forward to working with all parties to strengthen government reporting about the
age implications of their policy priorities in the years ahead.
7 The extra $2,691 to $3,008 that each party invests per retiree does not mean the amount that each senior receives today will increase by that amount. The impact of the extra average amount is moderated substantially by the fact that there are a million more people in the age category where individuals receive on average many, many thousands of dollars in additional spending compared to before they turned age 65.
BY THE NUMBERS: A generational guide to voting in the 2015 federal election 11
PArt II. A themAtIC COmPArIsON OF the PLAtFOrms
Retirement Income
All four national parties support the $12.8 billion increase in Old Age Security (OAS) by 2019/20 that is allocated
in the Government of Canada (2015a, Table 5.2.6) budget. This is by far the largest single annual investment
any party will make over the next four years.
Presently, the OAS pays a maximum $570/month per person age 65+ provided you have lived in Canada for
at least 10 years after turning age 18. The monthly OAS benefit declines as annual income surpasses $72,000
a year.
OAS includes a Guaranteed Income Supplement (GIS) of up to $773/month if a senior’s annual income falls
below $17,280.
The $12.8 billion increase to OAS preserves current benefit levels for the additional 1 million seniors in 2019
after adjusting for inflation.
On top of the $12.8 billion increase on which all parties agree:
• Conservatives (2015, p. 156) will add $315 million for single and widowed seniors to provide an extra $300
annual benefit.
• The NDP (2015, p. 68) will add $400 million into the Guaranteed Income Supplement (GIS) to prevent
poverty among seniors. Currently, Statistics Canada data show that seniors report the lowest rates of low-
income of any age group in the country.
• Liberals (2015, p. 83) will outspend all parties on income support for retirees. Liberals will add $840 million
into the GIS to prevent poverty among seniors, and another $210 million to ensure that the real value of
OAS increases with inflation.
Finally, Opposition parties promise to reverse the Conservative plan to increase the age of eligibility for OAS
and GIS to age 67, up from age 65. The plan to increase the age of retirement will not influence anyone who
will retire over the next 4 years. In fact, it won’t affect anyone who retires before the year 2023, because the
policy does not target today’s retirees, nor those nearing retirement. It is a policy change that asks Generations
X, Millennials and those who follow to work two years more than they would under the current policy before
claiming the Old Age Security pension.
Since Canadians are living 7 to 10 years longer than when the Old Age Security system was first created,
Generation Squeeze concedes it is appropriate for governments to consider postponing the age at which we
claim OAS and GIS. Any support for this change is conditional on three things:
1. Governments and citizens alike acknowledge it is younger generations who are being asked to adapt
the length of their work lives in ways that are not expected from Canadians in their 50s and older.
2. After the year 2023, the disability benefits of the Canada Public Pension plan are protected and
strengthened so that Canadians under age 67 who are not able to work because of a disability are
eligible for income protection in the same way people are today.
BY THE NUMBERS: A generational guide to voting in the 2015 federal election 12
3. Anticipated savings from adjusting the age of retirement for OAS will be invested in younger Canadians
today – not reallocated to achieve savings in other parts of the federal budget.
Medical Care
Opposition parties mislead the electorate when they charge that the Conservative Party has cut spending for
medical care. In fact, the federal Conservatives increased the Canada Health Transfer (CHT) to provinces by
billions of dollars per year, and the Conservatives would continue to grow it by billions more after the election.
The 2015 federal budget (Table 5.2.6) adds $8.8 billion in additional annual spending to the CHT by 2019/20.
Indeed, spending on medical care will grow faster than every other social policy measure in the federal budget
except one – the Old Age Security system.
The charge that the Conservative Party has cut medical care spending has been made because growing the
CHT by $8.8 billion annually means that the transfer would increase at a slower pace than in recent years8.
Over the last decade, federal transfers for health care grew six per cent each year – outpacing economic
growth. Now the Conservatives propose raising the CHT no less than 3 per cent per year, or as fast as the
economy grows – whichever is higher.
Why does this matter?
It may not yet be politically popular, but research encourages Canada to contain the growth of medical care
spending. Our country spends more public money per person on medical care than most countries. This
might be fine if we got better outcomes than most countries. But we don’t. We don’t get better access to
doctors, CT Scans or MRIs. We don’t get better outcomes or satisfaction. We do get better paid doctors by
comparison with other jurisdictions (OECD 2013).
While not getting big bang for our increasing medical care bucks, our federal and provincial governments have
been cutting income and sales taxes. Reducing taxes and raising spending on medical care leaves less left over
for other things that often make us healthier: for example, supports for families, education, housing, etc. (For
more information, see Table 4 in Kershaw (2015b)).
How do the other Parties compare on medical care?
The NDP (2015, p. 64) will grow medical care faster than any other national party, adding another $2.5 billion
on top of the $8.8 billion increase the Conservatives already propose. That means by 2019/20, the NDP will
increase spending on the Canada Health Transfer by $11.3 billion a year by the end of its first mandate.
To put this NDP proposed increase in context, the entire federal budget for education is presently just under
$10 billion a year.
The Liberals (2015, p. 85) will add $1 billion on top of what the Conservatives budget.
The Greens (2015) will add $1.26 billion more than the Conservatives by 2019/20.
What do the NDP, Greens & Liberals aim to buy with more medical spending?
Important things.
8 The Conservatives also changed the Canada Health Transfer to deliver funding to the provinces solely based on the number of people in the province, as opposed to accounting for the age distribution. Since health care spending increases with age, the Conservative change to the CHT is advantageous to provinces like Alberta and Saskatchewan which have young populations, and is disadvantageous to provinces like BC, Quebec and Atlantic Canada.

BY THE NUMBERS: A generational guide to voting in the 2015 federal election 13
For example, both the NDP and Liberals budget more for seniors’ care outside of hospitals. Such care is a
good idea because hospital care is particularly expensive. And seniors often don’t want to be in hospitals when
needing support with chronic conditions that come with aging. My 99 year old grandmother doesn’t.
The NDP also propose to phase in a universal approach to pharmaceutical insurance and bulk buying. (So
do the Greens and Liberals, although Greens only budget about 1/5th of what the NDP do; and the
Liberal budget is vague). Again, there is good research to support integrating the costs of pharmaceuticals
into our public health care system, in part because doing so will reduce the cost at which our governments
purchase medications.9
The additional Green party investment is more oriented toward prevention than treating illness. The Greens
propose $913 million to pay for dental care for 700,000 youths in low-income families.
Still, many countries already spend less on medical care per citizen than does Canada (OECD 2013),
while already integrating better approaches to caring for seniors, paying for medications and dental care.
So, it is important in this election for all four national parties to explain why Canada can’t achieve these goals
within the minimum $8.8 billion annual medical care spending increase on which all parties agree.
This explanation is important, because inefficiency in medical care drains other investment areas.
Consider the NDP platform. By growing the CHT faster than other parties, while not wanting to reverse many
recent federal income and sales tax cuts, the NDP have to make other trade-offs.
One way to interpret these trade-offs is to observe that the NDP will add over $11 billion to medical care
compared to just $2.5 billion to child care by 2019/20 (New Democratic Party of Canada 2015, p. 65). As a
result, the NDP doesn’t have enough money to make its important $15/day child care commitment come to
fruition in as timely a way as it otherwise might, because it will take $9 to $10 billion a year to make the child
care promise a reality.
This is a pity, because science confirms the value of investing in child care services, including for health
promotion.
Employment Insurance Spending & Training Investments
All four national parties support the $3.1 billion spending increase on Employment Insurance reported for
the year 2019/20 in the Government of Canada (2015a, Table 5.2.6) budget. This increase accommodates a
growing population and inflation.
On top of this increase on which all parties agree, the NDP and Liberals will allocate additional funds.
The NDP (2015, p. 72) propose a number of policy changes that would bring its yearly increase to $7.8 billion
– billions more than any other party. With this additional money, the NDP would make changes that include:
• More generous EI benefits for Canadians with uneven work hours by calculating their benefit based on
9 As governments contemplate how to integrate pharmaceutical insurance into our public health care system at a moment that the population is aging, it will be important to ensure that the resulting intergenerational costs and benefits of the pharmaceutical program are fair for all age groups.
BY THE NUMBERS: A generational guide to voting in the 2015 federal election 14
their best 12 weeks of pay
• Increase eligibility for EI by reducing the number of hours one must have worked in the last year to 360 –
down from the status quo which ranges from 420 to 700+ hours depending on where one lives and their
work circumstances.
• Support regional economies and workers in seasonal industries by providing a maximum of five extra
weeks of benefits in regions where unemployment is high and work is hard to come by.
• Reduce pressures on workers to move from their communities or take on lower paying jobs.
• Increase training funds made available by the provinces through labour market development agreements.
The Liberals (2015, p. 84) propose policy changes that would increase total EI spending by $5.2 billion in
2019/20. Their changes would:
• Reduce the waiting period for benefits. When a worker loses a job, s/he will have to be without income
for one week, not two.
• End the rule that requires new workers and those re-entering the workforce to accumulate more hours of
employment than others before qualifying for EI.
• Reduce pressures on workers to move from their communities or take on lower paying jobs.
• Increase training funds made available by the provinces through labour market development agreements.
• Encourage companies to hire young Canadians age 18 to 24 for permanent positions by offering a
12-month break on EI premiums.
Other Jobs & Training Investments
In addition to EI spending, the four parties also propose other, typically more modest, investments in direct job
training and apprentice programs.
The Conservatives (2015, p. 156) promise $60 million to enhance a tax credit that currently subsidizes 12,000
companies that employ apprentices; and another $10 million to help people starting out in the trades get work
experience.
The NDP (2015, p. 65-68) promise another $100 million to create job opportunities for young Canadians.
The money aims to create 40,000 jobs, co-op placements and internships for youth, while bringing in the
requirement that youth apprenticeships become part of all major federally owned infrastructure and public
works projects. The NDP also plan to renew and expand funding for the Aboriginal Skills and Employment
Training Strategy with funds allocated as part of education spending (considered below).
The Liberals (2015, p. 84) propose another $350 million to create 40,000 youth jobs each year for the next
three years, provide training for those who do not qualify for EI, and improve training facilities by building
trades training equipment. In addition, the Liberals will add $50 million to renew and expand funding for the
Aboriginal Skills and Employment Training Strategy.
BY THE NUMBERS: A generational guide to voting in the 2015 federal election 15
The Green (2015) party also wants to stimulate the creation of 40,000 jobs a year for youth age 18 to 25.
Greens devote the largest budget to this goal – $1 billion a year for local Community and Environment Service
Corps Youth teams.
Infrastructure and Economic Investment (excluding what is counted in housing and child care)
Infrastructure is not generally an area of investment for which Generation Squeeze has produced analyses in
the past. The concept of an infrastructural debt refers to the quality and state of repair of hospitals, schools,
roads, bridges, transit, energy infrastructure, etc. now compared to the past. It is an area where Generation
Squeeze aims to improve our research analyses in the years ahead.
In this study, we include an accounting of the new money each party proposes for infrastructure and other
economic investment, because doing so is an important indicator of their respective approaches to making it
easier for people to find good jobs. One part of an approach to investing in these areas involves using policy
like Employment Insurance, the National Child Benefit Supplement, and the Working Income Tax Benefit to
supplement incomes in low-paying or unstable work environments. Another part of the strategy involves
stimulating the economy to increase the demand for labour in high quality jobs. Infrastructure investments
can contribute to this goal.
The Government of Canada (2015a, Table 3.0) budget passed into legislation by the Conservative party in
2015 includes $1 billion in annual spending on major public transit projects in 2019/20 along with another
$276 million to build or renew federal infrastructure. To these budget investments, each party’s platform adds
additional funds:
• The Conservative (2015, p. 156-159) party adds another $778 million in economic stimulus investments.
These dollars cover an array of investments, including a $100 million automotive innovation fund, $50
million for rural broadband and $50 million for a Canadian partnership against cancer.
• The NDP (2015, p. 64-71) add another $3.16 billion in infrastructure investments that include $300 million
a year for transit, $1.5 billion annually for municipal infrastructure, and a one-time $500 million investment
to incentivize the construction of affordable rental accommodation.
• The Liberals (2015, p. 83-86) will invest in infrastructure more urgently and at a higher level than the NDP.
On top of the 2015 budget, Liberals will add $6.7 billion in annual infrastructure spending primarily for
transit, green technology and energy, seniors’ facilities, as well as culture and recreational facilities (in
addition to child care and housing investments discussed below).
• The Greens propose investing more urgently, and a greater total amount, in infrastructure compared to
the other three national parties. Greens will add $9.90 billion in infrastructure on top of the current federal
budget. This makes infrastructure the second largest budget commitment in the Green platform – second
to old age security. The Green (2015) budget includes:
• $1 billion annually for electrical grid upgrades to allow for distribution and collection of green energy;
• $1 billion annually in grants to support the commercialization of green technology;
BY THE NUMBERS: A generational guide to voting in the 2015 federal election 16
• $764 million for the national railway system; and
• $6.4 billion a year for the creation of “six municipal super funds for community brownfield reclamation,
water and waste treatment facilities, sports, cultural and recreation facilities, mass transit promotion,
cycling and pedestrian promotion, and community housing.”
Families with children
Families are squeezed for time, cash and services. This problem is front and centre in the federal election.
Generation Squeeze helped make this so, because international research shows Canada has particularly weak
family policy. Our work has contributed to all four parties committing $4 to $7 billion more in annual spending
on families (Government of Canada 2015a, Table. 4.1.3; Conservative Party of Canada 2015; New Democratic
Party of Canada 2015, p. 64-71; Liberal Party of Canada 2015, p. 83-86; Green Party of Canada 2015).
The Conservatives promise $4.9 billion.
The NDP promise $6.3 billion.
The Liberals promise $7.4 billion.
The Greens promise $3.7 billion.
This new money pales in comparison to the minimum $12.8 billion increase that all the parties are committing
to Old Age Security (OAS) (see Table 1 above). It is further diminished when we recognize the $4 to $7 billion
for families with children is spread over the majority of the population, whereas the OAS investment targets
the 18 per cent of the population that will be age 65+ in 2019/20.
Will the new money be spent wisely?
The answer depends on your perspective and values.
Families with at-home parents: If you are (or hope to be) a couple in which one parents stays home most of
the time with kids, then you may prefer the Conservative approach. Half of its new money is reserved for you
through income splitting from which just one third of Canadian families can benefit. This will deliver up to
$2,000 a year to qualifying families, with higher earners benefiting more.
Parental time at home and gender equality: The Conservative plan doesn’t include measures to encourage
dads to share responsibility for caregiving at home with moms. On this front, the NDP and Greens are stronger.
The NDP (2015, p. 72) are adding $500 million a year to add five weeks of parental leave benefits (primarily) for
dads.
The Greens endorse a Generation Squeeze recommendation that would stretch to six months the period
reserved for dads, along with six months for moms and six months to be shared how parents choose – totaling
18 months per household. However, Greens don’t say where they will get the funds to pay for this commitment.
The Liberals (2015, p. 84) will add $130 million to lengthen leave to 18 months per household, but don’t
BY THE NUMBERS: A generational guide to voting in the 2015 federal election 17
incentivize dads to share leave time.
The Conservative (2015, p. 156) party will also extend leave to 18 months. They only budget $2 million in new
money to make the extra leave time affordable, and don’t incentivize dads to share leave time.
Gen Squeeze estimates that a meaningful extension of parental leave to 18 months per household will cost
$10 billion.
Enough time in the labour market and gender equality: Canadians in their 20s, 30s and 40s earn thousands
less for full time-work, start with larger student debts and face higher housing prices (Kershaw 2015b).
These factors drive most Canadian households to have two earners even when they have younger
children, and result in most lone-parents working.
Other than in Quebec, child care services cost the equivalent of a second mortgage. Three of the four national
parties have talked about fixing this, which is important for household finances and women’s equality in the
workforce.
The Greens (2015) commit more money to child care services than any other party. They would do so
by reallocating $6.7 billion in existing spending, and adding another billion on top of this. Such money
would go a long way to bringing the cost of quality child care down to $10/day.
The NDP (2015, p. 65) would scrap income splitting and reallocate the funds to child care services. By
2019/20, the NDP would spend $2.5 billion more directly on child care services. This is more than the
Liberals, but (likely)10 less than the Greens.
There remains a large gap between the NDP investment and the $10 billion incremental cost of a national child
care system. A sizable portion of the gap could be closed by reallocating $2.4 billion that Ottawa spends on
the spousal and equivalent to spouse credits. The spousal credit is outdated, delivering tax relief to couples
where one person doesn’t work regardless of whether children are at home.
The Liberals (2015, p. 13) also promise a new National Early Learning and Child Care Framework, funded from
its social infrastructure budget. Assuming ¼ of this funding goes to child care services (with the rest going
to seniors, housing and culture/recreation), Liberals would allocate $300 million per year for this framework
in 2019/20. Since there is a big gap between $300 million and the $10 billion cost of a high quality child care
system, the Liberals will also need to explore options like reallocating the outdated spousal tax credit.
Save families a little extra over 18 years, or save them a lot before kids start school?
The Liberals and Conservatives promise relatively little money for child care services and parental leave
because they prioritize building on the historical way that Ottawa has supported families: delivering monthly
child tax benefits paid to families until their children reach 18 through the Canada Child Tax Benefit, National
Child Benefit Supplement and the Universal Child Care Benefit. These monthly cheques often add up to a
couple thousand dollars a year per child.
The Conservatives added $60/month to these cheques heading into the election. The Liberals doubled-
down on this approach, consolidating a bunch of existing tax credits and adding billions more to make Liberal
10 The Green platform is unclear about the timing of when it will reallocate the $6.7 billion.
BY THE NUMBERS: A generational guide to voting in the 2015 federal election 18
cheques $1,000 to $2,000 more generous annually than Conservative cheques for households earning less
than $150,000/year.
No one will object to receiving another $60 or so per month for children up to 18 years. But it’s worth
questioning whether the same money would be spent better over a shorter period of time to save families
tens of thousands of dollars in parental leave and child care costs before kids start school. This question is all
the more important, since the Canada Child Tax Benefit already provides most families with sizable monthly
cheques, and schools represent a major public investment in kids age 6 to 17. The major missing piece in our
family policy puzzle occurs for families with preschool age children.
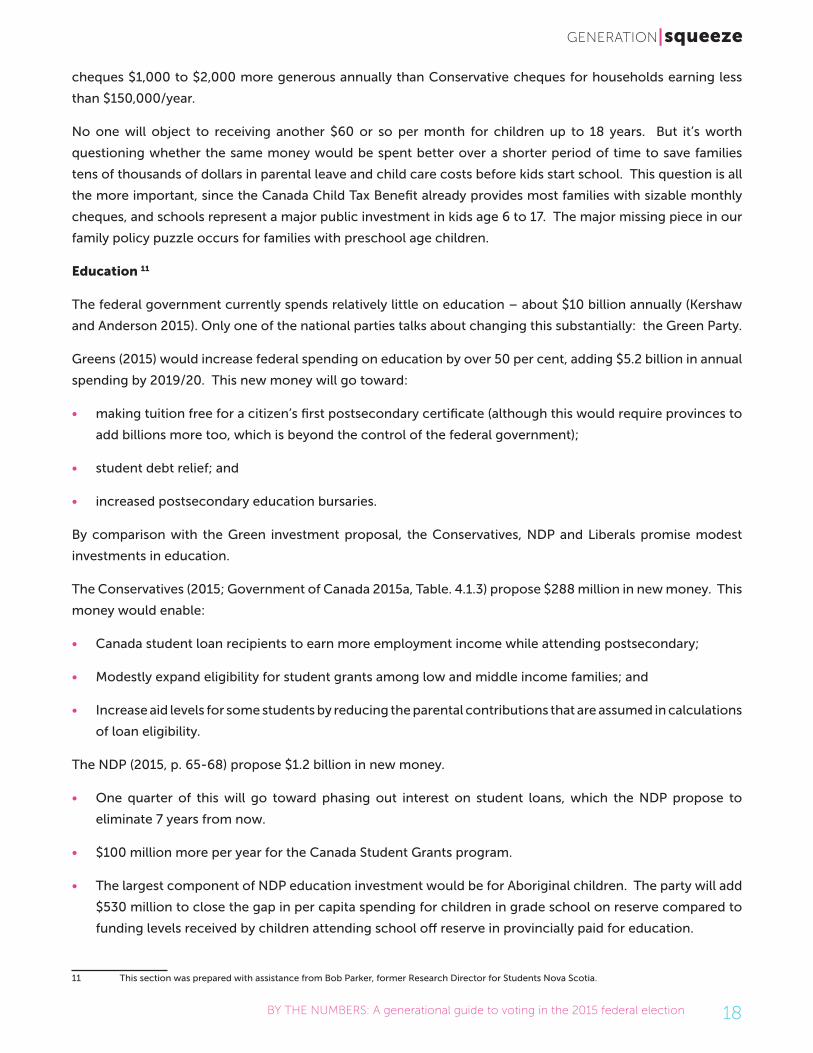
Education 11
The federal government currently spends relatively little on education – about $10 billion annually (Kershaw
and Anderson 2015). Only one of the national parties talks about changing this substantially: the Green Party.
Greens (2015) would increase federal spending on education by over 50 per cent, adding $5.2 billion in annual
spending by 2019/20. This new money will go toward:
• making tuition free for a citizen’s first postsecondary certificate (although this would require provinces to
add billions more too, which is beyond the control of the federal government);
• student debt relief; and
• increased postsecondary education bursaries.
By comparison with the Green investment proposal, the Conservatives, NDP and Liberals promise modest
investments in education.
The Conservatives (2015; Government of Canada 2015a, Table. 4.1.3) propose $288 million in new money. This
money would enable:
• Canada student loan recipients to earn more employment income while attending postsecondary;
• Modestly expand eligibility for student grants among low and middle income families; and
• Increase aid levels for some students by reducing the parental contributions that are assumed in calculations
of loan eligibility.
The NDP (2015, p. 65-68) propose $1.2 billion in new money.
• One quarter of this will go toward phasing out interest on student loans, which the NDP propose to
eliminate 7 years from now.
• $100 million more per year for the Canada Student Grants program.
• The largest component of NDP education investment would be for Aboriginal children. The party will add
$530 million to close the gap in per capita spending for children in grade school on reserve compared to
funding levels received by children attending school off reserve in provincially paid for education.
11 This section was prepared with assistance from Bob Parker, former Research Director for Students Nova Scotia.

BY THE NUMBERS: A generational guide to voting in the 2015 federal election 19
The Liberals (2015, p. 78-87) will add $719 million in education spending by 2019/20.
• The featured education commitment in the Liberal platform is adding $850 million to the Canada Student
Grant program. The Liberals pay for this increase, however, by eliminating $925 million in postsecondary
and textbook tax credits. It’s an example of spending smarter, not more, which Gen Squeeze encourages
across policy areas, especially health care (see above). Research has shown that it would be more
advantageous for students to receive financial support in advance of paying the education expenses, rather
than make a claim for a tax-delivered subsidy after they incurred the expenses. Still, this policy change will
not result in any net new investment.
• The most significant component of new education spending in the Liberal platform is for Aboriginal
education. Liberals will add $300 million on top of the current federal budget to close the gap in per capita
spending for Indigenous children in grade school on reserve compared to per pupil funding provided by
provincial governments. Liberals also add $50 million in annual spending on postsecondary grants for
Aboriginal students.
• Finally, the Liberals propose an additional $80 million annually in education benefits for new veterans.
Housing
Housing is a generational tipping point (Kershaw 2015b). High prices drive wealth accumulation for many
of our parents and grandparents, while they crush dreams of home ownership for younger Canadians, or
weigh us down with heavy debts or high rental costs. Here’s what the parties would do:
Conservatives (2015, p. 156) will add $1.5 billion annually:
• $30 million/year to help people get into the housing market; and
• $1.48 billion/year to support owners renovate their homes.
The Conservative Party would increase from $25k to $35k the amount of tax-free money that first time home
buyers can withdraw from their own RRSP savings to put towards their first home (or the home of a relative
with a disability). This will benefit people who already had more than $25k saved in their RRSPs and were
willing to roll those retirement savings into their first home. Since younger Canadians earn thousands less for
full-time work than in the past, have larger student debts and pay more expensive rents, many wouldn’t have
that kind of money saved in their RRSPs and so wouldn’t be eligible.
The Home renovation credit is a much larger investment in total. Still, it will only save households up to $750
in renovation costs. Benefiting from these savings assumes that younger Canadians can cobble together the
down payment and large monthly installments required to cover mortgages on housing that costs hundreds
of thousands more today than in 1976.
The NDP (2015, p. 66) will invest $700 million/year in housing:
• $650 million to restore federal funding for housing back to 1996 levels (before subsequent federal
governments allowed Ottawa’s contributions to social housing to slowly diminish). This would include
BY THE NUMBERS: A generational guide to voting in the 2015 federal election 20
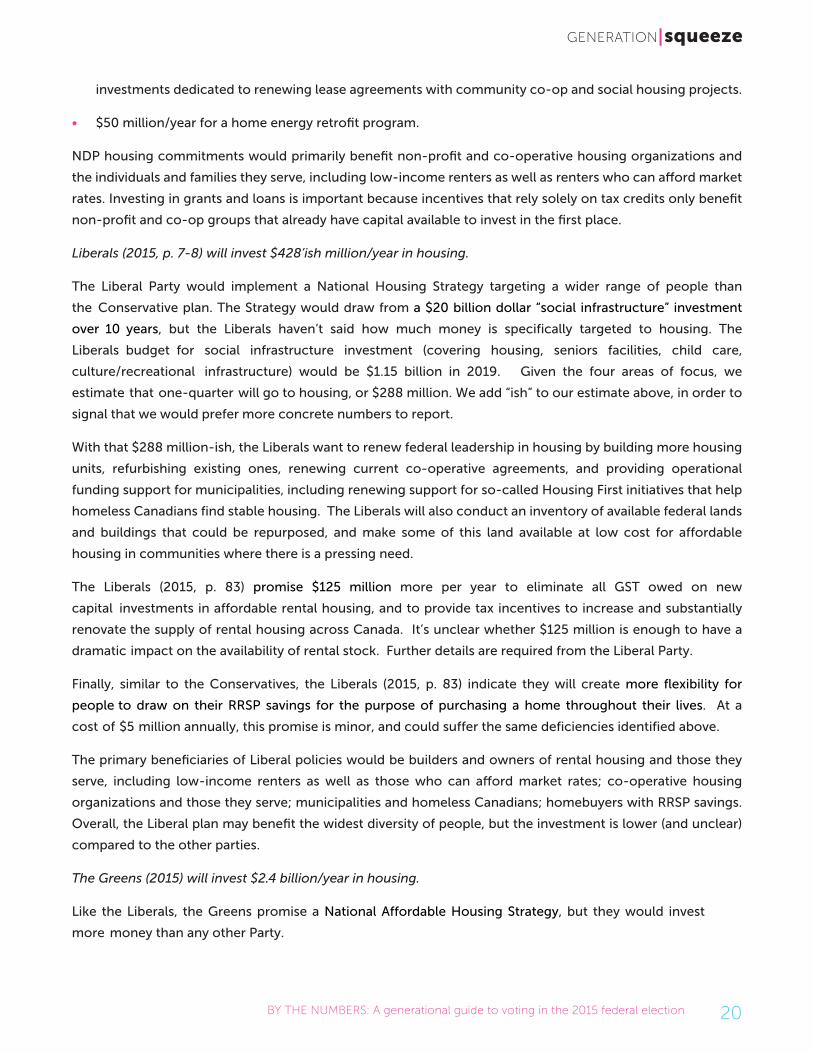
investments dedicated to renewing lease agreements with community co-op and social housing projects.
• $50 million/year for a home energy retrofit program.
NDP housing commitments would primarily benefit non-profit and co-operative housing organizations and
the individuals and families they serve, including low-income renters as well as renters who can afford market
rates. Investing in grants and loans is important because incentives that rely solely on tax credits only benefit
non-profit and co-op groups that already have capital available to invest in the first place.
Liberals (2015, p. 7-8) will invest $428’ish million/year in housing.
The Liberal Party would implement a National Housing Strategy targeting a wider range of people than
the Conservative plan. The Strategy would draw from a $20 billion dollar “social infrastructure” investment
over 10 years, but the Liberals haven’t said how much money is specifically targeted to housing. The
Liberals budget for social infrastructure investment (covering housing, seniors facilities, child care,
culture/recreational infrastructure) would be $1.15 billion in 2019. Given the four areas of focus, we
estimate that one-quarter will go to housing, or $288 million. We add “ish” to our estimate above, in order to
signal that we would prefer more concrete numbers to report.
With that $288 million-ish, the Liberals want to renew federal leadership in housing by building more housing
units, refurbishing existing ones, renewing current co-operative agreements, and providing operational
funding support for municipalities, including renewing support for so-called Housing First initiatives that help
homeless Canadians find stable housing. The Liberals will also conduct an inventory of available federal lands
and buildings that could be repurposed, and make some of this land available at low cost for affordable
housing in communities where there is a pressing need.
The Liberals (2015, p. 83) promise $125 million more per year to eliminate all GST owed on new
capital investments in affordable rental housing, and to provide tax incentives to increase and substantially
renovate the supply of rental housing across Canada. It’s unclear whether $125 million is enough to have a
dramatic impact on the availability of rental stock. Further details are required from the Liberal Party.
Finally, similar to the Conservatives, the Liberals (2015, p. 83) indicate they will create more flexibility for
people to draw on their RRSP savings for the purpose of purchasing a home throughout their lives. At a
cost of $5 million annually, this promise is minor, and could suffer the same deficiencies identified above.
The primary beneficiaries of Liberal policies would be builders and owners of rental housing and those they
serve, including low-income renters as well as those who can afford market rates; co-operative housing
organizations and those they serve; municipalities and homeless Canadians; homebuyers with RRSP savings.
Overall, the Liberal plan may benefit the widest diversity of people, but the investment is lower (and unclear)
compared to the other parties.
The Greens (2015) will invest $2.4 billion/year in housing.
Like the Liberals, the Greens promise a National Affordable Housing Strategy, but they would invest
more money than any other Party.
BY THE NUMBERS: A generational guide to voting in the 2015 federal election 21
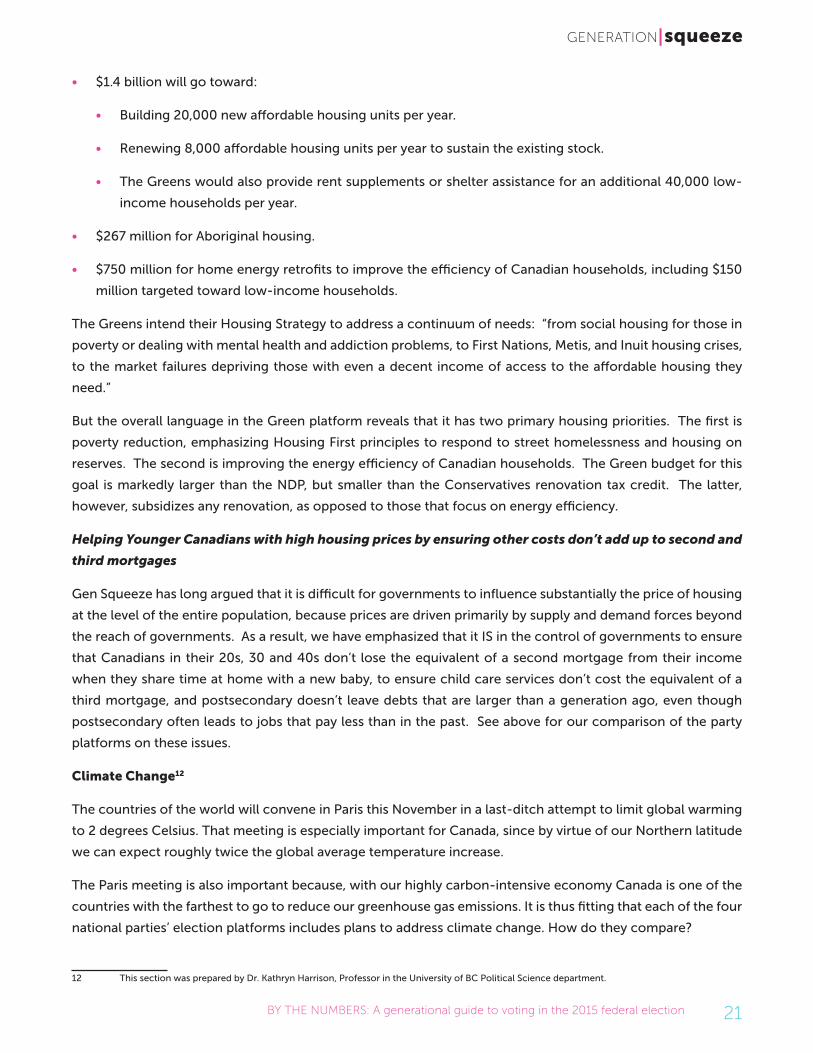
• $1.4 billion will go toward:
• Building 20,000 new affordable housing units per year.
• Renewing 8,000 affordable housing units per year to sustain the existing stock.
• The Greens would also provide rent supplements or shelter assistance for an additional 40,000 low-
income households per year.
• $267 million for Aboriginal housing.
• $750 million for home energy retrofits to improve the efficiency of Canadian households, including $150
million targeted toward low-income households.
The Greens intend their Housing Strategy to address a continuum of needs: “from social housing for those in
poverty or dealing with mental health and addiction problems, to First Nations, Metis, and Inuit housing crises,
to the market failures depriving those with even a decent income of access to the affordable housing they
need.”
But the overall language in the Green platform reveals that it has two primary housing priorities. The first is
poverty reduction, emphasizing Housing First principles to respond to street homelessness and housing on
reserves. The second is improving the energy efficiency of Canadian households. The Green budget for this
goal is markedly larger than the NDP, but smaller than the Conservatives renovation tax credit. The latter,
however, subsidizes any renovation, as opposed to those that focus on energy efficiency.
Helping Younger Canadians with high housing prices by ensuring other costs don’t add up to second and
third mortgages
Gen Squeeze has long argued that it is difficult for governments to influence substantially the price of housing
at the level of the entire population, because prices are driven primarily by supply and demand forces beyond
the reach of governments. As a result, we have emphasized that it IS in the control of governments to ensure
that Canadians in their 20s, 30 and 40s don’t lose the equivalent of a second mortgage from their income
when they share time at home with a new baby, to ensure child care services don’t cost the equivalent of a
third mortgage, and postsecondary doesn’t leave debts that are larger than a generation ago, even though
postsecondary often leads to jobs that pay less than in the past. See above for our comparison of the party
platforms on these issues.
Climate Change12
The countries of the world will convene in Paris this November in a last-ditch attempt to limit global warming
to 2 degrees Celsius. That meeting is especially important for Canada, since by virtue of our Northern latitude
we can expect roughly twice the global average temperature increase.
The Paris meeting is also important because, with our highly carbon-intensive economy Canada is one of the
countries with the farthest to go to reduce our greenhouse gas emissions. It is thus fitting that each of the four
national parties’ election platforms includes plans to address climate change. How do they compare?
12 This section was prepared by Dr. Kathryn Harrison, Professor in the University of BC Political Science department.

BY THE NUMBERS: A generational guide to voting in the 2015 federal election 22
The Conservative government has committed that Canada will reduce its emissions to 30 per cent below
2005 levels by 2030. The Green Party has committed to 40 per cent below 2005 levels by 2025. The NDP have
promised a 34 per cent reduction related to a 1990 baseline, equivalent to 46 per cent below 2005 levels, by
2025. The Liberals have not stated a reduction target. However, it would be difficult to backtrack on the 30 per
cent by 2030 target Canada has already submitted to the UN.
Targets are easy to announce but much harder to meet. Indeed, Canadian governments have announced
seven different climate action targets over the last 25 years, but moved the goalposts each time it became
apparent that the latest target would not be met. With emissions steadily increasing, Environment Canada has
projected that, yet again, we will fall well short of our current target to reduce emissions to 17 per cent below
2005 levels. So what the parties propose to do to meet their targets is at least as important as the targets
themselves.
The Conservative Party would stay the course with a sector-by-sector regulatory strategy. Although some new
regulations are proposed, the Conservatives have rejected regulation of emissions from oil sands extraction.
Since that sector alone accounts for the majority of Canada’s continuing emissions growth, it is not credible
that the Conservatives’ strategy would meet their own 2030 target, short of a deep recession.
The other parties all have embraced variants of carbon pricing. The Greens would impose a fee on all carbon
pollution, returning all revenue to Canadians via equal dividend cheques. The pollution fee would need to be
increased over time to prompt deeper reductions to achieve near- and long-term targets.
The NDP would adopt a cap and trade program for “big polluters.” As with a carbon fee, the national cap would
need to be steadily decreased to meet the 2025 target. While resulting pollution control costs that would be
passed on to consumers are less visible than under a carbon tax, they are likely to be identical if the goal is to
meet the same emissions target.
A critical gap in the NDP plan is how it would address small pollution sources, such as motor vehicles, homes,
and farms, which collectively account for half of Canada’s emissions. We simply cannot achieve the proposed
scale of reductions by targeting industry alone.
The Liberals have promised a national carbon price to be developed in collaboration with the provinces, but
have provided little detail. A critical question for the Liberals is how they would gain agreement from provinces
with conflicting goals.
In that regard, the Liberal proposal to achieve an intergovernmental carbon pricing deal in the way previous
governments achieved a medical care deal is less than convincing. Conditional federal grants helped to induce
provincial participation in Medicare, since that program involved significant costs for provincial governments.
Federal funding provides less leverage over climate policy, since pollution control costs will be borne primarily
by the private sector, not provincial governments. The NDP proposal only to allow provinces that meet or beat
federal criteria to opt out of a federal carbon pricing program is more credible.
Proposed pipelines also are connected to climate change, since they demand expanded oil sands production,
which in turn will yield increasing greenhouse gas emissions. Conditional on environmental assessments, the
Conservatives, Liberals, and NDP each have left the door open to one or more pipelines, though the NDP
assessments would include climate impacts. The Green Party opposes expansion of oil sands production and
all proposed pipelines.
BY THE NUMBERS: A generational guide to voting in the 2015 federal election 23
reFereNCes
Canadian Institute for Health Information. 2014. “National Health Expenditure Trends, 1975 - 2014.” Ottawa,
ON: Canadian Institute for Health Information.
Conservative Party of Canada. 2015. “Protect our Ecnomy: Our Conservative Plan to Protect the Economy.”
Conservative Party of Canada. http://www.conservative.ca/media/plan/conservative-platform-en.pdf.
Government of Canada. 2015a. Budget 2015. Strong Leadership. A Balanced Budget, Low Tax Plan for Jobs,
Growth and Security. http://www.budget.gc.ca/2015/docs/plan/budget2015-eng.pdf
Government of Canada. 2015b. Employment & Social Development Canada 2015-16 Report on Plans and
Priorities. http://www.esdc.gc.ca/en/reports/rpp/2015_2016/index.page.
Green Party of Canada. 2015. “Budget Overview.” Green Party of Canada. http://www.greenparty.ca/en/
budget.
Kershaw, Paul. 2015a. “Measuring the Age Gap in Canadian Social Spending.” Vancouver, BC: Generation
Squeeze. http://bit.ly/GSageGAP.
Kershaw, Paul. 2015b. "Population Aging, Generational Equity and the Middle Class." Vancouver BC:
Generations Squeeze. http://bit.ly/GSMiddleClass.
Kershaw, Paul, and Lynell Anderson. 2015. “Federal Favouritism: why does the federal government spend
five times more per retiree than per person under 45?” Vancouver, BC: Generation Squeeze. http://bit.ly/
GSFedFavouritism.
Liberal Party of Canada. 2015. “Real Change: A New Plan for a Strong Middle Class.” Liberal Party of Canada.
https://www.liberal.ca/files/2015/10/New-plan-for-a-strong-middle-class.pdf.
New Democratic Party of Canada. 2015. “Building the Country of our Dreams: Tom Mulcair’s Plan to Bring
Change to Ottawa.” New Democratic Party of Canada. http://www.ndp.ca/platform.
OECD. 2013. “Health at a Glance 2013: OECD Indicators.” OECD Publishing. http://dx.doi.org/10.1787/
health_glance-2013-en.
Statistics Canada. 2013. “Longitudinal Administrative Data: 2011.” Ottawa, ON: Ministry of Industry.
Statistics Canada. 2014. “CANSIM Table 051-0001: Estimates of population, by age group and sex for July 1,
Canada, provinces and territories annual.” Statistics Canada Accessed September 15, 2015. http://www5.
statcan.gc.ca/cansim/pick-choisir?lang=eng&p2=33&id=0510001.