Embed Size (px)
Citation preview
Generation Change in Biopharmaceuticals Production
From Fed-Batch to Hybrid Processes
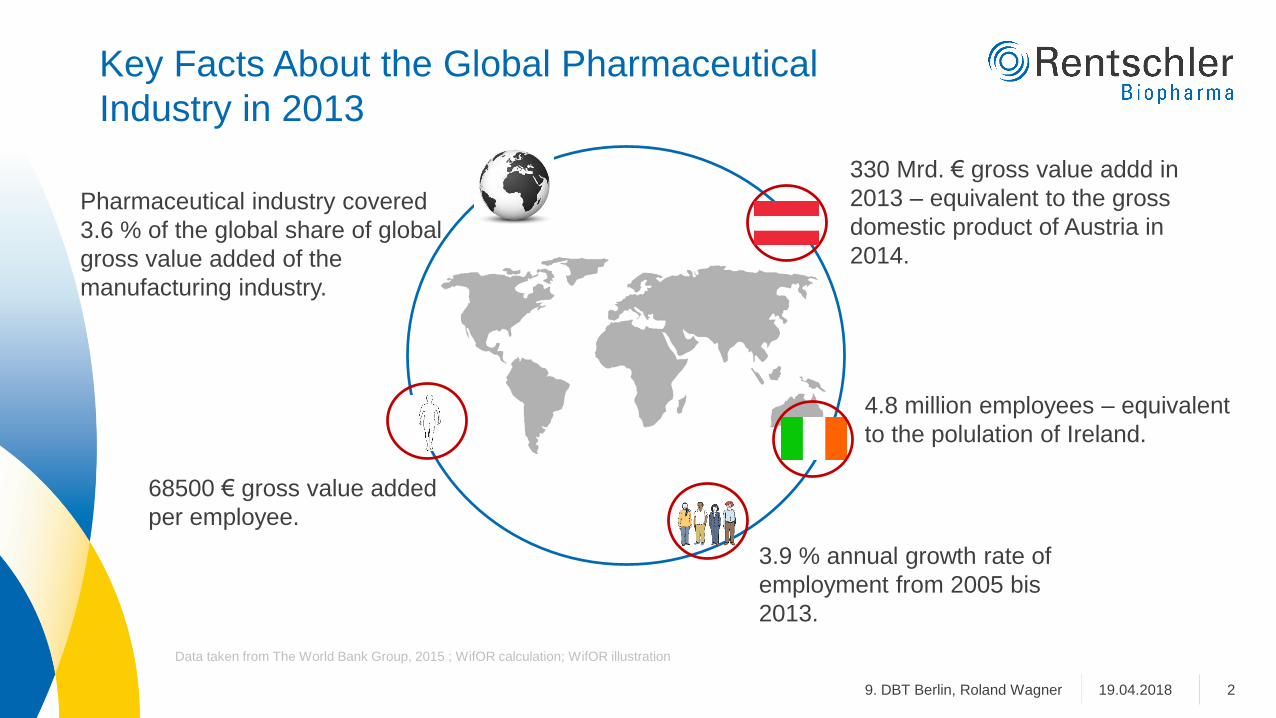
Key Facts About the Global Pharmaceutical
Industry in 2013
219.04.20189. DBT Berlin, Roland Wagner
Data taken from The World Bank Group, 2015 ; WifOR calculation; WifOR illustration
330 Mrd. € gross value addd in
2013 – equivalent to the gross
domestic product of Austria in
2014.
4.8 million employees – equivalent
to the polulation of Ireland.
3.9 % annual growth rate of
employment from 2005 bis
2013.
68500 € gross value added
per employee.
Pharmaceutical industry covered
3.6 % of the global share of global
gross value added of the
manufacturing industry.

Approvals for Biopharmaceuticals on the EU
Are Higher than Ever
32018-02-14Roland Wagner
0
5
10
15
20
25
30
35
40
45
50
2006 2007 2008 2009 2010 2011 2012 2013 2014 2015 2016
Other Pharmaceuticals Biosimilars Originals
More than 250
biopharmaceuticals
are on the market.
Biotech-Report 2017

Germany‘s Biopharmaceutical Pipeline Is Well-Filled2/3 of active ingredients are monoclonal antibodies
42018-02-14Roland Wagner,Biotech-Report 2017
0
50
100
150
200
250
300
350
400
MonoclonalAntibodies
Vaccines Other Recom.Proteins
Gene Therapeutics
Phase I Phase II Phase III
Change from the prior year +3% +1% -6% +10%
Total amount 399 116 98 23
Biopharmaceutical
Companies in Germany
(change from the prior year)
Employment Number
(change from the prior year)
365 (+1.7%) 44100 (+8.1%)
2016
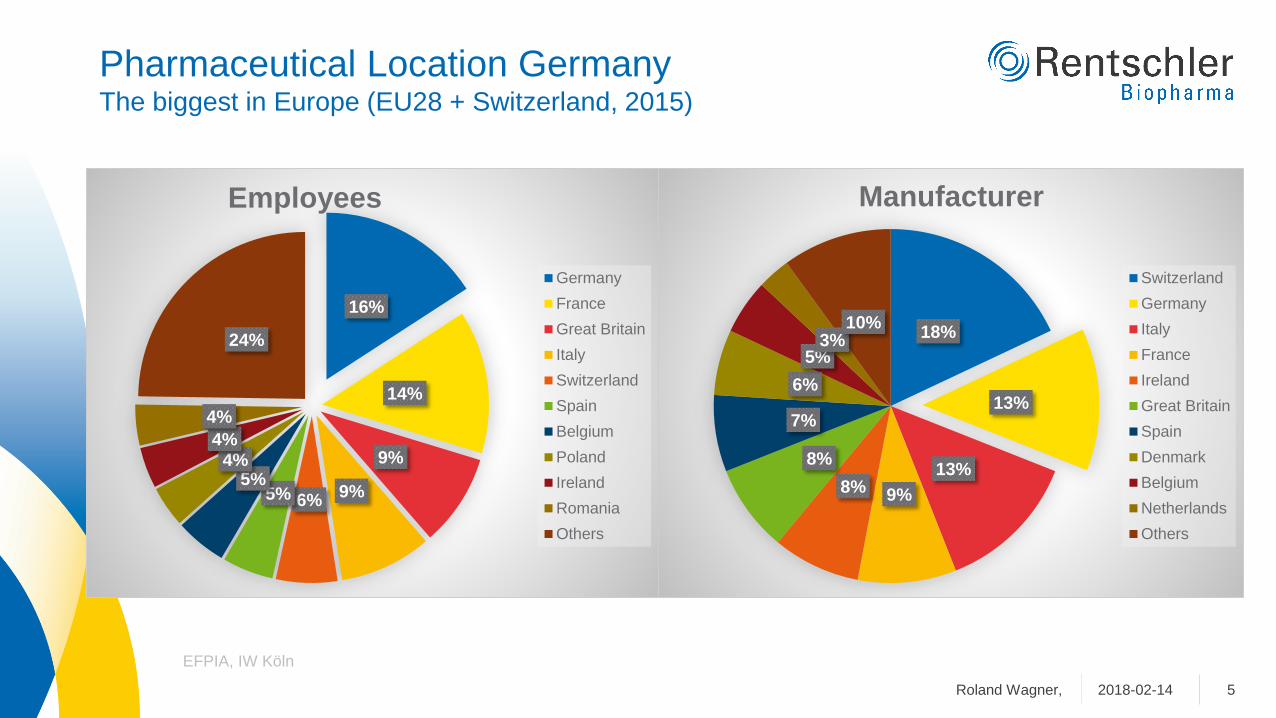
Pharmaceutical Location GermanyThe biggest in Europe (EU28 + Switzerland, 2015)
52018-02-14Roland Wagner,
EFPIA, IW Köln
16%
14%
9%
9%6%5%
5%4%
4%
4%
24%
Employees
Germany
France
Great Britain
Italy
Switzerland
Spain
Belgium
Poland
Ireland
Romania
Others
18%
13%
13%
9%8%
8%
7%
6%
5%3%
10%
Manufacturer
Switzerland
Germany
Italy
France
Ireland
Great Britain
Spain
Denmark
Belgium
Netherlands
Others
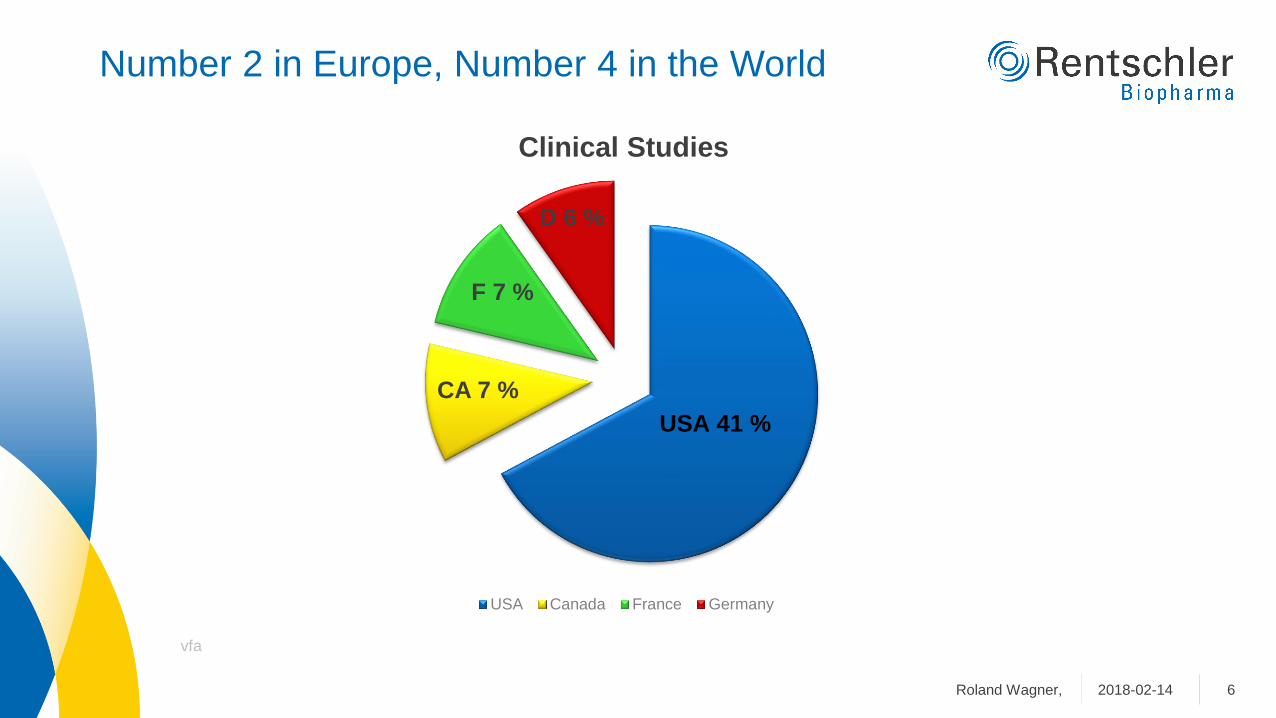
Number 2 in Europe, Number 4 in the World
62018-02-14Roland Wagner,
Clinical Studies
USA Canada France Germany
USA 41 %
D 6 %
F 7 %
CA 7 %
vfa
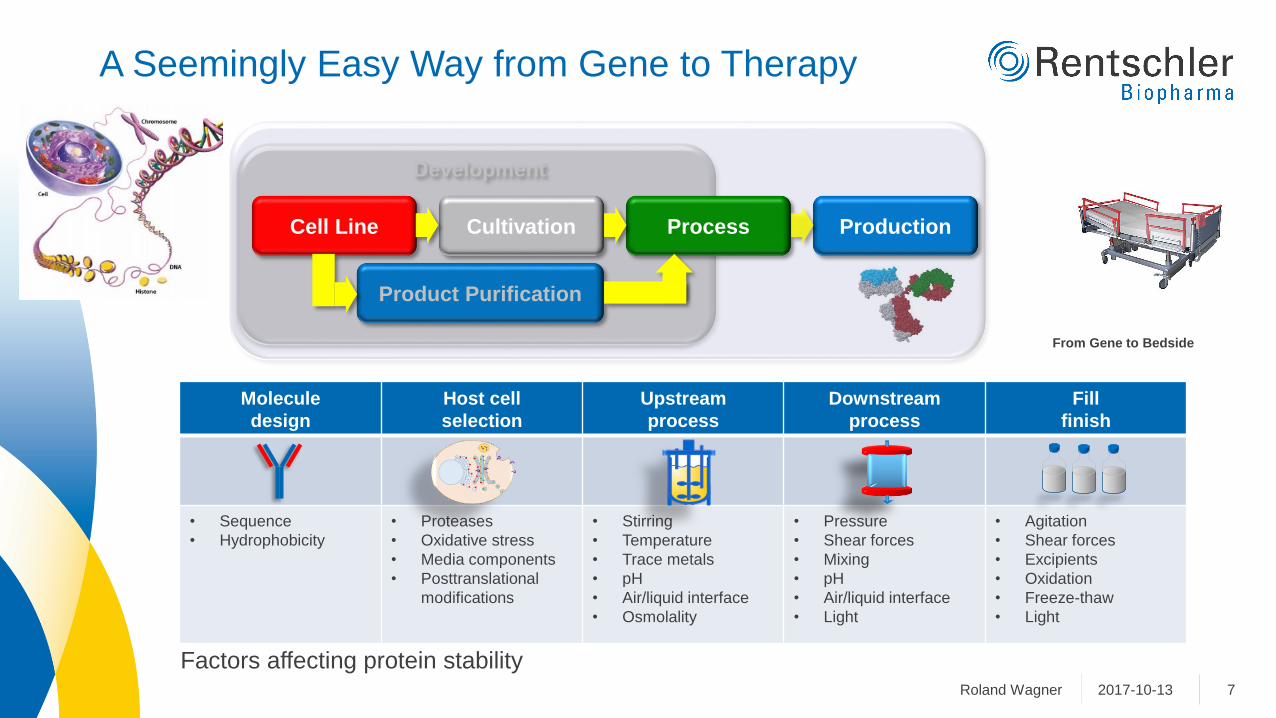
A Seemingly Easy Way from Gene to Therapy
72017-10-13Roland Wagner
From Gene to Bedside
Development
Cell Line Cultivation
Product Purification
ProductionProcess
Molecule
design
Host cell
selection
Upstream
process
Downstream
process
Fill
finish
• Sequence
• Hydrophobicity
• Proteases
• Oxidative stress
• Media components
• Posttranslational
modifications
• Stirring
• Temperature
• Trace metals
• pH
• Air/liquid interface
• Osmolality
• Pressure
• Shear forces
• Mixing
• pH
• Air/liquid interface
• Light
• Agitation
• Shear forces
• Excipients
• Oxidation
• Freeze-thaw
• Light
Factors affecting protein stability

Pioneering Cell Culture Bioprocesses in 1967
82017-10-13Roland Wagner
Paul van Hemert with the so-called “Bilthoven Unit” with a Polio virus vaccine production bioreactor in
1967.
Filled with cells grown on microcarriers
(Anton van Wezel. 1967. Nature 216: 64).
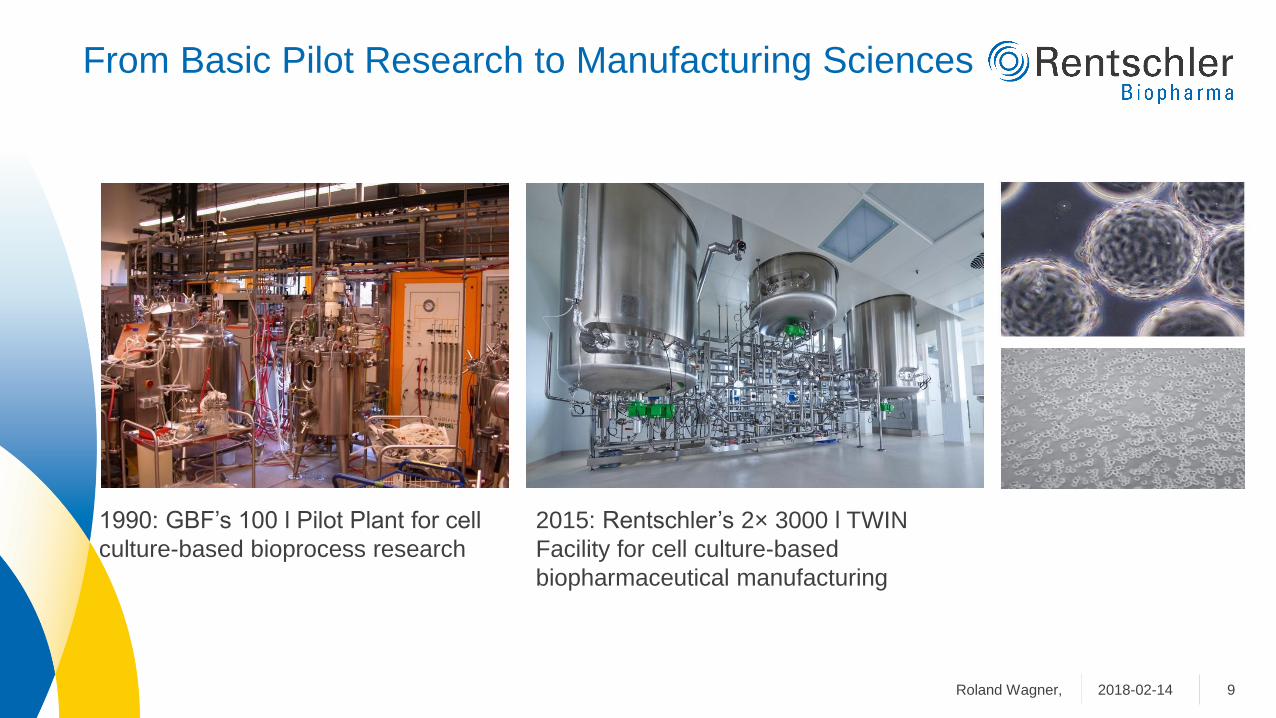
From Basic Pilot Research to Manufacturing Sciences
92018-02-14Roland Wagner,
2015: Rentschler’s 2× 3000 l TWIN
Facility for cell culture-based
biopharmaceutical manufacturing
1990: GBF’s 100 l Pilot Plant for cell
culture-based bioprocess research
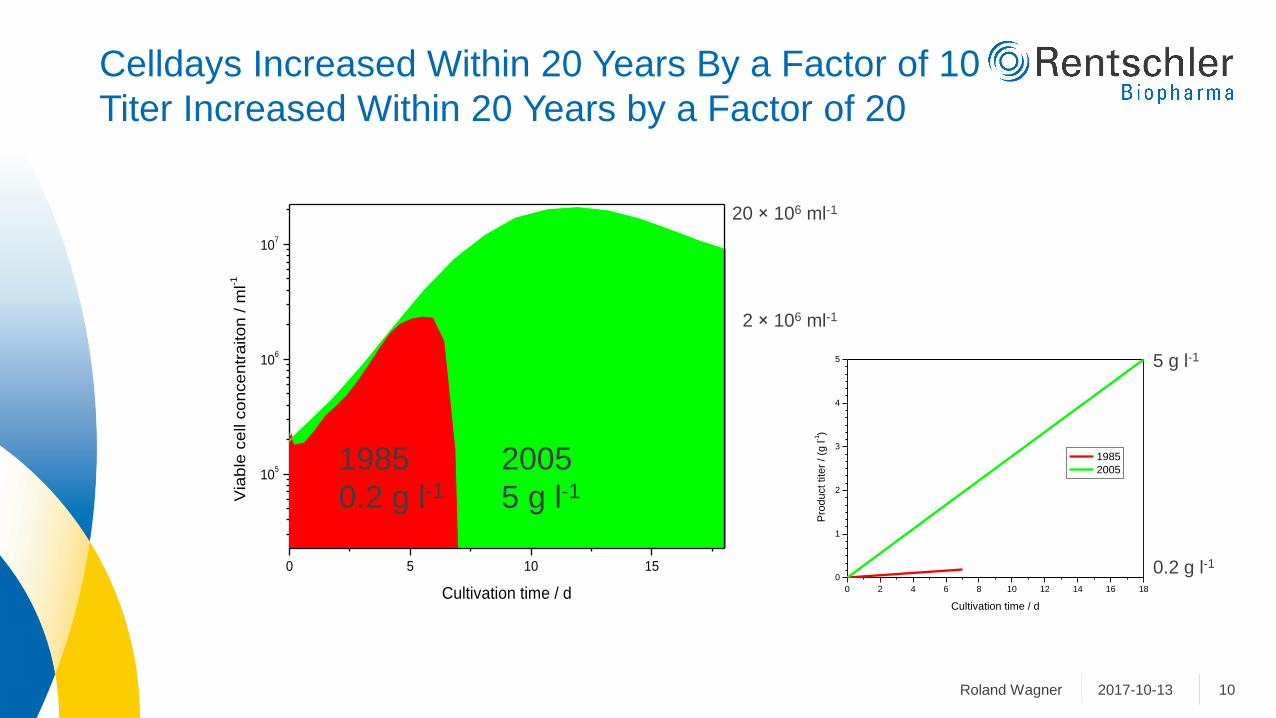
Celldays Increased Within 20 Years By a Factor of 10
Titer Increased Within 20 Years by a Factor of 20
102017-10-13Roland Wagner
0 5 10 15
105
106
107
Via
ble
ce
ll c
on
ce
ntr
aito
n / m
l-1
Cultivation time / d
1985
0.2 g l-12005
5 g l-1
20 × 106 ml-1
2 × 10⁶ ml-1
5 g l-1
0.2 g l-1
0 2 4 6 8 10 12 14 16 18
0
1
2
3
4
5
1985
2005
Pro
du
ct tite
r / (g
l-1)
Cultivation time / d
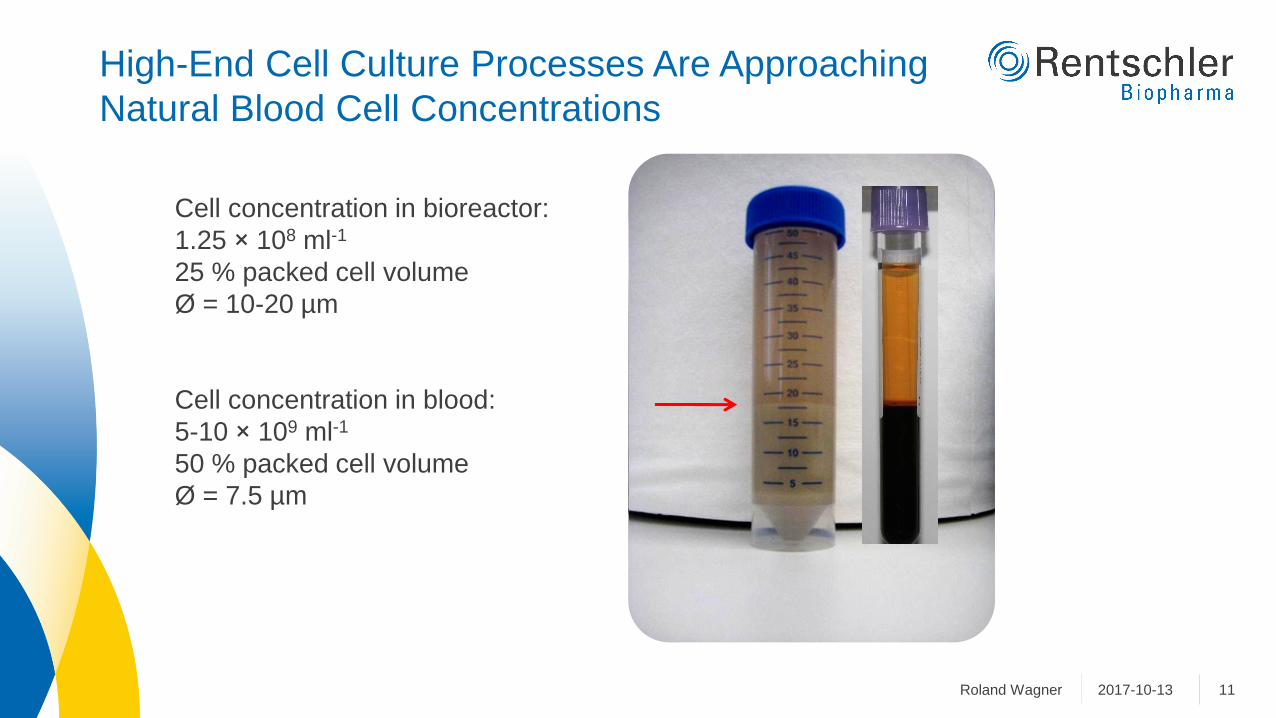
High-End Cell Culture Processes Are Approaching
Natural Blood Cell Concentrations
112017-10-13Roland Wagner
Cell concentration in bioreactor:
1.25 × 10⁸ ml-1
25 % packed cell volume
Ø = 10-20 µm
Cell concentration in blood:
5-10 × 109 ml-1
50 % packed cell volume
Ø = 7.5 µm

Boost Performed by Cell Culture TechnologistsA fantastic job over the last 20 years
122017-10-13Roland Wagner
● Drivers are
o Improving Safety to patients (CD media)
o Improved Control & Consistency
o Development Time Line Acceleration
● In principle for antibodies and Fc-fusion proteins
0
2.000
4.000
6.000
8.000
10.000
12.000
14.000
1990 1995 2000 2005 2010 2015 2020
Tit
er
/ (m
g l
-1)
Date / y
According to Thomas Ryll, 25th ESACT Meeting, Lausanne, 2017

Improved Cell Culture Production is Driven by
132017-10-13Roland Wagner
● Safety, Control and Robustness
o Enhanced patient safety
o Improved process robustness and
consistency
o Tailor-made product quality
(comparability & similarity)
● Efficiency, Potency and Cost
o Enhanced productivity and facility output
(titer and volumetric productivity)
o Excellent pharmacokinetics
o Reduced processing time
o Reduced process scale
o Ease downstream operation
o Ease technology transfer
o Overall cost reduction (cost per gram of
product produced)
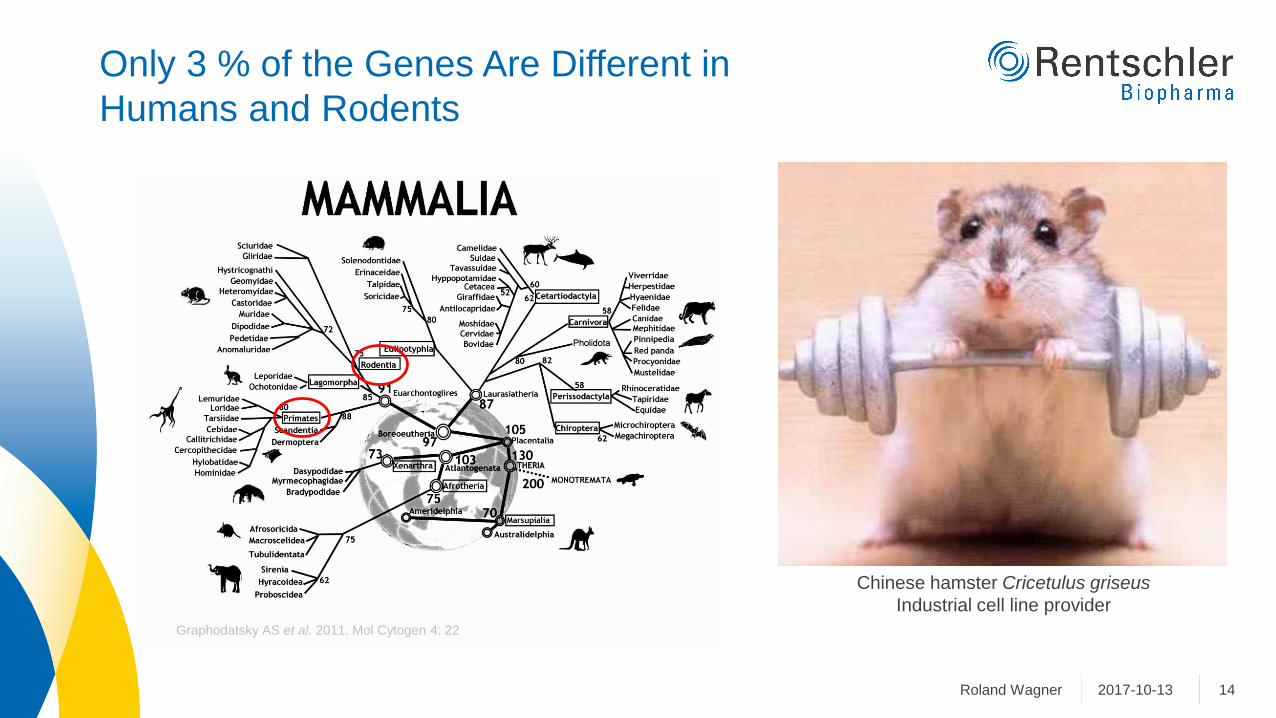
Only 3 % of the Genes Are Different in
Humans and Rodents
142017-10-13Roland Wagner
Chinese hamster Cricetulus griseus
Industrial cell line provider
Graphodatsky AS et al. 2011. Mol Cytogen 4: 22
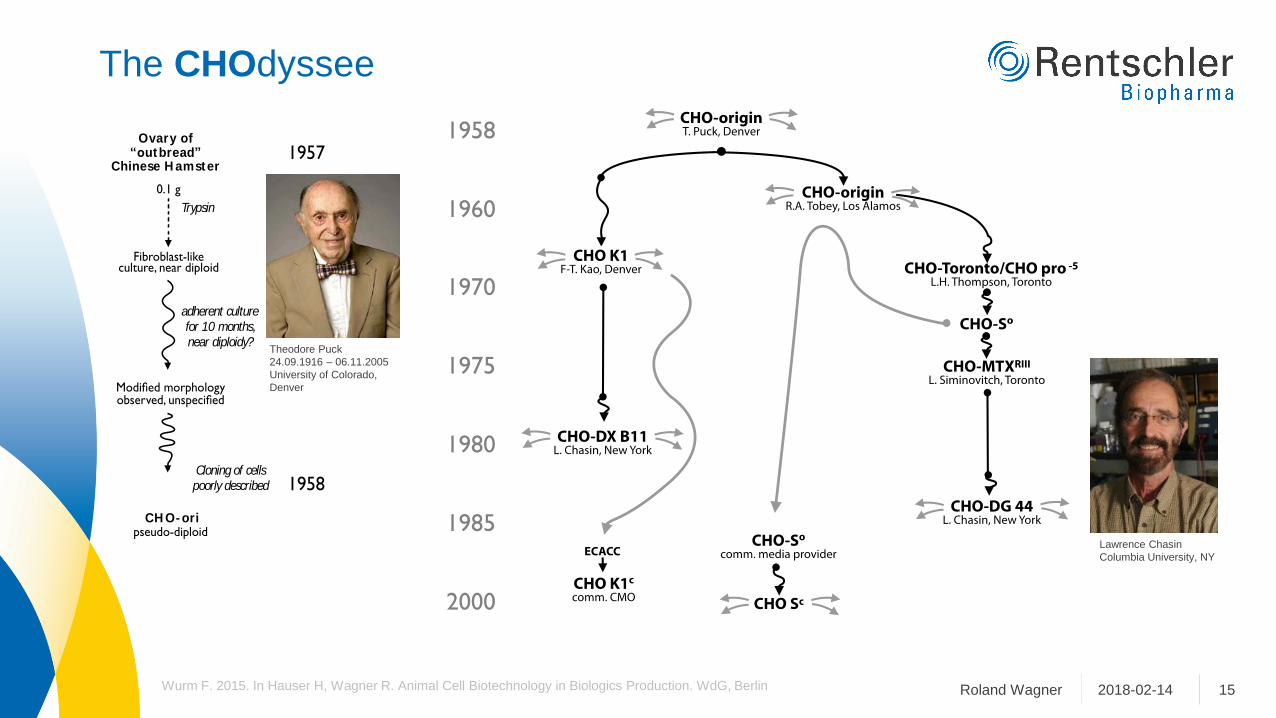
The CHOdyssee
152018-02-14Roland Wagner
Ovary of “outbread”
Chinese H amster
0.1 g
Trypsin
Fibroblast-like culture, near diploid
adherent culture for 10 months, near diploidy?
Modified morphology observed, unspecified
Cloning of cellspoorly described
1957
1958
CH O- oripseudo-diploid
Theodore Puck
24.09.1916 – 06.11.2005
University of Colorado,
Denver
Lawrence Chasin
Columbia University, NY
Wurm F. 2015. In Hauser H, Wagner R. Animal Cell Biotechnology in Biologics Production. WdG, Berlin
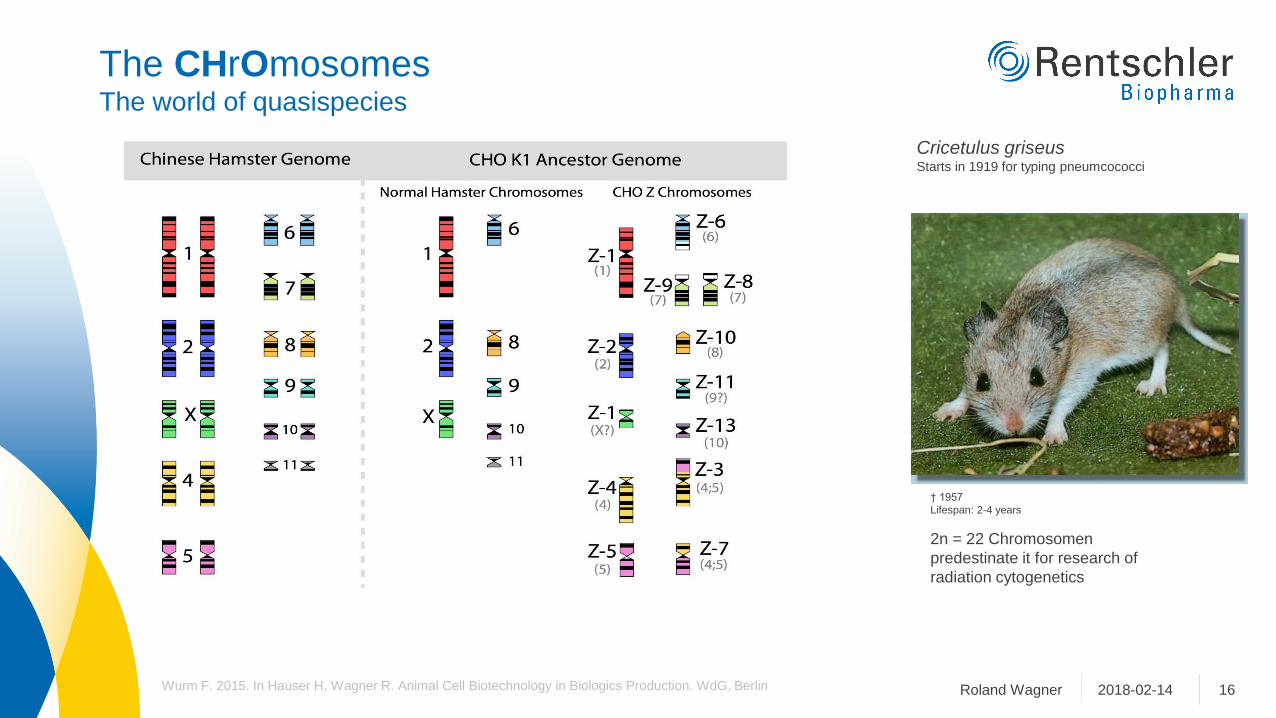
The CHrOmosomesThe world of quasispecies
162018-02-14Roland WagnerWurm F. 2015. In Hauser H, Wagner R. Animal Cell Biotechnology in Biologics Production. WdG, Berlin
Cricetulus griseusStarts in 1919 for typing pneumcococci
† 1957
Lifespan: 2-4 years
2n = 22 Chromosomen
predestinate it for research of
radiation cytogenetics

Typical Antibody Manufacturing Process Over the
Last 20 Years
172017-10-13Roland Wagner
Levine H et al. 2013. BioProcess Int 11(4s): 40-45
Inoculation Train
15 – 18 d
● Challenge:
Overall Process
Intensification
● Focus areas for
improvements
o Cell Banks
o Seed
Expansion
o N-1 Cell Mass
o Production
Culture
Seed Train 6 – 12 d
From Vial to Harvest 30- 50 d
12 – 18 d
Shake Flasks/
Rocker Bags
USP
DSP
Inoculation Train:
Thaw and expand cells

Cell Banks and Seeding Intensification
182017-10-13Roland Wagner
● Increasing starting cell mass and reducing initial expansion steps
o Rolling seed train
o High cell concentration in vials or bags
o Frozen seed train intermediates in bags
Heidemann R et al. 2002. Cytotechnology 38: 99-108; Heidemann R et al. 2010. Biotechnol Prog 26: 1154-1163; Tao YW et al. 2011. Biotechnol Prog 27: 824-829; Seth G et al. 2013.
Biotechnol Bioeng 110: 1376-1385; Clincke MF et al. 2013. Biotechnol Prog 29: 768 - 777
Basic Strategy Advantage Disadvantage
One Vial Only Batch • Batch to batch identical seed train• Identical population doublings
• Identical cell age
SLOW
• More WCB vials used
• More labor intensive
RELIABLE
Rolling Seed Train
(small scale bioreactors)
• Less labor intensive
• Less WCB vials used
• Reduced number of seed train stages
for each production run
FAST
• Each batch has a different seed
train history• Each batch has different cell age
• Cell line stability limits
• FAILURE-PRONE

Cell Banks and Seed IntensificationHigh cell number working cell bank
192017-10-13Roland Wagner
Thaw directly into Wave from 5-ml CryoTube vial (cell conc.100×106 ml-1)
Elimination of more variable seed expansion stages
9 days facility time saving after change over
Standard Vial Master Cell Bank + High Density Working Cell
Bank
20-L Wave system with floating perfusion filter
Tao Y et al. 2011. Biotechnol Prog 27: 824-829
Standard WCB
1 ml, 25×106 ml-1
HDWCB
4.5 ml, 100×106 ml-1
20-L Wave system with floating perfusion filter
Via
ble
Cell
Concentr
ation
/ (1
06
ml-1
)
Cultivation time / d
Via
ble
Cell
Concentr
ation
/ (1
06
ml-1
)
Cultivation time / d
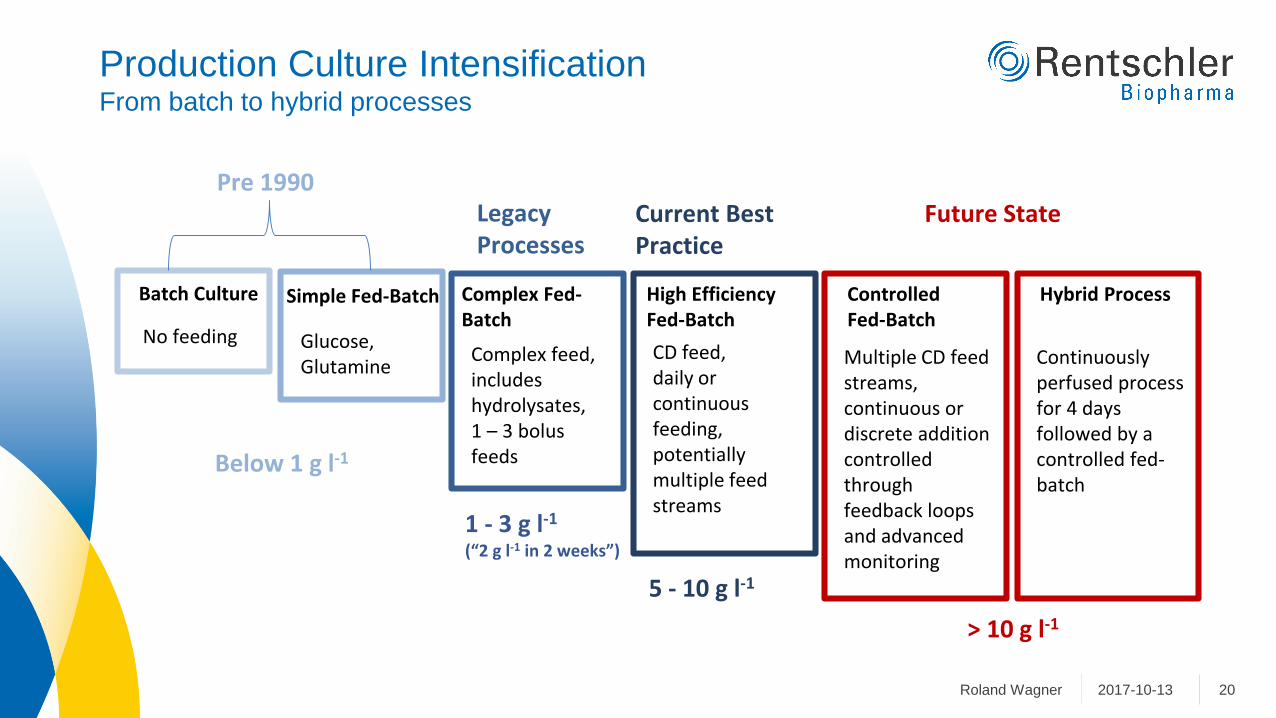
Production Culture IntensificationFrom batch to hybrid processes
202017-10-13Roland Wagner
Batch Culture Simple Fed-Batch
Glucose, Glutamine
Complex Fed-Batch
Complex feed, includes hydrolysates,1 – 3 bolus feeds
High Efficiency Fed-Batch
CD feed,daily or continuous feeding, potentially multiple feed streams
Controlled Fed-Batch
Multiple CD feed streams, continuous or discrete addition controlled through feedback loops and advanced monitoring
No feeding
Pre 1990Legacy Processes
Current Best Practice
Future State
Below 1 g l-1
1 - 3 g l-1
(“2 g l-1 in 2 weeks”)
5 - 10 g l-1
> 10 g l-1
Hybrid Process
Continuously perfused process for 4 daysfollowed by a controlled fed-batch

● Shortened process time by 1 day
● Comparable cell conc. (<10×106 ml-1) & viability
● Doubled protein titer at harvest
Effects of Accelerated Feed Strategy
0
200
400
600
800
1000
1200
0 2 4 6 8 10 12 14
Pro
tAH
PLC
m/
(mg
l-1)
Cultivation time / dGMP 1 GMP 2 GMP 3 GMP 4
0
500
1000
1500
2000
2500
0 2 4 6 8 10 12 14
Pro
tAH
PLC
/ (
mg
l-1)
Cultivation time / d
GMP 5 GMP 6 GMP 7 GMP 8 GMP 9
212017-10-13Roland Wagner

Fed-Batch Production Improvements Over the Last 20 Years
Iso-Titer Lines in Efficiency / Intensity Space
222017-10-13Roland Wagner
Media / Feed Optimization
o CD formulas, balanced feeding
Host Cell Line that grows to high cell mass
o Adapted to process materials and format
Improved Process Control
o Feedback loop driven feeding: Feed per cell, Glc / Lac control
o Lactogenesis: HIPDOG, HIPCOP
Perfusion Applications:
- Perfusion supported Fed-Batch
- Concentrated Fed-Batch
- High Density Perfusion Culture
0 2 4 6 8
105
106
107
0.0
0.5
1.0
1.5
2.0
2.5
3.0
3.5
4.0
Via
ble
ce
ll co
nce
ntr
atio
n / m
l-1
Cultivation time / d
Lac
Glc
VCC
Glc
/La
c c
on
ce
ntr
atio
n / (
g l
-1)
Cellsp.
Productivity
[pg d-1]
Integral Cell Mass
[106 ml-1]
Titer
[g l-1]
Year
20 20 1 1990
30 70 2.5 - 2005
50 100 5 - 2010
50 200 10 > 2015
50 300 15 > 2017

Combining Benefits of Fed-Batch and Perfusion to
Hybrid Processes
232017-10-13Roland Wagner
Perfusion Fed-Batch
N-1 PerfusionSeed culture Perfusion followed by Fed-Batch
Hybrid Perfusion - Fed-BatchPerfusion during Fed-Batch growth phase to boost cell mass
Concentrated Fed-BatchPerfusion during Fed-Batch production phase using UF membrane to concentrate the product
Fusion
Process
Feature
Titer Media
Consumption
Complexity Available Manufacturing
Capacity
Cell Mass Volumetric
Productivity
Product
Residence Time
Benefit Fed-Batch Fed-Batch Fed-Batch Fed-Batch Perfusion Perfusion Perfusion
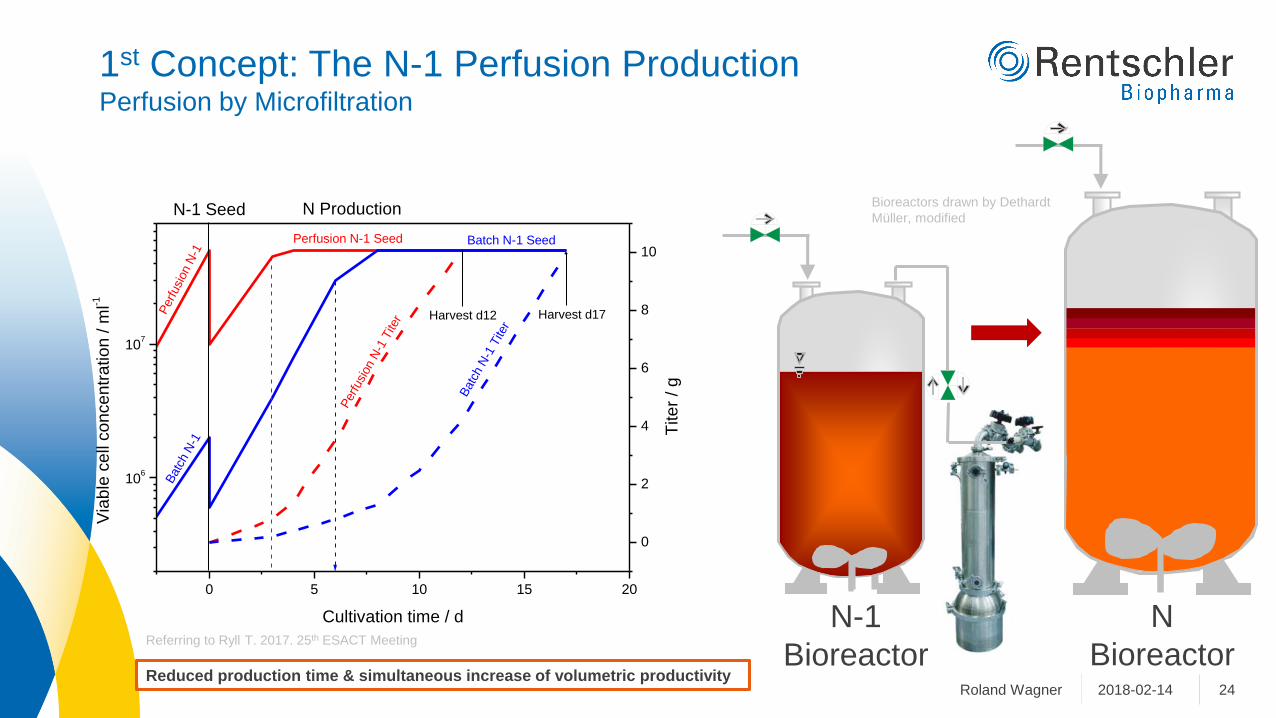
1st Concept: The N-1 Perfusion ProductionPerfusion by Microfiltration
242018-02-14Roland WagnerReduced production time & simultaneous increase of volumetric productivity
Referring to Ryll T. 2017. 25th ESACT Meeting
0 5 10 15 20
106
107
0
2
4
6
8
10Batch N-1 SeedPerfusion N-1 Seed
Harvest d17Harvest d12
Batc
h N
-1 T
iter
N ProductionN-1 Seed
Batc
h N
-1
Perfusi
on N
-1
Via
ble
ce
ll co
nce
ntr
atio
n / m
l-1
Cultivation time / d
Perfusi
on N
-1 T
iter
Tite
r / g
N-1
Bioreactor
N
Bioreactor
Bioreactors drawn by Dethardt
Müller, modified
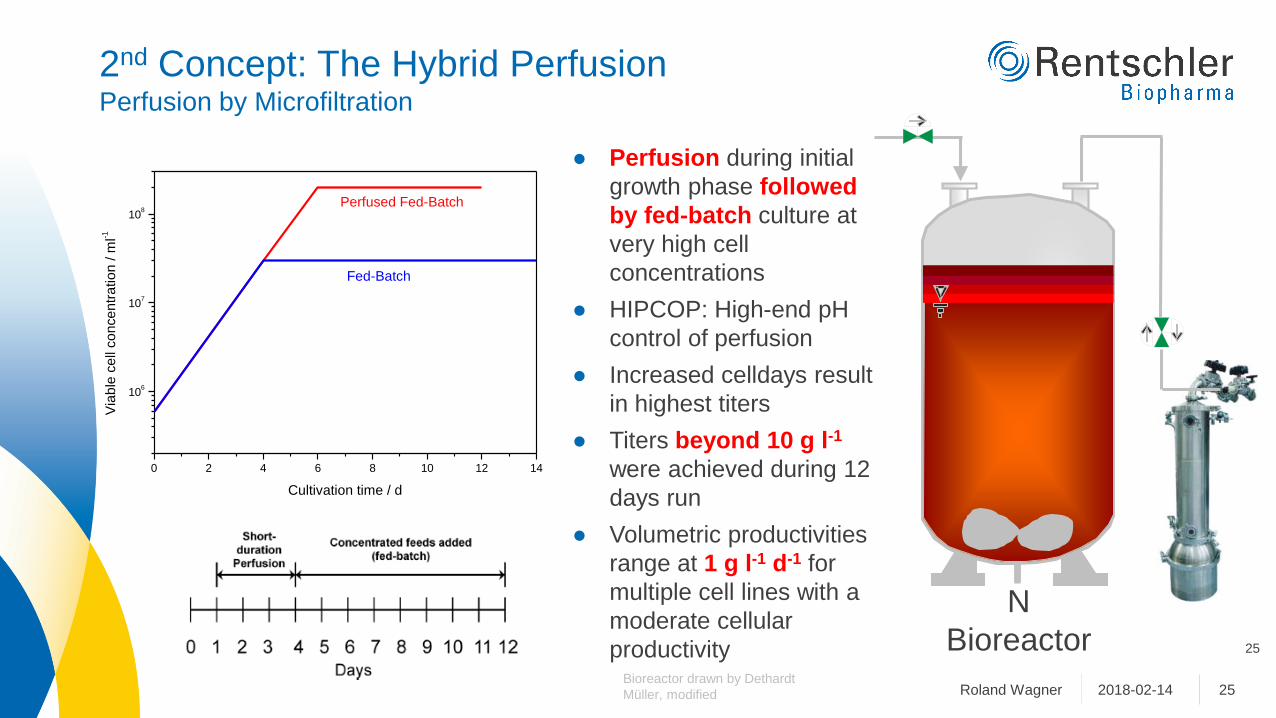
2nd Concept: The Hybrid PerfusionPerfusion by Microfiltration
252018-02-14Roland Wagner
● Perfusion during initial
growth phase followed
by fed-batch culture at
very high cell
concentrations
● HIPCOP: High-end pH
control of perfusion
● Increased celldays result
in highest titers
● Titers beyond 10 g l-1
were achieved during 12
days run
● Volumetric productivities
range at 1 g l-1 d-1 for
multiple cell lines with a
moderate cellular
productivity
0 2 4 6 8 10 12 14
106
107
108
Perfused Fed-Batch
Fed-Batch
Via
ble
ce
ll co
nce
ntr
atio
n / m
l-1
Cultivation time / d
25
N
BioreactorBioreactor drawn by Dethardt
Müller, modified

3rd Concept: The N-1 Perfusion Hybrid ProcessPerfusion by Microfiltration
262018-02-14Roland Wagner
0 2 4 6 8 10 12 14
106
107
108
109
N-1 Perfused Hybrid
Perfused Fed-Batch
Via
ble
ce
ll co
nce
ntr
atio
n / m
l-1
Cultivation time / d
N-1
BioreactorN
Bioreactor
● Start perfusion at the N-1 seed bioreactor state followed by a
short perfusion period at production scale and finished with a
fed-batch process
● Reduction of process time by simultaneous increase of
productivityBioreactors drawn by Dethardt
Müller, modified
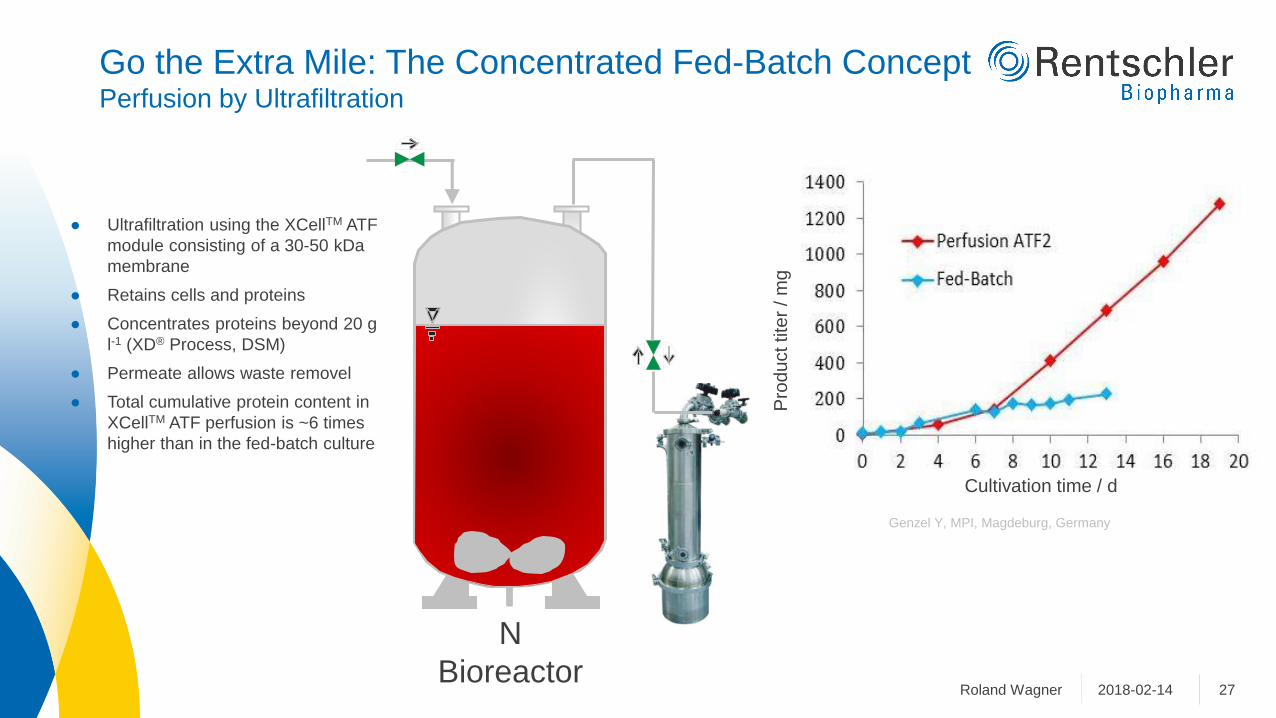
Go the Extra Mile: The Concentrated Fed-Batch ConceptPerfusion by Ultrafiltration
272018-02-14Roland Wagner
● Ultrafiltration using the XCellTM ATF
module consisting of a 30-50 kDa
membrane
● Retains cells and proteins
● Concentrates proteins beyond 20 g
l-1 (XD® Process, DSM)
● Permeate allows waste removel
● Total cumulative protein content in
XCellTM ATF perfusion is ~6 times
higher than in the fed-batch culture
Pro
du
cttite
r/ m
g
Cultivation time / d
Genzel Y, MPI, Magdeburg, Germany
N
Bioreactor

The Concentrated Fed-Batch Concept
282017-10-13Roland Wagner
Process Cell
concentration
[ml-1]
Titer
[g l-1]
Volumetric
productivity
[mg l-1 d-1]
Reference
Fed-Batch 5 × 10⁷ 8 430 Yang WC et al. 2016. J
Biotechnol 217:1-11
Concentrated
Fed-Batch
18 × 107 25 790 Yang WC et al. 2016. J
Biotechnol 217:1-11
XD® Process 15 × 107 27 1800 Douwenga R. 2013. Bioproc
Intl. Industry Yearbook: 99
Concentrated
Fed-Batch
9 × 10⁷ 37 2500 Xu S et al. 2017. Biotechnol
Prog 33: 867-878
130 75 40 20 10
Cell density / (106 ml-1)
Linz F. 2011. DSM

Impact of Continuously Perfused High Density CulturesIso-Volumetric Productivity Lines in Efficiency / Intensity Space
292017-10-13Roland Wagner
Xu S et al. 2017. Biotechnol Prog 33: 867-878
Via
ble
cell
concentr
atio
n/ (
(10
6m
l-1)
Volu
metr
icpro
ductivity
/ (
(g l
-1d
-1)
Cultivation time / d
Eff
icie
ncy
IntensityRyll T. 2017. 25th ESACT Meeting, Lausanne
0,0
10,0
20,0
30,0
40,0
50,0
60,0
0 10 20 30 40 50 60 70 80 90 100 110 120
5 g l-1 d-1210.50.1 3 4
Cell
sp
ec
ific
pro
du
cti
vit
y /
(p
gd
-1)
Average cell mass per run day / (106 d-1)
Perfusion with
basal medium
Perfusion with basal
medium + feed

Supply of an Antibody Market -
Economy Determines the Process
302017-10-13Roland Wagner
● Case study to supply a large market (e.g. Alzheimer - a worse case)
o Potential patients: >10 million next 30 years.
o 50 % market penetration: 5 million patients
o Yearly demand per patient: 24 g
o 5 million patients: 120 000 kg
o 2500 kg with 20 000-l bioreactor per year
o 10 – 50× 20-k bioreactors required
Not a problem even with todays technology

One Step Further
312018-02-14Roland Wagner
Cricetulus griseus
† 1957
2n = 22 Chromosomes
CHO cell size: 15×15 µm
Max. cell concentration 8×10⁸ ml-1
Doubling time: 20 h
Culture temperature: 37 °C
Will be born
2n = 36 Chromosomes
Cell size: 15×5 µm
Max. cell concentration: 5×10⁹ ml-1
Doubling time: 6 h
Culture temperature: 26 °C
Leishmania tarentolae
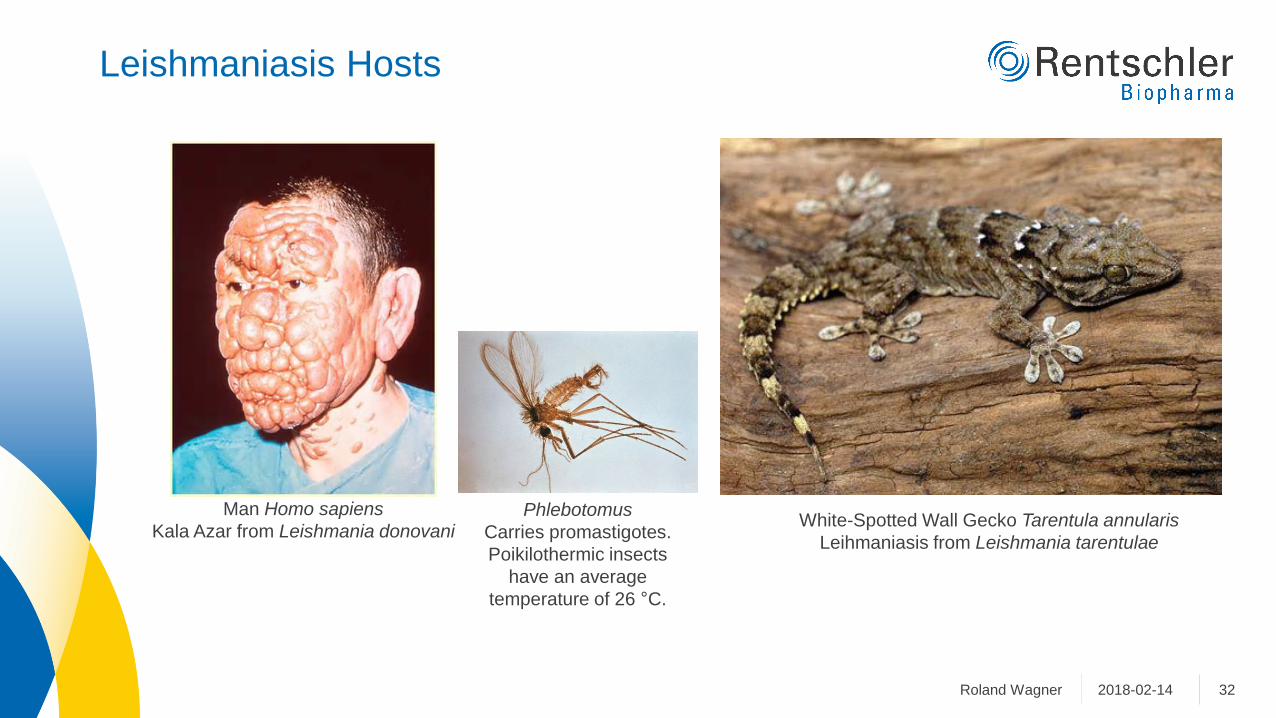
Leishmaniasis Hosts
322018-02-14Roland Wagner
Man Homo sapiens
Kala Azar from Leishmania donovaniWhite-Spotted Wall Gecko Tarentula annularis
Leihmaniasis from Leishmania tarentulae
Phlebotomus
Carries promastigotes.
Poikilothermic insects
have an average
temperature of 26 °C.
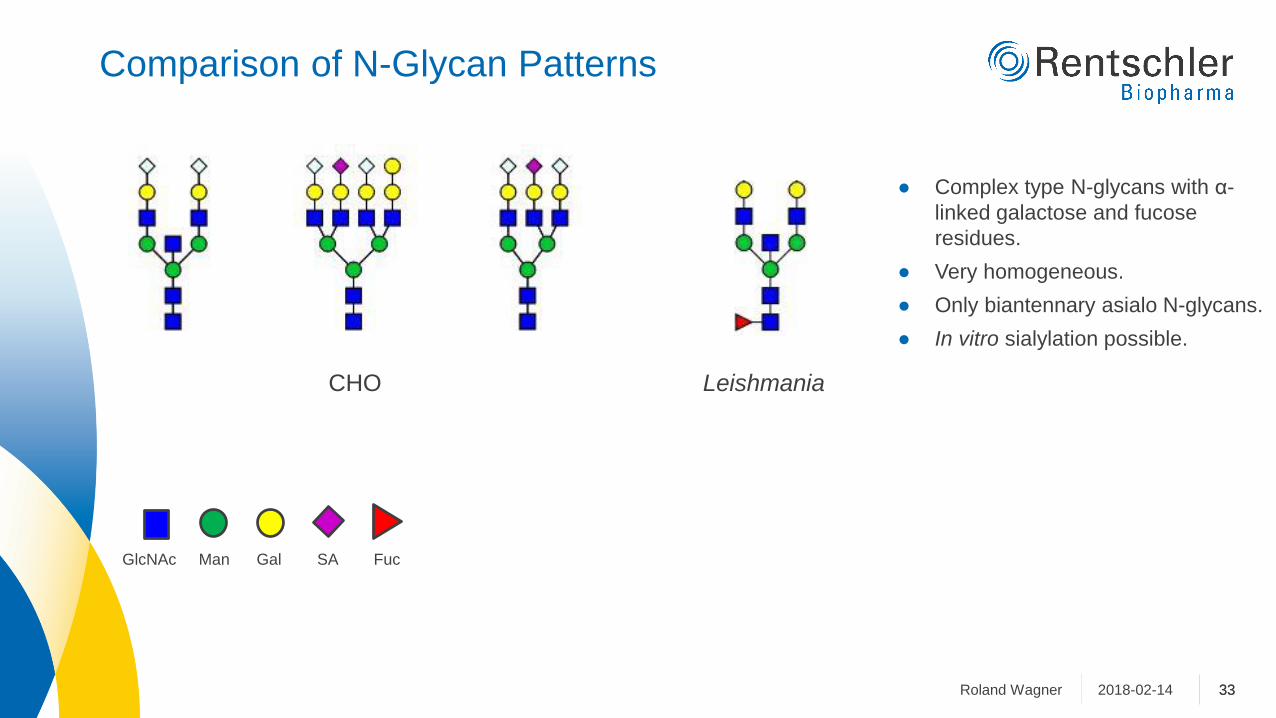
Comparison of N-Glycan Patterns
33332018-02-14Roland Wagner
CHO
● Complex type N-glycans with α-
linked galactose and fucose
residues.
● Very homogeneous.
● Only biantennary asialo N-glycans.
● In vitro sialylation possible.
GlcNAc Man Gal SA Fuc
Leishmania

Next Challenges Just Around the Corner
342017-10-13Roland Wagner
● Drug Safety and Potency
o Quality control
o ADC
● Processes for Gene & Cell Therapeutics
o Viral vectors
o Cells as products
● Artificial Cells
o Cell specific productivity
o Stable cell lines for continuous processing
● Process Intensification
o Highly concentrated media and feeds
o Harvest process


![Recent hydrologic change in a Colorado alpine basin: an indicator of permafrost thaw? [Nel Caine]](https://img.dokumen.tips/doc/110x75/559833be1a28ab007a8b4693/recent-hydrologic-change-in-a-colorado-alpine-basin-an-indicator-of-permafrost-thaw-nel-caine.jpg)