Embed Size (px)
Citation preview

SOCI
AL
SCIE
NCE
S
Generalizability of heterogeneous treatment effectestimates across samplesAlexander Coppocka,1,2, Thomas J. Leeperb,1, and Kevin J. Mullinixc,1
aDepartment of Political Science, Yale University, New Haven, CT 06520; bDepartment of Government, London School of Economics and Political Science,London WC2A 2AE, United Kingdom; and cDepartment of Political Science, University of Kansas, Lawrence, KS 66045
Edited by Roderick Little, University of Michigan, and accepted by Editorial Board Member Adrian E. Raftery October 17, 2018 (received for review May 10,2018)
The extent to which survey experiments conducted with non-representative convenience samples are generalizable to tar-get populations depends critically on the degree of treatmenteffect heterogeneity. Recent inquiries have found a strongcorrespondence between sample average treatment effects esti-mated in nationally representative experiments and in replica-tion studies conducted with convenience samples. We considerhere two possible explanations: low levels of effect hetero-geneity or high levels of effect heterogeneity that are unre-lated to selection into the convenience sample. We analyzesubgroup conditional average treatment effects using 27 original–replication study pairs (encompassing 101,745 individual surveyresponses) to assess the extent to which subgroup effect esti-mates generalize. While there are exceptions, the overwhelmingpattern that emerges is one of treatment effect homogeneity,providing a partial explanation for strong correspondence acrossboth unconditional and conditional average treatment effectestimates.
experiments | generalizability | external validity | replication
Randomized experiments are increasingly used across thesocial sciences to study beliefs, opinions, and behavioral
intentions (1, 2). Experiments are nevertheless sometimes metwith skepticism about the degree to which results generalize(3). Indeed, it is often said that experiments achieve betterinternal validity than they do external validity because of the non-representative samples typically used in experimental research(e.g., refs. 4–6, though see ref. 7 for a critique of the claimedexternal validity of some nonexperimental regression estimates).In response, a series of scholars have developed methods fortransporting experimental results obtained on a sample to tar-get populations (8–11), typically by adjusting for factors thatdetermine sample selection, treatment effect heterogeneity, orboth.
Despite tremendous methodological progress in this area, thesocial scientific community has generated only limited theoryand evidence to guide expectations about when a conveniencesample and a target population are sufficiently similar to jus-tify generalizing from one to the other. Sometimes demographicdifferences between, say, a student sample and the national pop-ulation are taken as prima facie evidence that results obtainedon the student sample are unlikely to generalize. By contrast,several recent empirical studies suggest that convenience sam-ples, despite drastic demographic differences, frequently yieldaverage treatment effect estimates that are not substantially dif-ferent from those obtained through nationally representativesamples (12–15).
Such findings suggest that even in the face of differences insample composition, claims of strong external validity are some-times justified. What could explain the rough equivalence ofsample average treatment effects (SATEs) across such differ-ent samples? We consider two possibilities: (A) effect homo-geneity across participants such that sample characteristics areirrelevant, or (B) effect heterogeneity that is approximately
orthogonal to selection. Arbitrating between these explanationsis critical to predicting whether future experiments are likely togeneralize.
Methods and MaterialsWe aim to distinguish between scenarios A and B through reanalyses of 27original–replication pairs collected by refs. 12 and 13. This set of studiesis useful because it constitutes a unique sample of original studies con-ducted on nationally representative samples and replications performed onconvenience samples [namely, Amazon Mechanical Turk (MTurk)] using iden-tical experimental protocols. Both papers focused narrowly on replication asassessed by the correspondence between SATEs in each study pair, both find-ing a high degree of correspondence. Our goal here is to assess the degreeof correspondence of conditional average treatment effect (CATE) estimatesamong 16 distinct subgroups defined by subjects’ pretreatment backgroundcharacteristics.
We estimate all CATEs via difference-in-means. Our main statistic of inter-est is the slope of the original estimate with respect to the replicationestimate, corrected for measurement error via a generalized Deming regres-sion (16, 17). Deming regression (an errors-in-variables model) is appropriatebecause both the original and replication CATEs are estimated with error,itself estimated via the SE of the CATEs. We calculate 95% confidence inter-vals (CIs) around our slope estimates using the jackknife (17). We reportseparate slopes for each study (within-study slopes) and demographic group(across-study slopes).
For readers unfamiliar with these sample platforms, MTurk provides non-probability, fully opt-in samples of participants who complete online tasksfor financial compensation. Many studies find that MTurk workers gener-ate high-quality survey data (18, 19). The original studies rely mostly uponsamples provided by Time-Sharing Experiments for the Social Sciences (TESS)that are obtained from GfK’s KnowledgePanel. KnowledgePanel panelistsare recruited using probability-based random-digit dialing or address-basedsampling methods and provided internet access if they do not have it. Pan-elists are then sampled using standard sampling methods. GfK/TESS differsfrom other online samples like MTurk in that it relies upon probability-based
Significance
In experiments, the degree to which results generalize toother populations depends critically on the degree of treat-ment effect heterogeneity. We replicated 27 survey exper-iments (encompassing 101,745 individual survey responses)originally conducted on nationally representative samplesusing online convenience samples, finding very high corre-spondence despite obvious differences in sample composition.We contend this pattern is due to low treatment effect het-erogeneity in these types of standard social science surveyexperiments.
Author contributions: A.C., T.J.L., and K.J.M. designed research, performed research,analyzed data, and wrote the paper.y
The authors declare no conflict of interest.y
This article is a PNAS Direct Submission. R.L. is a guest editor invited by the EditorialBoard.y
Published under the PNAS license.y1 A.C., T.J.L., and K.J.M. contributed equally to this work.y2 To whom correspondence should be addressed. Email: [email protected]
Published online November 16, 2018.
www.pnas.org/cgi/doi/10.1073/pnas.1808083115 PNAS | December 4, 2018 | vol. 115 | no. 49 | 12441–12446
Dow
nloa
ded
by g
uest
on
Janu
ary
26, 2
022

Table 1. Within-study correspondence of CATEs
Study Original N Mturk N Slope (SE) 95% CI N comparisons Joint F test P value Ref.
Bergan (2012) 1206 1913 0.75 (0.20) [0.37, 1.12] 16 0.09 24Brader (2005) 280 1709 3.56 (1.68) [−30.74, 37.86] 12 0.69 25Brandt (2013) 1225 3131 4.49 (1.96) [−6.25, 15.23] 13 0.20 26Caprariello (2013) 825 2729 −4.38 (2.00) [−7.83, −0.93] 16 0.63 27Chong and Druckman (2010) 958 1400 0.17 (0.18) [−0.58, 0.92] 13 0.61 28Craig and Richeson (2014) 608 847 −0.95 (0.36) [−1.56, −0.34] 16 0.24 29Denny (2012) 1733 1913 2.83 (1.04) [1.19, 4.47] 16 0.59 30Epley et al. (2009) 1019 1913 0.68 (0.64) [−2.52, 3.88] 10 0.14 31Flavin (2011) 2015 2729 0.23 (0.20) [−0.15, 0.62] 16 0.06 32Gash and Murakami (2009) 1022 3131 2.78 (1.01) [1.59, 3.96] 16 0.73 33Hiscox (2006) 1610 2972 2.5 (1.07) [0.94, 4.07] 16 0.96 34Hopkins and Mummolo (2017) 3266 2972 −1.84 (0.85) [−4.06, 0.37] 16 0.27 35Jacobsen, Snyder, and Saultz (2014) 1111 3171 −4.73 (1.99) [−8.32, −1.14] 16 0.09 36Johnston and Ballard (2016) 2045 2985 0.13 (0.53) [−0.26, 0.53] 16 0.06 37Levendusky and Malhotra (2015) 1053 1987 −0.16 (0.35) [−1.50, 1.19] 16 0.01 38McGinty, Webster, and Barry (2013) 2935 2985 2.53 (1.10) [1.09, 3.97] 16 0.72 39Murtagh et al. (2012) 2112 3131 0.34 (0.34) [−0.20, 0.88] 10 0.98 40Nicholson (2012) 781 1099 −23.05 (16.21) [−396.69, 350.58] 12 0.94 41Parmer (2011) 521 3277 1.71 (0.75) [−0.12, 3.54] 16 0.61 42Pedulla (2014) 1407 1913 −57.93 (17.90) [−363.42, 247.55] 15 0.73 43Peffley and Hurwitz (2007) 905 1285 2.23 (1.17) [−1.08, 5.54] 13 0.19 44Piazza (2015) 1135 3171 −2.15 (0.74) [−3.83, −0.47] 16 0.81 45Shafer (2017) 2592 2729 −24.13 (9.75) [−162.31, 114.05] 16 0.49 46Thompson and Schlehofer (2014) 591 3277 0.24 (0.60) [−1.08, 1.56] 16 0.68 47Transue (2007) 345 367 −1.67 (1.02) [−7.52, 4.17] 7 0.29 48Turaga (2010) 774 3277 1.44 (0.54) [−0.86, 3.74] 16 0.73 49Wallace (2011) 2929 2729 4.74 (1.86) [−7.96, 17.43] 16 0.00 50
Slopes are estimated via Deming regression with unequal (estimated) variances, and the 95% CIs are estimated via the jackknife. The P values in the lastcolumn are derived from a joint F test against the null of no differences in heterogeneity by sample.
sampling methods through panel construction and is designed to providepanelists that are representative of the US adult population.
Because of the varied experimental protocols for each of the 54 sep-arate experiments (27 study pairs) reanalyzed here, the largest challengewe face is measuring subject characteristics in an identical manner acrossexperiments. While some studies measure a rich set of demographic, psy-chological, and political attributes, others only measure a few. We haveidentified six attributes that are measured in nearly all studies. Theseattributes are not always measured in the same way, so we have coars-ened each to a maximum of three categories to maintain comparabilityacross studies: age (18 to 39, 40 to 59, 60+), education (less than college, col-lege, graduate school), gender (men, women), ideology (liberal, moderate,conservative), partisanship (Democrat, Independent, Republican), and race(nonwhite, white). We acknowledge that our covariate measures are roughand that many subtleties of scientific interest will unfortunately be masked.In particular, we regret the extreme coarsening of race and ethnicity intononwhite/white, but smaller divisions left us with far too little data insome cases.
A complete description of each experiment and replication proceduresare available in the original papers and their supplementary materials (12,13). The full list of studies, with the sample sizes used in the analysesreported here, is presented in Table 1. An examination of the discipline ofthe first, original study author reveals that our replication studies encom-pass political science, psychology, public health, communication, business,sociology, law, education, and public policy. By and large, these experi-ments estimate the effects of stimuli on social and political attitudes andare broadly representative of the sorts of persuasion, attitude-formation,and decision-making studies that are common in social science experiments.They do not include experiments used primarily for measurement, such asconjoint or list experiments.
ResultsFig. 1 displays scatterplots of the estimated CATEs subgroupby subgroup. The relationship between the conditional averagetreatments in the original and MTurk versions of the studies isunequivocally positive for all demographic subgroups. Whereas
previous analyses of these datasets showed strong correspon-dence of average treatment effects, this analysis shows that thesame pattern holds at every level of age, gender, race, education,ideology, and partisanship that we measure.
The figure also indicates whether the CATEs are statisticallysignificantly different from each other.∗ Out of 393 opportuni-ties, the difference-in-CATEs is significant 59 times, or 15% ofthe time. In 0 of 393 opportunities do the CATEs have differentsigns while both being statistically distinguishable from 0. Thereis also a close correspondence of significance tests for CATEsacross study pairs. Of the 156 CATEs that were significantlydifferent from no effect in the original, 118 are significantlydifferent from no effect in the MTurk replication. Of the 237CATEs that were statistically indistinguishable from no effect inthe original, 158 were statistically indistinguishable from 0 in theMTurk version.
The overall “significance match” rate is therefore 70%. Wemust be careful, however, not to overinterpret conclusions basedon this statistic, as it is confounded by the power of the stud-ies. If the studies were infinitely powered, all estimates of non-0CATEs in both versions of the study would be statistically signif-icant, and therefore, the match rate would be 100%. By contrast,if all studies were severely underpowered, almost all estimateswould be nonsignificant, again implying a match rate of 100%.We therefore prefer evaluating correspondence across studiesbased on (error-corrected) regression slopes, since they directly
*For each sample, we estimate uncertainty under a finite population model using HC2robust standard errors (20). This approach does not account for the uncertainty associ-ated with imagining that Mechanical Turk respondents are sampled as a cluster froma larger population. We estimate the standard error of the difference-in-CATEs as√
SE12+ SE2
2and conduct hypothesis tests under a normal approximation. We deem
a difference statistically significant if the P value is less than 0.05.
12442 | www.pnas.org/cgi/doi/10.1073/pnas.1808083115 Coppock et al.
Dow
nloa
ded
by g
uest
on
Janu
ary
26, 2
022

SOCI
AL
SCIE
NCE
S
Age: More than 60 Graduate School Conservative Republican
Age: 40 − 59 College Women Moderate Independent White
Age: 18 − 39 Less than College Men Liberal Democrat Nonwhite
−1 0 1 −1 0 1 −1 0 1 −1 0 1 −1 0 1 −1 0 1
−1
0
1
−1
0
1
−1
0
1
Mechanical Turk Version Standardized Estimate
Orig
inal
Ver
sion
Sta
ndar
dize
d E
stim
ate
Difference in CATES Significant Not Significant
Fig. 1. Across-study correspondence of CATEs.
operate on the estimates themselves rather than on arbitrarysignificance levels.
The estimated slopes across CATEs are shown in Table 2. Theslopes are all positive, ranging from 0.71 to 1.01. A true slopeof 1 would indicate perfect correspondence of original and repli-cation CATEs within demographic subgroups. All but one of the95% CIs include 1, but the intervals are sometimes quite wide, sowe resist “accepting the null” of perfect correspondence. The CIfor the conservative group (just barely) excludes 1, which alignswith a common belief that conservatives on MTurk are especiallyidiosyncratic, though this view is challenged in ref. 21. Overall, weconclude that in this set of studies, the estimated CATEs withindemographic subgroups are quite similar.
We now have two basic findings to explain: Average treatmenteffects are approximately the same in probability and nonprob-ability samples and so are CATEs. Which of our explanations(no heterogeneity or heterogeneity orthogonal to selection) canaccount for both findings?
To arbitrate between these explanations, we turn to within-study comparisons. Within a given study, we ask, are the CATEsthat were estimated to be high in the original study also highin the MTurk version? Fig. 2 shows that the answer tends tobe no. The CATEs in the original study are mostly uncorre-lated with the CATEs in the MTurk versions. Table 1 confirmswhat the visual analysis suggests. We see within-study slopesthat are smaller than the across-study slopes and slopes ofboth signs.
An inspection of the CATEs themselves reveals why. Most ofthe CATEs are tightly clustered around the overall average treat-ment effect in each study version. Put differently, the treatmenteffects within each study version appear to be mostly homo-geneous. We conclude from this preliminary analysis that the
main reason why we observe strong correspondence in averagetreatment effects is low treatment effect heterogeneity.
Table 1 also presents the P values from joint hypothesis testsagainst the null hypothesis of no differences in treatment effectheterogeneity by sample. We conduct the test by obtaining the Fstatistic from a comparison of two nested models. The first modelis ordinary least squares regression of the outcome on treatment,a sample indicator, covariates, and complete sets of interactionsbetween treatment and covariates and the sample indicator and
Table 2. Across-study correspondence of CATEs
Covariate class Slope (SE) 95% CI N comparisons
Age: 18 to 39 0.82 (0.08) [0.51, 1.12] 27Age: 40 to 59 0.86 (0.08) [0.55, 1.17] 27Age: more than 60 0.95 (0.13) [0.61, 1.29] 26Less than college 0.93 (0.06) [0.61, 1.25] 26College 0.87 (0.10) [0.46, 1.29] 26Graduate school 0.72 (0.13) [0.28, 1.15] 26Men 0.87 (0.07) [0.49, 1.25] 26Women 0.91 (0.07) [0.61, 1.20] 26Liberal 0.71 (0.11) [0.37, 1.05] 20Moderate 1.01 (0.11) [0.49, 1.53] 20Conservative 0.75 (0.09) [0.52, 0.99] 20Democrat 0.88 (0.07) [0.50, 1.26] 24Independent 0.94 (0.16) [0.19, 1.68] 23Republican 0.86 (0.08) [0.63, 1.08] 24Nonwhite 0.95 (0.11) [0.45, 1.46] 25White 0.92 (0.06) [0.66, 1.18] 27
Slopes are estimated via Deming regression with unequal (estimated)variances, and the 95% CIs are estimated via the jackknife.
Coppock et al. PNAS | December 4, 2018 | vol. 115 | no. 49 | 12443
Dow
nloa
ded
by g
uest
on
Janu
ary
26, 2
022
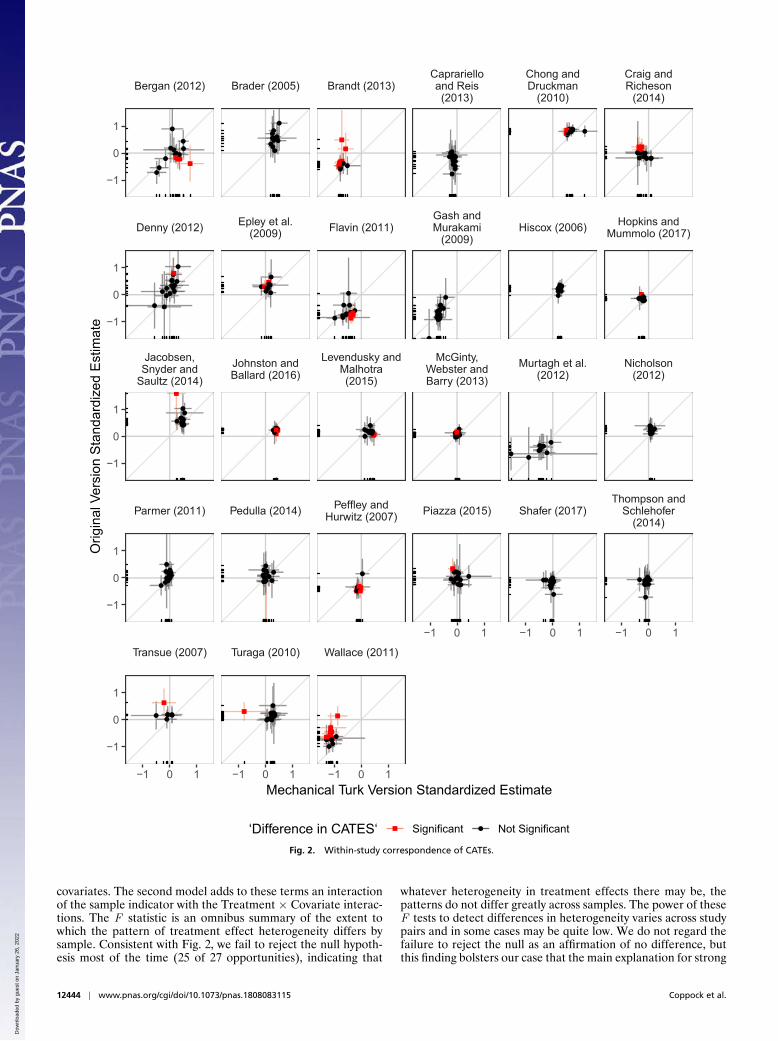
Fig. 2. Within-study correspondence of CATEs.
covariates. The second model adds to these terms an interactionof the sample indicator with the Treatment × Covariate interac-tions. The F statistic is an omnibus summary of the extent towhich the pattern of treatment effect heterogeneity differs bysample. Consistent with Fig. 2, we fail to reject the null hypoth-esis most of the time (25 of 27 opportunities), indicating that
whatever heterogeneity in treatment effects there may be, thepatterns do not differ greatly across samples. The power of theseF tests to detect differences in heterogeneity varies across studypairs and in some cases may be quite low. We do not regard thefailure to reject the null as an affirmation of no difference, butthis finding bolsters our case that the main explanation for strong
12444 | www.pnas.org/cgi/doi/10.1073/pnas.1808083115 Coppock et al.
Dow
nloa
ded
by g
uest
on
Janu
ary
26, 2
022

SOCI
AL
SCIE
NCE
S
correspondence in both SATEs and CATEs is low treatmenteffect heterogeneity.
DiscussionDifferent samples will yield similar SATEs when either (A)treatment effects are mostly homogeneous or (B) any effectheterogeneity is orthogonal to sample selection. Drawing on afine-grained analysis of 27 pairs of survey experiments conductedon representative and nonrepresentative samples and variousmethods of assessing the pattern of effect heterogeneity in eachstudy, we have shown that effect heterogeneity is typically lim-ited, so we conclude that treatment effect homogeneity is the bestexplanation for the correspondence of SATEs across samples.
As a result, the convenience samples we analyze provide use-ful estimates not only of the PATE but also of subgroup CATEs.The reason for this is that there appears to be little effectheterogeneity— as seen in the tight clustering of CATEs in eachpanel of Fig. 2. Lacking such heterogeneity, any subgroup pro-vides a reasonable estimate of not only the CATE but the PATEas well. In cases where some heterogeneity appears to be present,CATEs in each study pair rarely differ substantially from oneanother. Our results indicate that even descriptively unrepresen-tative samples constructed with no design-based justification forgeneralizability still tend to produce useful estimates not just ofthe SATE but also of subgroup CATEs that generalize quite well.
Important caveats are in order. First, we have not consideredall possible survey experiments, let alone all possible experimentsin other modes or settings. Our pairs of studies were limited tothose conducted in an online mode on samples of US residents.However, this set of studies is also quite comprehensive, drawingfrom multiple social science disciplines, using a variety of exper-imental stimuli and outcome question formats. The studies arealso drawn not just from published research (which we mightexpect to be subject to publication biases) but from a sample ofexperiments fielded by Time-Sharing Experiments for the SocialSciences.
Second, because we can never perfectly know the variationin treatment effects, our analysis of heterogeneity is limited byboth the set of covariates that are available for direct comparisonbetween samples and any measurement error in those covari-ates. We made several decisions about coarsening of covariates(for example, comparing whites to members of all other racialand ethnic groups) that reflected the need for a minimum levelof measurement precision. Accordingly, our results may maskpossible moderators of treatment effects (though we would notethat the low levels of heterogeneity according to the covariates
we were able to measure lead us to be skeptical of predic-tions of high levels of unmodeled effect heterogeneity). Ourreliance on existing studies as the basis for our empirics is impor-tant because it means that we are evaluating the degree andpattern of effect heterogeneity using the types of samples andset of covariates typically used in survey-experimental research.Additional and more precisely measured covariates might haveallowed for detection of more complex patterns of effectheterogeneity, but survey-experimental research rarely offerssuch detail.
Third, the subgroup samples we analyzed were relatively small.While we may be well-powered to estimate an SATE, these stud-ies were not necessarily designed to detect any particular sourceof effect heterogeneity. Larger sample sizes, oversampling ofrare populations, and more precise measurement of covariateswould have allowed the detection of smaller sized variations ineffect sizes across groups, but researchers rarely have access tolarger samples than those used here. We are confident that largersample sizes would turn up strong evidence that the pattern ofheterogeneity differs across samples. We would argue, however,that the need for such large samples indicates that whatever thedifferences may be, they are not large.
Finally, this discussion of generalizability has been focusedexclusively on who the subjects (or units) of the experiments areand how their responses to treatment may or may not vary. The“UTOS” framework (5, 22) identifies four dimensions of externalvalidity: units, treatments, outcomes, and setting. In our study,we hold treatments, outcomes, and setting constant by design.We ask “What happens if we run the same experiment on dif-ferent people?” but not “Are the causal processes studied in theexperiments the ones we care about outside the experiments?”This second question is clearly of great importance but is not onewe address here.
Perhaps the most controversial conclusion that could be drawnfrom the present research is that we should be more suspectof extant claims of effect moderation. A common post hocdata analysis procedure is to examine whether subgroups differin their apparent response to treatment. We find only limitedevidence that such moderation occurs and, when it does, the dif-ferences in effect sizes across groups are small. The response tothis evidence should not be that any convenience sample canbe used to study any treatment without concern about general-izability (23) but rather that debates about generalizability andreplication must focus on the underlying causes of replicationand nonreplication, among these most importantly the variationin treatment effects across experimental units.
1. Druckman JN, Green DP, Kuklinski JH, Arthur L (2006) The growth and developmentof experimental research in political science. Am Polit Sci Rev 100:627–635.
2. Druckman JN, Green DP, Kuklinski JH, Arthur L (2011) Cambridge Handbook ofExperimental Political Science (Cambridge Univ Press, New York).
3. Gerring J (2012) Social Science Methodology: A Unified Framework (Cambridge UnivPress, New York).
4. Sears DO (1986) College sophomores in the laboratory: Influences of a narrow database on social psychology’s view of human nature. J Personal Soc Psychol 51:515–530.
5. Cronbach LJ (1986) Social inquiry by and for earthlings. Metatheory in Social Sci-ence: Pluralisms and Subjectivities, eds Fiske DW, Shweder RA (Univ of Chicago Press,Chicago), pp 83–107.
6. McDermott R (2011) New directions for experimental work in international relations.Int Stud Q 55:503–520.
7. Aronow PM, Samii C (2015) Does regression produce representative estimates ofcausal effects? Am J Polit Sci 60:250–267.
8. Cole SR, Stuart EA (2010) Generalizing evidence from randomized clinical trials totarget populations: The ACTG 320 trial. Am J Epidemiol 172:107–115.
9. Hartman E, Grieve R, Ramsahai R, Sekhon JS (2015) From sample average treatmenteffect to population average treatment effect on the treated: Combining experimen-tal with observational studies to estimate population treatment effects. J R Stat SocSer A Stat Soc 178:757–778.
10. Kern HL, Stuart EA, Hill J, Green DP (2016) Assessing methods for generalizingexperimental impact estimates to target populations. J Res Educ Eff 9:103–127.
11. Nguyen TQ, Ebnesajjad C, Cole SR, Stuart EA (2017) Sensitivity analysis for an unob-served moderator in RCT-to-target-population generalization of treatment effects.Ann Appl Stat 11:225–247.
12. Mullinix KJ, Leeper TJ, Druckman JN, Freese J (2015) The generalizability of surveyexperiments. J Exp Polit Sci 2:109–138.
13. Coppock A, Generalizing from survey experiments conducted on Mechanical Turk: Areplication approach. Polit Sci Res Methods, 10.1017/psrm.2018.10.
14. Krupnikov Y, Levine AS (1 2014) Cross-sample comparisons and external validity. J ExpPolit Sci 1:59–80.
15. Weinberg JD, Freese J, McElhattan D (2014) Comparing data characteristicsand results of an online factorial survey between a population-based and acrowdsource-recruited sample. Sociol Sci 1:292–310.
16. Deming WE (1943) Statistical Adjustment of Data (Wiley, Oxford, UK).17. Linnet K (1993) Evaluation of regression procedures for methods comparison studies.
Clin Chem 39:424–432.18. Buhrmester MD, Talaifar S, Gosling SD (2018) An evaluation of Amazon’s Mechanical
Turk, its rapid rise, and its effective use. Perspect Psychol Sci 13:149–154.19. Paolacci G, Chandler J (2014) Inside the Turk: Understanding Mechanical Turk as a
participant pool. Curr Dir Psychol Sci 23:184–188.20. Samii C, Aronow PM (2012) On equivalencies between design-based and regression-
based variance estimators for randomized experiments. Stat Probab Lett 82:365–370.
21. Clifford S, Jewell RM, Waggoner PD (2015) Are samples drawn from Mechanical Turkvalid for research on political ideology? Res Polit 2:2053168015622072.
Coppock et al. PNAS | December 4, 2018 | vol. 115 | no. 49 | 12445
Dow
nloa
ded
by g
uest
on
Janu
ary
26, 2
022

22. Coppock A, Green DP (2015) Assessing the correspondence between experimentalresults obtained in the lab and field: A review of recent social science research. PolitSci Res Methods 3:113–131.
23. Deaton A, Cartwright N (2017) Understanding and misunderstanding randomizedcontrolled trials. Social Science and Medicine 210:2–21.
24. Bergan D (2012) The flexible correction model and party labels. Time-SharingExperiments for the Social Sciences. Available at www.tessexperiments.org/data/bergan208.html. Accessed November 9, 2018.
25. Brader T (2005) Striking a responsive chord: How political ads motivate and persuadevoters by appealing to emotions. Am J Pol Sci 49:388–405.
26. Brandt MJ (2013) Onset and offset deservingness: The case of home foreclosures. PolitPsychol 34:221–238.
27. Caprariello PA, Reis HT (2013) To do, to have, or to share? Valuing experiencesover material possessions depends on the involvement of others. J Pers Soc Psychol104:199–215.
28. Chong D, Druckman JN (2010) Dynamic public opinion: Communication effects overtime. Am Pol Sci Rev 104:663–680.
29. Craig MA, Richeson JA (2014) More diverse yet less tolerant? How the increasinglydiverse racial landscape affects white Americans’ racial attitudes. Personality andSocial Psychology Bulletin 40:750–761.
30. Denny K (2012) Examining the ‘raced’ fatherhood premium: Workplace evaluations ofmen by race, fatherhood status, and level of involvement. Time-Sharing Experimentsfor the Social Sciences. Available at www.tessexperiments.org/data/denny262.html.Accessed November 9, 2018.
31. Epley N, Converse BA, Delbosc A, Monteleone GA, Cacioppo JT (2009) Believers’ esti-mates of god’s beliefs are more egocentric than estimates of other people’s beliefs.Proc Natl Acad Sci USA 106:21533–21538.
32. Flavin PJ (2011) Public attitudes about political equality. Time-Sharing Experimentsfor the Social Sciences. Available at www.tessexperiments.org/data/flavin235.html.Accessed November 9, 2018.
33. Gash A, Murakami M (2009) Understanding how policy venue influences pub-lic opinion. Time-Sharing Experiments for the Social Sciences. Available at www.tessexperiments.org/data/gash&murakami718.html. Accessed November 9, 2018.
34. Hiscox MJ (2006) Through a glass and darkly: Attitudes toward international tradeand the curious effects of issue framing. Int Organ 60:755–780.
35. Hopkins DJ, Mummolo J (2017) Assessing the breadth of framing effects. QuarterlyJournal of Political Science 12:37–57.
36. Jacobsen R, Snyder JW, Saultz A (2014) Informing or shaping public opinion? Theinfluence of school accountability data format on public perceptions of school quality.American Journal of Education 121:1–27.
37. Johnston CD, Ballard AO (2016) Economists and public opinion: Expert consensus andeconomic policy judgments. J Polit 78:443–456.
38. Levendusky M, Malhotra N (2015) Does media coverage of partisan polarizationaffect political attitudes? Polit Commun 33:283–301.
39. McGinty EE, Webster DW, Barry CL (2013) Effects of news media messages about massshootings on attitudes toward persons with serious mental illness and public supportfor gun control policies. Am J Psychiatry 170:494–501.
40. Murtagh L, Gallagher TH, Andrew P, Mello MM (2012) Disclosure-and-resolution pro-grams that include generous compensation offers may prompt a complex patientresponse. Health Aff 31:2681–2689.
41. Nicholson SP (2012) Polarizing cues. Am J Pol Sci 56:52–66.42. Parmer J (2011) Smallpox vaccine recommendations: Is trust a shot in the arm? PhD
Dissertation (University of Georgia, Athens, GA).43. Pedulla DS (2014) The positive consequences of negative stereotypes: Race,
sexual orientation, and the job application process. Soc Psychol Q 77:75–94.
44. Peffley M, Hurwitz J (2007) Persuasion and resistance: Race and the death penalty inAmerica. Am J Pol Sci 51:996–1012.
45. Piazza JA (2015) Terrorist suspect religious identity and public support for harshinterrogation and detention practices. Polit Psychol 36:667–690.
46. Shafer EF (2017) Hillary Rodham versus Hillary Clinton: Consequences of surnamechoice in marriage. Gender Issues 34:316–332.
47. Thompson SC, Schlehofer MM (2014) Undermining optimistic denial reactions todomestic and campus emergency warning messages. Appl Psychol Health Well Being2:19–213.
48. Transue JE (2007) Identity salience, identity acceptance, and racial policy atti-tudes: American national identity as a uniting force. Am J Pol Sci 51:78–91.
49. Turaga M (2010) Environmental values, beliefs, and behavior. Time-SharingExperiments for the Social Sciences. Available at www.tessexperiments.org/data/turaga789.html. Accessed November 9, 2018.
50. Wallace GP (2011) The reputational consequences of international law and com-pliance. Time-Sharing Experiments for the Social Sciences. Available at www.tessexperiments.org/data/wallace187.html. Accessed November 9, 2018.
12446 | www.pnas.org/cgi/doi/10.1073/pnas.1808083115 Coppock et al.
Dow
nloa
ded
by g
uest
on
Janu
ary
26, 2
022