Embed Size (px)
Citation preview
w
Economic andFinancial Aff airs
GENERAL GOVERNMENT DATA
PART I: Tables by country
AUTUMN 2013
General Government Revenue, Expenditure, Balances and Gross Debt
EUROPEAN COMMISSION DIRECTORATE GENERAL ECFIN ECONOMIC AND FINANCIAL AFFAIRS
GENERAL GOVERNMENT DATA
GENERAL GOVERNMENT REVENUE, EXPENDITURE, BALANCES AND GROSS DEBT
PART I: TABLES BY COUNTRY
AUTUMN 2013

X X
X X
EUROPEAN COMMISSION DIRECTORATE GENERAL ECFIN ECONOMIC AND FINANCIAL AFFAIRS
GENERAL GOVERNMENT DATA
GENERAL GOVERNMENT REVENUE, EXPENDITURE, BALANCES AND GROSS DEBT
PART I: TABLES BY COUNTRY
AUTUMN 2013 For inquiries, contact: Cut-off date: 22 October 2013 SPECIAL EDITION for the period up to 1999 A. Avdoulos tel. 32.2.29 933 63 email: [email protected] N. Doyle tel. 32.2.29 934 60 email: [email protected]
1
Foreword GENERAL GOVERNMENT DATA shows the time-series for the general government transactions and balances that the Commission Services use for the monitoring of the Member States’ budgetary situations. Government accounts (transactions and balances) and debt figures up to 2012 have been compiled and reported to the Commission by the national statistical offices and checked by Eurostat. Figures for 2013 - 2015 are forecasts by the Commission Services (Directorate General Economic and Financial Affairs) in autumn 2013.
GENERAL GOVERNMENT DATA is organised in two parts. Part I shows, for each Member State, the figures of the government revenue and expenditure account. The methodological reference is the European System of National and Regional Accounts (ESA 95), which is, since mid-1999, the reference for the compilation of national accounts within the European Union. From 2000 on, ESA 95 figures are also the reference for the budgetary surveillance in Europe.
In Part II, each table covers one specific transaction and shows the time-series for the individual Member States, for the euro area and the European Union as a whole. Tables are presented according to the ESA 95 system (depending on data availability). The government debt from 1996 onwards is defined by reference to ESA 95.
GENERAL GOVERNMENT DATA is produced twice a year in connection with the publication of the Commission Services’ economic forecasts. It is also available in an electronic form.
2
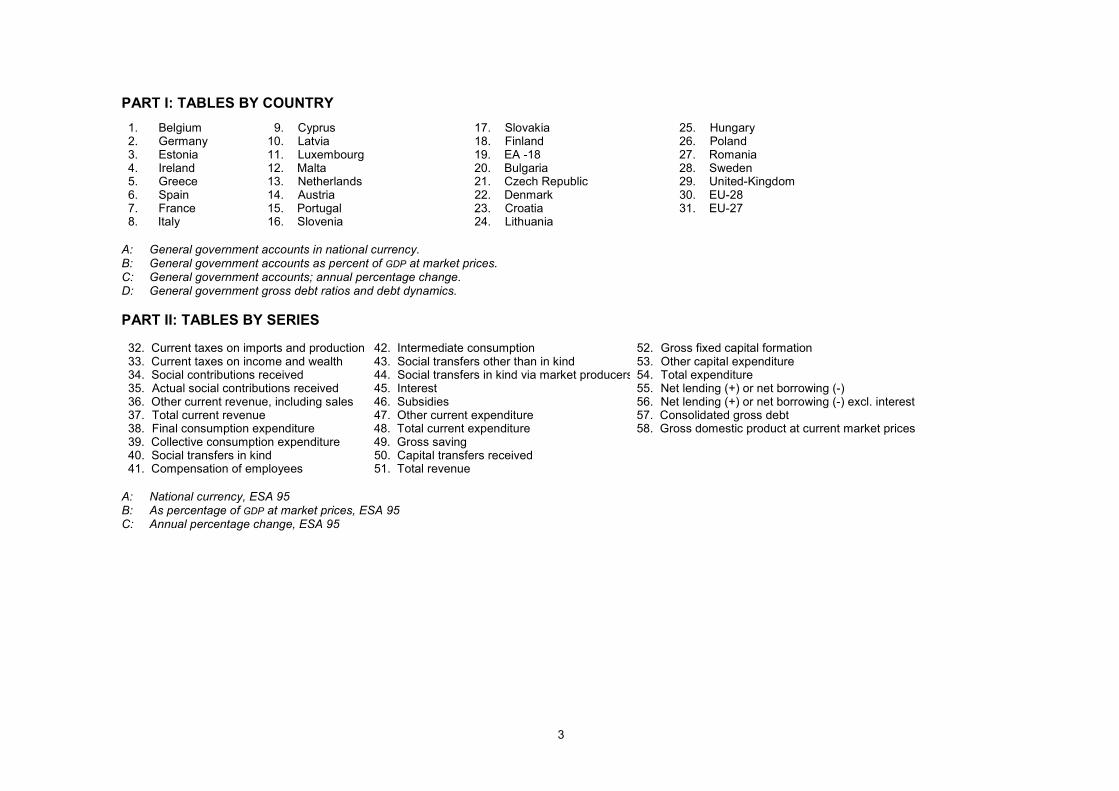
PART I: TABLES BY COUNTRY 1. Belgium 09. Cyprus 17. Slovakia 25. Hungary2. Germany 10. Latvia 18. Finland 26. Poland3. Estonia 11. Luxembourg 19. EA -18 27. Romania4. Ireland 12. Malta 20. Bulgaria 28. Sweden5. Greece 13. Netherlands 21. Czech Republic 29. United-Kingdom6. Spain 14. Austria 22. Denmark 30. EU-287. France 15. Portugal 23. Croatia 31. EU-278. Italy 16. Slovenia 24. Lithuania
A: General government accounts in national currency. B: General government accounts as percent of GDP at market prices. C: General government accounts; annual percentage change. D: General government gross debt ratios and debt dynamics. PART II: TABLES BY SERIES 32. Current taxes on imports and production 42. Intermediate consumption 52. Gross fixed capital formation33. Current taxes on income and wealth 43. Social transfers other than in kind 53. Other capital expenditure34. Social contributions received 44. Social transfers in kind via market producers 54. Total expenditure35. Actual social contributions received 45. Interest 55. Net lending (+) or net borrowing (-)36. Other current revenue, including sales 46. Subsidies 56. Net lending (+) or net borrowing (-) excl. interest37. Total current revenue 47. Other current expenditure 57. Consolidated gross debt38. Final consumption expenditure 48. Total current expenditure 58. Gross domestic product at current market prices39. Collective consumption expenditure 49. Gross saving 40. Social transfers in kind 50. Capital transfers received 41. Compensation of employees 51. Total revenue
A: National currency, ESA 95 B: As percentage of GDP at market prices, ESA 95 C: Annual percentage change, ESA 95
3
NOTES 7
TABLE 1A BELGIUM 14TABLE 1B BELGIUM 15TABLE 2A GERMANY 16TABLE 2B GERMANY 17TABLE 3A ESTONIA 18TABLE 3B ESTONIA 19TABLE 4A IRELAND 20TABLE 4B IRELAND 21TABLE 5A GREECE 22TABLE 5B GREECE 23TABLE 6A SPAIN 24TABLE 6B SPAIN 25TABLE 7A FRANCE 26TABLE 7B FRANCE 27TABLE 8A ITALY 28TABLE 8B ITALY 29TABLE 9A CYPRUS 30TABLE 9B CYPRUS 31TABLE 10A LATVIA 32TABLE 10B LATVIA 33TABLE 11A LUXEMBOURG 34TABLE 11B LUXEMBOURG 35TABLE 12A MALTA 36TABLE 12B MALTA 37TABLE 13A NETHERLANDS 38TABLE 13B NETHERLANDS 39TABLE 14A AUSTRIA 40TABLE 14B AUSTRIA 41TABLE 15A PORTUGAL 42TABLE 15B PORTUGAL 43TABLE 16A SLOVENIA 44TABLE 16B SLOVENIA 45TABLE 17A SLOVAKIA 46TABLE 17B SLOVAKIA 47TABLE 18A FINLAND 48TABLE 18B FINLAND 49TABLE 19A EA-18 50TABLE 19B EA-18 51TABLE 20A BULGARIA 52TABLE 20B BULGARIA 53TABLE 21A CZECH REPUBLIC 54
………………………………………………………………………………………
………………………………………………………………………………………
………………………………………………………………………………………………………………………………………………………………………………………………………………………………………………………………………
………………………………………………………………………………………………………………………………………………………………………………………………………………………………………………………………………………………………………………………………………………………………
……………………………………………………………………………………
………………………………………………………………………………………………………………………………………………………………………………………………………………………………………………………………………
………………………………………………………………………………………………………………………………………………………………………………………………………………………………………………………………………
………………………………………………………………………………………………………………………………………………………………………………
………………………………………………………………………………………
………………………………………………………………………………………………………………………………………………………………………………
………………………………………………………………………………………………………………………………………………………………………………………………………………………………………………………………………………………………………………………………………………………………
………………………………………………………………………………………………………………………………………………………………………………………………………………………………………………………………………………………………………………………………………………………………
………………………………………………………………………………………………………………………………………………………………………………
………………………………………………………………………………………………………………………………………………………………………………………………………………………………………………………………………
………………………………………………………………………………………………………………………………………………………………………………
………………………………………………………………………………………………………………………………………………………………………………
………………………………………………………………………………………………………………………………………………………………………………………………………………………………………………………………………
………………………………………………………………………………………
4
TABLE 21B CZECH REPUBLIC 55TABLE 22A DENMARK 56TABLE 22B DENMARK 57TABLE 23A CROATIA 58TABLE 23B CROATIA 59TABLE 24A LITHUANIA 60TABLE 24B LITHUANIA 61TABLE 25A HUNGARY 62TABLE 25B HUNGARY 63TABLE 26A POLAND 64TABLE 26B POLAND 65TABLE 27A ROMANIA 66TABLE 27B ROMANIA 67TABLE 28A SWEDEN 68TABLE 28B SWEDEN 69TABLE 29A UNITED KINGDOM 70TABLE 29B UNITED KINGDOM 71TABLE 30A EU-28 72TABLE 30B EU-28 73TABLE 31A EU-27 74TABLE 31B EU-27 75………………………………………………………………………………………
………………………………………………………………………………………
………………………………………………………………………………………………………………………………………………………………………………
………………………………………………………………………………………………………………………………………………………………………………………………………………………………………………………………………
………………………………………………………………………………………………………………………………………………………………………………………………………………………………………………………………………
………………………………………………………………………………………
………………………………………………………………………………………………………………………………………………………………………………………………………………………………………………………………………………………………………………………………………………………………
………………………………………………………………………………………………………………………………………………………………………………………………………………………………………………………………………
………………………………………………………………………………………………………………………………………………………………………………………………………………………………………………………………………
5

6
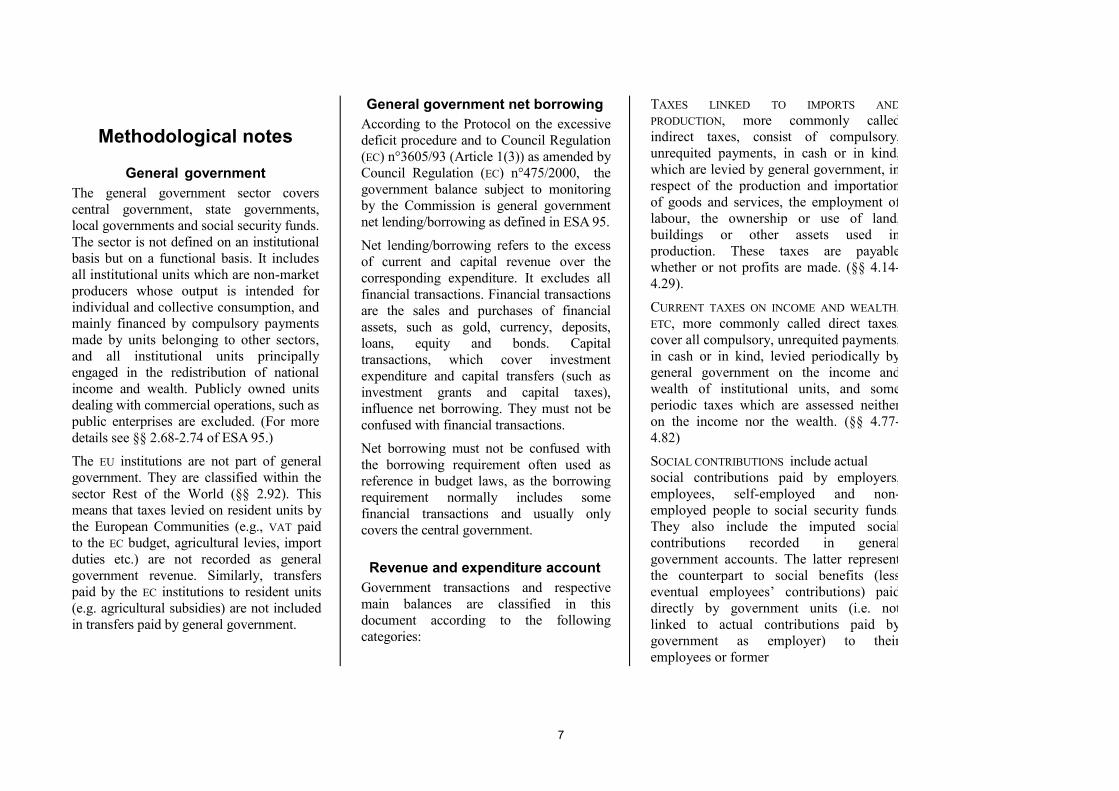
Methodological notes
General government The general government sector covers central government, state governments, local governments and social security funds. The sector is not defined on an institutional basis but on a functional basis. It includes all institutional units which are non-market producers whose output is intended for individual and collective consumption, and mainly financed by compulsory payments made by units belonging to other sectors, and all institutional units principally engaged in the redistribution of national income and wealth. Publicly owned units dealing with commercial operations, such as public enterprises are excluded. (For more details see §§ 2.68-2.74 of ESA 95.)
The EU institutions are not part of general government. They are classified within the sector Rest of the World (§§ 2.92). This means that taxes levied on resident units by the European Communities (e.g., VAT paid to the EC budget, agricultural levies, import duties etc.) are not recorded as general government revenue. Similarly, transfers paid by the EC institutions to resident units (e.g. agricultural subsidies) are not included in transfers paid by general government.
General government net borrowing According to the Protocol on the excessive deficit procedure and to Council Regulation (EC) n°3605/93 (Article 1(3)) as amended by Council Regulation (EC) n°475/2000, the government balance subject to monitoring by the Commission is general government net lending/borrowing as defined in ESA 95.
Net lending/borrowing refers to the excess of current and capital revenue over the corresponding expenditure. It excludes all financial transactions. Financial transactions are the sales and purchases of financial assets, such as gold, currency, deposits, loans, equity and bonds. Capital transactions, which cover investment expenditure and capital transfers (such as investment grants and capital taxes), influence net borrowing. They must not be confused with financial transactions.
Net borrowing must not be confused with the borrowing requirement often used as reference in budget laws, as the borrowing requirement normally includes some financial transactions and usually only covers the central government.
Revenue and expenditure account Government transactions and respective main balances are classified in this document according to the following categories:
TAXES LINKED TO IMPORTS ANDPRODUCTION, more commonly calledindirect taxes, consist of compulsory,unrequited payments, in cash or in kind,which are levied by general government, inrespect of the production and importationof goods and services, the employment oflabour, the ownership or use of land,buildings or other assets used inproduction. These taxes are payablewhether or not profits are made. (§§ 4.14-4.29).
CURRENT TAXES ON INCOME AND WEALTH,ETC, more commonly called direct taxes,cover all compulsory, unrequited payments,in cash or in kind, levied periodically bygeneral government on the income andwealth of institutional units, and someperiodic taxes which are assessed neitheron the income nor the wealth. (§§ 4.77-4.82)
SOCIAL CONTRIBUTIONS include actual social contributions paid by employers,employees, self-employed and non-employed people to social security funds.They also include the imputed socialcontributions recorded in generalgovernment accounts. The latter representthe counterpart to social benefits (lesseventual employees’ contributions) paiddirectly by government units (i.e. notlinked to actual contributions paid bygovernment as employer) to theiremployees or former
7
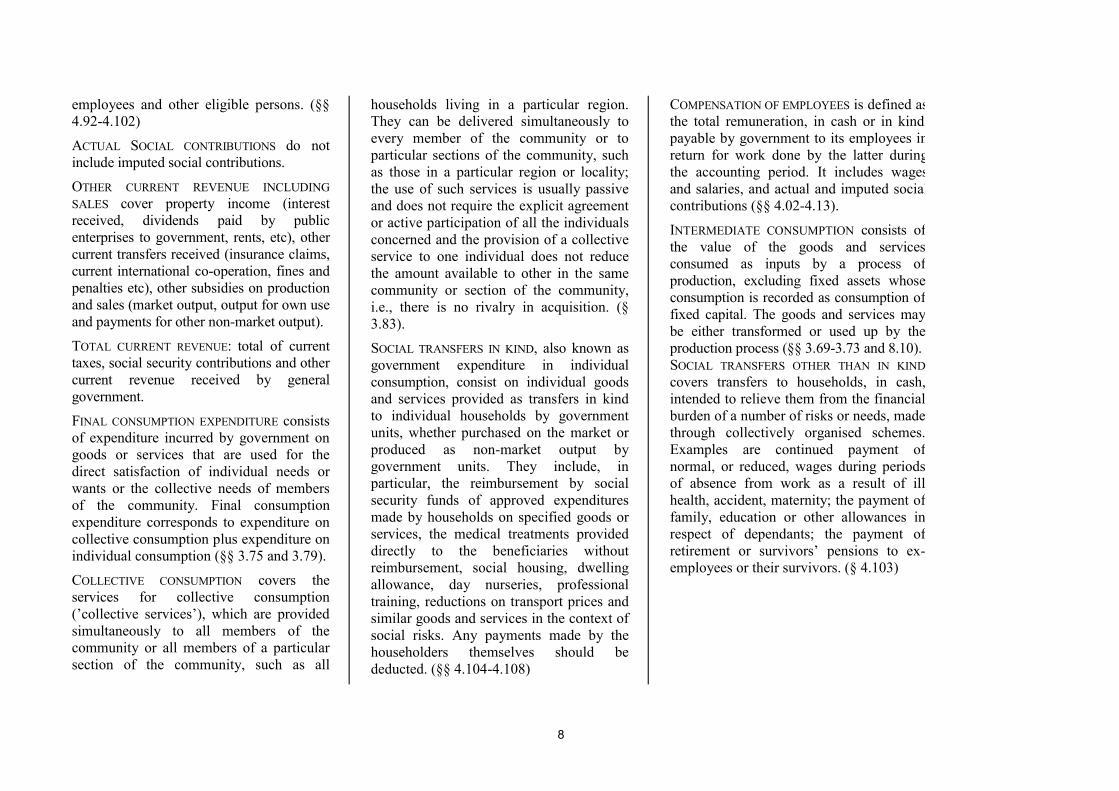
employees and other eligible persons. (§§ 4.92-4.102)
ACTUAL SOCIAL CONTRIBUTIONS do not include imputed social contributions.
OTHER CURRENT REVENUE INCLUDING SALES cover property income (interest received, dividends paid by public enterprises to government, rents, etc), other current transfers received (insurance claims, current international co-operation, fines and penalties etc), other subsidies on production and sales (market output, output for own use and payments for other non-market output).
TOTAL CURRENT REVENUE: total of current taxes, social security contributions and other current revenue received by general government.
FINAL CONSUMPTION EXPENDITURE consists of expenditure incurred by government on goods or services that are used for the direct satisfaction of individual needs or wants or the collective needs of members of the community. Final consumption expenditure corresponds to expenditure on collective consumption plus expenditure on individual consumption (§§ 3.75 and 3.79).
COLLECTIVE CONSUMPTION covers the services for collective consumption (’collective services’), which are provided simultaneously to all members of the community or all members of a particular section of the community, such as all
households living in a particular region. They can be delivered simultaneously to every member of the community or to particular sections of the community, such as those in a particular region or locality; the use of such services is usually passive and does not require the explicit agreement or active participation of all the individuals concerned and the provision of a collective service to one individual does not reduce the amount available to other in the same community or section of the community, i.e., there is no rivalry in acquisition. (§ 3.83).
SOCIAL TRANSFERS IN KIND, also known as government expenditure in individual consumption, consist on individual goods and services provided as transfers in kind to individual households by government units, whether purchased on the market or produced as non-market output by government units. They include, in particular, the reimbursement by social security funds of approved expenditures made by households on specified goods or services, the medical treatments provided directly to the beneficiaries without reimbursement, social housing, dwelling allowance, day nurseries, professional training, reductions on transport prices and similar goods and services in the context of social risks. Any payments made by the householders themselves should be deducted. (§§ 4.104-4.108)
COMPENSATION OF EMPLOYEES is defined asthe total remuneration, in cash or in kind,payable by government to its employees inreturn for work done by the latter duringthe accounting period. It includes wagesand salaries, and actual and imputed socialcontributions (§§ 4.02-4.13).
INTERMEDIATE CONSUMPTION consists ofthe value of the goods and servicesconsumed as inputs by a process ofproduction, excluding fixed assets whoseconsumption is recorded as consumption offixed capital. The goods and services maybe either transformed or used up by theproduction process (§§ 3.69-3.73 and 8.10).SOCIAL TRANSFERS OTHER THAN IN KINDcovers transfers to households, in cash,intended to relieve them from the financialburden of a number of risks or needs, madethrough collectively organised schemes.Examples are continued payment ofnormal, or reduced, wages during periodsof absence from work as a result of illhealth, accident, maternity; the payment offamily, education or other allowances inrespect of dependants; the payment ofretirement or survivors’ pensions to ex-employees or their survivors. (§ 4.103)
8
for the period up to 1999
SOCIAL TRANSFERS IN KIND PROVIDED TO HOUSEHOLDS VIA MARKET PRODUCERS
consist of reimbursement by social security funds of approved expenditures made by households on specified goods or services, of social transfers in kind, except reimbursements, made by social security funds to households and of transfers in kind provided to households by government units or NPISHs that are similar in nature to social security benefits in kind but are not provided in the context of a social insurance scheme. The goods and services are produced by market producers.
INTEREST is the amount that government becomes liable to pay to its creditors over a given period of time without reducing the amount of principal outstanding. Interest is recorded on an accruals basis, that is, interest is recorded as accruing continuously over time to the creditor. (§4.42-4.52).
In the original version of ESA 95, interest flows exchanged between two counterparts under any kind of swaps and under forward rate agreements have been considered as non-financial transactions, recorded under the item interest. In the amended ESA 95 (regulation (EC) N° 2558/2001 of the European Parliament and of the Council) these flows are
recorded as financial transactions. However, in this publication, interest flows under swap contracts and forward rate agreements (FRAs) are included in the item interest, as they are reported by Member States under the excessive deficit procedure (Commission regulation (EC) N° 351/2002).
SUBSIDIES are current unrequited payments which general government makes to resident producers, with the objective of influencing their levels of production, their prices or the remuneration of the factors of production.
OTHER CURRENT EXPENDITURE covers other taxes on production, rents, direct taxes and other current transfers (insurance premia, current international co-operation – including the GNP-based fourth own resource –, voluntary payments to non-profit institutions, etc.). (§§ 4.72-4.76, 4.77-4.82, 4.109-4.140)
TOTAL CURRENT EXPENDITURE covers compensation of employees, intermediate consumption, subsidies, interest, transfers other than transfers in kind, transfers in kind provided to households via market producers and other current expenditure.
GROSS SAVING : balance of current revenue MINUS current expenditure.(§§ 8.36, 8.39, 8.42-8.43)
CAPITAL TRANSFERS RECEIVED coverscapital taxes (inheritance taxes, taxes ongifts inter vivos, occasional andexceptional levies on assets or net worth),investment grants received and othercapital transfers received (e.g., legacies).(§§ 4.145-4.167)
GROSS FIXED CAPITAL FORMATIONincludes net acquisitions of fixed assets(dwellings, buildings and structures,machinery and equipment), plus certainadditions to the value of non-producedassets. Fixed assets are tangible assets orintangible assets (mineral exploration,computer software, entertainment,literary or artistic originals) produced asoutputs from processes of production thatare themselves used repeatedly, orcontinuously, in processes of productionfor more than one year. (§§ 3.100-3.116)
OTHER CAPITAL EXPENDITURE includeschanges in inventories, capital transferspaid (investment grants paid, capital taxespaid and other capital transfers paid), netacquisition of valuables (precious stonesand metals, antiques and other art objects,etc.) and net acquisition of non-produced,non-financial assets (land and othertangible non-produced assets that may beused in the production of goods andservices, and intangible non-producedassets, such as patents, licenses, etc). (§§3.117-3.127, 4.145-4.167, 6.06-6.13)
9
TOTAL EXPENDITURE AND TOTAL REVENUE are defined according to the Commission Regulation (EC) No 1500/2000 of 10 July 2000 implementing Council Regulation (EC) No 2223/96. The two variables do not exactly correspond to the sum of their components, as presented in this publication. However, the difference between total expenditure and total revenue (net lending/borrowing) corresponds to the difference of the sums of the expenditure and revenue components, as presented here.
NET LENDING (+) OR NET BORROWING (-) shows the net amount of revenue which the government places at the disposal of other sectors or which other sectors provide to the government sector. It corresponds to the difference between total revenue and total expenditure.
PRIMARY BALANCE is defined in this publication as the net lending/net borrowing excluding interest payments.
TAX BURDEN is defined in this publication as the sum of taxes on import and production levied both by general government and by the EU institutions, taxes on income and wealth, actual social contributions and capital taxes.
Consolidation
Consolidation refers to the elimination from the accounts of transactions which occur
between units belonging to the same sector. Although the accounting system advises not to consolidate transactions, it recognises that for some presentations and analyses, consolidated accounts are more significant than overall gross figures (§ 1.58).
In this publication, the following transactions were, as far as possible, consolidated: interest, other current transfers, investment grants and other capital transfers.
General government consolidated gross debt
The definition of government debt to beused in the context of the budgetarysurveillance at the European level is laiddown in Protocol on the excessive deficitprocedure, which was agreed upon whenthe Maastricht Treaty was signed. The debtdefinition is also specified in CouncilRegulation (EC) N° 3605/93 (Article 1(5)),as amended by Council Regulation (EC) N°475/2000. According to the said regulation,“Government debt means the total gross debtat nominal value outstanding at the end of theyear of the sector of “general government(S.13), with the exception of those liabilitiesthe corresponding financial assets of which areheld by the sector of “general government”(S.13). Government debt is constituted by theliabilities of general government in thefollowing categories: currency and deposits(AF.2); securities other than shares, excludingfinancial derivatives (AF.33) and loans (AF.4),as defined in ESA 95.
The nominal value of a liability outstanding atthe end of the year is the face value. The nominal value of an index-linked liabilitycorresponds to its face value adjusted by theindex-related change in the value of theprincipal accrued to the end of the year.
10
Liabilities denominated in a foreign currency, or exchanged from one foreign currency through contractual agreements to one or more other foreign currencies shall be converted into the other foreign currencies at the rate agreed upon in those contracts and shall be converted into the national currency on the basis of the representative market exchange rate prevailing on the last working day of each year. Liabilities denominated in the national currency and exchanged through contractual agreements to a foreign currency shall be converted into the foreign currency at the rate agreed upon in those contracts and shall be converted into the national currency on the basis of the representative market exchange rate prevailing on the last working day of each year. Liabilities denominated in a foreign currency and exchanged through contractual agreements to the national currency shall be converted into the national currency at the rate agreed upon in those contracts”
The codes mentioned in this definition are of ESA 95.
Government gross debt data are shown in Table 55 of Part II. The contributions to the changes in the gross debt ratios are presented in Tables D of Part I. See Debt dynamics, below.
Gross domestic product Gross domestic product used for the calculation of ratios is as defined in ESA 95.
Debt dynamics Tables D in Part I present for each Member State, a quantitative expression of the debt dynamics, giving the influence of the flow variables on the evolution of the government debt.
The debt dynamic (or the budgetary constraint) for a country can be expressed by the following equation:
D D NB SFt t t t= + +−1 , or DY
DY y
NBY
SFY
t
t
t
t t
t
t
t
t= ⋅
++ +−
−
1
1
11
, where
Dt = general government gross debt; NBt =general government deficit (net borrowing (+)); Yt = GDP at current market prices, yt = nominal GDP growth rate and SFt = stock-flow adjustment. The t subscript denotes the year.
The equation can be presented as: DY
DY
NBY
DY
yy
SFY
t
t
t
t
t
t
t
t
t
t
t
t− = − ⋅
++−
−
−
−
1
1
1
1 1 (1),
showing the decomposition of the change in the gross debt ratio in deficit, contribution of nominal GDP growth and stock-flow adjustment.
The equation may also be presentedemphasising the role of the primary deficit:
( )
t
t
t
t
t
t
t
t
t
t
ttttt
YSF
YPD
yi
YD
YD
SFPDiDD
++++
⋅=
⇔+++⋅=
−
−
−
11
1
1
1
1
, where we
define PDt =primary deficit and it = implicitinterest rate. The implicit interest rate iscalculated as interest paid as percentage ofgross debt at the end of year t-1.
The equation may be rearranged as: DY
DY
PDY
DY
i yy
SFY
t
t
t
t
t
t
t
t
t t
t
t
t− = + ⋅
−+
+−
−
−
−
1
1
1
1 1 (2),
showing the change in the gross debt ratioas primary deficit, snowball effect(contribution of interest and nominalgrowth) and stock-flow adjustment.
The contributions to changes in the grossdebt ratio in the Member States and theCommunity are presented in Tables D inaccordance with (1) and (2) in lines 5, 6and 7, and 8, 9 and 10, respectively.
Stock-flow adjustment
The stock-flow adjustment (also known asdebt-deficit adjustment) ensures theconsistency between net borrowing (flow)and the variation in the stock of gross debt
11
It includes the accumulation of financial assets, the changes in the value of debt denominated in foreign currency and remaining statistical adjustments. The stock-flow adjustment figures shown in Tables D for the Community aggregates comprise, besides the weighted average of the stock-flow adjustments of the Member States considered, the influence of exchange rate movements on the preceding year’s stocks of gross debt expressed in EUR/ECU.
Sources Figures up to 2012 have been compiled by national statistical offices, reported by the Member States to the Commission and checked by Eurostat. Figures for 2013 - 2015 are Commission services’ (Directorate General Economic and Financial Affairs) forecasts of autumn 2013.
Nota bene Starting from 2002, euro-zone countries publish national series in EUR. National currency data for all years prior to the switch of the country to euro have been converted using the irrevocably fixed euro conversion rate. For presentation purposes, the currency denomination has changed, with the prefix EURO and the ISO code of the former currency (i.e. EURO-BEF for Belgium). This approach conserves the historical continuity of national series.
However, cross country comparisons and aggregations should continue to be based only on historical series established in ECU up to 1998 and their statistical continuation in EUR from 1999 onwards.
12
GENERAL GOVERNMENT DATA
GENERAL GOVERNMENT REVENUE, EXPENDITURE, BALANCES AND GROSS DEBT
PART I
TABLES BY COUNTRY
13
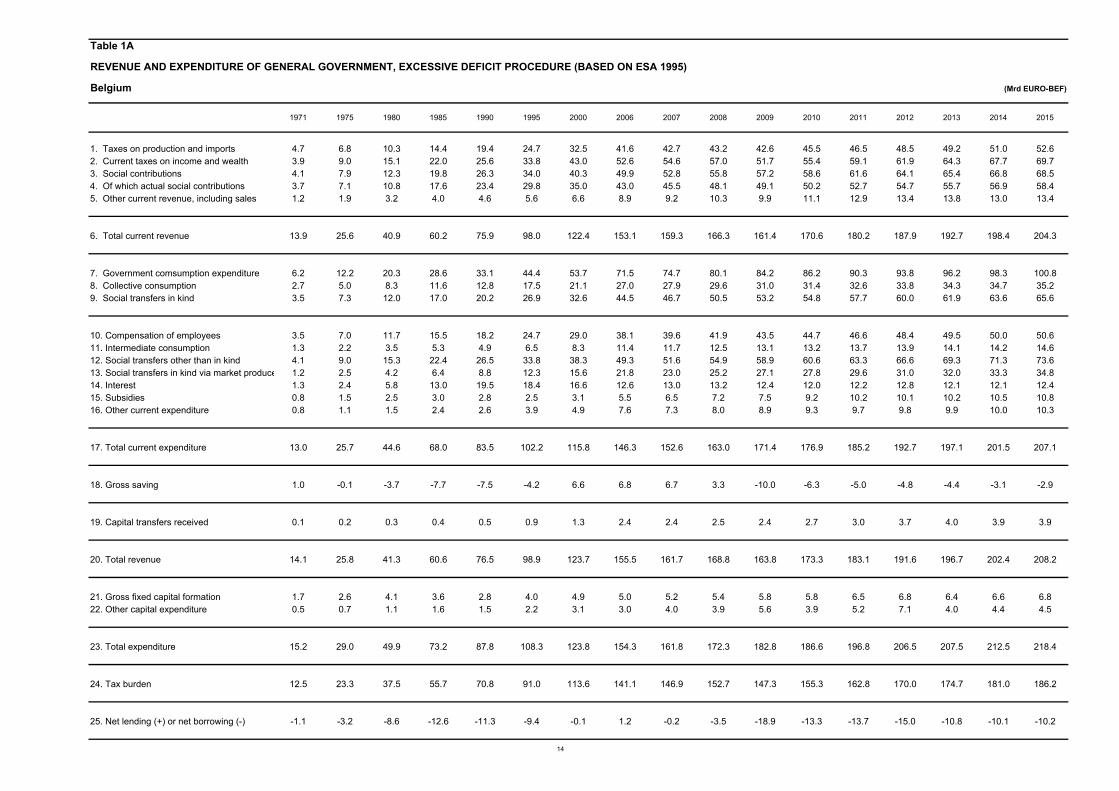
Table 1A
REVENUE AND EXPENDITURE OF GENERAL GOVERNMENT, EXCESSIVE DEFICIT PROCEDURE (BASED ON ESA 1995)
Belgium (Mrd EURO-BEF)
1971 1975 1980 1985 1990 1995 2000 2006 2007 2008 2009 2010 2011 2012 2013 2014 2015
1. Taxes on production and imports 4.7 6.8 10.3 14.4 19.4 24.7 32.5 41.6 42.7 43.2 42.6 45.5 46.5 48.5 49.2 51.0 52.62. Current taxes on income and wealth 3.9 9.0 15.1 22.0 25.6 33.8 43.0 52.6 54.6 57.0 51.7 55.4 59.1 61.9 64.3 67.7 69.73. Social contributions 4.1 7.9 12.3 19.8 26.3 34.0 40.3 49.9 52.8 55.8 57.2 58.6 61.6 64.1 65.4 66.8 68.54. Of which actual social contributions 3.7 7.1 10.8 17.6 23.4 29.8 35.0 43.0 45.5 48.1 49.1 50.2 52.7 54.7 55.7 56.9 58.45. Other current revenue, including sales 1.2 1.9 3.2 4.0 4.6 5.6 6.6 8.9 9.2 10.3 9.9 11.1 12.9 13.4 13.8 13.0 13.4
6. Total current revenue 13.9 25.6 40.9 60.2 75.9 98.0 122.4 153.1 159.3 166.3 161.4 170.6 180.2 187.9 192.7 198.4 204.3
7. Government comsumption expenditure 6.2 12.2 20.3 28.6 33.1 44.4 53.7 71.5 74.7 80.1 84.2 86.2 90.3 93.8 96.2 98.3 100.88. Collective consumption 2.7 5.0 8.3 11.6 12.8 17.5 21.1 27.0 27.9 29.6 31.0 31.4 32.6 33.8 34.3 34.7 35.29. Social transfers in kind 3.5 7.3 12.0 17.0 20.2 26.9 32.6 44.5 46.7 50.5 53.2 54.8 57.7 60.0 61.9 63.6 65.6
10. Compensation of employees 3.5 7.0 11.7 15.5 18.2 24.7 29.0 38.1 39.6 41.9 43.5 44.7 46.6 48.4 49.5 50.0 50.611. Intermediate consumption 1.3 2.2 3.5 5.3 4.9 6.5 8.3 11.4 11.7 12.5 13.1 13.2 13.7 13.9 14.1 14.2 14.612. Social transfers other than in kind 4.1 9.0 15.3 22.4 26.5 33.8 38.3 49.3 51.6 54.9 58.9 60.6 63.3 66.6 69.3 71.3 73.613. Social transfers in kind via market produce 1.2 2.5 4.2 6.4 8.8 12.3 15.6 21.8 23.0 25.2 27.1 27.8 29.6 31.0 32.0 33.3 34.814. Interest 1.3 2.4 5.8 13.0 19.5 18.4 16.6 12.6 13.0 13.2 12.4 12.0 12.2 12.8 12.1 12.1 12.415. Subsidies 0.8 1.5 2.5 3.0 2.8 2.5 3.1 5.5 6.5 7.2 7.5 9.2 10.2 10.1 10.2 10.5 10.816. Other current expenditure 0.8 1.1 1.5 2.4 2.6 3.9 4.9 7.6 7.3 8.0 8.9 9.3 9.7 9.8 9.9 10.0 10.3
17. Total current expenditure 13.0 25.7 44.6 68.0 83.5 102.2 115.8 146.3 152.6 163.0 171.4 176.9 185.2 192.7 197.1 201.5 207.1
18. Gross saving 1.0 -0.1 -3.7 -7.7 -7.5 -4.2 6.6 6.8 6.7 3.3 -10.0 -6.3 -5.0 -4.8 -4.4 -3.1 -2.9
19. Capital transfers received 0.1 0.2 0.3 0.4 0.5 0.9 1.3 2.4 2.4 2.5 2.4 2.7 3.0 3.7 4.0 3.9 3.9
20. Total revenue 14.1 25.8 41.3 60.6 76.5 98.9 123.7 155.5 161.7 168.8 163.8 173.3 183.1 191.6 196.7 202.4 208.2
21. Gross fixed capital formation 1.7 2.6 4.1 3.6 2.8 4.0 4.9 5.0 5.2 5.4 5.8 5.8 6.5 6.8 6.4 6.6 6.822. Other capital expenditure 0.5 0.7 1.1 1.6 1.5 2.2 3.1 3.0 4.0 3.9 5.6 3.9 5.2 7.1 4.0 4.4 4.5
23. Total expenditure 15.2 29.0 49.9 73.2 87.8 108.3 123.8 154.3 161.8 172.3 182.8 186.6 196.8 206.5 207.5 212.5 218.4
24. Tax burden 12.5 23.3 37.5 55.7 70.8 91.0 113.6 141.1 146.9 152.7 147.3 155.3 162.8 170.0 174.7 181.0 186.2
25. Net lending (+) or net borrowing (-) -1.1 -3.2 -8.6 -12.6 -11.3 -9.4 -0.1 1.2 -0.2 -3.5 -18.9 -13.3 -13.7 -15.0 -10.8 -10.1 -10.2
14

Table 1B
Contributions to the change in the general government gross debt ratio
Belgium
1995 2000 2001 2002 2003 2004 2005 2006 2007 2008 2009 2010 2011 2012 2013 2014 2015
1. Net borrowing (% of GDP) 1) 4.5 0.0 -0.4 0.1 0.1 0.1 2.5 -0.4 0.1 1.0 5.6 3.7 3.7 4.0 2.8 2.6 2.52. Interest payments (% of GDP) 8.9 6.6 6.4 5.7 5.3 4.7 4.2 4.0 3.9 3.8 3.6 3.4 3.3 3.4 3.2 3.1 3.1
3. Implicit interest rate 2) 7.0 6.1 6.1 5.5 5.2 5.0 4.6 4.5 4.6 4.7 4.0 3.7 3.6 3.5 3.2 3.1 3.14. Nominal GDP growth rate 3.6 5.7 2.9 3.4 2.8 5.5 4.2 5.1 5.3 3.1 -1.6 4.4 3.8 1.8 2.2 2.4 3.0
(% of GDP)
Budgetary constraint based on thedeficit
5. Deficit (net borrowing) 1) 4.5 0.0 -0.4 0.1 0.1 0.1 2.5 -0.4 0.1 1.0 5.6 3.7 3.7 4.0 2.8 2.6 2.56. Contribution of nominal GDP growth -4.6 -6.1 -3.0 -3.5 -2.8 -5.1 -3.8 -4.4 -4.4 -2.6 1.5 -4.1 -3.5 -1.7 -2.1 -2.4 -2.97. Stock-flow adjustment 3) -1.8 0.3 2.1 0.3 -2.3 0.6 -0.8 0.8 0.5 6.7 -0.5 0.3 2.1 -0.4 0.0 0.7 0.1
Budgetary constraint based on theprimary deficit
8. Primary deficit 4) -4.3 -6.5 -6.8 -5.6 -5.1 -4.5 -1.7 -4.3 -3.8 -2.8 1.9 0.4 0.4 0.6 -0.3 -0.5 -0.59. Snow-ball effect 4.2 0.4 3.4 2.2 2.4 -0.4 0.4 -0.5 -0.6 1.3 5.1 -0.7 -0.2 1.7 1.0 0.7 0.110. Stock-flow adjustment 3) -1.8 0.3 2.1 0.3 -2.3 0.6 -0.8 0.8 0.5 6.7 -0.5 0.3 2.1 -0.4 0.0 0.7 0.1
(% of GDP)
11. Change in gross debt 5) -1.9 -5.8 -1.3 -3.1 -5.0 -4.3 -2.1 -4.0 -3.9 5.2 6.5 -0.1 2.3 1.8 0.6 0.9 -0.312. Level of gross debt (end of year) 130.2 107.8 106.5 103.4 98.4 94.0 92.0 88.0 84.0 89.2 95.7 95.7 98.0 99.8 100.4 101.3 101.0
1) Line 1 = line 5, a minus sign means a surplus.2) Actual interest payments as percentage of gross debt at end of t-1.3) Line 7 = line 10.4) Net borrowing excl. interest payments, line 8 = line 1 - line 2. A minus sign means a primary surplus.5) Line 11 = total of lines 5, 6 and 7 or 8, 9 and 10.
15

Table 2A
REVENUE AND EXPENDITURE OF GENERAL GOVERNMENT, EXCESSIVE DEFICIT PROCEDURE (BASED ON ESA 1995)
Germany (Mrd EURO-DEM)
1991 1995 2000 2002 2003 2004 2005 2006 2007 2008 2009 2010 2011 2012 2013 2014 2015
1. Taxes on production and imports 146 184 218 227 232 232 233 242 266 270 274 276 293 298 304 312 3202. Current taxes on income and wealth 192 222 263 231 232 232 242 271 293 303 275 274 300 319 333 349 3663. Social contributions 258 343 381 392 397 397 397 401 401 408 411 421 437 449 454 464 4784. Of which actual social contributions 244 320 358 368 373 373 373 376 376 383 384 394 409 421 426 436 4495. Other current revenue, including sales 65 81 77 82 82 80 87 88 93 98 104 109 117 117 121 126 132
6. Total current revenue 661 829 939 932 943 942 960 1002 1052 1079 1063 1080 1147 1183 1212 1251 1295
7. Government comsumption expenditure 289 358 390 410 415 414 417 425 434 452 475 487 500 514 535 554 5738. Collective consumption 122 140 151 157 156 158 156 157 158 165 172 174 180 186 194 201 2079. Social transfers in kind 167 218 239 254 259 256 262 268 276 287 304 313 320 328 341 354 366
10. Compensation of employees 135 163 170 175 177 177 177 177 178 183 191 196 199 204 209 215 22211. Intermediate consumption 65 73 80 87 88 89 93 96 100 108 116 122 127 131 138 145 15212. Social transfers other than in kind 236 326 369 398 409 411 412 409 401 404 427 430 426 430 437 447 45913. Social transfers in kind via market produce 99 136 153 163 167 163 167 172 178 186 197 203 207 213 223 232 24114. Interest 41 65 66 63 65 63 63 66 68 68 64 63 66 64 63 61 6115. Subsidies 33 38 34 31 29 27 25 26 25 24 28 29 27 25 26 27 2716. Other current expenditure 31 27 35 35 38 38 41 41 42 47 51 54 54 57 62 65 68
17. Total current expenditure 640 828 907 951 971 969 979 986 993 1020 1073 1096 1106 1124 1158 1193 1230
18. Gross saving 21 1 31 -19 -29 -27 -19 16 60 59 -10 -16 40 60 54 58 65
19. Capital transfers received 5 10 8 8 9 10 10 9 10 9 10 10 10 11 10 10 10
20. Total revenue 666 839 947 940 952 951 969 1011 1062 1089 1073 1090 1157 1194 1222 1261 1305
21. Gross fixed capital formation 40 40 39 38 35 33 31 34 36 39 42 42 44 41 42 44 4622. Other capital expenditure 30 146 -23 33 34 32 33 29 28 32 32 56 29 26 23 23 23
23. Total expenditure 710 1014 923 1022 1041 1034 1043 1049 1057 1090 1146 1194 1179 1191 1223 1259 1299
24. Tax burden 597 744 854 837 848 847 859 900 946 968 942 954 1013 1050 1074 1107 1145
25. Net lending (+) or net borrowing (-) -44 -175 23 -82 -89 -83 -74 -38 6 -2 -74 -104 -22 2 -1 2 7
16

Table 2B
Contributions to the change in the general government gross debt ratio
Germany
1995 2000 2001 2002 2003 2004 2005 2006 2007 2008 2009 2010 2011 2012 2013 2014 2015
1. Net borrowing (% of GDP) 1) 9.5 -1.1 3.1 3.8 4.2 3.8 3.3 1.6 -0.2 0.1 3.1 4.2 0.8 -0.1 0.0 -0.1 -0.22. Interest payments (% of GDP) 3.5 3.2 3.1 3.0 3.0 2.9 2.8 2.8 2.8 2.8 2.7 2.5 2.5 2.4 2.3 2.2 2.1
3. Implicit interest rate 2) 7.6 5.3 5.3 5.1 5.0 4.6 4.3 4.3 4.3 4.3 3.9 3.6 3.2 3.1 2.9 2.8 2.84. Nominal GDP growth rate 3.7 2.4 2.7 1.4 0.7 2.2 1.3 4.0 5.0 1.9 -4.0 5.1 4.6 2.2 2.7 3.5 3.7
(% of GDP)
Budgetary constraint based on thedeficit
5. Deficit (net borrowing) 1) 9.5 -1.1 3.1 3.8 4.2 3.8 3.3 1.6 -0.2 0.1 3.1 4.2 0.8 -0.1 0.0 -0.1 -0.26. Contribution of nominal GDP growth -1.7 -1.4 -1.6 -0.8 -0.4 -1.4 -0.9 -2.7 -3.2 -1.2 2.8 -3.6 -3.6 -1.7 -2.1 -2.7 -2.87. Stock-flow adjustment 3) -0.1 1.5 -2.6 -1.4 0.0 -0.6 -0.1 0.5 0.6 2.7 1.8 7.3 0.3 2.8 0.6 0.3 0.0
Budgetary constraint based on theprimary deficit
8. Primary deficit 4) 6.0 -4.3 0.0 0.9 1.1 0.9 0.5 -1.2 -3.0 -2.7 0.4 1.6 -1.7 -2.5 -2.3 -2.2 -2.39. Snow-ball effect 1.8 1.8 1.5 2.1 2.6 1.5 2.0 0.2 -0.4 1.6 5.5 -1.1 -1.1 0.7 0.2 -0.5 -0.710. Stock-flow adjustment 3) -0.1 1.5 -2.6 -1.4 0.0 -0.6 -0.1 0.5 0.6 2.7 1.8 7.3 0.3 2.8 0.6 0.3 0.0
(% of GDP)
11. Change in gross debt 5) 7.6 -1.1 -1.0 1.6 3.7 1.8 2.3 -0.5 -2.8 1.6 7.7 7.9 -2.5 1.1 -1.5 -2.5 -3.012. Level of gross debt (end of year) 55.6 60.2 59.1 60.7 64.4 66.2 68.5 68.0 65.2 66.8 74.5 82.5 80.0 81.0 79.6 77.1 74.1
1) Line 1 = line 5, a minus sign means a surplus.2) Actual interest payments as percentage of gross debt at end of t-1.3) Line 7 = line 10.4) Net borrowing excl. interest payments, line 8 = line 1 - line 2. A minus sign means a primary surplus.5) Line 11 = total of lines 5, 6 and 7 or 8, 9 and 10.
17
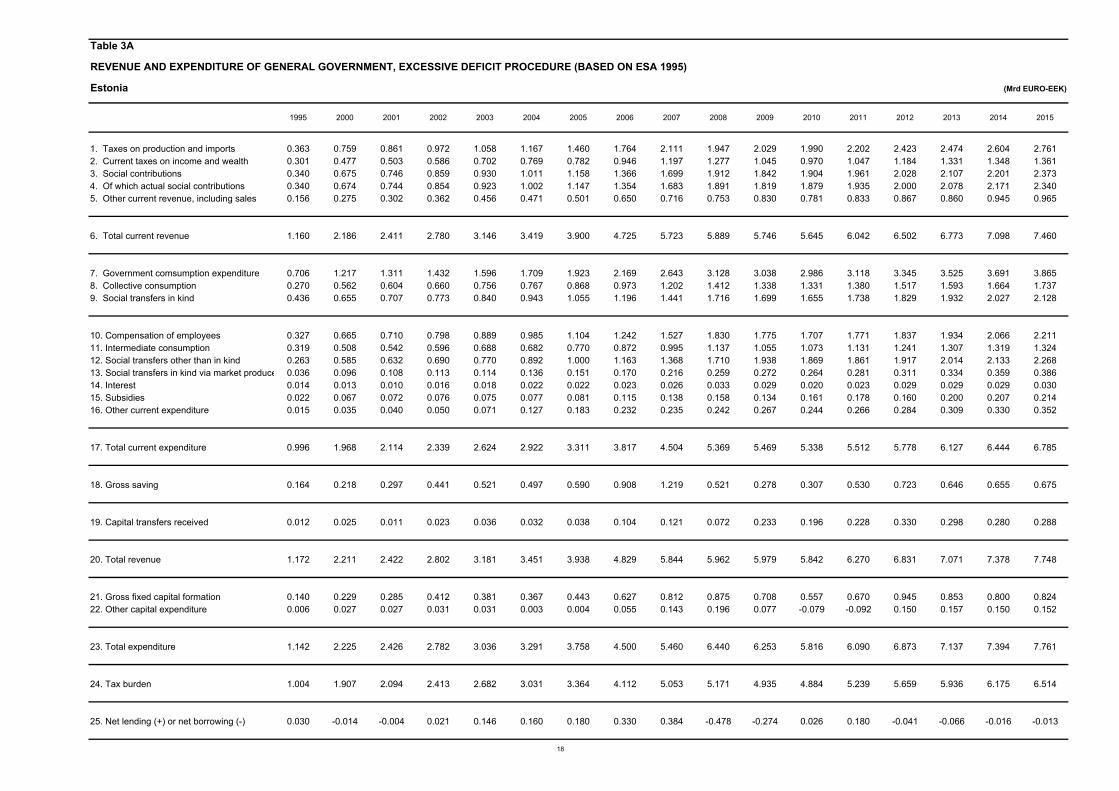
Table 3A
REVENUE AND EXPENDITURE OF GENERAL GOVERNMENT, EXCESSIVE DEFICIT PROCEDURE (BASED ON ESA 1995)
Estonia (Mrd EURO-EEK)
1995 2000 2001 2002 2003 2004 2005 2006 2007 2008 2009 2010 2011 2012 2013 2014 2015
1. Taxes on production and imports 0.363 0.759 0.861 0.972 1.058 1.167 1.460 1.764 2.111 1.947 2.029 1.990 2.202 2.423 2.474 2.604 2.7612. Current taxes on income and wealth 0.301 0.477 0.503 0.586 0.702 0.769 0.782 0.946 1.197 1.277 1.045 0.970 1.047 1.184 1.331 1.348 1.3613. Social contributions 0.340 0.675 0.746 0.859 0.930 1.011 1.158 1.366 1.699 1.912 1.842 1.904 1.961 2.028 2.107 2.201 2.3734. Of which actual social contributions 0.340 0.674 0.744 0.854 0.923 1.002 1.147 1.354 1.683 1.891 1.819 1.879 1.935 2.000 2.078 2.171 2.3405. Other current revenue, including sales 0.156 0.275 0.302 0.362 0.456 0.471 0.501 0.650 0.716 0.753 0.830 0.781 0.833 0.867 0.860 0.945 0.965
6. Total current revenue 1.160 2.186 2.411 2.780 3.146 3.419 3.900 4.725 5.723 5.889 5.746 5.645 6.042 6.502 6.773 7.098 7.460
7. Government comsumption expenditure 0.706 1.217 1.311 1.432 1.596 1.709 1.923 2.169 2.643 3.128 3.038 2.986 3.118 3.345 3.525 3.691 3.8658. Collective consumption 0.270 0.562 0.604 0.660 0.756 0.767 0.868 0.973 1.202 1.412 1.338 1.331 1.380 1.517 1.593 1.664 1.7379. Social transfers in kind 0.436 0.655 0.707 0.773 0.840 0.943 1.055 1.196 1.441 1.716 1.699 1.655 1.738 1.829 1.932 2.027 2.128
10. Compensation of employees 0.327 0.665 0.710 0.798 0.889 0.985 1.104 1.242 1.527 1.830 1.775 1.707 1.771 1.837 1.934 2.066 2.21111. Intermediate consumption 0.319 0.508 0.542 0.596 0.688 0.682 0.770 0.872 0.995 1.137 1.055 1.073 1.131 1.241 1.307 1.319 1.32412. Social transfers other than in kind 0.263 0.585 0.632 0.690 0.770 0.892 1.000 1.163 1.368 1.710 1.938 1.869 1.861 1.917 2.014 2.133 2.26813. Social transfers in kind via market produce 0.036 0.096 0.108 0.113 0.114 0.136 0.151 0.170 0.216 0.259 0.272 0.264 0.281 0.311 0.334 0.359 0.38614. Interest 0.014 0.013 0.010 0.016 0.018 0.022 0.022 0.023 0.026 0.033 0.029 0.020 0.023 0.029 0.029 0.029 0.03015. Subsidies 0.022 0.067 0.072 0.076 0.075 0.077 0.081 0.115 0.138 0.158 0.134 0.161 0.178 0.160 0.200 0.207 0.21416. Other current expenditure 0.015 0.035 0.040 0.050 0.071 0.127 0.183 0.232 0.235 0.242 0.267 0.244 0.266 0.284 0.309 0.330 0.352
17. Total current expenditure 0.996 1.968 2.114 2.339 2.624 2.922 3.311 3.817 4.504 5.369 5.469 5.338 5.512 5.778 6.127 6.444 6.785
18. Gross saving 0.164 0.218 0.297 0.441 0.521 0.497 0.590 0.908 1.219 0.521 0.278 0.307 0.530 0.723 0.646 0.655 0.675
19. Capital transfers received 0.012 0.025 0.011 0.023 0.036 0.032 0.038 0.104 0.121 0.072 0.233 0.196 0.228 0.330 0.298 0.280 0.288
20. Total revenue 1.172 2.211 2.422 2.802 3.181 3.451 3.938 4.829 5.844 5.962 5.979 5.842 6.270 6.831 7.071 7.378 7.748
21. Gross fixed capital formation 0.140 0.229 0.285 0.412 0.381 0.367 0.443 0.627 0.812 0.875 0.708 0.557 0.670 0.945 0.853 0.800 0.82422. Other capital expenditure 0.006 0.027 0.027 0.031 0.031 0.003 0.004 0.055 0.143 0.196 0.077 -0.079 -0.092 0.150 0.157 0.150 0.152
23. Total expenditure 1.142 2.225 2.426 2.782 3.036 3.291 3.758 4.500 5.460 6.440 6.253 5.816 6.090 6.873 7.137 7.394 7.761
24. Tax burden 1.004 1.907 2.094 2.413 2.682 3.031 3.364 4.112 5.053 5.171 4.935 4.884 5.239 5.659 5.936 6.175 6.514
25. Net lending (+) or net borrowing (-) 0.030 -0.014 -0.004 0.021 0.146 0.160 0.180 0.330 0.384 -0.478 -0.274 0.026 0.180 -0.041 -0.066 -0.016 -0.013
18

Table 3B
Contributions to the change in the general government gross debt ratio
Estonia
1999 2000 2001 2002 2003 2004 2005 2006 2007 2008 2009 2010 2011 2012 2013 2014 2015
1. Net borrowing (% of GDP) 1) 3.5 0.2 0.1 -0.3 -1.7 -1.6 -1.6 -2.5 -2.4 2.9 2.0 -0.2 -1.1 0.2 0.4 0.1 0.12. Interest payments (% of GDP) 0.3 0.2 0.1 0.2 0.2 0.2 0.2 0.2 0.2 0.2 0.2 0.1 0.1 0.2 0.2 0.1 0.1
3. Implicit interest rate 2) 5.1 3.6 3.2 4.9 4.1 4.5 4.5 4.5 4.5 5.6 3.9 2.0 2.4 2.9 1.7 1.6 1.64. Nominal GDP growth rate 6.5 15.0 13.2 11.6 12.1 11.1 15.5 19.8 20.0 1.0 -14.0 2.9 12.8 7.4 6.2 6.5 7.3
(% of GDP)
Budgetary constraint based on thedeficit
5. Deficit (net borrowing) 1) 3.5 0.2 0.1 -0.3 -1.7 -1.6 -1.6 -2.5 -2.4 2.9 2.0 -0.2 -1.1 0.2 0.4 0.1 0.16. Contribution of nominal GDP growth -0.4 -0.8 -0.6 -0.5 -0.6 -0.6 -0.7 -0.8 -0.7 0.0 0.7 -0.2 -0.8 -0.4 -0.6 -0.6 -0.77. Stock-flow adjustment 3) -2.6 -0.8 0.2 1.7 2.2 1.6 1.8 3.1 2.4 -2.1 -0.1 0.0 1.2 4.0 0.4 0.2 0.0
Budgetary constraint based on theprimary deficit
8. Primary deficit 4) 3.2 0.0 -0.1 -0.5 -1.9 -1.9 -1.8 -2.6 -2.6 2.7 1.8 -0.3 -1.3 0.1 0.2 -0.1 -0.19. Snow-ball effect -0.1 -0.6 -0.4 -0.3 -0.4 -0.3 -0.5 -0.6 -0.6 0.2 0.9 -0.1 -0.6 -0.3 -0.4 -0.5 -0.510. Stock-flow adjustment 3) -2.6 -0.8 0.2 1.7 2.2 1.6 1.8 3.1 2.4 -2.1 -0.1 0.0 1.2 4.0 0.4 0.2 0.0
(% of GDP)
11. Change in gross debt 5) 0.5 -1.4 -0.3 0.9 -0.1 -0.6 -0.5 -0.2 -0.7 0.9 2.6 -0.4 -0.6 3.8 0.1 -0.3 -0.612. Level of gross debt (end of year) 6.5 5.1 4.8 5.7 5.6 5.0 4.6 4.4 3.7 4.5 7.1 6.7 6.1 9.8 10.0 9.7 9.1
1) Line 1 = line 5, a minus sign means a surplus.2) Actual interest payments as percentage of gross debt at end of t-1.3) Line 7 = line 10.4) Net borrowing excl. interest payments, line 8 = line 1 - line 2. A minus sign means a primary surplus.5) Line 11 = total of lines 5, 6 and 7 or 8, 9 and 10.
19
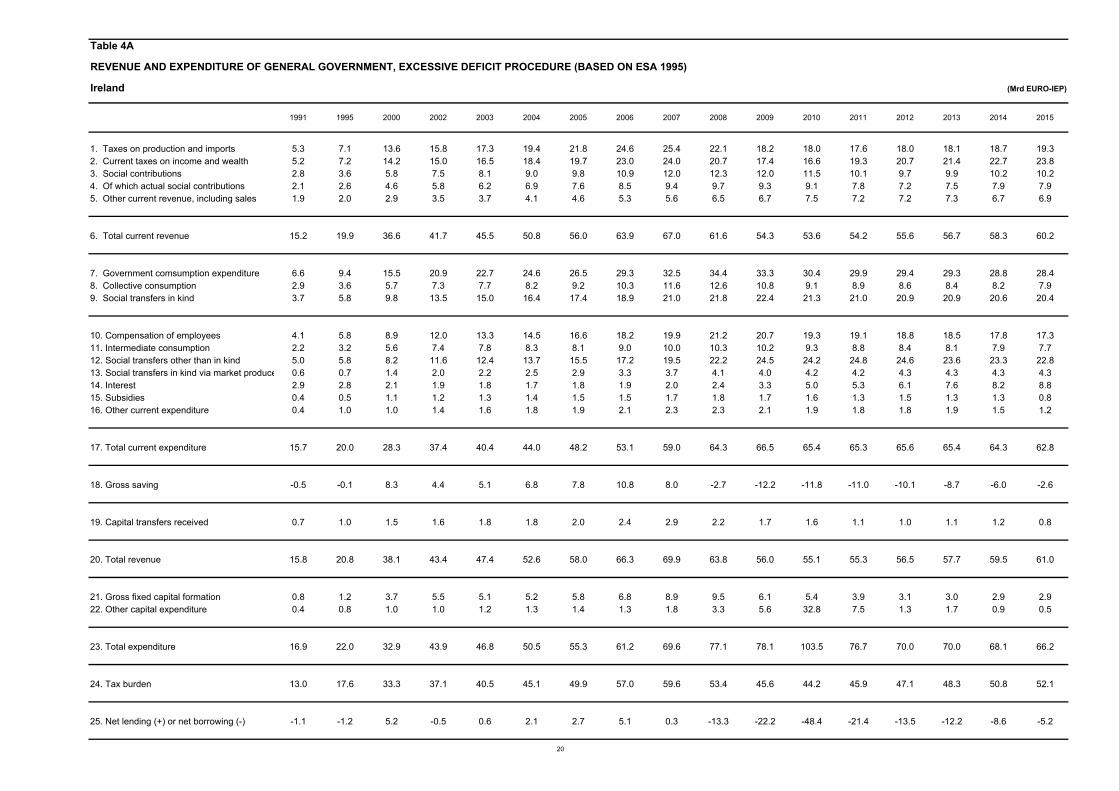
Table 4A
REVENUE AND EXPENDITURE OF GENERAL GOVERNMENT, EXCESSIVE DEFICIT PROCEDURE (BASED ON ESA 1995)
Ireland (Mrd EURO-IEP)
1991 1995 2000 2002 2003 2004 2005 2006 2007 2008 2009 2010 2011 2012 2013 2014 2015
1. Taxes on production and imports 5.3 7.1 13.6 15.8 17.3 19.4 21.8 24.6 25.4 22.1 18.2 18.0 17.6 18.0 18.1 18.7 19.32. Current taxes on income and wealth 5.2 7.2 14.2 15.0 16.5 18.4 19.7 23.0 24.0 20.7 17.4 16.6 19.3 20.7 21.4 22.7 23.83. Social contributions 2.8 3.6 5.8 7.5 8.1 9.0 9.8 10.9 12.0 12.3 12.0 11.5 10.1 9.7 9.9 10.2 10.24. Of which actual social contributions 2.1 2.6 4.6 5.8 6.2 6.9 7.6 8.5 9.4 9.7 9.3 9.1 7.8 7.2 7.5 7.9 7.95. Other current revenue, including sales 1.9 2.0 2.9 3.5 3.7 4.1 4.6 5.3 5.6 6.5 6.7 7.5 7.2 7.2 7.3 6.7 6.9
6. Total current revenue 15.2 19.9 36.6 41.7 45.5 50.8 56.0 63.9 67.0 61.6 54.3 53.6 54.2 55.6 56.7 58.3 60.2
7. Government comsumption expenditure 6.6 9.4 15.5 20.9 22.7 24.6 26.5 29.3 32.5 34.4 33.3 30.4 29.9 29.4 29.3 28.8 28.48. Collective consumption 2.9 3.6 5.7 7.3 7.7 8.2 9.2 10.3 11.6 12.6 10.8 9.1 8.9 8.6 8.4 8.2 7.99. Social transfers in kind 3.7 5.8 9.8 13.5 15.0 16.4 17.4 18.9 21.0 21.8 22.4 21.3 21.0 20.9 20.9 20.6 20.4
10. Compensation of employees 4.1 5.8 8.9 12.0 13.3 14.5 16.6 18.2 19.9 21.2 20.7 19.3 19.1 18.8 18.5 17.8 17.311. Intermediate consumption 2.2 3.2 5.6 7.4 7.8 8.3 8.1 9.0 10.0 10.3 10.2 9.3 8.8 8.4 8.1 7.9 7.712. Social transfers other than in kind 5.0 5.8 8.2 11.6 12.4 13.7 15.5 17.2 19.5 22.2 24.5 24.2 24.8 24.6 23.6 23.3 22.813. Social transfers in kind via market produce 0.6 0.7 1.4 2.0 2.2 2.5 2.9 3.3 3.7 4.1 4.0 4.2 4.2 4.3 4.3 4.3 4.314. Interest 2.9 2.8 2.1 1.9 1.8 1.7 1.8 1.9 2.0 2.4 3.3 5.0 5.3 6.1 7.6 8.2 8.815. Subsidies 0.4 0.5 1.1 1.2 1.3 1.4 1.5 1.5 1.7 1.8 1.7 1.6 1.3 1.5 1.3 1.3 0.816. Other current expenditure 0.4 1.0 1.0 1.4 1.6 1.8 1.9 2.1 2.3 2.3 2.1 1.9 1.8 1.8 1.9 1.5 1.2
17. Total current expenditure 15.7 20.0 28.3 37.4 40.4 44.0 48.2 53.1 59.0 64.3 66.5 65.4 65.3 65.6 65.4 64.3 62.8
18. Gross saving -0.5 -0.1 8.3 4.4 5.1 6.8 7.8 10.8 8.0 -2.7 -12.2 -11.8 -11.0 -10.1 -8.7 -6.0 -2.6
19. Capital transfers received 0.7 1.0 1.5 1.6 1.8 1.8 2.0 2.4 2.9 2.2 1.7 1.6 1.1 1.0 1.1 1.2 0.8
20. Total revenue 15.8 20.8 38.1 43.4 47.4 52.6 58.0 66.3 69.9 63.8 56.0 55.1 55.3 56.5 57.7 59.5 61.0
21. Gross fixed capital formation 0.8 1.2 3.7 5.5 5.1 5.2 5.8 6.8 8.9 9.5 6.1 5.4 3.9 3.1 3.0 2.9 2.922. Other capital expenditure 0.4 0.8 1.0 1.0 1.2 1.3 1.4 1.3 1.8 3.3 5.6 32.8 7.5 1.3 1.7 0.9 0.5
23. Total expenditure 16.9 22.0 32.9 43.9 46.8 50.5 55.3 61.2 69.6 77.1 78.1 103.5 76.7 70.0 70.0 68.1 66.2
24. Tax burden 13.0 17.6 33.3 37.1 40.5 45.1 49.9 57.0 59.6 53.4 45.6 44.2 45.9 47.1 48.3 50.8 52.1
25. Net lending (+) or net borrowing (-) -1.1 -1.2 5.2 -0.5 0.6 2.1 2.7 5.1 0.3 -13.3 -22.2 -48.4 -21.4 -13.5 -12.2 -8.6 -5.2
20

Table 4B
Contributions to the change in the general government gross debt ratio
Ireland
1995 2000 2001 2002 2003 2004 2005 2006 2007 2008 2009 2010 2011 2012 2013 2014 2015
1. Net borrowing (% of GDP) 1) 2.2 -4.9 -0.9 0.4 -0.4 -1.4 -1.6 -2.9 -0.2 7.4 13.7 30.6 13.1 8.2 7.4 5.0 3.02. Interest payments (% of GDP) 5.2 2.0 1.6 1.4 1.3 1.2 1.1 1.1 1.0 1.3 2.0 3.1 3.3 3.7 4.6 4.8 5.0
3. Implicit interest rate 2) 6.8 5.0 4.7 4.6 4.3 4.0 4.0 4.2 4.5 5.1 4.1 4.8 3.7 3.6 4.0 4.0 4.34. Nominal GDP growth rate 13.0 16.5 11.2 11.2 7.6 6.7 8.6 9.0 6.8 -5.0 -10.0 -2.6 2.8 0.8 1.1 2.5 3.6
(% of GDP)
Budgetary constraint based on thedeficit
5. Deficit (net borrowing) 1) 2.2 -4.9 -0.9 0.4 -0.4 -1.4 -1.6 -2.9 -0.2 7.4 13.7 30.6 13.1 8.2 7.4 5.0 3.06. Contribution of nominal GDP growth -10.0 -6.7 -3.7 -3.5 -2.2 -1.9 -2.3 -2.2 -1.6 1.3 4.9 1.7 -2.5 -0.8 -1.2 -3.1 -4.27. Stock-flow adjustment 3) 0.4 1.6 2.1 0.4 1.8 1.7 1.8 2.5 2.0 10.6 1.7 -5.5 2.3 5.9 0.8 -5.6 -0.4
Budgetary constraint based on theprimary deficit
8. Primary deficit 4) -3.0 -6.9 -2.5 -1.0 -1.7 -2.6 -2.7 -3.9 -1.2 6.1 11.6 27.5 9.9 4.5 2.8 0.2 -2.09. Snow-ball effect -4.8 -4.6 -2.2 -2.1 -1.0 -0.8 -1.2 -1.2 -0.5 2.6 6.9 4.9 0.7 2.9 3.4 1.7 0.810. Stock-flow adjustment 3) 0.4 1.6 2.1 0.4 1.8 1.7 1.8 2.5 2.0 10.6 1.7 -5.5 2.3 5.9 0.8 -5.6 -0.4
(% of GDP)
11. Change in gross debt 5) -7.5 -10.0 -2.5 -2.7 -0.8 -1.6 -2.2 -2.6 0.3 19.3 20.3 26.8 12.9 13.3 7.0 -3.6 -1.712. Level of gross debt (end of year) 80.1 37.0 34.5 31.8 31.0 29.4 27.2 24.6 24.9 44.2 64.4 91.2 104.1 117.4 124.4 120.8 119.1
1) Line 1 = line 5, a minus sign means a surplus.2) Actual interest payments as percentage of gross debt at end of t-1.3) Line 7 = line 10.4) Net borrowing excl. interest payments, line 8 = line 1 - line 2. A minus sign means a primary surplus.5) Line 11 = total of lines 5, 6 and 7 or 8, 9 and 10.
21
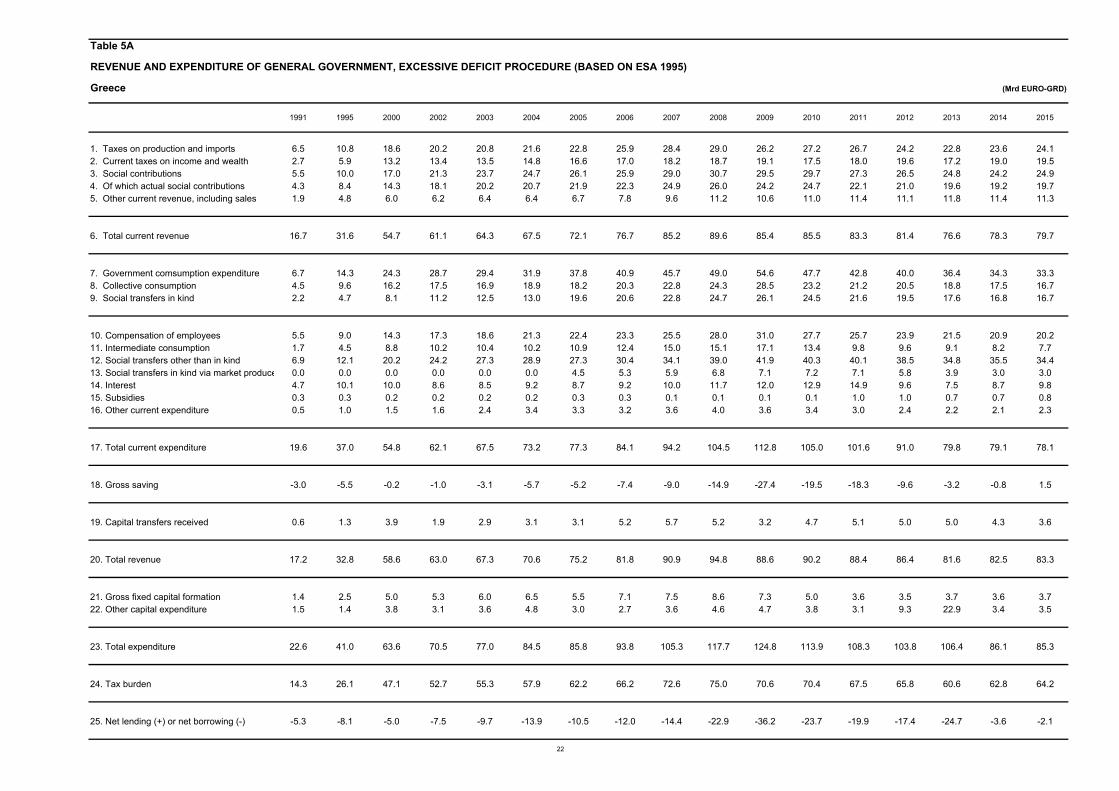
Table 5A
REVENUE AND EXPENDITURE OF GENERAL GOVERNMENT, EXCESSIVE DEFICIT PROCEDURE (BASED ON ESA 1995)
Greece (Mrd EURO-GRD)
1991 1995 2000 2002 2003 2004 2005 2006 2007 2008 2009 2010 2011 2012 2013 2014 2015
1. Taxes on production and imports 6.5 10.8 18.6 20.2 20.8 21.6 22.8 25.9 28.4 29.0 26.2 27.2 26.7 24.2 22.8 23.6 24.12. Current taxes on income and wealth 2.7 5.9 13.2 13.4 13.5 14.8 16.6 17.0 18.2 18.7 19.1 17.5 18.0 19.6 17.2 19.0 19.53. Social contributions 5.5 10.0 17.0 21.3 23.7 24.7 26.1 25.9 29.0 30.7 29.5 29.7 27.3 26.5 24.8 24.2 24.94. Of which actual social contributions 4.3 8.4 14.3 18.1 20.2 20.7 21.9 22.3 24.9 26.0 24.2 24.7 22.1 21.0 19.6 19.2 19.75. Other current revenue, including sales 1.9 4.8 6.0 6.2 6.4 6.4 6.7 7.8 9.6 11.2 10.6 11.0 11.4 11.1 11.8 11.4 11.3
6. Total current revenue 16.7 31.6 54.7 61.1 64.3 67.5 72.1 76.7 85.2 89.6 85.4 85.5 83.3 81.4 76.6 78.3 79.7
7. Government comsumption expenditure 6.7 14.3 24.3 28.7 29.4 31.9 37.8 40.9 45.7 49.0 54.6 47.7 42.8 40.0 36.4 34.3 33.38. Collective consumption 4.5 9.6 16.2 17.5 16.9 18.9 18.2 20.3 22.8 24.3 28.5 23.2 21.2 20.5 18.8 17.5 16.79. Social transfers in kind 2.2 4.7 8.1 11.2 12.5 13.0 19.6 20.6 22.8 24.7 26.1 24.5 21.6 19.5 17.6 16.8 16.7
10. Compensation of employees 5.5 9.0 14.3 17.3 18.6 21.3 22.4 23.3 25.5 28.0 31.0 27.7 25.7 23.9 21.5 20.9 20.211. Intermediate consumption 1.7 4.5 8.8 10.2 10.4 10.2 10.9 12.4 15.0 15.1 17.1 13.4 9.8 9.6 9.1 8.2 7.712. Social transfers other than in kind 6.9 12.1 20.2 24.2 27.3 28.9 27.3 30.4 34.1 39.0 41.9 40.3 40.1 38.5 34.8 35.5 34.413. Social transfers in kind via market produce 0.0 0.0 0.0 0.0 0.0 0.0 4.5 5.3 5.9 6.8 7.1 7.2 7.1 5.8 3.9 3.0 3.014. Interest 4.7 10.1 10.0 8.6 8.5 9.2 8.7 9.2 10.0 11.7 12.0 12.9 14.9 9.6 7.5 8.7 9.815. Subsidies 0.3 0.3 0.2 0.2 0.2 0.2 0.3 0.3 0.1 0.1 0.1 0.1 1.0 1.0 0.7 0.7 0.816. Other current expenditure 0.5 1.0 1.5 1.6 2.4 3.4 3.3 3.2 3.6 4.0 3.6 3.4 3.0 2.4 2.2 2.1 2.3
17. Total current expenditure 19.6 37.0 54.8 62.1 67.5 73.2 77.3 84.1 94.2 104.5 112.8 105.0 101.6 91.0 79.8 79.1 78.1
18. Gross saving -3.0 -5.5 -0.2 -1.0 -3.1 -5.7 -5.2 -7.4 -9.0 -14.9 -27.4 -19.5 -18.3 -9.6 -3.2 -0.8 1.5
19. Capital transfers received 0.6 1.3 3.9 1.9 2.9 3.1 3.1 5.2 5.7 5.2 3.2 4.7 5.1 5.0 5.0 4.3 3.6
20. Total revenue 17.2 32.8 58.6 63.0 67.3 70.6 75.2 81.8 90.9 94.8 88.6 90.2 88.4 86.4 81.6 82.5 83.3
21. Gross fixed capital formation 1.4 2.5 5.0 5.3 6.0 6.5 5.5 7.1 7.5 8.6 7.3 5.0 3.6 3.5 3.7 3.6 3.722. Other capital expenditure 1.5 1.4 3.8 3.1 3.6 4.8 3.0 2.7 3.6 4.6 4.7 3.8 3.1 9.3 22.9 3.4 3.5
23. Total expenditure 22.6 41.0 63.6 70.5 77.0 84.5 85.8 93.8 105.3 117.7 124.8 113.9 108.3 103.8 106.4 86.1 85.3
24. Tax burden 14.3 26.1 47.1 52.7 55.3 57.9 62.2 66.2 72.6 75.0 70.6 70.4 67.5 65.8 60.6 62.8 64.2
25. Net lending (+) or net borrowing (-) -5.3 -8.1 -5.0 -7.5 -9.7 -13.9 -10.5 -12.0 -14.4 -22.9 -36.2 -23.7 -19.9 -17.4 -24.7 -3.6 -2.1
22

Table 5B
Contributions to the change in the general government gross debt ratio
Greece
1995 2000 2001 2002 2003 2004 2005 2006 2007 2008 2009 2010 2011 2012 2013 2014 2015
1. Net borrowing (% of GDP) 1) 9.1 3.7 4.5 4.8 5.7 7.6 5.5 5.7 6.5 9.8 15.7 10.7 9.5 9.0 13.5 2.0 1.12. Interest payments (% of GDP) 11.3 7.4 6.5 5.6 5.0 5.0 4.5 4.4 4.5 5.0 5.2 5.8 7.1 5.0 4.1 4.8 5.2
3. Implicit interest rate 2) 13.1 8.4 6.7 5.7 5.3 5.5 4.7 4.3 4.5 4.9 4.5 4.3 4.5 2.7 2.5 2.7 3.04. Nominal GDP growth rate 12.1 8.0 7.4 7.0 10.1 7.4 5.2 8.1 7.0 4.5 -0.9 -3.9 -6.1 -7.1 -5.6 0.1 3.3
(% of GDP)
Budgetary constraint based on thedeficit
5. Deficit (net borrowing) 1) 9.1 3.7 4.5 4.8 5.7 7.6 5.5 5.7 6.5 9.8 15.7 10.7 9.5 9.0 13.5 2.0 1.16. Contribution of nominal GDP growth -10.5 -7.0 -7.2 -6.8 -9.4 -6.8 -4.9 -8.2 -7.0 -4.6 1.0 5.2 9.7 13.0 9.4 -0.2 -5.67. Stock-flow adjustment 3) 2.0 12.9 3.0 -0.1 -0.5 0.7 9.7 0.2 0.1 0.4 0.1 2.7 2.8 -35.4 -3.5 -2.1 -0.5
Budgetary constraint based on theprimary deficit
8. Primary deficit 4) -2.2 -3.7 -2.0 -0.7 0.7 2.6 1.0 1.3 2.0 4.8 10.5 4.9 2.4 4.0 9.4 -2.8 -4.19. Snow-ball effect 0.8 0.4 -0.7 -1.2 -4.5 -1.8 -0.4 -3.8 -2.5 0.4 6.2 11.0 16.8 18.0 13.5 4.6 -0.510. Stock-flow adjustment 3) 2.0 12.9 3.0 -0.1 -0.5 0.7 9.7 0.2 0.1 0.4 0.1 2.7 2.8 -35.4 -3.5 -2.1 -0.5
(% of GDP)
11. Change in gross debt 5) 0.7 9.5 0.3 -2.1 -4.3 1.4 10.2 -2.2 -0.5 5.6 16.8 18.6 22.0 -13.4 19.4 -0.3 -5.012. Level of gross debt (end of year) 97.9 104.4 104.7 102.6 98.3 99.8 110.0 107.8 107.3 112.9 129.7 148.3 170.3 156.9 176.2 175.9 170.9
1) Line 1 = line 5, a minus sign means a surplus.2) Actual interest payments as percentage of gross debt at end of t-1.3) Line 7 = line 10.4) Net borrowing excl. interest payments, line 8 = line 1 - line 2. A minus sign means a primary surplus.5) Line 11 = total of lines 5, 6 and 7 or 8, 9 and 10.
23
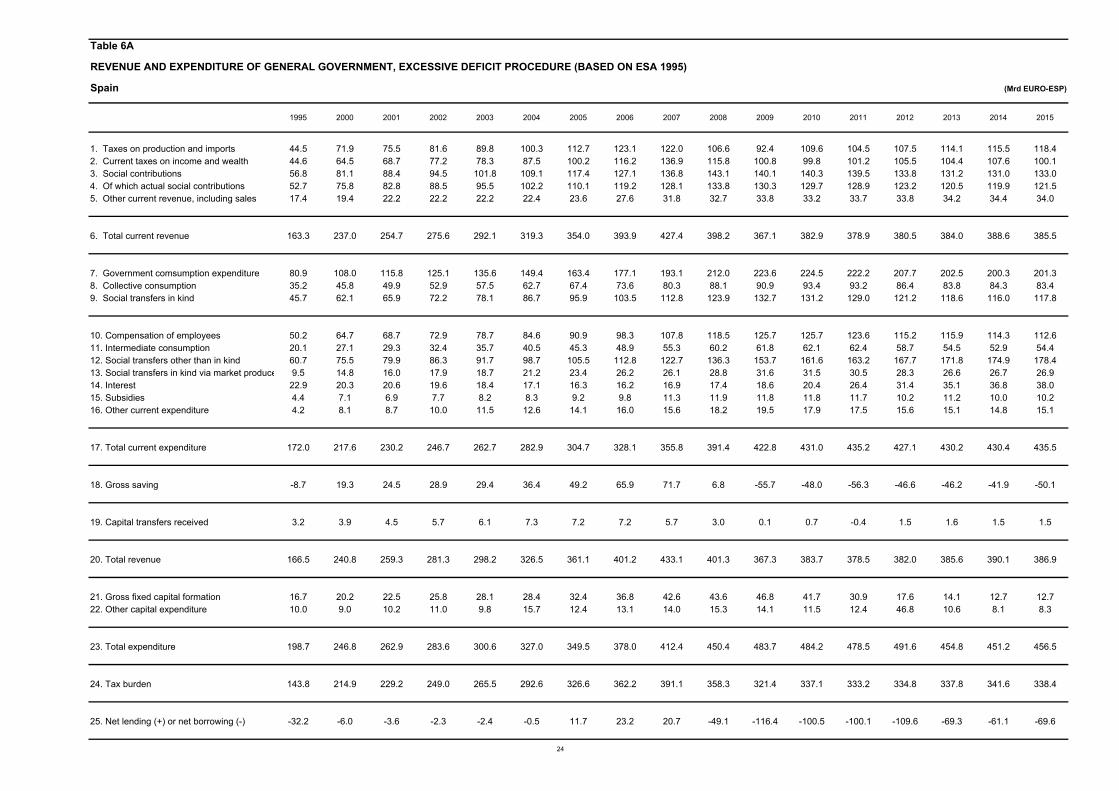
Table 6A
REVENUE AND EXPENDITURE OF GENERAL GOVERNMENT, EXCESSIVE DEFICIT PROCEDURE (BASED ON ESA 1995)
Spain (Mrd EURO-ESP)
1995 2000 2001 2002 2003 2004 2005 2006 2007 2008 2009 2010 2011 2012 2013 2014 2015
1. Taxes on production and imports 44.5 71.9 75.5 81.6 89.8 100.3 112.7 123.1 122.0 106.6 92.4 109.6 104.5 107.5 114.1 115.5 118.42. Current taxes on income and wealth 44.6 64.5 68.7 77.2 78.3 87.5 100.2 116.2 136.9 115.8 100.8 99.8 101.2 105.5 104.4 107.6 100.13. Social contributions 56.8 81.1 88.4 94.5 101.8 109.1 117.4 127.1 136.8 143.1 140.1 140.3 139.5 133.8 131.2 131.0 133.04. Of which actual social contributions 52.7 75.8 82.8 88.5 95.5 102.2 110.1 119.2 128.1 133.8 130.3 129.7 128.9 123.2 120.5 119.9 121.55. Other current revenue, including sales 17.4 19.4 22.2 22.2 22.2 22.4 23.6 27.6 31.8 32.7 33.8 33.2 33.7 33.8 34.2 34.4 34.0
6. Total current revenue 163.3 237.0 254.7 275.6 292.1 319.3 354.0 393.9 427.4 398.2 367.1 382.9 378.9 380.5 384.0 388.6 385.5
7. Government comsumption expenditure 80.9 108.0 115.8 125.1 135.6 149.4 163.4 177.1 193.1 212.0 223.6 224.5 222.2 207.7 202.5 200.3 201.38. Collective consumption 35.2 45.8 49.9 52.9 57.5 62.7 67.4 73.6 80.3 88.1 90.9 93.4 93.2 86.4 83.8 84.3 83.49. Social transfers in kind 45.7 62.1 65.9 72.2 78.1 86.7 95.9 103.5 112.8 123.9 132.7 131.2 129.0 121.2 118.6 116.0 117.8
10. Compensation of employees 50.2 64.7 68.7 72.9 78.7 84.6 90.9 98.3 107.8 118.5 125.7 125.7 123.6 115.2 115.9 114.3 112.611. Intermediate consumption 20.1 27.1 29.3 32.4 35.7 40.5 45.3 48.9 55.3 60.2 61.8 62.1 62.4 58.7 54.5 52.9 54.412. Social transfers other than in kind 60.7 75.5 79.9 86.3 91.7 98.7 105.5 112.8 122.7 136.3 153.7 161.6 163.2 167.7 171.8 174.9 178.413. Social transfers in kind via market produce 9.5 14.8 16.0 17.9 18.7 21.2 23.4 26.2 26.1 28.8 31.6 31.5 30.5 28.3 26.6 26.7 26.914. Interest 22.9 20.3 20.6 19.6 18.4 17.1 16.3 16.2 16.9 17.4 18.6 20.4 26.4 31.4 35.1 36.8 38.015. Subsidies 4.4 7.1 6.9 7.7 8.2 8.3 9.2 9.8 11.3 11.9 11.8 11.8 11.7 10.2 11.2 10.0 10.216. Other current expenditure 4.2 8.1 8.7 10.0 11.5 12.6 14.1 16.0 15.6 18.2 19.5 17.9 17.5 15.6 15.1 14.8 15.1
17. Total current expenditure 172.0 217.6 230.2 246.7 262.7 282.9 304.7 328.1 355.8 391.4 422.8 431.0 435.2 427.1 430.2 430.4 435.5
18. Gross saving -8.7 19.3 24.5 28.9 29.4 36.4 49.2 65.9 71.7 6.8 -55.7 -48.0 -56.3 -46.6 -46.2 -41.9 -50.1
19. Capital transfers received 3.2 3.9 4.5 5.7 6.1 7.3 7.2 7.2 5.7 3.0 0.1 0.7 -0.4 1.5 1.6 1.5 1.5
20. Total revenue 166.5 240.8 259.3 281.3 298.2 326.5 361.1 401.2 433.1 401.3 367.3 383.7 378.5 382.0 385.6 390.1 386.9
21. Gross fixed capital formation 16.7 20.2 22.5 25.8 28.1 28.4 32.4 36.8 42.6 43.6 46.8 41.7 30.9 17.6 14.1 12.7 12.722. Other capital expenditure 10.0 9.0 10.2 11.0 9.8 15.7 12.4 13.1 14.0 15.3 14.1 11.5 12.4 46.8 10.6 8.1 8.3
23. Total expenditure 198.7 246.8 262.9 283.6 300.6 327.0 349.5 378.0 412.4 450.4 483.7 484.2 478.5 491.6 454.8 451.2 456.5
24. Tax burden 143.8 214.9 229.2 249.0 265.5 292.6 326.6 362.2 391.1 358.3 321.4 337.1 333.2 334.8 337.8 341.6 338.4
25. Net lending (+) or net borrowing (-) -32.2 -6.0 -3.6 -2.3 -2.4 -0.5 11.7 23.2 20.7 -49.1 -116.4 -100.5 -100.1 -109.6 -69.3 -61.1 -69.6
24

Table 6B
Contributions to the change in the general government gross debt ratio
Spain
1995 2000 2001 2002 2003 2004 2005 2006 2007 2008 2009 2010 2011 2012 2013 2014 2015
1. Net borrowing (% of GDP) 1) 7.2 0.9 0.5 0.3 0.3 0.1 -1.3 -2.4 -2.0 4.5 11.1 9.6 9.6 10.6 6.8 5.9 6.62. Interest payments (% of GDP) 5.1 3.2 3.0 2.7 2.3 2.0 1.8 1.6 1.6 1.6 1.8 1.9 2.5 3.0 3.4 3.6 3.6
3. Implicit interest rate 2) 9.2 5.6 5.5 5.2 4.8 4.5 4.2 4.1 4.3 4.6 4.2 3.6 4.1 4.3 4.0 3.8 3.74. Nominal GDP growth rate 7.8 8.7 8.0 7.2 7.4 7.4 8.1 8.4 6.9 3.3 -3.8 -0.1 0.1 -1.7 -0.9 1.1 2.4
(% of GDP)
Budgetary constraint based on thedeficit
5. Deficit (net borrowing) 1) 7.2 0.9 0.5 0.3 0.3 0.1 -1.3 -2.4 -2.0 4.5 11.1 9.6 9.6 10.6 6.8 5.9 6.66. Contribution of nominal GDP growth -4.3 -5.0 -4.4 -3.7 -3.6 -3.4 -3.5 -3.3 -2.5 -1.2 1.6 0.1 0.0 1.2 0.8 -1.1 -2.37. Stock-flow adjustment 3) 0.6 1.0 0.1 0.4 -0.5 0.8 1.7 2.2 1.1 0.5 1.1 -2.0 -0.7 3.7 1.2 0.2 0.2
Budgetary constraint based on theprimary deficit
8. Primary deficit 4) 2.1 -2.3 -2.5 -2.4 -2.0 -2.0 -3.1 -4.0 -3.6 2.9 9.3 7.7 7.0 7.6 3.3 2.4 3.09. Snow-ball effect 0.8 -1.8 -1.4 -1.0 -1.3 -1.3 -1.7 -1.7 -0.9 0.4 3.3 2.0 2.5 4.2 4.2 2.5 1.310. Stock-flow adjustment 3) 0.6 1.0 0.1 0.4 -0.5 0.8 1.7 2.2 1.1 0.5 1.1 -2.0 -0.7 3.7 1.2 0.2 0.2
(% of GDP)
11. Change in gross debt 5) 3.5 -3.0 -3.8 -3.0 -3.8 -2.5 -3.1 -3.5 -3.4 3.9 13.8 7.7 8.8 15.5 8.8 5.1 4.512. Level of gross debt (end of year) 63.3 59.4 55.6 52.6 48.8 46.3 43.2 39.7 36.3 40.2 54.0 61.7 70.5 86.0 94.8 99.9 104.3
1) Line 1 = line 5, a minus sign means a surplus.2) Actual interest payments as percentage of gross debt at end of t-1.3) Line 7 = line 10.4) Net borrowing excl. interest payments, line 8 = line 1 - line 2. A minus sign means a primary surplus.5) Line 11 = total of lines 5, 6 and 7 or 8, 9 and 10.
25
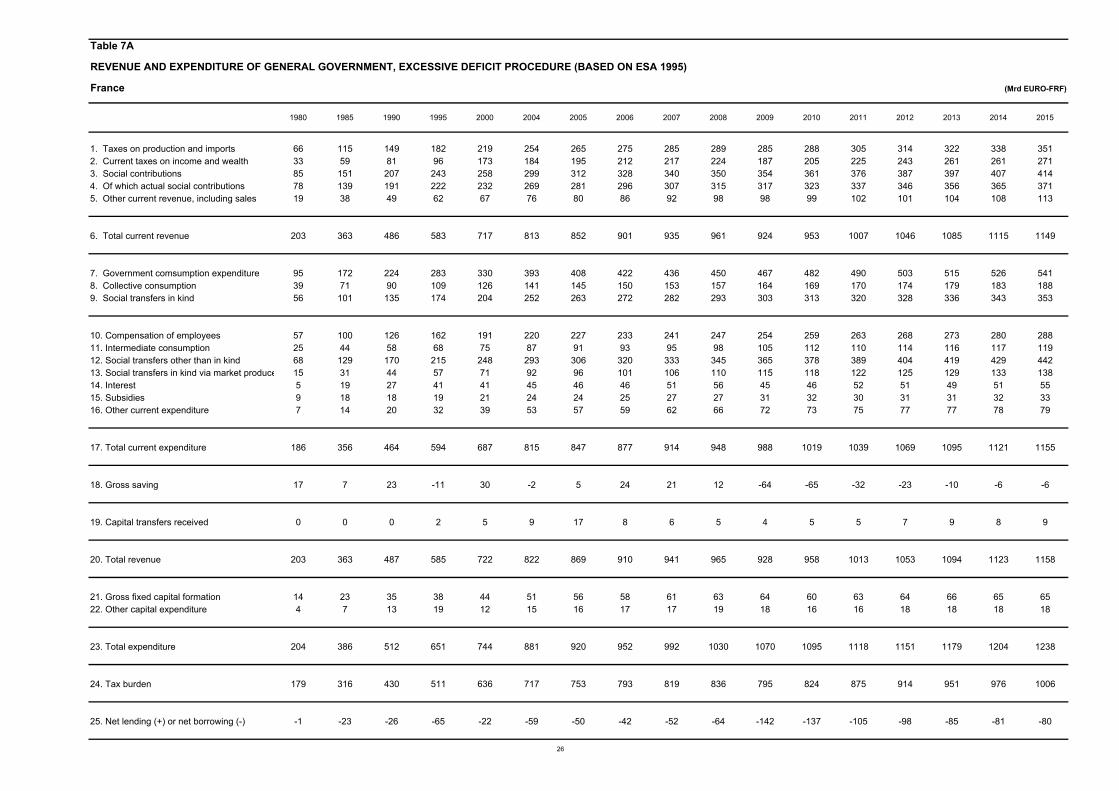
Table 7A
REVENUE AND EXPENDITURE OF GENERAL GOVERNMENT, EXCESSIVE DEFICIT PROCEDURE (BASED ON ESA 1995)
France (Mrd EURO-FRF)
1980 1985 1990 1995 2000 2004 2005 2006 2007 2008 2009 2010 2011 2012 2013 2014 2015
1. Taxes on production and imports 66 115 149 182 219 254 265 275 285 289 285 288 305 314 322 338 3512. Current taxes on income and wealth 33 59 81 96 173 184 195 212 217 224 187 205 225 243 261 261 2713. Social contributions 85 151 207 243 258 299 312 328 340 350 354 361 376 387 397 407 4144. Of which actual social contributions 78 139 191 222 232 269 281 296 307 315 317 323 337 346 356 365 3715. Other current revenue, including sales 19 38 49 62 67 76 80 86 92 98 98 99 102 101 104 108 113
6. Total current revenue 203 363 486 583 717 813 852 901 935 961 924 953 1007 1046 1085 1115 1149
7. Government comsumption expenditure 95 172 224 283 330 393 408 422 436 450 467 482 490 503 515 526 5418. Collective consumption 39 71 90 109 126 141 145 150 153 157 164 169 170 174 179 183 1889. Social transfers in kind 56 101 135 174 204 252 263 272 282 293 303 313 320 328 336 343 353
10. Compensation of employees 57 100 126 162 191 220 227 233 241 247 254 259 263 268 273 280 28811. Intermediate consumption 25 44 58 68 75 87 91 93 95 98 105 112 110 114 116 117 11912. Social transfers other than in kind 68 129 170 215 248 293 306 320 333 345 365 378 389 404 419 429 44213. Social transfers in kind via market produce 15 31 44 57 71 92 96 101 106 110 115 118 122 125 129 133 13814. Interest 5 19 27 41 41 45 46 46 51 56 45 46 52 51 49 51 5515. Subsidies 9 18 18 19 21 24 24 25 27 27 31 32 30 31 31 32 3316. Other current expenditure 7 14 20 32 39 53 57 59 62 66 72 73 75 77 77 78 79
17. Total current expenditure 186 356 464 594 687 815 847 877 914 948 988 1019 1039 1069 1095 1121 1155
18. Gross saving 17 7 23 -11 30 -2 5 24 21 12 -64 -65 -32 -23 -10 -6 -6
19. Capital transfers received 0 0 0 2 5 9 17 8 6 5 4 5 5 7 9 8 9
20. Total revenue 203 363 487 585 722 822 869 910 941 965 928 958 1013 1053 1094 1123 1158
21. Gross fixed capital formation 14 23 35 38 44 51 56 58 61 63 64 60 63 64 66 65 6522. Other capital expenditure 4 7 13 19 12 15 16 17 17 19 18 16 16 18 18 18 18
23. Total expenditure 204 386 512 651 744 881 920 952 992 1030 1070 1095 1118 1151 1179 1204 1238
24. Tax burden 179 316 430 511 636 717 753 793 819 836 795 824 875 914 951 976 1006
25. Net lending (+) or net borrowing (-) -1 -23 -26 -65 -22 -59 -50 -42 -52 -64 -142 -137 -105 -98 -85 -81 -80
26

Table 7B
Contributions to the change in the general government gross debt ratio
France
1995 2000 2001 2002 2003 2004 2005 2006 2007 2008 2009 2010 2011 2012 2013 2014 2015
1. Net borrowing (% of GDP) 1) 5.5 1.5 1.6 3.3 4.1 3.6 2.9 2.3 2.7 3.3 7.5 7.1 5.3 4.8 4.1 3.8 3.72. Interest payments (% of GDP) 3.4 2.9 3.0 2.9 2.8 2.7 2.7 2.6 2.7 2.9 2.4 2.4 2.6 2.5 2.4 2.4 2.5
3. Implicit interest rate 2) 7.2 5.1 5.4 5.3 4.9 4.5 4.2 4.0 4.4 4.6 3.4 3.1 3.3 3.0 2.7 2.7 2.74. Nominal GDP growth rate 3.3 5.3 3.9 3.2 2.9 4.3 3.8 4.7 4.9 2.5 -2.5 2.7 3.3 1.5 1.7 2.5 3.2
(% of GDP)
Budgetary constraint based on thedeficit
5. Deficit (net borrowing) 1) 5.5 1.5 1.6 3.3 4.1 3.6 2.9 2.3 2.7 3.3 7.5 7.1 5.3 4.8 4.1 3.8 3.76. Contribution of nominal GDP growth -1.6 -3.0 -2.1 -1.8 -1.7 -2.6 -2.4 -3.0 -3.0 -1.5 1.7 -2.1 -2.7 -1.3 -1.5 -2.3 -3.07. Stock-flow adjustment 3) 2.4 0.0 0.1 0.5 1.8 0.9 1.0 -2.1 0.4 2.2 1.7 -1.8 0.8 0.9 0.6 0.3 0.0
Budgetary constraint based on theprimary deficit
8. Primary deficit 4) 2.0 -1.4 -1.4 0.3 1.3 0.8 0.3 -0.2 0.0 0.4 5.1 4.7 2.7 2.3 1.8 1.4 1.19. Snow-ball effect 1.9 -0.1 0.9 1.2 1.1 0.1 0.3 -0.4 -0.3 1.4 4.1 0.3 -0.1 1.2 0.9 0.1 -0.410. Stock-flow adjustment 3) 2.4 0.0 0.1 0.5 1.8 0.9 1.0 -2.1 0.4 2.2 1.7 -1.8 0.8 0.9 0.6 0.3 0.0
(% of GDP)
11. Change in gross debt 5) 6.2 -1.5 -0.4 2.1 4.2 1.9 1.6 -2.7 0.1 4.0 11.0 3.2 3.4 4.4 3.3 1.8 0.712. Level of gross debt (end of year) 55.5 57.5 57.1 59.1 63.3 65.2 66.8 64.1 64.2 68.2 79.2 82.4 85.8 90.2 93.5 95.3 96.0
1) Line 1 = line 5, a minus sign means a surplus.2) Actual interest payments as percentage of gross debt at end of t-1.3) Line 7 = line 10.4) Net borrowing excl. interest payments, line 8 = line 1 - line 2. A minus sign means a primary surplus.5) Line 11 = total of lines 5, 6 and 7 or 8, 9 and 10.
27
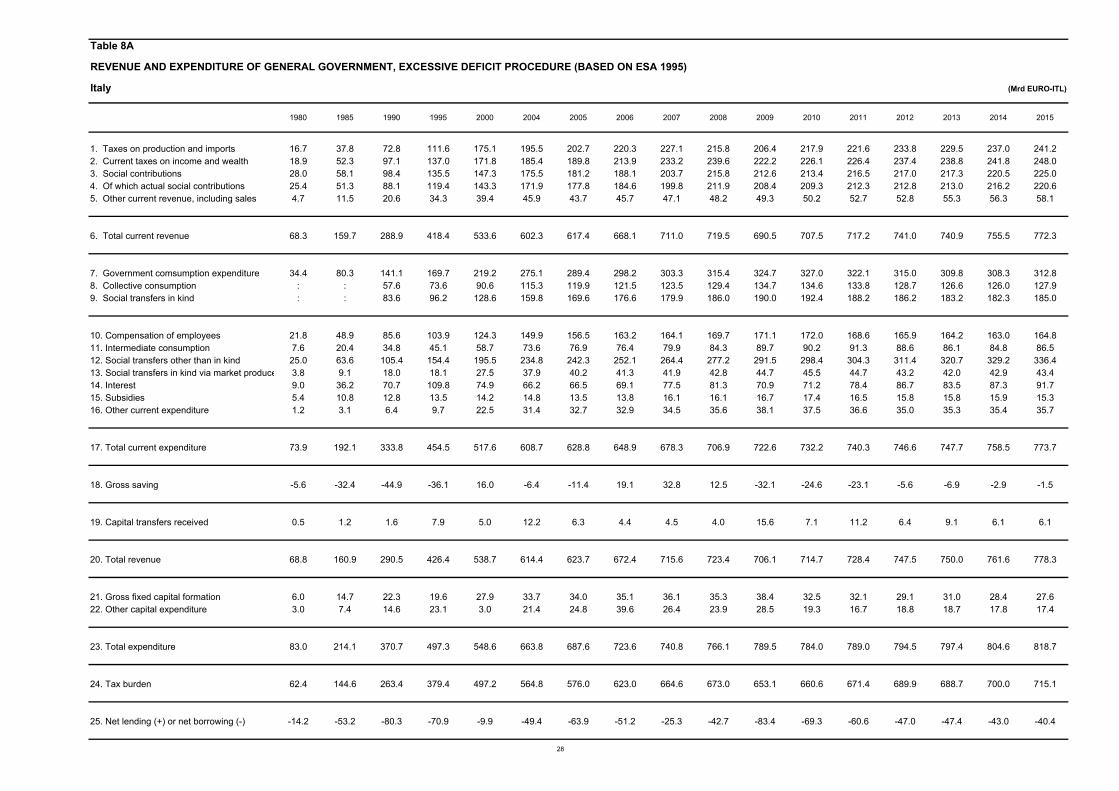
Table 8A
REVENUE AND EXPENDITURE OF GENERAL GOVERNMENT, EXCESSIVE DEFICIT PROCEDURE (BASED ON ESA 1995)
Italy (Mrd EURO-ITL)
1980 1985 1990 1995 2000 2004 2005 2006 2007 2008 2009 2010 2011 2012 2013 2014 2015
1. Taxes on production and imports 16.7 37.8 72.8 111.6 175.1 195.5 202.7 220.3 227.1 215.8 206.4 217.9 221.6 233.8 229.5 237.0 241.22. Current taxes on income and wealth 18.9 52.3 97.1 137.0 171.8 185.4 189.8 213.9 233.2 239.6 222.2 226.1 226.4 237.4 238.8 241.8 248.03. Social contributions 28.0 58.1 98.4 135.5 147.3 175.5 181.2 188.1 203.7 215.8 212.6 213.4 216.5 217.0 217.3 220.5 225.04. Of which actual social contributions 25.4 51.3 88.1 119.4 143.3 171.9 177.8 184.6 199.8 211.9 208.4 209.3 212.3 212.8 213.0 216.2 220.65. Other current revenue, including sales 4.7 11.5 20.6 34.3 39.4 45.9 43.7 45.7 47.1 48.2 49.3 50.2 52.7 52.8 55.3 56.3 58.1
6. Total current revenue 68.3 159.7 288.9 418.4 533.6 602.3 617.4 668.1 711.0 719.5 690.5 707.5 717.2 741.0 740.9 755.5 772.3
7. Government comsumption expenditure 34.4 80.3 141.1 169.7 219.2 275.1 289.4 298.2 303.3 315.4 324.7 327.0 322.1 315.0 309.8 308.3 312.88. Collective consumption : : 57.6 73.6 90.6 115.3 119.9 121.5 123.5 129.4 134.7 134.6 133.8 128.7 126.6 126.0 127.99. Social transfers in kind : : 83.6 96.2 128.6 159.8 169.6 176.6 179.9 186.0 190.0 192.4 188.2 186.2 183.2 182.3 185.0
10. Compensation of employees 21.8 48.9 85.6 103.9 124.3 149.9 156.5 163.2 164.1 169.7 171.1 172.0 168.6 165.9 164.2 163.0 164.811. Intermediate consumption 7.6 20.4 34.8 45.1 58.7 73.6 76.9 76.4 79.9 84.3 89.7 90.2 91.3 88.6 86.1 84.8 86.512. Social transfers other than in kind 25.0 63.6 105.4 154.4 195.5 234.8 242.3 252.1 264.4 277.2 291.5 298.4 304.3 311.4 320.7 329.2 336.413. Social transfers in kind via market produce 3.8 9.1 18.0 18.1 27.5 37.9 40.2 41.3 41.9 42.8 44.7 45.5 44.7 43.2 42.0 42.9 43.414. Interest 9.0 36.2 70.7 109.8 74.9 66.2 66.5 69.1 77.5 81.3 70.9 71.2 78.4 86.7 83.5 87.3 91.715. Subsidies 5.4 10.8 12.8 13.5 14.2 14.8 13.5 13.8 16.1 16.1 16.7 17.4 16.5 15.8 15.8 15.9 15.316. Other current expenditure 1.2 3.1 6.4 9.7 22.5 31.4 32.7 32.9 34.5 35.6 38.1 37.5 36.6 35.0 35.3 35.4 35.7
17. Total current expenditure 73.9 192.1 333.8 454.5 517.6 608.7 628.8 648.9 678.3 706.9 722.6 732.2 740.3 746.6 747.7 758.5 773.7
18. Gross saving -5.6 -32.4 -44.9 -36.1 16.0 -6.4 -11.4 19.1 32.8 12.5 -32.1 -24.6 -23.1 -5.6 -6.9 -2.9 -1.5
19. Capital transfers received 0.5 1.2 1.6 7.9 5.0 12.2 6.3 4.4 4.5 4.0 15.6 7.1 11.2 6.4 9.1 6.1 6.1
20. Total revenue 68.8 160.9 290.5 426.4 538.7 614.4 623.7 672.4 715.6 723.4 706.1 714.7 728.4 747.5 750.0 761.6 778.3
21. Gross fixed capital formation 6.0 14.7 22.3 19.6 27.9 33.7 34.0 35.1 36.1 35.3 38.4 32.5 32.1 29.1 31.0 28.4 27.622. Other capital expenditure 3.0 7.4 14.6 23.1 3.0 21.4 24.8 39.6 26.4 23.9 28.5 19.3 16.7 18.8 18.7 17.8 17.4
23. Total expenditure 83.0 214.1 370.7 497.3 548.6 663.8 687.6 723.6 740.8 766.1 789.5 784.0 789.0 794.5 797.4 804.6 818.7
24. Tax burden 62.4 144.6 263.4 379.4 497.2 564.8 576.0 623.0 664.6 673.0 653.1 660.6 671.4 689.9 688.7 700.0 715.1
25. Net lending (+) or net borrowing (-) -14.2 -53.2 -80.3 -70.9 -9.9 -49.4 -63.9 -51.2 -25.3 -42.7 -83.4 -69.3 -60.6 -47.0 -47.4 -43.0 -40.4
28

Table 8B
Contributions to the change in the general government gross debt ratio
Italy
1995 2000 2001 2002 2003 2004 2005 2006 2007 2008 2009 2010 2011 2012 2013 2014 2015
1. Net borrowing (% of GDP) 1) 7.4 0.8 3.1 3.1 3.6 3.5 4.4 3.4 1.6 2.7 5.5 4.5 3.8 3.0 3.0 2.7 2.52. Interest payments (% of GDP) 11.5 6.2 6.2 5.6 5.1 4.7 4.6 4.6 5.0 5.2 4.7 4.6 5.0 5.5 5.4 5.5 5.6
3. Implicit interest rate 2) 10.3 5.8 6.0 5.3 5.0 4.7 4.6 4.6 4.9 5.1 4.2 4.0 4.2 4.5 4.2 4.2 4.34. Nominal GDP growth rate 8.0 5.7 4.8 3.7 3.1 4.2 2.8 3.9 4.1 1.3 -3.5 2.1 1.8 -0.8 -0.5 2.2 2.6
(% of GDP)
Budgetary constraint based on thedeficit
5. Deficit (net borrowing) 1) 7.4 0.8 3.1 3.1 3.6 3.5 4.4 3.4 1.6 2.7 5.5 4.5 3.8 3.0 3.0 2.7 2.56. Contribution of nominal GDP growth -8.9 -6.1 -5.0 -3.8 -3.1 -4.2 -2.8 -4.0 -4.2 -1.4 3.9 -2.4 -2.2 1.0 0.7 -2.8 -3.47. Stock-flow adjustment 3) 1.2 0.7 1.6 -2.2 -1.7 0.2 0.4 1.2 -0.5 1.5 1.0 0.8 -0.3 2.2 2.3 1.1 0.1
Budgetary constraint based on theprimary deficit
8. Primary deficit 4) -4.1 -5.4 -3.1 -2.5 -1.5 -1.2 -0.2 -1.2 -3.4 -2.5 0.8 -0.1 -1.1 -2.5 -2.3 -2.8 -3.19. Snow-ball effect 2.6 0.2 1.3 1.7 2.0 0.6 1.8 0.6 0.8 3.8 8.5 2.2 2.8 6.6 6.0 2.7 2.210. Stock-flow adjustment 3) 1.2 0.7 1.6 -2.2 -1.7 0.2 0.4 1.2 -0.5 1.5 1.0 0.8 -0.3 2.2 2.3 1.1 0.1
(% of GDP)
11. Change in gross debt 5) -0.3 -4.5 -0.3 -3.0 -1.2 -0.4 2.0 0.6 -3.1 2.8 10.3 2.9 1.4 6.3 6.0 1.0 -0.912. Level of gross debt (end of year) 120.9 108.6 108.3 105.4 104.1 103.7 105.7 106.3 103.3 106.1 116.4 119.3 120.7 127.0 133.0 134.0 133.1
1) Line 1 = line 5, a minus sign means a surplus.2) Actual interest payments as percentage of gross debt at end of t-1.3) Line 7 = line 10.4) Net borrowing excl. interest payments, line 8 = line 1 - line 2. A minus sign means a primary surplus.5) Line 11 = total of lines 5, 6 and 7 or 8, 9 and 10.
29
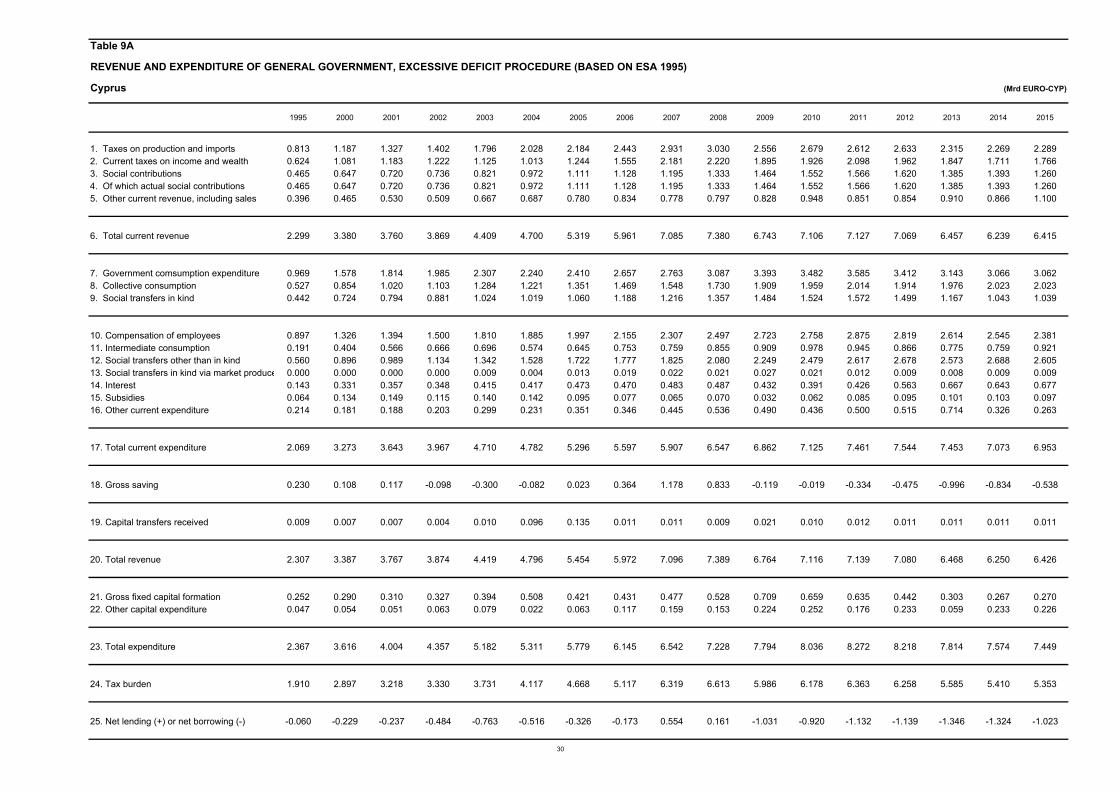
Table 9A
REVENUE AND EXPENDITURE OF GENERAL GOVERNMENT, EXCESSIVE DEFICIT PROCEDURE (BASED ON ESA 1995)
Cyprus (Mrd EURO-CYP)
1995 2000 2001 2002 2003 2004 2005 2006 2007 2008 2009 2010 2011 2012 2013 2014 2015
1. Taxes on production and imports 0.813 1.187 1.327 1.402 1.796 2.028 2.184 2.443 2.931 3.030 2.556 2.679 2.612 2.633 2.315 2.269 2.2892. Current taxes on income and wealth 0.624 1.081 1.183 1.222 1.125 1.013 1.244 1.555 2.181 2.220 1.895 1.926 2.098 1.962 1.847 1.711 1.7663. Social contributions 0.465 0.647 0.720 0.736 0.821 0.972 1.111 1.128 1.195 1.333 1.464 1.552 1.566 1.620 1.385 1.393 1.2604. Of which actual social contributions 0.465 0.647 0.720 0.736 0.821 0.972 1.111 1.128 1.195 1.333 1.464 1.552 1.566 1.620 1.385 1.393 1.2605. Other current revenue, including sales 0.396 0.465 0.530 0.509 0.667 0.687 0.780 0.834 0.778 0.797 0.828 0.948 0.851 0.854 0.910 0.866 1.100
6. Total current revenue 2.299 3.380 3.760 3.869 4.409 4.700 5.319 5.961 7.085 7.380 6.743 7.106 7.127 7.069 6.457 6.239 6.415
7. Government comsumption expenditure 0.969 1.578 1.814 1.985 2.307 2.240 2.410 2.657 2.763 3.087 3.393 3.482 3.585 3.412 3.143 3.066 3.0628. Collective consumption 0.527 0.854 1.020 1.103 1.284 1.221 1.351 1.469 1.548 1.730 1.909 1.959 2.014 1.914 1.976 2.023 2.0239. Social transfers in kind 0.442 0.724 0.794 0.881 1.024 1.019 1.060 1.188 1.216 1.357 1.484 1.524 1.572 1.499 1.167 1.043 1.039
10. Compensation of employees 0.897 1.326 1.394 1.500 1.810 1.885 1.997 2.155 2.307 2.497 2.723 2.758 2.875 2.819 2.614 2.545 2.38111. Intermediate consumption 0.191 0.404 0.566 0.666 0.696 0.574 0.645 0.753 0.759 0.855 0.909 0.978 0.945 0.866 0.775 0.759 0.92112. Social transfers other than in kind 0.560 0.896 0.989 1.134 1.342 1.528 1.722 1.777 1.825 2.080 2.249 2.479 2.617 2.678 2.573 2.688 2.60513. Social transfers in kind via market produce 0.000 0.000 0.000 0.000 0.009 0.004 0.013 0.019 0.022 0.021 0.027 0.021 0.012 0.009 0.008 0.009 0.00914. Interest 0.143 0.331 0.357 0.348 0.415 0.417 0.473 0.470 0.483 0.487 0.432 0.391 0.426 0.563 0.667 0.643 0.67715. Subsidies 0.064 0.134 0.149 0.115 0.140 0.142 0.095 0.077 0.065 0.070 0.032 0.062 0.085 0.095 0.101 0.103 0.09716. Other current expenditure 0.214 0.181 0.188 0.203 0.299 0.231 0.351 0.346 0.445 0.536 0.490 0.436 0.500 0.515 0.714 0.326 0.263
17. Total current expenditure 2.069 3.273 3.643 3.967 4.710 4.782 5.296 5.597 5.907 6.547 6.862 7.125 7.461 7.544 7.453 7.073 6.953
18. Gross saving 0.230 0.108 0.117 -0.098 -0.300 -0.082 0.023 0.364 1.178 0.833 -0.119 -0.019 -0.334 -0.475 -0.996 -0.834 -0.538
19. Capital transfers received 0.009 0.007 0.007 0.004 0.010 0.096 0.135 0.011 0.011 0.009 0.021 0.010 0.012 0.011 0.011 0.011 0.011
20. Total revenue 2.307 3.387 3.767 3.874 4.419 4.796 5.454 5.972 7.096 7.389 6.764 7.116 7.139 7.080 6.468 6.250 6.426
21. Gross fixed capital formation 0.252 0.290 0.310 0.327 0.394 0.508 0.421 0.431 0.477 0.528 0.709 0.659 0.635 0.442 0.303 0.267 0.27022. Other capital expenditure 0.047 0.054 0.051 0.063 0.079 0.022 0.063 0.117 0.159 0.153 0.224 0.252 0.176 0.233 0.059 0.233 0.226
23. Total expenditure 2.367 3.616 4.004 4.357 5.182 5.311 5.779 6.145 6.542 7.228 7.794 8.036 8.272 8.218 7.814 7.574 7.449
24. Tax burden 1.910 2.897 3.218 3.330 3.731 4.117 4.668 5.117 6.319 6.613 5.986 6.178 6.363 6.258 5.585 5.410 5.353
25. Net lending (+) or net borrowing (-) -0.060 -0.229 -0.237 -0.484 -0.763 -0.516 -0.326 -0.173 0.554 0.161 -1.031 -0.920 -1.132 -1.139 -1.346 -1.324 -1.023
30

Table 9B
Contributions to the change in the general government gross debt ratio
Cyprus
1999 2000 2001 2002 2003 2004 2005 2006 2007 2008 2009 2010 2011 2012 2013 2014 2015
1. Net borrowing (% of GDP) 1) 4.3 2.3 2.2 4.4 6.6 4.1 2.4 1.2 -3.5 -0.9 6.1 5.3 6.3 6.4 8.3 8.4 6.32. Interest payments (% of GDP) 3.1 3.4 3.4 3.2 3.6 3.3 3.5 3.3 3.0 2.8 2.6 2.2 2.4 3.2 4.1 4.1 4.2
3. Implicit interest rate 2) 5.6 6.2 6.1 5.4 5.8 5.1 5.3 5.1 5.2 5.2 5.1 4.0 4.0 4.4 4.3 3.4 3.54. Nominal GDP growth rate 7.7 8.3 8.1 3.3 6.8 7.7 7.0 7.7 9.7 8.4 -1.8 3.3 2.7 -0.9 -8.2 -2.9 2.6
(% of GDP)
Budgetary constraint based on thedeficit
5. Deficit (net borrowing) 1) 4.3 2.3 2.2 4.4 6.6 4.1 2.4 1.2 -3.5 -0.9 6.1 5.3 6.3 6.4 8.3 8.4 6.36. Contribution of nominal GDP growth -4.2 -4.5 -4.5 -1.9 -4.1 -5.0 -4.7 -5.0 -5.7 -4.5 0.9 -1.9 -1.6 0.6 7.8 3.5 -3.27. Stock-flow adjustment 3) -0.1 2.5 3.8 1.5 2.1 2.1 0.7 -1.0 3.3 -4.4 2.6 -0.6 5.4 8.1 13.3 -3.5 -0.1
Budgetary constraint based on theprimary deficit
8. Primary deficit 4) 1.3 -1.1 -1.1 1.2 3.0 0.8 -1.1 -2.1 -6.5 -3.8 3.6 3.0 4.0 3.3 4.2 4.3 2.19. Snow-ball effect -1.2 -1.1 -1.1 1.3 -0.6 -1.6 -1.1 -1.7 -2.7 -1.7 3.4 0.4 0.8 3.8 11.9 7.6 1.010. Stock-flow adjustment 3) -0.1 2.5 3.8 1.5 2.1 2.1 0.7 -1.0 3.3 -4.4 2.6 -0.6 5.4 8.1 13.3 -3.5 -0.1
(% of GDP)
11. Change in gross debt 5) 0.1 0.3 1.6 4.0 4.6 1.2 -1.5 -4.7 -5.9 -9.9 9.6 2.8 10.1 15.1 29.4 8.3 3.112. Level of gross debt (end of year) 59.3 59.6 61.2 65.1 69.7 70.9 69.4 64.7 58.8 48.9 58.5 61.3 71.5 86.6 116.0 124.4 127.4
1) Line 1 = line 5, a minus sign means a surplus.2) Actual interest payments as percentage of gross debt at end of t-1.3) Line 7 = line 10.4) Net borrowing excl. interest payments, line 8 = line 1 - line 2. A minus sign means a primary surplus.5) Line 11 = total of lines 5, 6 and 7 or 8, 9 and 10.
31
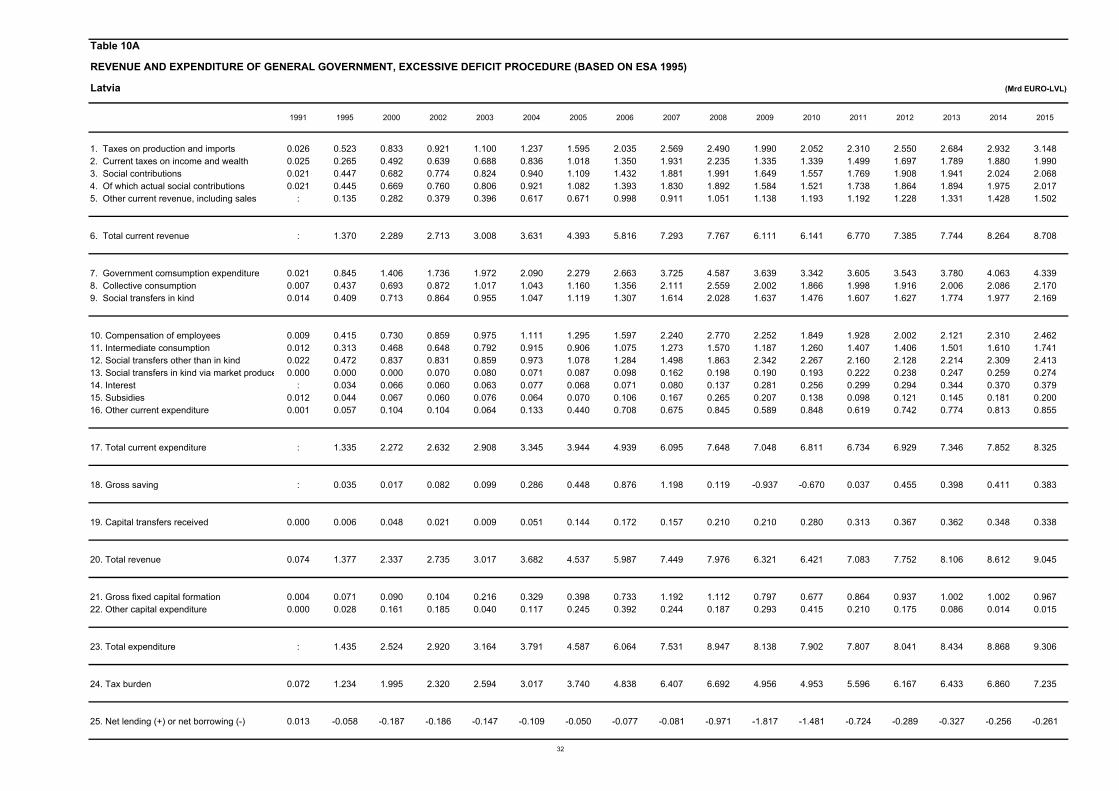
Table 10A
REVENUE AND EXPENDITURE OF GENERAL GOVERNMENT, EXCESSIVE DEFICIT PROCEDURE (BASED ON ESA 1995)
Latvia (Mrd EURO-LVL)
1991 1995 2000 2002 2003 2004 2005 2006 2007 2008 2009 2010 2011 2012 2013 2014 2015
1. Taxes on production and imports 0.026 0.523 0.833 0.921 1.100 1.237 1.595 2.035 2.569 2.490 1.990 2.052 2.310 2.550 2.684 2.932 3.1482. Current taxes on income and wealth 0.025 0.265 0.492 0.639 0.688 0.836 1.018 1.350 1.931 2.235 1.335 1.339 1.499 1.697 1.789 1.880 1.9903. Social contributions 0.021 0.447 0.682 0.774 0.824 0.940 1.109 1.432 1.881 1.991 1.649 1.557 1.769 1.908 1.941 2.024 2.0684. Of which actual social contributions 0.021 0.445 0.669 0.760 0.806 0.921 1.082 1.393 1.830 1.892 1.584 1.521 1.738 1.864 1.894 1.975 2.0175. Other current revenue, including sales : 0.135 0.282 0.379 0.396 0.617 0.671 0.998 0.911 1.051 1.138 1.193 1.192 1.228 1.331 1.428 1.502
6. Total current revenue : 1.370 2.289 2.713 3.008 3.631 4.393 5.816 7.293 7.767 6.111 6.141 6.770 7.385 7.744 8.264 8.708
7. Government comsumption expenditure 0.021 0.845 1.406 1.736 1.972 2.090 2.279 2.663 3.725 4.587 3.639 3.342 3.605 3.543 3.780 4.063 4.3398. Collective consumption 0.007 0.437 0.693 0.872 1.017 1.043 1.160 1.356 2.111 2.559 2.002 1.866 1.998 1.916 2.006 2.086 2.1709. Social transfers in kind 0.014 0.409 0.713 0.864 0.955 1.047 1.119 1.307 1.614 2.028 1.637 1.476 1.607 1.627 1.774 1.977 2.169
10. Compensation of employees 0.009 0.415 0.730 0.859 0.975 1.111 1.295 1.597 2.240 2.770 2.252 1.849 1.928 2.002 2.121 2.310 2.46211. Intermediate consumption 0.012 0.313 0.468 0.648 0.792 0.915 0.906 1.075 1.273 1.570 1.187 1.260 1.407 1.406 1.501 1.610 1.74112. Social transfers other than in kind 0.022 0.472 0.837 0.831 0.859 0.973 1.078 1.284 1.498 1.863 2.342 2.267 2.160 2.128 2.214 2.309 2.41313. Social transfers in kind via market produce 0.000 0.000 0.000 0.070 0.080 0.071 0.087 0.098 0.162 0.198 0.190 0.193 0.222 0.238 0.247 0.259 0.27414. Interest : 0.034 0.066 0.060 0.063 0.077 0.068 0.071 0.080 0.137 0.281 0.256 0.299 0.294 0.344 0.370 0.37915. Subsidies 0.012 0.044 0.067 0.060 0.076 0.064 0.070 0.106 0.167 0.265 0.207 0.138 0.098 0.121 0.145 0.181 0.20016. Other current expenditure 0.001 0.057 0.104 0.104 0.064 0.133 0.440 0.708 0.675 0.845 0.589 0.848 0.619 0.742 0.774 0.813 0.855
17. Total current expenditure : 1.335 2.272 2.632 2.908 3.345 3.944 4.939 6.095 7.648 7.048 6.811 6.734 6.929 7.346 7.852 8.325
18. Gross saving : 0.035 0.017 0.082 0.099 0.286 0.448 0.876 1.198 0.119 -0.937 -0.670 0.037 0.455 0.398 0.411 0.383
19. Capital transfers received 0.000 0.006 0.048 0.021 0.009 0.051 0.144 0.172 0.157 0.210 0.210 0.280 0.313 0.367 0.362 0.348 0.338
20. Total revenue 0.074 1.377 2.337 2.735 3.017 3.682 4.537 5.987 7.449 7.976 6.321 6.421 7.083 7.752 8.106 8.612 9.045
21. Gross fixed capital formation 0.004 0.071 0.090 0.104 0.216 0.329 0.398 0.733 1.192 1.112 0.797 0.677 0.864 0.937 1.002 1.002 0.96722. Other capital expenditure 0.000 0.028 0.161 0.185 0.040 0.117 0.245 0.392 0.244 0.187 0.293 0.415 0.210 0.175 0.086 0.014 0.015
23. Total expenditure : 1.435 2.524 2.920 3.164 3.791 4.587 6.064 7.531 8.947 8.138 7.902 7.807 8.041 8.434 8.868 9.306
24. Tax burden 0.072 1.234 1.995 2.320 2.594 3.017 3.740 4.838 6.407 6.692 4.956 4.953 5.596 6.167 6.433 6.860 7.235
25. Net lending (+) or net borrowing (-) 0.013 -0.058 -0.187 -0.186 -0.147 -0.109 -0.050 -0.077 -0.081 -0.971 -1.817 -1.481 -0.724 -0.289 -0.327 -0.256 -0.261
32
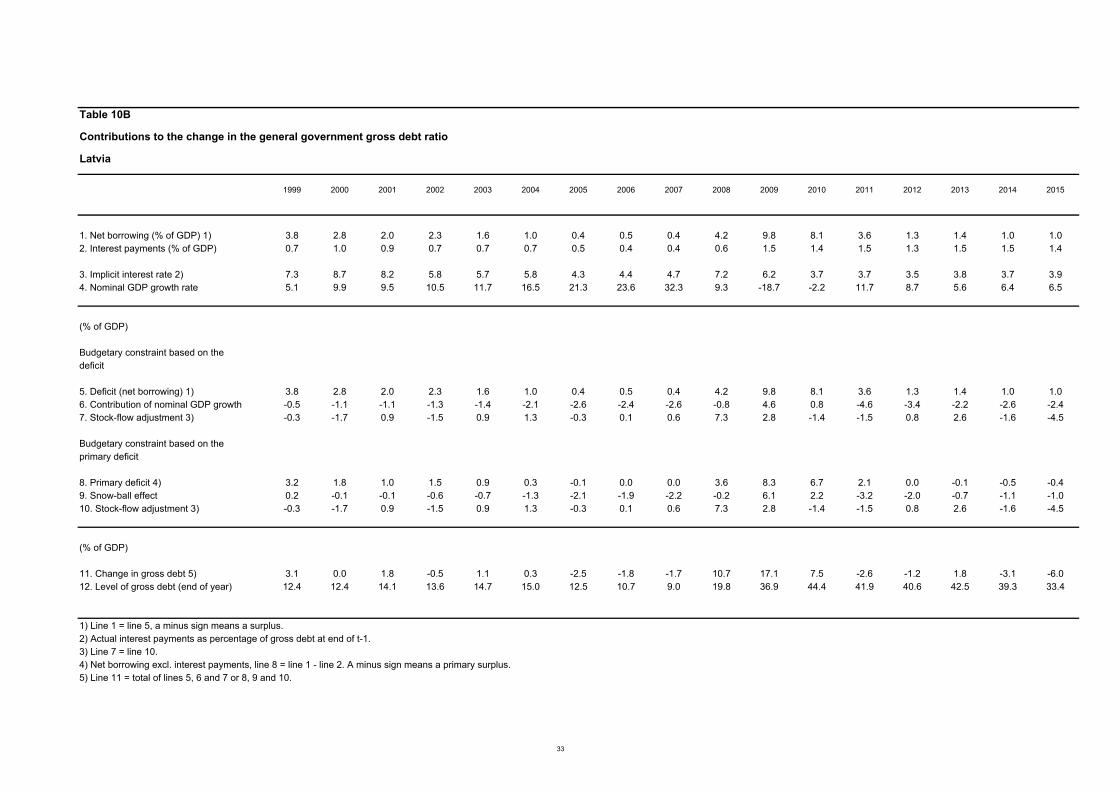
Table 10B
Contributions to the change in the general government gross debt ratio
Latvia
1999 2000 2001 2002 2003 2004 2005 2006 2007 2008 2009 2010 2011 2012 2013 2014 2015
1. Net borrowing (% of GDP) 1) 3.8 2.8 2.0 2.3 1.6 1.0 0.4 0.5 0.4 4.2 9.8 8.1 3.6 1.3 1.4 1.0 1.02. Interest payments (% of GDP) 0.7 1.0 0.9 0.7 0.7 0.7 0.5 0.4 0.4 0.6 1.5 1.4 1.5 1.3 1.5 1.5 1.4
3. Implicit interest rate 2) 7.3 8.7 8.2 5.8 5.7 5.8 4.3 4.4 4.7 7.2 6.2 3.7 3.7 3.5 3.8 3.7 3.94. Nominal GDP growth rate 5.1 9.9 9.5 10.5 11.7 16.5 21.3 23.6 32.3 9.3 -18.7 -2.2 11.7 8.7 5.6 6.4 6.5
(% of GDP)
Budgetary constraint based on thedeficit
5. Deficit (net borrowing) 1) 3.8 2.8 2.0 2.3 1.6 1.0 0.4 0.5 0.4 4.2 9.8 8.1 3.6 1.3 1.4 1.0 1.06. Contribution of nominal GDP growth -0.5 -1.1 -1.1 -1.3 -1.4 -2.1 -2.6 -2.4 -2.6 -0.8 4.6 0.8 -4.6 -3.4 -2.2 -2.6 -2.47. Stock-flow adjustment 3) -0.3 -1.7 0.9 -1.5 0.9 1.3 -0.3 0.1 0.6 7.3 2.8 -1.4 -1.5 0.8 2.6 -1.6 -4.5
Budgetary constraint based on theprimary deficit
8. Primary deficit 4) 3.2 1.8 1.0 1.5 0.9 0.3 -0.1 0.0 0.0 3.6 8.3 6.7 2.1 0.0 -0.1 -0.5 -0.49. Snow-ball effect 0.2 -0.1 -0.1 -0.6 -0.7 -1.3 -2.1 -1.9 -2.2 -0.2 6.1 2.2 -3.2 -2.0 -0.7 -1.1 -1.010. Stock-flow adjustment 3) -0.3 -1.7 0.9 -1.5 0.9 1.3 -0.3 0.1 0.6 7.3 2.8 -1.4 -1.5 0.8 2.6 -1.6 -4.5
(% of GDP)
11. Change in gross debt 5) 3.1 0.0 1.8 -0.5 1.1 0.3 -2.5 -1.8 -1.7 10.7 17.1 7.5 -2.6 -1.2 1.8 -3.1 -6.012. Level of gross debt (end of year) 12.4 12.4 14.1 13.6 14.7 15.0 12.5 10.7 9.0 19.8 36.9 44.4 41.9 40.6 42.5 39.3 33.4
1) Line 1 = line 5, a minus sign means a surplus.2) Actual interest payments as percentage of gross debt at end of t-1.3) Line 7 = line 10.4) Net borrowing excl. interest payments, line 8 = line 1 - line 2. A minus sign means a primary surplus.5) Line 11 = total of lines 5, 6 and 7 or 8, 9 and 10.
33
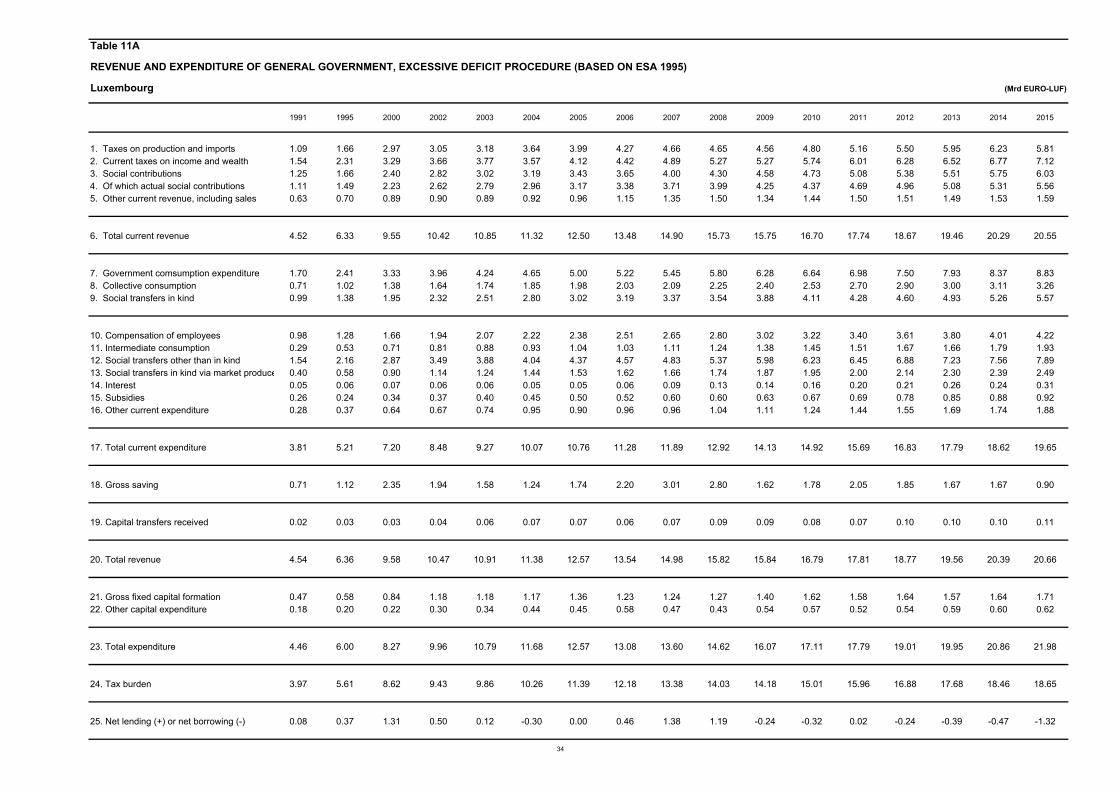
Table 11A
REVENUE AND EXPENDITURE OF GENERAL GOVERNMENT, EXCESSIVE DEFICIT PROCEDURE (BASED ON ESA 1995)
Luxembourg (Mrd EURO-LUF)
1991 1995 2000 2002 2003 2004 2005 2006 2007 2008 2009 2010 2011 2012 2013 2014 2015
1. Taxes on production and imports 1.09 1.66 2.97 3.05 3.18 3.64 3.99 4.27 4.66 4.65 4.56 4.80 5.16 5.50 5.95 6.23 5.812. Current taxes on income and wealth 1.54 2.31 3.29 3.66 3.77 3.57 4.12 4.42 4.89 5.27 5.27 5.74 6.01 6.28 6.52 6.77 7.123. Social contributions 1.25 1.66 2.40 2.82 3.02 3.19 3.43 3.65 4.00 4.30 4.58 4.73 5.08 5.38 5.51 5.75 6.034. Of which actual social contributions 1.11 1.49 2.23 2.62 2.79 2.96 3.17 3.38 3.71 3.99 4.25 4.37 4.69 4.96 5.08 5.31 5.565. Other current revenue, including sales 0.63 0.70 0.89 0.90 0.89 0.92 0.96 1.15 1.35 1.50 1.34 1.44 1.50 1.51 1.49 1.53 1.59
6. Total current revenue 4.52 6.33 9.55 10.42 10.85 11.32 12.50 13.48 14.90 15.73 15.75 16.70 17.74 18.67 19.46 20.29 20.55
7. Government comsumption expenditure 1.70 2.41 3.33 3.96 4.24 4.65 5.00 5.22 5.45 5.80 6.28 6.64 6.98 7.50 7.93 8.37 8.838. Collective consumption 0.71 1.02 1.38 1.64 1.74 1.85 1.98 2.03 2.09 2.25 2.40 2.53 2.70 2.90 3.00 3.11 3.269. Social transfers in kind 0.99 1.38 1.95 2.32 2.51 2.80 3.02 3.19 3.37 3.54 3.88 4.11 4.28 4.60 4.93 5.26 5.57
10. Compensation of employees 0.98 1.28 1.66 1.94 2.07 2.22 2.38 2.51 2.65 2.80 3.02 3.22 3.40 3.61 3.80 4.01 4.2211. Intermediate consumption 0.29 0.53 0.71 0.81 0.88 0.93 1.04 1.03 1.11 1.24 1.38 1.45 1.51 1.67 1.66 1.79 1.9312. Social transfers other than in kind 1.54 2.16 2.87 3.49 3.88 4.04 4.37 4.57 4.83 5.37 5.98 6.23 6.45 6.88 7.23 7.56 7.8913. Social transfers in kind via market produce 0.40 0.58 0.90 1.14 1.24 1.44 1.53 1.62 1.66 1.74 1.87 1.95 2.00 2.14 2.30 2.39 2.4914. Interest 0.05 0.06 0.07 0.06 0.06 0.05 0.05 0.06 0.09 0.13 0.14 0.16 0.20 0.21 0.26 0.24 0.3115. Subsidies 0.26 0.24 0.34 0.37 0.40 0.45 0.50 0.52 0.60 0.60 0.63 0.67 0.69 0.78 0.85 0.88 0.9216. Other current expenditure 0.28 0.37 0.64 0.67 0.74 0.95 0.90 0.96 0.96 1.04 1.11 1.24 1.44 1.55 1.69 1.74 1.88
17. Total current expenditure 3.81 5.21 7.20 8.48 9.27 10.07 10.76 11.28 11.89 12.92 14.13 14.92 15.69 16.83 17.79 18.62 19.65
18. Gross saving 0.71 1.12 2.35 1.94 1.58 1.24 1.74 2.20 3.01 2.80 1.62 1.78 2.05 1.85 1.67 1.67 0.90
19. Capital transfers received 0.02 0.03 0.03 0.04 0.06 0.07 0.07 0.06 0.07 0.09 0.09 0.08 0.07 0.10 0.10 0.10 0.11
20. Total revenue 4.54 6.36 9.58 10.47 10.91 11.38 12.57 13.54 14.98 15.82 15.84 16.79 17.81 18.77 19.56 20.39 20.66
21. Gross fixed capital formation 0.47 0.58 0.84 1.18 1.18 1.17 1.36 1.23 1.24 1.27 1.40 1.62 1.58 1.64 1.57 1.64 1.7122. Other capital expenditure 0.18 0.20 0.22 0.30 0.34 0.44 0.45 0.58 0.47 0.43 0.54 0.57 0.52 0.54 0.59 0.60 0.62
23. Total expenditure 4.46 6.00 8.27 9.96 10.79 11.68 12.57 13.08 13.60 14.62 16.07 17.11 17.79 19.01 19.95 20.86 21.98
24. Tax burden 3.97 5.61 8.62 9.43 9.86 10.26 11.39 12.18 13.38 14.03 14.18 15.01 15.96 16.88 17.68 18.46 18.65
25. Net lending (+) or net borrowing (-) 0.08 0.37 1.31 0.50 0.12 -0.30 0.00 0.46 1.38 1.19 -0.24 -0.32 0.02 -0.24 -0.39 -0.47 -1.32
34

Table 11B
Contributions to the change in the general government gross debt ratio
Luxembourg
1995 2000 2001 2002 2003 2004 2005 2006 2007 2008 2009 2010 2011 2012 2013 2014 2015
1. Net borrowing (% of GDP) 1) -2.4 -6.0 -6.1 -2.1 -0.5 1.1 0.0 -1.4 -3.7 -3.2 0.7 0.8 -0.1 0.6 0.9 1.0 2.72. Interest payments (% of GDP) 0.4 0.3 0.3 0.3 0.2 0.2 0.2 0.2 0.2 0.3 0.4 0.4 0.5 0.5 0.6 0.5 0.6
3. Implicit interest rate 2) 8.1 5.8 5.5 4.4 3.8 2.9 2.7 3.3 3.9 5.0 2.5 3.0 2.6 2.7 2.8 2.2 2.64. Nominal GDP growth rate 3.8 10.6 2.6 6.3 7.7 6.3 10.3 12.0 10.6 -0.3 -4.8 10.5 6.2 2.8 5.6 4.6 3.8
(% of GDP)
Budgetary constraint based on thedeficit
5. Deficit (net borrowing) 1) -2.4 -6.0 -6.1 -2.1 -0.5 1.1 0.0 -1.4 -3.7 -3.2 0.7 0.8 -0.1 0.6 0.9 1.0 2.76. Contribution of nominal GDP growth -0.2 -0.6 -0.2 -0.4 -0.5 -0.4 -0.6 -0.7 -0.6 0.0 0.7 -1.5 -1.1 -0.5 -1.1 -1.1 -0.97. Stock-flow adjustment 3) 4.5 6.3 6.4 2.5 0.8 -0.6 0.3 2.6 4.3 10.9 -0.3 4.6 0.4 3.0 3.1 1.3 1.2
Budgetary constraint based on theprimary deficit
8. Primary deficit 4) -2.8 -6.3 -6.4 -2.4 -0.7 0.9 -0.2 -1.5 -3.9 -3.5 0.3 0.4 -0.5 0.1 0.3 0.5 2.09. Snow-ball effect 0.2 -0.3 0.2 -0.1 -0.2 -0.2 -0.4 -0.5 -0.4 0.4 1.1 -1.1 -0.7 0.0 -0.6 -0.6 -0.310. Stock-flow adjustment 3) 4.5 6.3 6.4 2.5 0.8 -0.6 0.3 2.6 4.3 10.9 -0.3 4.6 0.4 3.0 3.1 1.3 1.2
(% of GDP)
11. Change in gross debt 5) 1.9 -0.3 0.1 0.0 -0.1 0.1 -0.3 0.6 0.0 7.8 1.1 4.0 -0.8 3.0 2.8 1.2 3.012. Level of gross debt (end of year) 7.4 6.2 6.3 6.3 6.2 6.3 6.1 6.7 6.7 14.4 15.5 19.5 18.7 21.7 24.5 25.7 28.7
1) Line 1 = line 5, a minus sign means a surplus.2) Actual interest payments as percentage of gross debt at end of t-1.3) Line 7 = line 10.4) Net borrowing excl. interest payments, line 8 = line 1 - line 2. A minus sign means a primary surplus.5) Line 11 = total of lines 5, 6 and 7 or 8, 9 and 10.
35
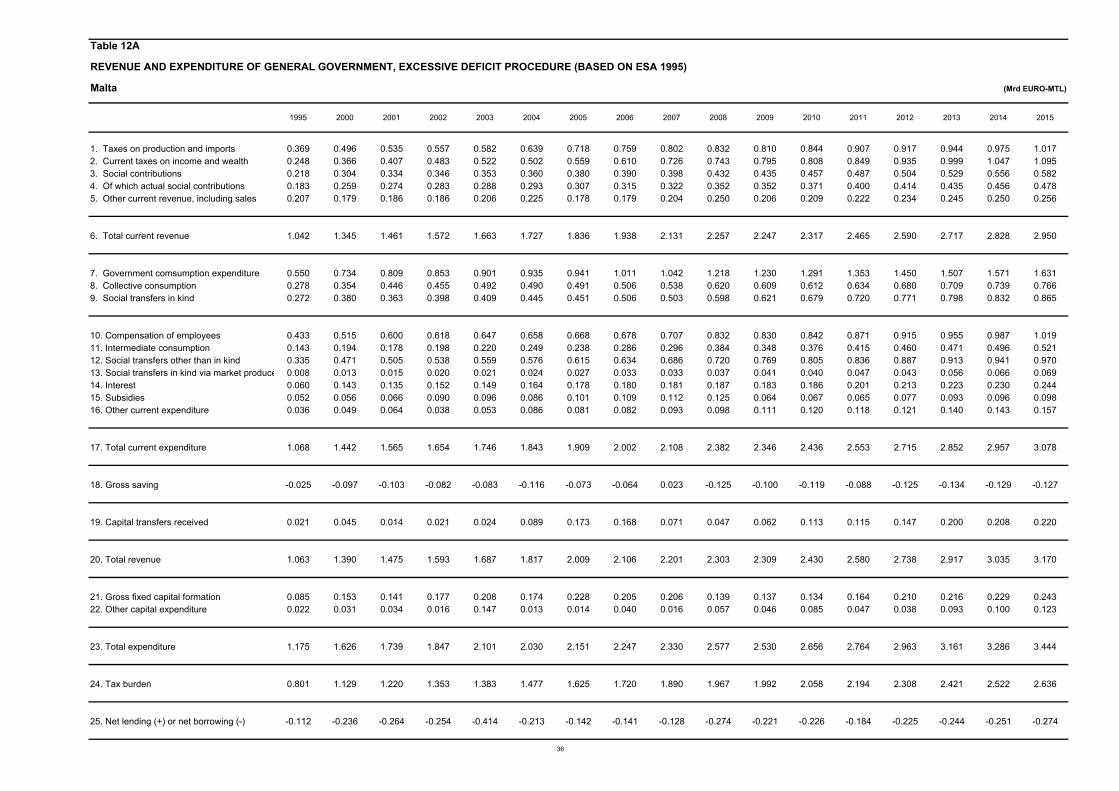
Table 12A
REVENUE AND EXPENDITURE OF GENERAL GOVERNMENT, EXCESSIVE DEFICIT PROCEDURE (BASED ON ESA 1995)
Malta (Mrd EURO-MTL)
1995 2000 2001 2002 2003 2004 2005 2006 2007 2008 2009 2010 2011 2012 2013 2014 2015
1. Taxes on production and imports 0.369 0.496 0.535 0.557 0.582 0.639 0.718 0.759 0.802 0.832 0.810 0.844 0.907 0.917 0.944 0.975 1.0172. Current taxes on income and wealth 0.248 0.366 0.407 0.483 0.522 0.502 0.559 0.610 0.726 0.743 0.795 0.808 0.849 0.935 0.999 1.047 1.0953. Social contributions 0.218 0.304 0.334 0.346 0.353 0.360 0.380 0.390 0.398 0.432 0.435 0.457 0.487 0.504 0.529 0.556 0.5824. Of which actual social contributions 0.183 0.259 0.274 0.283 0.288 0.293 0.307 0.315 0.322 0.352 0.352 0.371 0.400 0.414 0.435 0.456 0.4785. Other current revenue, including sales 0.207 0.179 0.186 0.186 0.206 0.225 0.178 0.179 0.204 0.250 0.206 0.209 0.222 0.234 0.245 0.250 0.256
6. Total current revenue 1.042 1.345 1.461 1.572 1.663 1.727 1.836 1.938 2.131 2.257 2.247 2.317 2.465 2.590 2.717 2.828 2.950
7. Government comsumption expenditure 0.550 0.734 0.809 0.853 0.901 0.935 0.941 1.011 1.042 1.218 1.230 1.291 1.353 1.450 1.507 1.571 1.6318. Collective consumption 0.278 0.354 0.446 0.455 0.492 0.490 0.491 0.506 0.538 0.620 0.609 0.612 0.634 0.680 0.709 0.739 0.7669. Social transfers in kind 0.272 0.380 0.363 0.398 0.409 0.445 0.451 0.506 0.503 0.598 0.621 0.679 0.720 0.771 0.798 0.832 0.865
10. Compensation of employees 0.433 0.515 0.600 0.618 0.647 0.658 0.668 0.678 0.707 0.832 0.830 0.842 0.871 0.915 0.955 0.987 1.01911. Intermediate consumption 0.143 0.194 0.178 0.198 0.220 0.249 0.238 0.286 0.296 0.384 0.348 0.376 0.415 0.460 0.471 0.496 0.52112. Social transfers other than in kind 0.335 0.471 0.505 0.538 0.559 0.576 0.615 0.634 0.686 0.720 0.769 0.805 0.836 0.887 0.913 0.941 0.97013. Social transfers in kind via market produce 0.008 0.013 0.015 0.020 0.021 0.024 0.027 0.033 0.033 0.037 0.041 0.040 0.047 0.043 0.056 0.066 0.06914. Interest 0.060 0.143 0.135 0.152 0.149 0.164 0.178 0.180 0.181 0.187 0.183 0.186 0.201 0.213 0.223 0.230 0.24415. Subsidies 0.052 0.056 0.066 0.090 0.096 0.086 0.101 0.109 0.112 0.125 0.064 0.067 0.065 0.077 0.093 0.096 0.09816. Other current expenditure 0.036 0.049 0.064 0.038 0.053 0.086 0.081 0.082 0.093 0.098 0.111 0.120 0.118 0.121 0.140 0.143 0.157
17. Total current expenditure 1.068 1.442 1.565 1.654 1.746 1.843 1.909 2.002 2.108 2.382 2.346 2.436 2.553 2.715 2.852 2.957 3.078
18. Gross saving -0.025 -0.097 -0.103 -0.082 -0.083 -0.116 -0.073 -0.064 0.023 -0.125 -0.100 -0.119 -0.088 -0.125 -0.134 -0.129 -0.127
19. Capital transfers received 0.021 0.045 0.014 0.021 0.024 0.089 0.173 0.168 0.071 0.047 0.062 0.113 0.115 0.147 0.200 0.208 0.220
20. Total revenue 1.063 1.390 1.475 1.593 1.687 1.817 2.009 2.106 2.201 2.303 2.309 2.430 2.580 2.738 2.917 3.035 3.170
21. Gross fixed capital formation 0.085 0.153 0.141 0.177 0.208 0.174 0.228 0.205 0.206 0.139 0.137 0.134 0.164 0.210 0.216 0.229 0.24322. Other capital expenditure 0.022 0.031 0.034 0.016 0.147 0.013 0.014 0.040 0.016 0.057 0.046 0.085 0.047 0.038 0.093 0.100 0.123
23. Total expenditure 1.175 1.626 1.739 1.847 2.101 2.030 2.151 2.247 2.330 2.577 2.530 2.656 2.764 2.963 3.161 3.286 3.444
24. Tax burden 0.801 1.129 1.220 1.353 1.383 1.477 1.625 1.720 1.890 1.967 1.992 2.058 2.194 2.308 2.421 2.522 2.636
25. Net lending (+) or net borrowing (-) -0.112 -0.236 -0.264 -0.254 -0.414 -0.213 -0.142 -0.141 -0.128 -0.274 -0.221 -0.226 -0.184 -0.225 -0.244 -0.251 -0.274
36

Table 12B
Contributions to the change in the general government gross debt ratio
Malta
1999 2000 2001 2002 2003 2004 2005 2006 2007 2008 2009 2010 2011 2012 2013 2014 2015
1. Net borrowing (% of GDP) 1) 6.9 5.7 6.3 5.7 9.0 4.6 2.9 2.7 2.3 4.6 3.7 3.5 2.8 3.3 3.4 3.4 3.52. Interest payments (% of GDP) 3.6 3.5 3.2 3.4 3.2 3.5 3.6 3.5 3.3 3.1 3.1 2.9 3.0 3.1 3.1 3.1 3.2
3. Implicit interest rate 2) 7.3 6.9 6.1 6.1 5.8 5.4 5.5 5.4 5.6 5.5 5.0 4.7 4.7 4.6 4.6 4.5 4.54. Nominal GDP growth rate 5.8 9.6 2.4 5.1 3.9 1.1 6.1 5.4 7.1 7.0 -0.1 7.1 3.9 3.1 4.1 4.2 4.4
(% of GDP)
Budgetary constraint based on thedeficit
5. Deficit (net borrowing) 1) 6.9 5.7 6.3 5.7 9.0 4.6 2.9 2.7 2.3 4.6 3.7 3.5 2.8 3.3 3.4 3.4 3.56. Contribution of nominal GDP growth -2.8 -4.8 -1.3 -2.8 -2.2 -0.7 -4.0 -3.5 -4.1 -4.0 0.1 -4.4 -2.5 -2.1 -2.8 -2.9 -3.17. Stock-flow adjustment 3) -0.7 -2.2 0.0 -3.9 1.3 -0.1 -0.7 -4.7 0.1 -0.4 1.8 1.1 2.5 0.6 0.6 0.3 0.3
Budgetary constraint based on theprimary deficit
8. Primary deficit 4) 3.3 2.2 3.1 2.3 5.8 1.1 -0.7 -0.7 -0.9 1.5 0.6 0.6 -0.3 0.2 0.3 0.3 0.49. Snow-ball effect 0.7 -1.4 1.9 0.6 1.1 2.8 -0.4 -0.1 -0.9 -0.8 3.2 -1.5 0.5 1.0 0.3 0.2 0.110. Stock-flow adjustment 3) -0.7 -2.2 0.0 -3.9 1.3 -0.1 -0.7 -4.7 0.1 -0.4 1.8 1.1 2.5 0.6 0.6 0.3 0.3
(% of GDP)
11. Change in gross debt 5) 3.4 -1.3 5.0 -1.0 8.1 3.8 -1.8 -5.5 -1.8 0.2 5.6 0.2 2.8 1.8 1.3 0.8 0.812. Level of gross debt (end of year) 55.2 53.9 58.9 57.9 66.0 69.8 68.0 62.5 60.7 60.9 66.5 66.8 69.5 71.3 72.6 73.3 74.1
1) Line 1 = line 5, a minus sign means a surplus.2) Actual interest payments as percentage of gross debt at end of t-1.3) Line 7 = line 10.4) Net borrowing excl. interest payments, line 8 = line 1 - line 2. A minus sign means a primary surplus.5) Line 11 = total of lines 5, 6 and 7 or 8, 9 and 10.
37
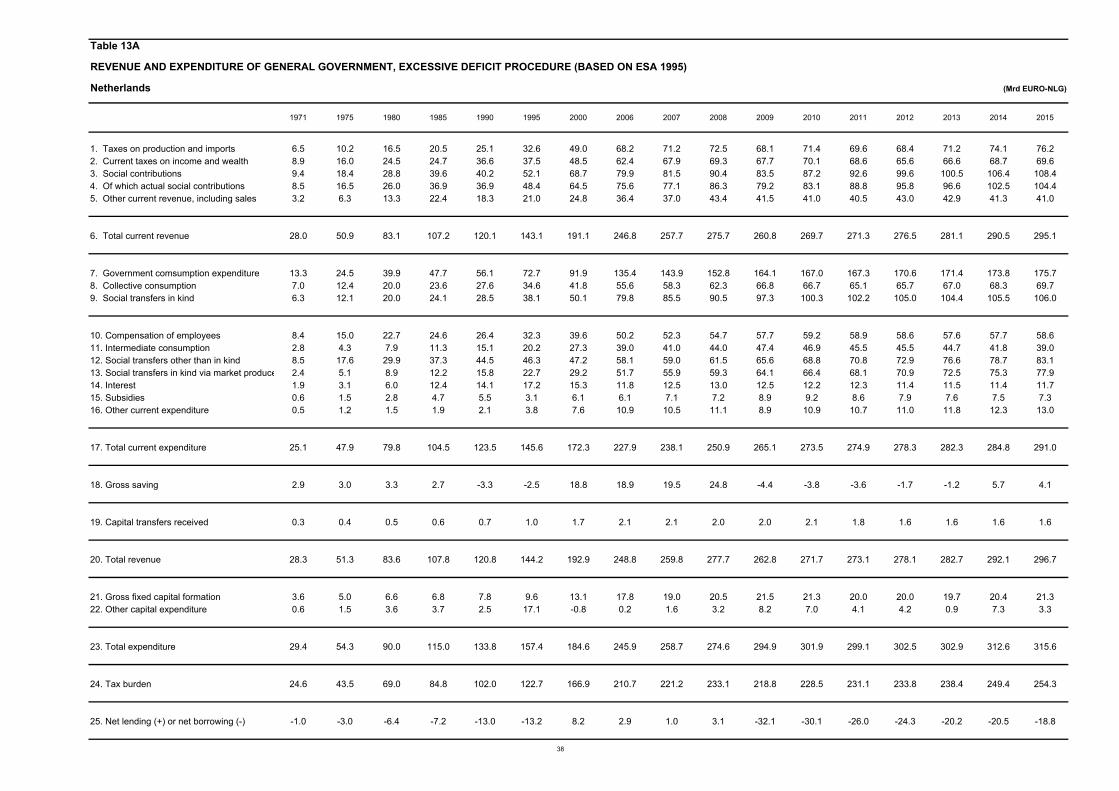
Table 13A
REVENUE AND EXPENDITURE OF GENERAL GOVERNMENT, EXCESSIVE DEFICIT PROCEDURE (BASED ON ESA 1995)
Netherlands (Mrd EURO-NLG)
1971 1975 1980 1985 1990 1995 2000 2006 2007 2008 2009 2010 2011 2012 2013 2014 2015
1. Taxes on production and imports 6.5 10.2 16.5 20.5 25.1 32.6 49.0 68.2 71.2 72.5 68.1 71.4 69.6 68.4 71.2 74.1 76.22. Current taxes on income and wealth 8.9 16.0 24.5 24.7 36.6 37.5 48.5 62.4 67.9 69.3 67.7 70.1 68.6 65.6 66.6 68.7 69.63. Social contributions 9.4 18.4 28.8 39.6 40.2 52.1 68.7 79.9 81.5 90.4 83.5 87.2 92.6 99.6 100.5 106.4 108.44. Of which actual social contributions 8.5 16.5 26.0 36.9 36.9 48.4 64.5 75.6 77.1 86.3 79.2 83.1 88.8 95.8 96.6 102.5 104.45. Other current revenue, including sales 3.2 6.3 13.3 22.4 18.3 21.0 24.8 36.4 37.0 43.4 41.5 41.0 40.5 43.0 42.9 41.3 41.0
6. Total current revenue 28.0 50.9 83.1 107.2 120.1 143.1 191.1 246.8 257.7 275.7 260.8 269.7 271.3 276.5 281.1 290.5 295.1
7. Government comsumption expenditure 13.3 24.5 39.9 47.7 56.1 72.7 91.9 135.4 143.9 152.8 164.1 167.0 167.3 170.6 171.4 173.8 175.78. Collective consumption 7.0 12.4 20.0 23.6 27.6 34.6 41.8 55.6 58.3 62.3 66.8 66.7 65.1 65.7 67.0 68.3 69.79. Social transfers in kind 6.3 12.1 20.0 24.1 28.5 38.1 50.1 79.8 85.5 90.5 97.3 100.3 102.2 105.0 104.4 105.5 106.0
10. Compensation of employees 8.4 15.0 22.7 24.6 26.4 32.3 39.6 50.2 52.3 54.7 57.7 59.2 58.9 58.6 57.6 57.7 58.611. Intermediate consumption 2.8 4.3 7.9 11.3 15.1 20.2 27.3 39.0 41.0 44.0 47.4 46.9 45.5 45.5 44.7 41.8 39.012. Social transfers other than in kind 8.5 17.6 29.9 37.3 44.5 46.3 47.2 58.1 59.0 61.5 65.6 68.8 70.8 72.9 76.6 78.7 83.113. Social transfers in kind via market produce 2.4 5.1 8.9 12.2 15.8 22.7 29.2 51.7 55.9 59.3 64.1 66.4 68.1 70.9 72.5 75.3 77.914. Interest 1.9 3.1 6.0 12.4 14.1 17.2 15.3 11.8 12.5 13.0 12.5 12.2 12.3 11.4 11.5 11.4 11.715. Subsidies 0.6 1.5 2.8 4.7 5.5 3.1 6.1 6.1 7.1 7.2 8.9 9.2 8.6 7.9 7.6 7.5 7.316. Other current expenditure 0.5 1.2 1.5 1.9 2.1 3.8 7.6 10.9 10.5 11.1 8.9 10.9 10.7 11.0 11.8 12.3 13.0
17. Total current expenditure 25.1 47.9 79.8 104.5 123.5 145.6 172.3 227.9 238.1 250.9 265.1 273.5 274.9 278.3 282.3 284.8 291.0
18. Gross saving 2.9 3.0 3.3 2.7 -3.3 -2.5 18.8 18.9 19.5 24.8 -4.4 -3.8 -3.6 -1.7 -1.2 5.7 4.1
19. Capital transfers received 0.3 0.4 0.5 0.6 0.7 1.0 1.7 2.1 2.1 2.0 2.0 2.1 1.8 1.6 1.6 1.6 1.6
20. Total revenue 28.3 51.3 83.6 107.8 120.8 144.2 192.9 248.8 259.8 277.7 262.8 271.7 273.1 278.1 282.7 292.1 296.7
21. Gross fixed capital formation 3.6 5.0 6.6 6.8 7.8 9.6 13.1 17.8 19.0 20.5 21.5 21.3 20.0 20.0 19.7 20.4 21.322. Other capital expenditure 0.6 1.5 3.6 3.7 2.5 17.1 -0.8 0.2 1.6 3.2 8.2 7.0 4.1 4.2 0.9 7.3 3.3
23. Total expenditure 29.4 54.3 90.0 115.0 133.8 157.4 184.6 245.9 258.7 274.6 294.9 301.9 299.1 302.5 302.9 312.6 315.6
24. Tax burden 24.6 43.5 69.0 84.8 102.0 122.7 166.9 210.7 221.2 233.1 218.8 228.5 231.1 233.8 238.4 249.4 254.3
25. Net lending (+) or net borrowing (-) -1.0 -3.0 -6.4 -7.2 -13.0 -13.2 8.2 2.9 1.0 3.1 -32.1 -30.1 -26.0 -24.3 -20.2 -20.5 -18.8
38

Table 13B
Contributions to the change in the general government gross debt ratio
Netherlands
1995 2000 2001 2002 2003 2004 2005 2006 2007 2008 2009 2010 2011 2012 2013 2014 2015
1. Net borrowing (% of GDP) 1) 4.3 -2.0 0.2 2.1 3.1 1.7 0.3 -0.5 -0.2 -0.5 5.6 5.1 4.3 4.1 3.3 3.3 3.02. Interest payments (% of GDP) 5.6 3.7 3.2 2.8 2.6 2.5 2.3 2.2 2.2 2.2 2.2 2.1 2.1 1.9 1.9 1.9 1.8
3. Implicit interest rate 2) 7.8 6.5 6.3 5.7 5.2 4.9 4.7 4.4 4.9 5.0 3.6 3.5 3.3 2.9 2.7 2.5 2.54. Nominal GDP growth rate 5.2 8.2 7.1 3.9 2.5 3.0 4.5 5.2 5.8 4.0 -3.6 2.4 2.1 0.0 0.6 1.7 3.9
(% of GDP)
Budgetary constraint based on thedeficit
5. Deficit (net borrowing) 1) 4.3 -2.0 0.2 2.1 3.1 1.7 0.3 -0.5 -0.2 -0.5 5.6 5.1 4.3 4.1 3.3 3.3 3.06. Contribution of nominal GDP growth -3.8 -4.6 -3.6 -1.9 -1.2 -1.5 -2.3 -2.6 -2.6 -1.7 2.2 -1.4 -1.3 0.0 -0.4 -1.2 -2.97. Stock-flow adjustment 3) -0.2 -0.7 0.3 -0.4 -0.4 0.2 1.4 -1.3 0.7 15.4 -5.5 -1.1 -0.7 1.5 0.7 -0.5 0.4
Budgetary constraint based on theprimary deficit
8. Primary deficit 4) -1.3 -5.6 -2.9 -0.7 0.6 -0.7 -2.1 -2.7 -2.4 -2.7 3.4 3.1 2.3 2.2 1.4 1.5 1.19. Snow-ball effect 1.9 -1.0 -0.4 0.9 1.3 1.0 0.1 -0.4 -0.4 0.5 4.4 0.7 0.8 1.9 1.5 0.6 -1.010. Stock-flow adjustment 3) -0.2 -0.7 0.3 -0.4 -0.4 0.2 1.4 -1.3 0.7 15.4 -5.5 -1.1 -0.7 1.5 0.7 -0.5 0.4
(% of GDP)
11. Change in gross debt 5) 0.3 -7.4 -3.1 -0.2 1.5 0.4 -0.6 -4.4 -2.1 13.2 2.3 2.6 2.3 5.5 3.6 1.6 0.512. Level of gross debt (end of year) 76.1 53.8 50.7 50.5 52.0 52.4 51.8 47.4 45.3 58.5 60.8 63.4 65.7 71.3 74.8 76.4 76.9
1) Line 1 = line 5, a minus sign means a surplus.2) Actual interest payments as percentage of gross debt at end of t-1.3) Line 7 = line 10.4) Net borrowing excl. interest payments, line 8 = line 1 - line 2. A minus sign means a primary surplus.5) Line 11 = total of lines 5, 6 and 7 or 8, 9 and 10.
39
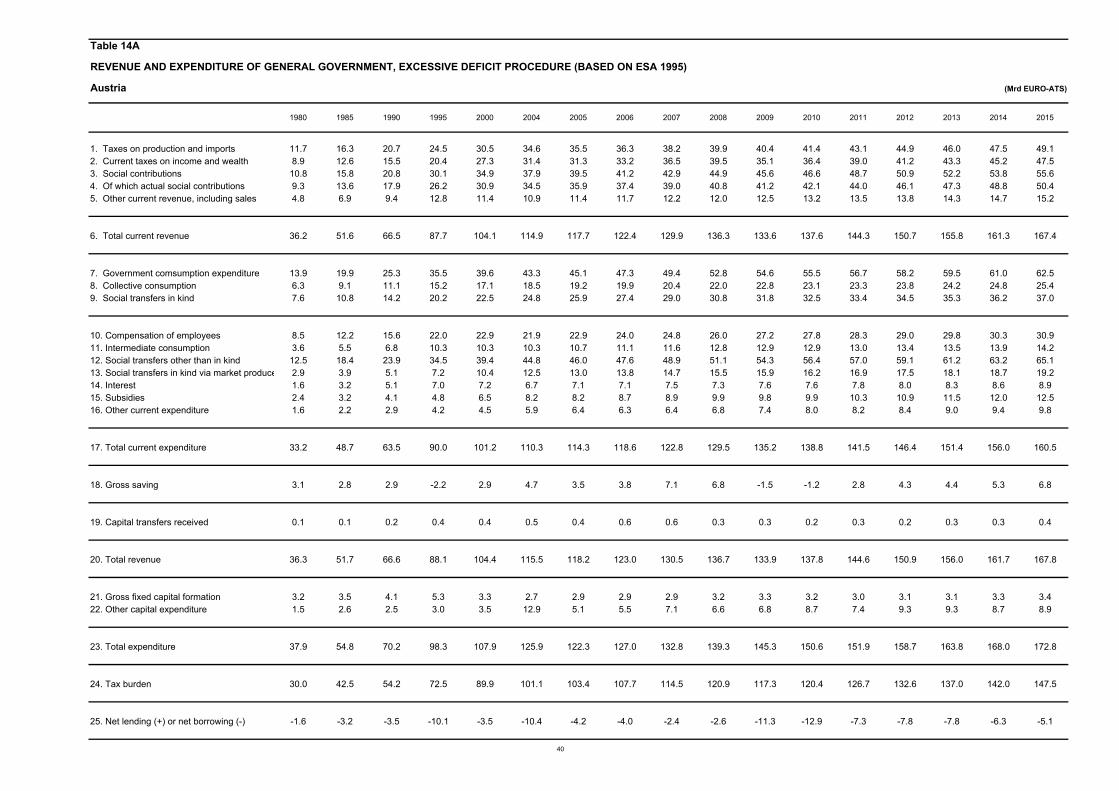
Table 14A
REVENUE AND EXPENDITURE OF GENERAL GOVERNMENT, EXCESSIVE DEFICIT PROCEDURE (BASED ON ESA 1995)
Austria (Mrd EURO-ATS)
1980 1985 1990 1995 2000 2004 2005 2006 2007 2008 2009 2010 2011 2012 2013 2014 2015
1. Taxes on production and imports 11.7 16.3 20.7 24.5 30.5 34.6 35.5 36.3 38.2 39.9 40.4 41.4 43.1 44.9 46.0 47.5 49.12. Current taxes on income and wealth 8.9 12.6 15.5 20.4 27.3 31.4 31.3 33.2 36.5 39.5 35.1 36.4 39.0 41.2 43.3 45.2 47.53. Social contributions 10.8 15.8 20.8 30.1 34.9 37.9 39.5 41.2 42.9 44.9 45.6 46.6 48.7 50.9 52.2 53.8 55.64. Of which actual social contributions 9.3 13.6 17.9 26.2 30.9 34.5 35.9 37.4 39.0 40.8 41.2 42.1 44.0 46.1 47.3 48.8 50.45. Other current revenue, including sales 4.8 6.9 9.4 12.8 11.4 10.9 11.4 11.7 12.2 12.0 12.5 13.2 13.5 13.8 14.3 14.7 15.2
6. Total current revenue 36.2 51.6 66.5 87.7 104.1 114.9 117.7 122.4 129.9 136.3 133.6 137.6 144.3 150.7 155.8 161.3 167.4
7. Government comsumption expenditure 13.9 19.9 25.3 35.5 39.6 43.3 45.1 47.3 49.4 52.8 54.6 55.5 56.7 58.2 59.5 61.0 62.58. Collective consumption 6.3 9.1 11.1 15.2 17.1 18.5 19.2 19.9 20.4 22.0 22.8 23.1 23.3 23.8 24.2 24.8 25.49. Social transfers in kind 7.6 10.8 14.2 20.2 22.5 24.8 25.9 27.4 29.0 30.8 31.8 32.5 33.4 34.5 35.3 36.2 37.0
10. Compensation of employees 8.5 12.2 15.6 22.0 22.9 21.9 22.9 24.0 24.8 26.0 27.2 27.8 28.3 29.0 29.8 30.3 30.911. Intermediate consumption 3.6 5.5 6.8 10.3 10.3 10.3 10.7 11.1 11.6 12.8 12.9 12.9 13.0 13.4 13.5 13.9 14.212. Social transfers other than in kind 12.5 18.4 23.9 34.5 39.4 44.8 46.0 47.6 48.9 51.1 54.3 56.4 57.0 59.1 61.2 63.2 65.113. Social transfers in kind via market produce 2.9 3.9 5.1 7.2 10.4 12.5 13.0 13.8 14.7 15.5 15.9 16.2 16.9 17.5 18.1 18.7 19.214. Interest 1.6 3.2 5.1 7.0 7.2 6.7 7.1 7.1 7.5 7.3 7.6 7.6 7.8 8.0 8.3 8.6 8.915. Subsidies 2.4 3.2 4.1 4.8 6.5 8.2 8.2 8.7 8.9 9.9 9.8 9.9 10.3 10.9 11.5 12.0 12.516. Other current expenditure 1.6 2.2 2.9 4.2 4.5 5.9 6.4 6.3 6.4 6.8 7.4 8.0 8.2 8.4 9.0 9.4 9.8
17. Total current expenditure 33.2 48.7 63.5 90.0 101.2 110.3 114.3 118.6 122.8 129.5 135.2 138.8 141.5 146.4 151.4 156.0 160.5
18. Gross saving 3.1 2.8 2.9 -2.2 2.9 4.7 3.5 3.8 7.1 6.8 -1.5 -1.2 2.8 4.3 4.4 5.3 6.8
19. Capital transfers received 0.1 0.1 0.2 0.4 0.4 0.5 0.4 0.6 0.6 0.3 0.3 0.2 0.3 0.2 0.3 0.3 0.4
20. Total revenue 36.3 51.7 66.6 88.1 104.4 115.5 118.2 123.0 130.5 136.7 133.9 137.8 144.6 150.9 156.0 161.7 167.8
21. Gross fixed capital formation 3.2 3.5 4.1 5.3 3.3 2.7 2.9 2.9 2.9 3.2 3.3 3.2 3.0 3.1 3.1 3.3 3.422. Other capital expenditure 1.5 2.6 2.5 3.0 3.5 12.9 5.1 5.5 7.1 6.6 6.8 8.7 7.4 9.3 9.3 8.7 8.9
23. Total expenditure 37.9 54.8 70.2 98.3 107.9 125.9 122.3 127.0 132.8 139.3 145.3 150.6 151.9 158.7 163.8 168.0 172.8
24. Tax burden 30.0 42.5 54.2 72.5 89.9 101.1 103.4 107.7 114.5 120.9 117.3 120.4 126.7 132.6 137.0 142.0 147.5
25. Net lending (+) or net borrowing (-) -1.6 -3.2 -3.5 -10.1 -3.5 -10.4 -4.2 -4.0 -2.4 -2.6 -11.3 -12.9 -7.3 -7.8 -7.8 -6.3 -5.1
40

Table 14B
Contributions to the change in the general government gross debt ratio
Austria
1995 2000 2001 2002 2003 2004 2005 2006 2007 2008 2009 2010 2011 2012 2013 2014 2015
1. Net borrowing (% of GDP) 1) 5.8 1.7 0.0 0.7 1.5 4.4 1.7 1.5 0.9 0.9 4.1 4.5 2.5 2.5 2.5 1.9 1.52. Interest payments (% of GDP) 4.0 3.4 3.4 3.1 2.9 2.8 2.9 2.7 2.7 2.6 2.8 2.7 2.6 2.6 2.6 2.6 2.6
3. Implicit interest rate 2) 6.5 5.4 5.2 4.8 4.5 4.5 4.6 4.5 4.7 4.4 4.2 4.0 3.8 3.7 3.6 3.6 3.74. Nominal GDP growth rate 4.5 4.6 2.7 3.0 2.0 4.3 4.5 5.6 5.8 3.2 -2.3 3.2 4.9 2.6 2.5 3.3 3.6
(% of GDP)
Budgetary constraint based on thedeficit
5. Deficit (net borrowing) 1) 5.8 1.7 0.0 0.7 1.5 4.4 1.7 1.5 0.9 0.9 4.1 4.5 2.5 2.5 2.5 1.9 1.56. Contribution of nominal GDP growth -2.8 -3.0 -1.8 -1.9 -1.3 -2.7 -2.8 -3.4 -3.4 -1.9 1.5 -2.2 -3.4 -1.8 -1.8 -2.4 -2.67. Stock-flow adjustment 3) 1.2 0.6 2.3 0.6 -1.1 -2.3 0.6 0.0 0.5 4.5 -0.3 0.8 1.4 0.5 0.1 0.2 0.1
Budgetary constraint based on theprimary deficit
8. Primary deficit 4) 1.8 -1.8 -3.3 -2.4 -1.4 1.6 -1.2 -1.2 -1.9 -1.7 1.3 1.8 -0.2 -0.1 -0.2 -0.7 -1.19. Snow-ball effect 1.2 0.5 1.6 1.2 1.6 0.1 0.1 -0.7 -0.7 0.7 4.3 0.5 -0.8 0.8 0.8 0.2 0.110. Stock-flow adjustment 3) 1.2 0.6 2.3 0.6 -1.1 -2.3 0.6 0.0 0.5 4.5 -0.3 0.8 1.4 0.5 0.1 0.2 0.1
(% of GDP)
11. Change in gross debt 5) 4.2 -0.6 0.6 -0.6 -0.9 -0.6 -0.5 -1.9 -2.1 3.6 5.3 3.1 0.5 1.2 0.8 -0.3 -1.012. Level of gross debt (end of year) 68.2 66.2 66.8 66.2 65.3 64.7 64.2 62.3 60.2 63.8 69.2 72.3 72.8 74.0 74.8 74.5 73.5
1) Line 1 = line 5, a minus sign means a surplus.2) Actual interest payments as percentage of gross debt at end of t-1.3) Line 7 = line 10.4) Net borrowing excl. interest payments, line 8 = line 1 - line 2. A minus sign means a primary surplus.5) Line 11 = total of lines 5, 6 and 7 or 8, 9 and 10.
41
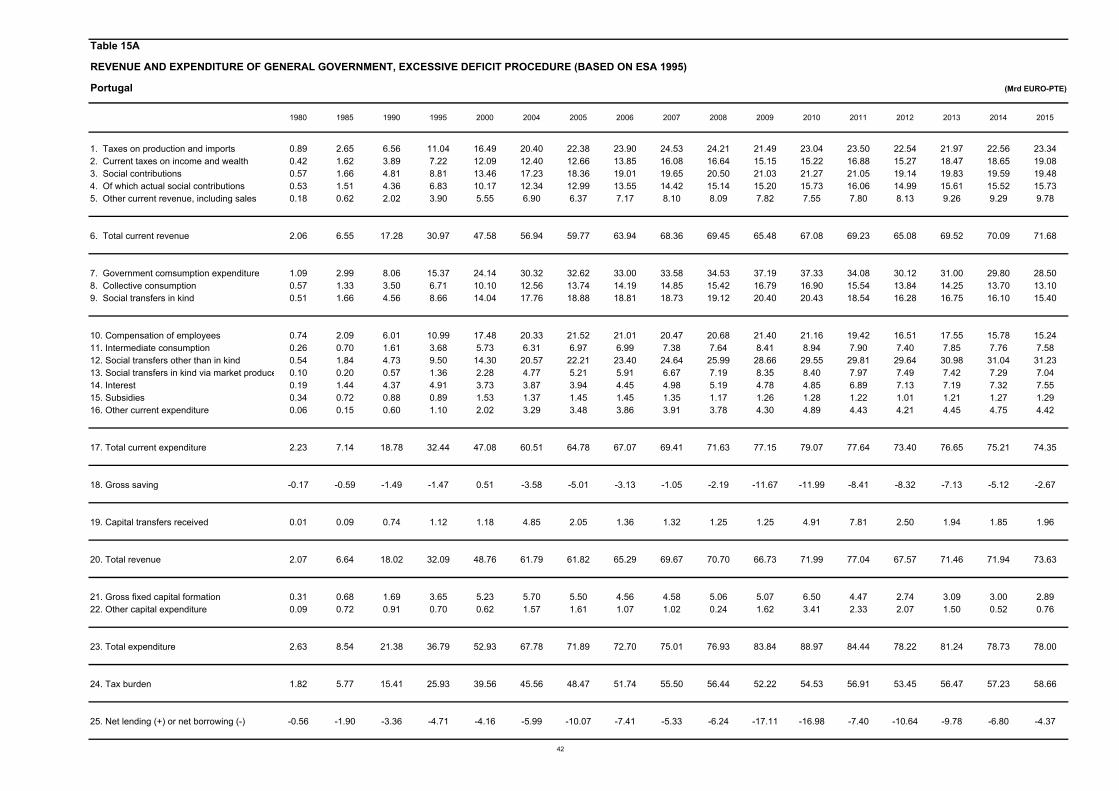
Table 15A
REVENUE AND EXPENDITURE OF GENERAL GOVERNMENT, EXCESSIVE DEFICIT PROCEDURE (BASED ON ESA 1995)
Portugal (Mrd EURO-PTE)
1980 1985 1990 1995 2000 2004 2005 2006 2007 2008 2009 2010 2011 2012 2013 2014 2015
1. Taxes on production and imports 0.89 2.65 6.56 11.04 16.49 20.40 22.38 23.90 24.53 24.21 21.49 23.04 23.50 22.54 21.97 22.56 23.342. Current taxes on income and wealth 0.42 1.62 3.89 7.22 12.09 12.40 12.66 13.85 16.08 16.64 15.15 15.22 16.88 15.27 18.47 18.65 19.083. Social contributions 0.57 1.66 4.81 8.81 13.46 17.23 18.36 19.01 19.65 20.50 21.03 21.27 21.05 19.14 19.83 19.59 19.484. Of which actual social contributions 0.53 1.51 4.36 6.83 10.17 12.34 12.99 13.55 14.42 15.14 15.20 15.73 16.06 14.99 15.61 15.52 15.735. Other current revenue, including sales 0.18 0.62 2.02 3.90 5.55 6.90 6.37 7.17 8.10 8.09 7.82 7.55 7.80 8.13 9.26 9.29 9.78
6. Total current revenue 2.06 6.55 17.28 30.97 47.58 56.94 59.77 63.94 68.36 69.45 65.48 67.08 69.23 65.08 69.52 70.09 71.68
7. Government comsumption expenditure 1.09 2.99 8.06 15.37 24.14 30.32 32.62 33.00 33.58 34.53 37.19 37.33 34.08 30.12 31.00 29.80 28.508. Collective consumption 0.57 1.33 3.50 6.71 10.10 12.56 13.74 14.19 14.85 15.42 16.79 16.90 15.54 13.84 14.25 13.70 13.109. Social transfers in kind 0.51 1.66 4.56 8.66 14.04 17.76 18.88 18.81 18.73 19.12 20.40 20.43 18.54 16.28 16.75 16.10 15.40
10. Compensation of employees 0.74 2.09 6.01 10.99 17.48 20.33 21.52 21.01 20.47 20.68 21.40 21.16 19.42 16.51 17.55 15.78 15.2411. Intermediate consumption 0.26 0.70 1.61 3.68 5.73 6.31 6.97 6.99 7.38 7.64 8.41 8.94 7.90 7.40 7.85 7.76 7.5812. Social transfers other than in kind 0.54 1.84 4.73 9.50 14.30 20.57 22.21 23.40 24.64 25.99 28.66 29.55 29.81 29.64 30.98 31.04 31.2313. Social transfers in kind via market produce 0.10 0.20 0.57 1.36 2.28 4.77 5.21 5.91 6.67 7.19 8.35 8.40 7.97 7.49 7.42 7.29 7.0414. Interest 0.19 1.44 4.37 4.91 3.73 3.87 3.94 4.45 4.98 5.19 4.78 4.85 6.89 7.13 7.19 7.32 7.5515. Subsidies 0.34 0.72 0.88 0.89 1.53 1.37 1.45 1.45 1.35 1.17 1.26 1.28 1.22 1.01 1.21 1.27 1.2916. Other current expenditure 0.06 0.15 0.60 1.10 2.02 3.29 3.48 3.86 3.91 3.78 4.30 4.89 4.43 4.21 4.45 4.75 4.42
17. Total current expenditure 2.23 7.14 18.78 32.44 47.08 60.51 64.78 67.07 69.41 71.63 77.15 79.07 77.64 73.40 76.65 75.21 74.35
18. Gross saving -0.17 -0.59 -1.49 -1.47 0.51 -3.58 -5.01 -3.13 -1.05 -2.19 -11.67 -11.99 -8.41 -8.32 -7.13 -5.12 -2.67
19. Capital transfers received 0.01 0.09 0.74 1.12 1.18 4.85 2.05 1.36 1.32 1.25 1.25 4.91 7.81 2.50 1.94 1.85 1.96
20. Total revenue 2.07 6.64 18.02 32.09 48.76 61.79 61.82 65.29 69.67 70.70 66.73 71.99 77.04 67.57 71.46 71.94 73.63
21. Gross fixed capital formation 0.31 0.68 1.69 3.65 5.23 5.70 5.50 4.56 4.58 5.06 5.07 6.50 4.47 2.74 3.09 3.00 2.8922. Other capital expenditure 0.09 0.72 0.91 0.70 0.62 1.57 1.61 1.07 1.02 0.24 1.62 3.41 2.33 2.07 1.50 0.52 0.76
23. Total expenditure 2.63 8.54 21.38 36.79 52.93 67.78 71.89 72.70 75.01 76.93 83.84 88.97 84.44 78.22 81.24 78.73 78.00
24. Tax burden 1.82 5.77 15.41 25.93 39.56 45.56 48.47 51.74 55.50 56.44 52.22 54.53 56.91 53.45 56.47 57.23 58.66
25. Net lending (+) or net borrowing (-) -0.56 -1.90 -3.36 -4.71 -4.16 -5.99 -10.07 -7.41 -5.33 -6.24 -17.11 -16.98 -7.40 -10.64 -9.78 -6.80 -4.37
42

Table 15B
Contributions to the change in the general government gross debt ratio
Portugal
1995 2000 2001 2002 2003 2004 2005 2006 2007 2008 2009 2010 2011 2012 2013 2014 2015
1. Net borrowing (% of GDP) 1) 5.4 3.3 4.8 3.4 3.7 4.0 6.5 4.6 3.1 3.6 10.2 9.8 4.3 6.4 5.9 4.0 2.52. Interest payments (% of GDP) 5.6 2.9 2.9 2.8 2.6 2.6 2.6 2.8 2.9 3.0 2.8 2.8 4.0 4.3 4.3 4.4 4.4
3. Implicit interest rate 2) 10.6 6.1 6.1 5.4 4.8 4.5 4.3 4.3 4.5 4.5 3.9 3.4 4.2 3.8 3.5 3.5 3.54. Nominal GDP growth rate 8.1 7.3 5.6 4.5 2.1 4.1 3.3 4.3 5.3 1.6 -2.0 2.6 -1.0 -3.5 0.1 1.7 2.5
(% of GDP)
Budgetary constraint based on thedeficit
5. Deficit (net borrowing) 1) 5.4 3.3 4.8 3.4 3.7 4.0 6.5 4.6 3.1 3.6 10.2 9.8 4.3 6.4 5.9 4.0 2.56. Contribution of nominal GDP growth -4.3 -3.5 -2.7 -2.3 -1.2 -2.3 -2.0 -2.8 -3.5 -1.1 1.5 -2.1 1.0 3.9 -0.2 -2.1 -3.17. Stock-flow adjustment 3) 0.8 -0.5 1.1 2.0 0.1 0.8 1.2 -0.1 -0.7 0.7 0.4 2.6 9.0 5.4 -2.0 -3.0 -0.4
Budgetary constraint based on theprimary deficit
8. Primary deficit 4) -0.2 0.3 1.8 0.6 1.0 1.4 4.0 1.8 0.2 0.6 7.3 7.0 0.3 2.1 1.6 -0.3 -1.89. Snow-ball effect 1.3 -0.6 0.2 0.5 1.5 0.3 0.6 0.0 -0.5 2.0 4.3 0.7 5.0 8.3 4.2 2.2 1.310. Stock-flow adjustment 3) 0.8 -0.5 1.1 2.0 0.1 0.8 1.2 -0.1 -0.7 0.7 0.4 2.6 9.0 5.4 -2.0 -3.0 -0.4
(% of GDP)
11. Change in gross debt 5) 1.9 -0.7 3.1 3.0 2.6 2.5 5.8 1.8 -1.1 3.3 12.0 10.3 14.3 15.8 3.8 -1.1 -1.012. Level of gross debt (end of year) 59.2 50.7 53.8 56.8 59.4 61.9 67.7 69.4 68.4 71.7 83.7 94.0 108.2 124.1 127.8 126.7 125.7
1) Line 1 = line 5, a minus sign means a surplus.2) Actual interest payments as percentage of gross debt at end of t-1.3) Line 7 = line 10.4) Net borrowing excl. interest payments, line 8 = line 1 - line 2. A minus sign means a primary surplus.5) Line 11 = total of lines 5, 6 and 7 or 8, 9 and 10.
43
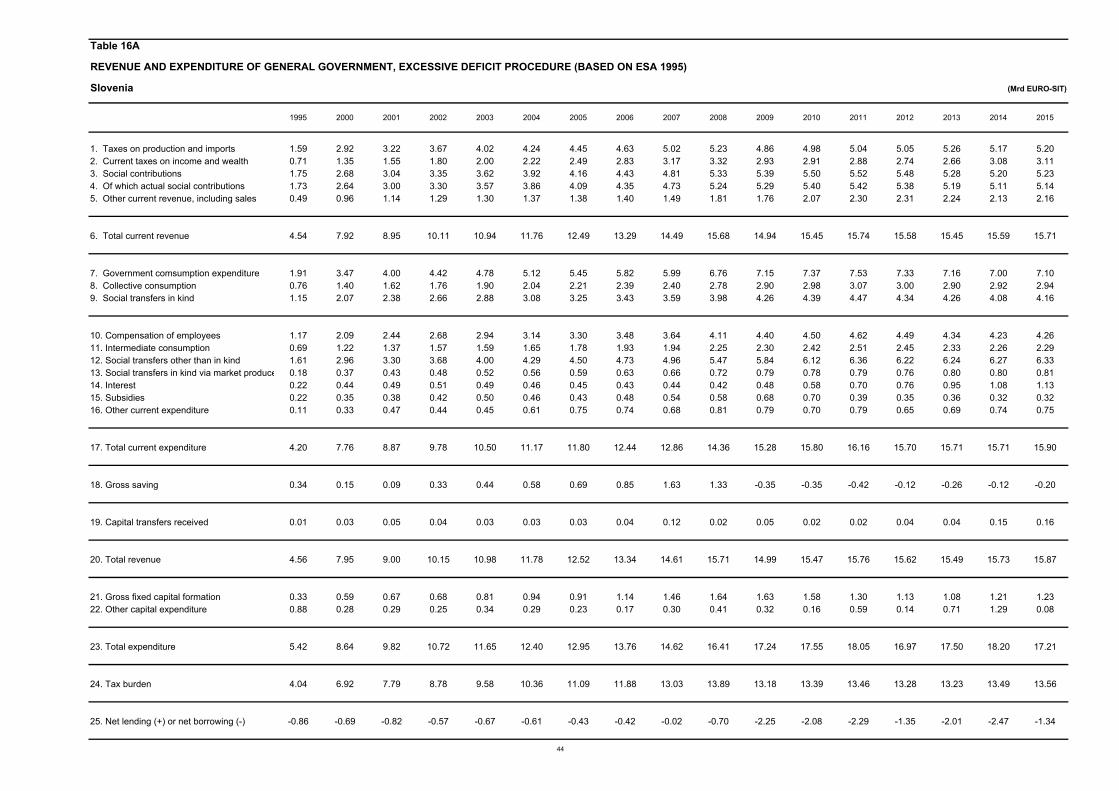
Table 16A
REVENUE AND EXPENDITURE OF GENERAL GOVERNMENT, EXCESSIVE DEFICIT PROCEDURE (BASED ON ESA 1995)
Slovenia (Mrd EURO-SIT)
1995 2000 2001 2002 2003 2004 2005 2006 2007 2008 2009 2010 2011 2012 2013 2014 2015
1. Taxes on production and imports 1.59 2.92 3.22 3.67 4.02 4.24 4.45 4.63 5.02 5.23 4.86 4.98 5.04 5.05 5.26 5.17 5.202. Current taxes on income and wealth 0.71 1.35 1.55 1.80 2.00 2.22 2.49 2.83 3.17 3.32 2.93 2.91 2.88 2.74 2.66 3.08 3.113. Social contributions 1.75 2.68 3.04 3.35 3.62 3.92 4.16 4.43 4.81 5.33 5.39 5.50 5.52 5.48 5.28 5.20 5.234. Of which actual social contributions 1.73 2.64 3.00 3.30 3.57 3.86 4.09 4.35 4.73 5.24 5.29 5.40 5.42 5.38 5.19 5.11 5.145. Other current revenue, including sales 0.49 0.96 1.14 1.29 1.30 1.37 1.38 1.40 1.49 1.81 1.76 2.07 2.30 2.31 2.24 2.13 2.16
6. Total current revenue 4.54 7.92 8.95 10.11 10.94 11.76 12.49 13.29 14.49 15.68 14.94 15.45 15.74 15.58 15.45 15.59 15.71
7. Government comsumption expenditure 1.91 3.47 4.00 4.42 4.78 5.12 5.45 5.82 5.99 6.76 7.15 7.37 7.53 7.33 7.16 7.00 7.108. Collective consumption 0.76 1.40 1.62 1.76 1.90 2.04 2.21 2.39 2.40 2.78 2.90 2.98 3.07 3.00 2.90 2.92 2.949. Social transfers in kind 1.15 2.07 2.38 2.66 2.88 3.08 3.25 3.43 3.59 3.98 4.26 4.39 4.47 4.34 4.26 4.08 4.16
10. Compensation of employees 1.17 2.09 2.44 2.68 2.94 3.14 3.30 3.48 3.64 4.11 4.40 4.50 4.62 4.49 4.34 4.23 4.2611. Intermediate consumption 0.69 1.22 1.37 1.57 1.59 1.65 1.78 1.93 1.94 2.25 2.30 2.42 2.51 2.45 2.33 2.26 2.2912. Social transfers other than in kind 1.61 2.96 3.30 3.68 4.00 4.29 4.50 4.73 4.96 5.47 5.84 6.12 6.36 6.22 6.24 6.27 6.3313. Social transfers in kind via market produce 0.18 0.37 0.43 0.48 0.52 0.56 0.59 0.63 0.66 0.72 0.79 0.78 0.79 0.76 0.80 0.80 0.8114. Interest 0.22 0.44 0.49 0.51 0.49 0.46 0.45 0.43 0.44 0.42 0.48 0.58 0.70 0.76 0.95 1.08 1.1315. Subsidies 0.22 0.35 0.38 0.42 0.50 0.46 0.43 0.48 0.54 0.58 0.68 0.70 0.39 0.35 0.36 0.32 0.3216. Other current expenditure 0.11 0.33 0.47 0.44 0.45 0.61 0.75 0.74 0.68 0.81 0.79 0.70 0.79 0.65 0.69 0.74 0.75
17. Total current expenditure 4.20 7.76 8.87 9.78 10.50 11.17 11.80 12.44 12.86 14.36 15.28 15.80 16.16 15.70 15.71 15.71 15.90
18. Gross saving 0.34 0.15 0.09 0.33 0.44 0.58 0.69 0.85 1.63 1.33 -0.35 -0.35 -0.42 -0.12 -0.26 -0.12 -0.20
19. Capital transfers received 0.01 0.03 0.05 0.04 0.03 0.03 0.03 0.04 0.12 0.02 0.05 0.02 0.02 0.04 0.04 0.15 0.16
20. Total revenue 4.56 7.95 9.00 10.15 10.98 11.78 12.52 13.34 14.61 15.71 14.99 15.47 15.76 15.62 15.49 15.73 15.87
21. Gross fixed capital formation 0.33 0.59 0.67 0.68 0.81 0.94 0.91 1.14 1.46 1.64 1.63 1.58 1.30 1.13 1.08 1.21 1.2322. Other capital expenditure 0.88 0.28 0.29 0.25 0.34 0.29 0.23 0.17 0.30 0.41 0.32 0.16 0.59 0.14 0.71 1.29 0.08
23. Total expenditure 5.42 8.64 9.82 10.72 11.65 12.40 12.95 13.76 14.62 16.41 17.24 17.55 18.05 16.97 17.50 18.20 17.21
24. Tax burden 4.04 6.92 7.79 8.78 9.58 10.36 11.09 11.88 13.03 13.89 13.18 13.39 13.46 13.28 13.23 13.49 13.56
25. Net lending (+) or net borrowing (-) -0.86 -0.69 -0.82 -0.57 -0.67 -0.61 -0.43 -0.42 -0.02 -0.70 -2.25 -2.08 -2.29 -1.35 -2.01 -2.47 -1.34
44

Table 16B
Contributions to the change in the general government gross debt ratio
Slovenia
1999 2000 2001 2002 2003 2004 2005 2006 2007 2008 2009 2010 2011 2012 2013 2014 2015
1. Net borrowing (% of GDP) 1) 3.0 3.7 4.0 2.4 2.7 2.3 1.5 1.4 0.0 1.9 6.3 5.9 6.3 3.8 5.8 7.1 3.82. Interest payments (% of GDP) 2.3 2.4 2.4 2.2 2.0 1.7 1.6 1.4 1.3 1.1 1.4 1.6 1.9 2.2 2.7 3.1 3.2
3. Implicit interest rate 2) 11.4 10.9 10.0 9.2 7.6 6.7 6.0 5.6 5.3 5.2 5.9 4.7 5.1 4.5 5.0 4.9 4.64. Nominal GDP growth rate 12.2 9.7 11.8 11.7 8.6 7.8 5.7 8.1 11.4 7.7 -4.9 0.2 1.9 -2.3 -1.0 0.1 1.6
(% of GDP)
Budgetary constraint based on thedeficit
5. Deficit (net borrowing) 1) 3.0 3.7 4.0 2.4 2.7 2.3 1.5 1.4 0.0 1.9 6.3 5.9 6.3 3.8 5.8 7.1 3.86. Contribution of nominal GDP growth -2.5 -2.1 -2.8 -2.8 -2.2 -2.0 -1.5 -2.0 -2.7 -1.6 1.1 -0.1 -0.7 1.1 0.6 -0.1 -1.17. Stock-flow adjustment 3) 0.5 0.6 -0.9 1.6 -1.0 -0.1 -0.6 0.3 -0.7 -1.4 5.7 -2.2 2.7 2.4 2.5 0.0 1.3
Budgetary constraint based on theprimary deficit
8. Primary deficit 4) 0.7 1.3 1.6 0.3 0.7 0.6 -0.1 0.0 -1.2 0.8 5.0 4.2 4.4 1.7 3.0 4.0 0.69. Snow-ball effect -0.2 0.3 -0.4 -0.6 -0.3 -0.3 0.1 -0.6 -1.4 -0.5 2.5 1.6 1.2 3.3 3.3 3.0 2.110. Stock-flow adjustment 3) 0.5 0.6 -0.9 1.6 -1.0 -0.1 -0.6 0.3 -0.7 -1.4 5.7 -2.2 2.7 2.4 2.5 0.0 1.3
(% of GDP)
11. Change in gross debt 5) 1.0 2.2 0.2 1.2 -0.6 0.1 -0.6 -0.3 -3.4 -1.1 13.2 3.5 8.3 7.3 8.8 7.0 4.012. Level of gross debt (end of year) 24.1 26.3 26.5 27.8 27.2 27.3 26.7 26.4 23.1 22.0 35.2 38.7 47.1 54.4 63.2 70.1 74.2
1) Line 1 = line 5, a minus sign means a surplus.2) Actual interest payments as percentage of gross debt at end of t-1.3) Line 7 = line 10.4) Net borrowing excl. interest payments, line 8 = line 1 - line 2. A minus sign means a primary surplus.5) Line 11 = total of lines 5, 6 and 7 or 8, 9 and 10.
45

Table 17A
REVENUE AND EXPENDITURE OF GENERAL GOVERNMENT, EXCESSIVE DEFICIT PROCEDURE (BASED ON ESA 1995)
Slovakia (Mrd EURO-SKK)
1995 2000 2001 2002 2003 2004 2005 2006 2007 2008 2009 2010 2011 2012 2013 2014 2015
1. Taxes on production and imports 2.80 3.90 3.84 4.19 4.85 5.47 6.10 6.14 6.80 6.96 6.51 6.68 7.27 7.05 7.28 7.48 7.572. Current taxes on income and wealth 2.09 2.31 2.53 2.59 2.88 2.75 2.96 3.33 3.79 4.34 3.47 3.54 3.78 3.97 4.11 4.38 4.633. Social contributions 2.92 4.43 4.86 5.41 5.67 6.01 6.31 6.55 7.29 8.01 7.97 8.25 8.63 9.02 9.91 9.86 10.214. Of which actual social contributions 2.90 4.41 4.84 5.38 5.62 5.94 6.27 6.49 7.21 7.93 7.88 8.12 8.51 8.93 9.82 9.76 10.105. Other current revenue, including sales 0.93 1.76 1.59 1.33 1.75 1.64 1.97 2.30 1.92 2.47 2.83 2.41 2.77 3.16 2.65 3.62 3.20
6. Total current revenue 8.73 12.40 12.82 13.52 15.16 15.87 17.34 18.33 19.79 21.79 20.77 20.88 22.45 23.20 23.96 25.35 25.61
7. Government comsumption expenditure 4.18 6.28 6.99 7.47 8.29 8.58 9.04 10.33 10.53 11.69 12.49 12.73 12.43 12.52 12.72 13.58 14.158. Collective consumption 3.34 3.52 4.01 4.24 4.95 5.20 5.37 6.12 5.61 6.06 6.58 6.58 6.42 6.25 6.37 6.50 6.639. Social transfers in kind 0.84 2.76 2.98 3.23 3.34 3.38 3.66 4.21 4.92 5.63 5.91 6.15 6.01 6.27 6.34 7.08 7.52
10. Compensation of employees 1.83 2.75 3.01 3.36 3.60 3.64 3.59 3.98 4.08 4.53 4.84 5.07 4.91 5.01 4.90 5.03 5.2111. Intermediate consumption 1.68 2.12 2.32 2.29 2.50 2.56 2.47 3.11 2.82 3.04 3.38 3.20 3.11 3.13 3.08 3.62 3.7912. Social transfers other than in kind 2.74 4.22 4.60 5.05 4.84 5.53 6.12 6.54 7.13 7.59 8.64 9.32 9.36 9.79 9.79 9.94 10.1113. Social transfers in kind via market produce 0.05 0.77 0.86 1.04 1.37 1.40 2.19 2.43 2.75 3.16 3.29 3.48 3.39 3.50 3.66 3.79 3.9714. Interest 0.46 1.27 1.35 1.31 1.02 0.98 0.85 0.80 0.85 0.83 0.91 0.88 1.08 1.32 1.37 1.38 1.4515. Subsidies 0.91 0.77 0.71 0.55 0.67 0.84 0.65 0.73 0.74 1.12 1.03 0.89 0.86 0.99 0.89 0.99 1.0516. Other current expenditure 0.22 0.59 0.44 0.60 1.07 0.78 0.99 0.87 1.00 1.00 1.17 1.10 1.38 1.12 1.49 1.85 1.65
17. Total current expenditure 7.89 12.49 13.30 14.21 15.07 15.73 16.86 18.46 19.36 21.27 23.26 23.94 24.11 24.88 25.18 26.61 27.24
18. Gross saving 0.84 -0.09 -0.48 -0.69 0.09 0.14 0.48 -0.13 0.43 0.52 -2.48 -3.06 -1.66 -1.68 -1.23 -1.26 -1.63
19. Capital transfers received 0.00 0.03 0.04 0.04 0.01 0.07 0.00 0.02 0.12 0.15 0.28 0.40 0.54 0.42 0.05 0.17 0.02
20. Total revenue 8.73 12.43 12.86 13.56 15.17 15.95 17.34 18.34 19.91 21.94 21.06 21.28 22.99 23.62 24.01 25.52 25.63
21. Gross fixed capital formation 0.45 0.88 1.05 1.20 1.04 1.08 1.03 1.20 1.15 1.31 1.46 1.72 1.59 1.37 1.17 0.99 1.0322. Other capital expenditure 1.04 2.89 0.72 1.17 0.19 0.20 0.84 0.43 0.51 0.75 1.38 0.67 0.79 0.61 -0.14 0.38 0.40
23. Total expenditure 9.39 16.26 15.06 16.58 16.30 17.01 18.73 20.09 21.02 23.34 26.10 26.33 26.49 26.85 26.21 27.97 28.68
24. Tax burden 7.79 10.63 11.22 12.16 13.36 14.24 15.46 16.13 18.03 19.47 18.05 18.53 19.78 20.16 21.43 21.84 22.53
25. Net lending (+) or net borrowing (-) -0.66 -3.82 -2.21 -3.02 -1.13 -1.07 -1.39 -1.75 -1.11 -1.40 -5.04 -5.05 -3.50 -3.23 -2.21 -2.45 -3.04
46

Table 17B
Contributions to the change in the general government gross debt ratio
Slovakia
1999 2000 2001 2002 2003 2004 2005 2006 2007 2008 2009 2010 2011 2012 2013 2014 2015
1. Net borrowing (% of GDP) 1) 7.4 12.3 6.5 8.2 2.8 2.4 2.8 3.2 1.8 2.1 8.0 7.7 5.1 4.5 3.0 3.2 3.82. Interest payments (% of GDP) 3.4 4.1 4.0 3.6 2.5 2.2 1.7 1.5 1.4 1.2 1.4 1.3 1.6 1.9 1.9 1.8 1.8
3. Implicit interest rate 2) 10.6 9.4 8.6 7.9 6.4 5.7 4.5 4.8 5.1 4.6 4.9 4.0 4.0 4.4 3.7 3.5 3.44. Nominal GDP growth rate 7.4 10.9 8.7 8.6 10.3 11.2 9.2 11.5 11.7 8.8 -6.1 4.9 4.7 3.1 2.4 3.9 4.8
(% of GDP)
Budgetary constraint based on thedeficit
5. Deficit (net borrowing) 1) 7.4 12.3 6.5 8.2 2.8 2.4 2.8 3.2 1.8 2.1 8.0 7.7 5.1 4.5 3.0 3.2 3.86. Contribution of nominal GDP growth -2.4 -4.7 -4.0 -3.9 -4.1 -4.3 -3.5 -3.5 -3.2 -2.4 1.8 -1.7 -1.8 -1.3 -1.2 -2.0 -2.67. Stock-flow adjustment 3) 8.3 -5.1 -3.9 -9.8 0.2 1.0 -6.6 -3.3 0.5 -1.5 -2.1 -0.6 -0.9 5.8 0.2 1.7 -0.3
Budgetary constraint based on theprimary deficit
8. Primary deficit 4) 4.0 8.2 2.5 4.7 0.3 0.2 1.1 1.7 0.4 0.8 6.6 6.3 3.5 2.7 1.1 1.4 2.09. Snow-ball effect 1.0 -0.6 0.0 -0.3 -1.6 -2.1 -1.8 -2.1 -1.8 -1.1 3.2 -0.3 -0.3 0.6 0.7 -0.2 -0.810. Stock-flow adjustment 3) 8.3 -5.1 -3.9 -9.8 0.2 1.0 -6.6 -3.3 0.5 -1.5 -2.1 -0.6 -0.9 5.8 0.2 1.7 -0.3
(% of GDP)
11. Change in gross debt 5) 13.3 2.5 -1.4 -5.4 -1.0 -0.9 -7.3 -3.6 -0.9 -1.8 7.7 5.4 2.4 9.0 2.0 2.9 0.912. Level of gross debt (end of year) 47.8 50.3 48.9 43.4 42.4 41.5 34.2 30.5 29.6 27.9 35.6 41.0 43.4 52.4 54.3 57.2 58.1
1) Line 1 = line 5, a minus sign means a surplus.2) Actual interest payments as percentage of gross debt at end of t-1.3) Line 7 = line 10.4) Net borrowing excl. interest payments, line 8 = line 1 - line 2. A minus sign means a primary surplus.5) Line 11 = total of lines 5, 6 and 7 or 8, 9 and 10.
47
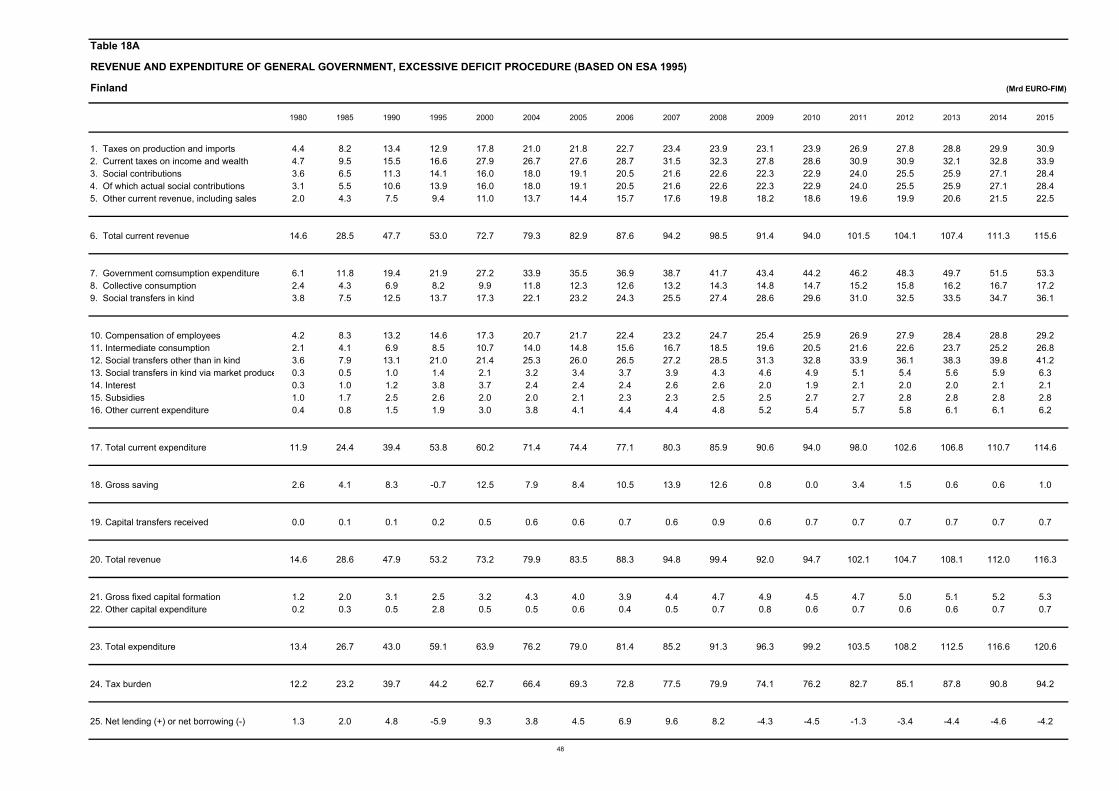
Table 18A
REVENUE AND EXPENDITURE OF GENERAL GOVERNMENT, EXCESSIVE DEFICIT PROCEDURE (BASED ON ESA 1995)
Finland (Mrd EURO-FIM)
1980 1985 1990 1995 2000 2004 2005 2006 2007 2008 2009 2010 2011 2012 2013 2014 2015
1. Taxes on production and imports 4.4 8.2 13.4 12.9 17.8 21.0 21.8 22.7 23.4 23.9 23.1 23.9 26.9 27.8 28.8 29.9 30.92. Current taxes on income and wealth 4.7 9.5 15.5 16.6 27.9 26.7 27.6 28.7 31.5 32.3 27.8 28.6 30.9 30.9 32.1 32.8 33.93. Social contributions 3.6 6.5 11.3 14.1 16.0 18.0 19.1 20.5 21.6 22.6 22.3 22.9 24.0 25.5 25.9 27.1 28.44. Of which actual social contributions 3.1 5.5 10.6 13.9 16.0 18.0 19.1 20.5 21.6 22.6 22.3 22.9 24.0 25.5 25.9 27.1 28.45. Other current revenue, including sales 2.0 4.3 7.5 9.4 11.0 13.7 14.4 15.7 17.6 19.8 18.2 18.6 19.6 19.9 20.6 21.5 22.5
6. Total current revenue 14.6 28.5 47.7 53.0 72.7 79.3 82.9 87.6 94.2 98.5 91.4 94.0 101.5 104.1 107.4 111.3 115.6
7. Government comsumption expenditure 6.1 11.8 19.4 21.9 27.2 33.9 35.5 36.9 38.7 41.7 43.4 44.2 46.2 48.3 49.7 51.5 53.38. Collective consumption 2.4 4.3 6.9 8.2 9.9 11.8 12.3 12.6 13.2 14.3 14.8 14.7 15.2 15.8 16.2 16.7 17.29. Social transfers in kind 3.8 7.5 12.5 13.7 17.3 22.1 23.2 24.3 25.5 27.4 28.6 29.6 31.0 32.5 33.5 34.7 36.1
10. Compensation of employees 4.2 8.3 13.2 14.6 17.3 20.7 21.7 22.4 23.2 24.7 25.4 25.9 26.9 27.9 28.4 28.8 29.211. Intermediate consumption 2.1 4.1 6.9 8.5 10.7 14.0 14.8 15.6 16.7 18.5 19.6 20.5 21.6 22.6 23.7 25.2 26.812. Social transfers other than in kind 3.6 7.9 13.1 21.0 21.4 25.3 26.0 26.5 27.2 28.5 31.3 32.8 33.9 36.1 38.3 39.8 41.213. Social transfers in kind via market produce 0.3 0.5 1.0 1.4 2.1 3.2 3.4 3.7 3.9 4.3 4.6 4.9 5.1 5.4 5.6 5.9 6.314. Interest 0.3 1.0 1.2 3.8 3.7 2.4 2.4 2.4 2.6 2.6 2.0 1.9 2.1 2.0 2.0 2.1 2.115. Subsidies 1.0 1.7 2.5 2.6 2.0 2.0 2.1 2.3 2.3 2.5 2.5 2.7 2.7 2.8 2.8 2.8 2.816. Other current expenditure 0.4 0.8 1.5 1.9 3.0 3.8 4.1 4.4 4.4 4.8 5.2 5.4 5.7 5.8 6.1 6.1 6.2
17. Total current expenditure 11.9 24.4 39.4 53.8 60.2 71.4 74.4 77.1 80.3 85.9 90.6 94.0 98.0 102.6 106.8 110.7 114.6
18. Gross saving 2.6 4.1 8.3 -0.7 12.5 7.9 8.4 10.5 13.9 12.6 0.8 0.0 3.4 1.5 0.6 0.6 1.0
19. Capital transfers received 0.0 0.1 0.1 0.2 0.5 0.6 0.6 0.7 0.6 0.9 0.6 0.7 0.7 0.7 0.7 0.7 0.7
20. Total revenue 14.6 28.6 47.9 53.2 73.2 79.9 83.5 88.3 94.8 99.4 92.0 94.7 102.1 104.7 108.1 112.0 116.3
21. Gross fixed capital formation 1.2 2.0 3.1 2.5 3.2 4.3 4.0 3.9 4.4 4.7 4.9 4.5 4.7 5.0 5.1 5.2 5.322. Other capital expenditure 0.2 0.3 0.5 2.8 0.5 0.5 0.6 0.4 0.5 0.7 0.8 0.6 0.7 0.6 0.6 0.7 0.7
23. Total expenditure 13.4 26.7 43.0 59.1 63.9 76.2 79.0 81.4 85.2 91.3 96.3 99.2 103.5 108.2 112.5 116.6 120.6
24. Tax burden 12.2 23.2 39.7 44.2 62.7 66.4 69.3 72.8 77.5 79.9 74.1 76.2 82.7 85.1 87.8 90.8 94.2
25. Net lending (+) or net borrowing (-) 1.3 2.0 4.8 -5.9 9.3 3.8 4.5 6.9 9.6 8.2 -4.3 -4.5 -1.3 -3.4 -4.4 -4.6 -4.2
48
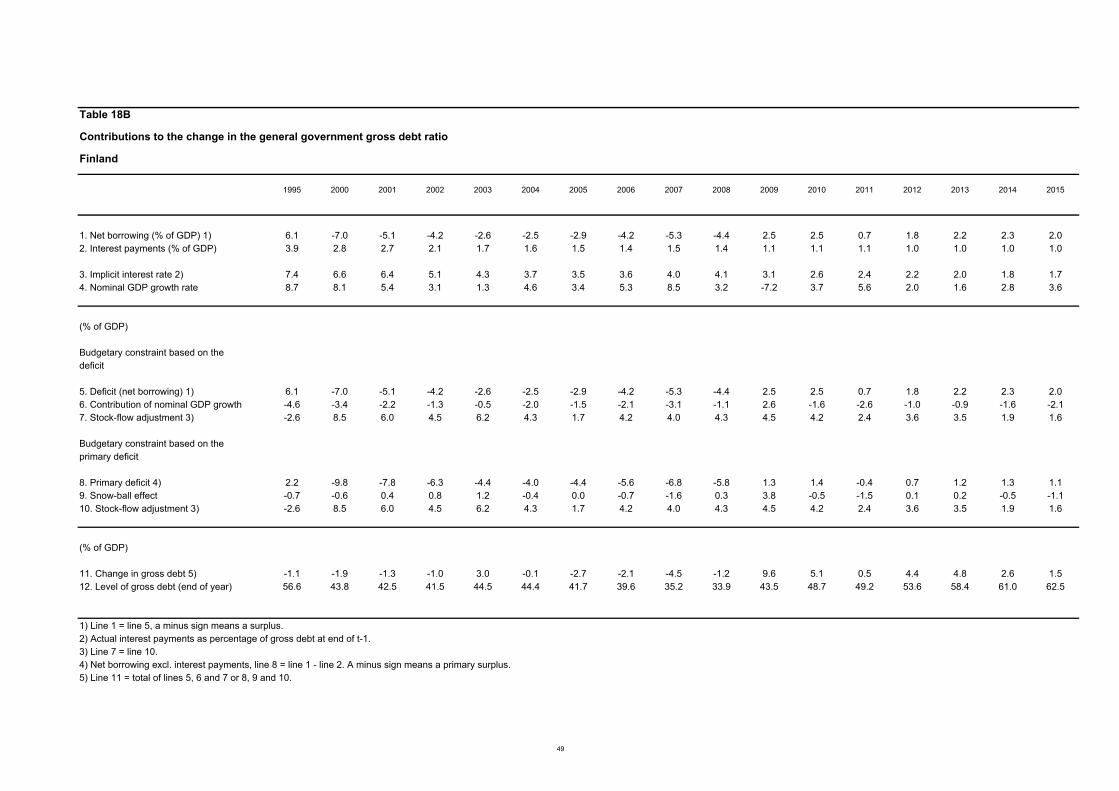
Table 18B
Contributions to the change in the general government gross debt ratio
Finland
1995 2000 2001 2002 2003 2004 2005 2006 2007 2008 2009 2010 2011 2012 2013 2014 2015
1. Net borrowing (% of GDP) 1) 6.1 -7.0 -5.1 -4.2 -2.6 -2.5 -2.9 -4.2 -5.3 -4.4 2.5 2.5 0.7 1.8 2.2 2.3 2.02. Interest payments (% of GDP) 3.9 2.8 2.7 2.1 1.7 1.6 1.5 1.4 1.5 1.4 1.1 1.1 1.1 1.0 1.0 1.0 1.0
3. Implicit interest rate 2) 7.4 6.6 6.4 5.1 4.3 3.7 3.5 3.6 4.0 4.1 3.1 2.6 2.4 2.2 2.0 1.8 1.74. Nominal GDP growth rate 8.7 8.1 5.4 3.1 1.3 4.6 3.4 5.3 8.5 3.2 -7.2 3.7 5.6 2.0 1.6 2.8 3.6
(% of GDP)
Budgetary constraint based on thedeficit
5. Deficit (net borrowing) 1) 6.1 -7.0 -5.1 -4.2 -2.6 -2.5 -2.9 -4.2 -5.3 -4.4 2.5 2.5 0.7 1.8 2.2 2.3 2.06. Contribution of nominal GDP growth -4.6 -3.4 -2.2 -1.3 -0.5 -2.0 -1.5 -2.1 -3.1 -1.1 2.6 -1.6 -2.6 -1.0 -0.9 -1.6 -2.17. Stock-flow adjustment 3) -2.6 8.5 6.0 4.5 6.2 4.3 1.7 4.2 4.0 4.3 4.5 4.2 2.4 3.6 3.5 1.9 1.6
Budgetary constraint based on theprimary deficit
8. Primary deficit 4) 2.2 -9.8 -7.8 -6.3 -4.4 -4.0 -4.4 -5.6 -6.8 -5.8 1.3 1.4 -0.4 0.7 1.2 1.3 1.19. Snow-ball effect -0.7 -0.6 0.4 0.8 1.2 -0.4 0.0 -0.7 -1.6 0.3 3.8 -0.5 -1.5 0.1 0.2 -0.5 -1.110. Stock-flow adjustment 3) -2.6 8.5 6.0 4.5 6.2 4.3 1.7 4.2 4.0 4.3 4.5 4.2 2.4 3.6 3.5 1.9 1.6
(% of GDP)
11. Change in gross debt 5) -1.1 -1.9 -1.3 -1.0 3.0 -0.1 -2.7 -2.1 -4.5 -1.2 9.6 5.1 0.5 4.4 4.8 2.6 1.512. Level of gross debt (end of year) 56.6 43.8 42.5 41.5 44.5 44.4 41.7 39.6 35.2 33.9 43.5 48.7 49.2 53.6 58.4 61.0 62.5
1) Line 1 = line 5, a minus sign means a surplus.2) Actual interest payments as percentage of gross debt at end of t-1.3) Line 7 = line 10.4) Net borrowing excl. interest payments, line 8 = line 1 - line 2. A minus sign means a primary surplus.5) Line 11 = total of lines 5, 6 and 7 or 8, 9 and 10.
49
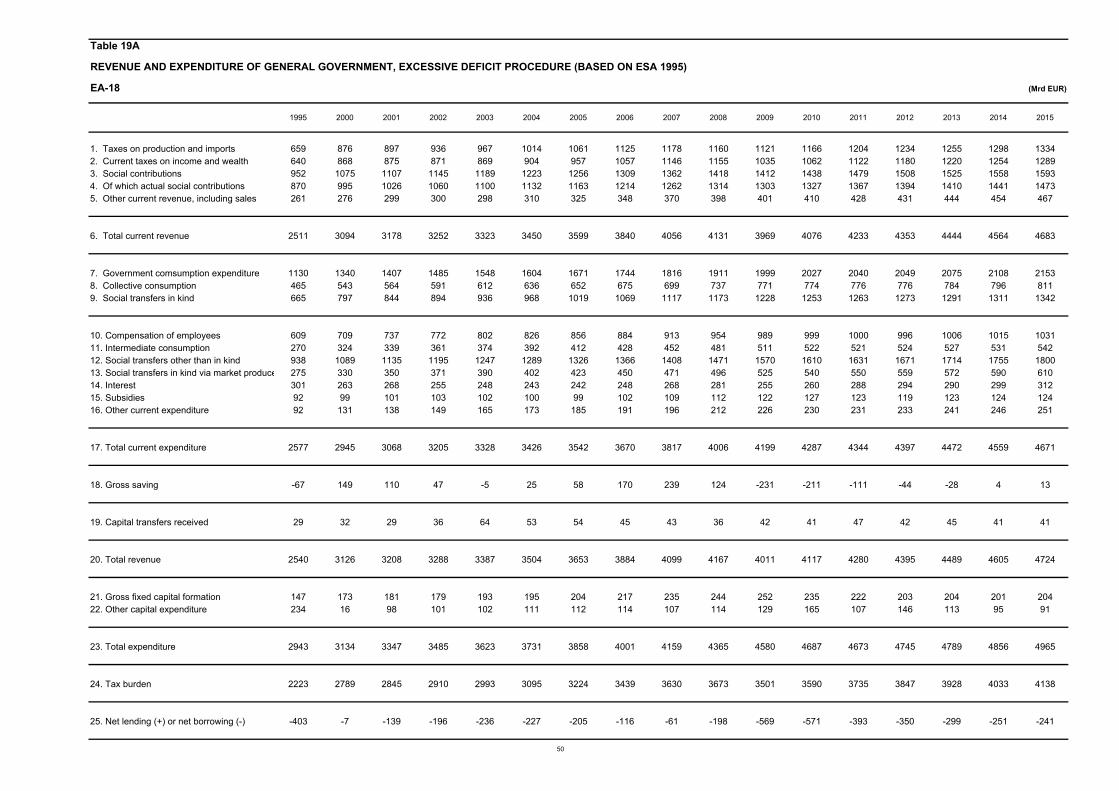
Table 19A
REVENUE AND EXPENDITURE OF GENERAL GOVERNMENT, EXCESSIVE DEFICIT PROCEDURE (BASED ON ESA 1995)
EA-18 (Mrd EUR)
1995 2000 2001 2002 2003 2004 2005 2006 2007 2008 2009 2010 2011 2012 2013 2014 2015
1. Taxes on production and imports 659 876 897 936 967 1014 1061 1125 1178 1160 1121 1166 1204 1234 1255 1298 13342. Current taxes on income and wealth 640 868 875 871 869 904 957 1057 1146 1155 1035 1062 1122 1180 1220 1254 12893. Social contributions 952 1075 1107 1145 1189 1223 1256 1309 1362 1418 1412 1438 1479 1508 1525 1558 15934. Of which actual social contributions 870 995 1026 1060 1100 1132 1163 1214 1262 1314 1303 1327 1367 1394 1410 1441 14735. Other current revenue, including sales 261 276 299 300 298 310 325 348 370 398 401 410 428 431 444 454 467
6. Total current revenue 2511 3094 3178 3252 3323 3450 3599 3840 4056 4131 3969 4076 4233 4353 4444 4564 4683
7. Government comsumption expenditure 1130 1340 1407 1485 1548 1604 1671 1744 1816 1911 1999 2027 2040 2049 2075 2108 21538. Collective consumption 465 543 564 591 612 636 652 675 699 737 771 774 776 776 784 796 8119. Social transfers in kind 665 797 844 894 936 968 1019 1069 1117 1173 1228 1253 1263 1273 1291 1311 1342
10. Compensation of employees 609 709 737 772 802 826 856 884 913 954 989 999 1000 996 1006 1015 103111. Intermediate consumption 270 324 339 361 374 392 412 428 452 481 511 522 521 524 527 531 54212. Social transfers other than in kind 938 1089 1135 1195 1247 1289 1326 1366 1408 1471 1570 1610 1631 1671 1714 1755 180013. Social transfers in kind via market produce 275 330 350 371 390 402 423 450 471 496 525 540 550 559 572 590 61014. Interest 301 263 268 255 248 243 242 248 268 281 255 260 288 294 290 299 31215. Subsidies 92 99 101 103 102 100 99 102 109 112 122 127 123 119 123 124 12416. Other current expenditure 92 131 138 149 165 173 185 191 196 212 226 230 231 233 241 246 251
17. Total current expenditure 2577 2945 3068 3205 3328 3426 3542 3670 3817 4006 4199 4287 4344 4397 4472 4559 4671
18. Gross saving -67 149 110 47 -5 25 58 170 239 124 -231 -211 -111 -44 -28 4 13
19. Capital transfers received 29 32 29 36 64 53 54 45 43 36 42 41 47 42 45 41 41
20. Total revenue 2540 3126 3208 3288 3387 3504 3653 3884 4099 4167 4011 4117 4280 4395 4489 4605 4724
21. Gross fixed capital formation 147 173 181 179 193 195 204 217 235 244 252 235 222 203 204 201 20422. Other capital expenditure 234 16 98 101 102 111 112 114 107 114 129 165 107 146 113 95 91
23. Total expenditure 2943 3134 3347 3485 3623 3731 3858 4001 4159 4365 4580 4687 4673 4745 4789 4856 4965
24. Tax burden 2223 2789 2845 2910 2993 3095 3224 3439 3630 3673 3501 3590 3735 3847 3928 4033 4138
25. Net lending (+) or net borrowing (-) -403 -7 -139 -196 -236 -227 -205 -116 -61 -198 -569 -571 -393 -350 -299 -251 -241
50
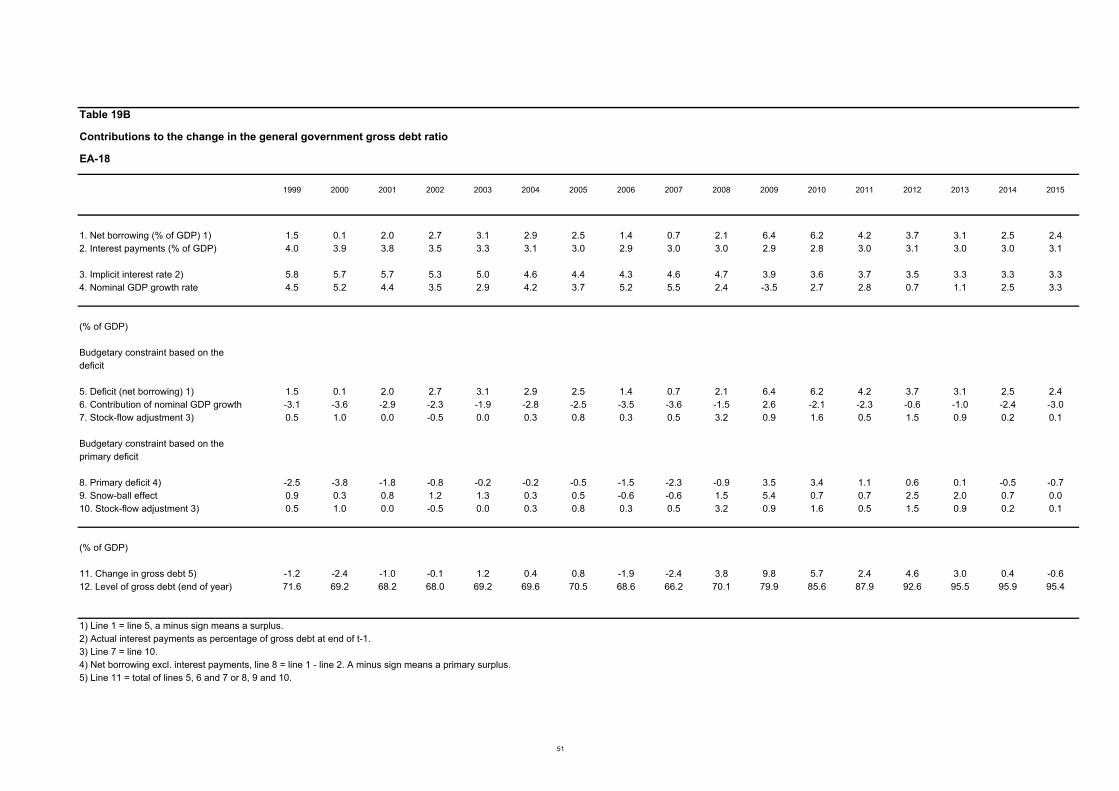
Table 19B
Contributions to the change in the general government gross debt ratio
EA-18
1999 2000 2001 2002 2003 2004 2005 2006 2007 2008 2009 2010 2011 2012 2013 2014 2015
1. Net borrowing (% of GDP) 1) 1.5 0.1 2.0 2.7 3.1 2.9 2.5 1.4 0.7 2.1 6.4 6.2 4.2 3.7 3.1 2.5 2.42. Interest payments (% of GDP) 4.0 3.9 3.8 3.5 3.3 3.1 3.0 2.9 3.0 3.0 2.9 2.8 3.0 3.1 3.0 3.0 3.1
3. Implicit interest rate 2) 5.8 5.7 5.7 5.3 5.0 4.6 4.4 4.3 4.6 4.7 3.9 3.6 3.7 3.5 3.3 3.3 3.34. Nominal GDP growth rate 4.5 5.2 4.4 3.5 2.9 4.2 3.7 5.2 5.5 2.4 -3.5 2.7 2.8 0.7 1.1 2.5 3.3
(% of GDP)
Budgetary constraint based on thedeficit
5. Deficit (net borrowing) 1) 1.5 0.1 2.0 2.7 3.1 2.9 2.5 1.4 0.7 2.1 6.4 6.2 4.2 3.7 3.1 2.5 2.46. Contribution of nominal GDP growth -3.1 -3.6 -2.9 -2.3 -1.9 -2.8 -2.5 -3.5 -3.6 -1.5 2.6 -2.1 -2.3 -0.6 -1.0 -2.4 -3.07. Stock-flow adjustment 3) 0.5 1.0 0.0 -0.5 0.0 0.3 0.8 0.3 0.5 3.2 0.9 1.6 0.5 1.5 0.9 0.2 0.1
Budgetary constraint based on theprimary deficit
8. Primary deficit 4) -2.5 -3.8 -1.8 -0.8 -0.2 -0.2 -0.5 -1.5 -2.3 -0.9 3.5 3.4 1.1 0.6 0.1 -0.5 -0.79. Snow-ball effect 0.9 0.3 0.8 1.2 1.3 0.3 0.5 -0.6 -0.6 1.5 5.4 0.7 0.7 2.5 2.0 0.7 0.010. Stock-flow adjustment 3) 0.5 1.0 0.0 -0.5 0.0 0.3 0.8 0.3 0.5 3.2 0.9 1.6 0.5 1.5 0.9 0.2 0.1
(% of GDP)
11. Change in gross debt 5) -1.2 -2.4 -1.0 -0.1 1.2 0.4 0.8 -1.9 -2.4 3.8 9.8 5.7 2.4 4.6 3.0 0.4 -0.612. Level of gross debt (end of year) 71.6 69.2 68.2 68.0 69.2 69.6 70.5 68.6 66.2 70.1 79.9 85.6 87.9 92.6 95.5 95.9 95.4
1) Line 1 = line 5, a minus sign means a surplus.2) Actual interest payments as percentage of gross debt at end of t-1.3) Line 7 = line 10.4) Net borrowing excl. interest payments, line 8 = line 1 - line 2. A minus sign means a primary surplus.5) Line 11 = total of lines 5, 6 and 7 or 8, 9 and 10.
51
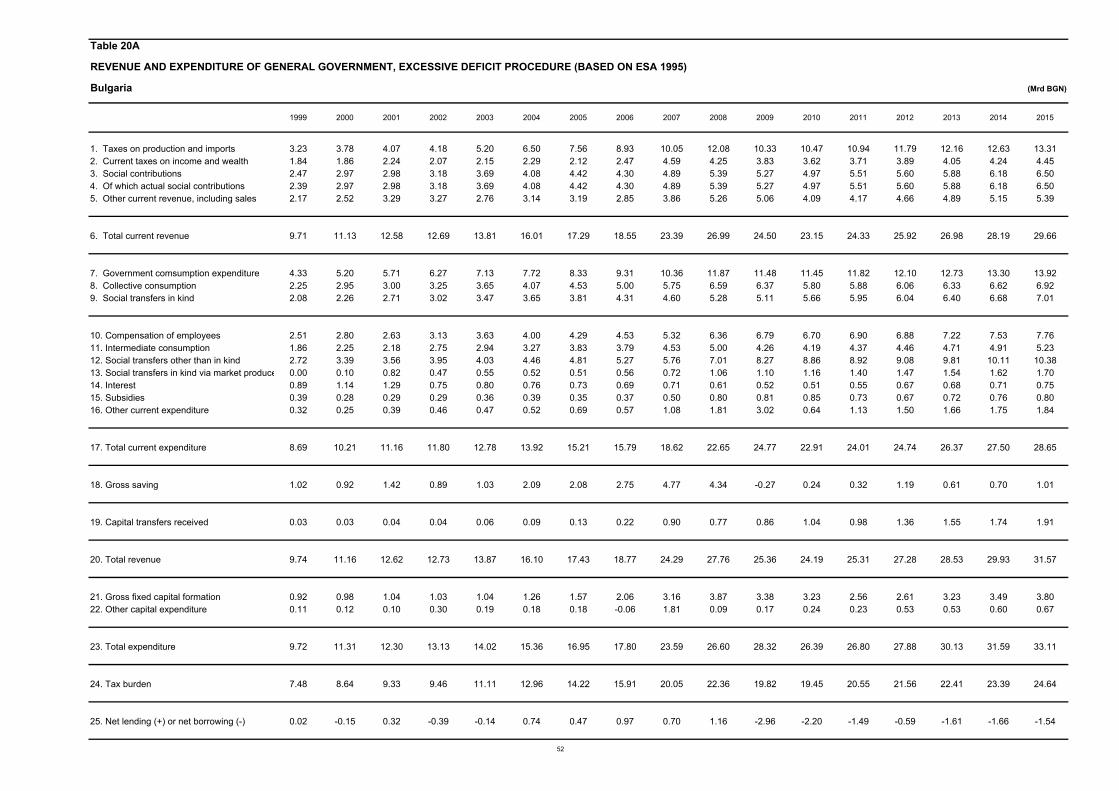
Table 20A
REVENUE AND EXPENDITURE OF GENERAL GOVERNMENT, EXCESSIVE DEFICIT PROCEDURE (BASED ON ESA 1995)
Bulgaria (Mrd BGN)
1999 2000 2001 2002 2003 2004 2005 2006 2007 2008 2009 2010 2011 2012 2013 2014 2015
1. Taxes on production and imports 3.23 3.78 4.07 4.18 5.20 6.50 7.56 8.93 10.05 12.08 10.33 10.47 10.94 11.79 12.16 12.63 13.312. Current taxes on income and wealth 1.84 1.86 2.24 2.07 2.15 2.29 2.12 2.47 4.59 4.25 3.83 3.62 3.71 3.89 4.05 4.24 4.453. Social contributions 2.47 2.97 2.98 3.18 3.69 4.08 4.42 4.30 4.89 5.39 5.27 4.97 5.51 5.60 5.88 6.18 6.504. Of which actual social contributions 2.39 2.97 2.98 3.18 3.69 4.08 4.42 4.30 4.89 5.39 5.27 4.97 5.51 5.60 5.88 6.18 6.505. Other current revenue, including sales 2.17 2.52 3.29 3.27 2.76 3.14 3.19 2.85 3.86 5.26 5.06 4.09 4.17 4.66 4.89 5.15 5.39
6. Total current revenue 9.71 11.13 12.58 12.69 13.81 16.01 17.29 18.55 23.39 26.99 24.50 23.15 24.33 25.92 26.98 28.19 29.66
7. Government comsumption expenditure 4.33 5.20 5.71 6.27 7.13 7.72 8.33 9.31 10.36 11.87 11.48 11.45 11.82 12.10 12.73 13.30 13.928. Collective consumption 2.25 2.95 3.00 3.25 3.65 4.07 4.53 5.00 5.75 6.59 6.37 5.80 5.88 6.06 6.33 6.62 6.929. Social transfers in kind 2.08 2.26 2.71 3.02 3.47 3.65 3.81 4.31 4.60 5.28 5.11 5.66 5.95 6.04 6.40 6.68 7.01
10. Compensation of employees 2.51 2.80 2.63 3.13 3.63 4.00 4.29 4.53 5.32 6.36 6.79 6.70 6.90 6.88 7.22 7.53 7.7611. Intermediate consumption 1.86 2.25 2.18 2.75 2.94 3.27 3.83 3.79 4.53 5.00 4.26 4.19 4.37 4.46 4.71 4.91 5.2312. Social transfers other than in kind 2.72 3.39 3.56 3.95 4.03 4.46 4.81 5.27 5.76 7.01 8.27 8.86 8.92 9.08 9.81 10.11 10.3813. Social transfers in kind via market produce 0.00 0.10 0.82 0.47 0.55 0.52 0.51 0.56 0.72 1.06 1.10 1.16 1.40 1.47 1.54 1.62 1.7014. Interest 0.89 1.14 1.29 0.75 0.80 0.76 0.73 0.69 0.71 0.61 0.52 0.51 0.55 0.67 0.68 0.71 0.7515. Subsidies 0.39 0.28 0.29 0.29 0.36 0.39 0.35 0.37 0.50 0.80 0.81 0.85 0.73 0.67 0.72 0.76 0.8016. Other current expenditure 0.32 0.25 0.39 0.46 0.47 0.52 0.69 0.57 1.08 1.81 3.02 0.64 1.13 1.50 1.66 1.75 1.84
17. Total current expenditure 8.69 10.21 11.16 11.80 12.78 13.92 15.21 15.79 18.62 22.65 24.77 22.91 24.01 24.74 26.37 27.50 28.65
18. Gross saving 1.02 0.92 1.42 0.89 1.03 2.09 2.08 2.75 4.77 4.34 -0.27 0.24 0.32 1.19 0.61 0.70 1.01
19. Capital transfers received 0.03 0.03 0.04 0.04 0.06 0.09 0.13 0.22 0.90 0.77 0.86 1.04 0.98 1.36 1.55 1.74 1.91
20. Total revenue 9.74 11.16 12.62 12.73 13.87 16.10 17.43 18.77 24.29 27.76 25.36 24.19 25.31 27.28 28.53 29.93 31.57
21. Gross fixed capital formation 0.92 0.98 1.04 1.03 1.04 1.26 1.57 2.06 3.16 3.87 3.38 3.23 2.56 2.61 3.23 3.49 3.8022. Other capital expenditure 0.11 0.12 0.10 0.30 0.19 0.18 0.18 -0.06 1.81 0.09 0.17 0.24 0.23 0.53 0.53 0.60 0.67
23. Total expenditure 9.72 11.31 12.30 13.13 14.02 15.36 16.95 17.80 23.59 26.60 28.32 26.39 26.80 27.88 30.13 31.59 33.11
24. Tax burden 7.48 8.64 9.33 9.46 11.11 12.96 14.22 15.91 20.05 22.36 19.82 19.45 20.55 21.56 22.41 23.39 24.64
25. Net lending (+) or net borrowing (-) 0.02 -0.15 0.32 -0.39 -0.14 0.74 0.47 0.97 0.70 1.16 -2.96 -2.20 -1.49 -0.59 -1.61 -1.66 -1.54
52

Table 20B
Contributions to the change in the general government gross debt ratio
Bulgaria
1999 2000 2001 2002 2003 2004 2005 2006 2007 2008 2009 2010 2011 2012 2013 2014 2015
1. Net borrowing (% of GDP) 1) -0.1 0.5 -1.1 1.2 0.4 -1.9 -1.0 -1.9 -1.2 -1.7 4.3 3.1 2.0 0.8 2.0 2.0 1.82. Interest payments (% of GDP) 3.7 4.2 4.3 2.3 2.2 1.9 1.6 1.3 1.2 0.9 0.8 0.7 0.7 0.9 0.8 0.9 0.9
3. Implicit interest rate 2) 5.0 6.1 6.5 3.8 4.6 4.8 5.0 5.5 6.3 5.9 5.5 5.1 4.8 5.5 4.7 4.6 4.04. Nominal GDP growth rate 5.7 12.7 10.6 9.5 7.9 11.2 14.2 13.8 16.2 15.1 -1.4 3.2 6.8 3.0 3.4 3.4 4.0
(% of GDP)
Budgetary constraint based on thedeficit
5. Deficit (net borrowing) 1) -0.1 0.5 -1.1 1.2 0.4 -1.9 -1.0 -1.9 -1.2 -1.7 4.3 3.1 2.0 0.8 2.0 2.0 1.86. Contribution of nominal GDP growth -4.2 -8.8 -6.9 -5.7 -3.8 -4.5 -4.6 -3.3 -3.0 -2.3 0.2 -0.5 -1.0 -0.5 -0.6 -0.6 -0.97. Stock-flow adjustment 3) 4.3 3.1 1.5 -9.1 -4.5 -1.1 -3.8 -0.7 -0.2 0.4 -3.6 -1.0 -0.9 1.9 -0.5 1.8 0.6
Budgetary constraint based on theprimary deficit
8. Primary deficit 4) -3.8 -3.6 -5.3 -1.1 -1.8 -3.8 -2.7 -3.2 -2.3 -2.6 3.6 2.4 1.2 -0.1 1.2 1.1 0.99. Snow-ball effect -0.5 -4.6 -2.7 -3.5 -1.6 -2.6 -3.0 -2.0 -1.8 -1.4 1.0 0.3 -0.3 0.4 0.2 0.2 0.010. Stock-flow adjustment 3) 4.3 3.1 1.5 -9.1 -4.5 -1.1 -3.8 -0.7 -0.2 0.4 -3.6 -1.0 -0.9 1.9 -0.5 1.8 0.6
(% of GDP)
11. Change in gross debt 5) 0.0 -5.1 -6.6 -13.6 -8.0 -7.4 -9.5 -5.9 -4.4 -3.5 0.9 1.6 0.1 2.2 0.9 3.2 1.512. Level of gross debt (end of year) 77.6 72.5 66.0 52.4 44.4 37.0 27.5 21.6 17.2 13.7 14.6 16.2 16.3 18.5 19.4 22.6 24.1
1) Line 1 = line 5, a minus sign means a surplus.2) Actual interest payments as percentage of gross debt at end of t-1.3) Line 7 = line 10.4) Net borrowing excl. interest payments, line 8 = line 1 - line 2. A minus sign means a primary surplus.5) Line 11 = total of lines 5, 6 and 7 or 8, 9 and 10.
53
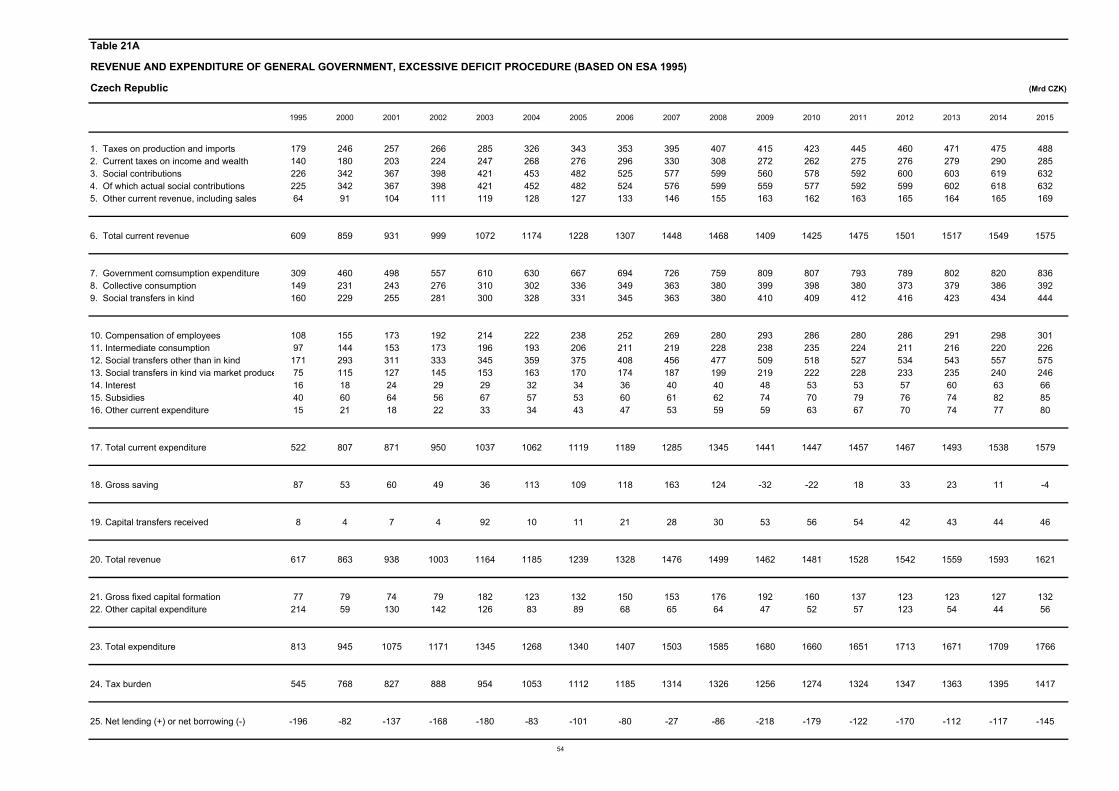
Table 21A
REVENUE AND EXPENDITURE OF GENERAL GOVERNMENT, EXCESSIVE DEFICIT PROCEDURE (BASED ON ESA 1995)
Czech Republic (Mrd CZK)
1995 2000 2001 2002 2003 2004 2005 2006 2007 2008 2009 2010 2011 2012 2013 2014 2015
1. Taxes on production and imports 179 246 257 266 285 326 343 353 395 407 415 423 445 460 471 475 4882. Current taxes on income and wealth 140 180 203 224 247 268 276 296 330 308 272 262 275 276 279 290 2853. Social contributions 226 342 367 398 421 453 482 525 577 599 560 578 592 600 603 619 6324. Of which actual social contributions 225 342 367 398 421 452 482 524 576 599 559 577 592 599 602 618 6325. Other current revenue, including sales 64 91 104 111 119 128 127 133 146 155 163 162 163 165 164 165 169
6. Total current revenue 609 859 931 999 1072 1174 1228 1307 1448 1468 1409 1425 1475 1501 1517 1549 1575
7. Government comsumption expenditure 309 460 498 557 610 630 667 694 726 759 809 807 793 789 802 820 8368. Collective consumption 149 231 243 276 310 302 336 349 363 380 399 398 380 373 379 386 3929. Social transfers in kind 160 229 255 281 300 328 331 345 363 380 410 409 412 416 423 434 444
10. Compensation of employees 108 155 173 192 214 222 238 252 269 280 293 286 280 286 291 298 30111. Intermediate consumption 97 144 153 173 196 193 206 211 219 228 238 235 224 211 216 220 22612. Social transfers other than in kind 171 293 311 333 345 359 375 408 456 477 509 518 527 534 543 557 57513. Social transfers in kind via market produce 75 115 127 145 153 163 170 174 187 199 219 222 228 233 235 240 24614. Interest 16 18 24 29 29 32 34 36 40 40 48 53 53 57 60 63 6615. Subsidies 40 60 64 56 67 57 53 60 61 62 74 70 79 76 74 82 8516. Other current expenditure 15 21 18 22 33 34 43 47 53 59 59 63 67 70 74 77 80
17. Total current expenditure 522 807 871 950 1037 1062 1119 1189 1285 1345 1441 1447 1457 1467 1493 1538 1579
18. Gross saving 87 53 60 49 36 113 109 118 163 124 -32 -22 18 33 23 11 -4
19. Capital transfers received 8 4 7 4 92 10 11 21 28 30 53 56 54 42 43 44 46
20. Total revenue 617 863 938 1003 1164 1185 1239 1328 1476 1499 1462 1481 1528 1542 1559 1593 1621
21. Gross fixed capital formation 77 79 74 79 182 123 132 150 153 176 192 160 137 123 123 127 13222. Other capital expenditure 214 59 130 142 126 83 89 68 65 64 47 52 57 123 54 44 56
23. Total expenditure 813 945 1075 1171 1345 1268 1340 1407 1503 1585 1680 1660 1651 1713 1671 1709 1766
24. Tax burden 545 768 827 888 954 1053 1112 1185 1314 1326 1256 1274 1324 1347 1363 1395 1417
25. Net lending (+) or net borrowing (-) -196 -82 -137 -168 -180 -83 -101 -80 -27 -86 -218 -179 -122 -170 -112 -117 -145
54

Table 21B
Contributions to the change in the general government gross debt ratio
Czech Republic
1999 2000 2001 2002 2003 2004 2005 2006 2007 2008 2009 2010 2011 2012 2013 2014 2015
1. Net borrowing (% of GDP) 1) 3.6 3.6 5.6 6.5 6.7 2.8 3.2 2.4 0.7 2.2 5.8 4.7 3.2 4.4 2.9 3.0 3.52. Interest payments (% of GDP) 1.0 0.8 1.0 1.1 1.1 1.1 1.1 1.1 1.1 1.1 1.3 1.4 1.4 1.5 1.6 1.6 1.6
3. Implicit interest rate 2) 6.9 5.3 5.9 5.0 4.1 4.2 4.0 4.0 4.2 4.0 4.4 4.1 3.6 3.6 3.4 3.3 3.34. Nominal GDP growth rate 4.2 5.6 7.9 4.9 4.7 9.0 6.4 7.6 9.2 5.1 -2.3 0.8 0.9 0.6 0.2 2.6 3.5
(% of GDP)
Budgetary constraint based on thedeficit
5. Deficit (net borrowing) 1) 3.6 3.6 5.6 6.5 6.7 2.8 3.2 2.4 0.7 2.2 5.8 4.7 3.2 4.4 2.9 3.0 3.56. Contribution of nominal GDP growth -0.6 -0.8 -1.3 -1.1 -1.2 -2.3 -1.7 -2.0 -2.4 -1.3 0.7 -0.3 -0.3 -0.2 -0.1 -1.2 -1.77. Stock-flow adjustment 3) -1.7 -0.8 1.9 -2.3 -4.1 -0.1 -2.0 -0.5 1.4 -0.1 -0.6 -0.6 0.2 0.6 0.1 -0.1 -0.1
Budgetary constraint based on theprimary deficit
8. Primary deficit 4) 2.6 2.8 4.6 5.4 5.6 1.8 2.2 1.3 -0.4 1.2 4.5 3.3 1.8 2.9 1.3 1.4 1.99. Snow-ball effect 0.4 0.0 -0.3 0.0 -0.1 -1.2 -0.6 -0.9 -1.3 -0.3 2.0 1.1 1.1 1.2 1.5 0.4 -0.110. Stock-flow adjustment 3) -1.7 -0.8 1.9 -2.3 -4.1 -0.1 -2.0 -0.5 1.4 -0.1 -0.6 -0.6 0.2 0.6 0.1 -0.1 -0.1
(% of GDP)
11. Change in gross debt 5) 1.3 1.9 6.2 3.1 1.4 0.4 -0.5 -0.2 -0.3 0.8 5.9 3.8 3.0 4.8 2.9 1.6 1.712. Level of gross debt (end of year) 15.8 17.8 23.9 27.1 28.5 28.9 28.4 28.2 27.9 28.7 34.6 38.4 41.4 46.2 49.0 50.6 52.3
1) Line 1 = line 5, a minus sign means a surplus.2) Actual interest payments as percentage of gross debt at end of t-1.3) Line 7 = line 10.4) Net borrowing excl. interest payments, line 8 = line 1 - line 2. A minus sign means a primary surplus.5) Line 11 = total of lines 5, 6 and 7 or 8, 9 and 10.
55
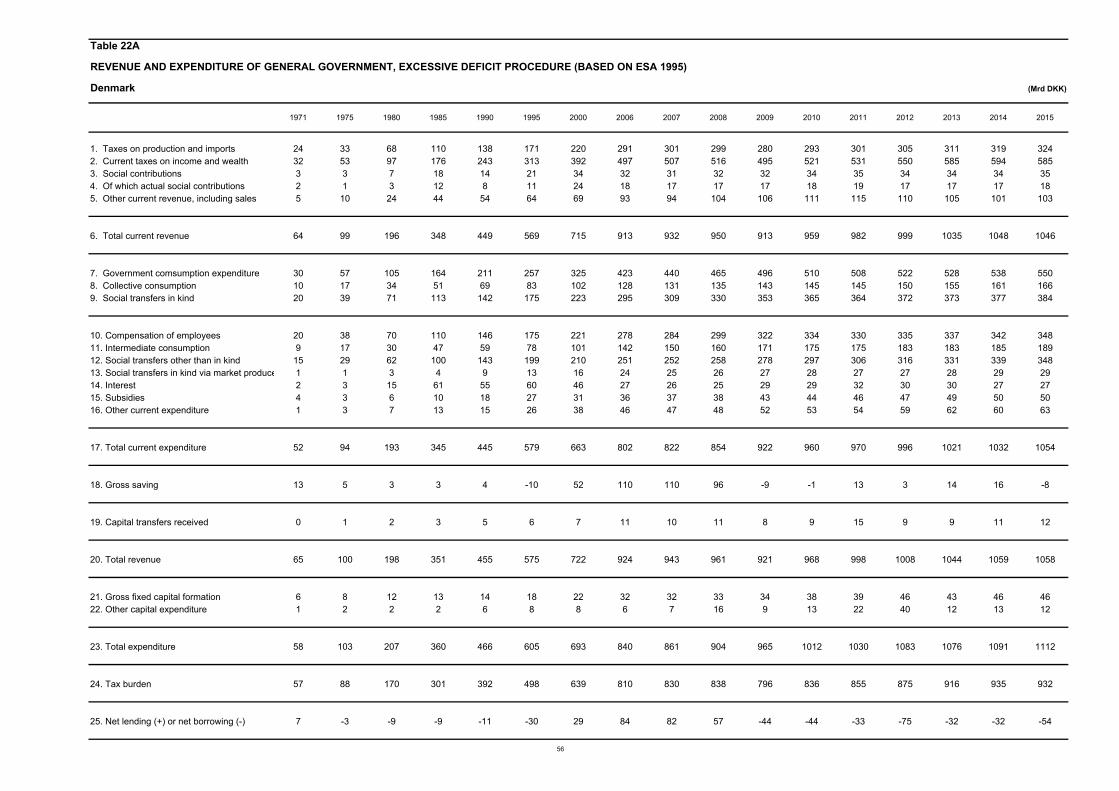
Table 22A
REVENUE AND EXPENDITURE OF GENERAL GOVERNMENT, EXCESSIVE DEFICIT PROCEDURE (BASED ON ESA 1995)
Denmark (Mrd DKK)
1971 1975 1980 1985 1990 1995 2000 2006 2007 2008 2009 2010 2011 2012 2013 2014 2015
1. Taxes on production and imports 24 33 68 110 138 171 220 291 301 299 280 293 301 305 311 319 3242. Current taxes on income and wealth 32 53 97 176 243 313 392 497 507 516 495 521 531 550 585 594 5853. Social contributions 3 3 7 18 14 21 34 32 31 32 32 34 35 34 34 34 354. Of which actual social contributions 2 1 3 12 8 11 24 18 17 17 17 18 19 17 17 17 185. Other current revenue, including sales 5 10 24 44 54 64 69 93 94 104 106 111 115 110 105 101 103
6. Total current revenue 64 99 196 348 449 569 715 913 932 950 913 959 982 999 1035 1048 1046
7. Government comsumption expenditure 30 57 105 164 211 257 325 423 440 465 496 510 508 522 528 538 5508. Collective consumption 10 17 34 51 69 83 102 128 131 135 143 145 145 150 155 161 1669. Social transfers in kind 20 39 71 113 142 175 223 295 309 330 353 365 364 372 373 377 384
10. Compensation of employees 20 38 70 110 146 175 221 278 284 299 322 334 330 335 337 342 34811. Intermediate consumption 9 17 30 47 59 78 101 142 150 160 171 175 175 183 183 185 18912. Social transfers other than in kind 15 29 62 100 143 199 210 251 252 258 278 297 306 316 331 339 34813. Social transfers in kind via market produce 1 1 3 4 9 13 16 24 25 26 27 28 27 27 28 29 2914. Interest 2 3 15 61 55 60 46 27 26 25 29 29 32 30 30 27 2715. Subsidies 4 3 6 10 18 27 31 36 37 38 43 44 46 47 49 50 5016. Other current expenditure 1 3 7 13 15 26 38 46 47 48 52 53 54 59 62 60 63
17. Total current expenditure 52 94 193 345 445 579 663 802 822 854 922 960 970 996 1021 1032 1054
18. Gross saving 13 5 3 3 4 -10 52 110 110 96 -9 -1 13 3 14 16 -8
19. Capital transfers received 0 1 2 3 5 6 7 11 10 11 8 9 15 9 9 11 12
20. Total revenue 65 100 198 351 455 575 722 924 943 961 921 968 998 1008 1044 1059 1058
21. Gross fixed capital formation 6 8 12 13 14 18 22 32 32 33 34 38 39 46 43 46 4622. Other capital expenditure 1 2 2 2 6 8 8 6 7 16 9 13 22 40 12 13 12
23. Total expenditure 58 103 207 360 466 605 693 840 861 904 965 1012 1030 1083 1076 1091 1112
24. Tax burden 57 88 170 301 392 498 639 810 830 838 796 836 855 875 916 935 932
25. Net lending (+) or net borrowing (-) 7 -3 -9 -9 -11 -30 29 84 82 57 -44 -44 -33 -75 -32 -32 -54
56

Table 22B
Contributions to the change in the general government gross debt ratio
Denmark
1995 2000 2001 2002 2003 2004 2005 2006 2007 2008 2009 2010 2011 2012 2013 2014 2015
1. Net borrowing (% of GDP) 1) 2.9 -2.3 -1.5 -0.4 -0.1 -2.1 -5.2 -5.2 -4.8 -3.2 2.7 2.5 1.8 4.1 1.7 1.7 2.72. Interest payments (% of GDP) 5.9 3.6 3.3 3.1 2.7 2.3 1.9 1.6 1.6 1.4 1.8 1.7 1.8 1.6 1.6 1.4 1.4
3. Implicit interest rate 2) 8.1 6.6 6.6 6.3 5.5 5.2 4.4 4.6 5.0 5.5 5.0 4.3 4.2 3.5 3.7 3.3 3.24. Nominal GDP growth rate 4.4 6.6 3.2 2.8 2.0 4.7 5.4 5.6 3.9 3.4 -5.0 5.8 1.7 1.8 1.7 3.1 3.5
(% of GDP)
Budgetary constraint based on thedeficit
5. Deficit (net borrowing) 1) 2.9 -2.3 -1.5 -0.4 -0.1 -2.1 -5.2 -5.2 -4.8 -3.2 2.7 2.5 1.8 4.1 1.7 1.7 2.76. Contribution of nominal GDP growth -3.2 -3.6 -1.6 -1.3 -1.0 -2.1 -2.3 -2.0 -1.2 -0.9 1.8 -2.2 -0.7 -0.8 -0.7 -1.3 -1.57. Stock-flow adjustment 3) -3.6 0.2 0.3 1.6 -1.2 2.1 0.1 1.5 1.1 10.4 2.9 1.8 2.5 -4.3 -2.1 -0.9 0.2
Budgetary constraint based on theprimary deficit
8. Primary deficit 4) -3.0 -5.9 -4.8 -3.4 -2.8 -4.4 -7.1 -6.8 -6.4 -4.7 0.9 0.8 0.1 2.5 0.1 0.2 1.39. Snow-ball effect 2.7 0.0 1.7 1.7 1.7 0.2 -0.4 -0.4 0.4 0.5 3.5 -0.6 1.0 0.8 0.9 0.1 -0.110. Stock-flow adjustment 3) -3.6 0.2 0.3 1.6 -1.2 2.1 0.1 1.5 1.1 10.4 2.9 1.8 2.5 -4.3 -2.1 -0.9 0.2
(% of GDP)
11. Change in gross debt 5) -3.9 -5.7 -2.8 -0.1 -2.3 -2.1 -7.4 -5.7 -4.9 6.2 7.3 2.1 3.6 -1.0 -1.1 -0.6 1.412. Level of gross debt (end of year) 72.6 52.4 49.6 49.5 47.2 45.1 37.8 32.1 27.1 33.4 40.7 42.7 46.4 45.4 44.3 43.7 45.1
1) Line 1 = line 5, a minus sign means a surplus.2) Actual interest payments as percentage of gross debt at end of t-1.3) Line 7 = line 10.4) Net borrowing excl. interest payments, line 8 = line 1 - line 2. A minus sign means a primary surplus.5) Line 11 = total of lines 5, 6 and 7 or 8, 9 and 10.
57
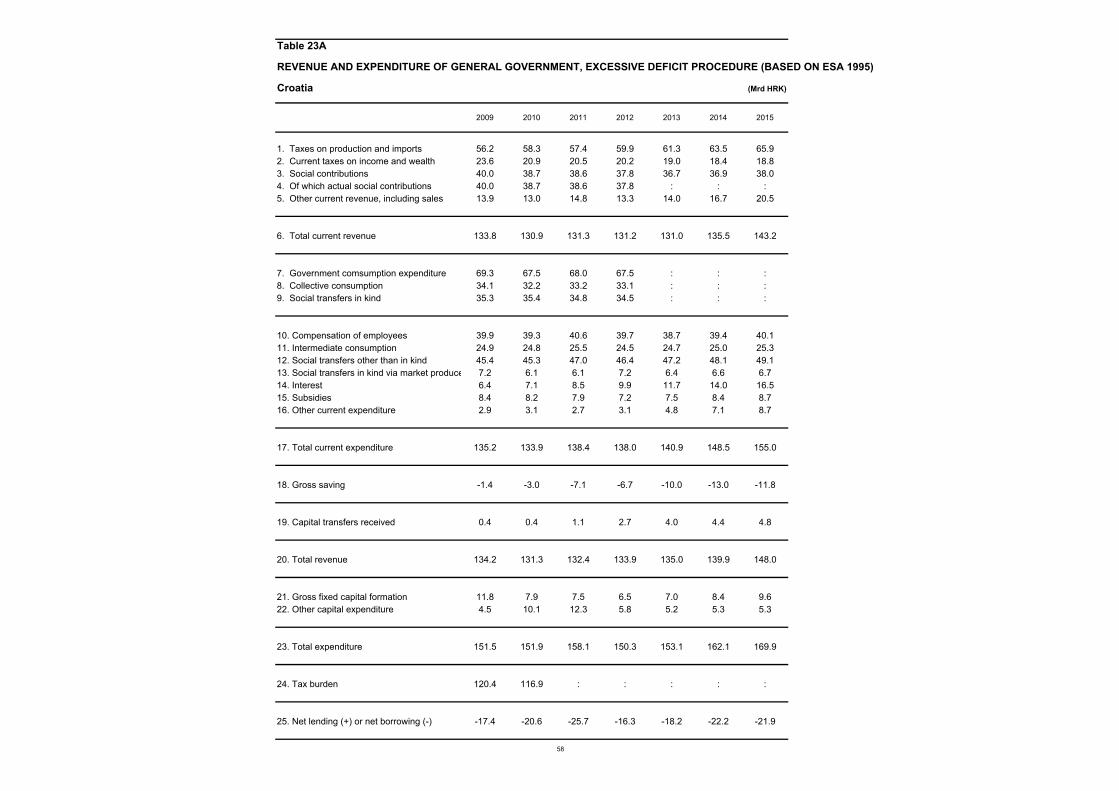
Table 23A
REVENUE AND EXPENDITURE OF GENERAL GOVERNMENT, EXCESSIVE DEFICIT PROCEDURE (BASED ON ESA 1995)
Croatia (Mrd HRK)
2009 2010 2011 2012 2013 2014 2015
1. Taxes on production and imports 56.2 58.3 57.4 59.9 61.3 63.5 65.92. Current taxes on income and wealth 23.6 20.9 20.5 20.2 19.0 18.4 18.83. Social contributions 40.0 38.7 38.6 37.8 36.7 36.9 38.04. Of which actual social contributions 40.0 38.7 38.6 37.8 : : :5. Other current revenue, including sales 13.9 13.0 14.8 13.3 14.0 16.7 20.5
6. Total current revenue 133.8 130.9 131.3 131.2 131.0 135.5 143.2
7. Government comsumption expenditure 69.3 67.5 68.0 67.5 : : :8. Collective consumption 34.1 32.2 33.2 33.1 : : :9. Social transfers in kind 35.3 35.4 34.8 34.5 : : :
10. Compensation of employees 39.9 39.3 40.6 39.7 38.7 39.4 40.111. Intermediate consumption 24.9 24.8 25.5 24.5 24.7 25.0 25.312. Social transfers other than in kind 45.4 45.3 47.0 46.4 47.2 48.1 49.113. Social transfers in kind via market produce 7.2 6.1 6.1 7.2 6.4 6.6 6.714. Interest 6.4 7.1 8.5 9.9 11.7 14.0 16.515. Subsidies 8.4 8.2 7.9 7.2 7.5 8.4 8.716. Other current expenditure 2.9 3.1 2.7 3.1 4.8 7.1 8.7
17. Total current expenditure 135.2 133.9 138.4 138.0 140.9 148.5 155.0
18. Gross saving -1.4 -3.0 -7.1 -6.7 -10.0 -13.0 -11.8
19. Capital transfers received 0.4 0.4 1.1 2.7 4.0 4.4 4.8
20. Total revenue 134.2 131.3 132.4 133.9 135.0 139.9 148.0
21. Gross fixed capital formation 11.8 7.9 7.5 6.5 7.0 8.4 9.622. Other capital expenditure 4.5 10.1 12.3 5.8 5.2 5.3 5.3
23. Total expenditure 151.5 151.9 158.1 150.3 153.1 162.1 169.9
24. Tax burden 120.4 116.9 : : : : :
25. Net lending (+) or net borrowing (-) -17.4 -20.6 -25.7 -16.3 -18.2 -22.2 -21.9
58

Table 23B
Contributions to the change in the general government gross debt ratio
Croatia
2009 2010 2011 2012 2013 2014 2015
1. Net borrowing (% of GDP) 1) 5.3 6.4 7.8 5.0 5.4 6.5 6.22. Interest payments (% of GDP) 2.0 2.2 2.6 3.0 3.5 4.1 4.7
3. Implicit interest rate 2) : 5.9 5.9 5.8 6.4 7.0 7.44. Nominal GDP growth rate -4.3 -1.5 2.0 0.0 1.1 2.4 3.1
(% of GDP)
Budgetary constraint based on thedeficit
5. Deficit (net borrowing) 1) 5.3 6.4 7.8 5.0 5.4 6.5 6.26. Contribution of nominal GDP growth : 0.6 -0.9 0.0 -0.6 -1.4 -2.07. Stock-flow adjustment 3) : 1.3 -0.2 -1.1 -0.7 0.0 0.0
Budgetary constraint based on theprimary deficit
8. Primary deficit 4) 3.3 4.2 5.2 1.9 1.9 2.4 1.59. Snow-ball effect : 2.8 1.7 3.0 2.9 2.7 2.710. Stock-flow adjustment 3) : 1.3 -0.2 -1.1 -0.7 0.0 0.0
(% of GDP)
11. Change in gross debt 5) : 8.2 6.7 3.9 4.1 5.1 4.212. Level of gross debt (end of year) 36.6 44.9 51.6 55.5 59.6 64.7 69.0
1) Line 1 = line 5, a minus sign means a surplus.2) Actual interest payments as percentage of gross debt at end of t-1.3) Line 7 = line 10.4) Net borrowing excl. interest payments, line 8 = line 1 - line 2. A minus sign means aprimary surplus.5) Line 11 = total of lines 5, 6 and 7 or 8, 9 and 10.
59
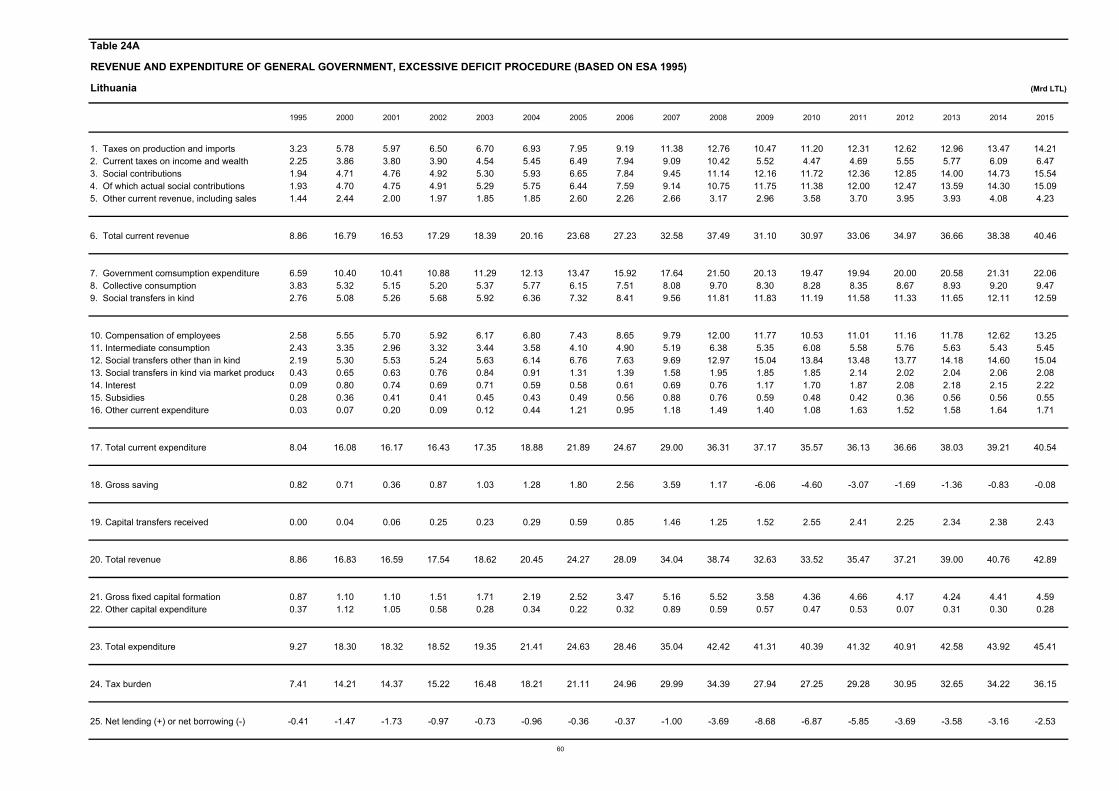
Table 24A
REVENUE AND EXPENDITURE OF GENERAL GOVERNMENT, EXCESSIVE DEFICIT PROCEDURE (BASED ON ESA 1995)
Lithuania (Mrd LTL)
1995 2000 2001 2002 2003 2004 2005 2006 2007 2008 2009 2010 2011 2012 2013 2014 2015
1. Taxes on production and imports 3.23 5.78 5.97 6.50 6.70 6.93 7.95 9.19 11.38 12.76 10.47 11.20 12.31 12.62 12.96 13.47 14.212. Current taxes on income and wealth 2.25 3.86 3.80 3.90 4.54 5.45 6.49 7.94 9.09 10.42 5.52 4.47 4.69 5.55 5.77 6.09 6.473. Social contributions 1.94 4.71 4.76 4.92 5.30 5.93 6.65 7.84 9.45 11.14 12.16 11.72 12.36 12.85 14.00 14.73 15.544. Of which actual social contributions 1.93 4.70 4.75 4.91 5.29 5.75 6.44 7.59 9.14 10.75 11.75 11.38 12.00 12.47 13.59 14.30 15.095. Other current revenue, including sales 1.44 2.44 2.00 1.97 1.85 1.85 2.60 2.26 2.66 3.17 2.96 3.58 3.70 3.95 3.93 4.08 4.23
6. Total current revenue 8.86 16.79 16.53 17.29 18.39 20.16 23.68 27.23 32.58 37.49 31.10 30.97 33.06 34.97 36.66 38.38 40.46
7. Government comsumption expenditure 6.59 10.40 10.41 10.88 11.29 12.13 13.47 15.92 17.64 21.50 20.13 19.47 19.94 20.00 20.58 21.31 22.068. Collective consumption 3.83 5.32 5.15 5.20 5.37 5.77 6.15 7.51 8.08 9.70 8.30 8.28 8.35 8.67 8.93 9.20 9.479. Social transfers in kind 2.76 5.08 5.26 5.68 5.92 6.36 7.32 8.41 9.56 11.81 11.83 11.19 11.58 11.33 11.65 12.11 12.59
10. Compensation of employees 2.58 5.55 5.70 5.92 6.17 6.80 7.43 8.65 9.79 12.00 11.77 10.53 11.01 11.16 11.78 12.62 13.2511. Intermediate consumption 2.43 3.35 2.96 3.32 3.44 3.58 4.10 4.90 5.19 6.38 5.35 6.08 5.58 5.76 5.63 5.43 5.4512. Social transfers other than in kind 2.19 5.30 5.53 5.24 5.63 6.14 6.76 7.63 9.69 12.97 15.04 13.84 13.48 13.77 14.18 14.60 15.0413. Social transfers in kind via market produce 0.43 0.65 0.63 0.76 0.84 0.91 1.31 1.39 1.58 1.95 1.85 1.85 2.14 2.02 2.04 2.06 2.0814. Interest 0.09 0.80 0.74 0.69 0.71 0.59 0.58 0.61 0.69 0.76 1.17 1.70 1.87 2.08 2.18 2.15 2.2215. Subsidies 0.28 0.36 0.41 0.41 0.45 0.43 0.49 0.56 0.88 0.76 0.59 0.48 0.42 0.36 0.56 0.56 0.5516. Other current expenditure 0.03 0.07 0.20 0.09 0.12 0.44 1.21 0.95 1.18 1.49 1.40 1.08 1.63 1.52 1.58 1.64 1.71
17. Total current expenditure 8.04 16.08 16.17 16.43 17.35 18.88 21.89 24.67 29.00 36.31 37.17 35.57 36.13 36.66 38.03 39.21 40.54
18. Gross saving 0.82 0.71 0.36 0.87 1.03 1.28 1.80 2.56 3.59 1.17 -6.06 -4.60 -3.07 -1.69 -1.36 -0.83 -0.08
19. Capital transfers received 0.00 0.04 0.06 0.25 0.23 0.29 0.59 0.85 1.46 1.25 1.52 2.55 2.41 2.25 2.34 2.38 2.43
20. Total revenue 8.86 16.83 16.59 17.54 18.62 20.45 24.27 28.09 34.04 38.74 32.63 33.52 35.47 37.21 39.00 40.76 42.89
21. Gross fixed capital formation 0.87 1.10 1.10 1.51 1.71 2.19 2.52 3.47 5.16 5.52 3.58 4.36 4.66 4.17 4.24 4.41 4.5922. Other capital expenditure 0.37 1.12 1.05 0.58 0.28 0.34 0.22 0.32 0.89 0.59 0.57 0.47 0.53 0.07 0.31 0.30 0.28
23. Total expenditure 9.27 18.30 18.32 18.52 19.35 21.41 24.63 28.46 35.04 42.42 41.31 40.39 41.32 40.91 42.58 43.92 45.41
24. Tax burden 7.41 14.21 14.37 15.22 16.48 18.21 21.11 24.96 29.99 34.39 27.94 27.25 29.28 30.95 32.65 34.22 36.15
25. Net lending (+) or net borrowing (-) -0.41 -1.47 -1.73 -0.97 -0.73 -0.96 -0.36 -0.37 -1.00 -3.69 -8.68 -6.87 -5.85 -3.69 -3.58 -3.16 -2.53
60

Table 24B
Contributions to the change in the general government gross debt ratio
Lithuania
1999 2000 2001 2002 2003 2004 2005 2006 2007 2008 2009 2010 2011 2012 2013 2014 2015
1. Net borrowing (% of GDP) 1) 2.8 3.2 3.5 1.9 1.3 1.5 0.5 0.4 1.0 3.3 9.4 7.2 5.5 3.2 3.0 2.5 1.92. Interest payments (% of GDP) 1.5 1.7 1.5 1.3 1.2 0.9 0.8 0.7 0.7 0.7 1.3 1.8 1.8 1.8 1.8 1.7 1.6
3. Implicit interest rate 2) 8.7 8.0 6.8 6.1 6.1 4.9 4.8 4.6 4.6 4.5 6.7 6.3 5.2 5.1 4.7 4.5 4.34. Nominal GDP growth rate -2.5 4.8 6.3 7.1 9.3 10.1 14.9 15.0 19.2 12.8 -17.8 4.0 11.7 6.4 5.4 6.1 6.8
(% of GDP)
Budgetary constraint based on thedeficit
5. Deficit (net borrowing) 1) 2.8 3.2 3.5 1.9 1.3 1.5 0.5 0.4 1.0 3.3 9.4 7.2 5.5 3.2 3.0 2.5 1.96. Contribution of nominal GDP growth 0.4 -1.0 -1.4 -1.5 -1.9 -1.9 -2.5 -2.4 -2.9 -1.9 3.4 -1.1 -4.0 -2.3 -2.1 -2.3 -2.67. Stock-flow adjustment 3) 2.9 -1.3 -2.8 -1.1 -0.5 -1.3 1.0 1.6 0.8 -2.7 1.0 2.4 -0.9 1.2 -1.5 0.1 0.1
Budgetary constraint based on theprimary deficit
8. Primary deficit 4) 1.4 1.5 2.0 0.6 0.0 0.6 -0.3 -0.3 0.3 2.6 8.2 5.4 3.7 1.4 1.2 0.8 0.29. Snow-ball effect 1.9 0.7 0.1 -0.2 -0.7 -1.0 -1.7 -1.7 -2.2 -1.2 4.6 0.7 -2.2 -0.5 -0.2 -0.6 -0.910. Stock-flow adjustment 3) 2.9 -1.3 -2.8 -1.1 -0.5 -1.3 1.0 1.6 0.8 -2.7 1.0 2.4 -0.9 1.2 -1.5 0.1 0.1
(% of GDP)
11. Change in gross debt 5) 6.2 0.9 -0.6 -0.8 -1.2 -1.7 -1.0 -0.4 -1.1 -1.3 13.8 8.4 0.6 2.2 -0.6 0.3 -0.612. Level of gross debt (end of year) 22.7 23.6 23.0 22.2 21.0 19.3 18.3 17.9 16.8 15.5 29.3 37.8 38.3 40.5 39.9 40.2 39.6
1) Line 1 = line 5, a minus sign means a surplus.2) Actual interest payments as percentage of gross debt at end of t-1.3) Line 7 = line 10.4) Net borrowing excl. interest payments, line 8 = line 1 - line 2. A minus sign means a primary surplus.5) Line 11 = total of lines 5, 6 and 7 or 8, 9 and 10.
61
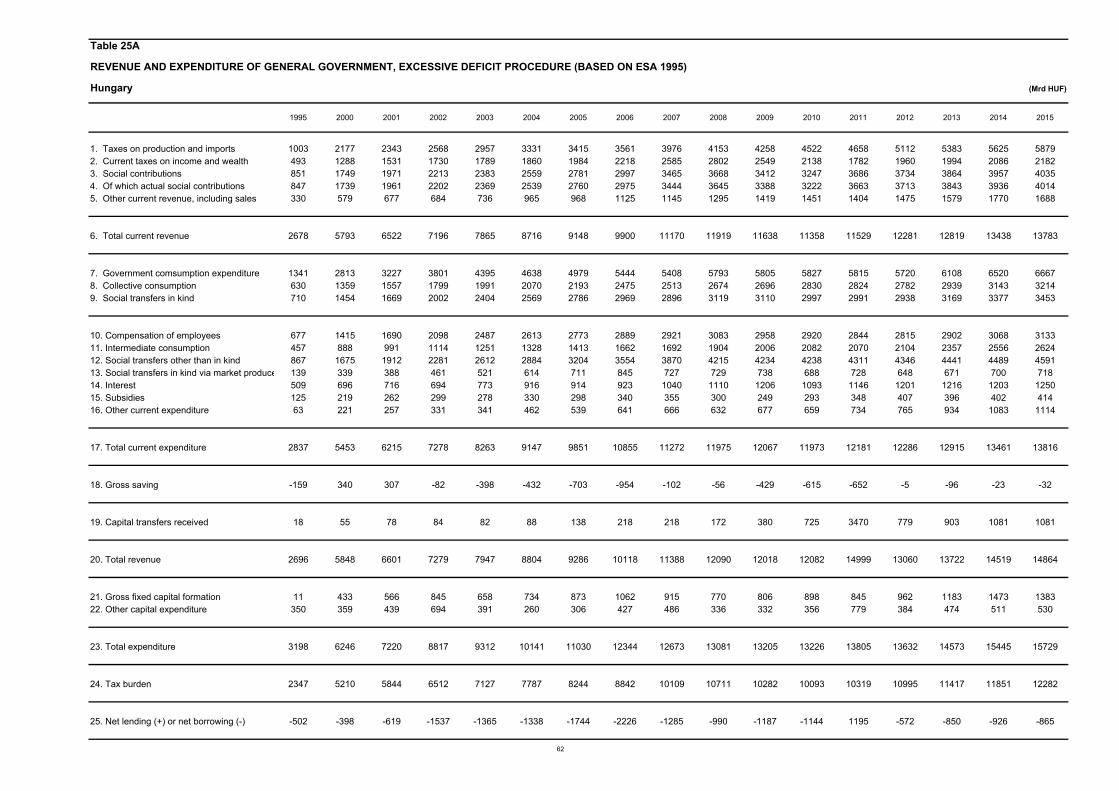
Table 25A
REVENUE AND EXPENDITURE OF GENERAL GOVERNMENT, EXCESSIVE DEFICIT PROCEDURE (BASED ON ESA 1995)
Hungary (Mrd HUF)
1995 2000 2001 2002 2003 2004 2005 2006 2007 2008 2009 2010 2011 2012 2013 2014 2015
1. Taxes on production and imports 1003 2177 2343 2568 2957 3331 3415 3561 3976 4153 4258 4522 4658 5112 5383 5625 58792. Current taxes on income and wealth 493 1288 1531 1730 1789 1860 1984 2218 2585 2802 2549 2138 1782 1960 1994 2086 21823. Social contributions 851 1749 1971 2213 2383 2559 2781 2997 3465 3668 3412 3247 3686 3734 3864 3957 40354. Of which actual social contributions 847 1739 1961 2202 2369 2539 2760 2975 3444 3645 3388 3222 3663 3713 3843 3936 40145. Other current revenue, including sales 330 579 677 684 736 965 968 1125 1145 1295 1419 1451 1404 1475 1579 1770 1688
6. Total current revenue 2678 5793 6522 7196 7865 8716 9148 9900 11170 11919 11638 11358 11529 12281 12819 13438 13783
7. Government comsumption expenditure 1341 2813 3227 3801 4395 4638 4979 5444 5408 5793 5805 5827 5815 5720 6108 6520 66678. Collective consumption 630 1359 1557 1799 1991 2070 2193 2475 2513 2674 2696 2830 2824 2782 2939 3143 32149. Social transfers in kind 710 1454 1669 2002 2404 2569 2786 2969 2896 3119 3110 2997 2991 2938 3169 3377 3453
10. Compensation of employees 677 1415 1690 2098 2487 2613 2773 2889 2921 3083 2958 2920 2844 2815 2902 3068 313311. Intermediate consumption 457 888 991 1114 1251 1328 1413 1662 1692 1904 2006 2082 2070 2104 2357 2556 262412. Social transfers other than in kind 867 1675 1912 2281 2612 2884 3204 3554 3870 4215 4234 4238 4311 4346 4441 4489 459113. Social transfers in kind via market produce 139 339 388 461 521 614 711 845 727 729 738 688 728 648 671 700 71814. Interest 509 696 716 694 773 916 914 923 1040 1110 1206 1093 1146 1201 1216 1203 125015. Subsidies 125 219 262 299 278 330 298 340 355 300 249 293 348 407 396 402 41416. Other current expenditure 63 221 257 331 341 462 539 641 666 632 677 659 734 765 934 1083 1114
17. Total current expenditure 2837 5453 6215 7278 8263 9147 9851 10855 11272 11975 12067 11973 12181 12286 12915 13461 13816
18. Gross saving -159 340 307 -82 -398 -432 -703 -954 -102 -56 -429 -615 -652 -5 -96 -23 -32
19. Capital transfers received 18 55 78 84 82 88 138 218 218 172 380 725 3470 779 903 1081 1081
20. Total revenue 2696 5848 6601 7279 7947 8804 9286 10118 11388 12090 12018 12082 14999 13060 13722 14519 14864
21. Gross fixed capital formation 11 433 566 845 658 734 873 1062 915 770 806 898 845 962 1183 1473 138322. Other capital expenditure 350 359 439 694 391 260 306 427 486 336 332 356 779 384 474 511 530
23. Total expenditure 3198 6246 7220 8817 9312 10141 11030 12344 12673 13081 13205 13226 13805 13632 14573 15445 15729
24. Tax burden 2347 5210 5844 6512 7127 7787 8244 8842 10109 10711 10282 10093 10319 10995 11417 11851 12282
25. Net lending (+) or net borrowing (-) -502 -398 -619 -1537 -1365 -1338 -1744 -2226 -1285 -990 -1187 -1144 1195 -572 -850 -926 -865
62

Table 25B
Contributions to the change in the general government gross debt ratio
Hungary
1999 2000 2001 2002 2003 2004 2005 2006 2007 2008 2009 2010 2011 2012 2013 2014 2015
1. Net borrowing (% of GDP) 1) 5.5 3.0 4.1 9.0 7.3 6.5 7.9 9.4 5.1 3.7 4.6 4.3 -4.3 2.0 2.9 3.0 2.72. Interest payments (% of GDP) 7.1 5.3 4.7 4.1 4.1 4.4 4.1 3.9 4.2 4.2 4.7 4.1 4.1 4.3 4.2 4.0 3.9
3. Implicit interest rate 2) 12.9 10.0 9.8 8.7 8.1 8.3 7.4 6.8 6.7 6.6 6.2 5.3 5.3 5.3 5.4 5.1 5.24. Nominal GDP growth rate 11.3 14.4 15.4 13.3 9.5 10.3 6.5 7.5 5.6 6.2 -3.5 3.5 4.2 1.5 3.6 4.5 4.4
(% of GDP)
Budgetary constraint based on thedeficit
5. Deficit (net borrowing) 1) 5.5 3.0 4.1 9.0 7.3 6.5 7.9 9.4 5.1 3.7 4.6 4.3 -4.3 2.0 2.9 3.0 2.76. Contribution of nominal GDP growth -6.2 -7.6 -7.5 -6.2 -4.8 -5.5 -3.7 -4.3 -3.5 -3.9 2.6 -2.7 -3.3 -1.2 -2.8 -3.5 -3.37. Stock-flow adjustment 3) 0.7 -0.2 0.0 0.5 0.2 -0.1 -2.1 -0.9 -0.5 6.1 -0.4 0.7 7.6 -3.1 0.7 -0.4 0.2
Budgetary constraint based on theprimary deficit
8. Primary deficit 4) -1.6 -2.3 -0.6 4.9 3.2 2.0 3.8 5.5 1.0 -0.5 -0.1 0.2 -8.5 -2.2 -1.3 -0.9 -1.29. Snow-ball effect 0.9 -2.3 -2.7 -2.1 -0.7 -1.0 0.5 -0.4 0.7 0.3 7.3 1.5 0.8 3.1 1.4 0.5 0.610. Stock-flow adjustment 3) 0.7 -0.2 0.0 0.5 0.2 -0.1 -2.1 -0.9 -0.5 6.1 -0.4 0.7 7.6 -3.1 0.7 -0.4 0.2
(% of GDP)
11. Change in gross debt 5) 0.0 -4.8 -3.4 3.3 2.7 0.9 2.2 4.2 1.1 5.9 6.8 2.3 0.0 -2.3 0.9 -0.8 -0.412. Level of gross debt (end of year) 60.8 56.1 52.7 55.9 58.6 59.5 61.7 65.9 67.0 73.0 79.8 82.2 82.1 79.8 80.7 79.9 79.4
1) Line 1 = line 5, a minus sign means a surplus.2) Actual interest payments as percentage of gross debt at end of t-1.3) Line 7 = line 10.4) Net borrowing excl. interest payments, line 8 = line 1 - line 2. A minus sign means a primary surplus.5) Line 11 = total of lines 5, 6 and 7 or 8, 9 and 10.
63

Table 26A
REVENUE AND EXPENDITURE OF GENERAL GOVERNMENT, EXCESSIVE DEFICIT PROCEDURE (BASED ON ESA 1995)
Poland (Mrd PLN)
1995 2000 2001 2002 2003 2004 2005 2006 2007 2008 2009 2010 2011 2012 2013 2014 2015
1. Taxes on production and imports 47.9 94.0 97.4 106.6 111.0 119.0 133.7 150.5 166.3 180.6 172.7 192.3 210.2 205.5 198.8 206.6 215.12. Current taxes on income and wealth 39.5 53.3 49.1 54.6 54.5 59.9 68.7 79.9 100.6 109.7 100.0 98.3 107.2 115.2 112.5 119.7 127.83. Social contributions 38.2 96.3 104.4 104.6 107.9 114.0 121.1 129.1 140.6 144.6 152.4 157.0 174.6 195.7 199.7 209.7 222.54. Of which actual social contributions 38.2 96.3 104.4 104.6 107.9 114.0 121.1 129.1 140.6 144.6 152.4 157.0 174.6 195.7 199.7 209.7 222.55. Other current revenue, including sales 20.2 40.0 49.5 51.8 50.7 50.7 57.9 61.3 60.9 63.6 67.1 65.9 67.7 74.1 71.7 69.4 72.2
6. Total current revenue 145.8 283.6 300.5 317.7 324.1 343.6 381.4 420.8 468.4 498.5 492.2 513.6 559.7 590.5 582.7 605.4 637.5
7. Government comsumption expenditure 63.0 129.8 139.5 144.7 152.8 162.7 177.8 193.7 211.6 236.2 248.9 268.4 274.8 284.4 292.1 303.6 317.28. Collective consumption 24.8 54.0 58.0 61.9 65.6 71.4 78.4 85.6 93.6 102.7 105.6 114.9 116.5 119.9 123.9 129.9 136.19. Social transfers in kind 38.2 75.8 81.5 82.7 87.2 91.3 99.3 108.1 118.0 133.4 143.3 153.5 158.2 164.5 168.1 173.7 181.1
10. Compensation of employees 35.9 75.1 83.3 87.0 90.0 93.0 98.8 104.1 113.2 127.6 138.6 144.3 148.6 150.6 153.6 157.9 163.111. Intermediate consumption 21.6 44.3 47.2 49.1 50.9 53.5 57.3 63.6 70.6 78.9 76.5 88.3 87.1 90.8 92.9 95.8 100.512. Social transfers other than in kind 57.2 119.2 132.0 137.3 142.8 148.3 153.9 161.3 166.9 179.1 197.8 210.1 215.5 226.4 238.4 248.0 258.913. Social transfers in kind via market produce 6.1 14.4 14.8 15.4 16.8 19.3 18.6 22.6 23.7 26.5 29.3 31.1 32.6 35.7 37.0 39.6 41.614. Interest 19.4 22.5 24.3 23.4 25.1 25.5 27.5 28.1 27.2 28.3 35.5 38.1 40.9 45.3 43.5 37.3 39.415. Subsidies 3.2 3.4 3.3 2.9 2.8 5.7 5.6 6.1 7.2 7.9 7.2 6.7 7.0 5.9 6.1 6.3 6.516. Other current expenditure 4.0 5.1 4.9 10.3 10.7 12.6 21.9 28.0 30.6 33.0 31.6 34.7 36.3 40.2 41.2 42.5 43.8
17. Total current expenditure 147.4 284.0 309.9 325.3 339.0 357.9 383.7 413.9 439.4 481.3 516.3 553.3 568.0 594.9 612.7 627.5 653.9
18. Gross saving -1.6 -0.4 -9.4 -7.7 -14.9 -14.3 -2.3 6.9 29.1 17.2 -24.1 -39.7 -8.4 -4.4 -30.0 -22.1 -16.3
19. Capital transfers received 0.2 -0.4 -0.1 -0.1 0.4 0.7 5.7 5.7 5.9 5.9 7.6 18.3 26.8 21.0 15.8 165.4 21.9
20. Total revenue 146.0 283.3 300.4 317.5 324.5 344.3 387.1 426.5 474.3 504.4 499.8 531.8 586.5 611.5 598.5 770.8 659.4
21. Gross fixed capital formation 11.1 17.8 26.5 27.8 28.1 31.0 33.5 41.4 49.0 58.6 70.1 79.7 87.3 73.1 59.1 59.8 59.322. Other capital expenditure 2.5 4.0 5.1 4.7 9.6 5.1 10.0 9.7 8.0 11.4 13.8 10.7 7.5 5.9 5.8 5.8 5.8
23. Total expenditure 160.9 305.8 341.5 357.9 376.7 394.1 427.2 465.0 496.4 551.4 600.2 643.6 662.8 673.9 677.6 693.1 719.0
24. Tax burden 125.6 243.8 250.1 264.9 272.5 293.8 325.0 361.3 409.7 437.5 427.3 449.9 494.2 518.6 515.0 540.1 569.6
25. Net lending (+) or net borrowing (-) -14.9 -22.5 -41.1 -40.3 -52.2 -49.8 -40.1 -38.5 -22.1 -47.0 -100.4 -111.8 -76.4 -62.4 -79.1 77.6 -59.6
64

Table 26B
Contributions to the change in the general government gross debt ratio
Poland
1999 2000 2001 2002 2003 2004 2005 2006 2007 2008 2009 2010 2011 2012 2013 2014 2015
1. Net borrowing (% of GDP) 1) 2.3 3.0 5.3 5.0 6.2 5.4 4.1 3.6 1.9 3.7 7.5 7.9 5.0 3.9 4.8 -4.6 3.32. Interest payments (% of GDP) 3.0 3.0 3.1 2.9 3.0 2.8 2.8 2.7 2.3 2.2 2.6 2.7 2.7 2.8 2.7 2.2 2.2
3. Implicit interest rate 2) 8.4 8.5 8.9 8.0 7.4 6.4 6.5 6.1 5.4 5.4 5.9 5.6 5.3 5.3 4.9 3.9 4.54. Nominal GDP growth rate 10.8 11.8 4.7 3.7 4.3 9.7 6.4 7.8 11.0 8.4 5.4 5.4 7.9 4.4 2.3 4.4 4.8
(% of GDP)
Budgetary constraint based on thedeficit
5. Deficit (net borrowing) 1) 2.3 3.0 5.3 5.0 6.2 5.4 4.1 3.6 1.9 3.7 7.5 7.9 5.0 3.9 4.8 -4.6 3.36. Contribution of nominal GDP growth -3.8 -4.2 -1.7 -1.3 -1.7 -4.1 -2.7 -3.4 -4.7 -3.5 -2.4 -2.6 -4.0 -2.4 -1.2 -2.4 -2.47. Stock-flow adjustment 3) 2.2 -1.6 -2.8 1.0 0.4 -2.6 0.1 0.4 0.1 1.9 -1.2 -1.3 0.4 -2.2 -1.0 -0.2 0.5
Budgetary constraint based on theprimary deficit
8. Primary deficit 4) -0.6 0.0 2.1 2.1 3.2 2.6 1.3 1.0 -0.4 1.5 4.8 5.2 2.3 1.1 2.2 -6.7 1.19. Snow-ball effect -0.8 -1.2 1.5 1.5 1.2 -1.4 0.1 -0.8 -2.4 -1.3 0.2 0.1 -1.3 0.5 1.4 -0.2 -0.210. Stock-flow adjustment 3) 2.2 -1.6 -2.8 1.0 0.4 -2.6 0.1 0.4 0.1 1.9 -1.2 -1.3 0.4 -2.2 -1.0 -0.2 0.5
(% of GDP)
11. Change in gross debt 5) 0.7 -2.8 0.8 4.6 4.9 -1.4 1.4 0.6 -2.8 2.1 3.8 4.0 1.3 -0.6 2.6 -7.2 1.512. Level of gross debt (end of year) 39.6 36.8 37.6 42.2 47.1 45.7 47.1 47.7 45.0 47.1 50.9 54.9 56.2 55.6 58.2 51.0 52.5
1) Line 1 = line 5, a minus sign means a surplus.2) Actual interest payments as percentage of gross debt at end of t-1.3) Line 7 = line 10.4) Net borrowing excl. interest payments, line 8 = line 1 - line 2. A minus sign means a primary surplus.5) Line 11 = total of lines 5, 6 and 7 or 8, 9 and 10.
65
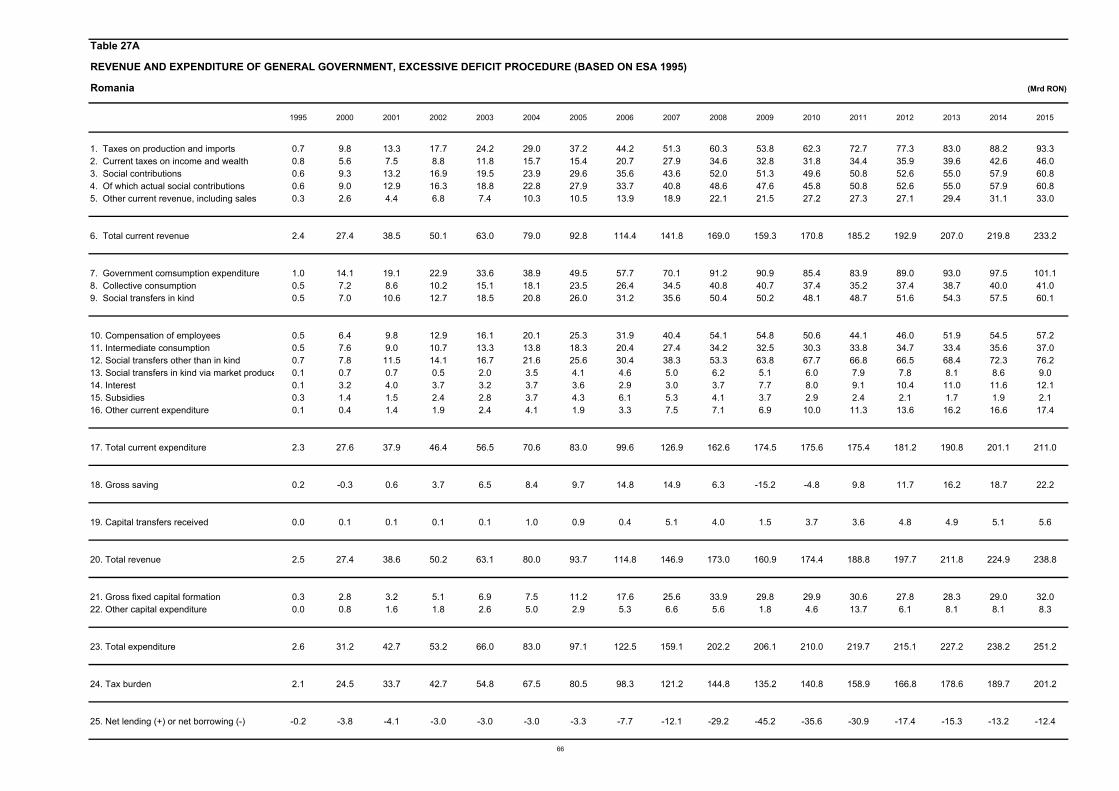
Table 27A
REVENUE AND EXPENDITURE OF GENERAL GOVERNMENT, EXCESSIVE DEFICIT PROCEDURE (BASED ON ESA 1995)
Romania (Mrd RON)
1995 2000 2001 2002 2003 2004 2005 2006 2007 2008 2009 2010 2011 2012 2013 2014 2015
1. Taxes on production and imports 0.7 9.8 13.3 17.7 24.2 29.0 37.2 44.2 51.3 60.3 53.8 62.3 72.7 77.3 83.0 88.2 93.32. Current taxes on income and wealth 0.8 5.6 7.5 8.8 11.8 15.7 15.4 20.7 27.9 34.6 32.8 31.8 34.4 35.9 39.6 42.6 46.03. Social contributions 0.6 9.3 13.2 16.9 19.5 23.9 29.6 35.6 43.6 52.0 51.3 49.6 50.8 52.6 55.0 57.9 60.84. Of which actual social contributions 0.6 9.0 12.9 16.3 18.8 22.8 27.9 33.7 40.8 48.6 47.6 45.8 50.8 52.6 55.0 57.9 60.85. Other current revenue, including sales 0.3 2.6 4.4 6.8 7.4 10.3 10.5 13.9 18.9 22.1 21.5 27.2 27.3 27.1 29.4 31.1 33.0
6. Total current revenue 2.4 27.4 38.5 50.1 63.0 79.0 92.8 114.4 141.8 169.0 159.3 170.8 185.2 192.9 207.0 219.8 233.2
7. Government comsumption expenditure 1.0 14.1 19.1 22.9 33.6 38.9 49.5 57.7 70.1 91.2 90.9 85.4 83.9 89.0 93.0 97.5 101.18. Collective consumption 0.5 7.2 8.6 10.2 15.1 18.1 23.5 26.4 34.5 40.8 40.7 37.4 35.2 37.4 38.7 40.0 41.09. Social transfers in kind 0.5 7.0 10.6 12.7 18.5 20.8 26.0 31.2 35.6 50.4 50.2 48.1 48.7 51.6 54.3 57.5 60.1
10. Compensation of employees 0.5 6.4 9.8 12.9 16.1 20.1 25.3 31.9 40.4 54.1 54.8 50.6 44.1 46.0 51.9 54.5 57.211. Intermediate consumption 0.5 7.6 9.0 10.7 13.3 13.8 18.3 20.4 27.4 34.2 32.5 30.3 33.8 34.7 33.4 35.6 37.012. Social transfers other than in kind 0.7 7.8 11.5 14.1 16.7 21.6 25.6 30.4 38.3 53.3 63.8 67.7 66.8 66.5 68.4 72.3 76.213. Social transfers in kind via market produce 0.1 0.7 0.7 0.5 2.0 3.5 4.1 4.6 5.0 6.2 5.1 6.0 7.9 7.8 8.1 8.6 9.014. Interest 0.1 3.2 4.0 3.7 3.2 3.7 3.6 2.9 3.0 3.7 7.7 8.0 9.1 10.4 11.0 11.6 12.115. Subsidies 0.3 1.4 1.5 2.4 2.8 3.7 4.3 6.1 5.3 4.1 3.7 2.9 2.4 2.1 1.7 1.9 2.116. Other current expenditure 0.1 0.4 1.4 1.9 2.4 4.1 1.9 3.3 7.5 7.1 6.9 10.0 11.3 13.6 16.2 16.6 17.4
17. Total current expenditure 2.3 27.6 37.9 46.4 56.5 70.6 83.0 99.6 126.9 162.6 174.5 175.6 175.4 181.2 190.8 201.1 211.0
18. Gross saving 0.2 -0.3 0.6 3.7 6.5 8.4 9.7 14.8 14.9 6.3 -15.2 -4.8 9.8 11.7 16.2 18.7 22.2
19. Capital transfers received 0.0 0.1 0.1 0.1 0.1 1.0 0.9 0.4 5.1 4.0 1.5 3.7 3.6 4.8 4.9 5.1 5.6
20. Total revenue 2.5 27.4 38.6 50.2 63.1 80.0 93.7 114.8 146.9 173.0 160.9 174.4 188.8 197.7 211.8 224.9 238.8
21. Gross fixed capital formation 0.3 2.8 3.2 5.1 6.9 7.5 11.2 17.6 25.6 33.9 29.8 29.9 30.6 27.8 28.3 29.0 32.022. Other capital expenditure 0.0 0.8 1.6 1.8 2.6 5.0 2.9 5.3 6.6 5.6 1.8 4.6 13.7 6.1 8.1 8.1 8.3
23. Total expenditure 2.6 31.2 42.7 53.2 66.0 83.0 97.1 122.5 159.1 202.2 206.1 210.0 219.7 215.1 227.2 238.2 251.2
24. Tax burden 2.1 24.5 33.7 42.7 54.8 67.5 80.5 98.3 121.2 144.8 135.2 140.8 158.9 166.8 178.6 189.7 201.2
25. Net lending (+) or net borrowing (-) -0.2 -3.8 -4.1 -3.0 -3.0 -3.0 -3.3 -7.7 -12.1 -29.2 -45.2 -35.6 -30.9 -17.4 -15.3 -13.2 -12.4
66

Table 27B
Contributions to the change in the general government gross debt ratio
Romania
1999 2000 2001 2002 2003 2004 2005 2006 2007 2008 2009 2010 2011 2012 2013 2014 2015
1. Net borrowing (% of GDP) 1) 4.4 4.7 3.5 2.0 1.5 1.2 1.2 2.2 2.9 5.7 9.0 6.8 5.6 3.0 2.5 2.0 1.82. Interest payments (% of GDP) 5.0 3.9 3.4 2.5 1.6 1.5 1.2 0.8 0.7 0.7 1.5 1.5 1.6 1.8 1.8 1.8 1.8
3. Implicit interest rate 2) 44.8 26.7 22.2 12.3 8.4 8.6 7.7 6.3 7.0 6.9 11.1 6.8 5.7 5.4 5.0 4.8 4.74. Nominal GDP growth rate 48.9 46.7 45.6 28.9 29.9 25.3 16.8 19.3 20.7 23.7 -2.6 4.5 6.3 5.5 6.5 5.2 5.1
(% of GDP)
Budgetary constraint based on thedeficit
5. Deficit (net borrowing) 1) 4.4 4.7 3.5 2.0 1.5 1.2 1.2 2.2 2.9 5.7 9.0 6.8 5.6 3.0 2.5 2.0 1.86. Contribution of nominal GDP growth -5.5 -6.9 -7.0 -5.8 -5.7 -4.3 -2.7 -2.6 -2.1 -2.5 0.4 -1.0 -1.8 -1.8 -2.3 -1.9 -1.97. Stock-flow adjustment 3) 6.0 3.0 6.8 2.9 0.9 0.4 -1.4 -3.1 -0.3 -2.6 0.8 1.1 0.5 2.1 0.5 0.4 0.5
Budgetary constraint based on theprimary deficit
8. Primary deficit 4) -0.6 0.7 0.1 -0.5 -0.1 -0.3 -0.1 1.4 2.2 5.0 7.5 5.3 3.9 1.2 0.7 0.3 0.09. Snow-ball effect -0.5 -3.0 -3.6 -3.3 -4.1 -2.9 -1.5 -1.7 -1.4 -1.7 1.9 0.5 -0.2 0.0 -0.5 -0.1 -0.110. Stock-flow adjustment 3) 6.0 3.0 6.8 2.9 0.9 0.4 -1.4 -3.1 -0.3 -2.6 0.8 1.1 0.5 2.1 0.5 0.4 0.5
(% of GDP)
11. Change in gross debt 5) 4.9 0.8 3.3 -0.9 -3.4 -2.8 -3.0 -3.4 0.4 0.6 10.2 6.8 4.2 3.2 0.6 0.6 0.412. Level of gross debt (end of year) 21.7 22.5 25.7 24.9 21.5 18.7 15.8 12.4 12.8 13.4 23.6 30.5 34.7 37.9 38.5 39.1 39.5
1) Line 1 = line 5, a minus sign means a surplus.2) Actual interest payments as percentage of gross debt at end of t-1.3) Line 7 = line 10.4) Net borrowing excl. interest payments, line 8 = line 1 - line 2. A minus sign means a primary surplus.5) Line 11 = total of lines 5, 6 and 7 or 8, 9 and 10.
67
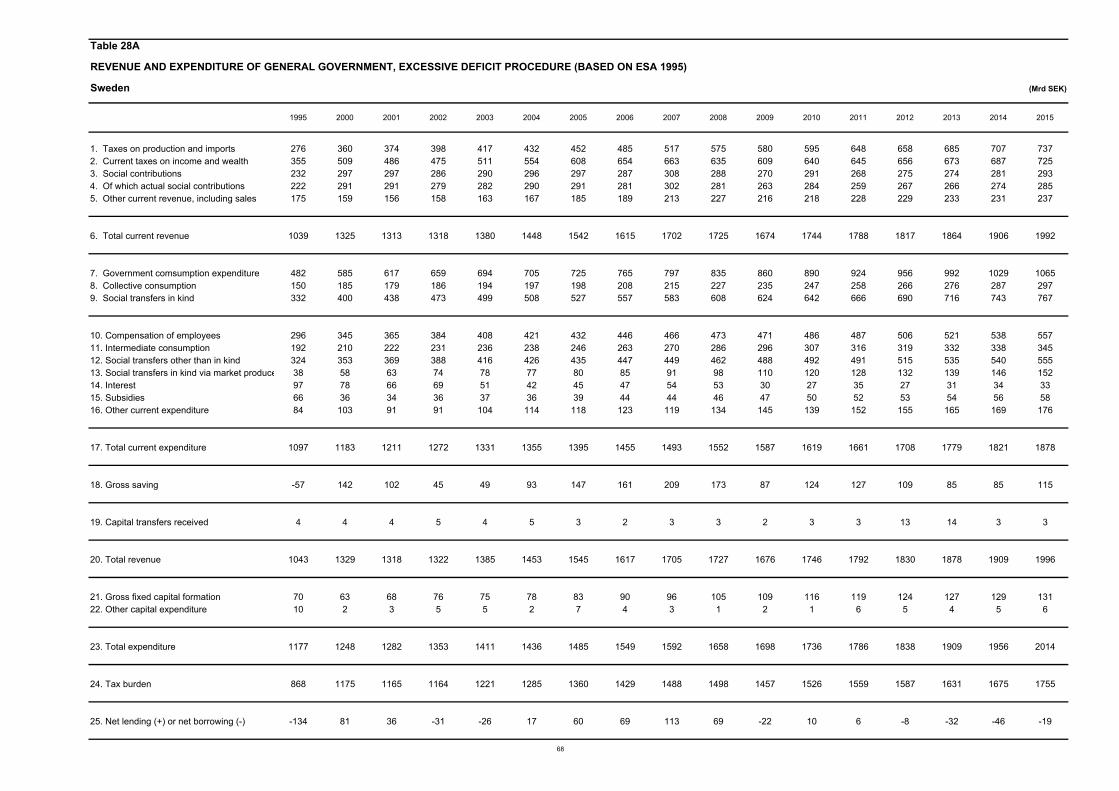
Table 28A
REVENUE AND EXPENDITURE OF GENERAL GOVERNMENT, EXCESSIVE DEFICIT PROCEDURE (BASED ON ESA 1995)
Sweden (Mrd SEK)
1995 2000 2001 2002 2003 2004 2005 2006 2007 2008 2009 2010 2011 2012 2013 2014 2015
1. Taxes on production and imports 276 360 374 398 417 432 452 485 517 575 580 595 648 658 685 707 7372. Current taxes on income and wealth 355 509 486 475 511 554 608 654 663 635 609 640 645 656 673 687 7253. Social contributions 232 297 297 286 290 296 297 287 308 288 270 291 268 275 274 281 2934. Of which actual social contributions 222 291 291 279 282 290 291 281 302 281 263 284 259 267 266 274 2855. Other current revenue, including sales 175 159 156 158 163 167 185 189 213 227 216 218 228 229 233 231 237
6. Total current revenue 1039 1325 1313 1318 1380 1448 1542 1615 1702 1725 1674 1744 1788 1817 1864 1906 1992
7. Government comsumption expenditure 482 585 617 659 694 705 725 765 797 835 860 890 924 956 992 1029 10658. Collective consumption 150 185 179 186 194 197 198 208 215 227 235 247 258 266 276 287 2979. Social transfers in kind 332 400 438 473 499 508 527 557 583 608 624 642 666 690 716 743 767
10. Compensation of employees 296 345 365 384 408 421 432 446 466 473 471 486 487 506 521 538 55711. Intermediate consumption 192 210 222 231 236 238 246 263 270 286 296 307 316 319 332 338 34512. Social transfers other than in kind 324 353 369 388 416 426 435 447 449 462 488 492 491 515 535 540 55513. Social transfers in kind via market produce 38 58 63 74 78 77 80 85 91 98 110 120 128 132 139 146 15214. Interest 97 78 66 69 51 42 45 47 54 53 30 27 35 27 31 34 3315. Subsidies 66 36 34 36 37 36 39 44 44 46 47 50 52 53 54 56 5816. Other current expenditure 84 103 91 91 104 114 118 123 119 134 145 139 152 155 165 169 176
17. Total current expenditure 1097 1183 1211 1272 1331 1355 1395 1455 1493 1552 1587 1619 1661 1708 1779 1821 1878
18. Gross saving -57 142 102 45 49 93 147 161 209 173 87 124 127 109 85 85 115
19. Capital transfers received 4 4 4 5 4 5 3 2 3 3 2 3 3 13 14 3 3
20. Total revenue 1043 1329 1318 1322 1385 1453 1545 1617 1705 1727 1676 1746 1792 1830 1878 1909 1996
21. Gross fixed capital formation 70 63 68 76 75 78 83 90 96 105 109 116 119 124 127 129 13122. Other capital expenditure 10 2 3 5 5 2 7 4 3 1 2 1 6 5 4 5 6
23. Total expenditure 1177 1248 1282 1353 1411 1436 1485 1549 1592 1658 1698 1736 1786 1838 1909 1956 2014
24. Tax burden 868 1175 1165 1164 1221 1285 1360 1429 1488 1498 1457 1526 1559 1587 1631 1675 1755
25. Net lending (+) or net borrowing (-) -134 81 36 -31 -26 17 60 69 113 69 -22 10 6 -8 -32 -46 -19
68

Table 28B
Contributions to the change in the general government gross debt ratio
Sweden
1995 2000 2001 2002 2003 2004 2005 2006 2007 2008 2009 2010 2011 2012 2013 2014 2015
1. Net borrowing (% of GDP) 1) 7.4 -3.6 -1.5 1.3 1.0 -0.6 -2.2 -2.3 -3.6 -2.2 0.7 -0.3 -0.2 0.2 0.9 1.2 0.52. Interest payments (% of GDP) 5.4 3.5 2.8 2.8 2.0 1.6 1.6 1.6 1.7 1.7 1.0 0.8 1.0 0.7 0.9 0.9 0.8
3. Implicit interest rate 2) 8.0 5.7 5.4 5.4 4.0 3.2 3.4 3.4 4.1 4.2 2.4 2.1 2.7 2.0 2.3 2.3 2.14. Nominal GDP growth rate 7.8 5.9 3.7 4.1 4.1 4.6 4.1 6.3 6.2 2.5 -3.1 7.5 4.3 2.0 2.5 4.0 5.0
(% of GDP)
Budgetary constraint based on thedeficit
5. Deficit (net borrowing) 1) 7.4 -3.6 -1.5 1.3 1.0 -0.6 -2.2 -2.3 -3.6 -2.2 0.7 -0.3 -0.2 0.2 0.9 1.2 0.56. Contribution of nominal GDP growth -5.2 -3.6 -1.9 -2.1 -2.1 -2.3 -2.0 -3.0 -2.6 -1.0 1.2 -3.0 -1.6 -0.7 -0.9 -1.6 -2.07. Stock-flow adjustment 3) -1.8 -3.2 4.3 -1.4 0.3 1.5 4.2 0.2 1.2 1.7 1.8 0.1 1.0 0.1 3.2 1.0 0.6
Budgetary constraint based on theprimary deficit
8. Primary deficit 4) 2.0 -7.1 -4.3 -1.6 -1.0 -2.2 -3.8 -3.9 -5.3 -3.8 -0.2 -1.1 -1.2 -0.5 0.0 0.3 -0.49. Snow-ball effect 0.1 -0.1 0.9 0.7 -0.1 -0.7 -0.3 -1.4 -0.9 0.7 2.2 -2.1 -0.6 0.0 -0.1 -0.7 -1.210. Stock-flow adjustment 3) -1.8 -3.2 4.3 -1.4 0.3 1.5 4.2 0.2 1.2 1.7 1.8 0.1 1.0 0.1 3.2 1.0 0.6
(% of GDP)
11. Change in gross debt 5) 0.4 -10.4 0.8 -2.2 -0.8 -1.4 0.1 -5.1 -5.1 -1.4 3.8 -3.1 -0.8 -0.4 3.1 0.6 -1.012. Level of gross debt (end of year) 72.8 53.9 54.7 52.5 51.7 50.3 50.4 45.3 40.2 38.8 42.6 39.4 38.6 38.2 41.3 41.9 41.0
1) Line 1 = line 5, a minus sign means a surplus.2) Actual interest payments as percentage of gross debt at end of t-1.3) Line 7 = line 10.4) Net borrowing excl. interest payments, line 8 = line 1 - line 2. A minus sign means a primary surplus.5) Line 11 = total of lines 5, 6 and 7 or 8, 9 and 10.
69
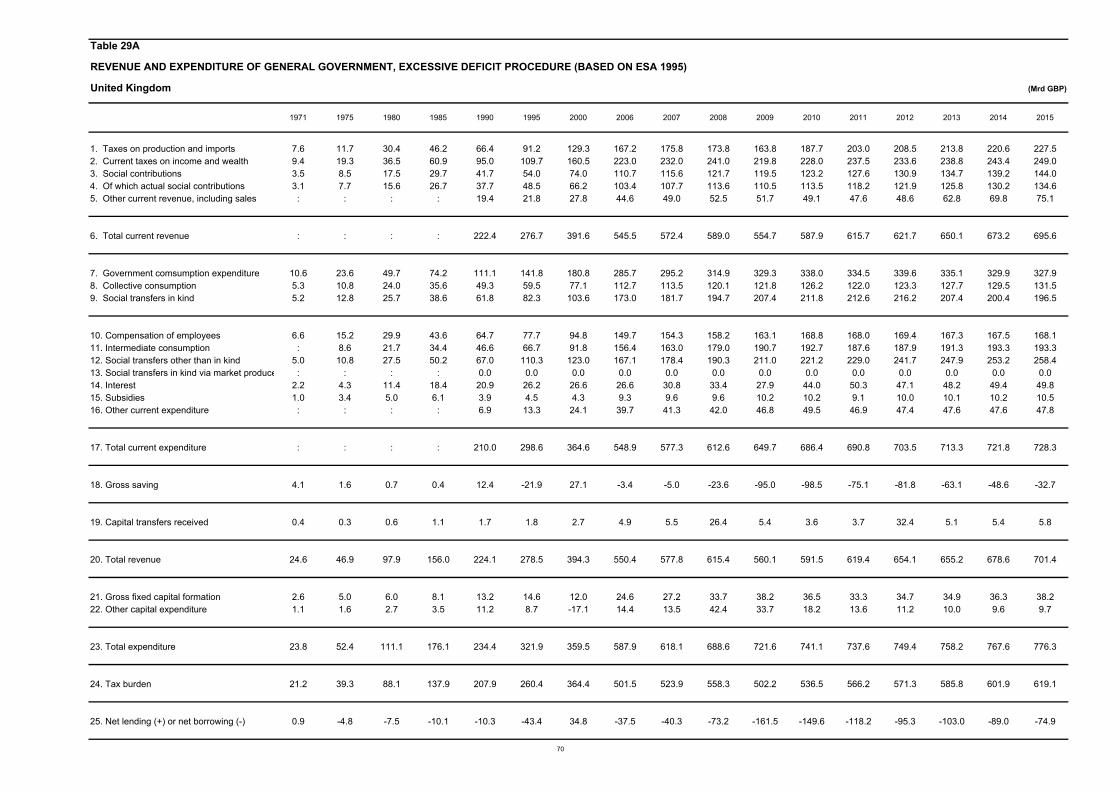
Table 29A
REVENUE AND EXPENDITURE OF GENERAL GOVERNMENT, EXCESSIVE DEFICIT PROCEDURE (BASED ON ESA 1995)
United Kingdom (Mrd GBP)
1971 1975 1980 1985 1990 1995 2000 2006 2007 2008 2009 2010 2011 2012 2013 2014 2015
1. Taxes on production and imports 7.6 11.7 30.4 46.2 66.4 91.2 129.3 167.2 175.8 173.8 163.8 187.7 203.0 208.5 213.8 220.6 227.52. Current taxes on income and wealth 9.4 19.3 36.5 60.9 95.0 109.7 160.5 223.0 232.0 241.0 219.8 228.0 237.5 233.6 238.8 243.4 249.03. Social contributions 3.5 8.5 17.5 29.7 41.7 54.0 74.0 110.7 115.6 121.7 119.5 123.2 127.6 130.9 134.7 139.2 144.04. Of which actual social contributions 3.1 7.7 15.6 26.7 37.7 48.5 66.2 103.4 107.7 113.6 110.5 113.5 118.2 121.9 125.8 130.2 134.65. Other current revenue, including sales : : : : 19.4 21.8 27.8 44.6 49.0 52.5 51.7 49.1 47.6 48.6 62.8 69.8 75.1
6. Total current revenue : : : : 222.4 276.7 391.6 545.5 572.4 589.0 554.7 587.9 615.7 621.7 650.1 673.2 695.6
7. Government comsumption expenditure 10.6 23.6 49.7 74.2 111.1 141.8 180.8 285.7 295.2 314.9 329.3 338.0 334.5 339.6 335.1 329.9 327.98. Collective consumption 5.3 10.8 24.0 35.6 49.3 59.5 77.1 112.7 113.5 120.1 121.8 126.2 122.0 123.3 127.7 129.5 131.59. Social transfers in kind 5.2 12.8 25.7 38.6 61.8 82.3 103.6 173.0 181.7 194.7 207.4 211.8 212.6 216.2 207.4 200.4 196.5
10. Compensation of employees 6.6 15.2 29.9 43.6 64.7 77.7 94.8 149.7 154.3 158.2 163.1 168.8 168.0 169.4 167.3 167.5 168.111. Intermediate consumption : 8.6 21.7 34.4 46.6 66.7 91.8 156.4 163.0 179.0 190.7 192.7 187.6 187.9 191.3 193.3 193.312. Social transfers other than in kind 5.0 10.8 27.5 50.2 67.0 110.3 123.0 167.1 178.4 190.3 211.0 221.2 229.0 241.7 247.9 253.2 258.413. Social transfers in kind via market produce : : : : 0.0 0.0 0.0 0.0 0.0 0.0 0.0 0.0 0.0 0.0 0.0 0.0 0.014. Interest 2.2 4.3 11.4 18.4 20.9 26.2 26.6 26.6 30.8 33.4 27.9 44.0 50.3 47.1 48.2 49.4 49.815. Subsidies 1.0 3.4 5.0 6.1 3.9 4.5 4.3 9.3 9.6 9.6 10.2 10.2 9.1 10.0 10.1 10.2 10.516. Other current expenditure : : : : 6.9 13.3 24.1 39.7 41.3 42.0 46.8 49.5 46.9 47.4 47.6 47.6 47.8
17. Total current expenditure : : : : 210.0 298.6 364.6 548.9 577.3 612.6 649.7 686.4 690.8 703.5 713.3 721.8 728.3
18. Gross saving 4.1 1.6 0.7 0.4 12.4 -21.9 27.1 -3.4 -5.0 -23.6 -95.0 -98.5 -75.1 -81.8 -63.1 -48.6 -32.7
19. Capital transfers received 0.4 0.3 0.6 1.1 1.7 1.8 2.7 4.9 5.5 26.4 5.4 3.6 3.7 32.4 5.1 5.4 5.8
20. Total revenue 24.6 46.9 97.9 156.0 224.1 278.5 394.3 550.4 577.8 615.4 560.1 591.5 619.4 654.1 655.2 678.6 701.4
21. Gross fixed capital formation 2.6 5.0 6.0 8.1 13.2 14.6 12.0 24.6 27.2 33.7 38.2 36.5 33.3 34.7 34.9 36.3 38.222. Other capital expenditure 1.1 1.6 2.7 3.5 11.2 8.7 -17.1 14.4 13.5 42.4 33.7 18.2 13.6 11.2 10.0 9.6 9.7
23. Total expenditure 23.8 52.4 111.1 176.1 234.4 321.9 359.5 587.9 618.1 688.6 721.6 741.1 737.6 749.4 758.2 767.6 776.3
24. Tax burden 21.2 39.3 88.1 137.9 207.9 260.4 364.4 501.5 523.9 558.3 502.2 536.5 566.2 571.3 585.8 601.9 619.1
25. Net lending (+) or net borrowing (-) 0.9 -4.8 -7.5 -10.1 -10.3 -43.4 34.8 -37.5 -40.3 -73.2 -161.5 -149.6 -118.2 -95.3 -103.0 -89.0 -74.9
70

Table 29B
Contributions to the change in the general government gross debt ratio
United Kingdom
1995 2000 2001 2002 2003 2004 2005 2006 2007 2008 2009 2010 2011 2012 2013 2014 2015
1. Net borrowing (% of GDP) 1) 5.8 -3.5 -0.4 2.1 3.5 3.5 3.4 2.8 2.8 5.0 11.4 10.1 7.7 6.1 6.4 5.3 4.32. Interest payments (% of GDP) 3.5 2.7 2.3 2.0 1.9 1.9 2.1 2.0 2.2 2.3 2.0 3.0 3.3 3.0 3.0 3.0 2.9
3. Implicit interest rate 2) 8.0 6.6 6.0 5.5 5.5 5.3 5.4 5.0 5.3 5.3 3.7 4.6 4.3 3.6 3.5 3.3 3.14. Nominal GDP growth rate 5.9 5.2 4.5 4.8 6.2 5.6 5.3 5.7 5.8 2.4 -3.1 4.8 3.5 1.8 2.6 3.7 3.9
(% of GDP)
Budgetary constraint based on thedeficit
5. Deficit (net borrowing) 1) 5.8 -3.5 -0.4 2.1 3.5 3.5 3.4 2.8 2.8 5.0 11.4 10.1 7.7 6.1 6.4 5.3 4.36. Contribution of nominal GDP growth -2.6 -2.1 -1.8 -1.7 -2.2 -2.1 -2.0 -2.3 -2.3 -1.0 1.6 -3.1 -2.6 -1.5 -2.2 -3.3 -3.77. Stock-flow adjustment 3) 0.4 3.0 -1.0 -0.5 0.3 0.2 0.0 0.5 0.5 4.2 2.2 4.4 0.8 -0.2 1.4 0.6 1.0
Budgetary constraint based on theprimary deficit
8. Primary deficit 4) 2.3 -6.2 -2.7 0.1 1.5 1.6 1.4 0.8 0.7 2.7 9.4 7.1 4.4 3.1 3.4 2.4 1.49. Snow-ball effect 0.9 0.6 0.6 0.2 -0.2 -0.1 0.0 -0.3 -0.2 1.3 3.6 -0.1 0.7 1.5 0.8 -0.4 -0.810. Stock-flow adjustment 3) 0.4 3.0 -1.0 -0.5 0.3 0.2 0.0 0.5 0.5 4.2 2.2 4.4 0.8 -0.2 1.4 0.6 1.0
(% of GDP)
11. Change in gross debt 5) 3.6 -2.7 -3.2 -0.1 1.6 1.7 1.4 1.0 1.0 8.2 15.2 11.3 5.9 4.4 5.6 2.6 1.612. Level of gross debt (end of year) 50.0 40.5 37.3 37.2 38.7 40.4 41.7 42.8 43.7 51.9 67.1 78.4 84.3 88.7 94.3 96.9 98.6
1) Line 1 = line 5, a minus sign means a surplus.2) Actual interest payments as percentage of gross debt at end of t-1.3) Line 7 = line 10.4) Net borrowing excl. interest payments, line 8 = line 1 - line 2. A minus sign means a primary surplus.5) Line 11 = total of lines 5, 6 and 7 or 8, 9 and 10.
71
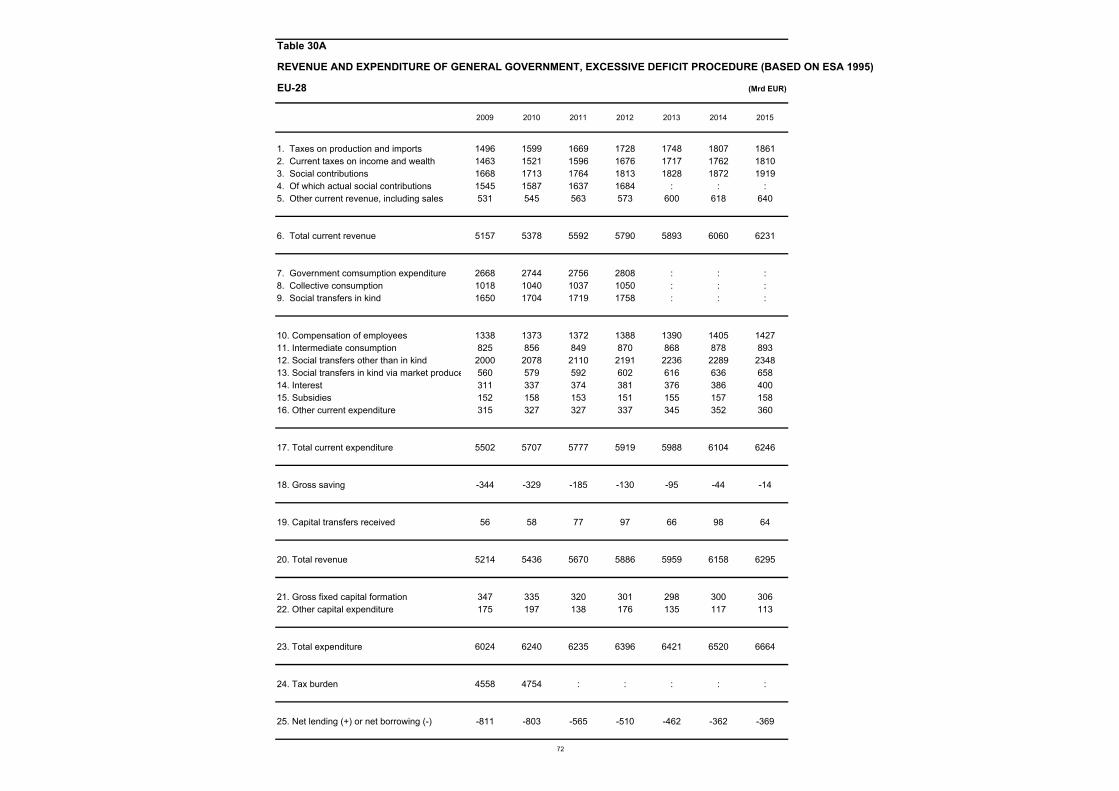
Table 30A
REVENUE AND EXPENDITURE OF GENERAL GOVERNMENT, EXCESSIVE DEFICIT PROCEDURE (BASED ON ESA 1995)
EU-28 (Mrd EUR)
2009 2010 2011 2012 2013 2014 2015
1. Taxes on production and imports 1496 1599 1669 1728 1748 1807 18612. Current taxes on income and wealth 1463 1521 1596 1676 1717 1762 18103. Social contributions 1668 1713 1764 1813 1828 1872 19194. Of which actual social contributions 1545 1587 1637 1684 : : :5. Other current revenue, including sales 531 545 563 573 600 618 640
6. Total current revenue 5157 5378 5592 5790 5893 6060 6231
7. Government comsumption expenditure 2668 2744 2756 2808 : : :8. Collective consumption 1018 1040 1037 1050 : : :9. Social transfers in kind 1650 1704 1719 1758 : : :
10. Compensation of employees 1338 1373 1372 1388 1390 1405 142711. Intermediate consumption 825 856 849 870 868 878 89312. Social transfers other than in kind 2000 2078 2110 2191 2236 2289 234813. Social transfers in kind via market produce 560 579 592 602 616 636 65814. Interest 311 337 374 381 376 386 40015. Subsidies 152 158 153 151 155 157 15816. Other current expenditure 315 327 327 337 345 352 360
17. Total current expenditure 5502 5707 5777 5919 5988 6104 6246
18. Gross saving -344 -329 -185 -130 -95 -44 -14
19. Capital transfers received 56 58 77 97 66 98 64
20. Total revenue 5214 5436 5670 5886 5959 6158 6295
21. Gross fixed capital formation 347 335 320 301 298 300 30622. Other capital expenditure 175 197 138 176 135 117 113
23. Total expenditure 6024 6240 6235 6396 6421 6520 6664
24. Tax burden 4558 4754 : : : : :
25. Net lending (+) or net borrowing (-) -811 -803 -565 -510 -462 -362 -369
72
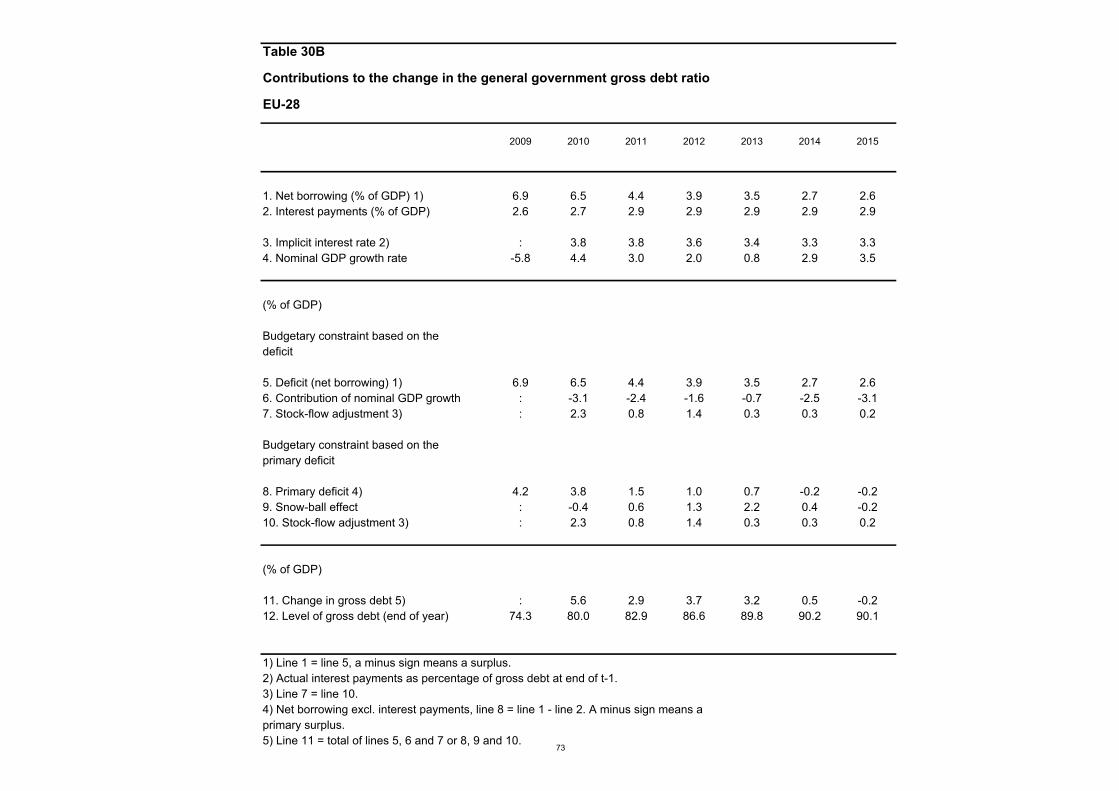
Table 30B
Contributions to the change in the general government gross debt ratio
EU-28
2009 2010 2011 2012 2013 2014 2015
1. Net borrowing (% of GDP) 1) 6.9 6.5 4.4 3.9 3.5 2.7 2.62. Interest payments (% of GDP) 2.6 2.7 2.9 2.9 2.9 2.9 2.9
3. Implicit interest rate 2) : 3.8 3.8 3.6 3.4 3.3 3.34. Nominal GDP growth rate -5.8 4.4 3.0 2.0 0.8 2.9 3.5
(% of GDP)
Budgetary constraint based on thedeficit
5. Deficit (net borrowing) 1) 6.9 6.5 4.4 3.9 3.5 2.7 2.66. Contribution of nominal GDP growth : -3.1 -2.4 -1.6 -0.7 -2.5 -3.17. Stock-flow adjustment 3) : 2.3 0.8 1.4 0.3 0.3 0.2
Budgetary constraint based on theprimary deficit
8. Primary deficit 4) 4.2 3.8 1.5 1.0 0.7 -0.2 -0.29. Snow-ball effect : -0.4 0.6 1.3 2.2 0.4 -0.210. Stock-flow adjustment 3) : 2.3 0.8 1.4 0.3 0.3 0.2
(% of GDP)
11. Change in gross debt 5) : 5.6 2.9 3.7 3.2 0.5 -0.212. Level of gross debt (end of year) 74.3 80.0 82.9 86.6 89.8 90.2 90.1
1) Line 1 = line 5, a minus sign means a surplus.2) Actual interest payments as percentage of gross debt at end of t-1.3) Line 7 = line 10.4) Net borrowing excl. interest payments, line 8 = line 1 - line 2. A minus sign means aprimary surplus.5) Line 11 = total of lines 5, 6 and 7 or 8, 9 and 10.
73
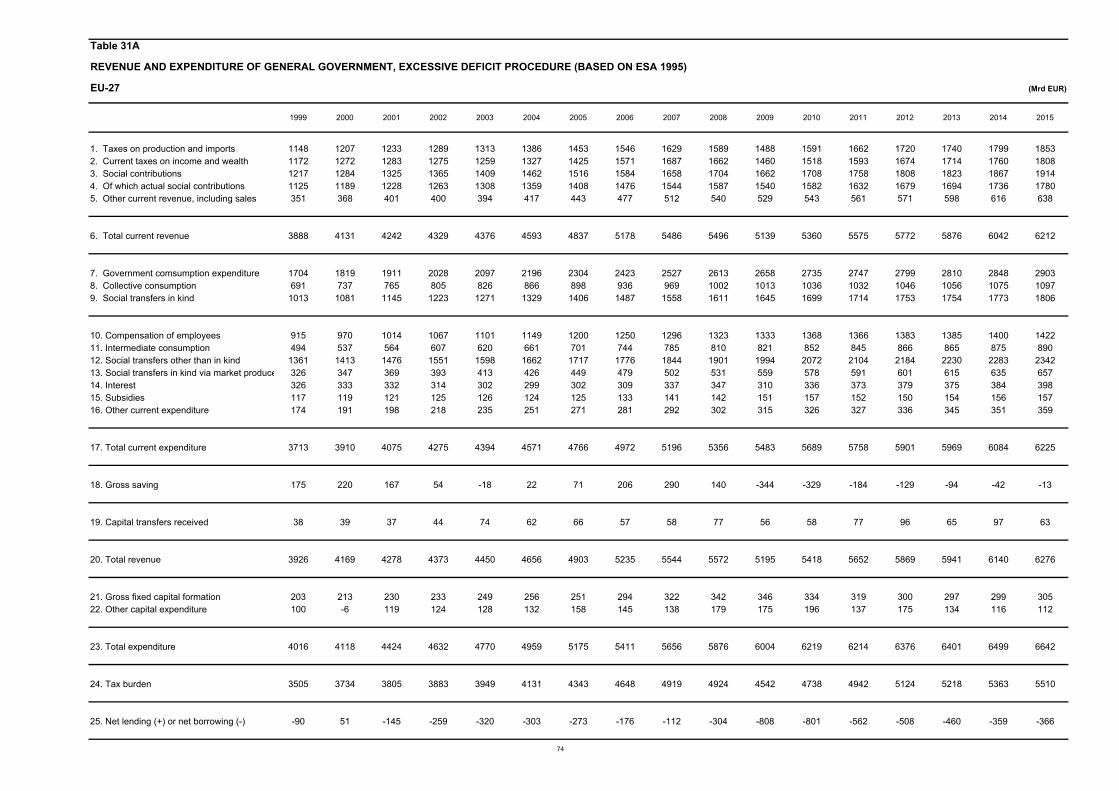
Table 31A
REVENUE AND EXPENDITURE OF GENERAL GOVERNMENT, EXCESSIVE DEFICIT PROCEDURE (BASED ON ESA 1995)
EU-27 (Mrd EUR)
1999 2000 2001 2002 2003 2004 2005 2006 2007 2008 2009 2010 2011 2012 2013 2014 2015
1. Taxes on production and imports 1148 1207 1233 1289 1313 1386 1453 1546 1629 1589 1488 1591 1662 1720 1740 1799 18532. Current taxes on income and wealth 1172 1272 1283 1275 1259 1327 1425 1571 1687 1662 1460 1518 1593 1674 1714 1760 18083. Social contributions 1217 1284 1325 1365 1409 1462 1516 1584 1658 1704 1662 1708 1758 1808 1823 1867 19144. Of which actual social contributions 1125 1189 1228 1263 1308 1359 1408 1476 1544 1587 1540 1582 1632 1679 1694 1736 17805. Other current revenue, including sales 351 368 401 400 394 417 443 477 512 540 529 543 561 571 598 616 638
6. Total current revenue 3888 4131 4242 4329 4376 4593 4837 5178 5486 5496 5139 5360 5575 5772 5876 6042 6212
7. Government comsumption expenditure 1704 1819 1911 2028 2097 2196 2304 2423 2527 2613 2658 2735 2747 2799 2810 2848 29038. Collective consumption 691 737 765 805 826 866 898 936 969 1002 1013 1036 1032 1046 1056 1075 10979. Social transfers in kind 1013 1081 1145 1223 1271 1329 1406 1487 1558 1611 1645 1699 1714 1753 1754 1773 1806
10. Compensation of employees 915 970 1014 1067 1101 1149 1200 1250 1296 1323 1333 1368 1366 1383 1385 1400 142211. Intermediate consumption 494 537 564 607 620 661 701 744 785 810 821 852 845 866 865 875 89012. Social transfers other than in kind 1361 1413 1476 1551 1598 1662 1717 1776 1844 1901 1994 2072 2104 2184 2230 2283 234213. Social transfers in kind via market produce 326 347 369 393 413 426 449 479 502 531 559 578 591 601 615 635 65714. Interest 326 333 332 314 302 299 302 309 337 347 310 336 373 379 375 384 39815. Subsidies 117 119 121 125 126 124 125 133 141 142 151 157 152 150 154 156 15716. Other current expenditure 174 191 198 218 235 251 271 281 292 302 315 326 327 336 345 351 359
17. Total current expenditure 3713 3910 4075 4275 4394 4571 4766 4972 5196 5356 5483 5689 5758 5901 5969 6084 6225
18. Gross saving 175 220 167 54 -18 22 71 206 290 140 -344 -329 -184 -129 -94 -42 -13
19. Capital transfers received 38 39 37 44 74 62 66 57 58 77 56 58 77 96 65 97 63
20. Total revenue 3926 4169 4278 4373 4450 4656 4903 5235 5544 5572 5195 5418 5652 5869 5941 6140 6276
21. Gross fixed capital formation 203 213 230 233 249 256 251 294 322 342 346 334 319 300 297 299 30522. Other capital expenditure 100 -6 119 124 128 132 158 145 138 179 175 196 137 175 134 116 112
23. Total expenditure 4016 4118 4424 4632 4770 4959 5175 5411 5656 5876 6004 6219 6214 6376 6401 6499 6642
24. Tax burden 3505 3734 3805 3883 3949 4131 4343 4648 4919 4924 4542 4738 4942 5124 5218 5363 5510
25. Net lending (+) or net borrowing (-) -90 51 -145 -259 -320 -303 -273 -176 -112 -304 -808 -801 -562 -508 -460 -359 -366
74

Table 31B
Contributions to the change in the general government gross debt ratio
EU-27
1999 2000 2001 2002 2003 2004 2005 2006 2007 2008 2009 2010 2011 2012 2013 2014 2015
1. Net borrowing (% of GDP) 1) 1.0 -0.6 1.5 2.6 3.2 2.9 2.5 1.5 0.9 2.4 6.9 6.5 4.4 3.9 3.5 2.7 2.62. Interest payments (% of GDP) 3.8 3.6 3.5 3.2 3.0 2.8 2.7 2.6 2.7 2.8 2.6 2.7 2.9 2.9 2.9 2.9 2.9
3. Implicit interest rate 2) 6.0 5.9 5.8 5.4 5.0 4.8 4.6 4.4 4.7 4.7 4.0 3.8 3.8 3.6 3.3 3.3 3.34. Nominal GDP growth rate 5.0 7.2 4.2 3.7 1.7 5.0 4.4 5.7 6.0 0.6 -5.8 4.4 3.0 2.0 0.8 2.9 3.5
(% of GDP)
Budgetary constraint based on thedeficit
5. Deficit (net borrowing) 1) 1.0 -0.6 1.5 2.6 3.2 2.9 2.5 1.5 0.9 2.4 6.9 6.5 4.4 3.9 3.5 2.7 2.66. Contribution of nominal GDP growth -3.2 -4.4 -2.5 -2.2 -1.0 -2.9 -2.6 -3.4 -3.5 -0.3 3.9 -3.2 -2.4 -1.6 -0.7 -2.5 -3.17. Stock-flow adjustment 3) 1.5 1.1 0.1 -1.0 -0.7 0.4 0.8 0.5 -0.1 1.2 1.6 2.3 0.8 1.4 0.3 0.3 0.3
Budgetary constraint based on theprimary deficit
8. Primary deficit 4) -2.7 -4.2 -2.0 -0.6 0.2 0.0 -0.3 -1.1 -1.8 -0.3 4.2 3.8 1.5 1.0 0.7 -0.2 -0.29. Snow-ball effect 0.6 -0.8 1.0 1.0 2.0 -0.1 0.1 -0.8 -0.8 2.4 6.5 -0.4 0.6 1.3 2.2 0.3 -0.210. Stock-flow adjustment 3) 1.5 1.1 0.1 -1.0 -0.7 0.4 0.8 0.5 -0.1 1.2 1.6 2.3 0.8 1.4 0.3 0.3 0.3
(% of GDP)
11. Change in gross debt 5) -0.6 -3.8 -0.9 -0.6 1.5 0.4 0.7 -1.4 -2.7 3.3 12.3 5.6 2.8 3.7 3.2 0.5 -0.212. Level of gross debt (end of year) 65.7 61.8 61.0 60.4 61.9 62.3 62.9 61.6 58.9 62.2 74.5 80.1 83.0 86.7 89.9 90.3 90.2
1) Line 1 = line 5, a minus sign means a surplus.2) Actual interest payments as percentage of gross debt at end of t-1.3) Line 7 = line 10.4) Net borrowing excl. interest payments, line 8 = line 1 - line 2. A minus sign means a primary surplus.5) Line 11 = total of lines 5, 6 and 7 or 8, 9 and 10.
75