Embed Size (px)
Citation preview

' I
lw:i.l
r, ' .
pi!) ! : ~
REGIONAL CONCEPTUAL DESIGN AND
ANALYSIS STUDIES FOR
SAND78-7039 DOCUMENT NO. 78SDS4239
JANUARY 1979
RESIDENTIAL PHOTOVOLTAIC SYSTEMS
CUSTOMER:
CONTRACT:
FINAL REPORT
EXECUTIVE SUMMARY VOLUME I
SANDIA LABORATORIES
P.O. NO. 05-6177
s,·uoY PERIOD: SEPTEMBER 1977 THROUGH SEPTEMBER 1978
ADVANCED ENERGY PROGRAMS
GENERAL. ELECTRIC SPACE DIVISION
Valley Forge Space Center
P. 0. Box 8555 • Philadelphia, Penna. 19101

NOTICE
This report was prepared as an account of work sponsored by the United States Government. Neither the United States nor the United States Department of Energy, nor any of their employees, nor any of their contractors, subcontractors, or their employees, makes any warranty, express or implied, or assumes any legal liability or responsibility for the accuracy completeness or usefulness of any information, apparatus, product or process disclosed, or represents that its use would not infringe privately owned rights.
Printed in the United States of America Available from
National Technical Information Service U. S. Department of Commerce
5285 Port Royal Road Springfield, Virginia 22161
Price: Printed Copy $5.25; Microfiche $3.00
~ ~
C
C
~ ~
f®l ~
~ ~
~ ~
rs, IJ

F'l i ;·
I
~
Section
1
2
3
4
5
6
7
8
9
10
11
12
13
14
15
16
17
18
19
20
21
22
23
TABLE OF CONTENTS
INTRODUCTION AND OBJECTIVES o •
CON CL US IONS • • • • • • • • • o • • • • 0 • • • •
APPROACH • • • • • 0 . . . . . . . . . . WEATHER REGION DETERMINATION •
RESIDENCE DESCRIPTION • • • • •
. . . . . . . . . . e e O e e e e e e 0
SPACE CONDITIONING LOADS e e e a e e O e e e e O e
OTHER HOME ENERGY DEMANDS • 0 e e • e D
SYSTEM DEFINITION • • • • • o • • • • • • e e O 0
ANALYTICAL MODELS • • • • • o • • • • 0 • • • • •
ECONOMIC MODEL •
COST DATA • • o . . . . . . .
• • • 0 . . SUBSYSTEM PERFORMANCE • o • • o • • • • o
SUMMARY OF ECONOMIC VIABILITY o • • • • • ..
COMPARISON OF PV SYSTEM PERFORMANCE • •
CORRELATION OF PV-ONLY SYSTEM OUTPUT. • •
0 • 0 0
SIDE-BY-SIDE SYSTEMS • • • • • • • • • • • • • • 0
COMBINED PV /THERMAL SYSTEMS • • •
ECONOMIC PARAMETRIC VARIATIONS
EXTENSIONS OF PERFORMANCE AND ECONOMIC RESULTS •
COMPARISON OF WEATHER DATA • •
HABITABLE HOUSE DESIGN • • • •
RESIDENTIAL TEST FACILITY •
• • • • • 0
. . . . . . 0 0 e
. . . .
PV AND THERMAL TEST SYSTEM DESIGN • e O e O O O e e
Page
6
8
10
12
14
16
18
20
22
24
26
28
30
32
34
36
38
40
42
44
46
48
50
3/4

f'!'1 : I
~ I •
\ ;
id
Fl I .:
bi
~ I '.
~
. 0
0 J
I
ABSTRACT
Conceptual. design and analyses of photovoltaic (PV) systems were performed for residences applicable to various regions of the United States during the mid-1980 time period. A wide range of roof-mounted array systems was studied including PV-only systems and combined and separate PV /thermal collection systems which provide heat for space conditioning and domestic hot water. The attractiveness of the system options were assessed in terms of performance and economic competitiveness based on hourly weather data for twelve designated regions of the U.S. representing a broad spectrum of climatic characteristics.
The study determined that if PV economic goals are achieved, PV-only solar energy systems for residential use should be emphasized because of their potential economic viability in all regions. On the basis of the costs and benefits used in the analysis, residential systems without batteries are preferred over systems with batteries assuming utility feedback acceptance at some differential buy-back rate such as 40 to 50 percent of the sell rate. Sideby-side PV /thermal systems become more viable across the nation with a PV system cost to thermal system cost ratio of 1. The combined PV /thermal collector systems were economically unattractive due to the projected performance and costs assumed in the study.
Based on the study results, 'the immediate implementation of a residential test program is recommended. The test program is required to provide early system installation and operating experience, to provide subsystem evaluations, to promote general public acceptance of PVsystems andtostimulatethepotentialPV residential market. Both test-bed facilities and habitable residences should be implemented. Test-bed facilities with PV-only systems with and without battery storage should be considered initially. These facilities would have provisions for installing solar thermal collectors at a later time. Parallel efforts with habitable residences having PV-only systems without storage is also recommended.
As part of the study, designs were developed for a habitable test house and a residential testbed facility to the requirements of the test program. These facilities should be considered in the Southwest, Northeast and Southeast regions of the country in that order.
5

6
1 . INTRODUCTION AND OBJECTIVES
This report presents the results of a comprehensive study on residential solar energy systems which include photovoltaic (PV) solar arrays for electrical power generation and PV /thermal systems. The study was conducted by the General Electric Co./ Advanced Energy Programs for Sandia Laboratories with Dr. Gary Jones of Sandia providing program direction and guidance. The study was carried out over a twelvemonth period starting in September, 1977.
The objectives of this study were to assess the technical and economic performance of residential solar energy systems and to select the most attractive systems for future testing. These systems encompassed both photovoltaic generation for residential electrical needs, and thermal energy collection for heating, cooling and domestic hot water needs. The technical and economic evaluations were completed based on residence designs and cost scenarios projected for the mid-1980's. The analyses were conducted on a regional basis to reflect significant climatic and economic differences. A final objective was to prepare a residential test-bed facility design and a habitable residence design and recommend an order for their implementation leading to systematic long-term development of residentif:I.]. PV and thermal solar energy systems.
In attaining these objectives, the study has developed many generalized results which can be utilized to change economic scenarios assumed in the study and to extend the results to other climatic regions.
C C
C F1 ~
C
ri ~
~ ~
F ~
C
C
C .

C
D 0 0 .
0 .
r ~
GENERAL ELECTRIC COMPANY Space Division
• • • •
Advanced Energy Programs Valley Forge, Pennsylvania
Project Management
Regional Identification
Load Determination
System Definition
PROJECT TEAM
• Performance and Economic Analyses
• System Cost Evaluation
• System Ranking
• Test Facility Design Features
MASSDESIGN ARCHITECTS AND PLANNERS CENTER FOR GOVERNMENTAL RESPONSIBILITY
Cambridge, Massachusetts
•
•
•
• •
Residential Energy Conservation Measures
Residential Test Facility Architectural Design
Habitable Test Residences Architectural Design
Test Facility Cost Estimates
Building Code Implications
Gainesville, Florida
• •
Institutional Factor Considerations
Legal Issue Review
7

. IL-__ 2_. c_o_N_c_Lu_s_i_o_N_s __ --1.. _______________ _
The study has led to the following principal conclusions:
1. Most sites studied indicated that residential PV systems show economic viability in the 1986 time frame at 50 ¢ /peak Watt array costs.
2. Immediate implementation of a residential test program is recommended to support technical development needed to assure the projected economic viability of photovoltaic (PV) systems for the 1986 time frame.
3. PV-only solar energy systems for residential use should be emphasized since their potential economic viability was as good as or better than other solar energy options evaluated in all regions.
4. On the basis of costs and benefits assumed, residential systems without batteries are preferred over systems with batteries. Systems without batteries, however, require that utilities accept excess PV output with sell-back rates in the range of 40 to 50 percent of the electricity buy rate.
5. Present cost projection for solar thermal systems, and required costs for PV systems to achieve economic viability, indicate a thermal to PV system cost ratio of about 2 to 1. Under this condition, side-by-side systems in the Southwest are economically viable with low thermal collector areas. At a cost ratio of 1 or less, sideby-side systems become more viable in most regions with thermal collectors occupying more than 30 percent of the roof area.
6. Combined PV/thermal collector systems must show improved performance and reduced costs over those assumed in this study to show economic viability.
7. Test-bed facilities should be initially implemented with simple PV-only systems, both with and without battery storage. Some provision should be included for installing solar thermal collectors at a later time, should cost reductions encourage their use. Because of the relative simplicity of the PV-only approach, particularly without storage, consideration should be given to concurrently erecting several PV-only habitable residences with the test facilities thereby addressing non-technical issues and producing early results and experience. In order of economic preference, the facilities should be considered for the Southwest, Northeast and Southeast regions of the country. An appropriate program would consist of locating separate test facilities in the Southwest and Northeast and habitable residences in each of the three regions.
8. Fixed-panel, roof-mounted, passively-cooled PV solar arrays are the most suitable systems for residential use.
9. PV -only system performance can be correlated as a function of annual insolation levels and heating and cooling degree days to provide estimates of system performance for microclimates. Economic nomographs can also be used to estimate economic viability for these microclimate regions.
8
. C F ~
~ ~
r'1 ~
F hllid
F' kei
~ ~
F' ~
C
C F1 kJ
' 0

' C
D '
~ w
F21 i : lJ
F1 ~
D '
PV ARRAY
UTILITY BACKUP
DC/AC t---+---4GENERAL INVERTER LOADS
MAX POWER TRACK HEAT
PUMP
HOT WATER
PV ARRAY
FOSSIL FUEL
BACK-UP
DC/AC GENERAL INVERTER LOADS
FURNACE
VAPOR COMPR.
HEATING
HOT WATER
REPRESENTIVE PV- ONLY SCHEMATICS
RESIDENTIAL TEST FACILITY
HABITABLE TEST RESIDENCE FOR SUNBELT STATES
9

I
10
3. APPROACH
To implement this study, the following approach to key issues was taken:
1. Weather Data: Performance analyses were based on hourly SOLMET tapes obtained from the National Climatic Center. From the years of record for a particular location, the most suitable one was selected representing the best average of the significant variables involved.
2. Regionalization: Analyses were performed at thirteen sites considered to be representative of various climates within the continental U. S.
3. Residence Characteristics: Residence desi.gns for median-income families of average size (4 to 5 members) used in establishing heating and cooling loads were representative of those projected for 1986 which incorporate energy conservation features. Building styles reflected those prevalent in the selected regions.
4. Loads: The magnitude and temporal characteristics of the residence loads were defined in detail to assure the acceptance and validity of the final results.
5. Photovoltaic Systems: Conceptual designs were based on current technology regarding solar cell efficiencies. Costs reflected those projected for the mid-1980's or those required to achieve overall system economic viability.
6. Solar Thermal Systems: Conceptual designs were based on current technology regarding solar collectors and supporting subsystems. Cost projections to the mid-1980's were used in the economic evaluations.
7. Economics: Economic analyses were based on 20-year payback periods with start of operations assumed to be in 1986. Appropriate projections of electricity and fuel escalations were taken into account. Resident ownership of the solar energy system was assumed. For those systems involving the sell-back of electricity to the local utility, sell-back rates were treated parametrically in establishing economic break-even levels.
8. System Ranking: The primary system ranking criteria was the system cost-to-benefit ratio which reflects system costs and performance. This system ranking along with non-technical evaluation factors such as region population and growth rates, institutional issues and market stimulation was used to define the order for regional test programs.
With this approach, the study flow plan shown on the next page was followed.
F ~
Fl ~
F! bJ
F ~
F' ~
Fl ~
Fl ~
r1 ~
C Fi ~
F ~
r ~
F1 bJ
~ ~
F1 ~
rJ bJ
I
bJ
C
D .
C 0
I PROGRAM FLOW CHART I WEATHER REGION DETERMINATION
t
\
\
INPUT DATA DEFINITION • ELECTRICAL LOADS • HOUSE MODELS • SPACE CONDITIONS LOADS
' SYSTEM SCREENING • TECHNICAL • ECONOMICAL • INSTITUTIONAL
t
I f
DETAILED PERFORMANCE a-----------~~
ANALYSIS
t
1•
SYSTEM RANKING
SUBSYSTEM AND SYSTEM
CONFIGURATIONS
'f
ECONOMIC ANALYSIS
~~-~ ,---~--------HABITABLE
TEST HOUSE DESIGN AND COST
,, TEST PROGRAM
RANKING
TEST FACILITY DESIGN AND COSTS
11

4. WEATHER REGION DETERMINATION
The definition of regional weather characteristics for the study was directed toward two primary objectives. The first of these objectives was to provide a division of the continental U. s. into climatic regions. The regions defined contiguous areas having similar solar system performance and residential. energy demand for convenient generalization of study results. The second objective was to select weather data for each of the regions for use in the detailed analysis of system performance and load demand.
Three premises were assumed for initiating the specific selections of sites and regions:
1. Regions could be climatically represented by specific sites.
2. PV system performance could be represented by the available insolation.
3. Residential energy demand could be represented by the space heating and cooling load.
Within the framework of the above premises, the following factors were considered to be of primary importance in the selection of sites and the expansion of site specific data to represent a region of similar climate.
1. Selected sites had to have measured hourly radiation and meteorological data records for a period of several years.
2. Sites had to be geographically dispersed across the U. s.
F ~
~ 6d
F1 ~
F9 ~
C .
.
Fl bkJ
Fl b:J
r1 ~
F1 ~
Fl w rm,
3. Sites had to be typical of populated areas, population being a key factor in the potential ~
12
for widespread PV usage.
Consideration of these premises and factors with the detailed insolation and heating and cooling degree-day data resulted in the selection of twelve regions with thirteen sites. One region, the Southwest, was represented by two sites, Phoenix and Albuquerque, to recognize the major shift in heating and cooling loads created by changes in site elevation variations in this part of the country. Certain areas, particularly in the West, have been crosshatched to indicate large climatic variability where the use of the representative site weather data may result in significant errors. Variations in weather patterns may be encountered in these areas due to major changes in elevation, directions of wind patterns created by mountain ranges and valley orientations, other topographic features, and seasonal mixture patterns of polar and maritime air masses.
C '
~ ~
~ ~
C I
Fl kd
. 0

Fl / I
bJ
Fl kl
D '
C j
r1 1d
F1 bJ
ri bJ
u
XX>< DO NOT GENERALIZE IN
~ MOUNTAINOUS AREAS
e SOLMET SITES
. REGIONAL DIVISION
13

15. RESIDENCE DESCRIPTION I
14
Two basic residence designs were configured by Massdesign for the application of solar energy systems. A one-story wrlt, reflecting the architectural styles in the Swibelt region of the cowitry, has a living area of 141 m2 (1520 ft2) and a roof area suitable for solar array installations of 121 m2 (1300 ft2). A two-story wrlt, reflecting the traditional styles more prevalent in the Northern region of the cowitry, has a similar living area and a steeper roof for snow-shedding with a roof area of 102 m2 (1100 ft2). Both designs have reduced living space projected for future housing, no basement, and a single car garage. Energy conservation features are incorporated such as six-inch fiberglass insulation in the walls, eight-inch fiberglass in the ceilings and double glazing on southern windows and triple glazing on north-facing windows. Aside from the use of a slab, construction was as light as possible because of the projected high cost of materials and the control problems experienced in temperate climates by high-mass buildings. The ceilings of the upstairs rooms in the northern home and wherever practical in the swibelt house are open to the sloping roof. Careful design of the heating system, effective use of insulation and innovative application of a clerestory have been combined to assure optimal summer and winter comfort with minimal energy uses.
The floor plans have been arranged to have maximum flexibility and can readily be modified to permit end-to-end contiguous placement. This feature allows an analysis of town houses in the Northern portion of the cowitry. The houses were also designed to permit entry, with minor alterations, from either the north or south side to allow placement on either side of an east-west street.
rt ~
C 179 ~
C
CJ ' .
F7l bl
Fi ~
r, ~
[J r, lgJ
C ' .
rt liihl

RESIDENCE FOR SOUTHERN
(SUNBELT) STATES
COMPOSITION SHINGLES 1/2"PLYW00D ROOF SHEATHING R-25 FIBERGLASS
..-:;..<~----'..;.,-:.--'~"i 2 X 10 RAFTERS @ 1611
O.C.
f 2 X 8 CEILING JOISTS @ 16" O.C.
~~-:=====..:;;.=:1- 1/2°'GYP. BOARD
!¥811 GYP. BOARD 6 11 STUDS R-19 FIBERGLASS 1/211 SHEATHING
CARPET
3/811 U NDERLAYMENT s,'811 P L YWOOD DECK 2 X 10 JOISTS @ 1611 O.C.
l/~~:;c==:====i--1/211 GYP. BO. Ji'l , I
DOUBLE PLATE
DOUBLE HEADER W/ FOAM INS ULATION
RESIDENCE FOR NORTHERN STATES
ENERGY- SAVING CONSTRUCTION DETAILS OF RESIDENCES
. ·-~ -
15

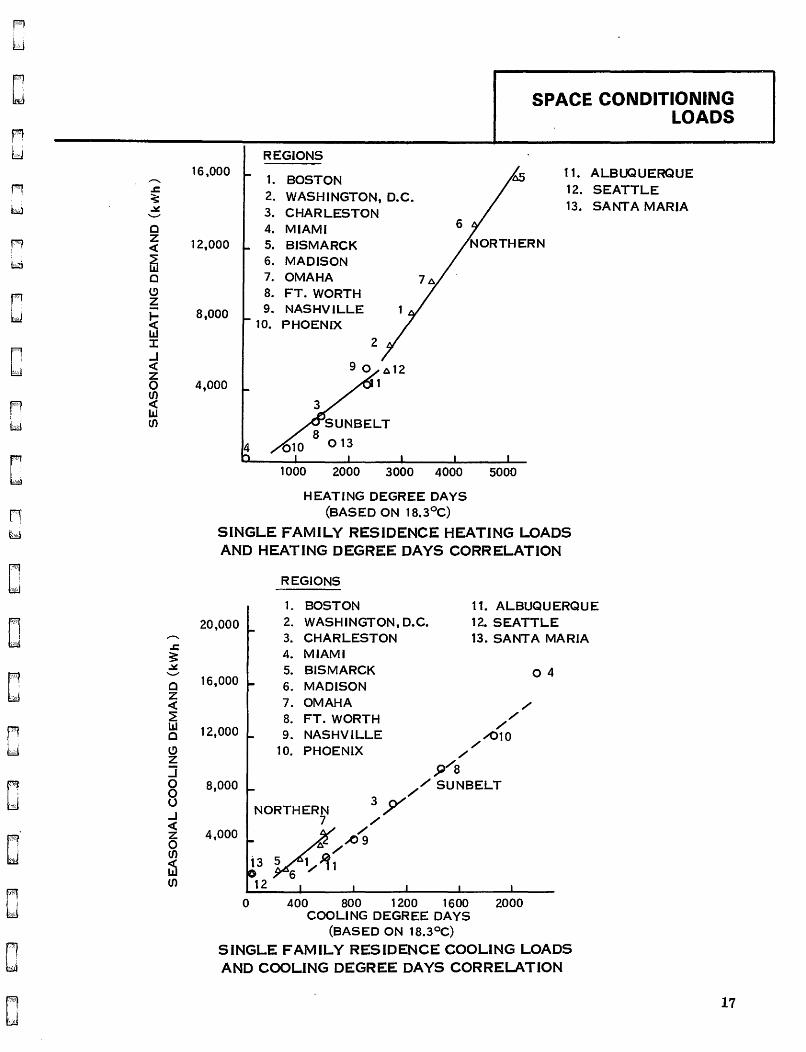
6. SPACE CONDITIONING LOADS
The architectural sketches were used to identify the thermal characteristics of the various building elements for each exposure and to delineate isothermal zones within the residences. Typical energy conserving behavior patterns by the occupants were modeled to the extent practical. To compute the thermal loads that would exist for the residences, General Electric' s Building Thermal Transient Load (BTT L) program was employed using the model of the building thermal characteristics together with the hourly meteorological and radiation data from the SOLMET tapes. Hourly profiles were generated for two dwellings in each of the representative sites chosen. These hourly profiles were then summed for a complete year to obtain annual thermal loads.
For these analyses, it was found that there is, in general, a linear relationship between the seasonal thermal load and the heating and cooling degree days. The slopes of the correlation curves are approximately equivalent to adjusted UA factors which include effects of solar gain, internal heat generation and infiltration as compared to the basic UA factor which accounts only for conductance (U) and area (A).
16
C
C ~ ~
C .
r ~
F ~
Fl l&SJ
C ~ ~
C
C
Cl
D 0
D F1 ' '
bl
' C
C
C .
D '
D C '
Fl w ~ IJ
r, w
D
C z <(
[5 C C) z
~ LL.I J: -1 <( z 0
~ LL.I CJ)
C z <(
~ llJ C C) z J 0
8 .J <( z 0 CJ)
~ CJ)
SPACE CONDITIONING LOADS
16,000
12,000
8,000
4,000
REGIONS
1. 2. 3. 4. s. 6. 7. 8. 9.
10.
BOSTON WASHINGTON, D.C. CHARLESTON MIAMI BISMARCK MADISON OMAHA FT.WORTH NASHVILLE
PHOENIX
2
1000 2000 3000 4000 5000
HEATING DEGREE DAYS (BASED ON 18.3°C)
11. ALBUQUERQUE 12. SEATTLE 13. SANT A MARIA
SINGLE FAMILY RESIDENCE HEATING LOADS AND HEATING DEGREE DAYS CORRELATION
20,000
16,000
12,000
8,000
4,000
REGIONS
1. BOSTON 2. WASHINGTON, D.C. 3. CHARLESTON 4. MIAMI 5. BISMARCK 6. MADISON 7. OMAHA 8. FT. WORTH 9. NASHVILLE
10. PHOENIX / 9/8
11. ALBUQUERQUE 12. SEATTLE 13. SANTA MARIA
/
/ /
/ A)1Q
04
NORTHERN 3 Y
// SUNBELT
7 // ,0 9
i3 6
~ 12
0 400 800 1 200 1600 2000 COOLING DEGREE DAYS
(BASED ON 18.3°C)
SINGLE FAMILY RESIDENCE COOLING LOADS AND COOLING DEGREE DAYS CORRELATION
17

I 7. OTHER HOME ENERGY DEMANDS
/
Energy loads for other than space conditioning were divided into three categories. The first category was that of diversified demand and includes lights and many miscellaneous applications in the modern home. The second group was cooking and clothes drying and the third grouping was heating of water for domestic use. Profiles of the integrated amount of energy used during each hour of the day for the various categories of energy usage were developed for 1977 by utilizing a wide variety of references and are shown on the opposite page. From the data examined, it was hypothesized that an annual usage of 5540 kWh would be representative of the diversified energy usage by a typical family of four persons in 1977. Since lights and some appliances ( e. g. , refrigeration equipment and HVAC auxiliaries) do have seasonal variations in their use, profiles for four seasons were developed. No significant regional variations were found. The cooking and clothes drying profile was found to have negligible seasonal and regional variations, and their annual load was determined to be 1980 kWh for the 1977 time period. An annual hot water load was similarly determined at 4940 kWh/year but a regional correction was applied to both the hourly profile and the annual value to account for difference in ground temperature across the countcy. Seasonal variations were again negligible.
All the profiles and annual values developed for 1977 were modified for projected usage trends in 1986 according to the rationale indicated below. The table below summarizes the annual projections for the thirteen sites for the 1986 time period.
ANNUAL ELECTRICAL LOAD PROJECTIONS FOR 1986
1986 PROJECTION DIVERSIF1ED COOKING CLOTHES DHW EFFECTS REGION LOAD LOAD DRY LOAD LOAD
kWh kWh kWh kWh DIVERSIF1ED, USAGE DECREASED
~ 1 BOSTON 5040 821 983 4813
DEMAND BY 1%/YR = 9% 2 WASHINGTON, D. C. 5040 821 983 4667 3 CHARLESTON 5040 821 983 4000
COOKING& COOKING DOWN 1. 5%/YR 4 MIAMI 5040 821 983 4267 CLOTHES DRYING DRYING DOWN 1/2%/YR 5 BISMARCK 5040 821 983 4546
TOTAL: 9. 3% DECREASE 6 MADISON 5040 821 983 4711 7 OMAHA 5040 821 983 4534
DOMESTIC CONSERVATION
~ 8 FORT WORTH 5040 821 983 3699
HOT WATER MEASURES REDUCE 9 NASHVILLE 5040 821 983 4011 BY 10% 10 PHOENIX 5040 821 983 3689
11 ALBUQUERQUE 5040 821 983 4800 12 SEATTLE 5040 821 983 4133 13 SANTA MARIA 5040 821 983 4145
18
F bu
f9 ~
Fl ~
~ L:d
r, ~
Fi ~
~ ~
Fl b&l
Fl kl
~ liiiJ
rt kd
Fi ~
Fl killi
D . .
D

F b
D '
Fl ~
D
D I
Fl bd
r1 LJ
D
n bJ
r1 w
1.6
1.4
1.Z
i 1.0
I
C
:ii 0.8 ::, > C) a: Ill z 0.6 Ill
o.•
0.2
0
WINTER
ENERGY USED: 17.97 kWlvDAY
M 2AM 4 6 8 IDNOONZPM 4 6
HOURS OF DAY
1,2
I.D
.c:: D.8
~ I
Iii ! 0.6
I w 0.4
0.2
8
DAILY PROFILES
1977 LOAD P~OFILES
10 M
0.8
.c:: 0.6
~ I
Iii ! 0.4
~ ! o.z
-- COMBINED LDAD: 5.42 kWh/DAY • ---- CLOTHES DRYING LOAD: 2.82 k\Yh/DAY ·-•• .. , COOKING LOAD: 2,60 kWh/DAY
M ZAM 4 10 NOON 2PM 4
HOUR OF DAY
NORMAL ENERGY USE: 13.53 kWlv'DAY
.r--~------.... __________ .r ___ ,---r---
VACATION Z.87 kWh/DAY
10 NOON2PM 4
HOUR OF DAY
10 M
10 M
19

20
8. SYSTEM DEFINITION
The candidate systems for detailed performance and economic analysis were screened from a large number of possible concepts developed from various subsystem combinations. All cases included photovoltaic generation, either alone or in combination with solar heating and cooling systems. When solar thermal energy collectors were considered, they were incorporated into side-by-side configurations with photovoltaic collectors, or were combined with the photovoltaic elements into a single collector design. In addition to defining system categories according to their solar collector configurations, other attributes were considered '\\hi ch included: (1) residential load characteristics; (2) electrical and fossil energy alternatives for meeting these loads; (3) the types of equipment available for heating and cooling; (4) the use of energy storage or, alternatively, the sellback of excess PV generation to the local utility; and (5) different fwictional arrangements of the equipment.
The systems selected for detailed performance analysis as a result of the screening process are listed in the table on the top of the opposite page.
The screening process eliminated systems or subsystems on the basis of previous experience and engineering judgment. In some instances, limited performance analyses were completed and systems showing similar performance were dropped. The table on the bottom of the opposite page summarizes many of the systems and subsystems dropped and the reason for their elimination.
Fl ~
F: w
rl bd
F1 ~
fl ~
Fl bJ
~ bgJ
w rJ IJ

A ! '
bJ
I '
6J SYSTEM
I(a)
(a)'
(d)
(c)
(b)
(e)
(f)
II(a)
(b)
(c)
(d)
ID(a)
(b)
,-SYSTEM SCREENING 1 •
RESULTS
SYSTEMS SELECTED FOR DETAILED ANALYSIS
APPLICABLE SOLAR ARRAY POWER CLIMATE
TYPE STORAGE CONDITIONING COOLING HEATING HOT WATER TYPE
PV-ONLY (FLAT PANEL) YES DIRECT CHARGE HEAT PUMP (HP) HEAT PUMP (HP) ELECTRIC HOT/COLD
YES DIRECT CHARGE PLUS HP HP ELECTRIC HOT/COLD NIGHT-TIME CHARGE
YES MAX PWR TRACK HP HP · ELECTRIC HOT/COLD
NO MAX PWR TRACK HP HP ELECTRIC HOT/COLD
• NO MAX PWR TRACK HP FOSSIL FOSSIL HOT/COLD
PV-ONLY (2-AXISCONCENTRATOR) NO MAX PWR TRACK HP HP ELECTRIC HOT/COLD
' NO MAX PWR TRACK HP FOSSIL FOSSIL HOT/COLD
SIDE-BY-SIDE PV & THERMAL NO MAX PWR TRACK HP HP/SOLAR ELEC/SOLAR COLD
NO MAX PWR TRACK HP FOSSIL/SOLAR FOSSIL/SOLAR COLD
NO MAX PWR TRACK SOLAR DRIVEN HP HP/SOLAR ELEC/SOLAR HOT
NO MAX PWR TRACK FOSSIL/SOLAR FOSSIL/ SOLAR FOSSIL/SOLAR HOT ABSORPTION
COMBINED PV /THERMAL NO MAX PWR TRACK HP HP/SOLAR ELEC/SOLAR COLD
NO MAX PWR TRACK HP FOSSIL/SOLAR FOSSIL/SOLAR COLD
SYSTEM AND SUBSYSTEM OPTIONS ELIMINATED
SYSTEM REASON DROPPED ·-
SOLAR-DRIVEN HEAT ENGINES FOR ELECTRICITY • TOO COMPLICATED FOR RESIDENTIAL APPLI-CATIONS
OFF-ROOF MOUNTED COLLECTOR ARRAYS • ROOF IS CONVENIENT AVAILABLE AREA WHICH DOES NOT USE MORE REAL ESTATE
• PIPING & ELECTRICAL WIRING REQUIREMENTS ARE LESS REDUCING COSTS, MAINTENANCE, AND LOSSES
STAND-ALONE SYSTEMS • HIGHER CAPITAL COSTS AND MAINTENANCE REQUIREMENTS
• POTENTIAL PROBLEMS WITH ENERGY MANAGE-MENT TO MEET PEAK POWER CAPABILITY
DIRECT DC EQUIPMENT • MAJORITY OF HOME EQUIPMENT REQUIRES AC
NIGHTTIME BATTERY CHARGING • NEGLIGIBLE IMPROVEMENTS IN BENEFITS SHOWN FOR CLIMATE EXTREMES, PHOENIX AND BOSTON
MAXIMUM POWER BATTERY CHARGE • NEGLIGIBLE DIFFERENCES WITH DIRECT CHARGE BATTERY SYSTEM
LO-HI TEMPERATURE COLLECTORS IN SERIES • PRE-HEAT NOT USEFUL --TEMP. DROP IN RANKINE OR ABSORPTION EQUIPMENT ONLY 5. 6°C(l0°F) I LO-TEMP HI-TEMP
COOLING COLLECTOR COLLECTOR
HEATING & HOT WATER
SIDE-BY-SIDE PV & COMBINED PV/THERMAL • COMBINED PV /THERMAL COLLECTOR CAN BE EVALUATED INDEPENDENTLY
SIDE-BY-SIDE THERMAL & COMBINED PV/THERMAL • COMBINED PV /THERMAL COLLECTORS CAN BE EVALUATED INDEPENDENTLY
21
9. ANAL VTICAL MODELS
22
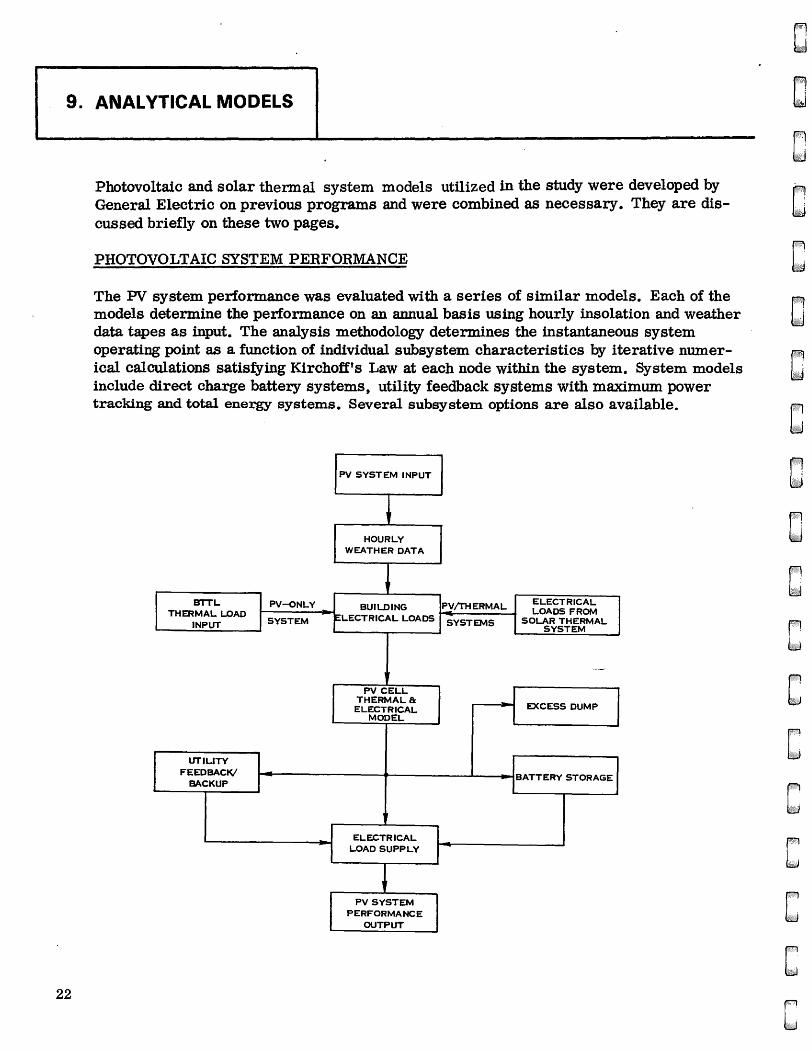
Photovoltaic and solar thermal system models utilized in the study were developed by General Electric on previous programs and were combined as necessary. They are discussed briefly on these two pages.
PHOTOVOLTAIC SYSTEM PERFORMANCE
The PV system performance was evaluated with a series of similar models. Each of the models determine the performance on an annual basis using hourly insolation and weather data tapes as input. The analysis methodology determines the instantaneous system operating point as a function of individual subsystem characteristics by iterative numerical calculations satisfying Kirchoff's Law at each node within the system. System models include direct charge battery systems, utility feedback systems with maximum power tracking and total energy systems. Several subsystem options are also available.
PV SYSTEM INPUT
HOURLY WEATHER DATA
BTTL PV-ONLV BUILDING PV/THERMAL ELECTRICAL THERMAL LOAD - LOADS FROM - ELECTRICAL LOADS SYSTEM SYSTEMS SOLAR THERMAL INPUT SYSTEM
---,, PV CELL
THERMAL& EXCESS DUMP ELECTRICAL
MODEL
UTILITY FEEDBACK/ BATTERY STORAGE
BACKUP
ELECTRICAL -LOAD SUPPLY -
PV SYSTEM PERFORMANCE
OUTPUT
[77) ~
~ ~
rry ~
C CJ
'
.
' C C .
C '
C C C
C

r i
ANALYTICAL MODELS
SOLAR THERMAL SYSTEM PERFORMANCE
The Solar System Simulation (SSS) program simulates the performance of thermal systems through mathematic models of the system components and appropriate logic to model the interaction of these components within the specified system on an hour-by-hour basis. Hourly solar radiation, meteorological. data, building energy requirements from tapes and system configuration data are input to the program.
Several space heating, cooling and domestic water heating system options are available in the program. The cooling options consist of a solar Rankine-driven heat pump system and an absorption air conditioner system. The performance of each system is calculated from actual unit performance curves. The heating mode is modeled as a conventional air-cooled heat exchanger system. All parasitic power requirements are taken into accollllt in the program and the appropriate portions of the pumping energy are utilized in meeting the building heating demand. All solar heating and cooling control schemes have auxiliary back-up systems with either an electric heat pump or fossil fuel system.
SYSTEM INPUT
HOURLY WEATHER AN 01.J.R RADIATION DAT
BUILDING HEATING/COOLING
DEMANDS
COLLECTOR MODELS VACUUM TUBE/FLAT PLATE
(AIR OR LIQUID)
THERMAL STORAGE UNIT
HEATING COOLING
HEAT EXCHANGER
SYSTEM
ABSORPTION AIR CONDITIONER
SYSTEM
HEAT PUMP OR FOSSIL FUEL
AUXILIARY SYSTEM
HOURLY, DAILY, MONTHLY AND YEARLY SYSTEM
PERFORMANCE PRINTOUT
SOIJ.R RANKINE DRIVEN HEAT
PUMP SYSTEM
23

10. ECONOMIC MODEL
24
True life cycle cost analysis must necessarily consider the timing of costs and benefits as well as the magnitude. A method employed in previous General Electric solar and wind energy programs is to compare Levelized Annual Benefits (LAB), representing system energy savings, with the Levelized Annual Cost (LAC), the levelized dollar amount required to own, operate, and maintain a system during each year of the life of the system. Specifically, the levelized annual cost accounts for:
1. "Paying off' system capital costs (mortgage principal)
2. Paying mortgage interest
3. Paying property taxes and insurance
4. Paying operating and maintenance expenses
The levelized annual cost, illustrated graphically below, is the product of the capital recovery factor (CRF), which is equivalent to the Fixed Charge Rate (FCR) in the study since no property taxes were included, and the present value of the year-by-year cash requirements throughout the system life. The capital recovery factor is the uniform periodic payment, as a fraction of the original principal, that will fully repay a loan (including all interest) in yearly periods over the loan lifetime at a specified yearly interest rateo The interest rate used to calculate CRF is called the discount rate and is equal to the weighted average after-tax cost of capital.
The present value is analogous to that amount which, if deposited in an account bearing interest at the discount rate, would permit annual withdrawals to pay all system costs and diminish to zero at the end of system life.
Variable system costs include operation and maintenance which would most likely tend to increase with inflation and component replacement and overhaul which would depend on servicing schedules.
CAPITALIZATION OF ANNUAL COSTS
PRESENT WORTH LEVELIZED
---------- EQUIVALENT YEAR
F1 ~
F' ~
C '
Fl ~
~ ~
r kd
~ ~
~ bid
Fl ~
~ ~
F1 ~
Fl ~
F ~
r b0
~ ~

f9 I
ECONOMIC MODEL
Levelized annual cost can be computed in constant or current year dollars. The former is more meaningful since comparisons with present data are easier. It is very often more representative of the actual costs - that ls, they are more likely to stay constant in constant year dollars then in current year dollars. The constant dollar levelized annual cost is computed from a capital recovery factor which is based on the real, or inflation adjusted, discount rate.
The comparison of the energy cost savings of the solar system to the levelized annual cost is accomplished by computing the levelized annual benefits (LAB) for the energy savings. LAB is inherently a function of present and projected energy prices. It is simply the product of the price of energy with the annual energy saved by the solar system together with a multiplier defined as the levelized value of an escalating cost stream in constant year dollars. This last term accounts for the rate of energy price escalation over the lifetime of the system.
The economic viability of a system can be measured through the use of the cost-to-benefit ratio which is defined as the ratio of the levelized annual cost to the levelized annual benefits. The system becomes economically viable when the cost-to-benefit ratio is less than unity. The break-even system cost occurs when the ratio is exactly unity; i.e., when LAC and LAB are equal.
25

1.
26
11. COST DATA
Costs for the various systems analyzed were developed in 1975 dollars based on actual manufacturer data, whenever possible, or on cost estimates using available drawings and assuming large quantity manufacturing production. Variations in the costs existed for many of the subsystems, so a set of governing assumptions was made for comparison between the systems and regions of the country. These assumptions included inputs required for the economic model such as inflation rate, fuel price escalation rate and operating and maintenance costs. These are summarized in the table below. No property taxes were included, assuming state or federal tax credits for solar systems available in 1986. The projected thermal system costs and combined system costs were assumed at two times the projected PV system costs. These assumptions were used in the costto-benefit ratio comparison between systems and regions but results were developed for various sets of economic assumptions to allow for different economic scenarios.
BASIC RANKING ECONOMIC ASSUMPTIONS
1986 START OF OPERATION
GENERAL INFLATION RATE
MORTGAGE RATE
TAX BRACKET
ADDITIONAL PROPERTY TAXES
INSURANCE
OPERATION & MAINTENANCE
ENERGY PRICE ESCALATION RATE
SELLBACK-TO-BUY RATIO
SYSTEM LIFE
BATTERY LIFE
ARRAY COST
BATTERY COST
BALANCE-OF-PV PLANT COSTS:
WITH STORAGE
VARIABLE $26. 20/m 2
FIXED $3832
= 5%
= 10%
= 30%
= 0
0. 5% OF CAPITAL COST
$50/YR
= 2%, 4%, 6% ABOVE INFLATION
0.5
= 20 YRS
= 10 YRS
$500/kWP (FOB) ($660/kWp@ SITE)
$25/kWh OF NAMEPLATE RATING
WITHOUT STORAGE
$34. 20/m 2
$1047
THERMAL SYSTEM-TO-PV SYSTEM COST RATIO = 2:1
COMBINED SYSTEM COST SAME AS THERMAL-ONLY SYSTEM COST
F ~
r, ~
' C r' ~
~ ~
C ~ ~
r, ~
r, ~
~ ~
C ·Ci,::::,:
x:,··
C .
C

I
bJ
COST DATA
A key system trade-off was the PV-only system with battery storage versus that system with utility sellback. As indicated on the previous page, a sellback rate of 50% of the buy rate was assumed. The assumed balance-of-plant cost comparison for these two options is further outlined below in terms of fixed and variable costs. The costs include a 15% markup for the distributor and 15%. mark-up for the contractor who would install the system.
ELECTRICAL BALANCE-OF-PLANT COSTS FOR RESIDENTIAL PV SYSTEM
Energy Storage Option Cost Element With Without
Array Material & Installation $10.20/m2 $10.20/m2
(Based on PV Shingles)
DC/ AC Inverter ( $ 190/kVA) $16.00/m2 $24.00/m2
Total Variables Cost $26.20/m2 $34.20/m2
------------ -------·-- ----Battery Shelter $1660/System ---Shunt Charge Regulator $ 590/System ---
Lightning Protection $ 674/System $ 67 4/System
Electrical Equip & Installation $ 908/System $ 373/System
Total Fixed Cost $ 3832/System $1047/System
27

28
12.SUBSYSTEM PERFORMANCE
PV COLLECTORS
The PV solar array design was nominally based on the PV shingle concept developed by General Electric in the PV Conceptual Design Studies (AL0-3686-01). Each shingle, as shown below, contains 19 solar cells wired in series having a total cell area of 419. 2 cm2• The exposed portion of the shingle is hexagonal in shape with an area of 507 cm2 yielding a packing factor of O. 827. The module uses silicon solar cells with an unencapsulated airmass- one efficiency of 13. 4% at 28°C. The module efficiency at 28°C is 14. 3% with the increase due to internal reflected energy from intercell regions, ("Zero- Depth Concen-trator11 effect). I
BATTERY
23991 . 47( l;.,t77tG 1 SEA, NO, •SH•31
2 3 4 6
GEN ERAL . ELECTRIC'
•
The battery charge and discharge voltage was modeled as a function of battery state of charge and instantaneous charge or discharge rate according to specific characteristic curves supplied by C&D Batteries Division of the Eltra Company. The average round trip efficiency of the battery, therefore, varied as function of battery capacity and collector area in the range of 75-88%. For the nominal condition of a 95 m2 array and 40 k¥lh battery capacity, the average round trip efficiency was 83%.
Fl I
rr I '
bJ
SUBSYSTEM PERFORMANCE
THERMAL COLLECTORS
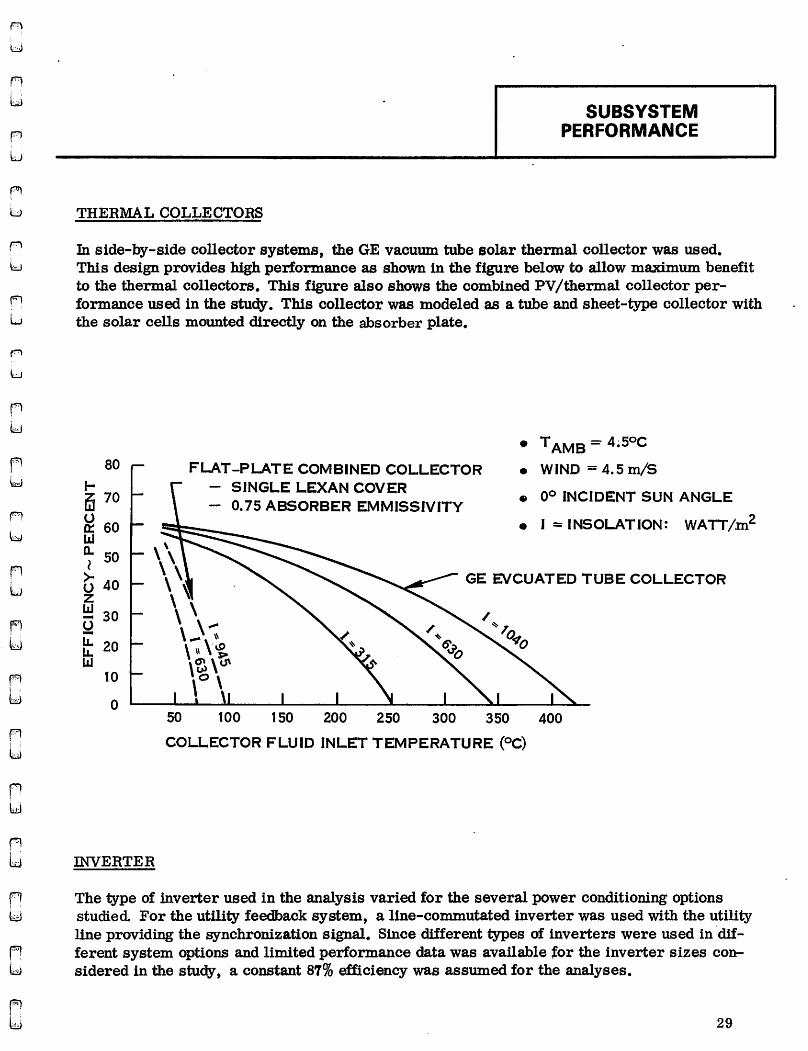
In side-by-side collector systems, the GE vacuum tube solar therm.al collector was used. This design provides high performance as shown in the figure below to allow maximum benefit to the thermal collectors. This figure also shows the combined PV /thermal collector performance used in the study. This collector was modeled as a tube and sheet-type collector with the solar cells mounted directly on the absorber plate.
80 1-ffi 70
~ 60 I.LI a. 50 l
G 40 z ~ 30 u -1.1.. 20 1.1.. I.LI
10
0
INVERTER
• T AMB = 4;5oc
FLAT -PLATE COMBINED COLLECTOR • WIND = 4.5 m/S SINGLE LEXAN COVER
- O. 75 ABSORBER EMMISSIVITY • 0° INCIDENT SUN ANGLE
• I = INSOLATION: WATT/m2
GE EVCUATED TUBE COLLECTOR
50 100 150 200 250 300 350 400
COLLECTOR FLUID INLET TEMPERATURE (°C)
The type of inverter used in the analysis varied for the several power conditioning options studied For the utility feedback system, a line-commutated inverter was used with the utility line providing the synchronization signal. Since different types of inverters were used in ·different system options and limited performance data was available tor the inverter sizes considered in the study, a constant 87% efficiency was assumed for the analyses.
29
30
13. SUMMARY OF ECONOMIC VIABILITY
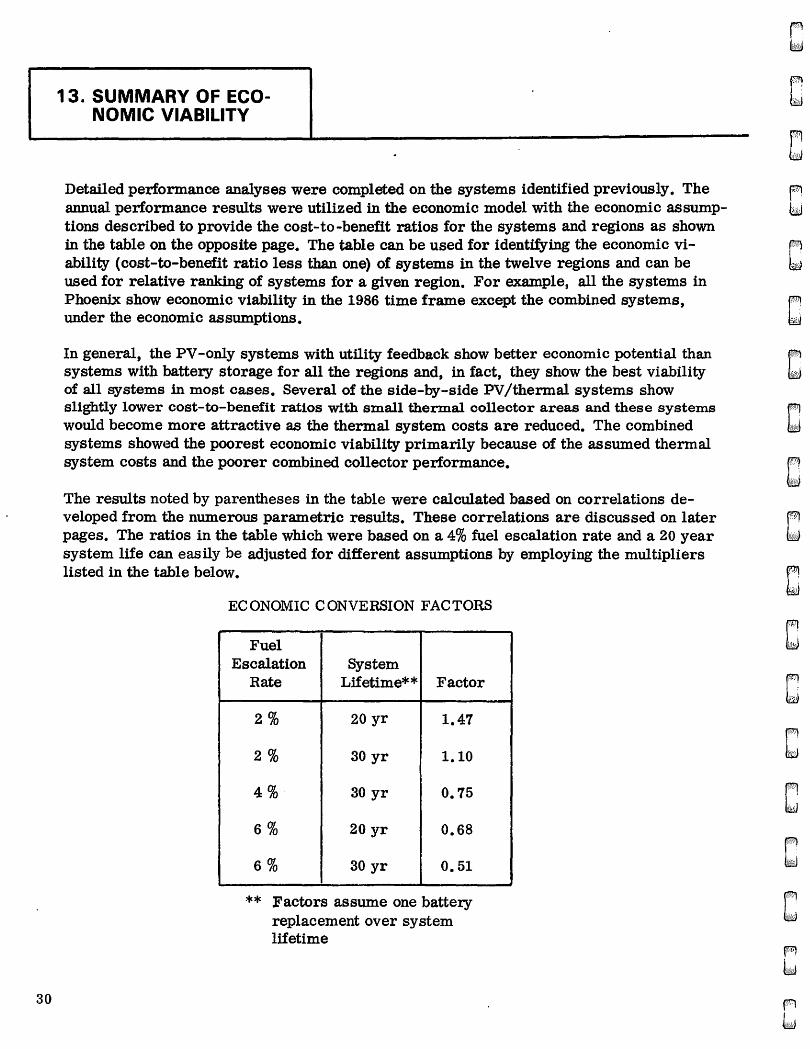
Detailed performance analyses were completed on the systems identified previously. The annual performance results were utilized in the economic model with the economic assumptions described to provide the cost-to-benefit ratios for the systems and regions as shown in the table on the opposite page. The table can be used for identifying the economic viability ( cost-to-benefit ratio less than one) of systems in the twelve regions and can be used for relative ranking of systems for a given region. For example, all the systems in Phoenix show economic viability in the 1986 time frame except the combined systems, under the economic assumptions.
In general, the PV-only systems with utility feedback show better economic potential than systems with battery storage for all the regions and, in fact, they show the best viability of all systems in most cases. Several of the side-by-side PV/thermal systems show slightly lower cost-to-benefit ratios with small therm.al collector areas and these systems would become more attractive as the thermal system costs are reduced. The combined systems showed the poorest economic viability primarily because of the assumed thermal system costs and the poorer combined collector performance.
The results noted by parentheses in the table were calculated based on correlations developed from the numerous parametric results. These correlations are discussed on later pages. The ratios in the table which were based on a 4% fuel escalation rate and a 20 year system life can easily be adjusted for different assumptions by employing the multipliers listed in the table below.
ECONOMIC CONVERSION FACTORS
Fuel Escalation System
Rate Lifetime** Factor
2% 20 yr 1.47
2% 30 yr 1.10
4% 30 yr 0.75
6% 20 yr 0.68
6% 30 yr 0.51
** Factors assume one battery replacement over system lifetime
F ~
r, ~
r, ~
f) ~
Fl lmJ
~ ~
r1 te&J
~ ~
~ ~
~ fu:lJ
fWl ~
Fl ~
F ~
C '

RELATIVE RANKING OF RESIDENTIAL SYSTEM PERFORMANCE AND ECONOMICS THROUGH COST-TO-BENEFIT RATIO
. -~!a,
:?'e"'
~I
PV-ONLY SYSTEMS ~ CONCENTRA TOR-,I SHINGLE ,---- SIDE-BY-SIDE SYSTEMS--,
l(a) I(a)' l(b) l(c) I(d) I(e) I(() Il(a) II(b) ll(c) U(d) ELEC'ltU\; ~~l)U., RANKlNt; ABSORP·.nuN
~ DIR.CHG. NIGHTTIME FOSSIL ALL MAX. TRACK ALL FOSSIL SOLAR SOLAR ELECTRIC FOSSIL Q'1'0DAflE CHARGE HEAT ELECTRIC STORAGE ELECTRIC HEAT HEAT HEAT R.Ar.K UP BACK UP
RE 95 m2 95 m2 95 m2 95m2 95 m2 32 m~ 32 m2 95 m2 95 m2 95 m2 95 m2
1. BOSTON 1.13 1.00 0.96 o. 87 1.64 1.82 o. 87 0.96 o. 85 9.95 (0%)* (0%) (7%) (131,)
2. WASHINGTON, D. C. (1. 59) (1.37) 1.20 2.49 2.75
3. CHARLESTON (1. 43) (1.24) 1.00 2.17 2.41
4. MIAMI (1. 34) (1.16) o. 96 2.10 2.33 o. 91 (5%)
5. BISMARCK (1. 59) 1.36 1.15 1. 95 2.16 1.15 1.36 (0%) (0%)
6. MADISON (1. 65) (1.42) 1. 24 2.37 2.64
7. OMAHA (1. 69) (1.46) 1. 26 2.16 2.40
8. FORT WORTH _1. 90 1.67 1. 53 2. 73 3.03 1.48 1.63 (3%) (191,)
9. NASHVILLE (2.10) 1. 85 1.62 3.12 3.46 1. 56 1.85 (6%) (0%)
10. PHOENIX 0.83 0.82 0.69 0.64 o. 83 o. 88 o. 97 0.61 0.69 0.63 0.76 (4%) (0%) (5%) (4%)
IL ALBUQUERQUE (1.11) 1.00 o. 89 1.20 1.34 0.85 1.00 0.84 (6%) {0%) (7%)
12. SEATTLE (6.78) (5. 86) 5.40 10. 58 11.76
13. SANTA MARIA (1.44) (1.24) 1.14 1. 82 2.02
NOTES: TABLE BASED ON 20-YR. LIFE AND4% ESCALATION RATE *OPTIMUM PERCENT THERMAL COLLECTOR AREA **ADJUSTMENT FACTOR ASSUMES ONE BATTERY REPLACEMENT OVER SYSTEM LIFETIME () RESULTS BASED ON CORRELATION DISCUSSED IN SECTION 12, VOLUME II
.-COMBINED SYSTEMS-, III(a) III(b)
t;Lt:l:.LJ:\l\; ~~u..,
SOLAR SOLAR HEA\ 26m
HEA~-26m
1.65 1. 99
3. 72 3,06
2. 86 4.06
1.20 1.76
n 0
n~ o• s:-1 -a9 ,-m :II m -2 cnm o-n z=i

14. COMPARISON OF PV SYSTEM PERFORMANCE
32
PV-ONLY SYSTEMS WITH STORAGE
Monthly performance of the PV-only system with storage is illustrated on the upper plot on the opposite page for site locations in Phoenix and Boston which represent extreme climatic conditions. The loads for this system at both sites were based on an all-electrical residence including heating and cooling. The peak for the Phoenix house corresponds to the summer cooling load, while the peak with the Boston residence corresponds to the winter heating load. Since the Phoenix maximum demand is in phase with the months of peak generation, the PV system is quite effective in supplying a high percentage of the total annual usage, as indicated by the near coincidence of curves for output and load on the Phoenix plot. The reverse is true for Boston since the peak heating demand is out of phase with the months of peak PV generation.
For both the Phoenix and Boston locations, the 95 m2 system exhibits a significant amount of excess generation that must be therm.ally discarded. As one would expect, the excess output occurs during the seasons of lowest load demand.
For the Phoenix location, both the maximum power tracker and the direct charge system were carefully modeled and analyzed using the identical weather data for both systems. Comparison of performance for the two systems in the upper plot on the opposite page indicated no appreciable difference between the two approaches.
PV-ONLY SYSTEMS WITHOUT ENERGY STORAGE
The solar array considered for this system is identical to that used for the system with storage. The instantaneous array output will be greater or smaller than the residence demand so the modes of operation were to "sellback" the excess output to the local utility, or to receive "makeup" power from the utility. These modes of operation are illustrated on a monthly basis on the lower plot on the opposite page for the Phoenix and Boston locations. The net energy to and from the utility is the algebraic difference of the sellback and makeup energy that occurs each day, with sellback occurring during daylight hours (assuming sufficient illumination) and makeup being required at night. Because of the different cost value attached to makeup and sellback energy, it is necessary to keep a careful accounting of these energy components in determining the economic worth of this type of system. The total system output can exceed the demand on an annual basis since no energy is lost. Correlations for the system performance for all the regions are shown on the succeeding pages.
f'9 ~
C C ~ ~
~ ~
f821
~
~ ~
~ ~
C .
~ ~
C FJ ~
F7! ~
C
Fl ~

C '
F) ~
F1 w
I
>(!) a:: w ~ 1 >-..J :::c 1-
5 :E
0
COMPARISON OF PV SYSTEM PERFORMANCE
MONTHLY PERFORMANCE OF PV-ONLY SYSTEM WITH STORAGE
IPl:IOENIX
• BATTERY CAPACITY: 40 kWh • ARRAY AREA: 95 m2
LOAD OUTPUT DIRECT CHARGE SYSTEM - l(a)
2
0
I BOSTON I • BATTERY CAPACITY: 40 kWh
• ARRAY AREA: 95 m2
OUTPUT -SYSTEM - I(•)
JFMAMJJASOND JFMAMJJASOND
2 .r: 3: :E
I
> (!) a: LL.I z 1 LL.I
> ..I ::c I-
a ii
0 J
MONTHLY PERFORMANCE OF PV-ONLY SYSTEM WITHOUT STORAGE
NET TO UTILITY
NET FROM UTILITY 2
PV SYSTEM .r: NET TO UTILITY OUTPUT 3:
~ I
> (!) a: LL.I ffi 1
> ..J LOAD
LOAD J: PV OUTPUT I PHOENIX I I- I BOSTON I SYSTEM a :E
0 F MA M J J A S ON D J F MA M J J A S 0 N D
33

15. CORRELATION OF PVONL Y SYSTEM OUTPUT
34
The annual PV system output was correlated as a function of cell efficiency, packing factor, heating and cooling degree days and annual total horizontal insolation. The correlations with and without storage based on the hour-by-hour system performance analyses are illustrated below. The annual energy output function, E0 , is seen to vary linearly with annual total horizontal insolation. The function 'E0 is related to the actual PV system output, E~, through the correlation expression
E = 0
.E' 0
11* PF* PF (1 + O. 006~) (in kWh/m2)
where T/ and PF are the cell efficiency and module packing factor with the (*) superscript indicating the reference study values of 13. 3% and O. 827 respectively. ¢ is a corresponding factor related to cooling degree days (CDD) and heating degree-days (HDD) by the expression
¢= CDD-HDD 365
For a specified cell efficiency and packing factor, these correlations provide an estimate of annual PV system output for any region or site once insolation and degree-day data are retrieved for that region.
250
N' 200
I 0 0
II.LI
..: ::::> a. ~ 0
~ 0:: I.LI
~ .J <( ::::> z z <
150
100
so
CORRECTED TO REFERENCE TEMPERATURE WITHOUT STORAGE
84 1 BOSTON
s-,f / 2 WASH. D.C. 3 CHARLESTON
9 10 4 MIAMI /
AWITH STORAGE
5 BISMARCK 1\ 6 MADISON
7 OMAHA 8 FT.WORTH 9 NASHVILLE
10 PHOENIX 11 ALBUQUERQUE 12 SEATTLE 13 SANTA MARIA
0----------------"----------' 1000 2000 3000
ANNUAL TOTAL HORIZONTAL INSOLATION.. i H' (kWh/m2)
C ~ ~
C '
'
F} ~
rl ~
fWl w ~ ~
~ ~
r} ~
~ ~
Fl ~
~ bd
~ ~
Fl ~

I
bJ
F w
CORRELATION OF ENERGY SELLBACK SYSTEM
OUTPUT
Systems without storage require the determination of both sellback energy to the utility (Es) and that portion of the total load that can be served by the PV system ref erred to as "direct energy" (E'n), for economic analysis. For this reason, sellback and direct energy were correlated as a function of array area and annual total horizontal insolation. The results for a 95 m2 array are shown below for an all-electric system. The linear fit of the actual performance data for the regions shown represents the best estimates for both Es and En which sum up to E0 • The correlation can be adjusted for different array areas by the following expression:
Es i
0
= ~ (~) .6 3 95
where A is the array area in m2.
250
200
cG' a } 150 0
~ 0:: bl
ffi ..J 100 ,c( :, z z ,c(
50
CORRECTED TO REFERENCE TEMPERATURE
• 95 m2 ARRAY AREA
- 2 -~Se! 3 EO
- ·1 -EDE! 3 EO
1000 2000
ANNUAL TOTAL HORIZONTAL INSOLATION, iH'(kWh/m2)
1 BOSTON 2 WASH. D.C. 3 CHARLESTON 4 MIAMI 5 BISMARCK 6 MADISON 7 OMAHA 8 FT. WORTH 9 NASHVILLE
10 PHOENIX 11 ALBUQUERQUE 12 SEATTLE 13 SANTA MARIA
3000
35

116. SIDE-BY-SIDE SYSTEMS I
36
Side-by-side systems are designed so that different sections of the residence roof produce different forms of solar conversion. One section produces electricity by PV conversion, and the second section collects either low-temperature thermal energy for space beating and domestic hot water production or high-temperature output for use in heat engines or absorption chillers. The four different side-by-side configurations analyzed during the study are diagrammed below. Only the utility feedback case was considered since it shows better economic viability than the system with battery storage from previous study results.
II (a) AU.. ELECTRIC. SOLAR SUPPLEMENTED HEAT
BACK UP
PV ARRAY
THERMAL ARRAY TES
DC/AC INVERT.
GENERAL LOADS
HEAT PUMP
Har WATER
II (c) AU- ELECTRIC, SOLAR DRIVEN COOLING
PV ARRAY
THERMAL ARRAY TES
DC/AC INVERT.
RANKINE ENGINE
BACK UP
GENERAL LOADS
HEAT PUMP
HaT WATER
PV ARRAY
THERMAL ARRAY TES FURNACE
FOSSIL FUEL
DC/AC INVERT.
BACK UP
GENERAL LOADS
HEAT PUMP
(COOLING)
HEATING
Har WATER
II (d) ELECTRIC/FOSSIL, SOIJ.R ABSORPTION COOLING
PV ARRAY
THERMAL ARRAY
BACK UP
~----------11 ~C/AC I t l~ENER INVERT. H LOADS
TES FURNACE
FOSSIL FUEL
ABSORP, CHILLER
HEATING
HOT WATER
Fl 6iliJ
~ ~
~ ~
~ I '
Cl ,
.
f9 ~
rrri ~
~ ~
~ ~
Cl ~ ~
~ ~
~ w
Fl ~
Ft ~
~ ~

r u
0 .
A w
SIDE-BY-SIDE SYSTEM PERFORMANCE
Performance analysis of these systems produced the annual outputs shown below for the Boston and Phoenix locations as a function of the percentage of the roof area devoted to the PV and therm.al collectors. Evacuated tube collectors were used as the thermal collectors. The PV output is proportional to the PV area since the sellback mode allows full utilization of the collected energy. The therm.al output which is defined as the useful solar energy contributed to the residence needs, on the other hand, is a strong function of energy demand on the system. The curves show a diminishing rate of solar utilization with larger collector areas resulting principally from tbe mismatch of generation and demand and the consequent need to discard large amounts of energy. This trend is particularly true for space and domestic hot water heating systems II(a) and Il(b) (on the opposite page) in the Phoenix location where the extreme low thermal requirements could be satisfied by thermal collectors covering only about 10% of the roof area. The annual energy outputs for space heating, cooling and domestic hot water systems, II(c) and Il(d), are higher than that of the Il(a, b) systems as the otherwise discarded energy collected during summer months can be utilized for cooling. The increase in output also reflects the relative magnitude of heating and cooling loads in a given location. The Phoenix residence ha~ significantly l_arger cooJing load than heati~g load, while in the Boston residence, the cooling load is relatively small. The cooling system employing an absorption chiller, (ll(d)) yields better system performance th.an the one using a Rankinedriven heat pump configuration (Il(c)) as indicated by the higher annual output curves for II(d) system. This is due to the fact that the absorption chiller requires a lower solar temperature than the Rankine system, and thus, the collector can operate at a higher efficiency and consequently, higher energy output.
2
! 5 IL
§ ~ ~ lD .J < :::> z z <
25
20
15
10
5
0
0 I
100
• TOTALCOLLECTORAREA 95 m2
• LIQUID THERMAL COLLECTORS
BOSTON 25 PHOENIX
20 ,... .c
II (d) ;:
11 (c) ~
5 15 IL I-
B ~
10 In > lD
PV SYSTEM .J II (a,b,c,d) < :::> z 5 z
c(
THERMAL 0 THERMAL 20 40 60 80 100 0 20 40 60 SO 100 I I I I I PV I -------1 __...__._1__.____.1___......__.1 PV
80 60 40 20 0 100 80 60 40 20 0
PERCENT COLLECTOR AREA PERCENT COLLECTOR AREA
37

38
17. COMBINED PV / THERMAL SYSTEMS
In these systems, the solar collectors are designed to both generate electricity and capture thermal energy. This is accomplished by placing solar cells in the optical path through the collector and providing a means for conducting away the thermal energy not converted to electricity. Both air and liquid means of removing the thermal energy are under development. Since the thermal energy must be at a somewhat elevated temperature to be of use, there is usually a corresponding sacrifice in PV output because of the solar cell's negative output dependency with temperature. Two system variations are illustrated below.
Configuration ill(a) uses the captured thermal energy to supplement space heating and hot water production. Since highly elevated temperatures would significantly sacrifice PV output, no cooling applications of this concept were considered.
For this reason, the regions for which this system was analyzed generally involve cooler climates. Configuration ill(b) is identical to fil(a) except that fossil energy provides heating and hot water with solar thermal supplementation.
Utility feedback is used in both configurations.
lll(a) ALL ELECTRIC, SOLAR SUPPLEMENTED lll(b) ELECTRIC/FOSSIL, SOLAR SUPPLEMENTED
PV DC/AC GENERA PV DC/AC GENERA ARRAY INVERT. LOADS ARRAY INVERT. LOADS
HERMAL ARRAY HEAT ARRAY HEAT
PUMP PUMP (COOL)
HOT
HEATING
TES TES FURNACE
HOT WATER
FOSSIL FUEL
r kd
C I
Fl ~
F ~
~ ~
F1 ~
rt ~
rm ~
ri ~
~ ~
I C
r ~
F" . kw>
C r'1l ~
~ ~
F1 ~
F1 kJ

I
bl
COMBINED PV /THERMAL SYSTEM PERFORMANCE
The electrical and thermal outputs of the systems as a function of collector area in four climate locations are shown below o The PV output is proportional to the collector area since the electricity sellback mode allows full utilization of the collected energy. For a given collector array size, the electrical output is proportional to the available solar insolation as evidenced by the highest annual system output in Phoenix and lowest annual output in Boston and Nashville.
The therm.al output, which is defined as the useful solar energy contributed to the residence needs, is a strong function of energy demand on the system. The system produces the highest energy output in Bismarck where the thermal demand is the greatest. On the other hand, a system with only 30 m2 of collector area can fully satisfy the extremely low therm.al requirements of a Phoenix single family residence.
Comparing the performance of the side-by-side system utilizing the evacuated tube thermal collector with the combined PV /therm.al system in Phoenix, the evacuated tube collector can perform three times better than the combined collector as evidenced by the 3 to 1 ratio in collector area required to meet all the thermal requirements in the two cases.
10
8 -:a 3: 6 I-[ 6
!5 0 ..I
~ 4 z z <
2
PV OUTPUT Ill (a,b)
10
BISMARCK
8 2 3: 6 I-[ 6
!; 0 ..I
~ 4 z z <
2
THERMAL OUTPUT Ill (a·, b)
BISMARCK
Ill (b)
0 '-----'------''------'------
0 ....__ __ i-.__ ____ ____.. ________ _
40 60 100 80 0 20 40 60 80 100 0 20
COLLECTOR AREA (m2) COLLECTOR AREA (m2)
39

I 18. ECONOMIC PARAMETRIC VARIATIONS
40
PV-ONLY SYSTEMS
An economic nomograph for PV-only systems without storage is illustrated below. The levelized annual system costs and benefits are plotted parametrically as a function of array cost, balance-of-plant cost, price of electricity and "utilized" annual PV system output for several electricity price escalation rates. The term "LAB*" refers to the levelized annual benefit at zero relative escalation rate; i.e. , when the electricity price escalates at the same rate as inflation. LAB* is the product of the electricity price, the system output and the ''utilization'' factor, U, which, in tum, is a function of the array area and sellback-to-buy ratio (pS/pE). The utilization factor is defined by
U = 1-f-::):: An example of how to use this nomograph is illustrated by the dotted lines for a utilized annual system output (E' U) of 150 kWh/m2 and BOP costs of $45/m2. For a 1975 electricity price of 3. 5¢/kv!Ji escalating at a rate of 2% above inflation with a 1986 start would require an array cost of about $65/m2 just to break even economically.
Similar curves were developed for systems with battery storage and are included in Volume II of this report.
ELECTRICITY PRICE ESCALATION RATE ABOVE INFLATION
50 __..,. 6
40
0 o~-----:1~0---2~0-----.130
LAB• (f{m2)
CONSTANT 1975 $
LEVEUZED ANNUAL COST & BENEFITS
($/m2)
•zERO RELATIVE ESCALATION RATE
50
40
30
• 5% INFLATION RATE • 10%MORTGAGE RATE • 30%TAX BRACKET • 20 YEAR LIFE • NO ADDITIONAL PROPERTY TAXES
UTILIZED ANNUAL PV SYSTEM OUTPUT, E' U ( kWh/ m 2)
• 0 • - - - - PRESENT ESTIMATE
BALANCE CF PLANT COSTS ~m2).
20 100 ~
50
0
100 150 200
1975 ELECTRICITY PRICE, p (¢/kWh) E
ARRAY COST ($/m2)
r' ~
C '
C F kw
F' ~
F' ~
~ ~
F1 ~
Fl ~
~ ~
r> ~
FkJ
F1 ~
C
C

0 .
C .
ECONOMIC PARAMETRIC VARIATIONS
SIDE-BY-SIDE SYSTEMS
An economic analysis of the side-by-side PV/thermal systems shows that for a given ratio of the cost($ /m2) of the solar thermal system (CT) to that of the PV system (Cpv), there exists an optimum percentage area mix of PV and thermal collection which yields the best overall cost-to-benefit ratio for the system. Typical PV-to-thermal cost ratios, (CT/Cpv ), computed as a function of optimum area mix are shown on the upper plot below for the specific system, region, and ground rules listed. Using this cost ratio curve, the lower plot illustrates the resulting levelized annual cost variation for several values of PV system cost and thermal system cost for escalation rates of O, 2%, 4% and 6% above inflation. The dotted lines represent the corresponding levelized annual benefits as a function of percent thermal collector area. The parametric curves provide an estimate of the optimum thermal collector area and the required electricity price escalation above inflation for the system to be economically viable. Similar curves for each of the systems and regions studied were developed and in-cluded in Volume II of this report.
PARAMETRIC DATA FOR SIDE-BY-SIDE PV/THERMAL SYSTEM WITH ABSORPTION COOLING
2
>
I BOSTON I ARRAY AREA:::: 95 m2
Ps/pE = 0.5
a. 1 ~ c.)
N'
o------------------0 00 ~ ~ 00 100 OPTIMUM PERCENT TfflE_RMAL COLLECTOR AREA
25
PV SYSTEM COST (fv'm2)
20 t 240
THERMAL SYSTEM COST ($/mZ)
240 ! --LAC
! 15
~ .J
3 m :5
10
5
10% MORTGAGE 30% TAX BRACKET
5% INFLATION 1986 START CONSTANT 1975$
0 ,..__ _ ___. __ __.&., __ __._ ______ __,
0 20 40 60 80 100
PERCENT THERMAL COLLECTOR AREA
' 41

19. EXTENSIONS OF PERFORMANCE AND ECONOMIC RESULTS
From the analysis conducted during this study, correlations were developed which can extend the results of the study to various microclimates. These correlations provide: (1) estimates of the electrical heating and cooling load demands of a residence based on the heating and cooling degree day characteristics of the sites to be evaluated; (2) estimates of the annual electrical output for PV systems with and without energy storage for PV systems with electrical or fossil fuel backup heating based on annual insolation; (3) estimates of the economic viability of the system for that site. The restrictions on the use of the correlations include: (1) the correlations for load requirement can be applied to all regions but are limited to heat pump heating or cooling or resistance heating; (2) PV-only system performance with or without storage has been correlated and these values can be extended to initial side-by-side system performance, (3) the economic correlations can only be applied to PV-only systems.
The principal factors which characterize the climate for a particular site relative to solar system performance are: annual insolation, heating degree-days, and cooling degree-days. Such data for particular locations are available from various sources such as Local Climatological Data issued by NOAA and the Climatic Atlas. The technique can be exercised by using these climate factors as input along with systems cost estimates for array, battery and B-0-P costs. The table on the opposite page summarizes the steps in using the correlation curves. A detailed discussion of the procedure and all the correlation curves are presented in Section 12 of Volume II of this report.
42
~ ktj
~ ~
C C .
I
ft ~
~ ~
F1) ~
F1 w
f3\ ~
C '
r ~
F blliJ
~ ~

EXTENSION OF PERFORMANCE AND ECONOMIC RESULTS
PROCEDURE FOR ESTIMATING PV SYSTEM PERFORMANCE
Specify:
• • •
•
Selected Site/ Region/Weather Year
House Type (Northern or Southern)
Array Area/ Cell Efficiency /Packing Factor
Specify Sell-Back Rate for Systems Without Storage
Step (1) Obtain from Local Climatological Data or Climatic Atlas
• •
Heating and Cooling Degree Days
Annual Insolation
Step (2) Estimate Annual Residential Load Requirements
•
•
Thermal Loads from Correlation Curves as shown in Section 4 as a Function of Insolation Heating and Cooling Degree Days
Electrical Loads from Tables for Diversified, Cooking and Clothes Drying, and Domestic Hot Water as shown in Section 7.
Step (3) Estimate Annual PV System Output
• Annual Loads from Correlation Curves as shown in Section 15 as a Function of Insolation
Step (4) Estimate Economic Viability
• •
Project Array, Battery and B-0-P Costs
Estimate Cost of Electricity for Sites
• Calculate Utilization Factor for Systems Without Storage
•
•
Levelized Annual Cost and Benefits from Nomograph similar to Figure Presented in Section 18
Calculate Cost-To-Benefit Ratio
43

1
20. COMPARISON OF . WEATHER DATA
The selected year of hourly weather data utilized in the detailed performance analysis differed from the data used by Westinghouse in a parallel program and from the Typical Meteorological Year (TMY) data developed by Sandia Laboratories toward the end of the program. A comparison, therefore, was made of pertinent weather data for four sites common between the GE and Westinghouse studies: Phoenix, Boston, Nashville and Seattle. A comparison of the three years of weather data evaluated at the four cites is shown in the table below. The numbers in parenthesis indicate the percent deviation from the GE selected year. In general, the spread of data for the several weather years used was less than 10%. The notable exceptions were for heating degree days determined for the Westinghouse year at Seattle and for the Test Meteorological Year at Nashville. Percentagewise, there was also a large variation in cooling degree days for Seattle, but this can be attributed to the unique climate of this city.
IUIAL PV ELECTRICAL SYSTEM
LO CATI ON WEATHER LOAD OUTPUT YEAR (kWh) (kWh}
1953 (GE) 14701(+0.5%)** 20305 (+2%) PHOENIX 1967 ( w) 14704~+2%~ 19970 (-0.5%~
THY 14945 +2% 20223 (+0.2%
1960 (GE) 15111(-0.1%) 13517(-1%) BOSTON 1965 (W) 15316(+1%) 13627(-2%)
THY 15117(+0. U) 12909(-U)
1968 (GE) . 13749(-1%) 14222 ( +1%) NASHVILLE 1966 (W) 13479(-0.1%) 13879(+2%)
THY 13262(+1%) 13924(+3%)
1966 (GE) 12882(+0.5%) 11341(+6%) SEATTLE 1962 (W) 12978(+7%) 11656(+3%)
TMY 13090(+1%) 11654(3%)
*BASED ON NOMINAL ~ET OF ECONOMIC GROUND RULES
**INDICATES PERCENTAGE DEVIATION OF CORRELATION RESULT
(GE) (W) ( TMY) -
44
GENERAL ELECTRIC SELECTED YEAR WESTINGHOUSE SELECTED YEAR TEST MET~OROLOGICAL YEAR
SELLBACK COST TO ENERGY BENEFIT (kWh)· RATIO*
12944 (+H) .9 (+U) 12718 1+4%) .92~+2%) 12834 +5%) .91 +2%)
8410 ( +6%) 1.23(+5%) 8436 (+6%) 1.22(+5%) 8015 (+6%) 1.29(+5%) . 9129 (+5%) 2 .24(+1%) 8866 (+7%) 2.35(-0.4%) 8974 (+6%) 2.35(-1%)
6988 (+15%) 7.64(-2%) 7 37 4 (+8%) 7.53(-0.1%) 7244 (+10%) 7.47(+1%)
M ~
rn ~
F ~
F8' ~
~ ~
r3\ ~
Fl ~
Fl ~
~ ~
Fl ~
C C ~ tJ
0
C .
F1 b
, C
SYSTEM OUTPUT SENSITIVITY TO
WEATHER DATA
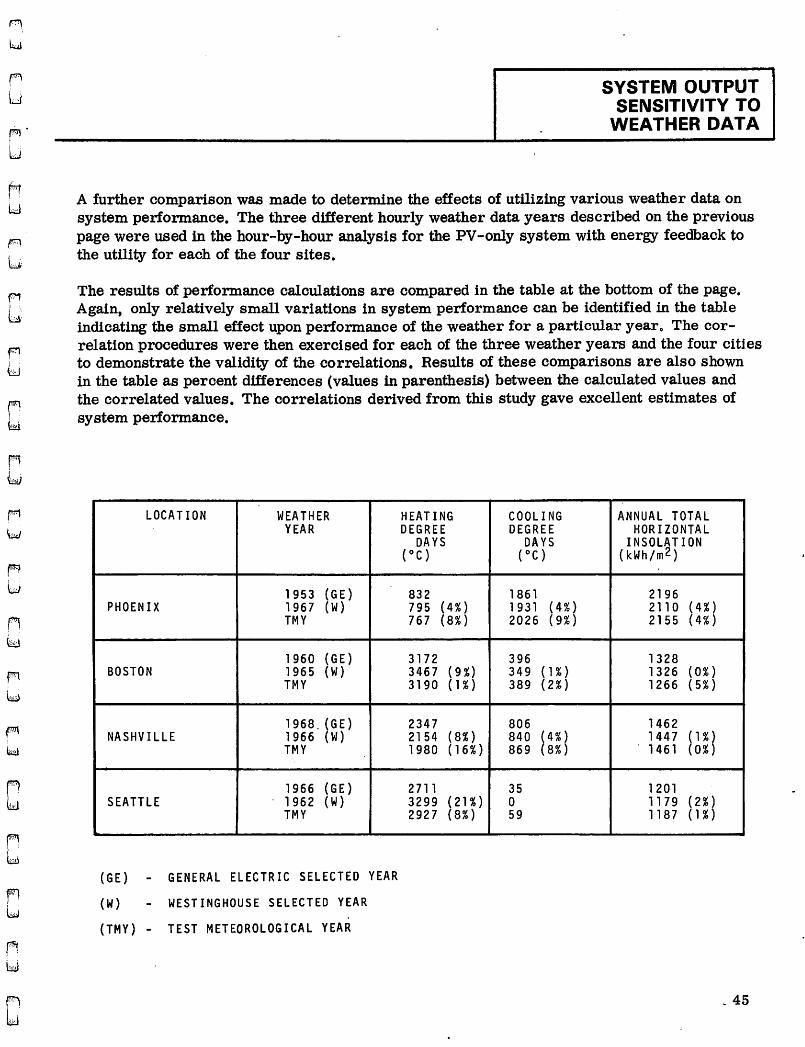
A further comparison was made to determine the effects of utilizing various weather data on system performance. The three different hourly weather data years described on the previous page were used in the hour-by-hour analysis for the PV-only system with energy feedback to the utility for each of the four sites.
The results of performance calculations are compared in the table at the bottom of the page. Again, only relatively small variations in system performance can be identified in the table indicating the small effect upon performance of the weather for a particular year o The correlation procedures were then exercised for each of the three weather years and the four cities to demonstrate the validity of the correlations. Results of these comparisons are also shown in the table as percent differences (values in parenthesis) between the calculated values and the correlated values. The correlations derived from this study gave excellent estimates of system performance.
LOCATION WEATHER HEATING COOLING ANNUAL TOTAL YEAR DEGREE DEGREE HORIZONTAL
DAYS DAYS INSOLATION (oc) (oc) (kWh/m2)
1953 (GE) 832 1861 2196 PHOENIX 1967 (W) 795 (4%) 1 931 (4%) 2110 (4%)
TMY 767 (8%) 2026 (9%) 2155 (4%)
1960 (GE) 3172 396 1328 BOSTON 1965 (W) 3467 ( 9 %) 349 ( 1 % ) 1326 (0%)
TMY 3190 ( l % ) 389 (2%) 1266 (5%)
1968. (GE) 2347 806 1462 NASHVILLE 1966 (W) 2154 (81) 840 (4%) 1447 ( 1 % )
TMY 1980 ( 16%) 869 (8%) 1461 (0%)
1966 (GE) 2711 35 1 201 SEATTLE 1962 ( w) 3299 (21%) 0 1179 (2%)
TMY 2927 {8%) 59 1187 { 1 % )
(GE) - GENERAL ELECTRIC SELECTED YEAR
(W) - WESTINGHOUSE SELECTED YEAR
(TMY) - TEST METEOROLOGICAL YEAR
~ 45

21. HABITABLE HOUSE DESIGN
The designs for the habitable houses were the same designs as used in the performance analysis incorporating all of the energy conservation features discussed previously. The two designs are depicted in isometric views on the opposite page. Several flat-plate panels are shown on the northern house and PV shingles are shown on the southern house indicating the general appearance with collectors mounted on the roof. The houses have three moderately-sized bedrooms for a family of four with two full-sized bathrooms.
Testing of the habitable residences would be limited to normal living routines. The aim of this testing would be to determine energy savings that could be effected under actual use of the home by the residents. To this end, the instrumentation would be relatively limited and would be configured so that it could be stored locally or integrated by means of commercial telephone lines into a centralized data accumulation system.
Construction and inhabitance of these houses would provide experience in addressing several of the potential building code problems which may be encountered by installing roof-mounted PV arrays and in assessing institutional issues with respect to financing, insurance and utility interface.
46
F) ~
C '
C
rm> ~
M ~
F' ~
Fl ~

HOU HABITABLE I SE DESIGN .
NORTHERN MODEL
~ 10· 15
SOUTHERN MODEL
0~ 10· 15 · 47

22. RESIDENTIAL TEST FACILITY
A flexible test facility as shown on the opposite page was designed to serve as a test bed and as a working showcase for solar energy systems. Technically, the facility provides an evaluation of functional PV or combined PV/therm.al system performance and addresses problems of installing and operating such systems on residential homes. The facility design was based on the Sunbelt house but with a greatly expanded garage area to provide space for a variety of systems to be installed and to accommodate working area for technicians. This design is applicable to all the regions, although a steeper pitched roof would be used in northern locations. The living area portion of the design serves as a reception and display area for visitors while the expanded garage is the equipment and test area. The de-sign allows for incorporation of all of the prime subsystem configurations and rapid reconfiguration to maximize the usefulness of the facility. The roof of the reception center portion of the structure was fitted with the modular metal framing (e.g., Unistruts®) to permit installation of any type of PV and thermal collectors.
48
C F ~
F1 kJ
F' ~
F1 ~
F w ~ w
fl w

Fi I
f"'l I
SIMULATED RESIDENTIAL AREA
RESIDENTIAL I TEST FACILITY
STAIRWELL DORMER TO EXTERIOR ACCESS WALK
EXCESS EQUIPMENT STORAGE
49

23. PV AND THERMAL TEST SYSTEM DESIGN
General conceptual design of the electrical system has been configured to permit the implementation of an arrangement either with or without battery storage. A schematic of the electrical system showing the required equipment and location of instrumentation is shown at the bottom of the page. Not all the equipment would be installed at the same· time. The schematic for the thermal system is shown on the opposite page •. A forced air circulation arrangement was selected for the building. The instrumentation is located to provide data for system and subsystem performance evaluation. Again, the figure shows the capability for introducing the various types of equipment which may be evaluated.
The loads imposed on the test facility consist of both real and simulated elements with appropriate controls for simulating family living patterns. Real loads can be generated by the personnel working in the facility while simulated loads can be developed through automatic control of typical appliances and lighting fixtures.
In addition to the instrumentation noted on the opposite page, appropriate meteorological instrumentation would be included to determine energy input to the system.
50
V
r. T r T T
·T • T
SOLAR
PV
PANELS
ELECTRICAL SYSTEM SCHEMATIC AND INSTRUMENTATION
UTILITY
T
I V W
MAX. POWER
TRACKER
T I
INVERTER
TT : ace* ;. ____ ,. L • • r------,
V W VAR
w VAR
T -i--' ~- .... -~ RECTIFl!R ~- -t----. T I 0-. I !_ - !'= - - ~ . . •. ·W T I --- w I ---r---l---, -- •--VAR .._~~ ~---~----,
: ~!~~;';_'t_ ; -::-•. -T : ELECTRIC : I SHUNT I ALTERNATOR I : REG. I ·-, BATTERY L - - - - - - - _I
-------· .,. I
SENSOR LEGEND
I = CURRENT I/ = VOLTAGE
W = TRUE POWER VAR = REACTIVE POf1ER
T = TEMPE.RATURE
.. BCC: BATTERY CHARGE CONTROLLER ' DOTTED LINES ARE ALTERNATIVE SYSTEMS
DOMESTIC HOT WATER
w
(.Wl
jEL-EC-TR-IC. ----L!ACE HEATE_~
IW
~~ES ··....---__,.
~~ING w
[SOLAR S~~TEM11--------1
PARASITICS ------····
•W
CJ I
I
F1} bJ
ri ~
C .
F, h£d
C
F' bi
f) ~
~ ~
r, ' i ~
r, w

- - Differential
Sensor Legend
->Q;peratura
erature Probe (Arrow Heads Indicate Paired Sensors)
- Alr Flow Heter
- Llquld Flow Meter
- Power
Hot or ColiL_
Freoi\,!SI
Heat Pump
(Located. Outside)
Liquid Colluctora (Evacuated Tube, Flat-Plate or Hybrid)
®
ln•Duct Re1l1tance
Heater
©
- - - - - - - - - - ·- - - -- , ------ --------.
©
I I I
I
I I
AB
PoHUPlred
Hot Vater
Cenerator
®
Cold
Air Collecton (Plat Plate or
· Hybrid) .
i l i-----'. I r-·-J
I ©
i I ··-· I I
I l I
I i l I!~ lockBe4 ;~ .,,,_,
i i I I
I I •
.J r l r- ·1-1
Alr Return
From Ruidence
Alr Handler (B lover)
@
I~' I I
_T __ _____i ~----_J I __ ;_ ,Ci)
-------------Condltionod Alr -+
Supply
--- - --- ---- --------
----------------
THERMAL SYSTEM SCHEMATIC AND INSTRUMENTATION
-------, • ____ _J 1-
•
I • I _____ ....J
IC~]

1
24. TEST PROGRAM . RANKING
The final system test program ranking and location was based on the results of the costto-benefit ratio ranking which included both solar system performance and cost effects, current population level and growth rate rankings, and energy cost and usage growth rate rankings. The immediate implementation of a test program developed around PV-only concepts, presently appears to promote the best development strategy for residential applications. The test program to develop the residential PV market should include the use of both the habitable house designs and test facility design discussed on previous pages. The test facility should be included in the plan due to the flexibility in system configurations and evaluation this facility can provide. It should be initially implemented with simple PV -only systems with and without battery storage. This facility design also allows for possible installation of solar thermal collectors which should receive consideration in the test program as costs are reduced.
Because of the relative simplicity of the PV -only approach, particularly without storage, consideration should be given to concurrently building several PV-only habitable residences along with the test facilities. These houses would be less costly than the test facility and have instrumentation sufficient to compare results with those obtained from the test facility. They would also provide early experience in addressing institutional issues and family acceptance.
The primary location for initial test facilities should be the Southwest represented by Phoenix and Albuquerque in the study results. The Northeast area of the country is recommended as the next area for testing. The Boston area has the highest current population and energy costs that make it a prime area for PV system implementation. The next attractive area is the Southeast. Miami has shown relatively high population levels and energy costs with viable system performance and costs.
These three locations provide good test visibility with the geographical dispersion of the test facilities and provide different weather climates for initial PV test results comparisons. Both habitable houses and test facilities should be erected in each region; however, the test facility may be located in only the Southwest and the Northeast to provide contrasting locations. With this approach, comparison of the data between the test facility and the habitable residences can be made in the same regions. The test program should be implemented immediately to achieve acceptance of PV residential systems.
If additional funds are available, the next regions for testing should include those represented by Charleston, Santa Maria, Bismarck and Washington, D. C., based mainly on the costto-benefit ratio ranking in Section 13.
52
~ bJ
C F kJ
Fl bi
Fl ~
r1 ~
F1 ~
r, ~
C

C ~ ~
0 .
TEST FACILITY COST ESTIMATES
Massdesign obtained construction cost estimates for both the Test-Bed Facility and the Habitable Residence from professional cost estimators. The costs are in 1978 dollars and are exclusive of solar related equipment and instrumentation. They were developed for the Boston area and adjusted to other locations using the 1978 Dodge construction cost guide. The tables below summarize the cost estimates •
Costs of Residential Test Facility in Selected Cities
City 1978 $
Boston (Basic) $125,253 Albuquerque 123,237 Bismarck 130,548 Charleston 98,678 Ft. Worth - Dallas 121,306 Madison 114,212 Miami 106,762 Nashville 103,143 Omaha 128,104 Phoenix 130,226 Santa Maria (Used San Jose) 139,898 Seattle 137,163 Washington, D. C. 120,328
Costs of Habitable Test Residences in Selected Cities
City 1978 $
Northern Residences Boston (Baseline) $ 85,797 Washington, D. C. 82,263 Bismarck 89,027 Omaha 87,557 Nashville 70,251 Seattle 93,887 Madison 78,205
Sunbelt Residences Boston (Baseline) $ 76,169 Charleston 59,857 Miami 64,939 Ft. Worth-Dallas 73,684 Phoenix 79,123 Albuquerque 74,866 Santa Maria (Used San Jose) 85,097
53/54

GENERALfj ELECTRIC