Embed Size (px)
Citation preview
GENERAL ARTICLE
Beginnings and Growth of Radio Astronomy in TIFR∗
The Ooty Radio Telescope and the Giant Metrewave Radio Telescope
S Ananthakrishnan and V Balasubramanian
S Ananthakrishnan was
associated closely with both
the Ooty Radio Telescope and
the GMRT. After retiring
from NCRA-TIFR, he has
been an Adjunct Professor of
S.P.Pune University. His
research interests include
Sun, solar wind, extragalactic
radio sources and nearby
galaxies and antenna designs.
V Balasubramanian joined
TIFR after BARC Training
school. For the rest of his
career, he was closely
associated with the Ooty
Radio Telescope and its
further development. He was
instrumental in realizing the
SMART design of GMRT
antennas. His research
interests include pulsar
scintillations, IPS studies of
space weather and solar
concentrators.
This article describes the origin and development of the radio
astronomy group of Tata Institute of Fundamental Research
(TIFR), which later became the National Centre for Radio
Astrophysics in Pune in 1991, under the leadership and guid-
ance of Govind Swarup over the past 50 years. The innova-
tiveness of the designs and the indigenous development of the
large radio telescopes by a team of young scientists and engi-
neers are highlighted. The scientific results from the work of
the group are briefly summarized.
1. Introduction
The history of science is replete with many instances when great
progress was made owing to the construction and development of
new instruments to aid in scientific research. Examples are the
invention of the optical telescope followed by Galileo’s discov-
ery of the satellites of Jupiter. Similar is the history of micro-
scopes and bacteria. Progress in the technologies of glass and
its use in making convex and concave lenses, as well as the un-
derstanding of the principles of optics of lenses, paved the way
for making more powerful telescopes and microscopes. In mod-
ern times this trend continues except that in several cases, the
instruments are quite complex and large and are produced by the
effort of big teams of scientists and engineers. Such is the case
with large particle accelerators and big astronomical telescopes.
However, generally because of funding restrictions for building
such large, complex instruments, scientists often use innovative
ideas in the design and operation of the instruments to reduce
∗Vol.26, No.7, DOI: https://doi.org/10.1007/s12045-021-1191-3
RESONANCE | July 2021 895

GENERAL ARTICLE
costs significantly. To get the best possible returns (or ‘bang forKeywords
Govind Swarup, parabolic cylin-
ders and dishes, ORT, GMRT.
the buck’) the capabilities of the materials and subsystems cho-
sen for the construction of the complex instrument are stretched
to their limits. Some of these special aspects of design and con-
struction of complex scientific instruments are highlighted in this
article, which describes the beginning and growth of radio astron-
omy in TIFR under the leadership of Professor Govind Swarup,
who passed away in Pune on 7th September 2020, at the age of 91
years. Govind Swarup’s innovative bent of mind was the source
from which the designs of world-class radio telescopes took shape
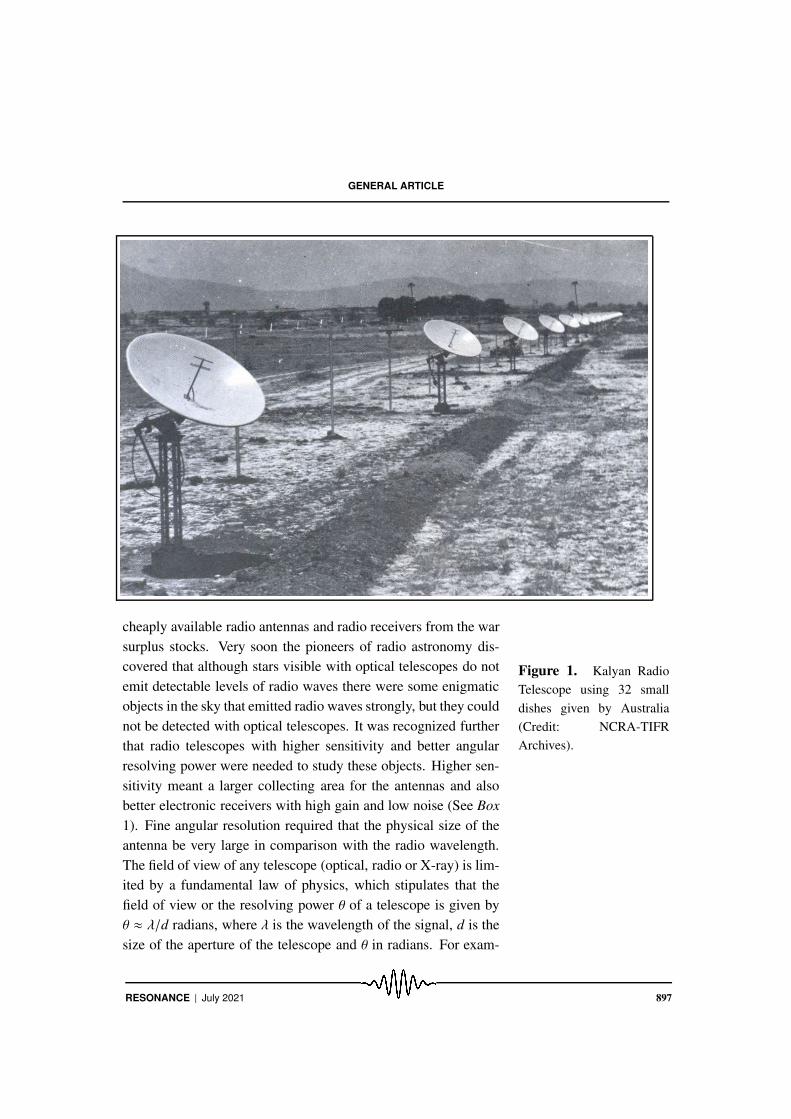
in India. After setting up the Kalyan Radio Telescope in 1964–
‘65 using 32 small dishes from Australia (Figure 1), he made a
unique facility called the Ooty Radio Telescope (ORT), which
became operational in 1970. The ORT was the first large equato-
rial cylindrical parabolic radio telescope with steerability in both
directions, built indigenously in India.
TheThe astronomical studies
with the ORT by the
young research group
headed by Swarup
established the Indian
radio astronomy
community as an
important one on the
international scene.
astronomical studies with the ORT by the young research
group headed by Swarup established the Indian radio astronomy
community as an important one on the international scene. The
thread of innovativeness has continued as the Indian group grew
and has culminated in the design, construction and operation of
the Ooty Synthesis Radio Telescope (OSRT), and finally, the Gi-
ant Metrewave Radio Telescope (GMRT). GMRT is currently the
most sensitive low-frequency radio telescope in the world.
2. The Beginnings
The serendipitous discovery in 1933 by Karl G. Jansky that ra-
dio waves were being emitted from the region of our Milky Way
galaxy did not excite the community of astronomers who worked
with optical telescopes. But the situation changed for the better
as many electronic engineers who had built radars and other radio
equipment returned to civilian life at the end of the Second World
War. Some of them started radio observations of celestial objects,
in Australia, the United Kingdom and a few European nations, as
well as the USA. These radio telescopes were built mostly with
896 RESONANCE | July 2021
GENERAL ARTICLE
Figure 1. Kalyan Radio
Telescope using 32 small
dishes given by Australia
(Credit: NCRA-TIFR
Archives).
cheaply available radio antennas and radio receivers from the war
surplus stocks. Very soon the pioneers of radio astronomy dis-
covered that although stars visible with optical telescopes do not
emit detectable levels of radio waves there were some enigmatic
objects in the sky that emitted radio waves strongly, but they could
not be detected with optical telescopes. It was recognized further
that radio telescopes with higher sensitivity and better angular
resolving power were needed to study these objects. Higher sen-
sitivity meant a larger collecting area for the antennas and also
better electronic receivers with high gain and low noise (See Box
1). Fine angular resolution required that the physical size of the
antenna be very large in comparison with the radio wavelength.
The field of view of any telescope (optical, radio or X-ray) is lim-
ited by a fundamental law of physics, which stipulates that the
field of view or the resolving power θ of a telescope is given by
θ ≈ λ/d radians, where λ is the wavelength of the signal, d is the
size of the aperture of the telescope and θ in radians. For exam-
RESONANCE | July 2021 897

GENERAL ARTICLE
ple, a parabolic dish antenna of one-meter diameter operating at
a wavelength of 10 cm (3 GHz) will have a field of view of 0.1
radians (∼ 5.7o). If the angular separation of two celestial sources
is less than 5.7o this dish will not be able to resolve them as sep-
arate sources. (In radio astronomy jargon the telescope is said to
have a ‘beam width’ of θ. If the telescope is incorrectly aimed
at a point source the output signal from the telescope would de-
crease by about 50% if the pointing error is θ/2). In the late 50’s
and 60’s of the last century, large steerable radio antennas (the
so-called ‘dishes’) which can be efficiently used at radio wave-
lengths in the range of a few to tens of centimeters were built by
radio astronomers. The earliest of such a big dish was the 79m di-
ameter radio telescope at Jodrell Bank in the UK, commissioned
in late 1957. This instrument would have a resolving power of
about 4′ (arcminutes) if used at 3 GHz.
Box 1. Signal to Noise Ratio and the Gain of an Antenna
Radio emission from celestial sources occurs at all radio frequencies and has the nature of random noise.
However, the range of radio frequencies received by the antenna is limited by the upper and lower frequency
cut-offs of its receiver, defined as its bandwidth, B. The permitted bandwidth generally avoids radio fre-
quencies used in terrestrial communication since the latter signals are enormously stronger than the cosmic
noise, which is the signal radio astronomers look for.
The amplitude of the cosmic signal collected by the antenna of a radio telescope and passed on to the
receiver increases in proportion to the bandwidth (B) of its receiver, but the internally generated radio
receiver noise increases only in proportion to the square root of B, as also the time over which the signal
is received (called integration time, τ). Hence the ratio of Cosmic Signal to the Receiver Noise (SNR)
increases with both B and τ. SNR should be high for the signal to be detected in presence of the noise. For
this purpose, it is important that the first amplifier in the receiver system has a low noise, quantified by its
noise figure. The minimum detectable signal is proportional to the inverse square root of the product of B
and τ.
The ‘Gain, G’ of the antenna is directly proportional to the collecting area, A, of the antenna and inversely
to the square of its wavelength of operation.
An alternative to having a single large diameter dish is to use
small antennas separated by large physical spacing between them—
i.e, a radio interferometer. The resolving power of an interfer-
898 RESONANCE | July 2021

GENERAL ARTICLE
ometer corresponds to the baseline separating the antennas. Al-
though Although the cost of
several small diameter
dishes is much less than
that of a single large
dish, it is more complex
to combine the signals
from different antennas
in proper phases. Errors
in phasing the antennas
can result in
mis-pointing of the
interferometer and/or a
decrease in signal
strength.
the cost of several small diameter dishes is much less than
that of a single large dish, it is more complex to combine the
signals from different antennas in proper phases. Errors in phas-
ing the antennas can result in mis-pointing of the interferometer
and/or a decrease in signal strength. In the early 1950’s, several
radio interferometers were also built with small dishes or arrays
of dipoles distributed over baselines of several hundred meters.
(Ref: public.nrao.edu/interferometry-explained; https://www.uni
versetoday.com/145065/how-interferometry-works-and-why-its-so-
powerful-for-astronomy/).
Basic design features of receivers for improving their sensitivity
to radio emission from celestial objects (such as bandwidth, inte-
gration time, signal to noise ratio, and noise figure) (see Box 1)
were also recognized by the pioneering radio astronomers. We
should remember that steerability of the antennas was very desir-
able because the celestial sources move from east to west in the
sky due to the rotation of the Earth from west to east about its
north-south axis.
2.1 The Lunar Occultation Method
In 1963, while going through the recent papers, Govind Swarup
came across the important papers by Cyril Hazard and Maarten
Schmidt in Nature, 1963. Hazard reported the “observations of
a lunar occultation (LO) of the radio source 3C273 made with
the 64-m Parkes Radio Telescope”, which is a parabolic dish an-
tenna; the strong radio source 3C273 (the first optically identified
quasar at a distance of 750 Mpc) was known to have a very com-
pact radio source at its center. This LO technique uses Moon as a
tool to discover radio sources in the sky and determine their po-
sition, brightness distribution, and angular size to good accuracy.
It is important to note that the apparent movements of the radio
sources and the Moon (as well as the Sun) are different in the sky.
Timing on the Earth is Sun-based such that there are 24 hours to
a day. But the sidereal day (time for the stars/radio sources to re-
turn to the same position of the sky daily) is slightly less than the
RESONANCE | July 2021 899
GENERAL ARTICLE
solar day. One sidereal day is 23h 56m 4sec. Hence, stars appear
to move in the sky at close to 15.001o/hour while Moon moves
at a slower varying rate of about 14.3 to 14.8o/hour. Therefore,
the radio sources on the path of the Moon can get eclipsed by the
Moon, and remain invisible for some time, till they emerge on an-
other side of the Moon. The position of the Moon has been stud-
ied over a long period of time precisely. Hence, lunar occultation
observations of celestial radio sources can tell us the positions
of radio sources accurate to a second of arc. Only a few strong
sources were being seen in this manner at that time. SwarupSwarup got the idea that
if he could build a large
steerable low-cost radio
telescope and track the
Moon from the time it
rises till it sets, then one
could discover many
weak sources and
estimate their angular
sizes as well as their flux
density.
got
the idea that if he could build a large steerable low-cost radio tele-
scope and track the Moon from the time it rises till it sets, then
one could discover many weak sources and estimate their angular
sizes as well as their flux density (amount of power received in
units of watts/square meter of area/Hz of bandwidth). The path
of the Moon in the sky changes from day to day. Therefore, if one
tracks the Moon on all days, one is likely to discover hundreds of
new radio sources. That happened later and aided Swarup and
Vijay Kapahi in making important progress in supporting the big
bang cosmology.
3. Need for Large Collecting Area and Resolution
Swarup was aware of the controversy between the Big Bang Model
and the Steady State Model for explaining the origin and evolu-
tion of the Universe. One group led by Martin Ryle from Cam-
bridge supported the Big Bang model assuming that weaker sources
are farther away, while another group led by Fred Hoyle consid-
ered the Steady State model as valid. To resolve this matter, mea-
surements of angular sizes and flux density of a large number of
weak radio sources were important, but suitable instruments were
not available. Swarup realized that he could make an important
contribution by building a large telescope, which would help in
resolving radio sources at the level of a few arcsec, but a break-
through was needed. This is where the LO method helped, and an
idea was born. He thought that for making outstanding discover-
ies, the collecting area needs to be much larger than the existing
900 RESONANCE | July 2021
GENERAL ARTICLE
big dishes, and receivers very stable so that high sensitivity (high
signal to noise ratio) is obtained. For getting a large area yet at
a low cost, it needs to be a long cylindrical parabola and not a
parabolic dish like Jodrell Bank, since dishes are far more costly
than cylinders given two-axis rotation. To satisfy all these re-
quirements, the telescope’s axis should be parallel to the Earth’s
axis for rotating in the E-W direction, while its signal receiving
focal line dipole array could be phase-shifted in the N-S direction
without the need for mechanical rotation of the antenna in that di-
rection. This will reduce the cost. Thus, was born the idea of the
Ooty Radio Telescope (ORT) [1]. When built, the ORT had about
four times the collecting area of the 79-m dish at Jodrell Bank.
4. Novel Equatorial Mounting
However, as learnt in early spherical trigonometry, ‘latitude of the
place is equal to the altitude of the Pole’ and for the telescope’s
axis to be parallel to the Earth’s axis, it has to be placed on a
north-south hill slope whose inclination to the horizontal is the
same as the latitude of the place. Ideally, if India had the equator
passing through it, then the Pole star would be at the equatorial
horizon, and hence the telescope could be placed horizontally in
the N-S direction. But the southern tip of the Indian sub-continent
is at ∼ 8o N latitude. One needs to find a long slope there, but
there are no suitable hills. Hence Swarup Swarup and his student
Ramesh Sinha looked at
all the topographic maps
from the Survey of India
and identified a few
places in South India
with as low a slope as
practicable. In the end,
they settled on a site
with a nearly appropriate
slope that required
minimum pillars, in the
picturesque Nilgiris,
near the town of
Ootacamund (or Ooty).
and his student Ramesh
Sinha looked at all the topographic maps from the Survey of In-
dia and identified a few places in South India with as low a slope
as practicable. In the end, they settled on a site with a nearly ap-
propriate slope that required minimum pillars, in the picturesque
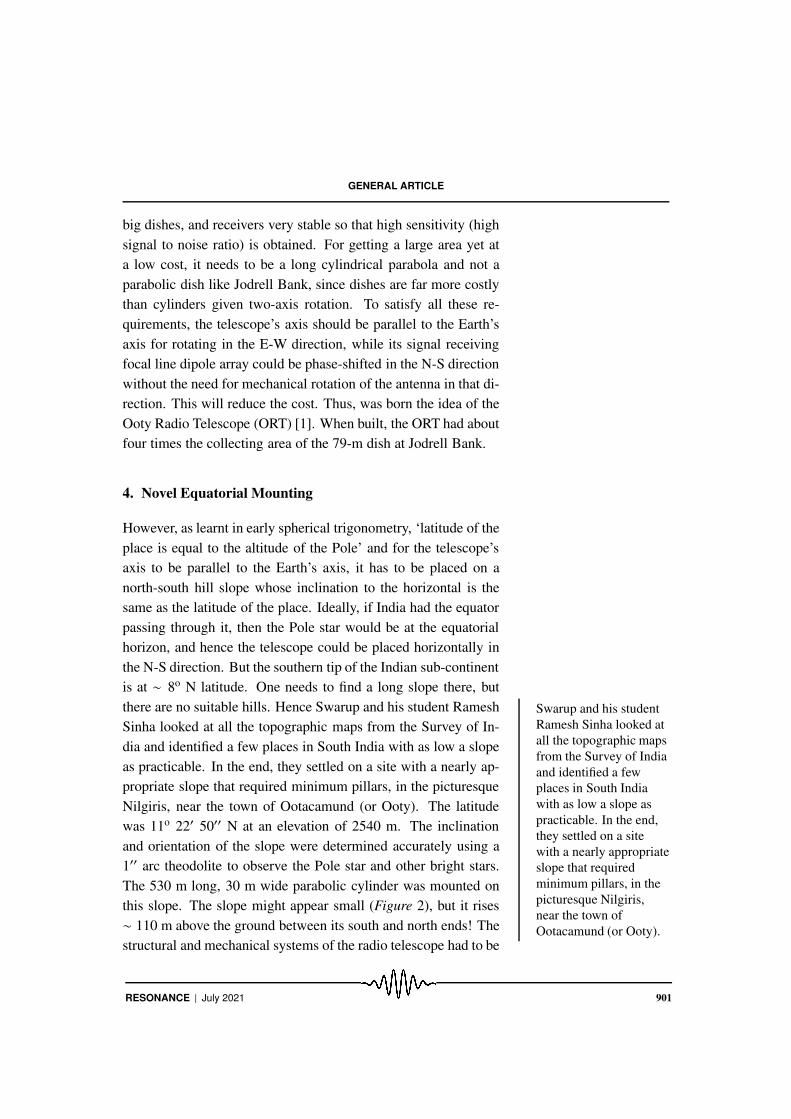
Nilgiris, near the town of Ootacamund (or Ooty). The latitude
was 11o 22′ 50′′ N at an elevation of 2540 m. The inclination
and orientation of the slope were determined accurately using a
1′′ arc theodolite to observe the Pole star and other bright stars.
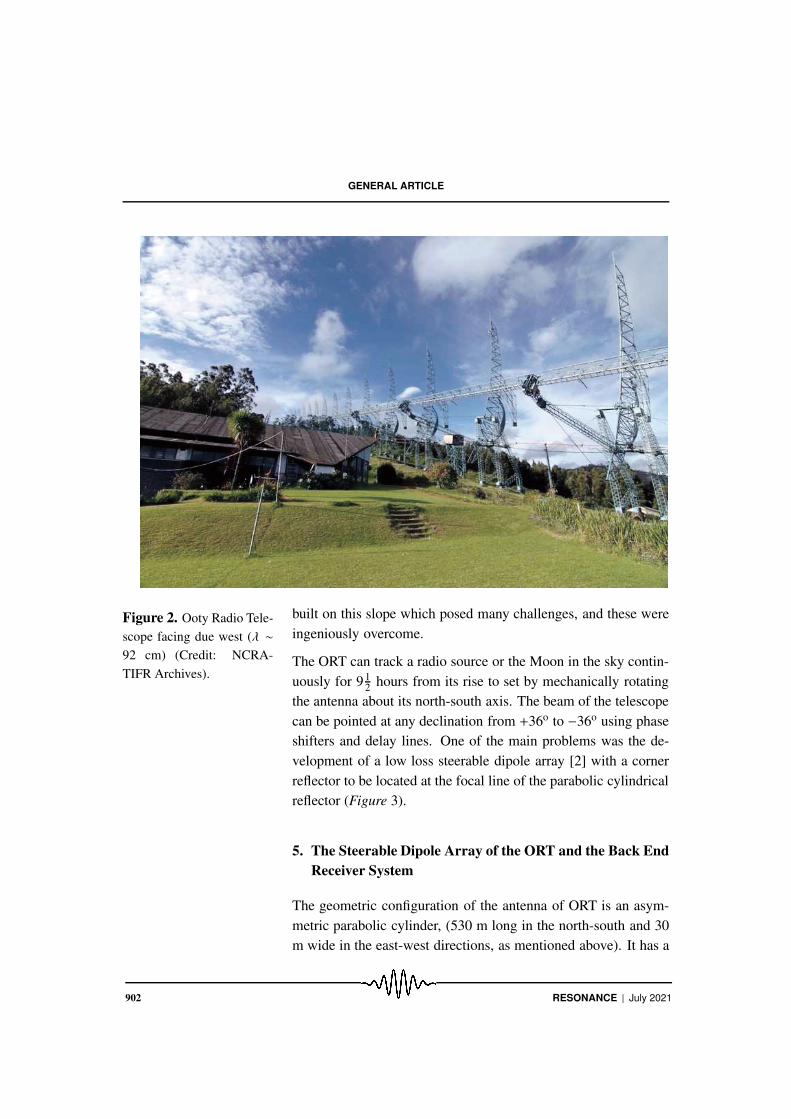
The 530 m long, 30 m wide parabolic cylinder was mounted on
this slope. The slope might appear small (Figure 2), but it rises
∼ 110 m above the ground between its south and north ends! The
structural and mechanical systems of the radio telescope had to be
RESONANCE | July 2021 901
GENERAL ARTICLE
Figure 2. Ooty Radio Tele-
scope facing due west (λ ∼
92 cm) (Credit: NCRA-
TIFR Archives).
built on this slope which posed many challenges, and these were
ingeniously overcome.
The ORT can track a radio source or the Moon in the sky contin-
uously for 912
hours from its rise to set by mechanically rotating
the antenna about its north-south axis. The beam of the telescope
can be pointed at any declination from +36o to −36o using phase
shifters and delay lines. One of the main problems was the de-
velopment of a low loss steerable dipole array [2] with a corner
reflector to be located at the focal line of the parabolic cylindrical
reflector (Figure 3).
5. The Steerable Dipole Array of the ORT and the Back End
Receiver System
The geometric configuration of the antenna of ORT is an asym-
metric parabolic cylinder, (530 m long in the north-south and 30
m wide in the east-west directions, as mentioned above). It has a
902 RESONANCE | July 2021

GENERAL ARTICLE
Figure 3. A cross section
sketch of one frame of ORT
showing details [1].
focal length of 16.5 m. The asymmetric parabolic shape was cho-
sen so that the focal dipole array is easily accessible from ground
level for maintenance and servicing operations when the antenna
is at the west limit (pointing towards a direction just above the
western horizon). The asymmetry led to certain complexities in
the structural design of the counterweights for the 24 parabolic
frames and also in the design of the electrical control of the drive
motors and electromagnetic brakes. The operating frequency of
RESONANCE | July 2021 903
GENERAL ARTICLE
the ORT is 327 MHz, corresponding to a free space wavelength of
92 cm. The reflecting surface is formed by stretching about 1100
stainless steel wires (0.38 mm diameter) in the N-S direction, with
the wires being supported by the 24 parabolic frames. In order to
achieve a narrow primary radiation pattern in the E-W direction
for the asymmetric reflector, it was decided to use a right-angled
corner reflector behind the dipoles, instead of a plane reflector
(Figure 3). The dipole array consists of 968 half-wavelength
dipoles placed collinearly at a spacing of 0.57 λ within the corner
reflector to form a line focus. The dipoles are grouped into 22
modules of 44 dipoles each. Between any two adjacent dipoles,
an RF phase shifter exists. This can be varied over +/ − 0.34λ
continuously, enabling the pointing of the array to different de-
clinations. The RF loss of each module is about 1 db, and the
standing wave ratio at the input of any module is less than 1.3 for
the entire range of declinations.
TheThe receiver system of
the ORT is basically
superheterodyne. The
RF amplifier and mixer
form the front end of the
receiver system and are
situated outdoors, close
to the dipole array. Only
the intermediate
frequency (IF) is carried
to the back end of the
receiver system situated
in the central control
room.
receiver system of the ORT [3] is basically a superhetero-
dyne system. The RF amplifier and mixer form the front end of
the receiver system and are situated outdoors, close to the dipole
array. Only the intermediate frequency (IF) is carried to the back
end of the receiver system situated in the central control room.
Each module of the dipole array is connected to an RF amplifier
of low Noise Figure, followed by a mixer from which the inter-
mediate frequency (IF) output at 30 MHz is carried to the central
receiver room by coaxial cables. Thus a set of 22 cables laid
underground carries the IF signal to the receiver. Similarly, an-
other set of cables carries the local oscillator signal to the 22 mix-
ers. The lengths of these cables are precisely measured, and their
lengths to each module of the dipole array kept equal to maintain
the equality of phases.
An additional test line similar to the above is used for monitoring
the gain and phase [4].
The dipole array is steered electrically by tilting the beam of each
of the 22 modules using RF phase shifters and further by intro-
ducing phase shifts and delays in the IF system to compensate for
different path lengths from a celestial radio source to the 22 mod-
904 RESONANCE | July 2021
GENERAL ARTICLE
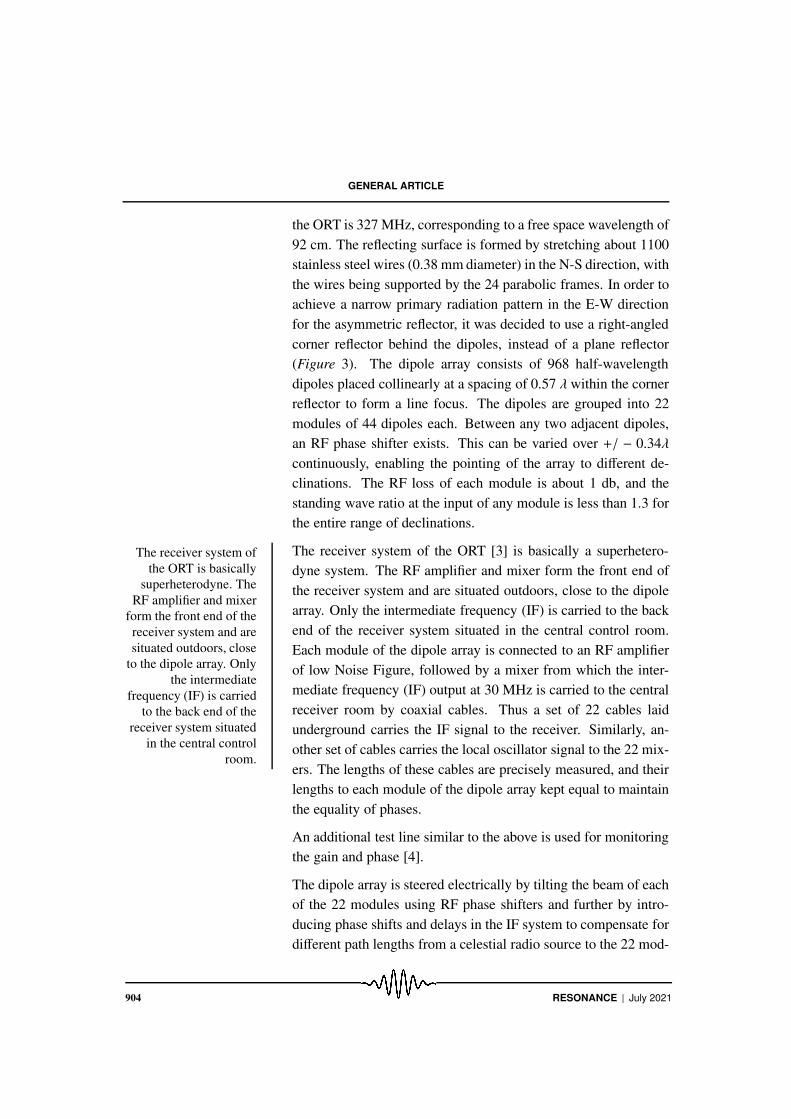
Figure 4. Moon being
tracked in declination using
the 12 beams as described in
text [1].
ules. This arrangement minimizes the system losses and, also
enables the formation of several beams of the telescope, which
can be pointed in slightly different directions in the north-south.
A bunch of 12 beams each with a width of about 3.6′ in decli-
nation, and separated by about 3 arcmins, was generated by this
phase shifter—delay line system (details in Sec. 6). The angu-
lar size of the moon being 30′, 10 beams of the ORT can cover
the entire moon (Figure 4). The east-west beamwidth is about
2.2o, which corresponds to 30 m aperture of the antenna at the
operative wavelength of 92 cm.
After combining the signals in proper phase from north and south
modules the final combination has two options, namely simple
addition to give total power beam or a multiplication to give a
phase switched beam. In the multiplication mode, one gets re-
duced beam width. Hence, the N-S beam widths for the total
power and phase switched modes are respectively 5.6′ sec δ or
3.6′ sec δ where δ is the declination at which the telescope is
pointed. Another advantage of the phase switched beam is that it
RESONANCE | July 2021 905

GENERAL ARTICLE
removes the slowly varying sky background and is sensitive to the
small increase in received flux density from weak radio sources
and aids in their discovery. Multiple beams are created by adding
the required delays and phases at the IF stage by the use of a beam
forming circuit made up of small lengths of additional switchable
delay lines. The final system bandwidth was limited to 4 MHz
bandwidth as per specifications via post amplifiers at the IF stage.
As mentioned earlier, the telescope was primarily intended to
make lunar occultation observations. One phase switched beam
of 3.6′ sec δ is not wide enough to cover the Moon. Hence the
need for 12 beams with offset pointing directions. EachFrom a design point of
view, the dipole array
may appear simple,
made with just a handful
of different solid
materials such as
aluminium, copper,
solder, polyethylene, and
Teflon (polytetrafluo-
roethylene). However,
the techniques for the
development,
fabrication, and
assembly of the
components tested our
innovative skills and
ingenuity to extreme
limits because it was
essential to keep the
costs low.
of the
12 beams can be shifted by a toggle switch either towards north
or south declination by 36′ sec δ such that at any time there are
12 beams of 3.6′ sec δ covering the entire face of the Moon. By
shifting each of the beams either north or south as appropriate as
the Moon moves in declination every day, the Moon is tracked
daily from the time it rises till it sets (Figure 4). The Moon’s mo-
tion in declination in a 9.5 hour period can be as large as 1.5o on
some days, and the beam toggling is used as and when required.
5.1 Technical Hurdles
From a design point of view, the dipole array may appear sim-
ple, made with just a handful of different solid materials such
as aluminium, copper, solder, polyethylene, and Teflon (polyte-
trafluoroethylene). However, the techniques for the development,
fabrication, and assembly of the components tested our innovative
skills and ingenuity to extreme limits because it was essential to
keep the costs low. One of the examples was the development of
20 different directional couplers, of which 44 identical sets were
to be produced and used in the dipole array. Some locations in
the array needed aluminium to copper bonding. Some deteriora-
tion in the bonds was noticed over a period of several months of
operation. These problems were eliminated when the array was
refurbished after about two years by incorporating newly devel-
oped technology of joining metals. This technology of welding
and brazing of dissimilar alloys and different metals was adopted
906 RESONANCE | July 2021

GENERAL ARTICLE
in improving the drive system of the parabolic cylinder also.
The collinear installation and alignment of 24 parabolic frames
along an inclined north-south line posed challenges in developing
precise techniques of theodolite survey especially because the re-
quired angular alignment accuracies were on the order of a few to
15′′ or 20′′. Let alone the availability of GPS (global positioning
system) or laser survey techniques in those days, even electronic
calculators were unavailable to help in the surveys at that time.
Tables of logarithms were used for computations in the field!
Some years ago the location and alignment of ORT were checked
with modern GPS techniques that proved the alignment accuracy
to be better than 15′′.
Many components of the receiver including, the transmission lines
from the front end to the central receiver, had to be carefully de-
signed, fabricated, tested and installed mainly because of the need
for a high level of phase stability to discover new radio sources.
Periodic measurements showed that records of the phase-switched
system are stable to within 2 r.m.s. of the receiver noise (0.6oK)
for 1 sec., time constant over a 10 hour period [4].
6. Performance Enhancement of ORT Over Decades
In In the course of time,
improvements were
made to many of the
subsystems of the ORT
to ensure better
reliability, robustness,
and sensitivity. Major
changes in the structural,
mechanical, and
electrical control
systems were carried out
soon after the accidental
damage to the structure
in 1971.
the course of time, improvements were made to many of the
subsystems of the ORT to ensure better reliability, robustness, and
sensitivity. Major changes in the structural, mechanical, and elec-
trical control systems were carried out soon after the accidental
damage to the structure in 1971. The subsequent improvements
stretched over a period from 1978 to 2005 and were concerned
with the phase shifter system of the dipole array. In 1973, the
central conductor joints, the drive system of the plungers, and the
waterproofing of the system underwent vast improvements. In
1979, the entire array was replaced with diode switched RF phase
shifters with miniaturized low loss RF coaxial lines. It improved
the stability of the array in a large measure apart from improving
the sensitivity of the telescope. The big improvement in sensi-
tivity of the ORT came in 1991 with the installation of compact,
RESONANCE | July 2021 907
GENERAL ARTICLE
low noise RF amplifiers behind each one of the 968 dipoles and
simplified RF phase shifters using coaxial cables. In 2016, a new
digital back end was added—the Ooty Wide Field Array [5]. It
has 10 MHz bandwidth, and the improvement in the field of view
is by about an order of magnitude as compared to the legacy sys-
tem. To go hand in hand with these enhancements, the 30-year-
old reflecting surface of the antenna was replaced with new SS
wires strung along the parabolic frames in 2002.
7. Scientific Results from Ooty
TheThe lunar occultation
(LO) observations from
ORT are the most
important reasons for
building ORT itself. The
first source 4C22.21 was
observed on the night of
18th February 1970,
when both authors
participated in it and had
the ringside view. It was
an exhilarating moment
when we realized that
the telescope was doing
exactly what it was
designed and built to do!
lunar occultation (LO) observations from ORT are the most
important reasons for building ORT itself. The first source 4C22.21
was observed on the night of 18th February 1970, when both au-
thors participated in it and had the ringside view. It was an ex-
hilarating moment when we realized that the telescope was doing
exactly what it was designed and built to do!
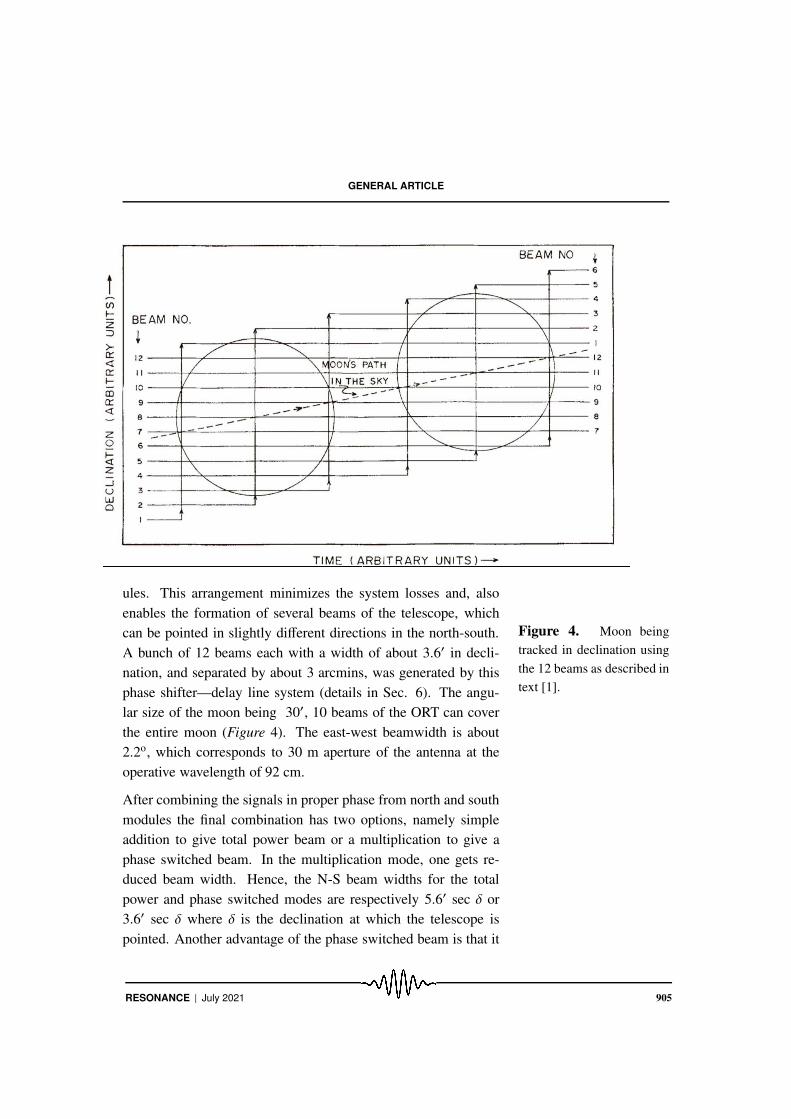
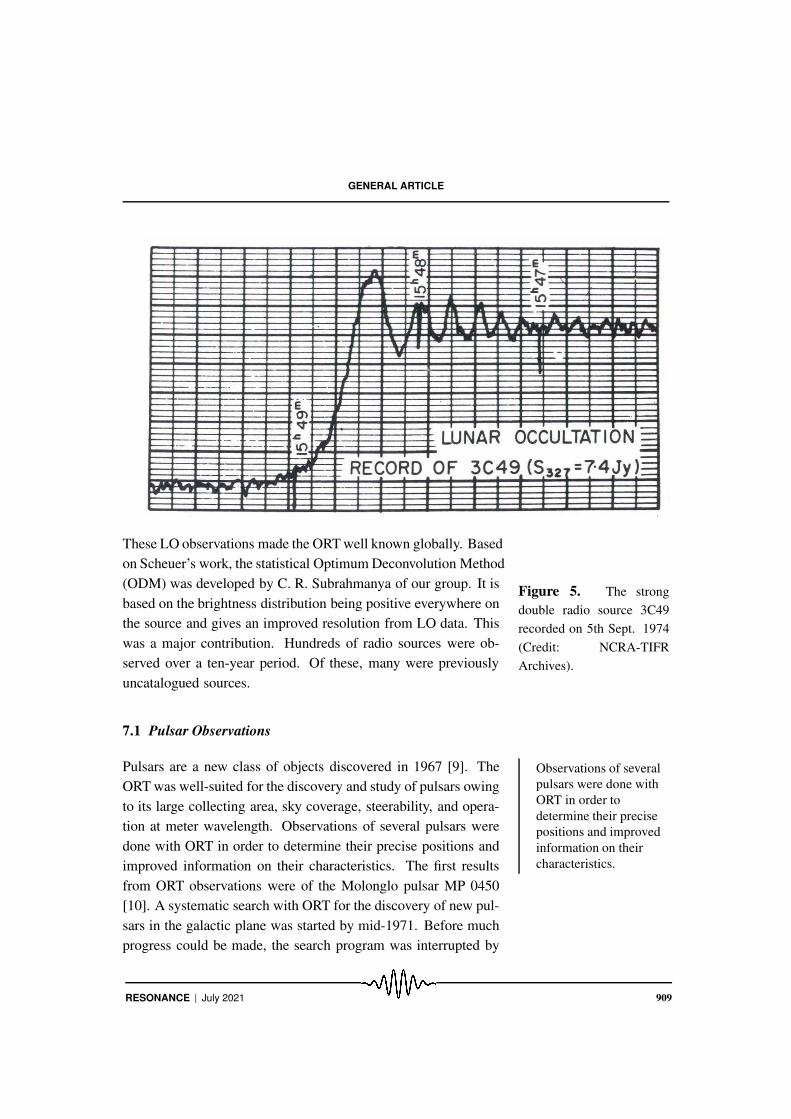
Figure 5 shows occultation of a strong radio source 3C 49 [6].
Its size was estimated from an analysis of two such records on
5th September 1974 and 20th January 1975 (Figure 6) to be ∼ 1
arcsec. Its total intensity was 7.4 Jy at 327 MHz. Its position was
α = 01h 38m 25.56s; δ = +13o38′20.3′′ (α = right ascension and
δ = declination). Students of physics may not miss the uncanny
resemblance of the LO record in Figure 5 to the diffraction pattern
for parallel rays of monochromatic light incident on an opaque
object with a straight edge. It is the same process in action in the
lunar occultation of celestial radio sources. If the angular size of
the radio source were much larger than 1′, the diffraction fringes
would wash out.
Using the first few years of data on a few hundred sources, Govind
Swarup concluded that angular sizes were correlated with their
flux density as θ ∝ S1/2 [7] and that the more compact sources
are at a greater distance; further it was shown that “the angu-
lar size data provide independent evidence of evolution in source
properties with epoch and that it does not support a steady-state
model” [8].
908 RESONANCE | July 2021
GENERAL ARTICLE
Figure 5. The strong
double radio source 3C49
recorded on 5th Sept. 1974
(Credit: NCRA-TIFR
Archives).
These LO observations made the ORT well known globally. Based
on Scheuer’s work, the statistical Optimum Deconvolution Method
(ODM) was developed by C. R. Subrahmanya of our group. It is
based on the brightness distribution being positive everywhere on
the source and gives an improved resolution from LO data. This
was a major contribution. Hundreds of radio sources were ob-
served over a ten-year period. Of these, many were previously
uncatalogued sources.
7.1 Pulsar Observations
Pulsars Observations of several
pulsars were done with
ORT in order to
determine their precise
positions and improved
information on their
characteristics.
are a new class of objects discovered in 1967 [9]. The
ORT was well-suited for the discovery and study of pulsars owing
to its large collecting area, sky coverage, steerability, and opera-
tion at meter wavelength. Observations of several pulsars were
done with ORT in order to determine their precise positions and
improved information on their characteristics. The first results
from ORT observations were of the Molonglo pulsar MP 0450
[10]. A systematic search with ORT for the discovery of new pul-
sars in the galactic plane was started by mid-1971. Before much
progress could be made, the search program was interrupted by
RESONANCE | July 2021 909

GENERAL ARTICLE
Figure 6. Ooty occulta-
tion observation of 3C 49:
Restored strip distributions
along two position angles
(PA) in which the occulta-
tion took place. The derived
size for the centroid of the
source is ∼ 1 arcsec (circle
above). The position of the
radio centroid agrees within
errors with that of the 22.5
mag. Galaxy identified with
the source [6].
unexpected structural damage to the ORT owing to a drive sys-
tem failure in December 1971. The ORT was made operational
after repairs in September 1973. Eight new pulsars were discov-
ered by the Ooty search, with one of them having an unusually
large intrinsic pulse width. Several pulsars were studied with
the ORT with the specific aim of distinguishing between inten-
sity variations arising due to interstellar scintillation and intrinsic
causes. Interesting new results on pulse nulling and sub-pulse
drift rates were also obtained from observations on 10 pulsars
with the ORT. Pulsar scintillation studies during 1993–98 with the
improved ORT having better sensitivity showed strong evidence
for a local bubble of low-density interstellar medium around the
solar neighborhood.
910 RESONANCE | July 2021

GENERAL ARTICLE
Figure 7. IPS of strong ra-
dio source 0138 + 136 (a)
When the ORT is pointed
at the source; (b) When the
ORT is pointed away from
the source towards the back-
ground sky. The scintillation
depends on the compactness
of the source and the close-
ness of the source line-of-
sight to the Earth-Sun line.
(From the personal collec-
tion of P. Janardhan)
7.2 IPS Observations
Interplanetary Scintillations (IPS) arise when radio waves from
distant compact radio sources pass through the expanding solar
wind plasma and get scattered and produce random diffraction
patterns on the ground [11]. Depending on the angular size and
strength (flux density) of the compact radio source, the veloc-
ity of the solar wind, and the angular separation between source
line-of-sight (LOS) and the Sun-Earth LOS, the resulting scintil-
lations are strong or weak (Figure 7). Therefore, IPS is a powerful
method for arriving at an estimate of the angular size of compact
extragalactic sources as well as a way of estimating the velocity
of the solar wind. IPS observations from Ooty were also used
to discover the cometary tail scintillation during the apparition of
Comet Kohoutek in 1973–74 which gave an idea of the density
fluctuation in the plasma tails of Comets. Substantial work using
IPS on ORT has been done over the past nearly ∼ 50 years from
1970 [12, 13].
RESONANCE | July 2021 911

GENERAL ARTICLE
7.3 VLBI observations
Using ORT and telescopes in the UK, Netherland, Poland, and
USSR, the first very-long baseline interferometric observations
from India were carried out successfully in 1983.
7.4 Radio Recombination Lines (RRL)
UsingUsing ORT, a
low-resolution (2o × 2o)
survey of radio
recombination lines
(RRLs) near 327 MHz in
the Galactic plane was
made as a collaborative
effort by the Ooty and
Raman Research
Institute groups.
ORT, a low-resolution (2o×2o) survey of radio recombina-
tion lines (RRLs) near 327 MHz in the Galactic plane was made
as a collaborative effort by the Ooty and Raman Research Insti-
tute groups.
7.5 Deuterium Abundance
The abundance measurement of deuterium to hydrogen during its
primordial formation is of cosmological significance. The ORT
observations by N. V. G. Sarma with collaborators from Ooty and
RRI, Bangalore helped in putting a good upper limit to the D/H
ratio.The abundance
measurement of
deuterium to hydrogen
during its primordial
formation is of
cosmological
significance. The ORT
observations by N. V. G.
Sarma with collaborators
from Ooty and RRI,
Bangalore helped in
putting a good upper
limit to the D/H ratio.
7.6 Solar Concentrator Project
The experience gained from the design and construction of the
ORT led us to build a stretched tape fixed mirror solar concentra-
tor of line focus type for solar thermal energy applications at 300
deg C [14].
In summary, ORT, built at a very low cost indigenously, under
Prof. Govind Swarup’s leadership, has been a great success as
a radio telescope over ∼ 50 years of its operation and built up a
high reputation for radio astronomy in India and the world. As-
tronomers, graduate students, and engineers from other groups
such as the Raman Research Institute (RRI), Bangalore, Physi-
cal Research Laboratory (PRL), Ahmedabad, National Physical
Laboratory (NPL), New Delhi, and Universities collaborated in
several observational programs at different times and used our
facilities at ORT at various times. The collaboration with RRI
912 RESONANCE | July 2021
GENERAL ARTICLE
extended over a long period, from the days of ORT to GMRT. A
feed covering the frequencies 1000 to 1450 MHz was designed
and built for GMRT by the RRI team.
8. The Idea of GMRT
As a technology-oriented person, Govind The GMRT array was
initially planned to be
made up of 34
cylindrical parabolas
with multiple feeds at
the focal lines but did
not find support
internationally.
Scientists from across
the world supported the
project but wanted us to
reconsider and think of
making dishes in place
of cylinders with the
equivalent area. The
main reasons were that
the complex software for
analyzing the data were
available freely, that the
instrumental polarization
characteristics of dishes
were much better
understood than those of
cylinders, feeds are
much easier to fabricate,
etc.
Swarup could not rest
on his laurels after completing ORT and proceeded with his idea
of Ooty Synthesis Radio Telescope by adding a few antennas in
the E-W direction to ORT. The OSRT was operated for a few
years in the mid-1970s. Then he got the idea of the Giant Equa-
torial Radio Telescope (GERT) in the late 1970s. The aim was
to construct a 2 km ×50 m long cylindrical parabolic telescope
on the equator in Kenya or Indonesia where the Earth’s equator
passes. But that did not fructify. The group at Ooty was explor-
ing various alternatives. Anecdotally, it was due to an eventful
new year party on 31st December that Swarup came up with the
idea of GMRT on 01 January 1984, when he laid it out to some
of us. After many discussions, the proposal was put up to the
TIFR authorities, who encouraged proceeding ahead. The site
search was arduous and finally took us, among many sites, to the
present one near Khodad village, about 10 km from Narayangaon
town, which is about 80 km north of Pune city and 100 km due
east of Mumbai. The array was initially planned to be made up
of 34 cylindrical parabolas with multiple feeds at the focal lines
but did not find support internationally. Scientists from across the
world supported the project but wanted us to reconsider and think
of making dishes in place of cylinders with the equivalent area.
The main reasons were that the complex software for analyzing
the data were available freely, that the instrumental polarization
characteristics of dishes were much better understood than those
of cylinders, feeds are much easier to fabricate, etc. It was ac-
cepted by Swarup and his experienced team. In consultation with
the team members and the consulting engineers (Tata Consult-
ing Engineers), Swarup then came up with the idea of making
a parabolic dish structure made up of 16 frames which form the
back up for supporting a “Stretched Mesh structure Attached to
RESONANCE | July 2021 913
GENERAL ARTICLE
a Rope Truss (SMART)”. The reflector mesh is made of spot-
welded stainless steel (SS) wires of 0.55 mm dia. forming square
cells of 10 mm ×10 mm in the central area of the paraboloid and
15 × 15 and 20 × 20 mm2 as one moves away from the center
towards the rim of the dish.
Thus, the surface is made up of a number of plane facets that
form a plane surface but yet give an rms error of within 10 mm of
a true parabola. As a result, the leakage from the mesh is less than
5% and the operation of the array extends to 1420 MHz, which is
one of the most important frequencies in radio astronomy. The
lower frequency was limited to 150 MHz but can possibly be
lower. However, all these developments meant that the cost went
up compared to parabolic cylinders and resulted in reducing the
number of dishes to 30, with 12 dishes in a central compact ar-
ray while the 3 arms had 6 dishes each [15]. WithWith fully steerable
dishes of effective total
collecting area of 30000
sq. meters for the 30
dishes, the GMRT has
become a world-class
radio telescope array
(Figure 8). With further
recent upgrades using
the latest hardware and
software technologies, it
is the best known
low-frequency synthesis
array telescope in the
world today [16], which
is heavily used by
scientists from about 40
countries in the world
since its full operation
began in 2002.
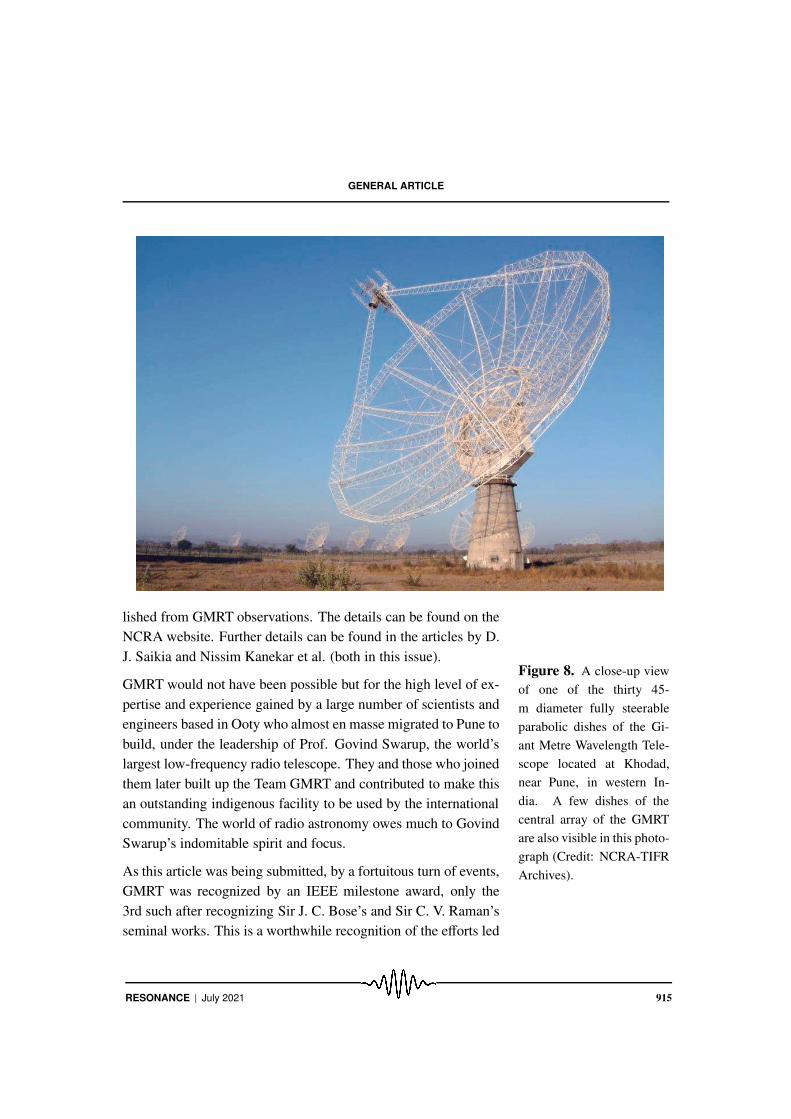
fully steerable
dishes of effective total collecting area of 30000 sq. meters for
the 30 dishes, the GMRT has become a world-class radio tele-
scope array (Figure 8). With further recent upgrades using the
latest hardware and software technologies, it is the best known
low-frequency synthesis array telescope in the world today [16],
which is heavily used by scientists from about 40 countries in the
world since its full operation began in 2002.
9. Scientific Results from GMRT
The scientific programmes being taken up by the GMRT are ex-
amined, and time is allotted by a well-refereed proposal system,
with open access to the data, after an initial period for the PI
(Principal Investigator). It covers a broad range of astronomy
from the Sun and exo-planets to our own galaxy and objects in
it like pulsars, supernovae, etc., and extragalactic sources such as
quasars, AGNs, gamma-ray bursters, magnetars, dark matter, and
cosmology. VLBI observations have also been done using GMRT
with Russian telescopes, and the GMRT team made an engineer-
ing contribution to the RADIOASTRON international space tele-
scope [17]. About 1000 scientific papers have already been pub-
914 RESONANCE | July 2021
GENERAL ARTICLE
Figure 8. A close-up view
of one of the thirty 45-
m diameter fully steerable
parabolic dishes of the Gi-
ant Metre Wavelength Tele-
scope located at Khodad,
near Pune, in western In-
dia. A few dishes of the
central array of the GMRT
are also visible in this photo-
graph (Credit: NCRA-TIFR
Archives).
lished from GMRT observations. The details can be found on the
NCRA website. Further details can be found in the articles by D.
J. Saikia and Nissim Kanekar et al. (both in this issue).
GMRT would not have been possible but for the high level of ex-
pertise and experience gained by a large number of scientists and
engineers based in Ooty who almost en masse migrated to Pune to
build, under the leadership of Prof. Govind Swarup, the world’s
largest low-frequency radio telescope. They and those who joined
them later built up the Team GMRT and contributed to make this
an outstanding indigenous facility to be used by the international
community. The world of radio astronomy owes much to Govind
Swarup’s indomitable spirit and focus.
As this article was being submitted, by a fortuitous turn of events,
GMRT was recognized by an IEEE milestone award, only the
3rd such after recognizing Sir J. C. Bose’s and Sir C. V. Raman’s
seminal works. This is a worthwhile recognition of the efforts led
RESONANCE | July 2021 915
GENERAL ARTICLE
by Govind Swarup. This is a moment of pride for Team GMRT.
Prof. Swarup would have been proud of this recognition.
Acknowledgements
The authors thank all those individuals involved in the design,
construction, modification, and continued operation of ORT and
GMRT. The list is too large to be given here. References have
been kept to the minimum and reflect only the earliest papers rel-
evant in each case. Many details on phasing and combining of
arrays can be found in the lucid articles in Resonance [18, 19]
and in the website www.ncra.tifr.res.in. The authors wish to thank
Profs. Vasant Kulkarni and P. Janardhan for their critical reading
and suggestions. The authors thank the referee for his insightful
comments.
Suggested Reading
[1] G Swarup, N V G Sarma, M N Joshi, V K Kapahi, D S Bagri, S H Damle, S
Ananthakrishnan, S., V Balasubramanian, S S Bhave, and R P Sinha, Nature
Phys. Science, Vol.230, 185, 1971.
[2] V K Kapahi, S H Damle, V Balasubramanian and G Swarup, Journ. Inst. Elec-
tronics and Telecommn. Engg., Vol.21, 117, 1975.
[3] N V G Sarma, M N Joshi, D S Bagri and S Ananthakrishnan, Journ. Inst.
Electronics and Telecommn. Engg., Vol.21, 110, 1975.
[4] N V G Sarma, M N Joshi and S Ananthakrishnan, Journ. Inst. Electronics and
Telecommn. Engg., 21, 107, 1975.
[5] C R Subrahmanya, P Prasad, B S Girish, R Somashekar, P K Manoharan and
A K Mittal, J. Astrophys. Astr., 38, 11, 2017.
[6] Mohan N. Joshi and Gopal-Krishna, Mon. Not. R. astr. Soc., 178,717, 1977.
[7] G Swarup, Mon. Not. R. astr. Soc., 172, 501, 1975.
[8] Vijay K Kapahi, Mon. Not. R. astr. Soc., 172, 513, 1975.
[9] A Hewish, S J Bell, J D H Pilkington, P F Scott and R A Collins, Nature, 218,
70, 1968.
[10] D K Mohanty, V Balasubramanian and G Swarup, Proc. Indian Acad. Sci.,
72A, 246,1970.
[11] A Hewish, P F Scott and D Wills, Nature, Vol.203, No.4951, p.1214, 1964.
[12] A P Rao, S M Bhandari and S Ananthakrishnan, Australian Journal of Physics,
Vol.27, 105, 1974.
[13] P K Manoharan and S Ananthakrishnan, Mon. Not. Roy. astr. Soc., Vol.244,
691, 1990.
916 RESONANCE | July 2021
GENERAL ARTICLE
[14] V Balasubramanian and G Sankarasubramanian, Sol. Energ., Vol.31, No.2,
109, 1993.
[15] G Swarup, S Ananthakrishnan, V K Kapahi, A P Rao, C R Subrahmanya and
V K Kulkarni, Current Science, 60, 95, 1991.
[16] Y G Gupta, et al., Current Science, 113, 4,, 707, 2017.
Address for Correspondence
S Ananthakrishnan
Adjunct Professor
Electronic Science Department
S P Pune University
Pune 411 007, India
Email:
V Balasubramanian
Email:
vbalu [email protected]
[17] N S Kardashev, et al., Astron. Rep., 57, 153, 2013.
[18] R Nithyananda, Resonance, Vol.22, No.7, pp.645-657, 2017 .
[19] J C Chengalur, Resonance, Vol.23 No.2, pp.165–182, 2018 .
RESONANCE | July 2021 917